Article

Determining Riverine Surface Roughness at Fluvial Mesohabitat Level and Its Influence on UAV-Based Thermal Imaging Accuracy

1
Aquatic Systems Biology Unit, TUM School of Life Sciences, Technical University of Munich, 85354 Freising, Germany
2
Department of Fish Ecology and Evolution, Eawag (Swiss Federal Institute of Aquatic Science and Technology), 6047 Kastanienbaum, Switzerland
3
Chair of Hydraulic Engineering, TUM School of Engineering and Design, Technical University of Munich, 80333 Munich, Germany
*
Author to whom correspondence should be addressed.
Remote Sens. 2024, 16(10), 1674; https://doi.org/10.3390/rs16101674
Submission received: 15 March 2024 / Revised: 3 May 2024 / Accepted: 7 May 2024 / Published: 9 May 2024
(This article belongs to the Special Issue Remote Sensing and GIS in Freshwater Environments)

Abstract

:
Water surface roughness (SR) is a highly relevant parameter governing data reliability in remote sensing applications, yet lacking appropriate methodology in riverine habitats. In order to assess thermal accuracy linked to SR of thermal imaging derived from an unmanned aerial vehicle (UAV), we developed the SR Measurement Device (SRMD). The SRMD uses the concept of in situ quantification of wave frequency and wave amplitude. Data of nine installed SRMDs in four different fluvial mesohabitat classes presented a range of 0 to 47 waves per 30 s and an amplitude range of 0 to 6 cm. Even subtle differences between mesohabitat classes run, riffle, and no-/low-flow still and pool areas could be detected with the SRMD. However, SR revealed no significant influence on the accuracy of thermal infrared (TIR) imagery data in our study case. Overall, the presented device expands existing methods of riverine habitat assessments and has the potential to produce highly relevant data of SR for various ecological and technical applications, ranging from remote sensing of surface water and habitat quality characterizations to bank stability and erosion risk assessments.

1. Introduction

In light of climate change and the ongoing trend of the warming of aquatic habitats [1,2], understanding the spatio-temporal patterns of temperature distributions in aquatic systems is of increasing importance [3]. In temperate regions of the world or at higher altitudes, aquatic organisms are evolutionarily adapted to cold conditions, with many organisms exceeding thermal limits when temperatures rise above 20 °C [4]. To sustain those species, it is important to preserve habitats with cooler temperatures, so-called thermal refugia [5,6].
Consequently, assessing thermal heterogeneity in rivers and streams is of great ecological relevance [7,8], but in contrast to many other physico-chemical characterizations of aquatic habitat conditions, it is still poorly harmonized. Due to the generally pronounced heterogeneity in rivers and lakes (e.g., for rivers 14 °C [3], for lakes >3.5 °C [9] both in summer), it is challenging to assess spatio-temporal temperature profiles with conventional methods such as data loggers, which are typically limited to point measurements with doubtful representativeness. Therefore, the use of remote sensing based on thermal imagery has become increasingly popular in the last two decades [5,10].
Studies using airborne thermal imaging as a survey methodology in aquatic environment focus on thermal heterogeneity and its fundamental controls on different spatial scales [8,11,12,13,14,15] including temporal [3,16] and habitat suitability assessments [17]. The study objects encompass river and stream habitats, ranging from headwaters [18,19] to coastal zones [20,21]. Several studies are also concerned with the technical perspective focusing on accuracy and limitations using UAV-based sensors for thermal imaging and its subsequent processing in aquatic research [6,11,22,23,24,25,26,27,28].
With modern ready-to-fly unmanned aerial vehicles (UAVs) equipped with radiometric thermal infrared (TIR) sensors (uncooled microbolometers), such studies are now easy to carry out [11,29]. With the UAVs’ radiometric TIR camera (sensors), the heat radiation of surfaces can be captured by a sensor and displayed in false-color images, containing measured temperature information in each pixel.
Thereby, the accuracy of detected heat radiation is, among others (such as internal camera heating, relative humidity, pitch, roll and yaw), thought to depend strongly on surface emissivity [18,24,30]. Emissivity is a number that varies from zero to one, which describes how efficiently an object emits thermal radiation [31], with surface water having an emissivity factor of 0.96–0.98 [32]. To improve the accuracy of remotely sensed spatial water surface temperature in principle, calibrating detected TIR imagery temperatures to ground truth data of measured water surface temperature using linear regression within the image processing workflow is mandatory [8,10,33,34].
However, the emissivity of objects itself is known to be affected by their surface structure [35] and thus surface roughness in aquatic habitats is expected to have an influence on detected thermal data accuracy [36,37]. Since surface roughness and heterogeneity are in principle displayed in waves, variability in emissivity and thus temperature accuracy is to be expected [33,34]. This problem has already been addressed on a larger scale in marine remote sensing research [38,39,40], where a deviation in accuracy of 0.5 °C is common when using airborne thermal infrared sensors [33,35].
To assess sea surface roughness, the most common approaches used on different scales include laser scanning, wave staffs, stereo imaging, microwave radar [41,42], polarimetric infrared, glitter imaging [43], and global navigation system reflectometry [44]. In situ wind measurements can also be correlated with sea surface roughness parameters, with different methods available to estimate roughness from wind data [45].
Metric dimensions of stream surface roughness can be very different to marine systems according to the diverse surface structure of fluvial mesohabitats such as pools, riffles, runs and still water areas, yet these remain largely untested.
Regarding the smaller survey scales (ground sampling size) of UAV-based remote sensing in riverine environments, we suspect that the known temperature accuracy of sea surface does not apply to thermal assessments in rivers and streams. In addition, riverine surface roughness is expected to have a smaller dimension but a higher heterogeneity due to the greater structural habitat diversity compared to the sea surface. To date, such a high degree of habitat variability has not yet been analyzed in the context of the accuracy of thermal imagery since methods to measure surface roughness on small scale have been lacking.
In this study, we present a surface-roughness-measuring device (SRMD) for on-site measuring of surface roughness, developed to (a) read wave amplitude and (b) count wave frequency. The application of the SRMD was tested in a field experiment combined with an UAV-based TIR imagery study including the following objectives: (i) proving the SRMDs’ concept to be valid by comparing water surface roughness amplitude and frequency at fluvial mesohabitat (FMH) level; and (ii) validation of thermal infrared (TIR) imagery accuracy linked to surface roughness at FMH level.

2. Materials and Methods

2.1. Study Site

This study was carried out at the upper Danube River near Ingolstadt in southern Germany (river km 2472), including a restored floodplain area consisting of four thermally and morphologically differentiated and interconnected watercourses [3,46,47,48,49]. The four river sections assessed comprised the bank habitats of the embanked Danube River, the Ottheinrichbach (OHB), a nature like fish pass (FP), and a hinterland drainage ditch, the Längenmühlbach (LMB) (Figure 1). As the objectives of this study were linked to fluvial mesohabitats (FMHs), within each of the habitats, subsections were classified into run, riffle, pool and still water according to several authors [50,51,52,53,54]. Since surface roughness is thought to be highly dependent on hydrological habitat conditions, the measurement points were selected to reflect the river habitat heterogeneity as described in [3,48] for this study site. Identification was based on a measurement of the depth, flow velocity and riverbed substratum in the context of the individual watercourses. “Run” was defined by directed current, unbroken water surface with constant water depth and river width. “Riffle” was defined by shallow areas with stronger current as runs where the water breaks over cobbles, boulders and gravel or where the water surface was visibly broken. “Pool” was defined by slowly flowing water, potential reverse current, greater depth than riffles or runs and the location after “riffles” or outside of bends. “Still” was defined for obviously non-flowing floodplain ponds and for the non- to extremely slow-flowing section (<0.01 ms−1) in the dammed Danube mainstream (Figure 1). Further information regarding the study sites, mesohabitats and thermal heterogeneity is available in [3].

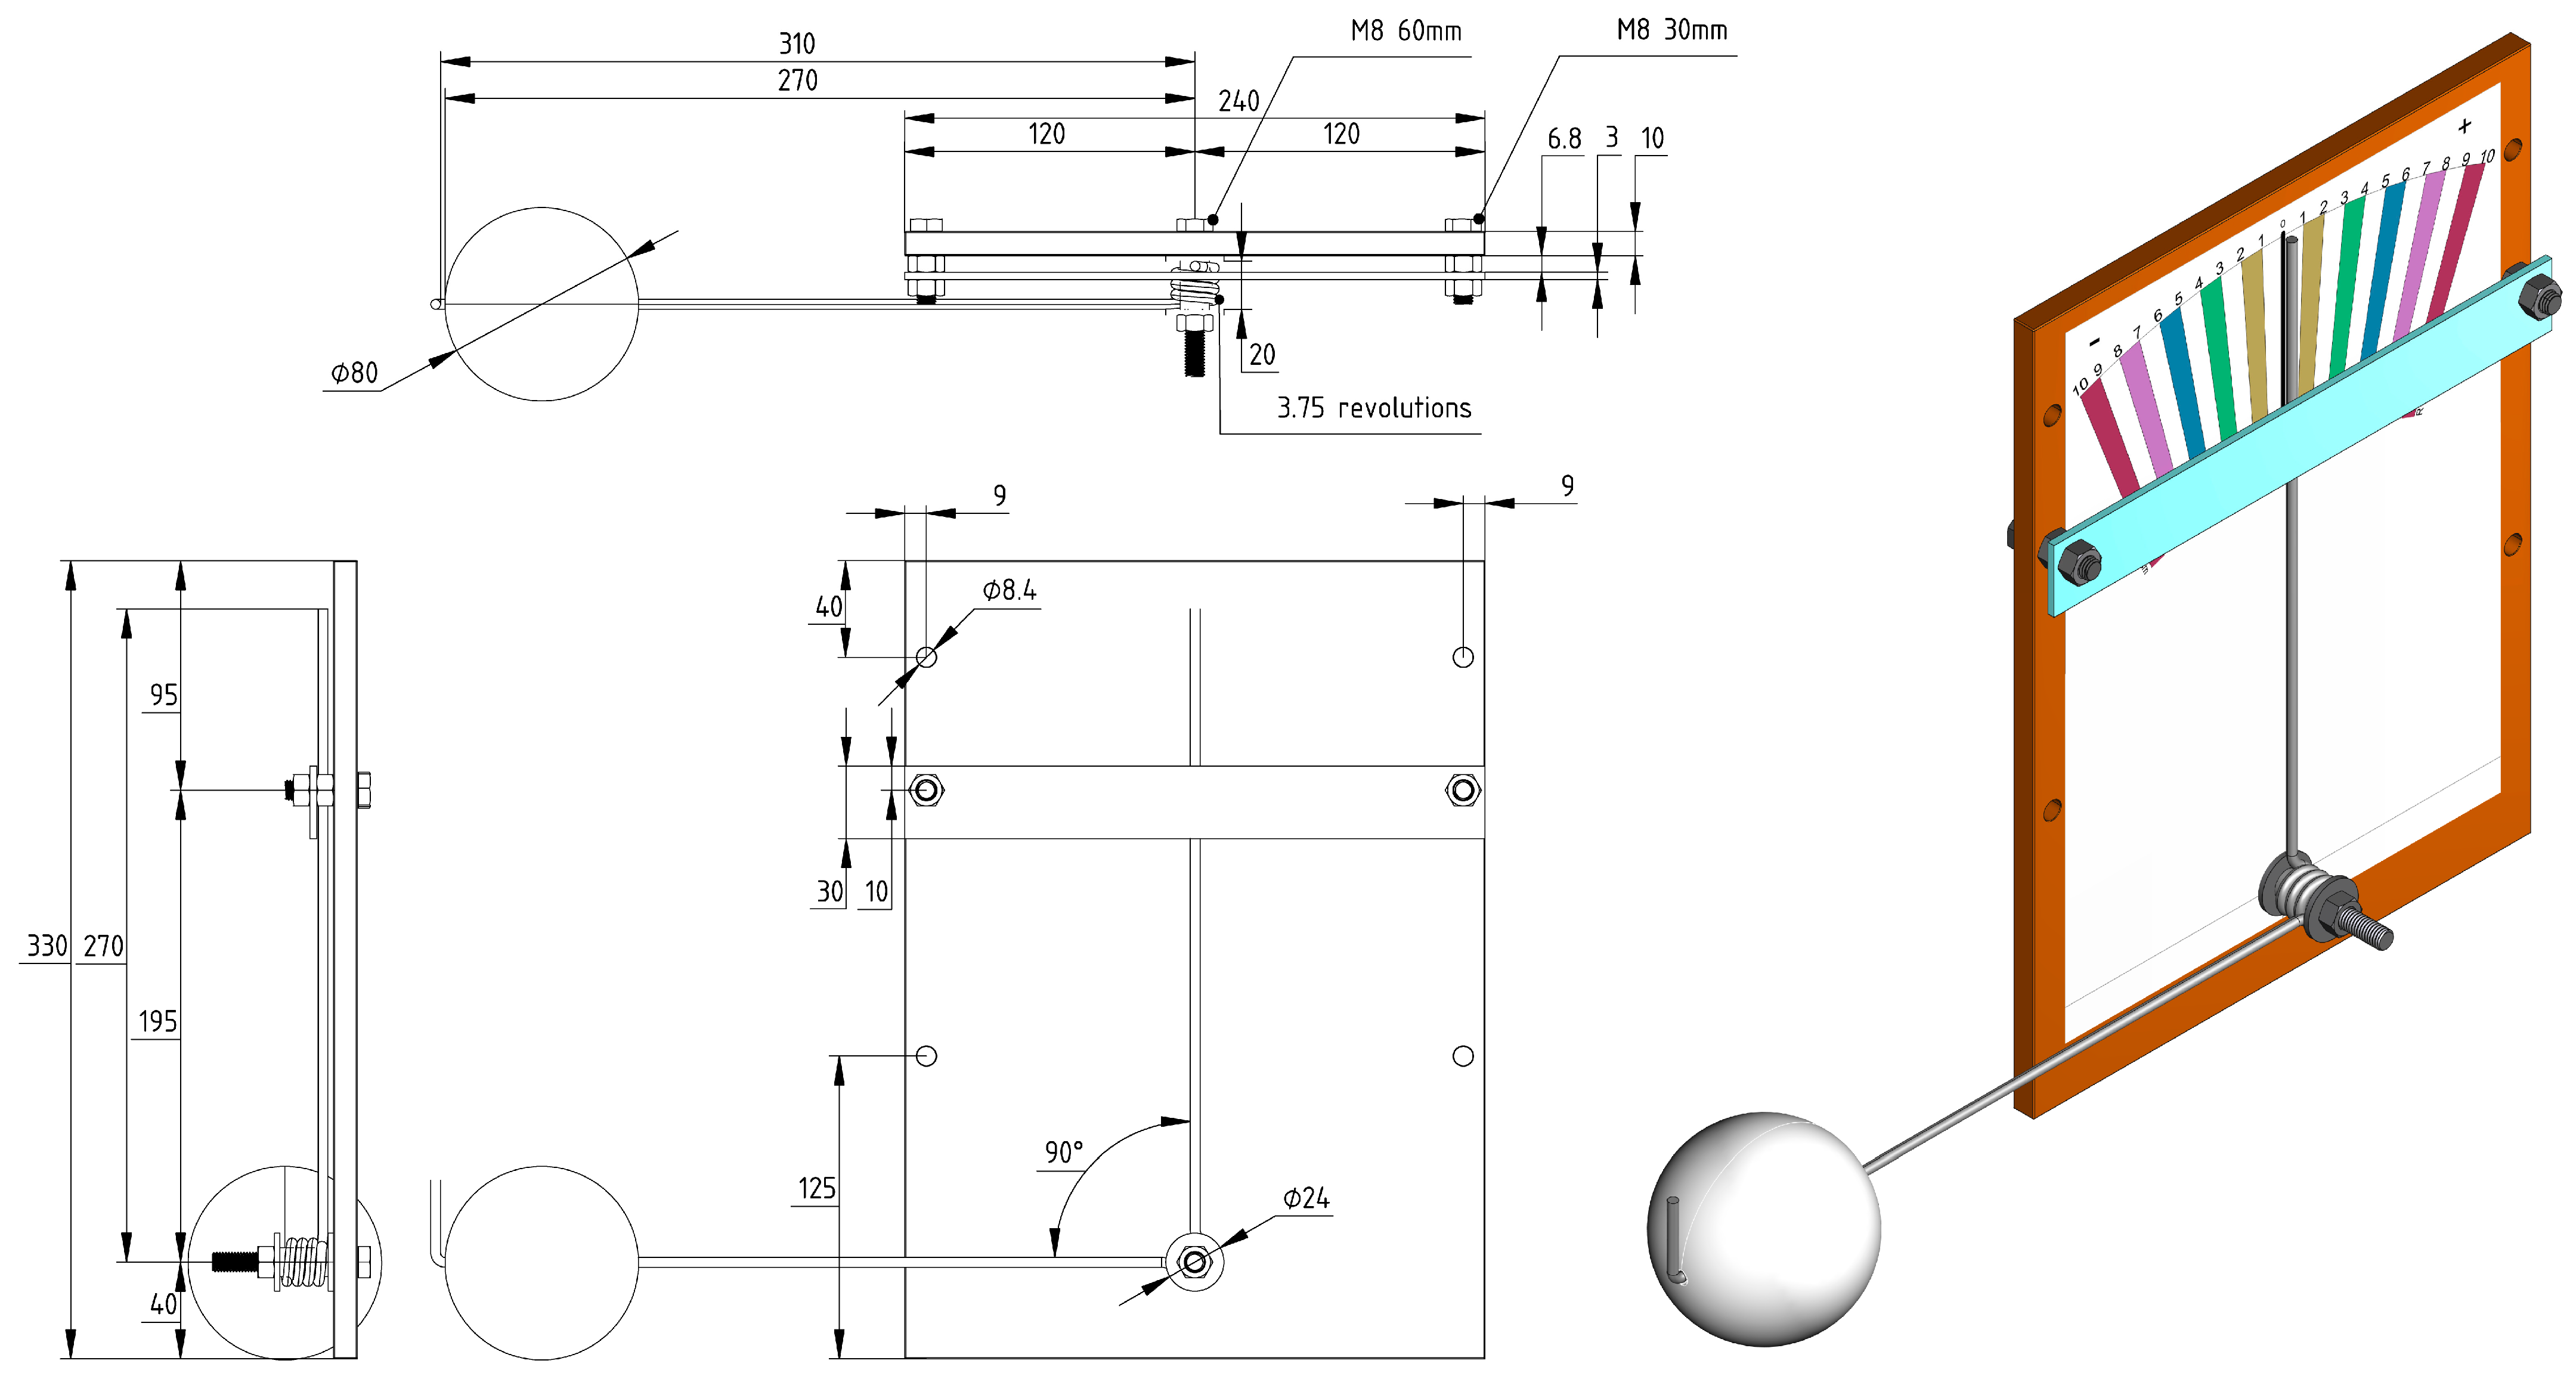
2.2. The Surface Roughness Measurement Device (SRMD)

A novel tool for in situ measuring water surface roughness was constructed for this study, the “Surface Roughness Measurement Device”, SRMD. In principle, this device visualizes the waves of surface roughness and makes wave frequency countable and wave amplitude readable using a scale.
The SRMD consists of a floating ball (80 mm diameter Styrofoam, Hagebaumarkt, Freising, Germany) on a lever-pointer arm, which transfers the movements of the water surface, using the lever-pointer, directly on the display of a scale (Figure 2). The lever-pointer arms are both 27 cm long to ensure a 1:1 leverage ratio. The lever-pointer unit is bent out of a 4 mm aluminum rod with four coils at the pivot. Pivot coils are bent around a 20 mm long aluminum tube. The lever-pointer unit with an aluminum tube (inner diameter 10 mm) is mounted on a metal screw (M8) using a nut and matching washers to ensure free movement. The pivot-point screw and lever-pointer unit are mounted on the measurement board with an affixed scale. The scale is divided into 1 cm sections comprising different colors to allow for easy reading from distance. For field installation, a pole has to be anchored into the river sediment at the measuring location. The SRMD is mounted on the pole even to the water level, ensuring the SRMD lever is parallel to the water surface (Figure 3). The amplitude of the waves can then be read off the scale and the frequency can be counted. In our case of using the SRMD prototype, all readings were taken by naked eye, but with little additional effort, automated recordings are also feasible.

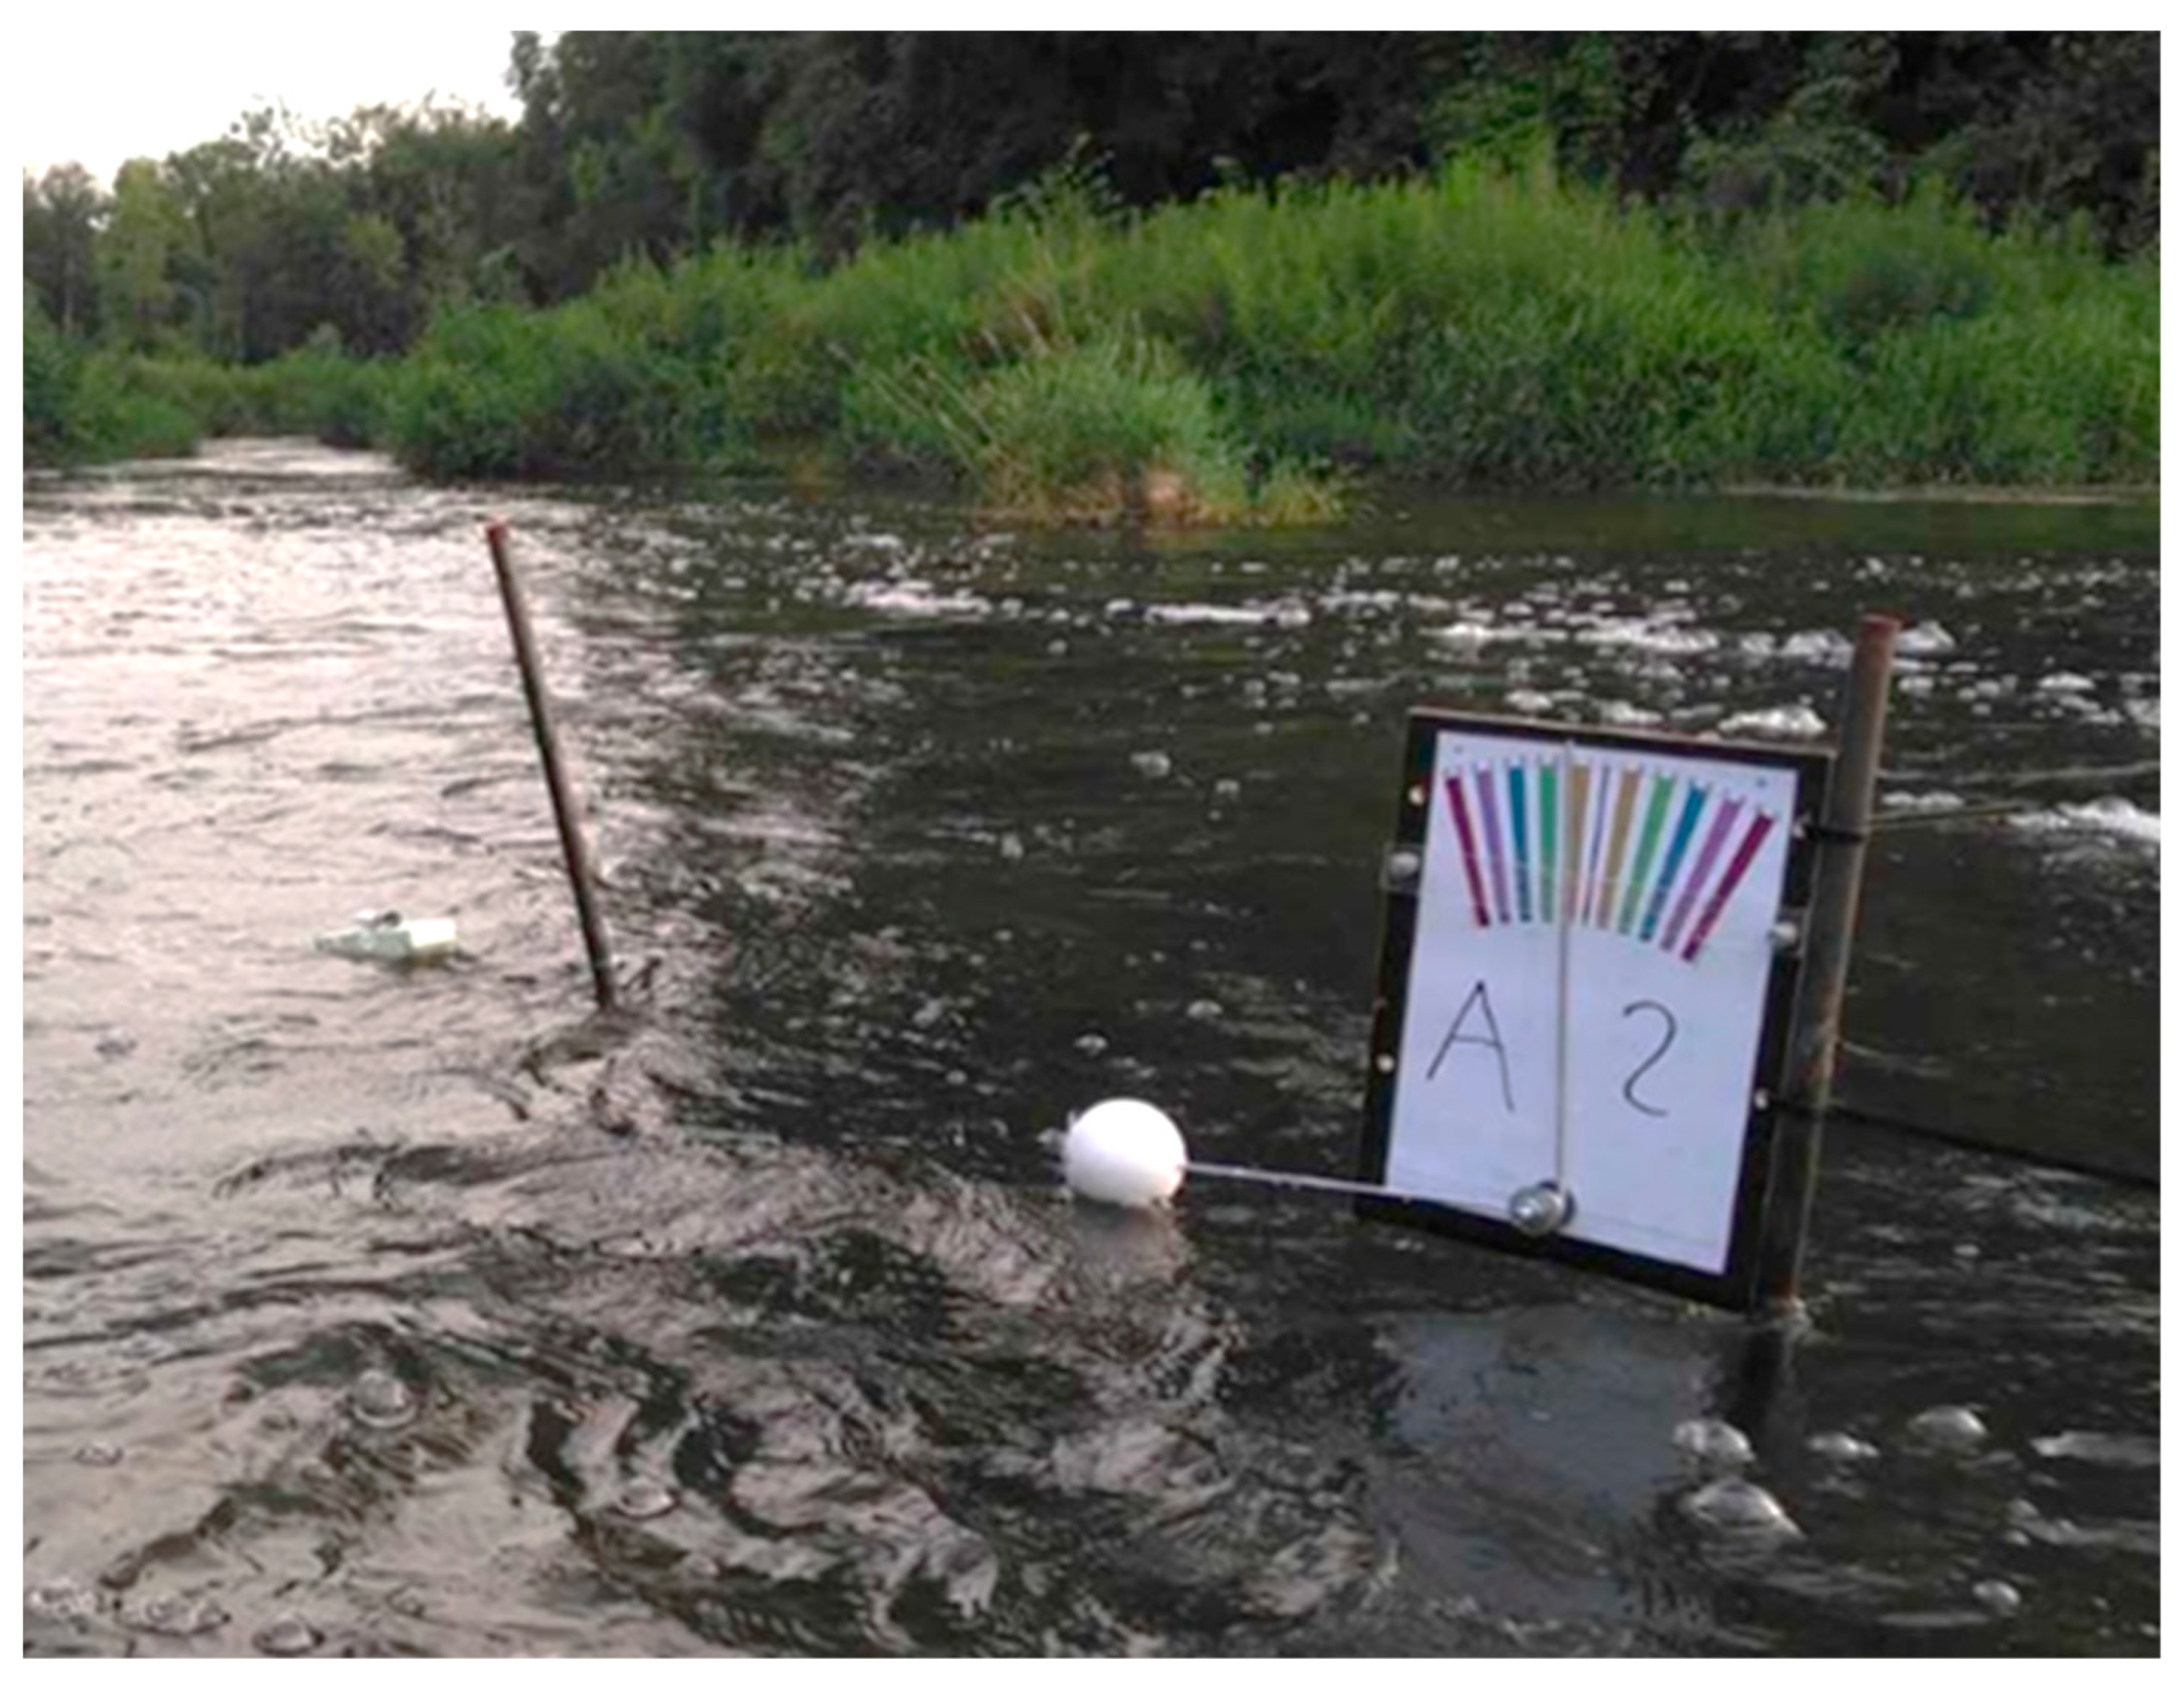
2.3. Application of SRMD and Thermal Imaging

To address the potential impact of surface roughness on the accuracy of thermal imaging data and to test the validity of the SRMD, we used simultaneously recorded on-site data of surface roughness (i) and UAV-based TIR imagery data combined with ground truth temperature logger data (ii).
TIR imagery data were obtained from an UAV survey with hourly flights from 6:00 am until 8:45 pm (n = 15) at a flight level of 50 m above ground. The survey took place during a typical hot summer day (20 July 2020), with an air temperature ranging from 15.3 °C in the morning to 29.9 °C in the afternoon [3]. TIR imagery were acquired by a Matrice 210 UAV (DJI, Shenzhen, China) equipped with a XT2 camera sensor ((640 × 512 pixels thermal resolution), DJI, Shenzhen, China). The flight at 10 a.m. did not return reliable TIR data and was omitted from the analysis. After the survey, a total of 15 data sets (flights), each with about 650 individual TIR images, were available for analysis. Further information regarding the UAV flights is available in [3].
To check for temperature ground truth, nine SRMDs and temperature data loggers (UA-002-064 HOBO, Onset Computer Corporation, Bourne, MA, USA) had been installed prior to the UAV survey in four different FMH classes consisting of two runs, three riffles, two pools, and two still water areas (Figure 1 and Figure 3). Temperature loggers were mounted to a small float that floated roughly 0.5 cm below the water surface (Figure 3). To minimize measurement errors of the loggers, we placed all loggers in a water-filled bucket for 10 h prior to the field survey. Only loggers with temperature deviations <0.001 K were used. Dimensions of surface roughness (objective i) were obtained at the SRMDs by a trained field team consisting of two surveyors that independently counted wave frequency and read maximum wave amplitude within 30 s during each flight. Frequency and amplitude were recorded directly after the UAV left the FMHs. To minimize individual bias for the values of surface roughness dimension, we calculated the mean recorded by the two surveyors.
We used temperature difference between temperature logger data (ground truth) and raw thermal imagery data as a proxy for possible variability in emissivity linked to surface roughness (objective ii). Temperature difference data between TIR imagery and temperature logger at the individual FMH “run 2” were omitted, since fast changing spatio-temporal mixing patterns of two thermally differentiated river sections did not allow for an accurate comparison of TIR data to logger data. Raw TIR imagery data were extracted downstream of the temperature logger position for each flight (n = 15) and 8 FMHs. We extracted the mean temperature of 4 × 4 pixel squares close to the SRMDs and downstream of the temperature loggers from 120 individual raw TIR images by using the software FLIR tools (Version 6.4.17317.1002, Teledyne FLIR LLC, Wilsonville, OR, USA). Raw images were used for objective ii) because processed imagery can be potentially biased by applying a linear regression to ground truth data.

2.4. Data Analysis

Shapiro–Wilk tests were applied to test for normal distribution of surface roughness frequency and amplitude, as well as temperature difference of FMHs. Since surface roughness amplitude and frequency data (objective i) did not always follow a normal distribution at FMH classes, differences between two or more groups were tested with the Kruskal–Wallis test and Wilcoxon-signed-ranks post hoc test. Since the analyzed data of temperature difference between TIR imagery and temperature logger data (objective ii) did follow a normal distribution, the difference in the homogeneity of variance was tested using the Levene test. The function ‘ANOVA’ in the package ‘car’ was used to test for differences of temperature between logger data (ground truth temperature) and TIR temperature at the FMH class level. Additionally, we applied two linear models to test for potential correlations between temperature differences from logger data and TIR data to SR frequency, and between temperature differences from logger data and TIR data to SR amplitude.
All data were analyzed and visualized using R studio (version 4.3.3, R Core Team, 2024). Statistically significance for all tests was considered at p-values < 0.05. Water surface roughness amplitude and frequency data (objective i), as well as temperature difference data between TIR imagery and temperature logger data (objective ii), were analyzed and visualized at FMH classes (run, riffle, pool and still) and additional visualized for each individual FMH. Data distributions were visualized in boxplots combined with violin plots using package ‘ggplot 2’ (version 3.4.0, Wickham, 2016) in R.

3. Results

During this UAV study with 15 hourly flights, a total of 135 measurements of surface roughness were made at the nine individual mesohabitats. Pools and riffles presented an overall higher surface roughness than that of runs and still water areas (Figure 4). Differences in surface roughness between pool and riffle are less distinct than those between riffle and runs. Surface roughness in runs was intermediate compared to that of pool and riffles. As expected, no surface roughness was detectable in still water areas. Overall, FMHs were mainly separated by wave frequency rather than amplitude. The temperature difference between ground truth and TIR imagery data revealed a similar range and means (Figure 5).
The mean wave frequency of the FMHs within 30 s ranged from zero waves in still water habitats to 30.13 waves in pool habitats. The mean wave frequency of riffle was at 28.20 waves and that of runs at 10.60 waves. The range of wave frequencies of riffles (5–47 waves) and pools (19–43 waves) was higher than that of runs (4–18 waves) and, of course, of still water habitats (0.00 waves).
The comparisons of wave frequency in 30 s revealed multiple significant differences between the FMH classes (Kruskal–Wallis test: p < 0.001). The mean wave frequency in pools was significant higher compared to runs (Wilcoxon test: p < 0.001) and compared to still water areas (Wilcoxon test: p < 0.001), but was not significantly lower than the wave frequency in riffles (Wilcoxon test: p = 1.00). The mean wave frequency in runs was significantly higher than the wave frequency in still water areas (Wilcoxon test: p < 0.001), but significantly lower than the wave frequency in riffles (Wilcoxon test: p < 0.001). The wave frequency in riffles was significantly higher than in still water areas (Wilcoxon test: p < 0.001).
Mean wave amplitude of the FMHs within 30 s ranged from 0 cm in still water areas to 2.43 cm in riffles. The mean wave amplitudes of runs were at 1.15 cm and those of pools at 2.03 cm. The amplitude range of waves in riffles (1–6 cm) and pools (0.5–4 cm) was higher than those in runs (0–3 cm) and, as expected, in still water habitats (0.00 cm).
Comparisons of wave amplitude revealed multiple significant differences between FMH classes (Kruskal–Wallis test: p < 0.001). The mean wave amplitude in pools was significant higher compared to that of runs (Wilcoxon test: p < 0.01) and compared to that of still water areas (Wilcoxon test: p < 0.001), but was not significantly lower than the wave amplitude in riffles (Wilcoxon test: p = 1.00). The mean wave amplitude of runs was significantly higher than the wave amplitude of still water areas (Wilcoxon test: p < 0.001), but was significantly lower than the wave frequency in riffles (Wilcoxon test: p < 0.001). Expectedly, the wave amplitude in riffles was significantly higher than in still water areas (Wilcoxon test: p < 0.001).
The temperature difference between logger temperatures (ground truth) and raw TIR imagery data revealed a similar range and means in all FMHs at the class level (Figure 5). The overall lowest mean of temperature difference between ground truth and TIR was found in pools (3.05 °C), while the highest mean temperature difference was found in still water (3.76 °C). The comparison of temperature difference between logger data and raw TIR imagery as a proxy of variability in emissivity linked to surface roughness revealed no significant difference between FMH classes (ANOVA: p = 0.06). The linear models (Figure 5C,D) also revealed no significant correlation between the temperature difference of logger data to raw TIR data and SR frequency (F-value = 0.00, p = 0.96) and between the temperature difference of logger data to raw TIR data and SR amplitude (F-value = 0.03, p = 0.86).

4. Discussion

The presented SRMD device for quantification of surface roughness in the riverine environment produced reliable data of wave frequency and wave amplitude. Differences in surface roughness between FMH validated the SRMD concept (objective i). The surface roughness of FMHs combined with TIR and ground truth temperature revealed no significant difference between FMHs (objective ii).

4.1. Reliability of SRMDs Concept

Multiple significant differences in pair-wise comparisons of the two dimensions of surface roughness (amplitude and frequency) at the FMH class level verified that the concept of the SRMD is valid. In this context, riffles and pools were very similar in their surface roughness dimensions. This can be attributed to the smooth transitions of fluvial mesohabitats [50]. Since pools are often located adjacent to riffles, a continuation of surface roughness characteristics from riffles into the pool areas below can be present until waves lose their energy and eventually collapse. While the difference between pool and riffle can alternatively be characterized by other definite factors (e.g., depth and flow velocity), the distinction between run and riffle is not always clear, both subjectively and objectively, due to different definitions and less distinct differences in depth and flow velocity [50,53,56]. Surprisingly, the device showed significant differences between riffles and runs, even though they are expectedly similar by visual checks. The latter clearly demonstrates the sensitivity and accuracy of the device and its functional concept. Since the investigated mesohabitats (run riffle, pool and still) represent all possible surface roughness types in riverine systems, it appears likely that the proposed method is reliable and generally suitable for measuring surface roughness in a wide range of streams and rivers. Hence, obtaining the dimensions of surface roughness can contribute to objective identification and characterization of FMHs from physical measurements. Particularly, in this study, the SRMD device produced reliable data for the assessment of water surface roughness linked to TIR imagery accuracy (objective ii).

4.2. Influence of Surface Roughness Linked to Thermal Imaging Accuracy

The application of the SRMD regarding thermal imaging in the riverine environment suggests a significantly higher temperature accuracy of raw TIR data than previously assumed since there was no significant temperature difference between TIR data and logger data (ground truth) at the FMH class level. This is clearly different from the current state of knowledge from marine environments where a deviation of 0.5 K is considered acceptable [38,39,40]. In the context of TIR processing, where calibration to ground truth temperature is fundamentally necessary, variability in thermal emissivity of the water surface does not have to be taken into account in our study. Greater accuracy in determining temperature profiles is clearly an advantage when it comes to risk assessments of exceeding biologically meaningful thermal thresholds related to mortality, reproduction and feeding of aquatic organisms, as well as the characterization of temperature-dependent oxygen solubility and matter fluxes [57].

4.3. Limitations, Potential Error Sources and Future Improvements

Overall, the range of differences between ground truth and TIR temperature appears surprisingly high. Within one flight, the range of temperature differences at FMHs between TIR and ground truth temperature is expected to be smaller. The remaining variability in temperature difference between logger data and TIR data can be attributed to the uncooled microbolometer and heating of the whole camera body during the study day with an air temperature up to 30 °C, as well as intense use in 15 subsequent flights. The heating of the camera body can be reduced by using colors with higher reflectance instead of matt black, for example, aluminum foil [24]. Other factors that can affect the accuracy and precision of uncooled sensors, such as relative humidity, pitch, roll and yaw of the UAV, and the flight time, were not taken into account in this study [26,58].
At the present stage of development, the pointer can deflect a maximum of 10 cm waves; thus, the application of this SRMD is limited when used in riffles with higher waves, high flow velocity and strong river slope. The installation of the SRMD is also limited by site depth since it needs to be mounted onto a pole. Additionally, sudden extreme changes in the water level can become a problem. This particularly applies to water bodies where the discharge is regulated, e.g., in river sections with hydropeaking.

4.4. Potential Future Applications

Since the SRMDs concept has proven that measurements of the surface roughness of rivers across a wide range of habitat conditions are possible, amplitude and frequency are suitable proxies for characterization of surface roughness. With adjustments or further development, e.g., concerning digital readings, the concept of the presented device can provide additional important data of surface roughness.
The possibility to measure surface roughness can improve current efforts on modeling and predicting mesohabitats dynamically [59] and can potentially improve mesohabitat classifications based on surface pattern categories (smooth, rippled, broken or unbroken standing waves) [60]. The applications of the SRMD are not limited to thermal imaging of surface water temperatures, as it can also be applied in the entire field of remote sensing, since the surface roughness of lentic, lotic and marine habitats can potentially affect all types of remote measurements [61]. The SRMD concept could also be used to assess wave disturbances linked to ship traffic regarding a potential impact to riparian bank habitats and erosion risk assessments. Surface roughness has so far been disregarded as a factor in habitat assessments but can certainly have an influence on habitat suitability for aquatic organisms and their behaviors, e.g., for surface-feeding fishes or in general when it comes to visibility and hiding, and thus for species’ composition and abundance.

5. Conclusions

This study describes and validates the application of a novel and simple device for measuring the dimensions of water surface roughness across different fluvial mesohabitat types in rivers and streams, the SRMD. It provides proof that reliable data of frequency and amplitude of surface roughness can be obtained across a range of different mesohabitat types, which contributes to greater accuracy in thermal remote sensing, highly relevant in light of assessing climate change impacts on aquatic ecosystems. Surface roughness data linked to thermal infrared imagery and combined with ground truth temperature data revealed no significant variability in temperature difference at fluvial mesohabitat classes. Overall, the presented device expands the existing methods of riverine habitat assessments and has the potential to produce highly relevant data of surface roughness for various ecological and technical applications, ranging from habitat quality characterizations to bank stability and erosion risk assessments. Since the developed SRMD may also have other ecological and technological applications, future research should also test its practical applications beyond riverine systems.

Author Contributions

Conceptualization, J.K., J.P., L.H., R.C.-M. and J.G.; methodology, J.K., L.H. and J.P.; validation, J.P. and J.G.; formal analysis, J.K.; investigation, J.K. and J.P.; resources, J.G. and J.P.; data curation, J.K.; writing—original draft preparation, J.K. and J.P.; writing—review and editing, R.C.-M., L.H. and J.G.; visualization, J.K. and L.H.; supervision, J.G.; project administration, J.P.; funding acquisition, J.P., R.C.-M. and J.G. All authors have read and agreed to the published version of the manuscript.

Funding

This research was partly funded by the Alexander von Humboldt Foundation through a fellowship awarded to R.C.-M., carried out at TUM, and by a grant financed by the HIT-Umweltstiftung for J.K. The funders did not have any influence on the study design or the interpretation of results.

Data Availability Statement

The raw data supporting the conclusions of this article will be made available by the authors on request.

Acknowledgments

We thank the Auen Zentrum Neuburg-Ingolstadt for coordinating the permissions with the landowner and the local authorities to carry out this study, the HIT-Umweltstiftung for financial support, all staff members for on-site data acquisition, and the 74th Tactical Air Wing of the German Airforce for UAV flight permission in the controlled-traffic region.

Conflicts of Interest

The authors declare no conflicts of interest. The funders had no role in the design of the study; in the collection, analyses, or interpretation of data; in the writing of the manuscript, or in the decision to publish the results.

References

  1. Terrestrial and Freshwater Ecosystems and Their Services. In Climate Change 2022—Impacts, Adaptation and Vulnerability; IPCC (Ed.) Cambridge University Press: Cambridge, UK, 2023; pp. 197–378. ISBN 9781009325844. [Google Scholar]
  2. Capon, S.J.; Stewart-Koster, B.; Bunn, S.E. Future of Freshwater Ecosystems in a 1.5 °C Warmer World. Front. Environ. Sci. 2021, 9, 41. [Google Scholar] [CrossRef]
  3. Pander, J.; Kuhn, J.; Casas-Mulet, R.; Habersetzer, L.; Geist, J. Diurnal patterns of spatial stream temperature variations reveal the need for integrating thermal heterogeneity in riverscape habitat restoration. Sci. Total Environ. 2024, 918, 170786. [Google Scholar] [CrossRef] [PubMed]
  4. Smialek, N.; Pander, J.; Mueller, M.; van Treeck, R.; Wolter, C.; Geist, J. Do We Know Enough to Save European Riverine Fish?—A Systematic Review on Autecological Requirements During Critical Life Stages of 10 Rheophilic Species at Risk. Sustainability 2019, 11, 5011. [Google Scholar] [CrossRef]
  5. Linnansaari, T.; O’Sullivan, A.M.; Breau, C.; Corey, E.M.; Collet, E.N.; Curry, R.A.; Cunjak, R.A. The Role of Cold-Water Thermal Refuges for Stream Salmonids in a Changing Climate—Experiences from Atlantic Canada. Fishes 2023, 8, 471. [Google Scholar] [CrossRef]
  6. Kuhn, J.; Casas-Mulet, R.; Pander, J.; Geist, J. Assessing Stream Thermal Heterogeneity and Cold-Water Patches from UAV-Based Imagery: A Matter of Classification Methods and Metrics. Remote Sens. 2021, 13, 1379. [Google Scholar] [CrossRef]
  7. Caissie, D. The thermal regime of rivers: A review. Freshw. Biol. 2006, 51, 1389–1406. [Google Scholar] [CrossRef]
  8. Casas-Mulet, R.; Pander, J.; Ryu, D.; Stewardson, M.J.; Geist, J. Unmanned Aerial Vehicle (UAV)-Based Thermal Infra-Red (TIR) and Optical Imagery Reveals Multi-Spatial Scale Controls of Cold-Water Areas Over a Groundwater-Dominated Riverscape. Front. Environ. Sci. 2020, 8, 257. [Google Scholar] [CrossRef]
  9. Irani Rahaghi, A.; Lemmin, U.; Barry, D.A. Surface Water Temperature Heterogeneity at Subpixel Satellite Scales and Its Effect on the Surface Cooling Estimates of a Large Lake: Airborne Remote Sensing Results from Lake Geneva. JGR Oceans 2019, 124, 635–651. [Google Scholar] [CrossRef]
  10. Dugdale, S.J. A practitioner’s guide to thermal infrared remote sensing of rivers and streams: Recent advances, precautions and considerations. WIREs Water 2016, 3, 251–268. [Google Scholar] [CrossRef]
  11. Dugdale, S.J.; Kelleher, C.A.; Malcolm, I.A.; Caldwell, S.; Hannah, D.M. Assessing the potential of drone-based thermal infrared imagery for quantifying river temperature heterogeneity. Hydrol. Process. 2019, 33, 1152–1163. [Google Scholar] [CrossRef]
  12. Fullerton, A.H.; Torgersen, C.E.; Lawler, J.J.; Faux, R.N.; Steel, E.A.; Beechie, T.J.; Ebersole, J.L.; Leibowitz, S.G. Rethinking the longitudinal stream temperature paradigm: Region-wide comparison of thermal infrared imagery reveals unexpected complexity of river temperatures. Hydrol. Process. 2015, 29, 4719–4737. [Google Scholar] [CrossRef]
  13. Webb, B.W.; Hannah, D.M.; Moore, R.D.; Brown, L.E.; Nobilis, F. Recent advances in stream and river temperature research. Hydrol. Process. 2008, 22, 902–918. [Google Scholar] [CrossRef]
  14. Wawrzyniak, V.; Piégay, H.; Allemand, P.; Vaudor, L.; Goma, R.; Grandjean, P. Effects of geomorphology and groundwater level on the spatio-temporal variability of riverine cold water patches assessed using thermal infrared (TIR) remote sensing. Remote Sens. Environ. 2016, 175, 337–348. [Google Scholar] [CrossRef]
  15. Eschbach, D.; Piasny, G.; Schmitt, L.; Pfister, L.; Grussenmeyer, P.; Koehl, M.; Skupinski, G.; Serradj, A. Thermal-infrared remote sensing of surface water–groundwater exchanges in a restored anastomosing channel (Upper Rhine River, France). Hydrol. Process. 2017, 31, 1113–1124. [Google Scholar] [CrossRef]
  16. Dugdale, S.J.; Bergeron, N.E.; St-Hilaire, A. Temporal variability of thermal refuges and water temperature patterns in an Atlantic salmon river. Remote Sens. Environ. 2013, 136, 358–373. [Google Scholar] [CrossRef]
  17. Frechette, D.M.; Dugdale, S.J.; Dodson, J.J.; Bergeron, N.E. Understanding summertime thermal refuge use by adult Atlantic salmon using remote sensing, river temperature monitoring, and acoustic telemetry. Can. J. Fish. Aquat. Sci. 2018, 75, 1999–2010. [Google Scholar] [CrossRef]
  18. Micieli, M.; Botter, G.; Mendicino, G.; Senatore, A. UAV Thermal Images for Water Presence Detection in a Mediterranean Headwater Catchment. Remote Sens. 2022, 14, 108. [Google Scholar] [CrossRef]
  19. Dugdale, S.J.; Klaus, J.; Hannah, D.M. Looking to the Skies: Realising the Combined Potential of Drones and Thermal Infrared Imagery to Advance Hydrological Process Understanding in Headwaters. Water Resour. Res. 2022, 58, 226. [Google Scholar] [CrossRef]
  20. Lee, E.; Yoon, H.; Hyun, S.P.; Burnett, W.C.; Koh, D.-C.; Ha, K.; Kim, D.-J.; Kim, Y.; Kang, K.-M. Unmanned aerial vehicles (UAVs)-based thermal infrared (TIR) mapping, a novel approach to assess groundwater discharge into the coastal zone. Limnol. Oceanogr. Methods 2016, 14, 725–735. [Google Scholar] [CrossRef]
  21. Karisallen, J.J.; Kurylyk, B.L. Drone-based characterization of intertidal spring cold-water plume dynamics. Hydrol. Process. 2021, 35, e2295. [Google Scholar] [CrossRef]
  22. Niwa, H. Comparison of the accuracy of two UAV-mounted uncooled thermal infrared sensors in predicting river water temperature. River Res. Apps 2022, 38, 1660–1667. [Google Scholar] [CrossRef]
  23. Caldwell, S.H.; Kelleher, C.; Baker, E.A.; Lautz, L.K. Relative information from thermal infrared imagery via unoccupied aerial vehicle informs simulations and spatially-distributed assessments of stream temperature. Sci. Total Environ. 2019, 661, 364–374. [Google Scholar] [CrossRef] [PubMed]
  24. O’Sullivan, A.M.; Kurylyk, B.L. Limiting External Absorptivity of UAV-Based Uncooled Thermal Infrared Sensors Increases Water Temperature Measurement Accuracy. Remote Sens. 2022, 14, 6356. [Google Scholar] [CrossRef]
  25. Handcock, R.N.; Gillespie, A.R.; Cherkauer, K.A.; Kay, J.E.; Burges, S.J.; Kampf, S.K. Accuracy and uncertainty of thermal-infrared remote sensing of stream temperatures at multiple spatial scales. Remote Sens. Environ. 2006, 100, 427–440. [Google Scholar] [CrossRef]
  26. Virtue, J.; Turner, D.; Williams, G.; Zeliadt, S.; McCabe, M.; Lucieer, A. Thermal Sensor Calibration for Unmanned Aerial Systems Using an External Heated Shutter. Drones 2021, 5, 119. [Google Scholar] [CrossRef]
  27. Loerke, E.; Pohle, I.; Drummond, D.; Miller, P.E.; Geris, J. Surface Measure to Depth (SMeTD): A new low-budget system for 3D water temperature measurements for combining with UAV-based thermal infrared imagery. Environ. Monit. Assess. 2023, 195, 1533. [Google Scholar] [CrossRef] [PubMed]
  28. Redana, M.; Lancaster, L.T.; Chong, X.Y.; Lip, Y.Y.; Gibbins, C. An open-source method for producing reliable water temperature maps for ecological applications using non-radiometric sensors. Remote Sens. Appl. Soc. Environ. 2024, 34, 101184. [Google Scholar] [CrossRef]
  29. Sedano-Cibrián, J.; Pérez-Álvarez, R.; de Luis-Ruiz, J.M.; Pereda-García, R.; Salas-Menocal, B.R. Thermal Water Prospection with UAV, Low-Cost Sensors and GIS. Application to the Case of La Hermida. Sensors 2022, 22, 6756. [Google Scholar] [CrossRef] [PubMed]
  30. Sima, O.; Tang, B.-H.; He, Z.-W.; Wang, D.; Zhao, J.-L. Retrieval of Plateau Lake Water Surface Temperature from UAV Thermal Infrared Data. Atmosphere 2024, 15, 99. [Google Scholar] [CrossRef]
  31. Shaw, J.; Marston, C. Polarized infrared emissivity for a rough water surface. Opt. Express 2000, 7, 375–380. [Google Scholar] [CrossRef] [PubMed]
  32. Newman, S.M.; Smith, J.A.; Glew, M.D.; Rogers, S.M.; Taylor, J.P. Temperature and salinity dependence of sea surface emissivity in the thermal infrared. Q. J. R. Meteorol. Soc. 2005, 131, 2539–2557. [Google Scholar] [CrossRef]
  33. Torgersen, C.E.; Faux, R.N.; McIntosh, B.A.; Poage, N.J.; Norton, D.J. Airborne thermal remote sensing for water temperature assessment in rivers and streams. Remote Sens. Environ. 2001, 76, 386–398. [Google Scholar] [CrossRef]
  34. Handcock, R.N.; Torgersen, C.E.; Cherkauer, K.A.; Gillespie, A.R.; Tockner, K.; Faux, R.N.; Tan, J. Thermal Infrared Remote Sensing of Water Temperature in Riverine Landscapes. In Fluvial Remote Sensing for Science and Management; Carbonneau, P.E., Piégay, H., Eds.; Wiley: Hoboken, NJ, USA, 2012; pp. 85–113. ISBN 9780470714270. [Google Scholar]
  35. Feijt, A.J.; Kohsiek, W. The effect of emissivity variation on surface temperature determined by infrared radiometry. Bound.-Layer Meteorol. 1995, 72, 323–327. [Google Scholar] [CrossRef]
  36. Cheng, J.; Cheng, X.; Meng, X.; Zhou, G. A Monte Carlo Emissivity Model for Wind-Roughened Sea Surface. Sensors 2019, 19, 2166. [Google Scholar] [CrossRef] [PubMed]
  37. Masuda, K.; Takashima, T.; Takayama, Y. Emissivity of pure and sea waters for the model sea surface in the infrared window regions. Remote Sens. Environ. 1988, 24, 313–329. [Google Scholar] [CrossRef]
  38. Hanafin, J.A.; Minnett, P.J. Measurements of the infrared emissivity of a wind-roughened sea surface. Appl. Opt. 2005, 44, 398–411. [Google Scholar] [CrossRef] [PubMed]
  39. Wei, J.-A.; Wang, D.; Gong, F.; He, X.; Bai, Y. The Influence of Increasing Water Turbidity on Sea Surface Emissivity. IEEE Trans. Geosci. Remote Sens. 2017, 55, 3501–3515. [Google Scholar] [CrossRef]
  40. Wenyao, L.; Field, R.T.; Gantt, R.G.; Klemas, V. Measurement of the surface emissivity of turbid waters. Chin. J. Ocean. Limnol. 1987, 5, 363–369. [Google Scholar] [CrossRef]
  41. Konda, M.; Imasato, N.; Nishi, K.; Toda, T. Measurement of the sea surface emissivity. J Oceanogr 1994, 50, 17–30. [Google Scholar] [CrossRef]
  42. Cox, C.; Munk, W. Measurement of the Roughness of the Sea Surface from Photographs of the Sun’s Glitter. J. Opt. Soc. Am. 1954, 44, 838. [Google Scholar] [CrossRef]
  43. Zhang, H.; Yang, K.; Lou, X.; Li, Y.; Zheng, G.; Wang, J.; Wang, X.; Ren, L.; Li, D.; Shi, A. Observation of sea surface roughness at a pixel scale using multi-angle sun glitter images acquired by the ASTER sensor. Remote Sens. Environ. 2018, 208, 97–108. [Google Scholar] [CrossRef]
  44. Høeg, P.; Carlström, A. Sea Surface Roughness Determination from Grazing Angle GPS Ocean Observations and Scatterometry Simulations. Remote Sens. 2023, 15, 3794. [Google Scholar] [CrossRef]
  45. Fu, S.; Huang, W.; Luo, J.; Yang, Z.; Fu, H.; Luo, Y.; Wang, B. Deep Learning-Based Sea Surface Roughness Parameterization Scheme Improves Sea Surface Wind Forecast. Geophys. Res. Lett. 2023, 50, 145. [Google Scholar] [CrossRef]
  46. Stammel, B.; Cyffka, B.; Geist, J.; Müller, M.; Pander, J.; Blasch, G.; Fischer, P.; Gruppe, A.; Haas, F.; Kilg, M.; et al. Floodplain restoration on the Upper Danube (Germany) by re-establishing water and sediment dynamics: A scientific monitoring as part of the implementation. River Syst. 2012, 20, 55–70. [Google Scholar] [CrossRef]
  47. Fischer, P.; Cyffka, B. Floodplain restoration on the Upper Danube by re-establishing back water dynamics: First results of the hydrological monitoring. Erdkunde 2014, 68, 3–18. [Google Scholar] [CrossRef]
  48. Pander, J.; Mueller, M.; Geist, J. Habitat diversity and connectivity govern the conservation value of restored aquatic floodplain habitats. Biol. Conserv. 2018, 217, 1–10. [Google Scholar] [CrossRef]
  49. Pander, J.; Casas-Mulet, R.; Geist, J. Hydropeaking impairs upstream salmonid spawning habitats in a restored Danube tributary. River Res. Apps 2023, 39, 389–400. [Google Scholar] [CrossRef]
  50. Jowett, I.G. A method for objectively identifying pool, run, and riffle habitats from physical measurements. N. Z. J. Mar. Freshw. Res. 1993, 27, 241–248. [Google Scholar] [CrossRef]
  51. Casatti, L.; Teresa, F.B. A multimetric index based on fish fauna for the evaluation of the biotic integrity of streams at a mesohabitat scale. Acta Limnol. Bras. 2012, 24, 339–350. [Google Scholar] [CrossRef]
  52. Environment Agency, River Habitat Survey in Britain and Ireland. Available online: https://assets.publishing.service.gov.uk/media/62dff4138fa8f564a21dcd5e/RHS-manual-2003_2022-reprint-LIT-1758.pdf (accessed on 24 January 2024).
  53. Hawkins, C.P.; Kershner, J.L.; Bisson, P.A.; Bryant, M.D.; Decker, L.M.; Gregory, S.V.; McCullough, D.A.; Overton, C.K.; Reeves, G.H.; Steedman, R.J.; et al. A Hierarchical Approach to Classifying Stream Habitat Features. Fisheries 1993, 18, 3–12. [Google Scholar] [CrossRef]
  54. Gosselin, M.-P.; Maddock, I.; Petts, G. Mesohabitat use by brown trout (Salmo trutta) in a small groundwater-dominated stream. River Res. Appl. 2012, 28, 390–401. [Google Scholar] [CrossRef]
  55. Landesamt für Digitalisierung, Breitband und Vermessung. GeodatenOnline: Digitales Orthophoto DOP80 (WMS). Available online: https://www.ldbv.bayern.de/produkte/dienste/geodatendienste.html (accessed on 1 March 2024).
  56. Wohl, E.E.; Vincent, K.R.; Merritts, D.J. Pool and riffle characteristics in relation to channel gradient. Geomorphology 1993, 6, 99–110. [Google Scholar] [CrossRef]
  57. Piatka, D.R.; Wild, R.; Hartmann, J.; Kaule, R.; Kaule, L.; Gilfedder, B.; Peiffer, S.; Geist, J.; Beierkuhnlein, C.; Barth, J.A.C. Transfer and transformations of oxygen in rivers as catchment reflectors of continental landscapes: A review. Earth-Sci. Rev. 2021, 220, 103729. [Google Scholar] [CrossRef]
  58. Kelly, J.; Kljun, N.; Olsson, P.-O.; Mihai, L.; Liljeblad, B.; Weslien, P.; Klemedtsson, L.; Eklundh, L. Challenges and Best Practices for Deriving Temperature Data from an Uncalibrated UAV Thermal Infrared Camera. Remote Sens. 2019, 11, 567. [Google Scholar] [CrossRef]
  59. Casas-Mulet, R.; Alfredsen, K.; García-Escudero Uribe, A. A cost-effective approach to predict dynamic variation of mesohabitats at the river scale in Norwegian systems. Int. J. River Basin Manag. 2014, 12, 145–159. [Google Scholar] [CrossRef]
  60. Borsányi, P.; Alfredsen, K.; Harby, A.; Ugedal, O.; Kraxner, C. A Meso-scale Habitat Classification Method for Production Modelling of Atlantic Salmon in Norway. Hydroecologie Appl. 2004, 14, 119–138. [Google Scholar] [CrossRef]
  61. Gharechelou, S.; Tateishi, R.; Johnson, B.A. A Simple Method for the Parameterization of Surface Roughness from Microwave Remote Sensing. Remote Sens. 2018, 10, 1711. [Google Scholar] [CrossRef]
Figure 1. Location of the study site and overview of installed surface roughness measurement devices (SRMD) and temperature loggers at individual fluvial mesohabitats (FMHs = still, pool, run and riffle) within a large-scale floodplain restoration at the Danube River. OHB = Ottheinrichbach, FP = fish pass, LMB = Längenmühlbach, Danube = River Danube. Base orthophoto [55].
Remotesensing 16 01674 g001
Figure 2. Views of the Surface Roughness Measurement Device (SRMD). (Left): technical three-sided view (all measures in mm). (Right): three-dimensional visualization of the SRMD, including a color scale with differentiated colors to mark each 1 cm interval which is readable from the distance.
Remotesensing 16 01674 g002
Figure 3. Installed Surface Roughness Measurement Device (SRMD) on a pole and a small float with temperature logger in the fluvial mesohabitat type (FMH) pool.
Remotesensing 16 01674 g003
Figure 4. Combined box-whisker-plots and violin plots (25% quantile, median, 75% quantile, whisker: minimum and maximum values, circles represent outliers). (A) Wave frequency of individual fluvial mesohabitats (FMHs), (B) wave frequency of FMH classes, (C) maximum wave amplitude of individual FMHs, (D) maximum wave amplitude of FMH classes. Labeled black dots indicate mean values at (B,D). Different colors represent different mesohabitats.
Remotesensing 16 01674 g004
Figure 5. Combined box-whisker-plots and violin plots (25% quantile, median, 75% quantile, whisker: minimum and maximum values) of difference between logger and TIR temperature of individual FMHs (A) and difference between logger and TIR temperature of FMH classes (B); labeled black dots indicate mean values. Scatterplots show an absent correlation (black line) between SR (frequency, (C); maximum wave amplitude, (D)) and temperature difference between logger and TIR data; grey areas indicate the standard error. Different colors represent different mesohabitats.
Remotesensing 16 01674 g005
Disclaimer/Publisher’s Note: The statements, opinions and data contained in all publications are solely those of the individual author(s) and contributor(s) and not of MDPI and/or the editor(s). MDPI and/or the editor(s) disclaim responsibility for any injury to people or property resulting from any ideas, methods, instructions or products referred to in the content.

