
Disaggregating National Statistical Data to Assess the Sub-National SDG 6.4.2 Water Stress Indicator by Integrating Satellite Observations and Model Data

1
Key Laboratory of Remote Sensing and Digital Earth, Aerospace Information Research Institute, Chinese Academy of Sciences, Beijing 100101, China
2
International Research Center of Big Data for Sustainable Development Goals, Aerospace Information Research Institute, Chinese Academy of Sciences, Beijing 100094, China
*
Author to whom correspondence should be addressed.
Remote Sens. 2024, 16(10), 1654; https://doi.org/10.3390/rs16101654
Submission received: 1 March 2024
/
Revised: 21 April 2024
/
Accepted: 1 May 2024
/
Published: 7 May 2024
Abstract
:Ensuring the sustainable management of water and sanitation for all is the primary goal of Sustainable Development Goal 6 (SDG 6). SDG indicator 6.4.2 (level of water stress) is critical for monitoring the progress toward SDG 6. The assessment of the SDG indicator 6.4.2 is currently based on statistical data at the national scale, i.e., one value for one country, which cannot reflect spatial variability in water stress in a country. The lack of data at sub-national scales limits the assessment of water stress in sub-national regions. This study developed a method of disaggregating national statistical renewable water resources (TRWR) and freshwater withdrawals (TFWW) to estimate the SDG 6.4.2 water stress indicator at a sub-national scale by combining satellite remote sensing data and model simulated data. Remote sensing (RS)-based precipitation (P); the difference between precipitation and evapotranspiration (P-ET); and the difference between precipitation, evapotranspiration, terrestrial water storage change (P-ET-dS), and model-simulated naturized runoff and withdrawal water use were used as spatial and temporal surrogates to disaggregate the national-scale statistics of TRWR and TFWW to the grid scale. Gridded TRWR and TFWW can be used to calculate the water stress of any interest regions. Disaggregated TRWR, TFWW, and water stress estimation were validated at three different spatial scales, from major river basins and provinces to prefectures in China, by comparing the corresponding statistical data. The results show that the disaggregation for TRWR is generally better than for TFWW, and the overall accuracy for water stress estimation can reach up to 91%. The temporal evolution of disaggregated variables also showed good consistency with statistical time series data. The RS-based P-ET and P-ET-dS have great potential for disaggregating TRWR at different spatiotemporal scales, with no obvious differences with the results using the model simulation as a surrogate for the disaggregation of SDG indicator 6.4.2. The disaggregation accuracy can be further improved when the sub-regional statistical data of TRWR and TFWW are applied to the disaggregation approach.
1. Introduction
Water is an indispensable resource for sustaining life, societies, and economies, but the amount of water is limited [1]. The United Nations (UN) has expressed great concern about the water crisis. According to the World Meteorological Organization’s (WMO) 2022 Report on the State of Global Water Resources, at least 3.6 billion people experience inadequate water supply for at least one month each year, expected to exceed 5 billion by 2050 [2]. To address this issue, the United Nations 2030 Agenda for Sustainable Development has established Sustainable Development Goal 6 (SDG 6) to ensure the sustainable management of water and sanitation for all. Specifically, SDG 6.4 aims to significantly reduce the number of people affected by water scarcity through sustainable freshwater withdrawals and supplies by 2030 [3]. Ineffective management, misuse, over-exploitation of groundwater, and freshwater pollution have exacerbated water scarcity and threatened sustainable development [4,5].
Several indicators have been developed to assess water scarcity, including the Falkenmark indicator; the criticality ratio; the water poverty index; and more advanced approaches considering water quality, green water, and environmental flow requirements [6]. These indicators, each with strengths and weaknesses, help us understand the multifaceted nature of water scarcity [7]. SDG indicator 6.4.2 proposed by the UN, namely, the level of water stress, is one of the two indicators for monitoring the SDG 6.4 target. High levels of water stress can lead to increased competition and potential conflict between water use sectors, which is detrimental to sustainable development, particularly in regions with insufficient and declining freshwater availability [8]. As the custodian agency of SDG 6, the Food and Agriculture Organization of the United Nations (FAO) collects annual data at the country level and reports them to the United Nations Statistics Division (UNSD). SDG indicator 6.4.2 is assessed using these collected statistical data at the national level [9], i.e., one value for one country, which may not capture sub-national differences in water stress in one country. Water stress levels are largely spatially variable, especially in countries with large territorial areas and spatial heterogeneity in water resources, hydrological conditions, and water use. In addition, the spatial variability in a region cannot always be captured by statistical data, regardless of how large the area is. The lack of data at sub-national scales limits the assessment of water stress in sub-national regions [10].
Accurate information on water stress is critical for identifying areas requiring immediate action and pinpointing regions affected by high or critical water stress. Previous studies have highlighted the importance of disaggregating this indicator to higher spatial and temporal resolutions [11,12,13]. The United Nations Statistical Commission (UNSC) emphasizes the need to improve data disaggregation to fully implement the indicator framework and reflect the principles of the 2030 Sustainable Development Agenda, ensuring that no one is left behind. The Inter-Agency and Expert Group of the Sustainable Development Goals (IAEG-SDG) has established a Working Group on data disaggregation, urging countries and custodian agencies to disaggregate SDG indicators according to various criteria. Fehri et al. (2019) utilized remote sensing (RS)-based evapotranspiration (ET) to estimate irrigation water withdrawals in the Medjerda catchment in Tunisia and found that integrating RS-based irrigation data reduced the uncertainty in estimating water stress [14]. Biancalani and Michela (2021) proposed a method of disaggregating SDG indicator 6.4.2 in major river basins, in which the GlobWat soil water balance model was used to estimate renewable freshwater resources, and global geospatial data consistent with national statistics were used to represent freshwater withdrawals in each sector [11]. This approach addresses the information gaps previously identified in country-level assessments.
One of the primary challenges in monitoring SDG indicator 6.4.2 is obtaining accurate, comprehensive, and timely data, as not all countries report all the required variables, and some countries do not report at the required frequency [10]. Although hydrological models can provide temporal and spatial disaggregation of water stress, the uncertainties of the model and too many input requirements limit their application [15,16]. Remote sensing technology can provide a wealth of data on the Earth’s surface information, including hydrologic attributes such as precipitation, evapotranspiration, and agricultural irrigation water use, which are especially critical for poorly gauged regions [17]. However, the potential of remote sensing to provide high spatial–temporal resolution data and near real-time monitoring remains underutilized in the assessment of SDG indicator 6.4.2. In addition, the quality of disaggregation results must be adequately assessed.
This study aims to improve the calculation of SDG indicator 6.4.2 by disaggregating the national-level statistics of renewable freshwater resources and freshwater withdrawals to a gridded scale, which can be used to calculate the water stress levels at any sub-national level of interest. Disaggregation was achieved by combining remote sensing and model–simulation data. The disaggregation results, including renewable water resources, freshwater withdrawals, and water stress levels, were evaluated at different spatial scales using China Water Resources Bulletin data. The results from different surrogate variables and the temporal evolution of disaggregated variables were also evaluated. In addition, some improvements for disaggregation, including using statistical data at finer administrative units, the impact of water stress level classification on disaggregation accuracy, and the effects of environmental flow requirements and external water resources on water stress evaluation, were discussed. The disaggregation of SDG indicator 6.4.2 will be necessary to better understand water stress’s spatial and temporal distribution.
2. Methods
2.1. Definition of Water Stress Indicator and Overall Approach of This Study
2.1.1. Definition of Water Stress Indicator
The level of water stress (WS) of SDG indicator 6.4.2 is defined as the ratio of total freshwater withdrawals (TFWW) by all major sectors to total renewable freshwater resources (TRWR) after deducting the environmental flow requirement (EFR) [10], and it is expressed mathematically as
WS (%) = TFWW/(TRWR − EFR) × 100.
TFWW refers to the total freshwater withdrawn from its source (rivers, lakes, and aquifers) for agriculture, industry, and services. It excludes the direct use of non-conventional water, such as treated wastewater, agricultural drainage, and desalinated water. TRWR is the sum of internal and external renewable freshwater resources. Internal renewable freshwater resources refer to the long-term average annual flow of rivers and the recharge of groundwater for a given region generated from endogenous precipitation, i.e., the total volume of river runoff and groundwater generated in natural conditions. The external renewable freshwater resources are the flows of water entering the country, considering the amount of flow volume reserved upstream and downstream through agreements or treaties. The EFR is the quantity and timing of freshwater flows and levels necessary to sustain aquatic ecosystems, which, in turn, support human cultures, economies, sustainable livelihoods, and well-being [11]. The EFR is established to protect the essential environmental services of freshwater ecosystems. The unit of TFWW, TRWW, and the EFR is m3.
According to the FAO’s definition, water stress is categorized into five levels of severity [10], as shown in Table 1. High levels of water stress adversely affect social and economic development. A level of water stress >100% indicates the use of environmental or non-renewable water (such as groundwater), which is undesirable and unsustainable.
Based on Equation (1), it is evident that WS can be easily obtained if the data of TRWR, TFWW, and the EFR are available for target areas. In the current reports on SDG6.4.2 published by the UN-FAO, the assessment of water stress is conducted at the national level using the annual statistical data of TRWR and TFWW provided by each country due to the limited availability of data at the sub-national level.
2.1.2. Overall Approach
We propose a method to disaggregate the national statistical data of TRWR and TFWW to the grid scale. The gridded TRWR and TFWW can then be aggregated at any sub-national or administrative level to assess water stress at the corresponding level. Figure 1 shows the overall flow chart of the proposed disaggregation and validation methods.
This section introduces a scientific approach to disaggregating the water stress indicator as defined in Equation (1). The research scheme includes three steps: (a) disaggregation of the statistical data of national TRWR and TFWW to obtain gridded values (Figure 1, block A); (b) aggregation of the gridded values of TRWR and TFWW to the sub-national scales of interest using the boundary of the region so that WS can be calculated at the corresponding levels (Figure 1, block B); (c) estimate of WS at the basinal, provincial, and prefectural levels and evaluation of disaggregated variables at these three scales (Figure 1, block C).
2.2. Spatial Disaggregation of TRWR and TFWW
The spatial disaggregation of TRWR and TFWW involves downscaling national-level statistical data to a grid scale, which requires gridded surrogate variables that accurately represent the spatial variations in TRWR and TFWW. The basic principle of spatial disaggregation is that TRWR (or TFWW) at the national level is equal to the sum of the TRWR (or TFWW) of all grids within the target country, and it is expressed as
where Y is either TRWR or TFWW at the national level from the statistical data; N is the total number of grids in a country; and yi is the values of TRWR or TFWW in grid i.
Due to spatial variability in the renewable water resources and freshwater withdrawals, the contribution of each grid value to TRWR and TFWW varies with space, i.e., different weights. If the weight of each grid, ωi, can be determined, the national TRWR (TFWW) value can be spatially assigned to each grid according to the weight by
The key step in the disaggregation of TRWR (TFWW) is then to determine the weight values, , of each grid, which is calculated by
where is the value of a surrogate variable for TRWR (or TFWW) in grid i, which can be obtained either by remote sensing observations or by model outputs, hereafter called surrogate of TRWR (or TFWW), and its unit should be consistent with the unit used to measure water volumes in TRWR (or TFWW), i.e., m3.
Figure 2 shows a schematic diagram of the spatial disaggregation process of water stress. The first stage of the process is to extract grid cells of surrogate variables using the country boundary. The details on the surrogate variables will be elaborated in Section 2.2.1 and Section 2.2.2. Next, ωi is determined using Equation (4). Once the ωi values are obtained, the TRWR and TFWW of each grid are calculated using Equation (3). Equation (2) is then used to calculate TRWR and TFWW at the sub-national level based on the gridded TRWR and TFWW and the sub-national region boundary. Finally, WS at the sub-national level can be obtained from Equation (1) when the environmental flow requirement (EFR) is provided (see Section 2.4 for EFR estimation). It should be noted that the sub-national level should be larger than the spatial resolution of the gridded surrogate variable.
2.2.1. Surrogate Variables of TRWR
The surrogate variables that represent the temporal and spatial variations in TRWR are diverse. Precipitation (P) is widely recognized as the critical variable of water resources because it is the primary source of renewable freshwater resources [18]. Actual evapotranspiration (ET) is the primary consumer of surface water, and the difference between P and ET, denoted as P−ET, can be used as the available water resource [19,20,21]. In addition, according to the water balance equation, the difference between P−ET and the change in terrestrial water storage (dS), denoted as P−ET−dS, represents the runoff, which is renewable water resources [22]. Therefore, the spatial variation in P, P−ET, and P−ET−dS may be somewhat correlated with the spatial distribution of TRWR. In this study, RS-based P, P−ET, and P−ET−dS are used as the surrogate of TRWR in Equation (4) to calculate the weight of each grid. In addition, simulated naturalized runoff from a hydrological model is also used as a surrogate to disaggregate TRWR and compare it with the results from RS-based surrogates.
It should be noted that P−ET and P−ET−dS may be less than 0. For example, irrigation may cause ET to be greater than P. In this study, if the value of P−ET or P−ET−dS is less than 0, it is replaced by 0.3P [23]. This replacement is only a rough estimation and does not consider the variability in different regions. However, the ratio means nearly 70% of the precipitation is evaporated into the atmosphere, and the remaining 30% of precipitation (0.3P) is renewable freshwater resources, in line with the global water cycle balance.
2.2.2. Surrogate Variables of TFWW
TFWW refers to the amount of water used by the main economic sectors of agriculture, industry, and services, excluding the direct use of non-conventional water. The increase in TFWW is closely linked to agricultural distribution, population growth, and economic development. Various approaches have been developed to geospatially relate sectoral water use to driving variables [11,24]. Estimating agricultural water use from remote sensing data has received more attention [25]. However, there are still challenges in estimating TFWW using remotely sensed data. Alternatively, this study uses publicly available gridded data regarding potential withdrawal water uses from a global hydrological model of WaterGAP (Water—Global Assessment and Prognosis) to spatially disaggregate TFWW.
2.3. Temporal Disaggregation of TRWR and TFWW
The temporal disaggregation of TRWR and TFWW is similar to their spatial disaggregation, but it aims to downscale annual values to monthly ones. The monthly scale can reflect seasonal change well, which is important for water resource management. The fundamental principle is that the yearly TRWR (or TFWW) is equal to the sum of monthly values from January to December; i.e., the spatially gridded data in Figure 2 are replaced by the time series data from January to December in each grid. The monthly data of surrogate variables reflect the fluctuations of TRWR and TFWW during the year and are used to calculate the weight of each month. Based on the yearly statistical data, the monthly TRWR and TFWW can be obtained for monthly WS calculation.
Spatial disaggregation and temporal disaggregation are two independent processes. Gridded TRWR and TFWW at monthly intervals can be obtained when both are performed. The gridded data can then be used to estimate water stress in any given area or water management unit at the sub-national level.
2.4. Estimation of Environmental Flow Requirement
In addition to TRWR and TFWW, the EFR is essential in calculating WS. The estimation methods for the EFR show high variability, ranging from global estimates to comprehensive assessments for river basins [26,27]. Due to limited data access and the inadequacy of global schemes for China’s regions (discussed in Section 5.3), we use an alternative method to estimate the EFR in this study. The difference between TRWR and the EFR (i.e., TRWR-EFR in the denominator of Equation (1)) represents the available water resource and is proportional to TRWR. Equation (1) can be rewritten as
where r is the ratio of available water resources to total renewable freshwater resources, also known as the water resources development and utilization ratio, which considers environmental flow requirements. Tennant (1976) recommended that the value of r should not exceed 40% to ensure ecological protection [28]. However, it is important to note that the threshold value of 40% should not be applied universally, as it varies across different regions [29]. In this study, the value of r is derived from Wang et al. (2006)’s study [30], which assessed the availability of water resources in ten first-level water resource regions (basins) in China and provided the r values for each basin, with 51.2% for the Songhua River, 52.3% for the Liao River, 64.4% for the Hai River, 58.1% for the Yellow River, 51.5% for the Huai River, 28.4% for the Yangtze River, 33.1% for the Pearl River, 25.4% for Southeast Rivers, 14.0% for Southwest Rivers, and 39.3% Northwest Rivers. We assume that the r value remains constant within the corresponding water resource regions. Equation (5) also implies that the EFR changes with time, following TRWR.
WS (%) = TFWW/(r × TRWR) × 100,
2.5. Validation Methods
2.5.1. Validation Scheme
This study mainly disaggregates national statistical data into various sub-national scales and validates the accuracy of this disaggregation. The spatial disaggregation of TRWR, TFWW, and WS is validated at three sub-national scales, i.e., basin, province, and prefecture (Figure 1, block C). The accuracy of the disaggregated TRWR and TFWW is directly evaluated against basinal, provincial, and prefectural statistical data. For the validation of WS disaggregation, the reference WS value is calculated by Equation (5) based on available basinal, provincial, and prefectural statistical data on TRWR and TFWW. Performance metrics in Section 2.5.2 refer to the quantitative indicators used for validation.
Various surrogate variables, including simulated gridded naturalized runoff; RS-based P, P−ET, and P−ET−dS; and gridded total/sectoral withdrawal water uses, are compared for the disaggregation of TRWR, TFWW, and WS. The potential of basinal and provincial statistical data on TRWR and TFWW to improve WS disaggregation is also discussed.
This study does not validate temporal disaggregation due to the lack of monthly statistical data. However, the temporal evolution of disaggregated variables at the yearly scale is evaluated through consistency analysis.
2.5.2. Performance Metrics
WS is greater than 0 and is classified into five levels, as shown in Table 1. The accuracy of disaggregated WS is validated using two indices: overall accuracy and Kappa coefficient. The overall accuracy index (pc) represents the probability that the classification result matches the reference category and is calculated using the following formula [31]:
where k (=5) denotes the number of categories (levels of water stress in this study); N is the total number of samples; and njj is the number of samples belonging to class j in the reference category for class j in the disaggregation results. pc ranges from 0 to 100%, indicating accuracy from low to high.
The Kappa coefficient (Kap) is an index that measures the degree of coincidence and accuracy between two categorical variables and is calculated by the following equation:
where is the sum of class j obtained for disaggregation results, and is the sum of the reference class, . The Kappa coefficient generally ranges from 0 to 1 and is divided into five groups to represent different levels of consistency: 0.2 (slight), 0.4 (fair), 0.6 (moderate), 0.8 (substantial), and 1.0 (almost perfect) [32]. The Kappa coefficient is highly positively correlated with the overall accuracy index, .
The disaggregated TRWR and TFWW were evaluated using several statistical indices, including the determination coefficient (R2, the square of correlation coefficient), relative root mean square error (RRMSE, the percentage of root mean square error to the mean value), and relative bias (RBIAS, the percentage of the mean deviation to the mean value). A higher value of R2 approaching 1 and lower RRMSE and RBIAS approaching 0 indicate a more accurate estimate. In addition, the consistency of temporal evolution is evaluated by R2. The higher the R2, the more consistent between the two time series data.
3. Data Sources and Data Processing
3.1. Statistical Data
The statistical data used in this study were from the annual China Water Resources Bulletin (CWRB), which provides information on the total amount of water resources, total water supply, total water use, and water use by sectors at national, basinal (10 first-level water resource regions), and provincial (31 provincial administrative units, excluding Hong Kong, Macau, and Taiwan) levels. Table 2 provides the details of the statistical data used in this study. In the CWRB dataset, the total number of water resources refers to the internal renewable water resources. The neglect of external freshwater resources will be discussed in Section 5.4. The total water use is consistent with the total water supply in the Water Resources Bulletin. The total water supply minus the non-conventional water supply is considered TFWW, with consistent connotations with Equation (1). TRWR and TFWW data at the prefectural level, a total of 60 prefectures, are available from the local Water Resources Bulletins of Zhejiang (ZJ), Hubei (HB), Sichuan (SC), and Gansu (GS) Provinces. Information on agriculture, industry, and domestic sectoral water use is available at the national, basinal, and provincial scales. The period of these data ranges from 2002 to 2019 at a yearly frequency. These statistical data are collected and published based on a comprehensive survey and the statistics of water resources.
3.2. Remote Sensing Data
As mentioned in Section 2.2, the surrogate variables (i.e., P, P−ET, and P−ET−dS) were used to disaggregate the national TRWR statistical data to the grid level. To obtain these surrogate variables, this study used remotely sensed gridded data for precipitation, evapotranspiration, and terrestrial water storage change. The details of the remote sensing data can be found in Table 3.
The gridded precipitation data were obtained from the satellite product of the Global Precipitation Measurement (GPM) mission, which integrates multi-source satellite remote sensing data and meteorological station observations. GPM data with a temporal and spatial resolution of 0.1°/month were downloaded from the Goddard Earth Sciences Data and Information Services Center.
The gridded evapotranspiration data were provided by the ETMonitor global ET product at a daily time step and a 1 km spatial resolution, downloaded from the CASEarth Data Sharing and Service Portal. ETMonitor is an RS-based ET model that uses multi-source data as inputs and can generate global daily ET with high accuracy [33]. Daily ET data at a 1 km resolution were integrated into the monthly values.
The terrestrial water storage change was calculated using the terrestrial water storage anomaly dataset from the Gravity Recovery and Climate Experiment (GRACE) JPL Mascon products. This dataset has a spatial and temporal resolution of 0.5°/month.
The monthly GPM precipitation and ETMonitor ET data were resampled to 0.5° to ensure consistency in the spatial resolution of all the gridded data. All monthly data were summed to obtain yearly values.
3.3. Model Simulation Data
WaterGAP (Water—Global Assessment and Prognosis) is a global hydrological model that assesses the human use of groundwater and surface water [24]. The data used in this paper are from WaterGAP 2.2d, released by PANGAEA (Data Publisher for Earth & Environmental Science) [34]. The details on the output variables of the WaterGAP model used in this study can be found in Table 3. The naturalized runoff from the WaterGAP model was used as a surrogate to disaggregate TRWR, and the WaterGAP model outputs of potential withdrawal water uses for irrigation, livestock, household, manufacturing, and thermal power cooling were used as surrogates to disaggregate the national statistical TFWW to the grid scale. The potential withdrawal water uses for irrigation and livestock are summed as agricultural water use. The sum of water uses for manufacturing, and thermal power cooling is the same as industrial water use in this study. TFWW is the sum of agricultural, industrial, and domestic water uses.
4. Results
4.1. Evaluation of Spatial Disaggregation of TRWR
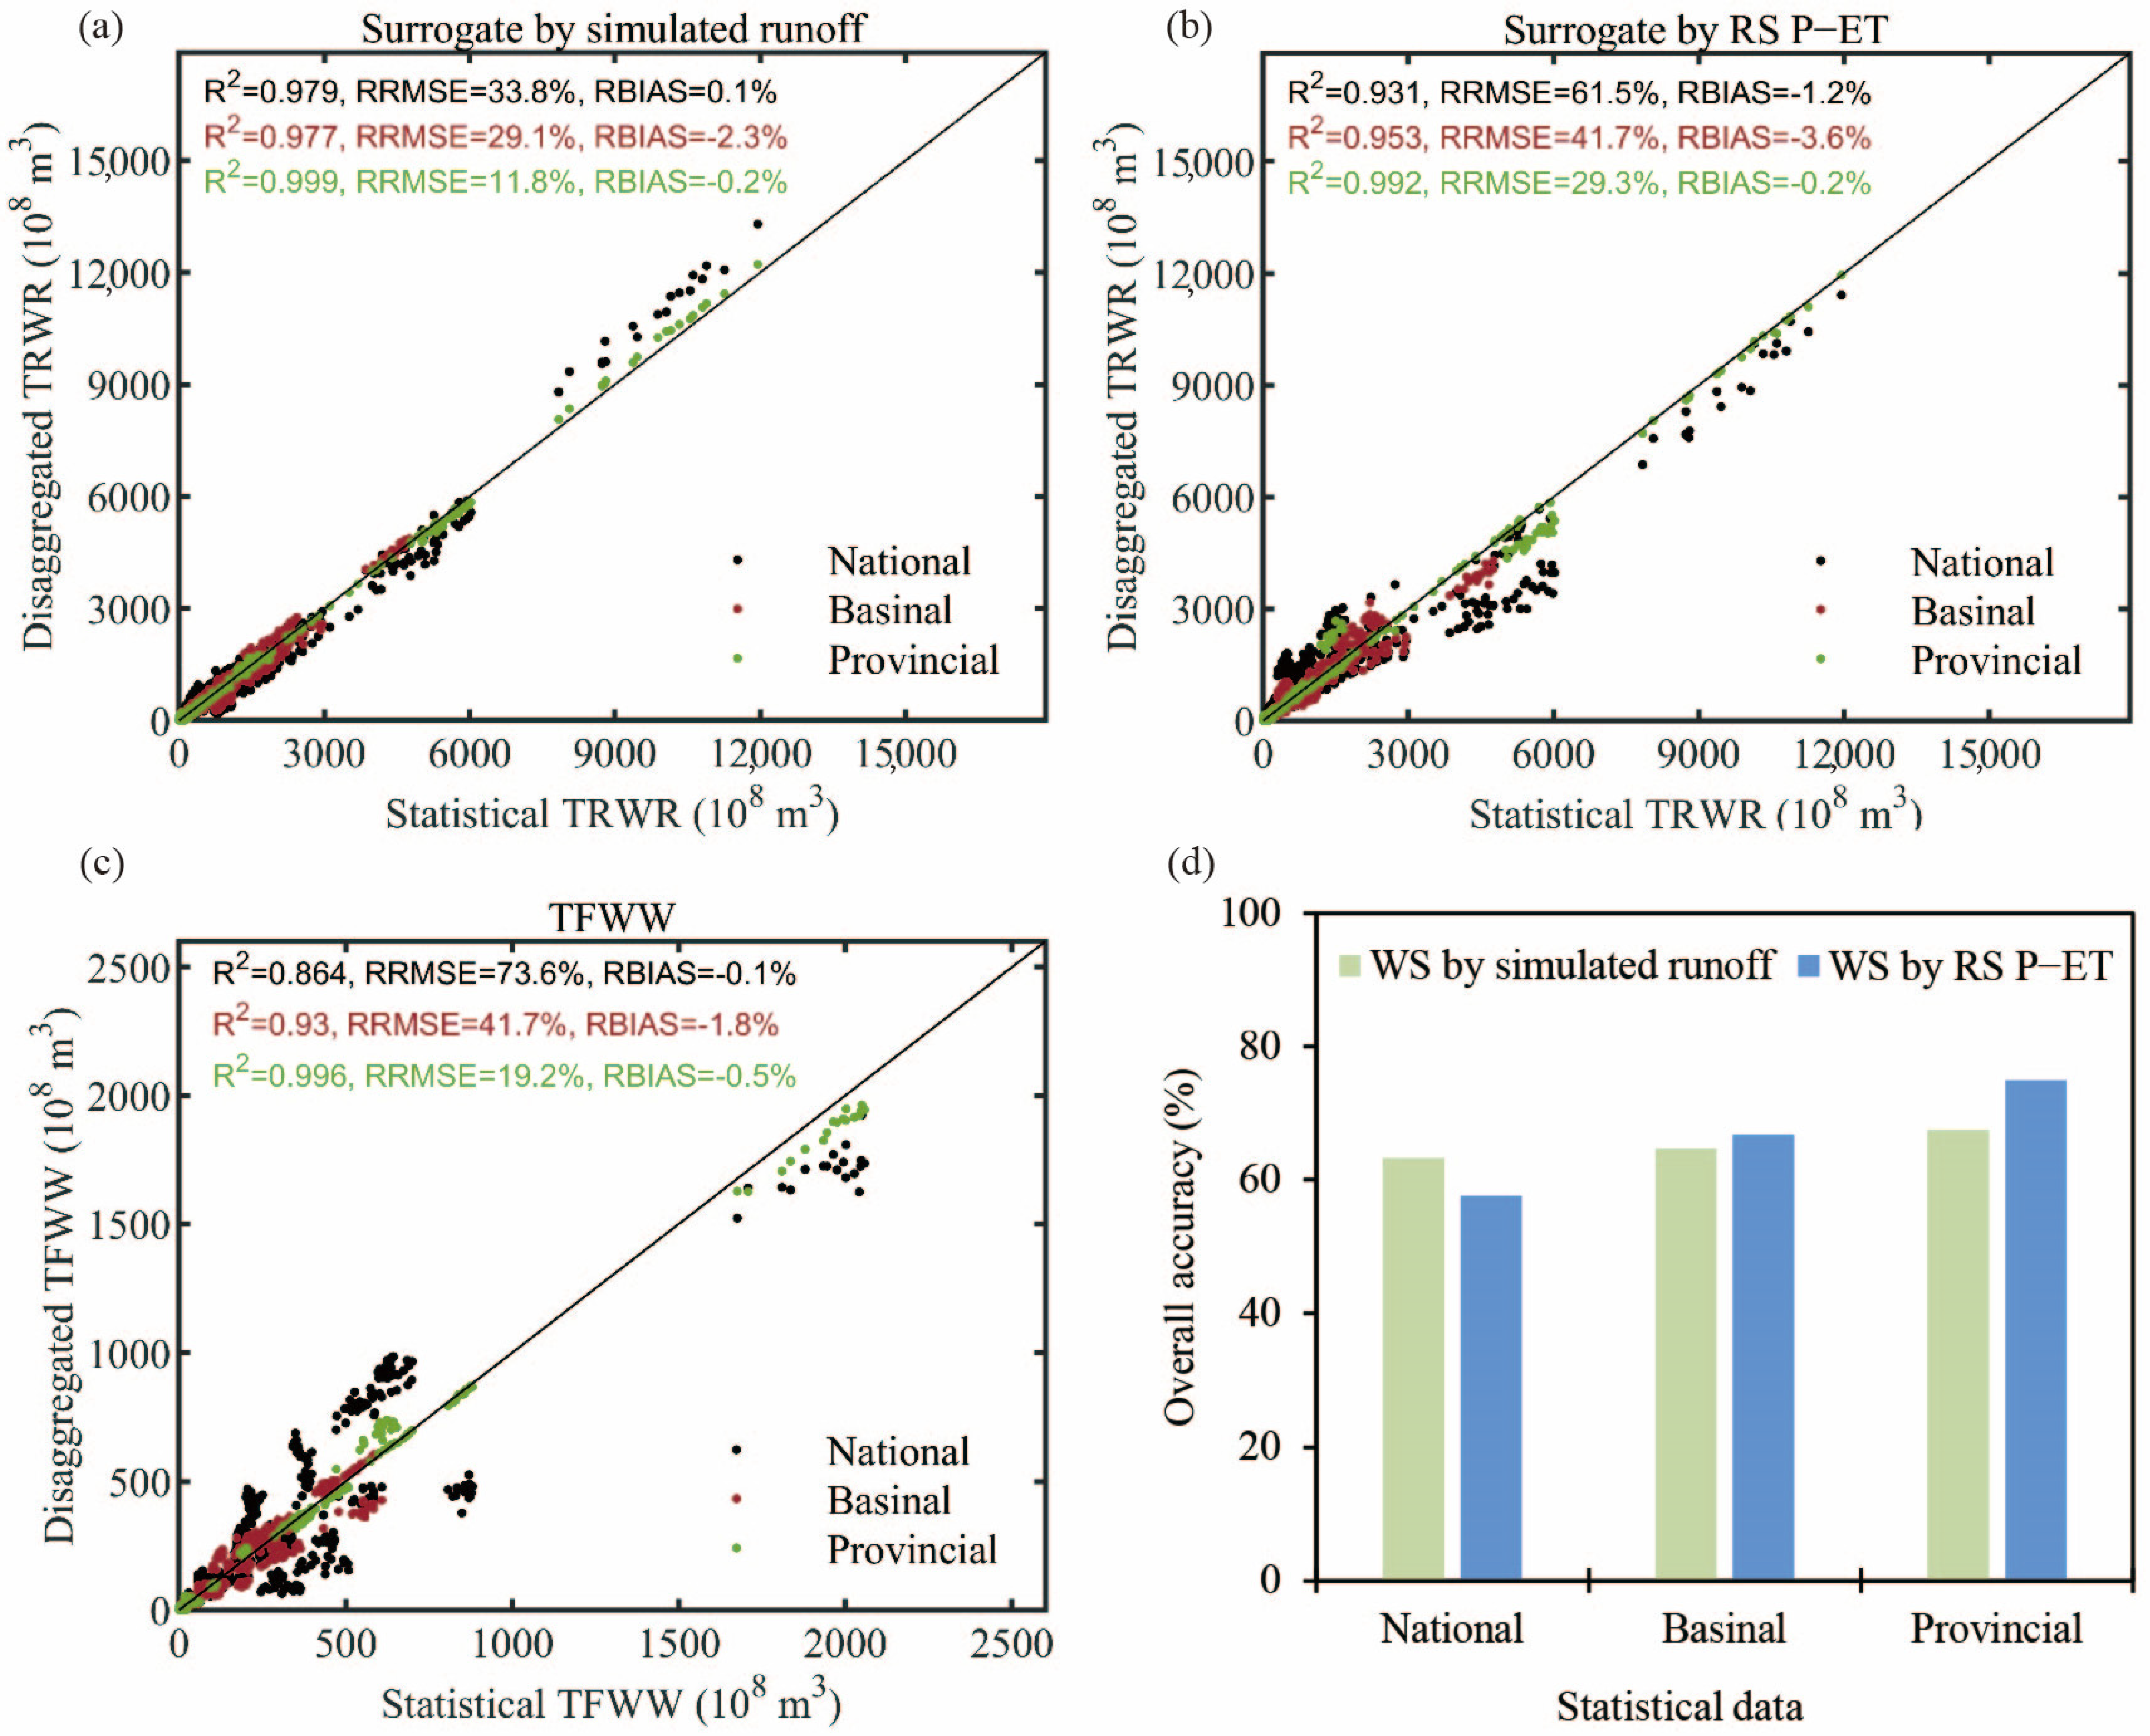
The statistical TRWR values of China in 2002−2019 are disaggregated to the grid level using four surrogates, i.e., WaterGap-simulated naturalized runoff and RS-based P, P−ET, and P−ET−dS. The gridded TRWR values were then aggregated to basinal, provincial, and prefectural levels and evaluated using statistical data at these three levels. The results showed that the disaggregated TRWR using the simulated runoff agreed well with the statistical data at the basinal scale, with an R2 of 0.977 and an RRMSE of 18.4% (Figure 3a). The disaggregation errors increased at provincial and prefectural scales. A higher relative error at a smaller spatial scale can be attributed to the low values at the small scale. The TRWR values of the selected prefectures were not larger than 800 × 108 m3, and most were less than 200 × 108 m3. RRMSE reaches 44.6% at the prefectural scale. The TRWR disaggregation using RS-based surrogates (i.e., P, P−ET, and P−ET−dS; Figure 3b–d) showed slightly poorer performance than that using the simulated naturalized runoff. The significant level for all results in Figure 3 is less than 0.05. Similar to the disaggregation results using simulated runoff as a surrogate, the error of TRWR disaggregation using P, P−ET, and P−ET−dS becomes more significant from the basinal to provincial and prefectural levels. The TRWR disaggregation using P−ET and P−ET−dS was comparable, with a difference of less than 1%, probably because dS can be neglected at the annual scale [35]. In addition, the disaggregation using RS-based P−ET and P−ET−dS showed superior performance at the basinal and provincial levels compared with the results using the P variable as a surrogate.
Figure 4 illustrates the spatial distribution of the disaggregated TRWR both at the gridded and provincial levels. The TRWR value in the southern regions of China is generally higher compared with the northern regions, as shown by the statistical data at the provincial level (Figure 4a). Such spatial patterns can be effectively represented at the grid scale (Figure 4b,d,f,h), allowing for the discrimination of spatial differences in the TRWR within each province. The provincial TRWR value obtained from the disaggregated gridded data (Figure 4c,e,g,i) was compared spatially with the actual provincial statistical data (Figure 4a). The results indicate that the provincial TRWR based on WaterGap simulated runoff tends to overestimate the TRWR values in southern China and underestimate TRWR in northwestern China (Figure 4c), while the opposite results can be seen from RS-based surrogates (Figure 4e,g,i). These results are consistent with those shown in Figure 3; i.e., the RS-based surrogates underestimate TRWR in regions with high TRWR values and overestimate it in regions with low TRWR values. In general, the naturalized runoff simulated by WaterGAP and the three variables (P, P−ET, and P−ET−dS) obtained by satellite remote sensing can capture at least 80% of the spatial pattern and magnitude of the statistical TRWR.
4.2. Evaluation of Spatial Disaggregation of TFWW
The disaggregation of TFWW relies on the potential withdrawal water use data generated by the WaterGap model. The disaggregated gridded results for TFWW were aggregated at the basinal, provincial, and prefectural levels and then evaluated using statistical data on total water use at these three levels. The results show that the R2 values range from 0.586 to 0.786 (a significance level less than 0.05) and the RRMSE values range from 39.6% to 55.1% (Figure 5a). The accuracy of the TFWW estimates is better at the basinal scale than at the provincial and prefectural scales. In general, WaterGap-generated potential withdrawal water uses can express about 60% of the spatial distribution of TFWW, no better than the disaggregation of TRWR in Section 4.1.
Information on the spatial distribution of sectoral water use is of great importance for the sustainable management of water resources, which will contribute to developing appropriate policies meant to adjust the economic framework. The national statistical data on water use by the agricultural, industrial, and domestic sectors can also be used to evaluate the disaggregation method described in Section 2.2, with WaterGap-simulated sectoral potential water uses as surrogates. The disaggregated sectoral water uses were validated at the basinal and provincial levels. There are no evaluation results at the prefectural scale due to the unavailable statistical data. The validation results indicate that the disaggregation for agricultural water uses generally has higher accuracy than that for industrial and domestic water uses (Figure 5b–d). Moreover, industrial water use estimation displays a more significant relative error, consistent with findings by Müller Schmied et al. (2021) [24]. The comparison at the provincial level shows a lower R2 value and a larger RRMSE than the basin level, indicating a more pronounced error in relatively smaller spatial regions.
The spatial distribution of TFWW and sectoral water use are shown in Figure 6. Gridded and provincial TFWW show higher water use in eastern China and coastal regions, which is consistent with the statistical data. The gridded data provide a detailed spatial distribution of TFWW (Figure 6a), with provincial capitals and developed cities showing higher water use than other regions. However, there is an overestimation of TFWW from disaggregation in some provinces in the Huaihe River Basin (Figure 6b). The provincial statistical TFWW (Figure 6c) shows that water use in these provinces is between 100 mm and 200 mm, while it is more than 200 mm from the disaggregation (Figure 6b). There is also some underestimation in the disaggregated TFWW in some provinces in northeastern China and southern China.
Agricultural water use accounts for more than 60% of the total water use in China, and its spatial pattern is similar to that of total water use (Figure 6d–f), meaning that an accurate estimation of agricultural water use is crucial for estimating China’s total water use. The Haihe and Huaihe River Basins, provincial capitals, and developed cities consume more freshwater withdrawals through industrial and domestic water use (Figure 6g–l). The overestimation of agricultural and industrial water uses in the Huaihe and Hai River Basins may be a reason for the overestimation of TFWW in these regions.
4.3. Evaluation of Spatial Disaggregation of WS
After obtaining the disaggregated TRWR and TFWW values at the basinal, provincial, and prefectural levels, water stress was calculated by Equation (5) and was evaluated using the WS values calculated by the statistical data at the corresponding scales. The disaggregated WS based on simulated naturalized runoff as a surrogate showed an average overall accuracy of 63.2% across all three validation scales (Figure 7a), and the averaged Kappa coefficient was 0.505 (Figure 7b), indicating moderate agreement with the results based on actual statistical values. No significant differences were observed between the validation scales and were slightly better at the provincial and prefectural scales than the basinal scale. The overall accuracy of the WS disaggregation using the RS-based surrogates (i.e., P, P−ET, and P−ET−dS) was about 58%, slightly better using P−ET and P−ET−dS compared to using P and about 5% lower than that using the simulated naturalized runoff. The accuracy of WS depends on the disaggregation accuracy of TRWR and TFWW. The use of different TRWR surrogates did not lead to significant differences in water stress evaluation due to the same disaggregated TFWW.
The spatial distribution of the disaggregated water stress over China was compared with that derived from statistical data at the basinal, provincial, and prefectural levels (Figure 8). Because the three RS-based surrogates (i.e., P, P−ET, and P−ET−dS) provided similar results for WS estimation, only the spatial distribution based on P−ET disaggregation is shown in Figure 8. Water stress in northern China’s river basins was generally higher than in southern China’s. WS disaggregation is underestimated in the Songhua River (SHR in northeastern China) and Pearl River Basins (PER in southern China). The two regions have a medium water stress level given the statistical data (Figure 8a), but the disaggregated result shows a low water stress level (Figure 8d,g). At the provincial level, the spatial distribution of WS was higher in the northern and eastern provinces compared with the southern and western regions (Figure 8b,e,h), which is consistent with previous research and reflects the status of water resources and water use in China [36,37]. However, the RS-based surrogates underestimated WS in some provinces in northern China, such as Inner Mongolia, Liaoning, Jilin, and Heilongjiang in northeastern China, which is related to the overestimation of TRWR in these regions. On the other hand, the overestimation of WS from simulated data in Inner Mongolia can be attributed to the underestimation of TRWR.
Prefectural data for TRWR and TFWW were only available for four provinces. However, the spatial distribution of water stress based on disaggregation compared well with the statistical results for these provinces (Figure 8c,f,i). Water stress was higher in the east of Sichuan and Hubei Provinces than in the west and higher in the north of Zhejiang and Gansu Provinces than in the south. High water stress regions in Sichuan, Hubei, and Zhejiang Provinces were mainly related to economic development. The insufficient water resources in the arid climate also led to high water stress, such as in northern Gansu. The comparison between Figure 8c,f,i indicates that the disaggregation method developed in this study can help estimate water stress in those areas where statistical data are not available.
4.4. Consistency of Temporal Evolution of Disaggregated Variables
The temporal evolution from 2002 to 2019 in disaggregated TRWR, TFWW, and WS at yearly scales was evaluated for each river basin, province, and prefecture. Figure 9 shows the histogram of the R2. Most of the R2 values are greater than 0.6 for the temporal consistency of TRWR (Figure 9a). Consistent with the results in Section 4.1 and Section 4.2, the disaggregation of TFWW is not better than TRWR, with most R2 values being less than 0.2 for TFWW (Figure 9b). Although WS is jointly determined by TRWR and TFWW, the temporal evolution of WS is more consistent than TFWW, with most R2 values greater than 0.5. In addition, the temporal evolution of disaggregated variables in the Haihe River Basin with the most severe water stress and the Southwest Rivers Basin with no water stress is shown in Figure 10. The results for the two provinces of Zhejiang and Gansu, respectively located in the east and west of China, are also shown in Figure 10. The disaggregated TRWR can generally follow the changes in statistical values, although there are some overestimations or underestimations. Although disaggregated TFWW is not perfect, the disaggregated WS can show consistent temporal evolution perfectly. These results also show the feasibility of the disaggregation method developed in this study.
5. Discussion
5.1. Improvement by Using Sub-National Statistical Data for Disaggregation
The accuracy of the disaggregation of TRWR and TFWW can be expected to improve when statistical data at finer administrative levels (e.g., provincial or even prefectural) smaller than a national scale are available. As shown in Figure 11, disaggregation using basinal and provincial statistical TRWR improved the accuracy of TRWR estimates at sub-national scales (Figure 11a,b), which is more significant when using provincial statistical data. The improvement was more significant for the results based on remote sensing surrogates than the simulated data, with a 32% decrease in RRMSE (from 61.5% to 29.3%). The WaterGap model can accurately simulate the TRWR, leading to a limited improvement with access to statistical data at finer administrative scales. The TFWW estimation is significantly improved by incorporating statistical data at the provincial and basinal scales (Figure 11c). Specifically, RRMSE is reduced by 54% (from 73.6% to 19.2%) when provincial statistical data are used to disaggregate TFWW. The improvement in the WS estimate was observed when using the improved TRWR and TFWW (Figure 11d). Notably, the results based on a remotely sensed P−ET surrogate showed a more significant improvement in the WS estimate than that based on the simulated data. The overall accuracy was improved by 9.1% and 17.3% when using basinal and provincial statistical data, respectively. These results highlighted the potential of statistical data at a finer scale to improve the accuracy of TRWR and TFWW disaggregation and further WS disaggregation.
5.2. Impact of Water Stress Level Classification on Disaggregation Accuracy
Water stress is a continuous variable that has been divided into five classes to represent different severe levels of water stress in UN SDG indicator 6.4.2, with an interval of 25% between each class (Table 1). Such a large interval can lead to misclassification even if the continuous values of WS between the estimated WS and the reference WS from the statistical data are not very different, especially because those WS values that are close to the classification thresholds can easily be misclassified into different categories. For instance, if the estimated WS value differs from the reference WS value by only 2%, a reference WS value of 74% can be classified as ‘medium’ class (WS between 50 and 75%), while an estimated WS value of 76% is classified as ‘high’ (WS between 75 and 100%), which is one level higher. For the validation at all three scales (i.e., basinal, provincial, and prefectural), a total of 28% of the results were misclassified into the adjacent classes (either lower or higher). Considering the overall accuracy of 63.2% using the simulated data for disaggregation, as shown in Section 4.3, the disaggregation accuracy increased to 91% after reclassifying the misclassification of water stress levels caused by the thresholds of water stress levels. The results using RS-based surrogates also improved significantly, with an accuracy of approximately 87%. We also calculated the root mean square error between the estimated continuous values of water stress and reference values, which was 17.4%, lower than the 25% interval between classes. These results indicate that the disaggregation accuracy of water stress levels using the method developed in this study is reasonable and acceptable.
5.3. Determination of Environmental Flow Requirements
According to the definition of SDG indicator 6.4.2, environmental flow requirements are critical for water stress evaluation. The assessment of SDG indicator 6.4.2 and related analysis is significantly affected by the amount of water used to maintain environmental flows [26,38,39]. The environmental flow requirements vary based on flow regimes, seasons, and regional ecological conservation objectives [7,36]. Vanham et al. (2021, 2022) revealed that the number of individuals exposed to water stress varies globally and nationally, depending on the environmental flow requirements [38,39]. Nevertheless, the calculation of the EFR is subject to significant uncertainties due to different methods. The International Water Management Institute has proposed a global EFR estimation scheme: a percentage of the total flow, as adopted in the UN-Water’s SDG 6.4.2 report for global water stress assessment [10,40]. According to the UN-Water report, China’s water stress level is about 43%, classified as a low water stress level. However, China is facing severe water scarcity [41]. Based on the ratio of the available water resources in China’s major river basins, the water stress in China calculated in this study is about 71%, classified as a medium water stress level, which is a more reasonable result compared with the status of China’s water resources. Therefore, an accurate estimate of actual environmental flow requirements is critical to assessing water stress in a given country or region.
The environmental flow requirements in this study are determined by the water resource development and utilization ratio, i.e., r, introduced in Section 2.4, which considers not only the environmental flow required by the ecological function of rivers but also the exploitable and utilizable degree of water resources and the water quality requirement [30]. However, we used a constant ratio for each major river basin, which may not reflect the actual environmental flow requirements in sub-basins or catchments and may bring uncertainty in accessing water stress levels. Future studies should focus on improving the estimate of actual environmental flow requirements by incorporating the natural system and local ecological conservation goals.
5.4. Consideration of External Renewable Freshwater Resources
In Equation (1), TRWR is the sum of internal renewable freshwater resources generated by endogenous precipitation and external renewable freshwater resources allocated according to administrative agreements. In this study, the estimation of TRWR did not include external renewable freshwater resources. Ignoring external renewable freshwater resources can lead to an overestimation of water stress levels. Inter-basin water transfer infrastructure can alleviate water scarcity in regions with limited freshwater resources by changing the spatial and temporal distribution of available water resources [42,43,44,45]. For example, China’s South-to-North Water Diversion Project has reduced water stress in the Beijing–Tianjin–Hebei region and stabilized the groundwater levels of this region [46]. The lack of water transfer information may lead to an overestimation of water stress in destination areas and an underestimation in source areas [47]. Reservoir storage can also affect water stress in different seasons [48]. Consequently, water stress assessment that considers external water resources remains a challenge. However, since internal water resources support 80% of global water consumption [49], it is generally reasonable to assess water stress levels based only on internal renewable freshwater resources. In addition, it is not easy to allocate external freshwater resources accurately. Meanwhile, it is difficult to reach consistent agreements between countries or administrative units with shared rivers [50].
5.5. Uncertainties from Surrogate Variables
This study used RS-based P, P−ET, and P−ET−dS, and model-simulated naturalized runoff and potential withdrawal water uses were used as the surrogate variables for disaggregating national statistical TRWR and TFWW. Although these surrogate variables have a similar connotation to the disaggregated variables, there are still some differences, which may cause uncertainties in the disaggregation results, as shown in Figure 3 and Figure 5. The disaggregated TRWR using WaterGap-simulated runoff as a surrogate tends to overestimate high values of TRWR (Figure 3a). Conversely, these high TRWR values were underestimated when using RS-based surrogates for disaggregation (Figure 3b–d). Especially at the prefectural level, TRWR was underestimated by 8% to 15%. In addition, uncertainties in remote sensing data also contribute to errors in disaggregation because there are still enormous challenges in retrieving and estimating precipitation, evapotranspiration, and terrestrial water storage changes from satellites [33,51,52]. The disaggregation of TFWW (Figure 5) shows inferior performance compared with TRWR disaggregation (Figure 3) in this study, which can be attributed to the complexity of TFWW estimation and the uncertainties resulting from the WaterGap simulation.
6. Conclusions
Information on spatial and temporal changes in water stress is critical for water resource management and policy-making. The assessment of SDG indicator 6.4.2. is limited at the national scale due to a lack of data at sub-national scales. This study addressed the issue of assessing this water stress indicator in a sub-region of a country. A disaggregation method was proposed to downscale the two key variables (i.e., TRWR and TFWW) for water stress calculation from a national to sub-national scale by combining remotely sensed and model-simulated data. Four variables, i.e., RS-based P, P−ET, and P−ET−dS and model-simulated naturalized runoff, were, respectively, taken as the spatial and temporal surrogates to disaggregate the national statistical TRWR. The model-simulated potential withdrawal water uses were taken as the surrogate to disaggregate national statistical TFWW. The resulting gridded TRWR and TFWW enabled the calculation of water stress at sub-national levels. The disaggregated TRWR, TFWW, and water stress were validated in major river basins, provinces, and prefectures in China. The disaggregation for TRWR generally outperformed that for TFWW. The average overall accuracy of the disaggregated water stress at the three sub-national levels was 63.2%, with a Kappa coefficient of 0.505, when using WaterGap-simulated runoff as a surrogate. After reclassifying the misclassification of water stress levels caused by the thresholds of water stress levels, the disaggregation accuracy increased to 91%. The RS-based P-ET and P-ET-dS performed similarly for water stress disaggregation, only about 5% lower than the result of using the simulated naturalized runoff as the surrogate. The temporal evolution of disaggregated variables also showed good consistency with statistical time series data. The disaggregation accuracy was improved when the approach was applied to regional statistical data at the basinal and provincial levels.
This study demonstrated the potential of remote sensing data for assessing water stress at sub-national scales. The disaggregation of water stress involves the estimation of TRWR, TFWW, and the EFR at sub-national scales. This study mainly explored the potential of remote sensing data for TRWR rather than TFWW and the EFR. In future studies, more attention should be paid to improving the estimation of environmental flow requirements at finer spatial scales, the estimation of sectoral water uses at the grid scale, and the estimation of external renewable water resources, which are essential for better understanding the spatial and temporal distribution of water stress.
Author Contributions
Conceptualization and methodology, J.L. and L.J.; validation, investigation, data curation, and writing—original draft preparation, J.L.; writing—review, editing, visualization, and supervision, L.J.; project administration, L.J. and J.L.; funding acquisition, J.L. All authors have read and agreed to the published version of the manuscript.
Funding
This research was supported by the National Natural Science Foundation of China, grant number 42271394; the Open Research Program of the International Research Center of Big Data for Sustainable Development Goals, grant number CBAS2023OPR05; and the Strategic Priority Research Program of the Chinese Academy of Sciences, grant numbers XDA19030203 and XDA19090120.
Data Availability Statement
The gridded data will be made available upon request.
Conflicts of Interest
The authors declare no conflicts of interest.
References
- UNESCO (United Nations Educational, Scientific, and Cultural Organization). UN World Water Development Report 2021: Valuing Water. 2021. Available online: https://www.unwater.org/publications/un-world-water-development-report-2021 (accessed on 29 April 2024).
- WMO (World Meteorological Organisation). State of Global Water Resources 2021; WMO: Geneva, Switzerland, 2022; Volume 1308, ISBN 978-92-63-11308-5. [Google Scholar]
- UN (United Nations). Transforming Our World: The 2030 Agenda for Sustainable Development. Resolution adopted by the General Assembly on 25 September 2015. Available online: https://digitallibrary.un.org/record/3923923?v=pdf (accessed on 29 April 2024).
- Dolan, F.; Lamontagne, J.; Link, R.; Hejazi, M.; Reed, P.; Edmonds, J. Evaluating the economic impact of water scarcity in a changing world. Nat. Commun. 2021, 12, 1915. [Google Scholar] [CrossRef] [PubMed]
- UN-Water. Summary Progress Update 2021: SDG 6—Water and Sanitation for All. 2021. Available online: https://www.unwater.org/publications/summary-progress-update-2021-sdg-6-water-and-sanitation-all (accessed on 29 April 2024).
- Liu, J.; Liu, Q.; Yang, H. Assessing water scarcity by simultaneously considering environmental flow requirements, water quantity, and water quality. Ecol. Indic. 2016, 60, 434–441. [Google Scholar] [CrossRef]
- Liu, J.; Yang, H.; Gosling, S.N.; Kummu, M.; Florke, M.; Pfister, S.; Hanasaki, N. Water scarcity assessments in the past, present and future. Earth’s Future 2017, 5, 545–559. [Google Scholar] [CrossRef] [PubMed]
- Rodell, M.; Famiglietti, J.S.; Wiese, D.N.; Reager, J.T.; Beaudoing, H.K.; Landerer, F.W.; Lo, M.H. Emerging Trends in Global Freshwater Availability. Nature 2018, 557, 651–659. [Google Scholar] [CrossRef] [PubMed]
- FAO (Food and Agriculture Organization of the United Nations). Progress on level of water stress—Global baseline for SDG 6 Indicator 6.4.2. 2018. Available online: https://www.unwater.org/publications/progress-level-water-stress-global-baseline-sdg-indicator-642 (accessed on 29 April 2024).
- UN-Water. Progress on Level of Water Stress—Global Status and Acceleration Needs for SDG Indicator 6.4.2. 2021. Available online: https://www.unwater.org/publications/progress-level-water-stress-2021-update (accessed on 29 April 2024).
- Biancalani, R.; Michela, M. Assessing SDG indicator 6.4.2 ‘level of water stress’ at major basins level. UCL Open Environ. 2021, 3, e026. [Google Scholar] [CrossRef] [PubMed]
- Mekonnen, M.M.; Hoekstra, A.Y. Four billion people facing severe water scarcity. Sustainability 2016, 2, e1500323. [Google Scholar] [CrossRef] [PubMed]
- Vanham, D.; Hoekstra, A.Y.; Wada, Y.; Bouraoui, F.; de Roo, A.; Mekonnen, M.M.; van de Bund, W.J.; Batelaa, O.; Pavelic, P.; Bastiaanssen, W. Physical water scarcity metrics for monitoring progress towards SDG target 6.4: An evaluation of indicator 6.4.2 Level of water stress. Sci. Total Environ. 2018, 613–614, 218–232. [Google Scholar] [CrossRef] [PubMed]
- Fehri, R.; Khlifi, S.; Vanclooster, M. Disaggregating SDG-6 water stress indicator at different spatial and temporal scales in Tunisia. Sci. Total Environ. 2019, 694, 133766. [Google Scholar] [CrossRef] [PubMed]
- Liu, X.; Tang, Q.; Cui, H.; Mu, M.; Gerten, D.; Gosling, S.N.; Masaki, Y.; Satoh, Y.; Wada, Y. Multimodel uncertainty changes in simulated river flows induced by human impact parameterizations. Environ. Res. Lett. 2017, 12, 025009. [Google Scholar] [CrossRef]
- Schewe, J.; Heinke, J.; Gerten, D.; Haddeland, I.; Arnell, N.W.; Clark, D.B.; Dankers, R. Multimodel assessment of water scarcity under climate change. Proc. Natl. Acad. Sci. USA 2014, 111, 3245–3250. [Google Scholar] [CrossRef]
- Ndehedehe, C. Remote Sensing Hydrology. In Satellite Remote Sensing of Terrestrial Hydrology; Springer: Cham, Switzerland, 2022. [Google Scholar] [CrossRef]
- Piao, S.; Ciais, P.; Huang, Y.; Shen, Z.; Peng, S.; Li, J.; Zhou, L. The impacts of climate change on water resources and agriculture in China. Nature 2010, 467, 43–51. [Google Scholar] [CrossRef] [PubMed]
- Konapala, G.; Mishra, A.K.; Wada, Y.; Mann, M.E. Climate change will affect global water availability through compounding changes in seasonal precipitation and evaporation. Nat. Commun. 2020, 11, 3044. [Google Scholar] [CrossRef]
- Liu, W.; Lim, W.; Sun, F.; Mitchell, D.; Wang, H.; Chen, D.; Bethke, I.; Shiogama, H.; Fischer, E. Global Freshwater Availability Below Normal Conditions and Population Impact Under 1.5 and 2 °C Stabilization Scenarios. Geophys. Res. Lett. 2018, 45, 9803–9813. [Google Scholar] [CrossRef]
- Lu, J.; Jia, L.; Zheng, C.; Hu, G. Potential of remote sensing-based water budget for the estimation of regional water resources. Remote Sens. Technol. Appl. 2019, 34, 630–638. (In Chinese) [Google Scholar]
- Zhang, Y.; He, B.; Guo, L.; Liu, J.; Xie, X. The Relative Contributions of Precipitation, Evapotranspiration, and Runoff to Terrestrial Water Storage Changes across 168 River Basins. J. Hydrol. 2019, 579, 124194. [Google Scholar] [CrossRef]
- Bastiaanssen, W.G.M.; Karimi, P.; Rebelo, L.; Duan, Z.; Senay, G.; Muthuwatte, L.; Smakhti, V. Earth Observation Based Assessment of the Water Production and Water Consumption of Nile Basin Agro-Ecosystems. Remote Sens. 2014, 6, 10306–10334. [Google Scholar] [CrossRef]
- Müller Schmied, H.; Cáceres, D.; Eisner, S.; Flörke, M.; Herbert, C.; Niemann, C.; Peiris, T.A. The global water resources and use model WaterGAP v2.2d: Model description and evaluation. Geosci. Model Dev. 2021, 14, 1037–1079. [Google Scholar] [CrossRef]
- Wu, B.; Tian, F.; Zhang, M.; Piao, S.; Zeng, H.; Zhu, W.; Liu, J.; Elnashar, A.; Lu, Y. Quantifying Global Agricultural Water Appropriation with Data Derived from Earth Observations. J. Clean. Prod. 2022, 358, 131891. [Google Scholar] [CrossRef]
- Liu, X.; Liu, W.; Liu, L.; Tang, Q.; Liu, J.; Yang, H. Environmental flow requirements largely reshape global surface water scarcity assessment. Environ. Res. Lett. 2021, 16, 104029. [Google Scholar] [CrossRef]
- Pastor, A.V.; Ludwig, F.; Biemans, H.; Hoff, H.; Kabat, P. Accounting for Environmental Flow Requirements in Global Water Assessments. Hydrol. Earth Syst. Sci. 2014, 18, 5041–5059. [Google Scholar] [CrossRef]
- Tennant, D. Instream flow regimens for fish, wildlife, recreation, and related environmental resources. Fisheries 1976, 1, 6–10. [Google Scholar]
- Jia, S.; Liu, W. Tracing and thinking about 40% threshold value of water resources development and utilization ratio. Water Resour. Prot. 2021, 37, 87–89. (In Chinese) [Google Scholar] [CrossRef]
- Wang, J.S.; Zhong, H.; Geng, L.; Xu, P.; Liu, C. Available water resources in China. Adv. Water Sci. 2006, 17, 549–553. (In Chinese) [Google Scholar]
- Alberg, A.J.; Park, J.W.; Hager, B.W.; Brock, M.V.; Diener-West, M. The use of ‘overall accuracy’ to evaluate the validity of screening or diagnostic tests. J. Gen. Intern. Med. 2004, 19, 460–465. [Google Scholar] [CrossRef] [PubMed]
- Landis, J.R.; Koch, G.G. The measurement of observer agreement for categorical data. Biometrics 1977, 33, 159–174. [Google Scholar] [CrossRef] [PubMed]
- Zheng, C.; Jia, L.; Hu, G. Global Land Surface Evapotranspiration Monitoring by ETMonitor Model Driven by Multi-source Satellite Earth Observations. J. Hydrol. 2022, 613, 128444. [Google Scholar] [CrossRef]
- Müller Schmied, H.; Cáceres, D.; Eisner, S.; Flörke, M.; Herbert, C.; Niemann, C.; Peiris, T.A. The global water resources and use model WaterGAP v2.2d—Standard model output. PANGAEA. 2020. Available online: https://doi.org/10.1594/PANGAEA.918447 (accessed on 29 April 2024).
- Hu, B.; Wang, L.; Li, X.; Zhou, J.; Pan, Y. Divergent Changes in Terrestrial Water Storage across Global Arid and Humid Basins. Geophys. Res. Lett. 2021, 48, e2020GL091069. [Google Scholar] [CrossRef]
- Liu, X.; Tang, Q.; Liu, W.; Veldkamp, T.; Boulange, J.; Liu, J.; Wada, Y.; Huan, Z.; Yang, H. A Spatially Explicit Assessment of Growing Water Stress in China from the Past to the Future. Earth’s Future 2019, 7, 1027–1043. [Google Scholar] [CrossRef]
- Ma, T.; Sun, S.; Fu, G.; Hall, J.W.; Ni, Y.; He, L.; Yi, J.; Zhao, N. Pollution exacerbates China’s water scarcity and its regional inequality. Nat. Commun. 2020, 11, 650. [Google Scholar] [CrossRef]
- Vanham, D.; Alfieri, L.; Florke, M.; Grimaldi, S.; Lorini, V.; de Roo, A.; Feyen, L. The Number of People Exposed to Water Stress in Relation to How Much Water Is Reserved for the Environment: A Global Modelling Study. Lancet Planet. Health. 2021, 5, e766–e774. [Google Scholar]
- Vanham, D.; Alfieri, L.; Feyen, L. National Water Shortage for Low to High Environmental Flow Protection. Sci. Rep. 2022, 12, 3037. [Google Scholar] [CrossRef] [PubMed]
- FAO (Food and Agriculture Organization of the United Nations). Incorporating Environmental Flows into Water Stress Indicator 6.4.2—Guidelines for a Minimum Standard Method for Global Reporting. 2019. Available online: https://www.unwater.org/publications/incorporating-environmental-flows-water-stress-indicator-642 (accessed on 29 April 2024).
- Wang, J.Y.; Huang, J.; Li, Y.; Yan, T.; Sun, T. Growing water scarcity, food security and government responses in China. Glob. Food Sec. 2017, 14, 9–17. [Google Scholar] [CrossRef]
- Gohari, A.; Eslamian, S.; Mirchi, A.; Abedi-Koupaei, J.; Bavani, A.M.; Madani, K. Water transfer as a solution to water shortage: A fix that can backfire. J. Hydrol. 2013, 491, 23–39. [Google Scholar] [CrossRef]
- Rising, J.; Josset, L.; Troy, T.; Lall, U. The importance of infrastructure and national demand to represent constraints on water supply in the United States. Glob. Environ. Change 2022, 73, 102468. [Google Scholar] [CrossRef]
- Shumilova, O.; Tockner, K.; Thieme, M.; Koska, A.; Zarfl, C. Global water transfer megaprojects: A potential solution for the water-food-energy nexus? Front. Environ. Sci. 2018, 6, 11. [Google Scholar] [CrossRef]
- Sun, S.; Tang, Q.; Kona, M.; Fang, C.; Liu, H.; Li, X.; Fu, G. Water transfer infrastructure buffers water scarcity risks to supply chains. Water Res. 2022, 22, 119442. [Google Scholar] [CrossRef]
- Long, D.; Yang, W.; Scanlon, B.; Zhao, J.; Liu, D.; Burek, P.; Pan, Y.; You, L.; Wada, Y. South-to-North Water Diversion stabilizing Beijing’s groundwater levels. Nat. Commun. 2020, 11, 3665. [Google Scholar] [CrossRef] [PubMed]
- Yin, Y.; Wang, L.; Wang, Z.; Tang, Q.; Piao, S.; Chen, D.; Xia, J. Quantifying Water Scarcity in northern China within the context of Climatic and Societal Changes and South-to-North Water Diversion. Earth’s Future 2020, 8, e2020EF001492. [Google Scholar] [CrossRef]
- Xie, J.; You, J.; Ma, Z.; Deng, X.; Lin, P.; Gao, J. Methodology for Including Reservoir Regulation in Water Scarcity Evaluation. J. Clean. Prod. 2022, 365, 132657. [Google Scholar] [CrossRef]
- Du, Y.; Zhao, D.; Qiu, S.; Zhou, F.; Peng, J. How can virtual water trade reshape water stress pattern? A global evaluation based on the metacoupling perspective. Ecol. Indic. 2022, 145, 109712. [Google Scholar] [CrossRef]
- Bernauer, T.; Böhmelt, T. International conflict and cooperation over freshwater resources. Nat. Sustain. 2020, 3, 350–356. [Google Scholar] [CrossRef]
- Rajani, K.P.; Markonis, Y.; Godoy, M.R.V.; Villalba-Pradas, A.; Andreadis, K.M.; Nikolopoulos, E.I.; Papalexiou, S.M.; Rahim, A.; Tapiador, F.J.; Hanel, M. Review of GPM IMERG performance: A global perspective. Remote Sens. Environ. 2022, 268, 112754. [Google Scholar] [CrossRef]
- Scanlon, B.R.; Zhang, Z.; Save, H.; Wiese, D.N.; Landerer, F.W.; Long, D.; Longuevergne, L.; Chen, J. Global evaluation of new GRACE mascon products for hydrologic applications. Water Resour. Res. 2016, 52, 9412–9429. [Google Scholar] [CrossRef]
Figure 1.
The overall flow chart of this study.
Figure 2.
The spatial disaggregation process of water stress using the total renewable freshwater resources (TRWR) and total freshwater withdrawals (TFWW) (Y is the national statistical TRWR or TFWW data; is the disaggregated TRWR or TFWW in grid i; is the grid weight; yi′ is the value of a surrogate variable in grid i; EFR is the environmental flow requirement; WS is the water stress; 1–3 represent different sub-national regions).

Figure 3.
Comparisons of disaggregated TRWR by the four surrogates with statistical data: (a) simulated runoff, (b) RS P, (c) RS P−ET, and (d) RS P−ET−dS.
Figure 3.
Comparisons of disaggregated TRWR by the four surrogates with statistical data: (a) simulated runoff, (b) RS P, (c) RS P−ET, and (d) RS P−ET−dS.
Figure 4.
Spatial distribution of TRWR based on (a) statistical data; (b,c) WaterGap-simulated naturalized runoff; (d,e) RS-based P; (f,g) RS-based P−ET; (h,i) RS-based P−ET−dS. The left panels are the disaggregated TRWR values at the gridded level, and the right panels are the provincial TRWR values based on disaggregation. The top panel is the statistical TRWR at the provincial scale from the CWRB.
Figure 5.
Validation of the disaggregated (a) total water use and sectoral water use: (b) agricultural, (c) industrial, (d) domestic.
Figure 5.
Validation of the disaggregated (a) total water use and sectoral water use: (b) agricultural, (c) industrial, (d) domestic.
Figure 6.
Spatial distribution of (a–c) total, (d–f) agricultural, (g–i) industrial, and (j–l) domestic water use. The left panels are the disaggregated TFWW values at the gridded level, the middle panels are the provincial TFWW values based on gridded TFWW, and the right panels are the provincial statistical TFWW values from CWRB.
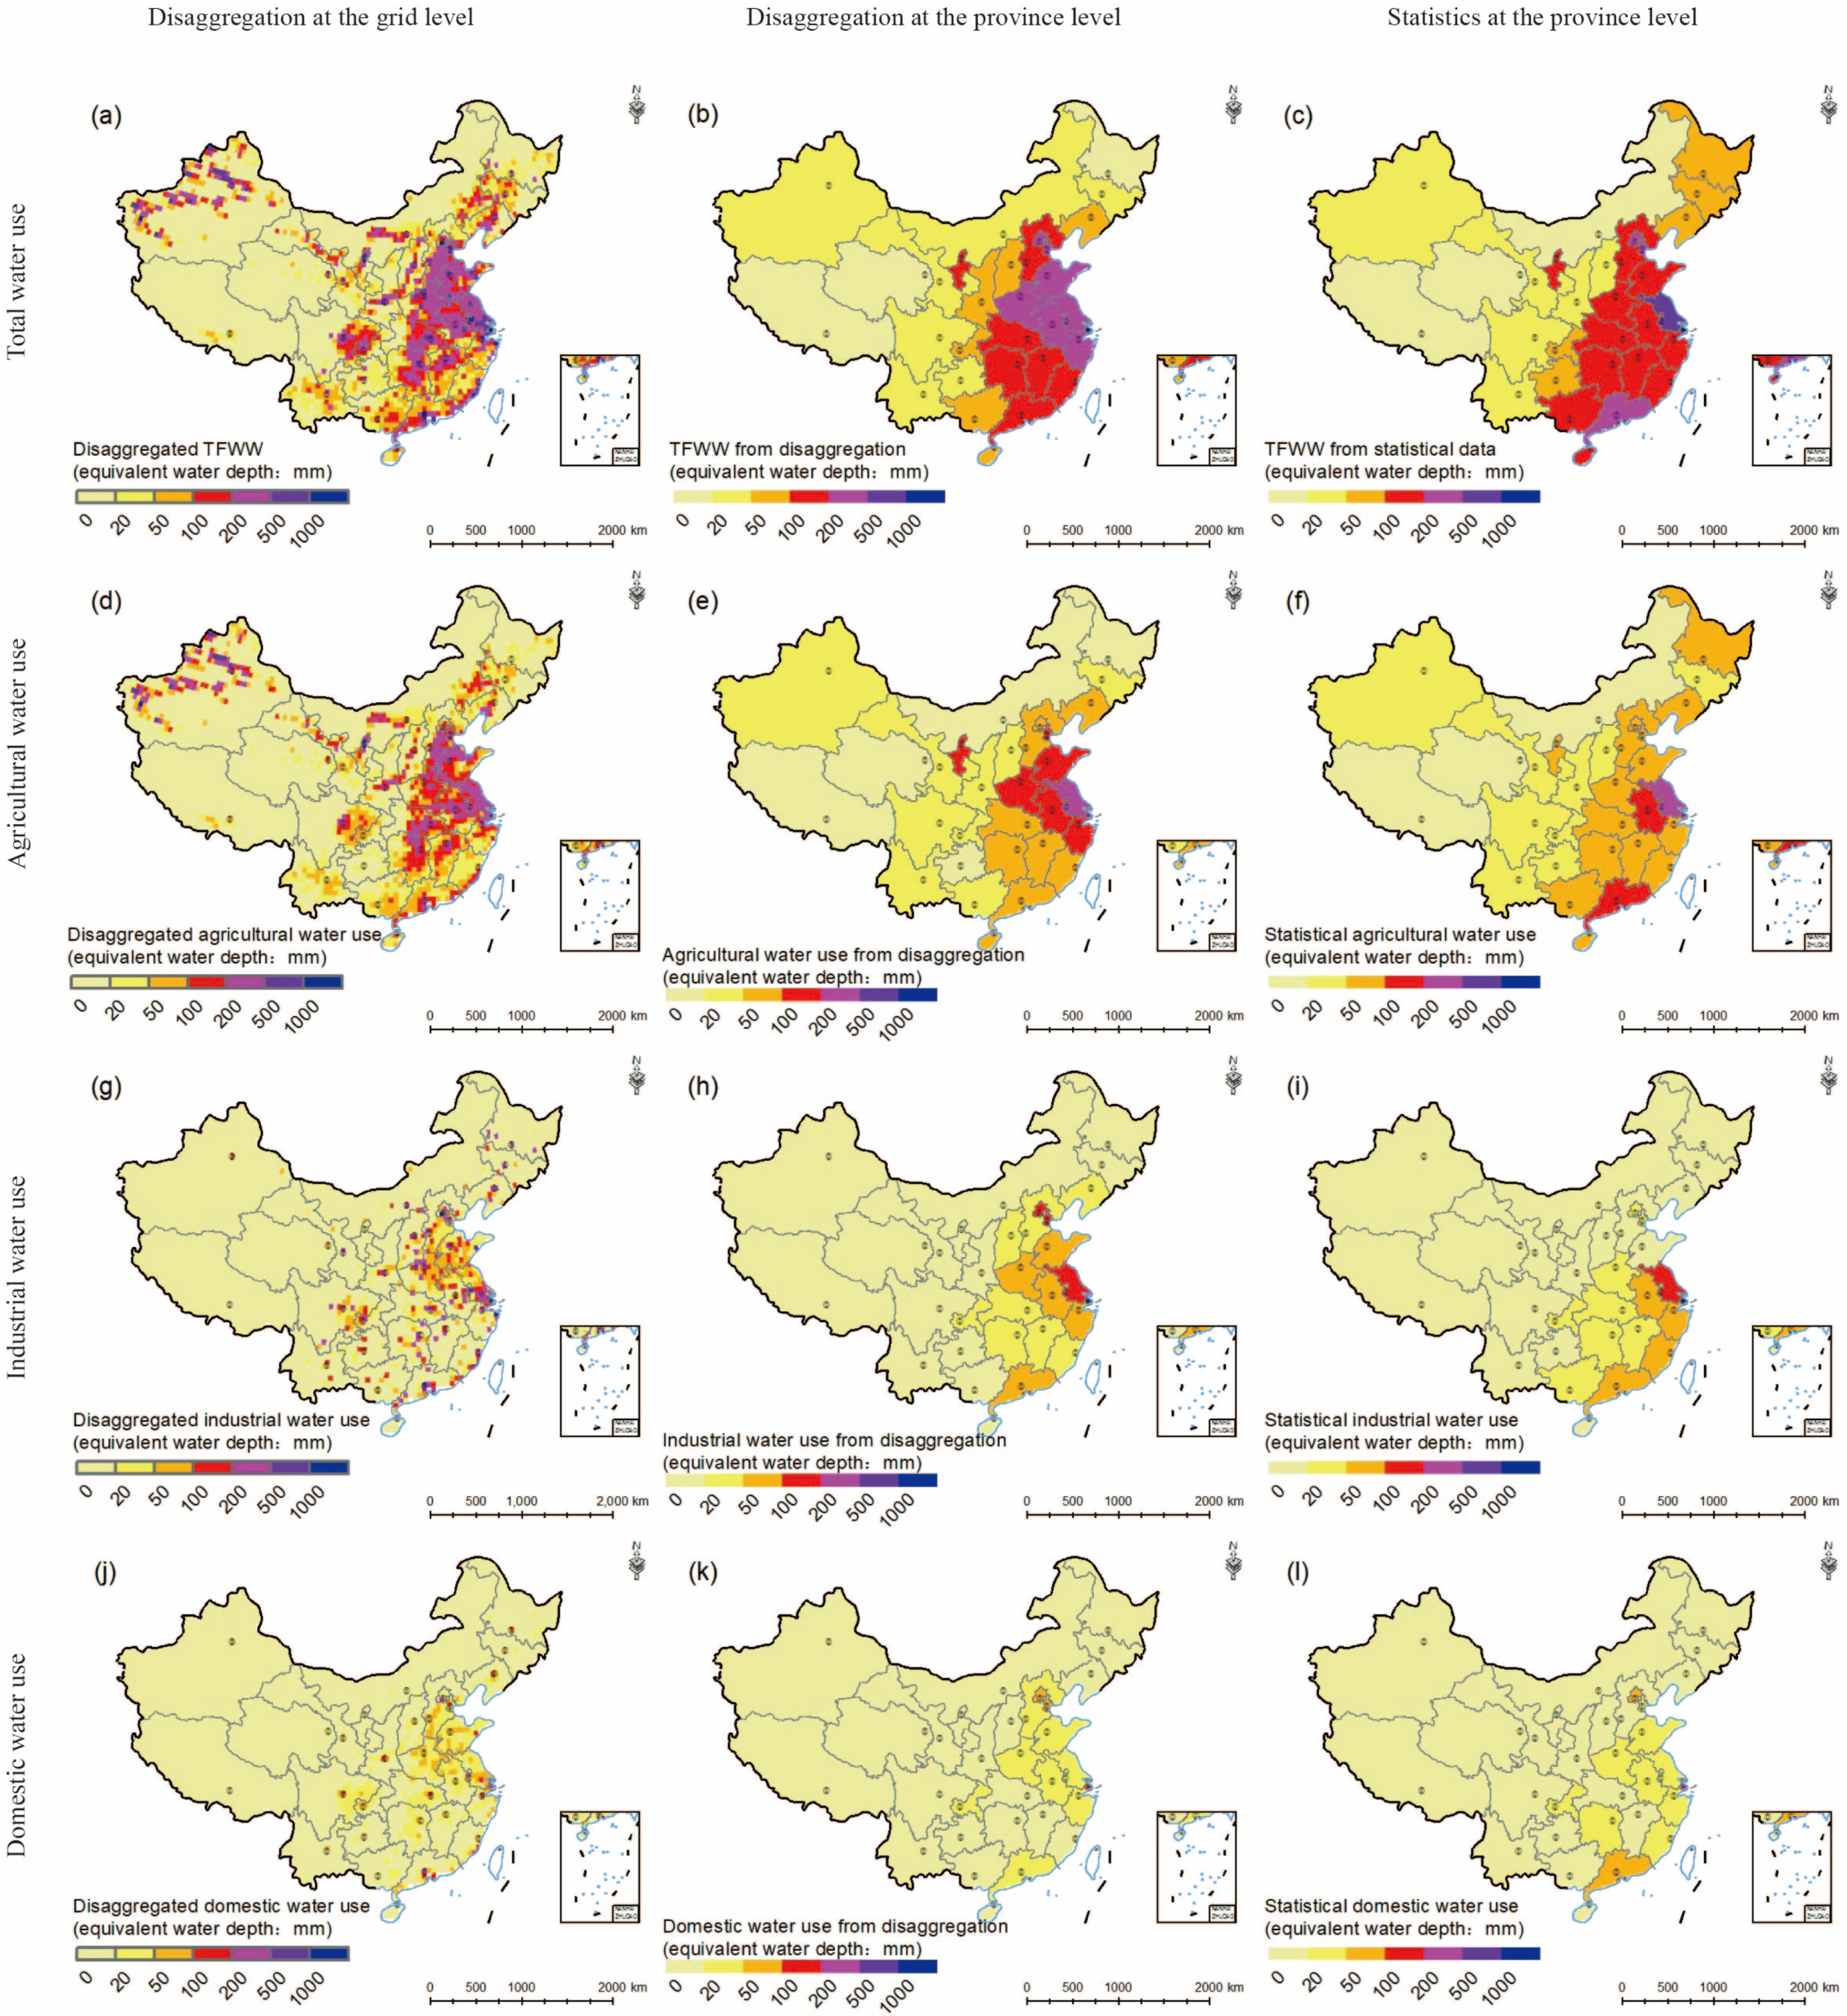
Figure 7.
(a) Overall accuracy and (b) Kappa coefficient for water stress disaggregation using different TRWR surrogates (simulated runoff and RS-based P, P−ET, and P−ET−dS).
Figure 7.
(a) Overall accuracy and (b) Kappa coefficient for water stress disaggregation using different TRWR surrogates (simulated runoff and RS-based P, P−ET, and P−ET−dS).

Figure 8.
The spatial distribution of water stress in China: (a–c) from statistical data; (d–f) based on the disaggregation by simulated runoff data; (g–i) based on disaggregation via RS-based P-ET as the surrogate. The left, middle, and right panels correspond to the basinal, provincial, and prefectural levels.

Figure 9.
Histogram of temporal consistency of disaggregated variables: (a) TRWR; (b) TFWW; (c) WS.
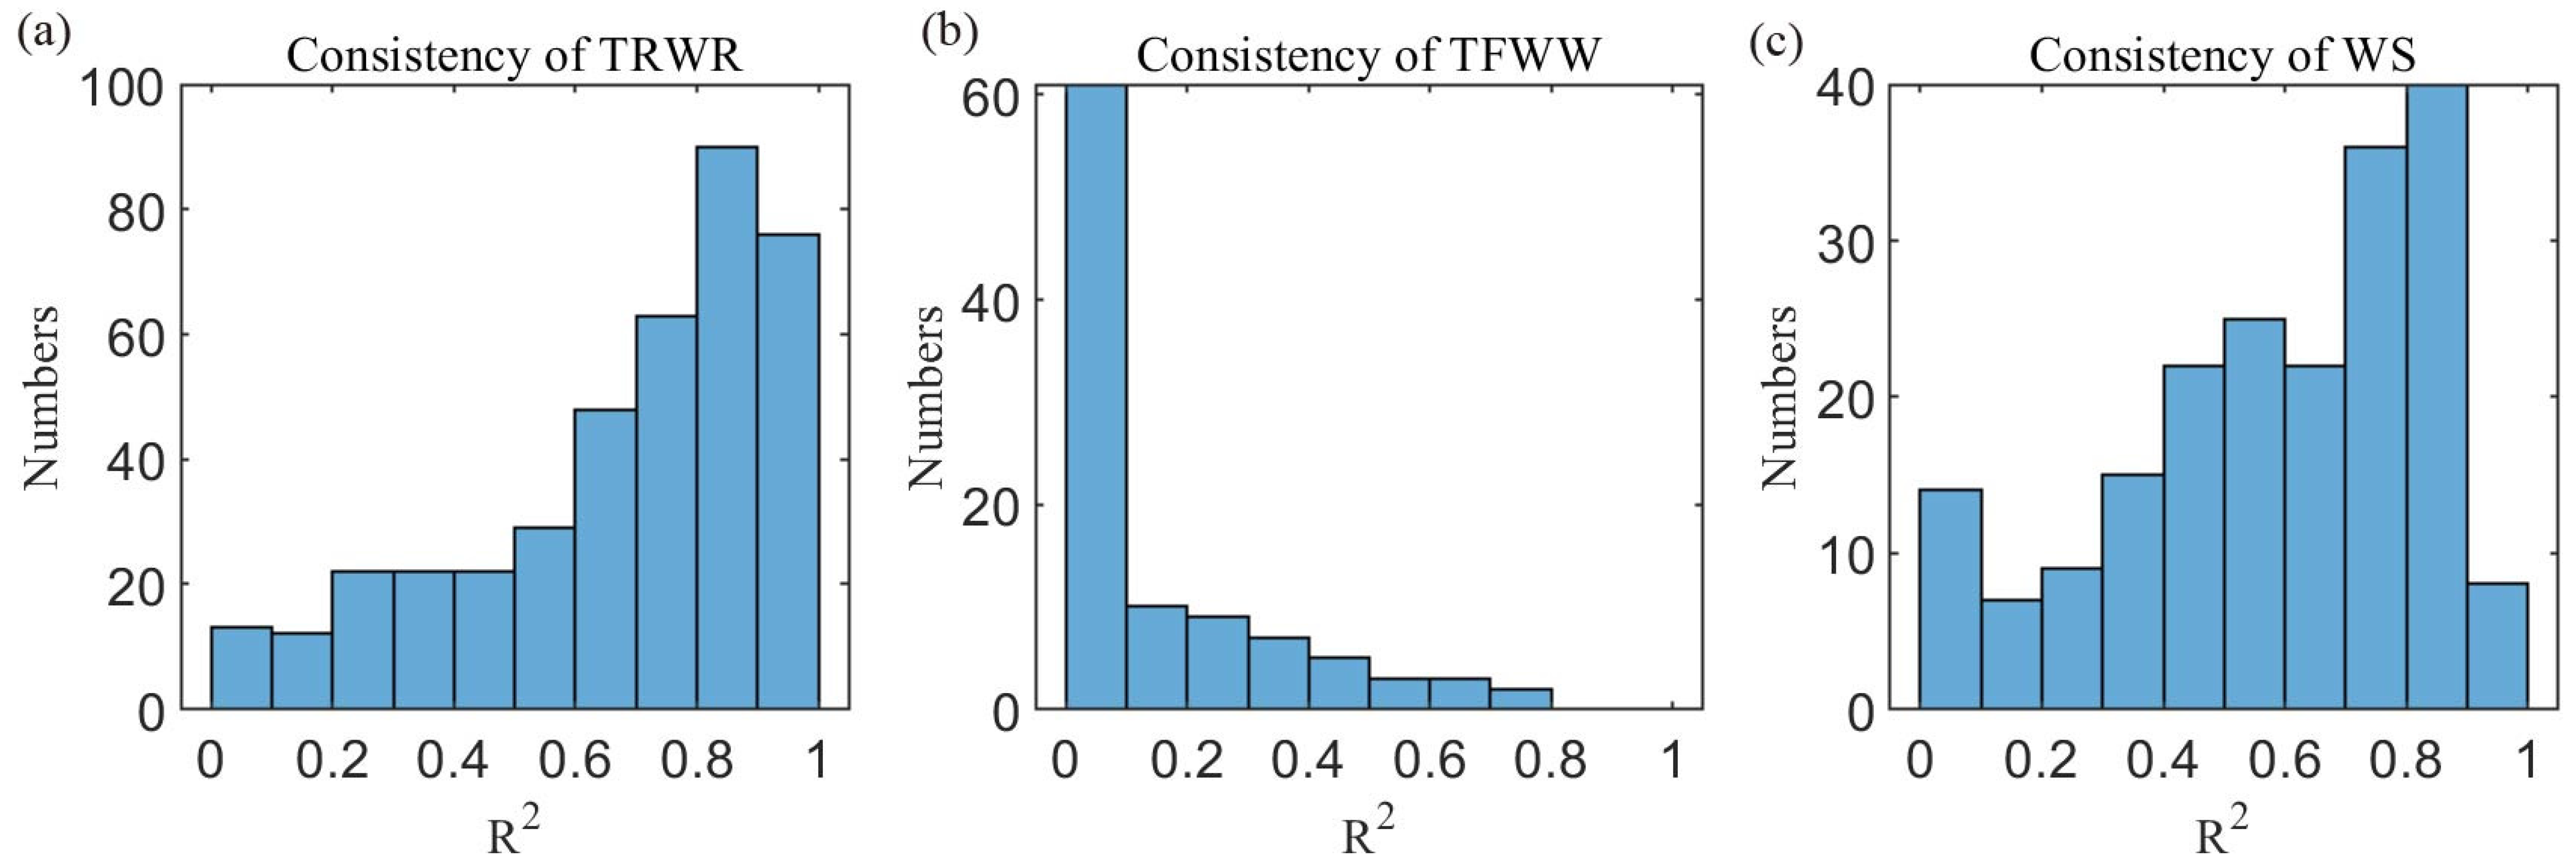
Figure 10.
Temporal evolution of disaggregated variables at the yearly scale: (a) Haihe River Basin; (b) Southwest Rivers Basin; (c) Zhejiang Province; (d) Gansu Province.
Figure 10.
Temporal evolution of disaggregated variables at the yearly scale: (a) Haihe River Basin; (b) Southwest Rivers Basin; (c) Zhejiang Province; (d) Gansu Province.

Figure 11.
Evaluation of TRWR, TFWW, and WS disaggregation at sub-national levels using different statistical data: (a) disaggregated TRWR by the simulated runoff, (b) disaggregated TRWR by RS P−ET, (c) disaggregated TFWW, and (d) disaggregated WS.
Figure 11.
Evaluation of TRWR, TFWW, and WS disaggregation at sub-national levels using different statistical data: (a) disaggregated TRWR by the simulated runoff, (b) disaggregated TRWR by RS P−ET, (c) disaggregated TFWW, and (d) disaggregated WS.

Table 1.
The criteria of water stress levels.
| Range of Water Stress | Water Stress Levels |
|---|---|
| (0, 25%] | No stress |
| (25%, 50%] | Low |
| (50%, 75%] | Medium |
| (75%, 100%] | High |
| >100% | Critical |
Table 2.
Summary of statistical data used in this study.
| Level | Regions/Spatial Scales | Source | Variables | Temporal Resolution |
|---|---|---|---|---|
| National | Whole country | China Water Resources Bulletin (CWRB) (www.mwr.gov.cn/sj/tjgb/szygb/, accessed on 29 April 2024) |
| Yearly |
| Provincial | 31 provincial administrative units, excluding Hong Kong, Macau, and Taiwan | |||
| Basinal | 10 first-level water resource regions:
| |||
| Prefectural | 60 prefectures from 4 provinces of Zhejiang (ZJ), Hubei (HB), Sichuan (SC), and Gansu (GS) | Local Water Resources Bulletin |
Table 3.
Summary of remote sensing data and model simulation data used in this study.
| Data Types | Variables | Spatial Resolution | Temporal Resolution | Sources |
|---|---|---|---|---|
| Remote sensing data | Precipitation | 0.1° | Monthly | GPM data https://gpm1.gesdisc.eosdis.nasa.gov/data/GPM_L3/GPM_3IMERGM.07 (accessed on 29 April 2024) |
| Evapotranspiration | 1 km | Daily | ETMonitor model output https://data.casearth.cn/thematic/GWRD_2023/272 (accessed on 29 April 2024) | |
| Terrestrial water storage change | 0.5° | Monthly | GRACE JPL Mascon products https://grace.jpl.nasa.gov/data/get-data/jpl_global_mascons (accessed on 29 April 2024) | |
| Model simulation data | Naturalized runoff; potential withdrawal water uses for irrigation, livestock, household, manufacturing, and thermal power cooling. | 0.5° | Monthly | WaterGAP 2.2d model output https://doi.org/10.1594/PANGAEA.918447 (accessed on 29 April 2024) |
Disclaimer/Publisher’s Note: The statements, opinions and data contained in all publications are solely those of the individual author(s) and contributor(s) and not of MDPI and/or the editor(s). MDPI and/or the editor(s) disclaim responsibility for any injury to people or property resulting from any ideas, methods, instructions or products referred to in the content. |
© 2024 by the authors. Licensee MDPI, Basel, Switzerland. This article is an open access article distributed under the terms and conditions of the Creative Commons Attribution (CC BY) license (https://creativecommons.org/licenses/by/4.0/).
Share and Cite
MDPI and ACS Style
Lu, J.; Jia, L. Disaggregating National Statistical Data to Assess the Sub-National SDG 6.4.2 Water Stress Indicator by Integrating Satellite Observations and Model Data. Remote Sens. 2024, 16, 1654. https://doi.org/10.3390/rs16101654
AMA Style
Lu J, Jia L. Disaggregating National Statistical Data to Assess the Sub-National SDG 6.4.2 Water Stress Indicator by Integrating Satellite Observations and Model Data. Remote Sensing. 2024; 16(10):1654. https://doi.org/10.3390/rs16101654
Chicago/Turabian StyleLu, Jing, and Li Jia. 2024. "Disaggregating National Statistical Data to Assess the Sub-National SDG 6.4.2 Water Stress Indicator by Integrating Satellite Observations and Model Data" Remote Sensing 16, no. 10: 1654. https://doi.org/10.3390/rs16101654
Note that from the first issue of 2016, this journal uses article numbers instead of page numbers. See further details here.