Article

Enhancing LiDAR-UAS Derived Digital Terrain Models with Hierarchic Robust and Volume-Based Filtering Approaches for Precision Topographic Mapping

by
Valeria-Ersilia Oniga
1,
Ana-Maria Loghin
2,*,
Mihaela Macovei
1,
Anca-Alina Lazar
1,
Bogdan Boroianu
3 and
Paul Sestras
4,5
1
Department of Terrestrial Measurements and Cadastre, Faculty of Hydrotechnical Engineering, Geodesy and Environmental Engineering, “Gheorghe Asachi” Technical University of Iasi, Professor Dimitrie Mangeron Boulevard 67, 700050 Iași, Romania
2
Department of Remote Sensing, Federal Office of Metrology and Surveying, Schiffamtsgasse 1-3, 1020 Vienna, Austria
3
Geocad Profesional SRL (Smart Imaging and Mapping Services-SIMS), 022683 București, Romania
4
Department of Land Measurements and Cadastre, Faculty of Civil Engineering, Technical University of Cluj-Napoca, 400020 Cluj-Napoca, Romania
5
Academy of Romanian Scientists, Ilfov 3, 050044 Bucharest, Romania
*
Author to whom correspondence should be addressed.
Remote Sens. 2024, 16(1), 78; https://doi.org/10.3390/rs16010078
Submission received: 3 November 2023 / Revised: 16 December 2023 / Accepted: 18 December 2023 / Published: 24 December 2023
(This article belongs to the Special Issue Accuracy Assessment of UAS Lidar)

Abstract

:
Airborne Laser Scanning (ALS) point cloud classification in ground and non-ground points can be accurately performed using various algorithms, which rely on a range of information, including signal analysis, intensity, amplitude, echo width, and return number, often focusing on the last return. With its high point density and the vast majority of points (approximately 99%) measured with the first return, filtering LiDAR-UAS data proves to be a more challenging task when compared to ALS point clouds. Various algorithms have been proposed in the scientific literature to differentiate ground points from non-ground points. Each of these algorithms has advantages and disadvantages, depending on the specific terrain characteristics. The aim of this research is to obtain an enhanced Digital Terrain Model (DTM) based on LiDAR-UAS data and to qualitatively and quantitatively compare three filtering approaches, i.e., hierarchical robust, volume-based, and cloth simulation, on a complex terrain study area. For this purpose, two flights over a residential area of about 7.2 ha were taken at 60 m and 100 m, with a DJI Matrice 300 RTK UAS, equipped with a Geosun GS-130X LiDAR sensor. The vertical and horizontal accuracy of the LiDAR-UAS point cloud, obtained via PPK trajectory processing, was tested using Check Points (ChPs) and manually extracted features. A combined approach for ground point classification is proposed, using the results from a hierarchic robust filter and applying an 80% slope condition for the volume-based filtering result. The proposed method has the advantage of representing with accuracy man-made structures and sudden slope changes, improving the overall accuracy of the DTMs by 40% with respect to the hierarchical robust filtering algorithm in the case of a 60 m flight height and by 28% in the case of a 100 m flight height when validated against 985 ChPs.

Graphical Abstract

1. Introduction

Airborne Laser Scanning (ALS), also known as airborne Light Detection and Ranging (LiDAR), and LiDAR-Unmanned Aerial System (LiDAR-UAS) are two different methods for collecting LiDAR data. LiDAR, an active remote sensing technology, has found applications in various fields, including topography [1], hydrography [2], archaeology [3,4], oil exploration [5], mining [6], and forestry [7,8], and has been in use for more than a decade. One of the advantages of LiDAR technology compared to aerial photogrammetry or high-resolution optical satellite data is the acquisition of high-precision three-dimensional (3D) data using the polar coordinate method (angles and inclined distances) to capture a terrain’s geometry. Moreover, Full-waveform (FWF) ALS systems have been operational for two decades. In addition to waveform digitization, these systems offer supplementary information, including echo width. When combined with amplitude data, this additional information can enhance ground filtering even in areas with dense canopy cover [7]. However, the Structure from Motion (SfM) photogrammetric technique reconstructs three-dimensional information from two-dimensional images, showing promising results for DTM derivation, with the main advantages being RGB color information and, especially, its cost-effectiveness.
Both ALS and LiDAR-UAS play crucial roles in collecting high-resolution and accurate elevation data for various applications. While both methods rely on LiDAR principles, they differ in terms of data acquisition platforms, applications, characteristics, point densities, and scale coverages. Compared with the widespread and well-established method of ALS, typically used for mapping large territories, the LiDAR-UAS technique can be seen as a desirable solution for performing topographic surveys for small- to medium-sized areas, up to a few square kilometers. The choice between ALS and LiDAR-UAS often depends on the specific requirements of a project, considering factors such as area extent, resolution, and environmental conditions. Due to its advantages, such as suitability for small-scale projects, flexibility in capturing data in hard-to-reach areas, cost-effectiveness, and the capability to achieve very high point density and resolution, LiDAR-UASs often present a superior solution for small-scale projects when compared to traditional airborne LiDAR or photogrammetry methods.
LiDAR-UASs consist of LiDAR sensors and UAVs equipped with Global Navigation Satellite Systems (GNSSs) that determine the position of the UAS and Inertial Navigation System (INS) using an Inertial Measurement Unit (IMU) that measures the rotation angles of the UAS with respect to its navigation coordinate system (roll, pitch, and yaw) and acceleration. Alternatively, LiDAR-UASs can be equipped with an RGB digital camera to obtain a textured LiDAR-UAS point cloud [9]. The LiDAR sensor emits laser pulses toward the ground, and the distance between the sensor (emitter) and the measured object that generates the backscatter echo is calculated based on the time it takes for the laser pulse to return to the sensor. Multiple returns, with the first return typically being the reflection from the topmost object (e.g., tree canopy) and the last return being the reflection from the ground, are recorded [10].
There are several manufacturers available on the market, such as Velodyne LiDAR Inc. (San Jose, CA, USA), Routescene Inc. (Edinburgh, UK), LeddarTech Inc. (Quebec City, QC, Canada), RIEGL Laser Measurement System GmbH (Horn, Austria), and Geodetics Inc. (San Diego, CA, USA), that have developed small and fully integrated LiDAR sensors for UAVs, with the various types offering different capabilities and specifications [11].
Modeling topographic surfaces is a very important stage in a wide range of applications, namely: hydrographic studies, engineering projects, telecommunications, geology, geomorphology, and more. A Digital Terrain Model (DTM) represents the bare earth terrain with uniformly spaced Z-values in X (Easting) and Y (Northing) directions, excluding vegetation and artificial objects. DTMs often include not only the elevations of prominent topographic features on the ground but also mass points and breaklines that are unevenly distributed. This uneven distribution is intentional and designed to more accurately represent the actual contour and shape of the bare earth surface [12].
An essential step in data pre-processing for terrain modeling is classifying LiDAR-UAS point clouds into ground and non-ground points. This classification process involves distinguishing points that represent the ground surface from those that represent non-ground objects such as buildings and vegetation. Once the ground points are accurately classified, the creation of the DTM becomes a straightforward process [13]. Often, a combination of automated and manual methods is used to classify LiDAR point clouds effectively. Automated methods provide initial classifications, which can then be reviewed and corrected manually where necessary. The effectiveness of point cloud classification into ground and non-ground points can be influenced by factors such as point cloud density [14], terrain complexity [15], and the quality of LiDAR-UAS data. Therefore, it is important to select the classification method that best suits the specific characteristics of the study area. As LiDAR-UASs are subject to technological advancements and LiDAR data become more readily accessible, research on LiDAR-UAS-based DTM generation is gaining greater attention [16].
Different ground filtering algorithms have been developed over the past 30 years [17]. Depending on the concept used, the existing methods for point cloud filtering are classified into six categories [16] as follows:
Morphological-based filters: These algorithms use a structural parameter that describes the height differences within a threshold based on the horizontal distances used. The smaller the distance between a point and its neighbor, the smaller the height difference between them. A variant of this method is described in [15], in which the structural parameter depends on the terrain’s shape. Morphology-based filtering may be challenging in terrains with a variety of non-ground objects [16].
Surface-based filters: These algorithms work iteratively. In the first iteration, the lowest point for each grid cell is used to create an initial surface. Subsequently, residuals, which represent the distances between the measured points and the initial surface, are calculated. Each point is assigned a weight based on its residual value. Points with higher weights have a stronger influence on the surface, attracting the surface toward them, while points with lower weights have a lesser impact on the overall configuration of the surface. This iterative process continues until a stable surface is achieved, or the maximum allowable number of iterations is reached [18,19,20]. This type of method can present challenges in preserving terrain details, such as sharp ridges and cliffs. Additionally, it may have a tendency to misclassify small non-ground objects within the point cloud data [16].
Triangulated irregular network (TIN)-based refinement: An initial TIN is created based on the points with the lowest elevation in each grid cell. Gradually, other points are added by establishing reference thresholds [21]. This approach may encounter challenges when it comes to detecting discontinuous terrains, such as sharp ridges, and is time-consuming [16].
Segmentation and classification: These methods work with segments, which are classified based on height differences in their neighborhoods. In [22], a region growing technique of creating a surface was applied, based on height differences, to obtain segments that were subsequently classified into three categories: ground, buildings, and vegetation. In [23], segmentation compactness and height differences were applied to determine various types of areas, including the ground. Features such as geometry, radiometry, topology, the number of returns, intensity, and echo characteristics are used for better filtering ground points. These methods may encounter difficulties when applied to densely vegetated areas and strongly depend on the accuracy of segmentation [16].
Statistical analysis: These filters, particularly parameter-free algorithms, help minimize the need for manual parameter tuning, thus reducing uncertainty and enhancing the robustness of applying specific methods to different study sites. Additionally, these methods tend to excel in relatively flat terrains without intricate non-ground objects [16].
Multi-scale comparison: In general, this type of method operates through two main steps. First, several preliminary trend surfaces are created at different resolutions; second, each point in the point cloud is examined at various scales by comparing the elevation difference between the point and the different trend surfaces. This method is better suited for relatively flat terrains and may exhibit suboptimal performance in rapidly changing or complex landscapes [16].
Filtering high-density point clouds is more challenging than filtering low-density ones because as point density increases, the performance of the filtering algorithm tends to decrease [24].
In the existing literature, most studies have primarily focused on DTMs derived from ALS point clouds. In contrast, a limited number of studies have examined the accuracy of DTMs generated from LiDAR-UAS point clouds. For example, in [25], the vertical error of a DTM, created based on a LiDAR-UAS point cloud acquired with a Velodyne laser sensor VLP-16 at a 50 m height with a density of 180 points/sqm, was evaluated for uncovered and vegetation areas, separately, using 193 checkpoints measured via GNSS-RTK technology. The RMSEZ values ranged between 10 and 14 cm for the different vegetation height levels. The ground points were filtered using Axelsson’s algorithm, and a DTM with a 0.25 m cell size was created using the moving average interpolation method combined with natural neighbor interpolation.
In [26], the DTM accuracy, generated based on AL3 S1000 and AL3-32 LiDAR, was tested for two different terrains (i.e., flat, slope, and overall) for three different heights (i.e., 20 m, 40 m, and 60 m), using 129 reference points measured via different technologies. For the 60 m flight height, the RMSE was 10.5 cm for the flat area, 34.3 cm for the slope area, and 61.6 cm overall. The ground points were filtered using the Axelsson’s algorithm.
In [27], a DTM was created for three small (around 1.5 ha) different forest sites, differing in terms of the nature of the forest and the terrain. The data acquisition was carried out with a DJI Zenmuse L1 mounted on a DJI Matrice 300 RTK UAS at a 100 m height under leaf-off conditions. The ground points were obtained using a combination of the structural filtering method CANUPO and a CSF. The vertical accuracy was tested, having as a reference a Terrestrial Laser Scanner (TLS) point cloud. For test site no. 2, which is an old forest with rugged terrain, the error was 5 cm, and for test site no. 3, the error was 6.5 cm. It is important to note that these sites are devoid of low and medium vegetation, making them unsuitable for a direct comparison with the DTM results obtained in our tests. Nevertheless, they can serve as reference points for evaluating the vertical accuracy of LiDAR-UAS point clouds.
Despite the significant advancements in terms of algorithms, the generation of DTMs, particularly in specific and complex terrain situations, continues to pose challenges [28].

Research Scope

The primary objective of this study is to identify the most suitable filtering method for generating a DTM in challenging terrain surfaces, utilizing UAS LiDAR data. Three distinct filtering techniques, namely, a cloth simulation filter, a volume-based filter, and hierarchic robust filtering, were applied to two LiDAR-UAS point clouds, and the resulting DTMs were tested in terms of vertical accuracy using a total of 985 ChPs measured via a total station and GNSS-RTK technology. The LiDAR-UAS point clouds were acquired at different altitudes, specifically at 60 m and 100 m. Furthermore, the accuracy of the georeferencing process of the LiDAR-UAS point cloud data was assessed using 85 ChP elevations, 33 ChP tridimensional coordinates, and 64 ChP tridimensional coordinates measured with the total station on the rooftop’s corners and manually digitized polylines on the edges of the rooftops. The georeferencing process was carried out using a GNSS-aided method with Post-Processed Kinematic (PPK) processing, without the use of additional information such as Ground Control Points (GCPs). We propose a workflow to enhance the LiDAR-UAS DTM by combining the results of the hierarchic robust and volume-based filtering approaches for precision topographic mapping.

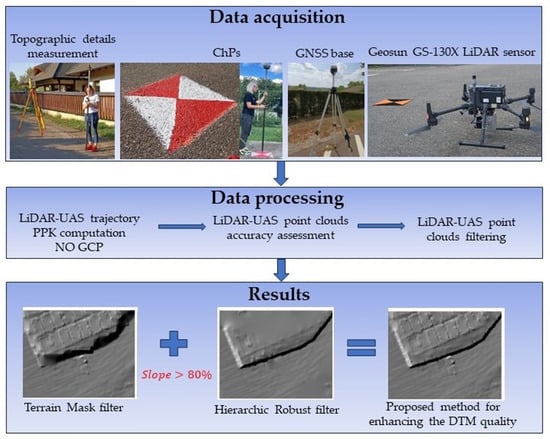
2. Materials and Methods

2.1. Study Area

The study area covers approximately 7.2 ha and constitutes a residential district situated in Iasi city, which is close to the administrative border of Rediu commune. It encompasses 22 houses and 2 residential apartment buildings, each enclosed by a combination of natural and artificial fences, along with private roads and a private cemetery (Figure 1). In terms of administrative classification, it falls within the jurisdiction of the inner city of the Municipality of Iasi, according to the Urban General Plan. The characteristics of the study area include those of complex terrains with sudden slope changes, man-made structures such as retaining concrete walls, artificially terraced terrain, and a long concrete pathway with steps.

2.2. Research Methodology

The workflow applied for this study area is depicted in Figure 2 and comprises the following processing steps: (1) fieldwork with measurements for determining the coordinates of ChPs using GNSS-RTK technology and total station measurements, (2) planning and execution of the LiDAR-UAS flights, (3) coordinate transformation from ETRS-84 coordinate system to Romanian national coordinate system, (4) processing the LiDAR flight trajectory and processing to obtain the LiDAR-UAS point cloud, (5) accuracy assessment of the LiDAR-UAS point cloud based on ChPs and manually measured features, (6) point cloud filtering to extract the ground and off-ground points for subsequent DTM generation, (7) proposed combined method to obtain an enhanced DTM and accuracy assessment of derived DTMs using different filtering algorithms based on 985 ChPs.

2.3. Check Points (ChPs)

ChPs were systematically positioned across the study area, as shown in Figure 3. Out of the total points that were established, 85 ChPs were specifically selected for assessing the vertical accuracy of the LiDAR-UAS point clouds. These ChPs were strategically positioned in areas devoid of vegetation, such as streets, parking lots, and a cemetery. They were marked on the ground using metallic bolts and wooden sticks, particularly in the cemetery area. To ensure a high degree of precision, the 85 ChPs’ locations were surveyed using a multi-band Emlid Reach RS2 GNSS receiver, achieving centimetric accuracy through the use of the Romanian Positioning Determination System (ROMPOS) [29] and GNSS-RTK technology. The planimetric coordinates of the ChPs were determined within the Romanian national coordinate system known as “Stereographic on a unique secant plane-1970” (STEREO-70). Furthermore, the ellipsoidal heights were converted from the ETRS89 European datum to the Black Sea-1975 normal heights, corresponding to the RO Const/NH vertical datum, as outlined in [30]. Also, 33 of these points were marked on the ground by painting two red and two white triangles, using a hand-crafted pattern of 40 cm × 40 cm. Subsequently, the coordinates of 64 specific points, representing the corners of rooftops, were obtained through the reflectorless function of a total station (Figure 3a). The 33 painted ChPs and the 64 roof corners, were used for the overall accuracy assessment of LiDAR-UAS point clouds.
A total of 985 ChPs (Figure 3b) were employed for the DTM accuracy assessment. These points are characteristic points of the surrounding space, such as road edges and fences, as well as man-made structures (Figure 4), and have been measured using a total station. This set of ChPs also encompasses the previously mentioned 85 ChPs to guarantee their distribution across the entire surface of the study area.

2.4. GeoSun GS-130X LiDAR Scanner

For this particular case study, a GeoSun GS-130X LiDAR sensor was employed. This sensor is purposefully designed for remote sensing and data collection across a wide spectrum of applications. Its versatility extends to fields such as forestry, agriculture, mining, environmental monitoring, and topographic mapping. Some key features and information about the GeoSun GS-130X can be found in Appendix A. Weighing just 1.26 kg, this system is well suited for seamless integration with small- to medium-sized UASs. It has the capability to scan at a rate of 1,280,000 points per second while maintaining a measurement accuracy of less than 10 cm at a flight height of 120 m.

2.5. LiDAR-UAS Mission Planning

For the LiDAR-UAS mission planning, the Unmanned Ground Control Software (UgCS) Expert v4.17 (2141) was used, which is a software platform developed by SPH Engineering, primarily designed for the planning and execution of autonomous drone missions. Offering a user-friendly interface, the mission plan was created based on a few parameters, with the most important ones being the UAS (DJI Matrice 300 RTK for this case study), LiDAR mission, take-off and landing points, area of interest, field of view (FOV) (75° for these missions), flight height (60 m and 100 m), flight speed (7 m/s), side overlap (30%), and altitude mode (AGL), as well as with avoid obstacle and avoid terrain options selected. For both missions, two calibration circles with a 20 m radius were specified in the first point of the itinerary, as can be seen in Figure 5.
A GeoSun GS-130X LiDAR-UAS scanner was mounted on the DJI Matrice 300 RTK UAS (Figure 6a). During the flights, an Emlid Reach RS2 GNSS receiver was set as the base station (Figure 6b) to record GNSS observations. The position of the receiver was determined with GNSS-RTK technology in 2 min intervals at 5 Hz (600 measurements) using the corrections through the ROMPOS service from the permanent reference station, namely, the IASI station from the national geodetic network, which was 3.9 km apart from the study area.

2.6. LiDAR-UAS Trajectory Computation

In general, the primary sources of error in UAV-based laser scanning are associated with the estimation of the GNSS/INS trajectory. These errors can be categorized into two main types: position errors and orientation errors. Position errors refer to inaccuracies in determining the exact location of the system or device as it moves. Orientation errors pertain to deviations in the device’s spatial orientation or attitude. These errors can be systematic and consistent, which means they occur in a predictable manner, and they tend to propagate into errors in the point cloud data collected by the system. This underscores the importance of accurate trajectory estimation for obtaining precise and reliable geospatial data through UAV-based laser scanning [31].
Developed by Wuhan Geosun Navigation Technology Co., Ltd. (Wuhan, China), Shuttle is a high-precision GNSS/INS positioning and attitude determination post-processing software, which was used for the GeoSun GS-130X LiDAR-UAS trajectory computation. Shuttle employs single-epoch ambiguity algorithms and high-order Kalman filters to maximize the integration of GNSS carrier phase data and information from the inertial navigation component (IMU). Compared to GNSS post-processing alone, the GNSS/INS combination provides a more comprehensive set of carrier dynamics information, thus enhancing resolution accuracy and overall reliability [32].
The processing steps for this case study are presented in Figure 7 and can be summarized as follows: GNSS dynamic (the receiver moves relative to the surface of the Earth) precision single-point positioning (Figure 8a,c), GNSS dynamic differential positioning (Figure 8b,d), coordinate transformation, GNSS/INS combined positioning and attitude measurement, and point cloud generation. Shuttle’s GNSS positioning solution is based on the fuzzy degree core algorithm, which combines several single-epoch ambiguity-solving techniques. The observation data of a dual-frequency GNSS receiver, the corresponding precision ephemeris, and the precision clock are used to achieve precise single-point positioning. The GNSS/INS-combined positioning attitude uses a high-order Kalman filter to establish a random error model of up to 24 orders for the system, and performs algorithms such as round-trip filtering, smoothing, and zero-speed updating.
Following the computation of the LiDAR-UAS trajectory using the GNSS information, the geodetic coordinates, defined within the ETRS-89 coordinate system, were subsequently transformed to the STEREO-70 coordinate system for the horizontal position and the Black Sea-1975 system for normal heights. This transformation was carried out using the coordinate transformation tool integrated into Geosun’s self-developed gAirHawk 5.0 software. For 2D coordinate transformation, a predefined 7-parameter method specific to the Romanian territory was employed. As for the vertical position, the transformation grid, also accessible through TransDatRO v4.07 software [33] provided by the National Agency for Cadaster and Land Registry (NACLR), was utilized.
At a flight height of 60 m, a total of 6 strips were acquired with a side overlap of 30%, as shown in Figure 9a, and at a flight height of 100 m, 4 strips were acquired, as depicted in Figure 9b.
The point density of the LiDAR-UAS data was determined for both flights using the “opalsCell” module of Orientation and Processing of Airborne Laser Scanning data (OPALS) v2.5.0 software, developed by the Department of Geodesy and Geoinformation from Technical University of Vienna [34,35]. The analysis revealed varying point densities. For the 100 m flight, the point density ranged from 0 to a maximum of 1209 points/sqm, while for the 60 m flight, it varied between 0 and 2585 points/sqm. To estimate point density more effectively, histograms and color-coded visualizations were calculated (refer to Appendix B). From these, the Root-Mean-Square (RMS) value was considered as a reliable approximation of the point density per square meter. For the 100 m flight, the RMS value was found to be approximately 300 points/sqm, and for the 60 m flight, it was about 564 points/sqm. A visual representation of the point clouds from both flights is shown in Figure 10. Additionally, a summary of the LiDAR-UAS point clouds is provided in Table 1.

3. Results

3.1. Quality Assessment of the LiDAR-UAS Point Clouds

Assessing the accuracy of LiDAR data collected from a UAS involves several steps and considerations. First, the standard deviation was computed to assess the disparity between LiDAR-derived elevation data and Ground Control Point (GCP) elevations, employing 85 ChPs, as detailed above (Figure 11a). Next, the coordinates of the 64 corners of rooftops were compared with the coordinates of the same points manually extracted directly from LiDAR-UAS point clouds. In Figure 11b, a close-up view is provided, highlighting certain points denoting the corners of rooftops. These specific points are distinguished by their red coloring and are superimposed onto the shaded Digital Surface Model (DSM). This presentation aims to enhance the clarity and understanding of the data.
Subsequently, the coordinates of 33 painted points were manually measured directly on the mesh surface by visually approximating the center to assess the planimetric, vertical, and overall accuracy of the LiDAR-UAS point cloud. This step is not simple but is of high importance, as reported in [36], where the global accuracy was measured using high-intensity targets. The point cloud was colored by intensity attribute using the “viridis” color palette from CloudCompare v2.12.4 software [37], and an RGB point cloud was created by choosing a 0–40 range for saturation. The solution to creating the mesh surface for the ChPs arises due to point cloud density, as no LiDAR point is measured in the ChP center (Figure 12a–c). The coordinates were compared with those measured via GNSS-RTK technology.
Finally, a manual digitization process was applied on shaded Digital Surface Models (DSMs) (Section 3) to delineate the edges of building roofs. These manually digitized roof edges were then compared with edges manually digitized from orthophotos generated from a 60 m oblique UAS flight, as reported in [30] (Figure 13).
To evaluate the disparities between the LiDAR-derived elevation data and the elevations provided by ChPs, a mesh surface was generated based on the LiDAR-UAS point clouds using CloudCompare software. The Hausdorff distances between each ChP point and the mesh surface were measured, and a histogram representing the distribution of the Hausdorff distances was then computed, as shown in Figure 14. The values of the Root-Mean-Square Error were computed using the average difference (Hausdorff distances) between reference ChP elevations (as actual values) and the mesh surface created based on LiDAR-UAS points. The analysis indicates that for the 60 m flight, approximately 39% of the ChPs exhibit calculated distances falling within a range of 1 to 2 cm, with an RMSE value of 2 cm. For the 100 m flight, about 35% of the ChPs have calculated distances ranging from 2 to 3 cm, with an RMSE value of 4 cm, as reported in [27]. The 4 cm error was also obtained in [27], but after rasterization of LiDAR-UAS point cloud averaging the data within a 0.1 m cell, providing significant smoothening. These data suggest the degree of agreement between LiDAR-derived elevations and the ChPs at different flight heights.
By comparing the coordinates of the 33 ChPs measured via GNSS-RTK with the coordinates of the same points manually measured directly on the mesh surface, errors along each axis were computed. These errors include the RMSEX, RMSEY, and RMSEZ, as well as the planimetric error RMSEX,Y and the total error RMSET. Additionally, the standard deviation was calculated, and the results are presented in Table 2.
Upon analyzing the results, it can be seen that the planimetric error for the 60 m flight is 4.8 cm and 6.5 cm for the 100 m height. Furthermore, the total errors are 5.3 cm for the 60 m height and 7.5 cm for the 100 m height, which is in accordance with the values reported in [36]. However, the total errors found in [36] were approx. 3.8 cm at the 50 m flight altitude and approx. 4.8 cm at the 70 m flight altitude after the removal of the georeferencing global error using 3D transformation of the entire point cloud.
Subsequently, by comparing the coordinates of the roof corners measured via the total station with the coordinates of the same points manually extracted directly from LiDAR-UAS point clouds, the errors along each axis were computed; the results are summarized in Table 3.
It is essential to note that the accuracy of corner measurements in a laser-scanned point cloud depends on various factors, including the point cloud density, the laser scanner characteristics, scan angle, vegetation, noise, and environmental conditions. The density of laser points in the point cloud plays a significant role in the identification of corners and edges. Higher point densities provide more information, making it easier to detect sharp transitions in elevation or slope, which are indicative of corners or edges. Low-density point clouds may not capture subtle features effectively. The type of laser scanner used for data acquisition affects the point cloud’s quality. Scanners with different laser wavelengths, pulse repetition rates, and scanning patterns can influence the quality and accuracy of the data. Thus, the planimetric accuracy for the 60 m height was found to be 10 cm, and for the 100 m height, it was found to be 14.1 cm. The total errors are 12.6 cm for the 60 m flight height and 17.9 cm for the 100 m flight height.
In order to automatically compare the extracted roof edges based on shaded DSM and 60 m flight orthophotos, we relied on comparing two polylines (the sequences of connected line segments) to obtain the standard deviation of the distances between them. ArcGIS Pro v10.8.2 software was used for this particular task, obtaining a standard deviation of 10.4 cm for the 60 m flight and a standard deviation of 15.5 cm for the 100 m flight.

3.2. LiDAR-UAS Point Cloud Classification in Ground and Off-Ground Points

To classify the LiDAR-UAS point cloud into ground and off-ground points, three methods were applied: a Cloth Simulation Filter (CSF) [38] implemented in CloudCompare software, a volume-based algorithm [39], and a hierarchic robust filter algorithm [40] implemented into Opals v2.5.0 software.

3.2.1. Cloth Simulation Filtering Approach

The CSF algorithm is very easy to apply and requires three parameters, i.e., the type of terrain surface (steep slope, relief, or flat), the cloth resolution (grid size), and the threshold for the off-ground point classification. However, for obtaining optimal results, an important aspect is to carefully choose the values for the parameters, as also emphasized in [41]. The significance of the cloth resolution parameter when conducting ground filtering within the CSF was demonstrated in [42]. This study concluded that increasing the cloth resolution makes the DTM coarser in quality. Additionally, it is essential to note that various data types require distinct parameter settings. For the present study, the “relief” option was chosen since the terrain level difference is about 30 m, the cloth resolution was set to 0.5 m, and the threshold for the off-ground points was 0.1 m.
For DTM generation, the “opalsGrid” module was utilized, opting for the robust moving interpolation method, and the following parameter configurations were selected: 0.3 m search radius, 20 neighbors, and 0.1 m grid size for the 60 m height; 0.6 m search radius, 20 neighbors, and 0.2 m grid size for the 100 m height. As anticipated, gaps in information (void pixels) persisted in the resulting data. To address this and create a final DTM without these information gaps, the “opalsFillGaps” module, designed to identify gaps in raster models, was employed. The adaptive interpolation method was applied to calculate values for the void pixels, ensuring a complete DTM (Appendix C).
Visually analyzing the ground and non-ground points, it can be seen that some points belonging to the bare earth surface (for example, a part of the parking lot and some points on the street), and also the points measured on the concrete retaining walls, were falsely classified as off-ground points (Appendix C, Figure A2, profiles P1–P5). Conversely, points that are not associated with bare earth are categorized as ground points, which include features like graves (Appendix C, Figure A2, profile P2), medium vegetation, or even construction rooftops, as highlighted on the shaded DTM (Appendix C, Figure A2). If the cloth resolution is set to 0.2 m, the points belonging to the building roofs are classified as ground points.
The effect of planar areas such as building roofs, which were misclassified as ground points by the CSF, was also reported in [43]. One of the conclusions of this study was that in order to precisely evaluate the performance of the CSF, a more extensive and statistically rigorous accuracy assessment is necessary. This assessment should encompass a variety of landscapes, including urban, rural, and forested areas.

3.2.2. Volume-Based Filtering Approach

DSM Generation

When using the volume-based filtering approach, the basic input is the Digital Surface Model (DSM) of the study area in raster format. For the DSM derivation, first, all LiDAR-UAS points were interpolated using the “robust moving plane” interpolation method, implemented into “opalsGrid” module. The DSMrmp corresponding to the 60 m height resulted in a regular grid structure with a grid cell dimension of 10 cm. The height for each grid cell was estimated by finding the best-fitting tilted plane of the 20 nearest points of the grid point (x, y) within the 30 cm search radius (3×cell size) with quadrant-oriented data selection, without taking into consideration the points detected as outliers. For each neighbor point, the individual weight was calculated by applying a weight function defined as the inverse of the squared distance. For the 100 m height, the grid cell dimension was set as 20 cm, and the search radius was set to 60 cm.
Details of the shaded DSMrmp for the 60 m height are shown in Figure 15a, where the averaging effect of the moving least squares method is evident along building edges, as noted by [44]. While the DSMrmp effectively represents smooth surfaces, its application along building edges and within forested areas can result in either an overestimation or underestimation of surface heights. In addition to the elevation, moving least squares interpolation enables the extraction of additional attributes for each grid point. These attributes encompass the standard error of the estimated grid point elevation (σz, indicating roughness), excentricity (distance between the grid point and the center of gravity of input points), point count, point density, slope, and exposure. These attributes have demonstrated their significance in subsequent data processing stages, particularly in identifying concealed and vegetated areas [44]. Hence, by employing the “opalsCell” module of Opals, the DSMmax was computed based on the highest elevation within a 0.1 m grid cell for the 60 m height and 0.2 m for the 100 m height. Although the method accurately represents building edges, it does introduce artificial roughness on building roofs and streets (Figure 15b).
Using the σz values (as shown in Figure 15c), a combination of rasters was utilized through the “opalsAlgebra” module, calculated using pseudocode (1) with a set threshold value of 0.01 m. When the σz values are lower than the threshold, the DSM height is derived from the DSMrmp; otherwise, it is obtained from the DSMmax:
z   D S M r m p _ m a x = z σ z < 0.01   o r   n o t   z D S M m a x ?   z   D S M r m p :   z   D S M m a x
To address the gaps (void pixels due to the acquisition angle, grid size, number of neighbors, point density, or interpolation method) in the obtained DSMrmp_max, another interpolation technique, Delaunay triangulation (OPALS-“delaunayTriangulation”), was applied. To create a complete DSM (DSMfinal) without information gaps, the two rasters, DSMrmp_max and DSMDelaunay, were merged using pseudocode (2), performed in the “opalsAlgebra” module of Opals software. Specifically, cells from DSMrmp_max were retained, and cells from DSMDelaunay were incorporated only in cases where information gaps existed in the first DSM.
z   D S M f i n a l = z D S M r m p _ m a x ?   z   D S M r m p _ m a x :   z   D S M D e l a u n a y
The shading of the final DSM for the 60 m height is shown in Appendix C1, Figure A3a. By using the two attributes, σz and eccentricity, a mask for the terrain and planar surfaces can be calculated setting a threshold value of 0.1 for the σz attribute and 0.8 for the eccentricity attribute, as shown in Appendix C, Figure A3b. The vegetated areas are highlighted very well as well as the roof’s edges.

Ground Point Filtering

The volume-based filtering approach by [39] identifies open terrain parts of a DSM input raster. Two key parameters are needed to apply this approach, i.e., the minimum height for the off-ground point classification and the maximum size of an elevated object, specifically the maximum length or width, and are typically used to limit the consideration of very large objects, such as buildings. The algorithm runs the classification separately for all four directions: N–S, E–W, NW–SE, and SW–NE. To obtain the final terrain mask, a straightforward voting scheme is employed, which combines the outcomes of all four directional masks. Therefore, the parameter “minConsensus” specifies the minimum number of directional masks that must classify a particular pixel as elevated for it to be considered as such. Taking as input the DSMfinal raster, setting the minimum height at 0.1 m and the maximum length at 40 m (building situated in the N-V part of the study area), and considering all four directions for voting a pixel, the terrain mask is calculated. By analyzing the result, it can be seen that some elevated points remain. The adopted solution was to apply morphological operations on the terrain mask using the “opalsMorph” module.
Dilation and erosion are fundamental operations in mathematical morphology, initially developed for binary images and later extended to grayscale images. Opening implies erosion and dilation in this order, while closing consists of dilation and erosion applied in this order.
The structural element, a small mask (a matrix with “0” and “1” values), typically of an odd size, often 3 × 3 pixels, is placed over the binary image and moved to all possible positions, being compared to all corresponding pixels in the image being analyzed. In the case of dilation, it tests whether the structural element intersects with the corresponding pixels in the image, while in the case of erosion, it tests whether the structural element matches with all the pixels under the mask (each pixel with a “1” value within the structural element corresponds to a pixel with a “1” value in the image segment under the mask). The new image created through a morphological operation is still a binary image, where pixels have a non-zero value only if they correspond to the binarization mode in that location. Dilation and erosion have opposite effects: dilation creates the background of an object, while erosion operates inversely. The size of the matrix defines the size of the structural element, and the positions of the “0” and “1” values define the shape of the structural element. The origin of the structural element is usually one of its pixels, typically located at its center, but it can also be situated outside the structural element. The structural element can have any shape: cross, square, diamond, etc. For this particular case study, the closing morphological operation was applied to the “terrain mask” binary raster image, using a square-shaped structural element, with a size of 3. The binary terrain mask before applying the morphological operation is shown in Appendix D, Figure A4a, and after applying the morphological operation in Figure A4b in Appendix D.
For DTM generation, the robust moving interpolation method, with the same parameter configurations as described above (Section 3.2.1), was applied, in addition to the adaptive interpolation method, to calculate values for the void pixels (Appendix D, Figure A5a,b). The effect of the “close” morphological operation on the final DTM can be observed in Figure 16. The isolated points that remain in areas of high vegetation cause artifacts in the generated DTM (Figure 16b) that are removed in the DTM obtained via volume-based morphological filtering (Figure 16c).
The details of non-ground points identified via volume-based morphological filtering superimposed on the DSM are shown in Figure 17. Natural elements, such as high, medium, and low vegetation, and artificial elements, such as graves, cars, and buildings, were correctly classified as non-ground points (Figure 17a). However, some omission errors can be seen on the edges of the study area, where a part of the street and the slanting terrain surface are wrongly classified as non-ground points (Figure 17b).

3.2.3. Hierarchic Robust Filtering Approach

To filter the LiDAR-UAS point cloud in order to automatically classify the ground and off-ground points, the point clouds obtained at 60 m and 100 m heights were filtered using the hierarchic robust filtering algorithm implemented into Opals software with four iterations, establishing threshold strips for elevation for noise filtering. For this purpose, the “opalsRobFilter” module was employed. First, the point cloud was filtered via the last return, a total of 657,466 points measured with the second return, representing only 1.7% of the total number of points for the 60 m height and 58,509 representing only 0.3% of the total number of points, were eliminated. The same percentage of first and second return points was reported by [25]. A HESAI Pandar XT laser sensor attached to a LiDAR-UAS scanner can only measure two returns, with the number of points measured using one return being significantly higher than the points measured using the second return. The process continues with an initial approximation of the surface, considering all points within the dataset, which may include elements such as vegetation, powerlines, buildings, and ground. Subsequently, the residuals, representing the distances between the measured points and the initial surface approximation are calculated and stored as attribute “normalizedZ”. Each point is assigned a weight based on its distance from the surface, prioritizing points located below the surface over those situated above it. Consequently, the surface is drawn toward the points located at lower elevations, typically representing the ground. For this case study, the initial surface was created using three iterations, considering the minimum height of two points for the first iteration and one point for the next iterations, in grid cell sizes of 5 m, 3 m, and 1 m. To calculate the DTM surface, the “moving average” interpolation method was used, setting the grid sizes at 2.5 m, 1.5 m, and 0.5 m for each iteration. The threshold strips for elevation considering the normalizedZ values were [−3 m ÷ +2 m] for the first iteration, [−1.5 m ÷ +1 m] for the second iteration, and [−0.25 m ÷ +0.5 m] for the third iteration. Therefore, a point is classified as a ground point if the normalized value is within the range interval.
After obtaining the ground points in the third iteration, the “opalsRobFilter” module was used next. The result was an XYZ file containing all points classified as ground. The parameter settings for the module are described in (3):
opalsRobfilter -Infile: ground_points.odm; -Interpolation: plane; -Number of Threads: 1; -Sigma a priori: 0.1; -Penetration: 20; -Outfile: filter_ground_points.xyz
The processing sequence in this module follows a grid-oriented approach, starting with the creation of an internal grid with a grid size equivalent to the specified search radius (parameter searchRadius = 3 by default). A local surface is estimated for each grid node, using the “moving plane” interpolation method with a titled plane (parameter interpolation = plane), from the three available interpolation methods, taking into consideration all the points situated within the defined search radius. The point classification into ground and non-ground points is given by a threshold (parameter maxSigma = 0.5 m by default), i.e., the standard deviation of the surface interpolation. As not all laser pulses are able to reach the ground, in the context of robust interpolation, the penetration rate (parameter penetration = 20) given in percentages is utilized as an estimate to establish an initial course for the local surfaces, which occurs prior to the detailed interpolation process. The robust interpolation process is carried out through iterations; during each iteration, the individual point weights are adjusted according to the residuals. This process of surface interpolation and re-weighting is reiterated until either the changes in the surface are within a defined threshold or the maximum number of iterations has been reached. By default, the maximum number of iterations is 100. For the ground points found by hierarchic robust interpolation, a surface was created using the “nearest point” interpolation method, with a grid size of 0.5 m and a 15 m search radius. Defining a range interval of −0.1 m ÷ 0.05 m for the normalizedZ attribute calculated for each ground point with respect to this surface, the final classification of ground points is made.
The details of the mesh surface created based on ground points identified via hierarchic robust filtering are displayed in Figure 18. It can be observed that even though the upper surface of the graves was filtered via the algorithm, some points at the bottom part, which were identified as ground points, led to irregularities. This same effect was observed in areas with medium vegetation.
For DTM generation, the robust moving interpolation method with the same parameter configurations as described above (Section 3.2.1) was applied, in addition to the adaptive interpolation method, to calculate values for the void pixels (Appendix E).

3.2.4. Proposed Method for Enhancing DTM Quality by Combining Robust Filtering and Volume-Based Filtering Approaches for Ground Points

By analyzing and comparing the DTMs resulting from the CSF, volume-based filtering, and hierarchic robust filtering methods, advantages and disadvantages could be identified for each. As observed, the estimated models at 60 m and 100 m heights obtained via hierarchic robust filtering approximate the ground topography with the highest fidelity. However, a significant drawback arises with steep slopes, where the algorithm is not able to capture ground points in close proximity to terrain edges. Consequently, the applied interpolation introduces smoothing effects in the DTM, deviating from the precise shape of the actual terrain. However, the volume-based filtering approach eliminates all areas under the corresponding ground mask but keeps the points at very steep slopes (e.g., retaining walls). Among the three algorithms analyzed, the CSF algorithm demonstrated the poorest performance, as it failed to identify large terrain areas as ground. It did not identify points on concrete retaining walls, artificial terraces, or sudden terrain slopes as ground points, erroneously classifying points on graves, building roofs, and medium vegetation as the “ground” class. Therefore, to obtain a final DTM with higher quality, we proposed a combined approach based on the strengths of the two methods, namely, hierarchical robust and volume-based filtering. In this way, the void areas at steep slopes with missing ground points in the hierarchic robust filter algorithm are filled with the corresponding ground points identified through the volume-based filtering approach.
The proposed solution is described with pseudocode (4), where, in the case of steep slopes of more than 80%, the ground points identified via the morphological-based filtering approach are considered; otherwise, the ground points extracted via the hierarchic robust filter are taken in the final combined approach. In this manner, the difficulties in identifying the ground points at steep edges encountered by robust filters are compensated for via the volume-based filtering approach.
For this, in the first step, a slope map of the entire area of interest (for both 60 m and 100 m flights) was computed using the “OpalsGrid” module with the feature “slope” implemented in Opals software. Secondly, with the “OpalsAlgebra” module, only the regions with a slope greater than 80% were selected and saved in a corresponding mask. A detailed view of the slope and the corresponding mask, which includes two retaining walls and an artificially terraced terrain, is illustrated in Figure 19.
The computed mask was then further employed to select and extract the corresponding areas from the ground points identified with the volume-based filtering method. The purpose of this was to merge the points extracted via hierarchic robust filtering with the ground points identified via the volume-based filtering approach for areas with very steep slopes. Hence, the number of ground points increased by 1% and 0.8% for the 60 m and 100 m heights, respectively (Table 4).
G r o u n d   p t s P r o p o s e d   m e t h o d = S l o p e > 80   ?     G r o u n d   p t s   M o r p h .     V o l u m e   :   G r o u n d   p t s H i e r a r c h i c   r o b u s t
where:
G r o u n d   p t s P r o p o s e d   m e t h o d —ground points identified via the proposed approach;
G r o u n d   p t s H i e r a r c h i c   r o b u s t —ground points extracted via the hierarchic robust filtering approach;
G r o u n d   p t s M o r p h .     V o l u m e   —ground points extracted via the morphological volume-based approach;
S l o p e > 80   —condition for ground point selection only in steep terrain areas with slopes > 80%.
Finally, a new interpolation was performed on the combined point cloud with only ground points using the robust moving interpolation method, keeping the same configuration parameters as presented in Section 3.2.1. Additionally, void areas were filled via the adaptive interpolation method. As expected, the newly obtained DTM is improved compared to hierarchical robust DTM, especially in areas with very steep slopes. Detailed views of the enhancements at a retaining wall and terraces are visible in Figure 20 in the last column. Compared to the robust filtering-based DTM with missing information in these specific areas containing sudden slope changes, the final combined model added the corresponding ground points from the volume-based DTM, thus increasing ground point completeness and improving the quality of the final result.
A summary of the number of ground points obtained by applying different filtering approaches on LiDAR-UAS point clouds acquired at 60 m and 100 m heights is presented in Table 5.
Using QGIS v3.28.13 software, the elevations of the 985 ChPs were interpolated in the derived DTMs, applying different filtering approaches. The resulting statistics, including mean, median, standard deviation, and Root-Mean-Square error for the differences between the initial elevations and the interpolated ones, are presented in Table 6.
The statistical values were calculated after filtering the outliers. Upon analyzing the histogram of the distribution of vertical errors for the 60 m flight height when using the hierarchic robust filtering method, it was observed that the calculated errors fell within a range of −1.86 m to +2.20 m, with a standard deviation of 0.25 m. In contrast, when the proposed method was applied in the DTM generation process based on LiDAR-UAS point clouds, the error range was notably reduced to −1.05 m to +0.76 m, with a standard deviation of 0.15 m. This means that the proposed method significantly decreases the error range, with the maximum error being approximately three times smaller compared to the hierarchic robust filtering method. For the 100 m flight height, the errors ranged from −2.05 m to +2.00 m, which was then reduced to −2.05 m to +0.66 m when employing the proposed method. Again, the maximum error was approximately three times smaller with the proposed method. Overall, the proposed method enhances DTM quality compared to the hierarchic robust filter, resulting in a 40% improvement for the 60 m flight height and a 28% improvement for the 100 m flight height.

4. Discussion

Through the examination of the three considered strategies for UAS point cloud filtering (CSF, volume-based morphological, and hierarchic robust filtering algorithms), the strengths and weaknesses associated with each approach were identified. While CSF shows the weakest performance, by eliminating a significant number of ground points, the volume-based morphological filter has a better efficiency, as it identifies ground points at very steep slopes. However, hierarchic robust filtering shows the best behavior overall but faces challenges in identifying ground points on steep slopes and in close proximity to terrain edges. Therefore, our proposed algorithm makes use of the strengths of the two most effective methods, namely: hierarchical robust filtering and volume-based morphological filter.
Figure 21 shows detailed profiles of “ground” points classified via the analyzed filtering approaches, along with the corresponding DTMs created based on these points. These profiles focus on specific areas, particularly those with steep slopes where the proposed methodology has notably increased the number of identified ground points. By looking at all profiles, the CSF performed worst overall. The retaining walls were successfully identified using the volume-based filtering approach. In addition, the hierarchic robust and CSF were effective in identifying the points located beneath trees. In the P2 profile, it is evident that there are graves with points identified as “ground” via the CSF, but they were correctly classified via the hierarchic robust and volume-based filters. In the P3 profile, tree branches cover the upper part of the wall, resulting in no points being identified as ground points via the volume-based filter. This effect can also be seen in profile P5, where an anthropic terraced terrain is illustrated. In the P4 profile, all points on the wall are correctly identified via the volume-based filter, but when generating the DTM, the points are located in the same cell (vertical wall), so the values are averaged, leading to a point in the middle of the wall.
The most significant advantages and disadvantages for each considered ground filtering approach and for the final combined proposed method, as identified in this paper, are summarized in Table 7.
Our present results form the basis for further detailed analyses and represent the beginning of future research directions, such as the application of the proposed method in other test areas with different topographic characteristics (mountainous, urban, and land areas), on datasets with different acquisition times (leaf-on vs. leaf-off conditions), and acquisitions with different LiDAR-UAS sensors.

5. Conclusions

The filtering of ground points represents an essential step in LiDAR data pre-processing, particularly for terrain modeling and the derivation of Digital Terrain Models. Over the last three decades, various ground filtering algorithms have been developed, with a primary focus on Airborne Laser Scanning (ALS) point clouds. Even though LiDAR-UAS and ALS methods both rely on LiDAR principles, they differ in terms of data acquisition platforms, applications, and characteristics. While LiDAR-UASs provide the advantage of a high point density, they also have the drawback of typically having a smaller number of returns in comparison to ALS systems, with the first return often representing about 99% of the entire point cloud. The high point density in LiDAR-UAS data may result in the reduced performance of filtering algorithms, rendering the task of filtering LiDAR-UAS point clouds more challenging compared to ALS point clouds.
In this study, the focus falls on obtaining a highly accurate DTM that faithfully reflects the actual ground features of a complex landscape, using as input data LiDAR-UAS point clouds. For this, different filtering approaches (i.e., hierarchical robust, volume-based, and cloth simulation) were tested, and their results were qualitatively and quantitatively compared.
For assessing the vertical, planimetric, and overall accuracy of the LiDAR-UAS point clouds, a total of 85 ChPs placed in open areas (measured via GNSS-RTK technology) were employed, together with 64 points representing roof corners (measured via a total station) and manually drawn polylines for roof edges. The vertical accuracy of the derived DTMs was assessed using 985 ChPs, including the 85 ChPs and topographical details measured via the total station, i.e., man-made structures, roads, and fences.
Ground points are “approximately” well identified by all three tested filtering methods, but the quality of the final obtained DTMs is affected by the adopted interpolation and void area filling strategies. Therefore, while the volume-based algorithm effectively identifies ground points, the subsequent application of the interpolation method produces a continuous surface that may not accurately represent the actual shape of the terrain. The main advantage of this algorithm is its capability to accurately classify points measured on steep or sudden slopes as ground points. From all three analyzed filters, the CSF performed worst overall, while the hierarchic robust filter performed the best in classifying ground points, except for areas with steep slopes and rapid changes in elevation, such as vertical walls. Therefore, to obtain an enhanced DTM that represents the real terrain shape with higher confidence, we proposed a new method that makes use of the strengths of the two filtering approaches, namely, hierarchical robust and volume-based filtering approaches. The results of the two techniques have been combined, applying an 80% slope condition for the volume-based filtering approach, thereby obtaining an increased number of ground points. Finally, the newly interpolated DTM shows improvements of 40% and 28% for the LiDAR-UAS flights at 60 m and 100 m, respectively. Furthermore, in comparison to the terrain models generated via the individual filtering methods, the final combined DTM shows the best overall quality and accuracy metrics. The obtained enhanced DTM represents a valuable dataset for further precision topographic mapping applications, such as urban planning, infrastructure development, and environmental monitoring, where having an accurate and detailed representation of the Earth’s surface is essential.

Author Contributions

Conceptualization, V.-E.O. and A.-M.L.; data curation, V.-E.O., A.-M.L., M.M., A.-A.L., B.B. and P.S.; formal analysis, V.-E.O., A.-M.L. and B.B.; funding acquisition, V.-E.O. and P.S.; investigation, V.-E.O., A.-M.L., M.M. and B.B.; methodology, V.-E.O., A.-M.L., B.B. and P.S.; project administration, V.-E.O.; resources, V.-E.O., A.-M.L., M.M., A.-A.L., B.B. and P.S.; software, V.-E.O., A.-M.L. and B.B.; supervision, V.-E.O. and A.-M.L.; validation, V.-E.O., A.-M.L. and B.B.; visualization, V.-E.O., A.-M.L., M.M., A.-A.L., B.B. and P.S.; writing—original draft, V.-E.O., A.-M.L. and P.S.; writing—review and editing, V.-E.O. and A.-M.L. All authors have read and agreed to the published version of the manuscript.

Funding

The work was supported by a grant from the Ministry of Research, Innovation and Digitization, CNCS-UEFISCDI (project number: PN-III-P1-1.1-TE-2021-1185), within PNCDI III.

Data Availability Statement

The data that support the findings of this study are available from the first author upon reasonable request. The data are not publicly available due to privacy restriction.

Acknowledgments

The grant from the Ministry of Research, Innovation and Digitization, CNCS-UEFISCDI (project number: PN-III-P1-1.1-TE-2021-1185), within PNCDI III, is gratefully acknowledged. The authors would like to thank the Department of Geodesy and Geoinformation from Technische Universität Wien, for the “OPALS” software license.

Conflicts of Interest

Author B.B was employed by the company Geocad Profesional SRL (Smart Imaging and Mapping Services-SIMS). The remaining authors declare that the research was conducted in the absence of any commercial or financial relationships that could be construed as a potential conflict of interest.

Appendix A

Table A1. Specification of GS-130X UAS LiDAR Scanning System.
Component Name System Parameters
GS-130XWeight1.26 kg
Measuring accuracyLess than 0.1 m @120 m
Working temperature−20 °C~+65 °C
Power range12 V–24 V
Consumption10 W
Carrying platformGS-800 Multi Rotor and other brand
Storage64 GB storage, maximum support 128 GB TF card
LiDAR Unit
Remotesensing 16 00078 i001
Measuring range0.3 m–120 m@10% reflectivity
Laser class905 nm Class 1 (IEC 60825-1:2014)
Channel32 channels
Range accuracy±1 cm (typical value)
Scanning frequency10 HZ, 20 HZ
DataDouble echo 1,280,000 points/sec
FOV360°, adjustable
Laser sensorHESAI Pandar XT
POS unitUpdate frequency200 HZ
Heading accuracy0.017°
Pitch accuracy0.005°
Rolling accuracy0.005°
Position accuracy≤0.05 m
GNSS signal typeGPSL1/L2/L5 GLONASSL1/L2 BDS B1/B2/B3 GAL E1/E5a/5b
Pre-processing softwarePOS softwareOutput information: position, speed, attitude
Point cloud softwareOutput point cloud data format: LAS format, custom TXT format
Camera (built-in)FOV83 degrees
Effective pixel26 megapixels
Focal length(mm)16

Appendix B

Figure A1. LiDAR-UAS point clouds colored by density (first column) and corresponding histograms (second column) for (a,b) 60 m flight height; (c,d) 100 m flight height.
Remotesensing 16 00078 g0a1aRemotesensing 16 00078 g0a1b

Appendix C

Figure A2. Shaded DTM based on ground points obtained via CSF algorithm for (a) 60 m flight height (0.1 m cell size); (b) 100 m flight height (0.2 m cell size).
Remotesensing 16 00078 g0a2
Figure A3. (a) DSM of the study area in raster format with 0.1 m cell size (60 m height), (b) mask with σz < 0.1 and eccentricity < 0.8.
Remotesensing 16 00078 g0a3

Appendix D

Figure A4. (a) Terrain mask obtained with volume-based filter algorithm in raster format with 0.1 m cell size (60 m height), (b) terrain mask obtained with volume-based filter algorithm in raster format after applying the “close” morphological operation.
Remotesensing 16 00078 g0a4
Figure A5. Digital Terrain Model obtained via volume-based filter algorithm in raster format for the (a) 60 m flight height with 0.1 m cell size, (b) 100 m flight height with 0.2 m cell size.
Remotesensing 16 00078 g0a5

Appendix E

Figure A6. Digital Terrain Model obtained via hierarchic robust filtering algorithm in raster format for the (a) 60 m flight height with 0.1 m cell size, (b) 100 m flight height with 0.2 m cell size.
Remotesensing 16 00078 g0a6

References

  1. Kucharczyk, M.; Hugenholtz, C.H.; Zou, X. UAV–LiDAR accuracy in vegetated terrain. J. Unmanned Veh. Syst. 2018, 6, 212–234. [Google Scholar] [CrossRef]
  2. Mandlburger, G.; Pfennigbauer, M.; Haring, A.; Wieser, M.; Glira, P.; Winiwarter, L. Complementing airborne laser bathymetry with UAV-based lidar for capturing alluvial landscapes. In Proceedings of the SPIE Remote Sensing, Toulouse, France, 14 October 2015. [Google Scholar]
  3. Seitsonen, O.; Ikäheimo, J. Detecting Archaeological Features with Airborne Laser Scanning in the Alpine Tundra of Sápmi, Northern Finland. Remote Sens. 2021, 13, 1599. [Google Scholar] [CrossRef]
  4. Herrault, P.-A.; Poterek, Q.; Keller, B.; Schwartz, D.; Ertlen, D. Automated detection of former field systems from airborne laser scanning data: A new approach for Historical Ecology. Int. J. Appl. Earth Obs. Geoinf. 2021, 104, 102563. [Google Scholar] [CrossRef]
  5. Hodgetts, D. Laser scanning and digital outcrop geology in the petroleum industry: A review. Mar. Pet. Geol. 2013, 46, 335–354. [Google Scholar] [CrossRef]
  6. Wajs, J.; Trybała, P.; Górniak-Zimroz, J.; Krupa-Kurzynowska, J.; Kasza, D. Modern Solution for Fast and Accurate Inventorization of Open-Pit Mines by the Active Remote Sensing Technique—Case Study of Mikoszów Granite Mine (Lower Silesia, SW Poland). Energies 2021, 14, 6853. [Google Scholar] [CrossRef]
  7. Hollaus, M.; Mücke, W.; Roncat, A.; Pfeifer, N.; Briese, C. Full-Waveform Airborne Laser Scanning Systems and Their Possibilities in Forest Applications. In Forestry Applications of Airborne Laser Scanning: Concepts and Case Studies; Maltamo, M., Næsset, E., Vauhkonen, J., Eds.; Managing Forest Ecosystems; Springer: Dordrecht, The Netherlands, 2014; pp. 43–61. ISBN 978-94-017-8663-8. [Google Scholar]
  8. Appiah Mensah, A.; Jonzén, J.; Nyström, K.; Wallerman, J.; Nilsson, M. Mapping site index in coniferous forests using bi-temporal airborne laser scanning data and field data from the Swedish national forest inventory. For. Ecol. Manag. 2023, 547, 121395. [Google Scholar] [CrossRef]
  9. Elamin, A.; Abdelaziz, N.; El-Rabbany, A. A GNSS/INS/LiDAR Integration Scheme for UAV-Based Navigation in GNSS-Challenging Environments. Sensors 2022, 22, 9908. [Google Scholar] [CrossRef]
  10. Loghin, A.; Oniga, E.; Wieser, M. Analysing and Modelling Terrain Surface Changes using Airborne Laser Scanning Data. World J. Eng. Res. Technol. 2016, 2, 87–95. [Google Scholar]
  11. Torresan, C.; Berton, A.; Carotenuto, F.; Chiavetta, U.; Miglietta, F.; Zaldei, A.; Gioli, B. Development and Performance Assessment of a Low-Cost UAV Laser Scanner System (LasUAV). Remote Sens. 2018, 10, 1094. [Google Scholar] [CrossRef]
  12. Maune, D.F.; Kopp, S.M.; Crawford, C.A.; Zervas, C.E. Introduction. In Digital Elevation Model Technologies and Applications: The DEM Users Manual, 2nd ed.; Maune, D.F., Ed.; American Society for Photogrammetry and Remote Sensing; Bethesda: Rockville, MD, USA, 2007; pp. 9–16. [Google Scholar]
  13. Wagner, W.; Ullrich, A.; Ducic, V.; Melzer, T.; Studnicka, N. Gaussian Decomposition and Calibration of a Novel Small-Footprint Full-Waveform Digitising Airborne Laser Scanner. ISPRS J. Photogramm. Remote Sens. 2006, 60, 100–112. [Google Scholar] [CrossRef]
  14. Ruiz, L.A.; Hermosilla, T.; Mauro, F.; Godino, M. Analysis of the Influence of Plot Size and LiDAR Density on Forest Structure Attribute Estimates. Forests 2014, 5, 936–951. [Google Scholar] [CrossRef]
  15. Sithole, G.; Vosselman, G. Experimental comparison of filter algorithms for bare-Earth extraction from airborne laser scanning point clouds. ISPRS J. Photogramm. Remote Sens. 2004, 59, 85–101. [Google Scholar] [CrossRef]
  16. Chen, Z.; Gao, B.; Devereux, B. State-of-the-Art: DTM Generation Using Airborne LIDAR Data. Sensors 2017, 17, 150. [Google Scholar] [CrossRef] [PubMed]
  17. Yilmaz, V. Automated ground filtering of LiDAR and UAS point clouds with metaheuristics. Opt. Laser Technol. 2021, 138, 106890. [Google Scholar] [CrossRef]
  18. Kraus, K.; Pfeifer, N. Determination of terrain models in wooded areas with airborne laser scanner data. ISPRS J. Photogramm. Remote Sens. 1998, 53, 193–203. [Google Scholar] [CrossRef]
  19. Kraus, K.; Pfeifer, N. Advanced DTM generation from LIDAR data. Int. Arch. Photogramm. Remote Sens. 2001, 34, 23–30. [Google Scholar]
  20. Pfeifer, N.; Stadler, P.; Briese, C. Derivation of Digital Terrain Models in the SCOP ++ Environment. In Proceedings of the OEEPE Workshop on Airborne Laser Scanning and Interferometric SAR for Detailed Digital Elevation Models, Stockholm, Sweden, 1–3 March 2001. [Google Scholar]
  21. Axelsson, P. DEM generation form laser scanner data using adaptive TIN models. Int. Arch. Photogramm. Remote Sens. 2000, 4, 110–118. [Google Scholar]
  22. Nardinocchi, C.; Forlani, G.; Zingaretti, P. Classification and filtering of laser data. Int. Arch. Photogramm. Remote Sens. 2003, 34. Available online: https://www.isprs.org/proceedings/XXXIV/3-W13/papers/Nardinocchi_ALSDD2003.PDF (accessed on 20 October 2023).
  23. Jacobsen, K.; Lohmann, P. Segmented filtering of laser scanner DSMs. Int. Arch. Photogramm. Remote Sens 2003, 34. Available online: https://www.isprs.org/proceedings/XXXIV/3-W13/papers/Jacobsen_ALSDD2003.pdf (accessed on 10 October 2023).
  24. Serifoglu, Y.C.; Gungor, O. Comparison of the performances of ground filtering algorithms and DTM generation from a UAV-based point cloud. Geocarto Int. 2018, 33, 522–537. [Google Scholar] [CrossRef]
  25. Salach, A.; Bakuła, K.; Pilarska, M.; Ostrowski, W.; Górski, K.; Kurczyński, Z. Accuracy Assessment of Point Clouds from LiDAR and Dense Image Matching Acquired Using the UAV Platform for DTM Creation. ISPRS Int. J. Geo-Inf. 2018, 7, 342. [Google Scholar] [CrossRef]
  26. Fuad, N.A.; Ismail, Z.; Majid, Z.; Darwin, N.; Ariff, M.F.M.; Idris, K.M.; Yusoff, A.R. Accuracy evaluation of digital terrain model based on different flying altitudes and conditional of terrain using UAV LiDAR technology. In Proceedings of the IOP Conference Series: Earth and Environmental Science, Kuala Lumpur, Malaysia, 24–25 April 2018; IOP Publishing: Bristol, UK, 2018; Volume 169, p. 012100. [Google Scholar]
  27. Štroner, M.; Urban, R.; Křemen, T.; Braun, J. UAV DTM acquisition in a forested area–comparison of low-cost photogrammetry (DJI Zenmuse P1) and LiDAR solutions (DJI Zenmuse L1). Eur. J. Remote Sens. 2023, 56, 2179942. [Google Scholar] [CrossRef]
  28. Chen, C.; Guo, J.; Wu, H.; Li, Y.; Shi, B. Performance Comparison of Filtering Algorithms for High-Density Airborne LiDAR Point Clouds over Complex LandScapes. Remote Sens. 2021, 13, 2663. [Google Scholar] [CrossRef]
  29. Romanian Position Determination System: Real Time Products. Available online: https://www.unoosa.org/documents/pdf/psa/activities/2010/moldova/presentations/3-3.pdf (accessed on 20 October 2023).
  30. Oniga, V.E.; Morelli, L.; Macovei, M.; Chirila, C.; Breaban, A.I.; Remondino, F.; Sestraș, P. PPK Processing to Boost Accuracy in Cadastral Mapping. Int. Arch. Photogramm. Remote Sens. Spat. Inf. Sci. 2023, 48, 345–352. [Google Scholar] [CrossRef]
  31. Dreier, A.; Janßen, J.; Kuhlmann, H.; Klingbeil, L. Quality Analysis of Direct Georeferencing in Aspects of Absolute Accuracy and Precision for a UAV-Based Laser Scanning System. Remote Sens. 2021, 13, 3564. [Google Scholar] [CrossRef]
  32. Shuttle V5.7 User Guide. Available online: https://fshop.oss-accelerate.aliyuncs.com/20200611113453747081734.pdf (accessed on 1 November 2023).
  33. Help TransDatRO: User Guide; National Agency for Cadastre and Land Registration; National Center for Cartography: Bucharest, Romania, 2022; Available online: https://cngcft.ro/index.php/ro/ (accessed on 20 October 2023).
  34. OPALS Orientation and Processing of Airborne Laser Scanning Data. Available online: http://geo.tuwien.ac.at/opals/html/ModuleGrid.html (accessed on 1 November 2023).
  35. Pfeifer, N.; Mandlburger, G.; Otepka, J.; Karel, W. OPALS—A framework for Airborne Laser Scanning data analysis. Comput. Environ. Urban Syst. 2014, 45, 125–136. [Google Scholar] [CrossRef]
  36. Štroner, M.; Urban, R.; Línková, L. A New Method for UAV Lidar Precision Testing Used for the Evaluation of an Affordable DJI ZENMUSE L1 Scanner. Remote Sens. 2021, 13, 4811. [Google Scholar] [CrossRef]
  37. CloudCompare OfficialWeb Site. Available online: http://www.danielgm.net/cc/ (accessed on 1 November 2023).
  38. Zhang, W.; Qi, J.; Wan, P.; Wang, H.; Xie, D.; Wang, X.; Yan, G. An Easy-to-Use Airborne LiDAR Data Filtering Method Based on Cloth Simulation. Remote Sens. 2016, 8, 501. [Google Scholar] [CrossRef]
  39. Piltz, B.; Bayer, S.; Poznanska, A.M. Volume based DTM generation from very high resolution photogrammetric DSMs. Int. Arch. Photogramm. Remote Sens. Spatial Inf. Sci. 2016, 41, 83–90. [Google Scholar] [CrossRef]
  40. Pfeifer, N.; Mandlburger, G. Filtering and DTM Generation. In Topographic Laser Ranging and Scanning: Principles and Processing; Shan, J., Toth, C., Eds.; CRC Press: Boca Raton, FL, USA, 2008; pp. 307–333. ISBN 9781420051421. [Google Scholar]
  41. Štroner, M.; Urban, R.; Lidmila, M.; Kolár, V.; Kremen, T. Vegetation Filtering of a Steep Rugged Terrain: The Performance of Standard Algorithms and a Newly Proposed Workflow on an Example of a Railway Ledge. Remote Sens. 2021, 13, 3050. [Google Scholar] [CrossRef]
  42. Kuçak, R.A.; Büyüksalih, İ. Comparison of CSF Ground Filtering Method by Using Airborne LiDAR Data. Adv. LiDAR 2023, 3, 47–52. [Google Scholar]
  43. Sarıtaş, B.; Kaplan, G. Enhancing Ground Point Extraction in Airborne LiDAR Point Cloud Data Using the CSF Filter Algorithm. Adv. LiDAR 2023, 3, 53–61. [Google Scholar]
  44. Hollaus, M.; Mandlburger, G.; Pfeifer, N.; Mücke, W. Land Cover Dependent Derivation of Digital Surface models from Airborne Laser Scanning Data. IAPRS 2010, 38, 221–226. [Google Scholar]
Figure 1. Study area location.
Remotesensing 16 00078 g001
Figure 2. Flow chart of research methodology.
Remotesensing 16 00078 g002
Figure 3. Overview of ChPs distribution for LiDAR-UAS accuracy (a), DTM vertical accuracy assessment (b).
Remotesensing 16 00078 g003
Figure 4. Total station measurements of the ChPs marked with red dots for accuracy assessment of derived DTMs: long concrete pathway with steps (a), retaining concrete walls (b,c).
Remotesensing 16 00078 g004
Figure 5. Mission planning for the DJI Matrice 300 RTK equipped with a GeoSun GS-130X LiDAR sensor using UgCS v4.17 (2141) software, parameters, and flight itinerary for the (a) 60 m height and (b) 100 m height.
Remotesensing 16 00078 g005
Figure 6. (a) DJI Matrice 300 RTK UAS with GeoSun GS-130X LiDAR scanner. (b) Emlid Reach RS2 GNSS receiver, set as the base station for PPK processing.
Remotesensing 16 00078 g006
Figure 7. Processing of UAV-based laser scanning data.
Remotesensing 16 00078 g007
Figure 8. Flight trajectory computation: the GNSS dynamic single-point and differential positioning result for the 60 m height (a,b), the GNSS dynamic single-point and differential positioning result for the 100 m height (c,d).
Remotesensing 16 00078 g008
Figure 9. LiDAR-UAS point cloud strips acquired at (a) 60 m height (6 strips colored with different colors); (b) 100 m height (4 strips colored with different colors).
Remotesensing 16 00078 g009
Figure 10. Details of the (a) 60 m height and (b) 100 m LiDAR-UAS point cloud colored by intensity.
Remotesensing 16 00078 g010
Figure 11. Quality assessment of LiDAR-UAS point cloud: (a) detail with some ChPs (markers with purple dots and their corresponding assigned numbers) superimposed on the LiDAR-UAS mesh surface; (b) points measured with a total station (red color) superimposed on a shaded DSM.
Remotesensing 16 00078 g011
Figure 12. Quality assessment of LiDAR-UAS point cloud: (a) ChP ground marked with paint; (b) LiDAR-UAS point cloud colored by intensity for a ChP; (c) mesh surface created for a ChP point cloud.
Remotesensing 16 00078 g012
Figure 13. Quality assessment of LiDAR-UAS point cloud: (a) manually digitized rooftop edges based on the 60 m shaded DSM; (b) manually digitized rooftop edges based on 60 m UAS orthophoto; (c) superimposed digitized rooftop edges.
Remotesensing 16 00078 g013
Figure 14. Histogram of Hausdorff distances between ChP altitude and mesh-DSM based on LiDAR-UAS point cloud acquired at (a) 60 m flight height and (b) 100 m flight height.
Remotesensing 16 00078 g014
Figure 15. (a) Shading of the DSMrmp, (b) shading of the DSMmax, (c) σz raster (0.1 m cell size), (d) UAS orthophoto.
Remotesensing 16 00078 g015
Figure 16. DSM of the study area in raster format with 0.1 m cell size (60 m height) (a), DTM after applying volume-based filtering algorithm (b), DTM after applying volume-based filtering algorithm and morphological operation on the terrain mask (c).
Remotesensing 16 00078 g016
Figure 17. Details of non-ground points identified via volume-based morphological filter. Correctly identified elements: low, medium, and high vegetation; buildings; graves; and cars (a). Omission errors that involve the exclusion of part of a street and a sloping terrain surface (yellow ellipse) (b).
Remotesensing 16 00078 g017
Figure 18. Details of the mesh surface created based on ground points identified via hierarchic robust filtering and UAS images for two specific areas: a parking lot with a ~4 m high wall (a,c) and a ~1 m high wall and graves (b,d).
Remotesensing 16 00078 g018
Figure 19. Detailed views of slope map (first row) with corresponding mask of identified regions with slopes greater than 80% (second row).
Remotesensing 16 00078 g019
Figure 20. Detailed view of the shaded DTMs for a retaining wall and terraces with 0.1 m cell size (60 m flight: first rows) and DTMs with 0.2 m cell size (100 m flight: second rows): (a) orthophoto; (b) DTM hierarchic robust filtering; (c) DTM terrain mask; and (d) DTM combined approach.
Remotesensing 16 00078 g020
Figure 21. Detailed profiles (P1, P2, P3, P4, and P5) of LiDAR-UAS acquisition with corresponding extracted ground points (left column) and with DTM interpolated points (right column) for different retaining concrete walls. Here, on the vertical walls, the CSF algorithm does not identify any ground points. In profile P2, the grave contains points identified as “ground”. The location of the detailed profiles in the test area is shown in Figure A2 (Appendix C).
Remotesensing 16 00078 g021
Table 1. Summary of the LiDAR-UAS point clouds.
LiDAR-UAS Point CloudNo. of PointsDensity Points/sqm
60 m height39,287,325564
100 m height20,159,785300
Table 2. The residuals of the 33 ChPs marked with paint along the roads.
LiDAR-UAS Point CloudRMSEX
σ
(cm)
RMSEY
σ
(cm)
RMSEZ
σ
(cm)
RMSEX,Y
σ
(cm)
RMSETOT
σ
(cm)
60 m height3.3
3.3
3.5
2.9
2.2
1.4
4.8
2.0
5.3
2.0
100 m height5.0
4.9
4.2
3.7
3.7
2.2
6.5
3.0
7.5
2.8
Table 3. The residuals of the 64 points representing rooftop corners.
LiDAR-UAS Point CloudRMSEX
(cm)
RMSEY
(cm)
RMSEZ
(cm)
RMSEX,Y
(cm)
RMSETOT
(cm)
60 m height687.61012.6
100 m height8.211.41114.117.9
Table 4. Number of LiDAR-UAS ground points for the enhanced DTM.
No. of LiDAR-UAS Ground Points 60 m Heigh100 m Height
Hierarchic robust 17,814,70211,092,862
Morphological volume-based
(steep slopes only)
175,64188,681
Total (combined)17,990,34311,181,543
Table 5. Summary of the LiDAR-UAS ground points identified via different filtering approaches.
No. of Ground
Points
CSFVolume-Based FilterVolume-Based
Morphological Filter
Hierarchic Robust FilterProposed Method
60 m height19,844,31616,611,90015,300,11717,990,70217,990,343
100 m height11,713,85010,016,3329,071,90811,092,86211,181,543
Table 6. Vertical accuracy of derived DTMs based on 985 ChPs.
Filtering MethodAccuracy Metrics (m)
µMedianσRMSE
CSF
60 m−0.040.010.290.29
100 m−0.05−0.010.280.29
Volume-based morphological filter
60 m0.010.000.280.28
100 m−0.01−0.020.290.29
Hierarchic robust filter
60 m−0.020.010.250.25
100 m−0.04−0.010.250.25
Proposed method
60 m−0.000.010.160.15
100 m−0.02−0.010.180.18
Table 7. Advantages and disadvantages of the CSF, volume-based morphological, hierarchic robust filtering, and proposed methods (advantages are indicated with a tick, while disadvantages are indicated with a circle).
CSFVolume-Based Morphological FilterHierarchic Robust FilterProposed Method
Free of charge
Paid license
Paid license
Paid license
Fast processing
Longer computation time
Similar computation time to volume-based filter
Longer computation time (requires processing of both volume-based and hierarchic robust methods)
Sudden slope changes are not depicted
Sudden slope changes are depicted
Sudden slope changes are not depicted
Sudden slope changes are depicted
Points belonging to bare earth are misclassified as non-ground points
Points belonging to bare earth are correctly classified as non-ground points
Correctly identifies ground points, except for areas of steep slopes
Correctly identifies ground points
Reduced number of identified ground points
Reduced number of identified ground points because only points under the “terrain” mask are extracted (points under the tree canopy are not extracted)
Increased number of extracted ground points
Increased number of extracted ground points (more than hierarchic-robust-filter-identified points)
Missing ground points at steep slopes
Ground points close to the edges of very steep slopes are well identified
Ground points close to the edges of very steep slopes are not identified
Extracts ground points at steep slopes
Needs only 3 parameters
Requires more parameters
Multiple tests to find the suitable parameters
Fewer number of tests to find the suitable parameters
Objects with a low height compared to the ground (such as graves with a height of approximately 40 cm) are added to the Digital Terrain Model (commission errors)
Objects with a low height compared to the ground are correctly classified
Effective on many types of terrain
Points situated in the middle of roofs are misclassified as ground points
Correctly eliminates points belonging to buildings and roofs
DTM affected by interpolation effects due to large gaps
When generating the DTM, the interpolation method causes a smoothing effect of the terrain surface, thus not reflecting the real terrain
Resulting DTM characterized by smoothing effects at steep slopes, due to interpolation
DTM with improved quality
Disclaimer/Publisher’s Note: The statements, opinions and data contained in all publications are solely those of the individual author(s) and contributor(s) and not of MDPI and/or the editor(s). MDPI and/or the editor(s) disclaim responsibility for any injury to people or property resulting from any ideas, methods, instructions or products referred to in the content.

