Abstract
Synthetic Aperture Radar (SAR) imagery is significant in remote sensing, but the limited spatial resolution results in restricted detail and clarity. Current super-resolution methods confront challenges such as complex network structure, insufficient sensing capability, and difficulty extracting features with local and global dependencies. To address these challenges, DMSC-GAN, a SAR image super-resolution technique based on the c-GAN framework, is introduced in this study. The design objective of DMSC-GAN is to enhance the flexibility and controllability of the model by utilizing conditional inputs to modulate the generated image features. The method uses an encoder–decoder structure to construct a generator and introduces a feature extraction module that combines convolutional operations with Deformable Multi-Head Self-Attention (DMSA). This module can efficiently capture the features of objects of various shapes and extract important background information needed to recover complex image textures. In addition, a multi-scale feature extraction pyramid layer helps to capture image details at different scales. DMSC-GAN combines perceptual loss and feature matching loss and, with the enhanced dual-scale discriminator, successfully extracts features from SAR images for high-quality super-resolution reconstruction. Extensive experiments confirm the excellent performance of DMSC-GAN, which significantly improves the spatial resolution and visual quality of SAR images. This framework demonstrates strong capabilities and potential in advancing super-resolution techniques for SAR images.
1. Introduction
Synthetic Aperture Radar (SAR) is a remote sensing technology based on phased-array radar knowledge [1]. SAR generates Earth surface images by coherently processing radar platform motion and multiple radar echoes. SAR exhibits the advantages of all-day, all-weather imaging, making it widely applied and highly valuable in various fields such as agriculture, disaster management, and marine monitoring [2,3]. However, inherent constraints stemming from physical limitations and imaging parameters often impact SAR images, leading to undesirable consequences such as reduced spatial resolution. To surmount these limitations, advanced super-resolution (SR) techniques for SAR image enhancement have been pursued by researchers. These techniques aim to generate high-resolution images from low-resolution SAR images. The primary research objectives are to improve the spatial resolution of SAR images, enhance spatial details, and surpass the limitations imposed by imaging systems, thereby enhancing the visual quality of SAR images.
In the field of image SR, the task of Single-Image SR (SISR) [4] is regarded as complex and challenging to recover a high-resolution image from a single low-resolution image directly. This approach offers the advantage of efficiency. In practical scenarios, acquiring multiple SAR images of the same target from different angles proves challenging, thus leading to a primary focus on the SISR problem of SAR images. The mainstream SISR algorithms currently encompass interpolation-based, reconstruction-based, and learning-based methods, each characterized by distinct attributes, advantages, and limitations.
The earliest methods applied to SR tasks were interpolation-based models. These models utilize simple techniques such as bilinear interpolation [5], bicubic interpolation [6], or nearest-neighbor interpolation [7] to generate images. These methods offer fast computation by computing the relationships between neighboring pixels to determine the target pixel values. However, they fail to recover high-frequency details, often resulting in blurry output effectively. In response to the limitations of interpolation-based methods, reconstruction-based approaches emerged. These approaches primarily rely on statistical methods to determine pixel values by constructing statistical relationship equations between pixels. Examples of such approaches include maximum likelihood estimation [8] and Bayesian estimation [9], which provide a rational statistical framework for SR. In comparison to interpolation-based methods, reconstruction-based methods generally yield sharper images. However, these models exhibit higher computational complexity, sensitivity to model assumptions, and limited generalization capability.
Significant advancements have been achieved in SR tasks in recent years through using learning-based models, particularly those employing deep learning. SISR tasks have predominantly embraced deep learning models as a mainstream approach. Within the sphere of deep learning-based methods, three categories can be identified: convolutional neural network (CNN) [10], self-attention mechanism (transformer) [11], and Generative Adversarial Network (GAN) [12]. GAN is effectively applied for image generation by generating realistic data through a generative network and employing adversarial training of the discriminative network [13]. This enables the generator to learn the distribution of actual data progressively. By combining GAN with conditional learning, the development of a powerful deep learning model known as conditional Generative Adversarial Network (c-GAN) [14] was realized. By incorporating conditional information as the input, this model empowers the generator to produce high-resolution images corresponding to specific conditions [15], thus exhibiting considerable potential in the domain of SR tasks.
However, SAR image reconstruction algorithms have received comparatively less research attention, as most existing methods primarily concentrate on optical image SR. The direct application of optical image algorithms to SAR images is not considered ideal, potentially due to inadequate consideration of SAR image characteristics, such as speckle noise. Consequently, dedicated research addressing the specific features of SAR images is imperative. CNN-based methods have proven effective in extracting and utilizing the underlying spatial information of SAR images. For instance, Shen et al. [16] devised a PolSAR SR framework utilizing a residual CNN, surpassing traditional methods in objective evaluation metrics and subjective assessment. Smith et al. [17] introduced a novel algorithm that combines a CNN and a visual transformer (ViT), tailored explicitly for near-field SAR image SR. This hybrid approach integrates the strengths of both CNNs and ViTs, allowing simultaneous processing of local and global receptive fields, thereby enhancing the details of the generated images. In another approach, Yang et al. [18] enhanced the resolution of generated SAR images by employing an improved nonlocal mean (NLM) to suppress speckle noise and optimize the loss function based on the structural similarity index. The powerful generative method GAN has also found successful application in SAR image SR [19]. NFGAN [20] combines SAR image denoising and super-resolution reconstruction, effectively eliminating noise from super-resolution reconstructed images. These methods incorporate a perceptual loss function comprising adversarial and content loss. Even so, more research is needed into the in-depth exploration of loss functions, as the currently introduced loss functions are relatively simplistic. Additionally, the feature extraction networks employed in these studies may need to adequately extract features, which limits the improvement in generated image quality and hinders the generation of high-resolution SAR images that meet the standards of human visual perception.
Inspired by the image super-resolution algorithms, this study proposes DMSC-GAN, a SAR image super-resolution framework based on the conditional Generative Adversarial Network. This framework is carefully designed to cater to the requirements of SAR image super-resolution tasks, representing a significant advancement over the conventional c-GAN approach. The primary contributions of this paper include the following:
- (1)
- A unified conditional Generative Adversarial Network framework has been developed, integrating adversarial loss, perceptual loss, and feature matching loss. This study represents the first application of perceptual and feature-matching loss in SAR image SR tasks. Perceptual loss emphasizes high-level semantic information in images, enhancing the perceptual quality of the generated images compared to traditional pixel-level difference metrics. Feature matching loss preserves the structure and details of the target image, improving the ability to recover fine image details.
- (2)
- An encoder–decoder structure is adopted in the generator, enabling the generation of high-resolution images through feature extraction, feature reconstruction, and contextual information utilization. A feature extraction module and a multiscale feature extraction pyramid layer designed explicitly for SAR image SR are proposed. These components effectively capture details and structural information at various scales, enhancing the reconstructed image’s quality.
- (3)
- A network structure comprising five layers of dual-scale discriminators is constructed to discriminate images at different scales. Using dual-scale discriminators enhances the learning capability of the generator and contributes to improved training stability. Considering that SAR images are grayscale, relevant enhancements have been made to the discriminator’s output.
The remaining sections of this paper are structured as follows: Section 2 presents some closely related works. Section 3 outlines DMSC-GAN, comprehensively explaining the GAN framework and introducing different loss functions. In Section 4, the experimental results are presented, accompanied by quantitative and qualitative analyses. Section 5 concludes the paper by summarizing DMSC-GAN and discussing its implications.
2. Related Works
2.1. CNN-Based Methods
In recent years, notable advancements in SR algorithms based on CNN have been witnessed. The pioneering SRCNN [21] introduced the concept of an end-to-end network architecture, markedly enhancing the quality of generated high-resolution images beyond conventional interpolation methods and affirming the suitability of CNNs for SR tasks. Subsequently, more sophisticated models, exemplified by EDSR [22] and HSENET [23], have emerged, broadening the scope of CNN-based SR by incorporating deeper models and distinctive architectural choices, resulting in substantial enhancements in visual metrics.
For SAR images, WDCCN [24] employs a weighted, densely connected convolutional network, effectively enhancing image resolution. Zhan et al. [25] have introduced an adaptive line search strategy, redefining the step size in the reconstruction process, thereby improving super-resolution reconstruction effectiveness and the convergence speed for SAR images.
Despite the advancements in CNN-based SR algorithms, challenges persist. A primary concern is enhancing the interpretability of the generated high-resolution images. The intricate nature of deep CNN models poses challenges in comprehending the mapping relationship between low- and high-resolution images. Simultaneously, apprehensions arise regarding potential artifacts or unrealistic details introduced during the generation process, necessitating the resolution of issues related to substandard image quality.
2.2. Transformer-Based Methods
The utilization of the transformer architecture, initially prominent in natural language processing, has progressively extended its reach into the image processing domain. Researchers have increasingly recognized its effectiveness in modeling global features of images through the serialization of image data, marking a significant development in the field [26].
In the specific context of image SR tasks, recent research endeavors have concentrated on designing transformer-based models tailored for this purpose. One notable advancement is Lei et al. [27], introducing a multilevel enhancement structure. This architecture effectively integrates high- and low-dimensional features at multiple scales, facilitating the generation of high-frequency details and significantly enhancing the quality of super-resolved images.
Additionally, the SWINIR [28], proposed by Liang et al., has emerged as a robust baseline model for image SR tasks. SWINIR builds upon the Swin Transformer architecture. It leverages layered representations to capture global contextual information and local details, thereby bolstering the recovery of fine-grained image features. DTRN [29] is a Dual Transformer Residual Network that consists of a transformer branch and a CNN-based residual branch, where the transformer branch captures the global relationships of the feature map.
2.3. GAN-Based Methods
The demonstration of the pivotal role played by GAN in SR tasks is evident through the introduction of adversarial training mechanisms, which augment the fidelity of generated images through the competitive interaction between generators and discriminators. The foundational SRGAN [30] model, incorporating adversarial loss and perceptual loss, establishes a basis for generating high-quality super-resolution images. ESRGAN [31] further advances SR performance by incorporating residual dense blocks, while BSRGAN [32] considers image degradation models for practical applications and improved adaptation to natural scenes. The GCFSR [33] framework underscores a focus on perceptual loss and loss through adversarial loss to produce realistic facial details, emphasizing the potential of these losses in SR tasks.
C-GAN has demonstrated excellent image processing capabilities in various domains. The application of c-GAN to the semantic segmentation task by Wang et al. [34] resulted in enhanced performance through the collaborative action of the global generator and the local enhancement network, along with the integration of the PatchGAN discriminator and feature matching loss. Liu et al. [35] proposed CCWGAN, utilizing residual dense blocks to generate high-quality remote sensing images effectively. In the realm of MRI super-resolution, Nasser et al. [36] successfully elevated the performance of isotropic and anisotropic MRI super-resolution by incorporating perceptual loss and conditioning on low-resolution MRI images. Hanano et al. [37] achieved the improved generation of facial expression images by enhancing cGAN in combination with a self-supervised guided encoder. Drawing upon these methodologies, a DMSC-GAN is constructed in this study, utilizing an encoder–decoder structure and incorporating feature matching loss and perceptual loss. The framework includes two discriminators operating at distinct scales and conducting discrimination through 1 × 1 points. Through the integration of these components, the intended outcome is to proficiently steer the generation of high-resolution images, ultimately enhancing the accuracy and quality of the generated outcomes.
3. Methods
This section reveals the overall framework of DMSC-GAN, providing a comprehensive exposition of each module within the network. This encompasses an introductory overview of the generator and dual-scale discriminator modules, explaining their structures and functionalities. Following this, the employed loss function in this paper is presented for further examination.
3.1. Network Structure
3.1.1. General Framework
Existing SR algorithms primarily developed for optical images do not yield satisfactory results when directly applied to SAR image SR. In response to this limitation, a novel framework explicitly tailored for SAR image super-resolution based on the c-GAN architecture is introduced in this paper. Unlike non-GAN models that minimize the variance of mean square error for image reconstruction, resulting in smooth images with reduced high-frequency details, GAN-generated images have been shown to effectively enhance visual clarity [30]. The proposed model, DMSC-GAN, as depicted in Figure 1, comprises a generator with an encoder–decoder structure and two discriminators at different scales. In addition to generating the adversarial loss function, network training also uses perceptual loss and feature matching loss. The main steps of network training are as follows: prepare the dataset, initialize the parameters, set the loss function, create the generator generate super-resolution images using adversarial training, update the network parameters using gradient descent, iteratively train the generator and the discriminators until a satisfactory result is obtained, and finally use the generator to generate images. The experimental process is divided into two stages: the training stage, where the complete network model is trained, and the testing stage, where only the trained generator is utilized to generate target images.
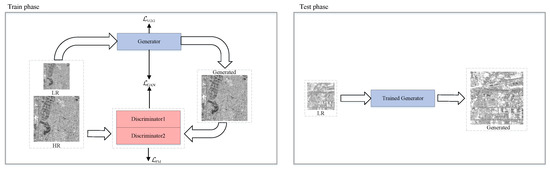
Figure 1.
The general framework of DMSC-GAN, including an enhanced feature extraction generator and discriminator at two different scales.
3.1.2. Generator
The proposed generator structure in this paper, as depicted in Figure 2, is based on an encoder–decoder architecture. The encoder is on the left side, while the decoder is on the right. To facilitate feature reuse, skip connections are introduced between the encoder and decoder. This encoder–decoder design enables hierarchical feature extraction of the input data, capturing abstract and high-level semantic features that are subsequently recombined by the decoder. The generator effectively preserves rich details and texture features by incorporating multi-scale feature information, thereby improving image reconstruction.
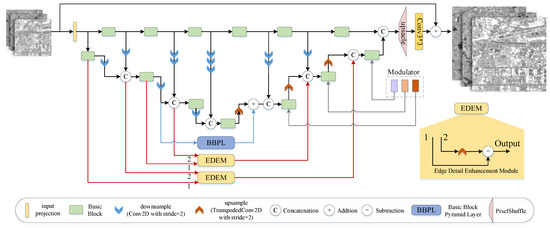
Figure 2.
Generator architecture.
The generator takes in low-resolution SAR images, denoted as , as input. Upon reading, the original SAR image, a single-channel grayscale image, is converted to RGB mode. This conversion does not introduce additional color information, as the grayscale image only possesses one color channel. Consequently, all three RGB channels become identical. The initial stage of feature extraction involves the utilization of convolution with the LeakyReLU activation function, leading to the extraction of feature maps . Subsequently, the features undergo mapping to higher dimensions through three encoder stages, where the channel numbers are doubled, and the feature sizes are halved at each stage. For instance, in the k-th stage of the encoder, the obtained features are represented as . Each encoder stage consists of the proposed Basic Blocks and downsampling modules. The number of downsampling modules is adjusted accordingly to ensure the consistency of feature sizes for the concatenated inputs. The upper-level feature extraction in each stage aims to capture features at different scales and complement the output features of the encoder.
At the end of the encoder, we incorporate a Basic Block module, which captures long-term dependencies between SAR images. Channel compression is employed to retain only the most relevant information for feature reconstruction, resulting in a decrease in the output dimension of the encoder and an improvement in the computational efficiency of subsequent decoding operations.
The decoder comprises three stages, each consisting of an upsampling module and a Basic Block module. The upsampling module employs transpose convolution with a kernel size of 2 and a stride of 2 for upsampling operations. As each upsampling layer is applied, the number of channels halves while the feature size doubles. The input for each stage is obtained by concatenating the upsampling output from the previous stage with the complementary features. Two Edge Detail Enhancement Modules (EDEMs) are devised, incorporating a design wherein the input of the first layer of the decoder is supplemented by the output of the first layer of the encoder, and the input of the second layer of the decoder is supplemented by the output of the second layer of the encoder. This approach facilitates the provision of additional edge features to the decoder. To leverage the multi-scale feature extraction operation, a Basic Block Pyramid Level (BBPL) module is constructed by altering the size of the attention window within the Basic Block. This block extracts depth features from the encoder’s twice-downsampled feature maps as complementary inputs to the decoder. We incorporate the modulator proposed in [38] into each decoder to improve the model’s generalization ability in handling different degradation patterns. The modulator is a randomly initialized position vector that enhances the model’s robustness against interference.
Following the three decoding stages, a size feature map is obtained. This feature map is then reshaped to match the target image resolution, denoted as , using Pixel Shuffle with an upsampling factor of s and a convolution. Afterward, the s-times bilinear interpolation result of the low-resolution image is added to R through a skip connection. This addition yields the reconstructed image , where . Introducing this skip connection mitigates the training challenges of the model and enables it to capture fine details more effectively in low-resolution images.
In image processing, transformers have been adapted in various forms. For instance, Uformer [38] is a U-shaped architecture designed specifically for image restoration tasks. It incorporates a locally enhanced window (LeWin) module, facilitating the simultaneous extraction of local information and contextual features. This architecture effectively reduces the computational complexity of the model. Building on this concept, Kulkarni et al. [39] proposed a novel algorithm called AIDTransformer for aerial image dehazing. They introduced Attentive Deformable Transformer Blocks, which combine attention mechanisms with deformable operations. This approach allows for the removal of haze from images while preserving essential textures.
Considering the remarkable ability of AIDTransformer to recover fine details and textures in dehazing, we have enhanced its fundamental module by introducing the Basic Block, illustrated in Figure 3. The Basic Block comprises two cascaded transformer structures and a convolutional layer (). This module overcomes the limitation of the original module by effectively modeling long-range dependencies in image processing. It captures global information while emphasizing local features. We have incorporated a skip connection that connects the input and output to address the challenges of training this module. The overall process can be summarized as follows:
where X denotes the input of the Basic Block, Y denotes the output of the Basic Block, P signifies the output of the first Feedforward Neural Network (FFN) after mapping with the residuals, Q denotes the output of the second FFN after mapping with the residuals, stands for patch embedded, and stands for patch unembedded.
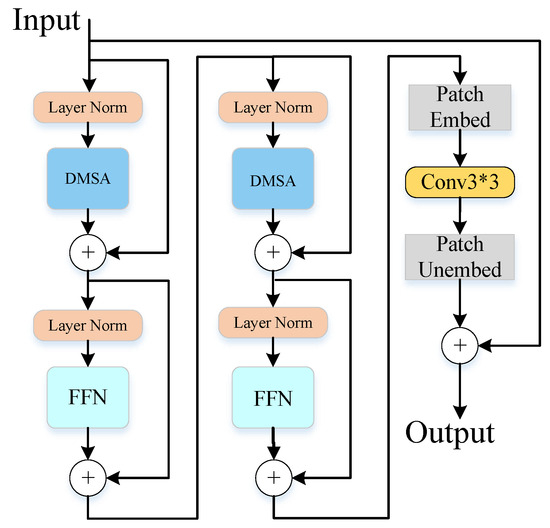
Figure 3.
Structure of Basic Block.
The feature extraction component in DMSC-GAN employs the deformable multi-head self-attention (DMSA) module proposed in AIDTransformer. This module utilizes a deformable multi-head attention mechanism to adapt to geometric variations within objects in the image and capture distinctive features of objects with different shapes. In our approach, we utilize the DMSA module as our feature extractor. The structure of DMSA is shown in Figure 4. SADC is a space-aware deformable convolution that focuses on the relevant image region by providing offsets associated with the texture. Furthermore, we incorporate an FFN consisting of three fully connected layers with the GELU activation function. To ensure normalization, LN is applied before each DMSA and feedforward network layer.
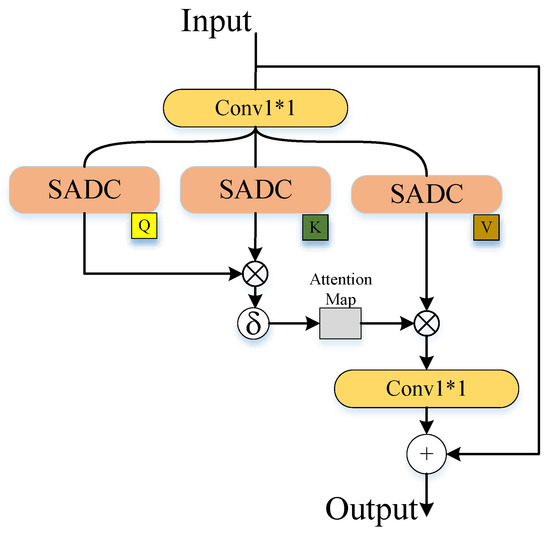
Figure 4.
Structure of DMSA.
The pyramid structure has proven to be a highly effective approach for multi-scale modeling in various tasks. However, there needs to be more research on applying pyramid structures in SAR image SR, particularly utilizing pyramid structures with varying window sizes. Kong et al. demonstrated the effectiveness of a pyramid structure with different window sizes in extracting feature information at different scales [40]. Building upon this motivation, we propose a Basic Block Pyramid Layer (BBPL) for SAR image SR, as illustrated in Figure 5. In order to encompass features of different scales, window sizes of 2, 4, and 8 are selected. SAR images contain varying features and smaller window sizes (e.g., 2) can effectively capture smaller-scale local details like textures and edges in the image. On the other hand, a larger window size (e.g., 8) enables the extraction of larger-scale global features, such as the overall structure and interrelationships among features. However, huge windows (e.g., 16) cause the model to overly rely on global context while disregarding local details, leading to a decline in performance. Moreover, using a larger window increases the training volume of the model and amplifies training difficulty.
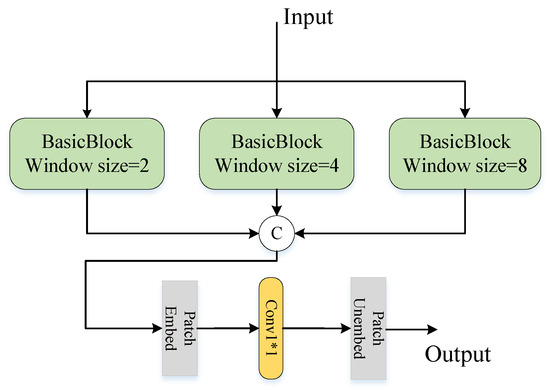
Figure 5.
Structure of BBPL.
BBPL comprises three Basic Blocks operating in parallel, each with a unique window size of 2, 4, and 8. To effectively integrate feature information from multiple scales, we employ a convolutional layer to merge the parallel features and reduce the number of channels. This merging process facilitates the extraction of essential image features while reducing the computational complexity of subsequent model operations. BBPL can be expressed as follows:
where represents a Basic Block with a window size of k, the input to each Basic Block is denoted as , and the output is denoted as .
To balance the network parameters and training speed, we introduce a BBPL module between the second layer of the encoder and the decoder. Placing it at the second layer is motivated by the fact that the first layer primarily captures coarse-grained information, while the third layer focuses on fine-grained details. There must be more than these two layers to effectively capture coarse and fine-grained features. However, the intermediate layer’s extracted features can effectively address this limitation. They encompass low-frequency and high-frequency details, making them valuable for subsequent feature reconstruction. By incorporating the BBPL module in the intermediate layer, we can utilize these features to extract coarse and fine-grained information from the image while maintaining low network parameters. This approach significantly enhances the image reconstruction performance.
The Edge Detail Enhancement Module (EDEM) is introduced to capture prominent edge details in SAR images, such as buildings and roads, which the Basic Block needs to learn effectively. The structure of EDEM, depicted in Figure 2, is applied between the encoder and the decoder’s first and second layers. EDEM takes two inputs: Input 1, the feature map extracted by the Basic Block without downsampling, and Input 2, the downsampled feature map with additional supplementary features incorporated. These two inputs represent feature maps at different scales, with Input 2 capturing richer edge detail features. To highlight the details in the edge regions and incorporate them into subsequent modules, we subtract the upsampled version of Feature Map 2 () from Feature Map 1 (), resulting in a feature map that specifically contains edge detail information (). This operation effectively enhances the model’s ability to reconstruct edge detail features. The representation of EDEM is as follows:
3.1.3. Discriminator
Designing a suitable discriminator for SAR image generation tasks presents a challenge due to the distinct characteristics of SAR images compared to other optical remote sensing images. SAR images are typically grayscale and encompass intense information and advanced features like polarization and phase, enabling sophisticated analysis and interpretation. Moreover, SAR images exhibit intricate texture details. Thus, to generate SAR images that are more realistic, it is essential to develop a discriminator that is carefully tailored to these unique attributes.
The PatchGAN architecture is commonly employed as a discriminator for optical image generation tasks. This approach entails designing the discriminator as a fully convolutional network that produces image patches as outputs. These patches are subsequently averaged to determine the discrimination outcome. However, due to the consistent content distribution in SAR images, employing patch-based discrimination may introduce redundancy. To address this issue, we propose an alternative discriminator design that utilizes a score-based approach.
In our specific discriminator design, the output is a single point with dimensions of . The loss calculation evaluates the generated image based on this single point. This design enables more effective discrimination of SAR images. Given the relatively uniform content distribution in SAR images, having the discriminator output a single point facilitates a comprehensive evaluation of the overall quality of the generated image, avoiding excessive local discrimination. By computing the loss for each point, we obtain a holistic quality assessment of the generated image, which guides the training of the generator.
We propose a multi-scale discriminator design to address the limitations of relying solely on a single point for discrimination in SAR image SR tasks. The multi-scale discriminator consists of two discriminators with the same structure but different input image scales. This design allows for more reliable discrimination information. The structure of the multi-scale discriminator is depicted in Figure 6. It is composed of a five-layer CNN serving as the backbone. The first layer comprises two convolutional layers with Rectified Linear Unit (ReLU) non-linear activation functions. The second and third layers consist of two batch normalization (BN) layers and convolutional layers with ReLU activation functions. The fourth layer comprises a single BN layer and a ReLU convolutional layer. The final layer is fully connected with pooling and ReLU activation functions. The size of the convolutional kernels in the discriminator is uniformly set to .
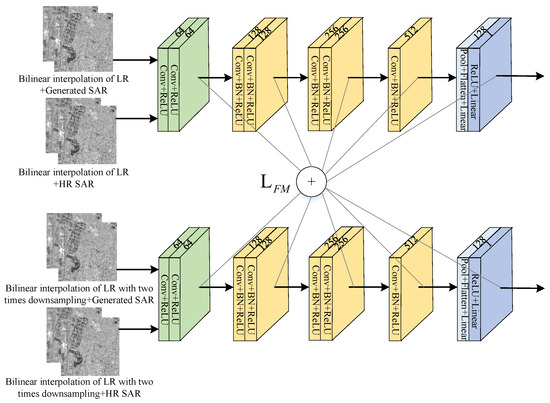
Figure 6.
Discriminators and feature matching loss.
Our discriminator operates in two input modes to enable effective discrimination between the generated SAR images and authentic high-resolution SAR images. In one mode, the upsampled result of the low-resolution SAR image is concatenated with the generated image. In contrast, in the other mode, it is concatenated with the actual image. To handle these two input scales, we employ two discriminators. The first discriminator discriminates the images corresponding to the generated images. The second discriminator focuses on the downsampled results: the images. Our design uses two discriminators to capture detailed texture information at the original scale and global features contributing to edge contour information. At each layer of the discriminator, we calculate the feature matching loss. This loss computation facilitates the alignment of the generator’s features with those of actual images, resulting in improved quality for the generated images. By incorporating feature matching loss at multiple layers, we encourage the generator to match the actual image features at different levels of abstraction, leading to a more realistic and visually pleasing output.
3.2. Loss Functions
3.2.1. Total Loss
In the entire framework of the Generative Adversarial Network, the total loss can be decomposed into three components:
where is the generation adversarial loss, is the VGG perceptual loss, and is the feature matching loss. These losses are combined using the weight coefficients and in a balanced loss function. The subsequent explanation will provide a detailed formulation and description of these losses.
3.2.2. Generate Adversarial Loss
Two discriminators are utilized in this study to assess the images at both the original scale and the downsampled scale. As a result, the adversarial loss comprises two components: the adversarial loss between the generator and the first discriminator, which discriminates images at the original scale, and the adversarial loss between the generator and the second discriminator, which operates at the downsampled scale. The formulation of the multi-adversarial loss for the generator network is expressed as follows:
The low-resolution SAR image is denoted as x, the upsampled version of x using bilinear interpolation is represented as , and the generator’s output, which is the SR image, is denoted as . The discriminators at the two scales are denoted as and , corresponding to the original and downsampled scales, respectively. The low-resolution SAR image contains comprehensive information, and the upsampled low-resolution SAR image concatenation with the image under discrimination is performed. This combined input is provided to the discriminators, allowing them to leverage the valuable reference information embedded in the low-resolution SAR image, thus facilitating accurate judgments by the discriminators.
Like conventional SR networks, our generator network also incorporates content loss to guide the generation process. By prioritizing the image’s content over the sole pursuit of generating a realistic image, the generator can reduce potential artifacts and distortion effects, resulting in a more realistic and natural appearance of the generated image. This content loss is calculated using the norm, which encourages the generator to produce images that closely resemble the target images.
Here, H and W denote the height and width of the images, respectively. The high-resolution image corresponding to the low-resolution SAR image x is denoted as y.
The utilization of multiple discriminators aids in capturing various aspects of the image and compensating for potential information loss associated with a single discriminator. The discriminator loss employed in our approach is formulated as follows:
Thus, the overall loss of our Generative Adversarial Network can be expressed as follows:
3.2.3. Perceptual Loss
The concept of perceptual loss was initially introduced in the domain of image style transfer by Johnson et al. [41]. They employed deep convolutional neural networks to calculate the perceptual loss, which quantifies the dissimilarity between generated and target images by comparing high-level visual features extracted from the network. Since then, perceptual loss has found successful applications in various tasks, including SR, as demonstrated in ESRGAN [31]. By incorporating perceptual loss, we aim to ensure visual coherence between the generated images and the desired high-resolution SAR images. Although the utilization of perceptual loss in SAR image SR has been limited, in this study, we leverage its potential to provide enhanced guidance for texture restoration. The formulation of perceptual loss is as follows:
where denotes the VGG19 network, represents the i-th layer of the network, and denotes the size of the feature map at the i-th layer. To compute the perceptual loss, we employ the loss to measure the discrepancies between the feature maps extracted from different layers of the VGG networks. This choice of loss function allows us to more accurately evaluate the similarity between the generated images and the target images, enabling a more effective assessment of their resemblance.
3.2.4. Feature Matching Loss
To tackle the challenge posed by the substantial disparity between high-resolution SAR images and their low-resolution counterparts, we employ the feature matching loss, initially introduced by Salimans et al. [42], to guide the network in reconstructing more accurate details. The feature matching loss involves calculating the weighted sum of the output features from each layer of the discriminator. It quantifies the statistical distinctions between the feature vectors extracted from the high-resolution SAR images and those from the generated SAR images. By minimizing the feature matching loss of the discriminator, the generator is encouraged to produce images that exhibit a higher level of similarity to the high-resolution SAR images. The utilization of the feature matching loss in both discriminators can be observed in Figure 6, and its formulation is expressed as follows:
In the above equation, represents the i-th layer of the k-th discriminator, represents the number of elements in the feature map of the i-th layer, and T denotes the total number of layers in the discriminator, where T is set to 5 in our specific discriminator. The feature matching loss plays a crucial role in stabilizing the model’s training process and ensuring that the generated SR SAR images capture the desired high-level features in the high-resolution SAR images. By incorporating the feature matching loss, we can effectively enhance the quality of the generated images.
4. Results
4.1. Dataset and Parameter Settings
The SEN1-2 dataset [43], which consists of SAR and optical images acquired from the Sentinel-1 and Sentinel-2 satellites, was utilized in this study. The dataset is accessible through the link https://mediatum.ub.tum.de/1436631 (accessed on 25 March 2023). With a spatial resolution of 5 m, the dataset is commonly employed in image fusion applications. The SAR images from this dataset were specifically selected for our experimental objectives.
The initial step of the data preprocessing involves cropping the SAR images to dimensions of pixels. We manually excluded regions exhibiting evident duplication or significant issues to ensure the dataset’s quality. Data augmentation techniques, including rotation and mirroring, are applied to augment the dataset. To generate the required low-resolution SAR images for input to DMSC-GAN, we downsample the high-resolution SAR images using bilinear interpolation. For instance, if the upscaling factor is 2, we perform a downsampling by a factor of two, resulting in low-resolution images of size . Similarly, for an upscaling factor of 4, downsampling by a factor of four yields low-resolution images of size . The training dataset comprises pairs of low-resolution SAR images and their corresponding high-resolution SAR images. We have carefully selected 5696 image pairs for training and 824 for testing. In the generator network, the input is the low-resolution SAR image, and the output is a image. For the discriminator, the input is formed by concatenating the high-resolution SAR image or the generator’s output with the bilinearly upsampled version of the low-resolution SAR image, resulting in images of size .
To further showcase the effectiveness of DMSC-GAN, a selection was made of a SAR image dataset of Nanjing, Jiangsu Province, in this study. The dataset comprised images acquired by the RADARSAT-2 satellite, boasting a resolution of 5 m. These images underwent preprocessing and were subsequently cropped to 256 × 256. A random sample of 1664 image pairs was chosen for testing purposes, while the training phase utilized a set of 9952 pairs. Comparatively, the Nanjing dataset served as an auxiliary collection, strictly employed for network structure comparisons, while exclusively, the SEN1-2 dataset was utilized for other experiments.
The training process is conducted with the following parameter settings: a batch size of 8, a total of 100 epochs, and utilizing the Adam optimizer. The initial learning rate is . After 50 iterations, the learning rate is halved. The coefficients and in the total loss are set to 20, which are determined empirically. The implementation of the entire network is executed using the PyTorch framework version 1.12.1. The experiments are carried out on two Micro-Star NVIDIA GeForce GTX 3080Ti graphics cards sourced from Taiwan, China.
4.2. Valuable Metrics
To address the limitation of prioritizing pixel-level differences over perceived quality in PSNR [44] and SSIM [45], alternative metrics such as MSE [46], FID [47], and LPIPS [48] have been introduced, which enhance the generation of visually pleasing and realistic SR images during GAN training. The selection of objective metrics aims to mitigate potential inaccuracies arising from subjective evaluation when assessing the quality of the generated SR images. MSE quantifies the mean squared difference between the generated and target images, ensuring proximity in terms of pixel values. Perceived similarity, evaluated by LPIPS, considers higher-level features such as edges, texture, and overall appearance, yielding a more meaningful metric from a perceptual standpoint. On the other hand, FID employs the Inception network to assess the feature representations of the generated and authentic images, encompassing both quality and diversity aspects and offering a metric applicable to generators.
4.3. Results and Analysis
4.3.1. Different Networks Analysis
SEN1–2 dataset. In order to assess the superior performance of DMSC-GAN in SAR image SR, a comparative study was conducted, evaluating it against traditional convolutional neural network methods, including HSENET, SWINIR with transformer architecture, supervised SRGAN, unsupervised CycleGAN [49] and Pix2pixHD [34]. The experimental results for these six methods, considering an upscaling factor of 4, are summarized in Table 1.

Table 1.
Comparison of metric results of different methods on SEN1-2 dataset with scale factor 4.
Based on the compared methods, SWINIR has the fewest parameters, allowing it to construct a global model by leveraging pixel relationships and achieve faster execution during reconstruction. In contrast, HSENET combines multi-scale and self-similarity feature extraction techniques to exploit the inherent self-similarity of images. However, due to multiple repetitive modules, HSENET has more parameters than SWINIR. Non-GAN methods, compared to GAN-based models, demonstrate faster execution speeds. CycleGAN has the highest number of parameters, primarily due to its utilization of two generators and two discriminators. In comparison to SRGAN and CycleGAN, DMSC-GAN falls in between the two in terms of the number of parameters and is less than pix2pixHD. DMSC-GAN incorporates a deeper generator and includes two discriminators, resulting in a larger network parameter count. Nevertheless, this design choice also contributes to the improved quality of the generated images.
DMSC-GAN achieves the second-highest scores in terms of PSNR and SSIM, slightly below SWINIR. However, it surpasses all other methods in the remaining three metrics. The FID score reached 24.52293, and the LPIPS score was 0.304919. These results indicate a significant improvement of 13.85138 and 0.064353, respectively, compared to the second-best SRGAN. Additionally, DMSC-GAN outperforms both supervised SRGAN and unsupervised CycleGAN in all five metrics. Compared with pix2pixHD, DMSC-GAN exhibits significant improvements, including a substantial PSNR increase of 3.40498 dB, an SSIM improvement of 0.361916, a reduced MSE of 0.044, a substantial FID improvement of 133.80897, and a decreased LPIPS by 0.141204. Notably, DMSC-GAN excels in improving the FID and LPIPS scores compared to non-GAN models while demonstrating overall enhancements across all five metrics compared to GAN models.
Figure 7 displays the generated images from various models. The images demonstrate that the results produced by DMSC-GAN closely resemble the original high-resolution SAR images, significantly improving the quality of the generated images. Upon visual inspection, the image outcomes produced by pix2pixHD are deemed unsatisfactory. The underlying issue is attributed to the fact that the pix2pixHD model was initially tailored for image segmentation tasks, and its network structure and loss function were not specifically optimized and enhanced for image SR. In contrast, except for the pix2pixHD model, when non-GAN networks are employed, the resultant images exhibit blurriness, whereas GAN networks yield images of greater explicitness. The reason behind this disparity lies in the optimization process of non-GAN models, which focuses on minimizing the pixel-level MSE between the generated and target images. Consequently, non-GAN models produce overly smooth SAR images that lack fine-grained details and appear blurry. On the other hand, GAN-based models excel in recovering consistent regions such as water bodies but struggle with non-consistent regions like buildings, where they fail to capture fine edges and texture details, resulting in spurious noise and inadequate restoration of architectural details. In contrast, DMSC-GAN generates images with clear boundaries and improved visual quality. The observations from Table 1 corroborate these findings, as non-GAN models achieve higher PSNR and SSIM scores. However, it is essential to note that high PSNR and SSIM scores do not guarantee good image quality. Hence, PSNR and SSIM should not be considered as the primary evaluation metrics for SAR image SR, as they lack sensitivity to blurriness. Instead, the FID and LPIPS metrics provide a more comprehensive evaluation of the generated images, as they align more closely with human visual perception. DMSC-GAN effectively addresses the task of SAR image SR and successfully enhances the resolution of complex urban structures, resulting in more explicit images. In summary, DMSC-GAN effectively enhances resolution in SAR images and reconstructs complex urban areas into more precise and visually appealing images.
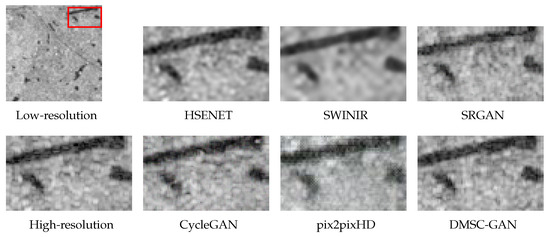
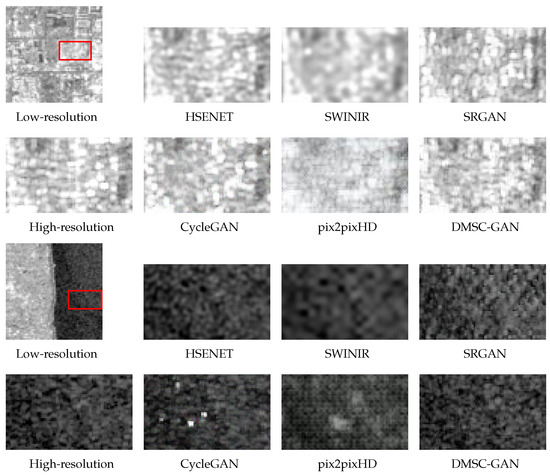
Figure 7.
Comparison of super-resolution methods for SAR images on the SEN1-2 dataset with scale factor 4. The images encompass distinct categories such as land, water, and buildings. The images in each set of examples are magnified representations of the corresponding red boxes in low-resolution.
Experiments were conducted with an upscaling factor of 2, and the results are presented in Table 2 and Figure 8. The images from different methods show relatively small visual differences, indicating that all methods can recover edge and texture details in SAR images. This can be attributed to the richer texture features obtained through upsampling the low-resolution SAR images at a factor of 2, reducing the reconstruction task’s difficulty. Among the networks, SWINIR achieves the highest PSNR and SSIM scores. In comparison, DMSC-GAN demonstrates a reduction in FID by 9.7626195 and a decrease in LPIPS by −0.230057 compared to SWINIR. Additionally, DMSC-GAN shows improvements in all evaluation metrics except LPIPS compared to SRGA, pix2pixHD and CycleGAN. From Figure 8, it can be observed that DMSC-GAN successfully reconstructs small water bodies and buildings with precise edges and texture details while generating fewer additional spurious noises. However, it may need help recovering fine-grained road details due to resolution limitations.
Table 2.
Comparison of metric results of different methods on SEN1-2 dataset with scale factor 2.
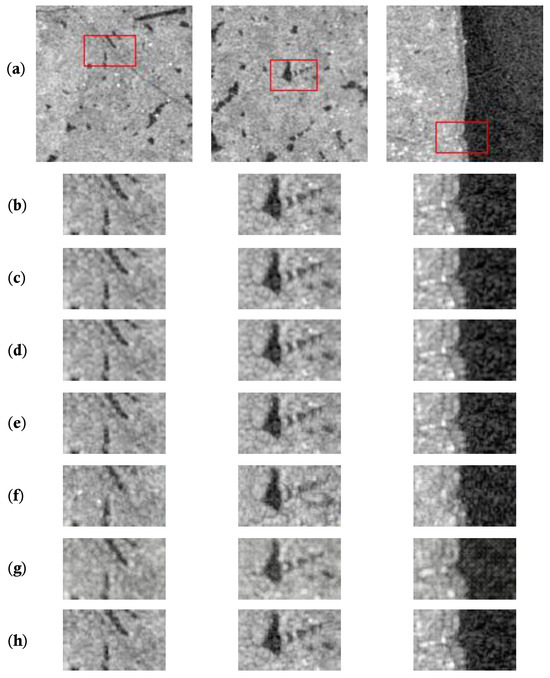
Figure 8.
Comparison of super-resolution methods for SAR images on the SEN1-2 dataset with scale factor 2. From top to bottom, (a) low-resolution SAR images, (b) high-resolution SAR images, (c) HSENET [23], (d) SWINIR [28], (e) SRGAN [30], (f) CycleGAN [49], (g) pix2pixHD [34], and (h) DMSC-GAN. The images in each set of examples are magnified representations of the corresponding red boxes in low-resolution.
The Nanjing dataset served as an additional dataset in this study, allowing for a supplementary evaluation. The approach’s effectiveness was further substantiated by comparing the performances of HSENET, SWINIR, SRGAN, CycleGAN, and pix2pixHD on the Nanjing dataset. Experiments were conducted with upscaling factors of 4 and 2.
For the upscaling factor of 4, superior image quality was attained with DMSC-GAN, as exemplified in Figure 9 and Table 3, in which both FID and LPIPS reached their optimal values of 18.076831 and 0.302789, respectively. In contrast, SWINIR outperformed DMSC-GAN in the remaining three metrics; however, the images generated by SWINIR exhibited blurriness and lacked the precision of DMSC-GAN. This blurriness arises from SWINIR’s utilization of pixel-level loss functions, such as MSE, which necessitates a comparison of every pixel between the generated and target images. Such a noise-sensitive loss function tends to yield smoothed and blurred images. Additionally, compared to the methods pix2pixHD, CycleGAN, and SRGAN, DMSC-GAN consistently outperformed across all five metrics.
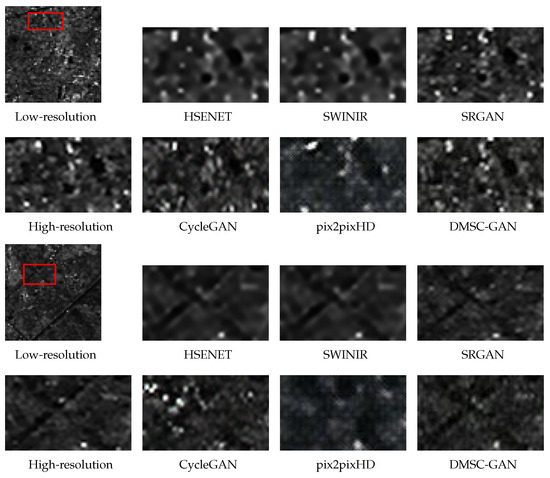
Figure 9.
Comparison of super-resolution methods for SAR images on the Nanjing dataset with scale factor 4. The images in each set of examples are magnified representations of the corresponding red boxes in low-resolution.
Table 3.
Comparison of metric results of different methods on Nanjing dataset with scale factor 4.
For the upscaling factor of 2, Figure 10 and Table 4 revealed that the metrics of images generated by HSENET and SWINIR were slightly superior to those of DMSC-GAN, although the differences were insignificant. Additionally, there were no noticeable distinctions in the generated images. However, compared to CycleGAN and SRGAN, DMSC-GAN consistently demonstrated optimal metrics and produced the most explicit images. These methods generally recovered intricate image features at an upscaling factor of 2, with minimal discrepancies in the generated images. This phenomenon can be attributed to the reduced reconstruction complexity at this upscaling factor.
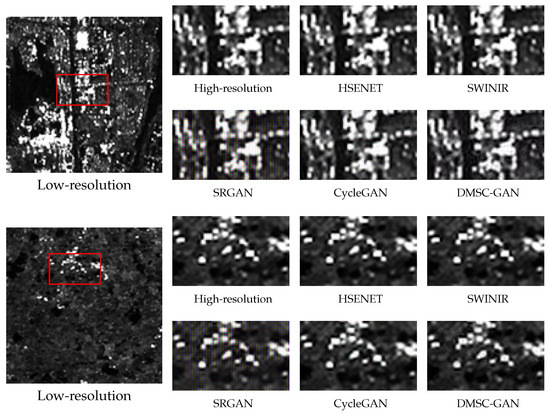
Figure 10.
Comparison of super-resolution methods for SAR images on the Nanjing dataset with scale factor 2. The images in each set of examples are magnified representations of the corresponding red boxes in low-resolution.
Table 4.
Comparison of metric results of different methods on Nanjing dataset with scale factor 2.
In summary, the experiments involving the SEN1-2 and Nanjing datasets affirmed the outstanding performance of DMSC-GAN across diverse datasets. DMSC-GAN significantly improved the quality of generated images compared to alternative methods, reinforcing its effectiveness.
4.3.2. Generator Ablation Analysis
In the previous section, the effectiveness of DMSC-GAN was demonstrated, as it achieved the best results on the dataset. To further validate the effectiveness of the components in the generator, an ablation study was conducted by generating images using only the generator without the discriminator. Specifically, the contributions of the Basic Block and BBPL modules were discussed. The impact of including convolutions in the Basic Block, the convolutional kernel size, and the number of DMSA modules used were investigated. The experimental results are presented in Table 5. From the third and fourth rows of the table, it is observed that including convolutional operations improved the PSNR by 0.18013 dB and SSIM by 0.010325 compared to not including convolutions. This indicates that including convolutions effectively enhances the quality of SAR image generation by assisting the generator in learning local features. Comparing the first and second rows of the table, it can be seen that the size of the convolutional kernel also influences the quality of the generated images. SAR images generated with a kernel in the Basic Block showed an improvement of 5.786666 in FID compared to a kernel, suggesting that using a kernel has a more significant impact. Furthermore, comparing the second and third rows of the table, the impact of the number of DMSA modules on the generator’s performance was examined. It is observed that using two DMSA modules outperformed using a single DMSA, with an increase of 0.15536 dB in PSNR and 2.545298 improvement in FID. This is because a single DMSA can only extract shallow-level global features while using two DMSA modules enables the extraction of deeper-level high-frequency detail features, which is beneficial for SAR image SR reconstruction. Figure 11 presents the results of incorporating Basic Block modules with different structures.
Table 5.
Metrics comparison after removing the discriminator and improving the Basic Block in the generator.
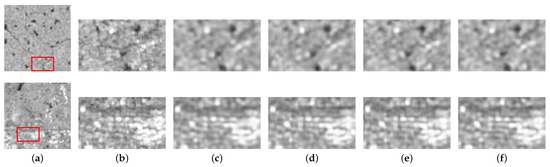
Figure 11.
Comparison after removing discriminator and improving the Basic Block in generator. From left to right, (a) low-resolution SAR images, (b) high-resolution SAR images, (c) 1 DMSA and convolution kernel for 1, (d) 1 DMSA and convolution kernel for 3, (e) 2 DMSA and convolution kernel for 3, (f) 2 DMSA and no convolution added. The images in each set of examples are magnified representations of the corresponding red boxes in low-resolution.
An ablation study was conducted on the BBPL module to examine the influence of the number of parallel Basic Block branches. The experimental outcomes are presented in Table 6. For the experiments, the branch with one parallel Basic Block had a window size of 2, the branch with two parallel Basic Blocks had window sizes of 2 and 4, and the branch with three parallel Basic Blocks had window sizes of 2, 4, and 8. It can be observed from the table that the best results were obtained when three parallel branches were utilized. Conversely, the performance was the lowest when only one parallel branch was employed. When comparing three branches to one branch, the PSNR improved by 0.10685 dB and the FID by 2.87843. Figure 12 showcases the generated outcomes from the experiments. Combining the figures and the table validates that integrating parallel branches and varying the computational window size enables the capture of feature information at different scales, thereby effectively enhancing the quality of the generated images.
Table 6.
Metrics comparison after removing discriminator and improving BBPL in the generator.
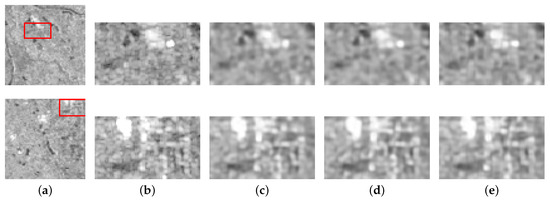
Figure 12.
Comparison after removing discriminator and improving BBPL in generator. From left to right, (a) low-resolution SAR images, (b) high-resolution SAR images, (c) 1 window, (d) 2 window, (e) 3 window. The images in each set of examples are magnified representations of the corresponding red boxes in low-resolution.
4.3.3. Discriminator Ablation Analysis
An ablation study was executed to evaluate the impact of the discriminator in the network, considering variations in the number of discriminators and the discriminative approach at the end of the discriminator. The experimental outcomes are outlined in Table 7. “Patch GAN D1” signifies the utilization of a single Patch GAN for discrimination, employing the discriminative network from [40], where the discriminator generated a -dimensional vector as output. In contrast, “Patch GAN D2” indicates the utilization of two Patch GANs. Similarly, “DMSC-GAN D1_nF” and “DMSC-GAN D2_nF” represent the use of one or two DMSC-GAN discriminators, excluding the last fully connected layer responsible for discriminating the feature vectors. Meanwhile, “DMSC-GAN D1_F” and “DMSC-GAN D2_F” denote the utilization of a single or two DMSC-GAN discriminators, including the last fully connected layer, with the discriminator outputting a -dimensional score. From rows 1–2, it is evident that the image quality reconstructed using two discriminators is significantly superior to that obtained with a single discriminator. The FID and LPIPS improved by 118.10154 and 0.02489, respectively. Figure 13 further illustrates that when using a single discriminator, the reconstructed generated images appear more blurred, and there are noticeable artifacts in some regions due to misjudgment. Rows 3–4 indicate that when employing our proposed discriminator without utilizing a -dimensional score for discrimination, there is little distinction between using one and two discriminators. The reconstruction performance is similar in both cases. From rows 4–5, it can be observed that when the discriminator incorporates a fully connected network and employs a -dimensional score for discrimination, the performance of two discriminators surpasses that of a single discriminator. Notably, all five indicators exhibit the best results in this case, affirming the effectiveness of the proposed multi-scale discriminator and the utilization of a -dimensional output vector for discrimination.
Table 7.
Metrics comparison after improving discriminator.
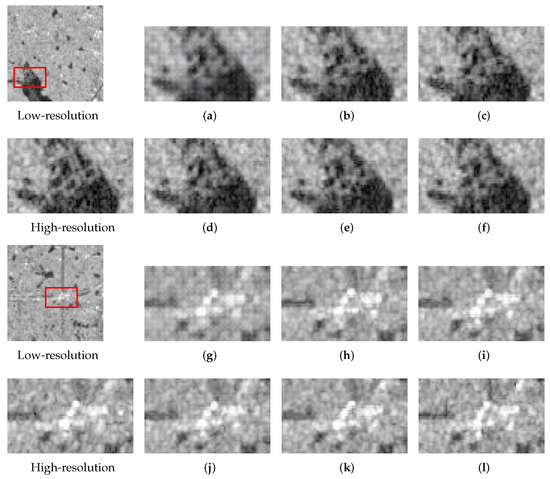
Figure 13.
Comparison after improving discriminator. (a–f) and (g–l) generated results for rows 1–6 in the corresponding Table 7. The images in each set of examples are magnified representations of the corresponding red boxes in low-resolution.
4.3.4. Loss Function Analysis
In order to investigate the impact of diverse loss functions on the network’s performance, the network underwent training employing a range of loss functions, and the results are displayed in Table 8 and Figure 14. In the table, “w/o feat” denotes the exclusion of the feature matching loss, “w/o vgg” indicates the omission of the perceptual loss, and “w/feat&vgg” signifies the utilization of both losses concurrently. The results reveal that feature matching and perceptual loss significantly impact the network’s performance. Compared to using both losses simultaneously, excluding the feature-matching loss results in a decrease of 5.57363 in FID and 1.6321 dB in PSNR. Omitting the perceptual loss leads to a decrease of 2.35678 in FID and a decrease of 0.87492 dB in PSNR. The figure shows that the accuracy of the generated features, such as roads and waters, is improved, and the image recovery with the incorporation of both losses exhibits enhanced clarity and quality simultaneously. These findings demonstrate that both losses play crucial roles in the network and are indispensable. It highlights the effectiveness of incorporating feature matching loss and perceptual loss in DMSC-GAN.
Table 8.
Metrics comparison under different loss functions.
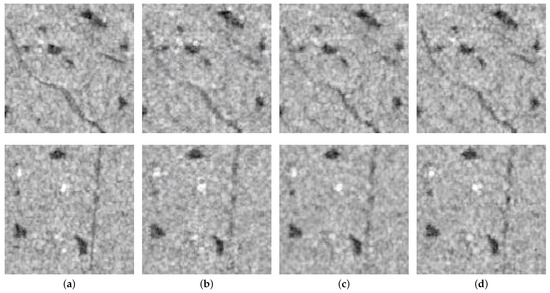
Figure 14.
Comparison under different loss functions. (a) High-resolution SAR images, (b) no feature matching loss, (c) no VGG loss, and (d) with feature matching loss and VGG loss.
The network’s performance was assessed through experiments to investigate the impact of weighting coefficients on the loss function. Table 9 displays the results, indicating varying degrees of influence based on the changes in these coefficients. The network performs poorly when both coefficients are set to 0, resulting in an FID index of 146.7726, an LPIPS index of 0.43851, and the generated image appearing blurred with low clarity. However, setting the coefficients to 5 and 5 improves the network’s performance with a PSNR metric of 23.626, an SSIM metric of 0.53151, and a decreased MSE metric of 0.09887. A slight decrease in performance is observed when setting the coefficients to 5 and 10, with a PSNR metric of 23.36392, an SSIM metric of 0.52065, and the network’s performance is comparable to the prior experiments. Similarly, when the coefficients are set to 10 and 5, the PSNR metric is 23.28437, the SSIM metric is 0.52063, and the MSE metric is 0.10266. Setting both coefficients to 10 improves the network’s performance, achieving a PSNR metric of 23.89908, an SSIM metric of 0.55937, and a reduced MSE metric of 0.09565. Slight performance drops are observed when the coefficients are set to 0 and 20, resulting in a PSNR metric of 23.50430, an SSIM metric of 0.52821, and an MSE metric of 0.10013. Likewise, setting the coefficients to 20 and 0 leads to a PSNR metric of 22.74712, an SSIM metric of 0.48423, and an MSE metric of 0.10923. Optimal network performance occurs when both coefficients are set to 20, resulting in a PSNR metric of 24.37922, an SSIM metric of 0.58299, a minimum MSE metric of 0.09051, a minimum FID metric of 24.52293, and a minimum LPIPS metric of 0.30492. Compared to setting both coefficients to 0, this results in a PSNR improvement of 1.20716 dB and a substantial FID improvement of 122.24967. However, the network performance gradually deteriorates when both coefficients are set to 30 or 40. The PSNR metric drops to less than 23 dB, the SSIM metric falls below 0.55, and the FID metric exceeds 25. These findings demonstrate that empirically optimizing the weighting coefficients significantly impacts network performance.
Table 9.
Metrics comparison under different weighting coefficients of the loss function.
5. Conclusions
In this study, DMSC-GAN is proposed for SAR image super-resolution. The generator module follows an encoder–decoder architecture, incorporating convolutional operations and DMSA to extract informative features. A multi-scale feature extraction pyramid is created using varying window sizes to capture features at different scales. The discriminator is enhanced by employing two discriminators to assess inputs at different scales to enhance discriminative capability. Perceptual loss and feature matching loss are introduced to provide more comprehensive feedback to the generator from the discriminator. The superiority of DMSC-GAN in terms of performance metrics compared to the SRGAN method is demonstrated through the analysis of research experiment results. Specifically, a significant improvement of 3.4196 dB in PSNR and 0.1889 in SSIM on the SEN1-2 dataset was observed with DMSC-GAN. Additionally, there was a substantial increase of 13.85 in the FID score. These enhancements vividly capture the effectiveness of DMSC-GAN in elevating the quality and fidelity of the generated SAR images, surpassing the capabilities of the SRGAN method. Hence, the experimental findings affirm the approach’s feasibility in accomplishing SAR image super-resolution tasks, notwithstanding certain limitations that necessitate further research and improvement. The following suggestions are recommended for future enhancements:
- (1)
- Improvement of the loss function: A SAR image super-resolution-specific loss function should be devised to optimize model training and attain superior results in super-resolution.
- (2)
- Reduction of model size: To expedite the model training process, lightweight modules designed explicitly for SAR image feature extraction should be developed, thereby augmenting the algorithm’s real-time capabilities and computational efficiency.
- (3)
- Data augmentation and small-sample learning: Given the limited availability of SAR image data, exploring data augmentation techniques to expand the training set is warranted. Furthermore, investigating small-sample learning methods can facilitate improved handling of the limited image quantity.
- (4)
- Multi-domain learning: The training set should encompass diverse SAR images, incorporating different polarization modes and resolutions to enhance the model’s generalization ability.
Author Contributions
Conceptualization, Y.K. and S.L.; methodology, S.L.; validation, Y.K. and S.L.; formal analysis, Y.K.; investigation, S.L.; writing—review and editing, S.L.; supervision, Y.K.; funding acquisition, Y.K. All authors have read and agreed to the published version of the manuscript.
Funding
This research was funded by the National Natural Science Foundation of China (No. 62171220); Natural Science Foundation of Jiangsu (No. BK20140825); Aeronautical Science Foundation of China (No. 20182052012); Basic Research (No. NS2021030); National Science and Technology Major Project (2017-II-0001-0017); and Program of Remote Sensing Intelligent Monitoring and Emergency Services for Regional Security Elements.
Institutional Review Board Statement
Not applicable.
Informed Consent Statement
Not applicable.
Data Availability Statement
The data presented in this study are available on request from the corresponding author. The data are not publicly available due to privacy.
Conflicts of Interest
The authors declare no conflict of interest.
References
- Curlander, J.C.; McDonough, R.N. Synthetic Aperture Radar; Wiley: New York, NY, USA, 1991; Volume 11. [Google Scholar]
- Sun, Z.; Leng, X.; Lei, Y.; Xiong, B.; Ji, K.; Kuang, G. BiFA-YOLO: A Novel YOLO-Based Method for Arbitrary-Oriented Ship Detection in High-Resolution SAR Images. Remote Sens. 2021, 13, 4209. [Google Scholar] [CrossRef]
- Sun, Z.; Dai, M.; Leng, X.; Lei, Y.; Xiong, B.; Ji, K.; Kuang, G. An Anchor-Free Detection Method for Ship Targets in High-Resolution SAR Images. IEEE J. Sel. Top. Appl. Earth Obs. Remote Sens. 2021, 14, 7799–7816. [Google Scholar] [CrossRef]
- Yang, W.; Zhang, X.; Tian, Y.; Wang, W.; Xue, J.H.; Liao, Q. Deep Learning for Single Image Super-Resolution: A Brief Review. Trans. Multimed. 2019, 21, 3106–3121. [Google Scholar] [CrossRef]
- Tong, C.; Leung, K. Super-resolution reconstruction based on linear interpolation of wavelet coefficients. Multidimens. Syst. Signal Process. 2007, 18, 153–171. [Google Scholar] [CrossRef]
- Liu, J.; Gan, Z.; Zhu, X. Directional bicubic interpolation—A new method of image super-resolution. In Proceedings of the 3rd International Conference on Multimedia Technology (ICMT-13), Guangzhou, China, 29 November–1 December 2013; Atlantis Press: Amsterdam, The Netherlands, 2013; pp. 463–470. [Google Scholar]
- Chang, H.; Yeung, D.Y.; Xiong, Y. Super-resolution through neighbor embedding. In Proceedings of the 2004 IEEE Computer Society Conference on Computer Vision and Pattern Recognition, Washington, DC, USA, 27 June–2 July 2004; Volume 1, p. 1. [Google Scholar]
- Conchello, J.A. Superresolution and convergence properties of the expectation-maximization algorithm for maximum-likelihood deconvolution of incoherent images. J. Opt. Soc. Am. A Opt. Image Sci. Vis. 1998, 15, 2609–2619. [Google Scholar] [CrossRef] [PubMed]
- Zheng, W.; Deng, F.; Mo, S.; Jin, X.; Qu, Y.; Zhou, J.; Zou, R.; Shuai, J.; Xie, Z.; Long, S.; et al. Image super-resolution reconstruction algorithm based on Bayesian theory. In Proceedings of the 2018 13th IEEE Conference on Industrial Electronics and Applications (ICIEA), Wuhan, China, 31 May–2 June 2018; pp. 1934–1938. [Google Scholar]
- Lecun, Y.; Bottou, L.; Bengio, Y.; Haffner, P. Gradient-based learning applied to document recognition. Proc. IEEE 1998, 86, 2278–2324. [Google Scholar] [CrossRef]
- Vaswani, A.; Shazeer, N.; Parmar, N.; Uszkoreit, J.; Jones, L.; Gomez, A.N.; Kaiser, Ł.; Polosukhin, I. Attention is all you need. Adv. Neural Inf. Process. Syst. 2017, 30, 5998–6008. [Google Scholar]
- Goodfellow, I.J.; Pouget-Abadie, J.; Mirza, M.; Xu, B.; Warde-Farley, D.; Ozair, S.; Courville, A.; Bengio, Y. Generative Adversarial Nets. In Proceedings of the Advances in Neural Information Processing Systems 27 (NIPS 2014), Montreal, Canada, 8–13 December 2014; Volume 27, pp. 2672–2680. [Google Scholar]
- Kwon, H.; Kim, Y.; Yoon, H.; Choi, D. CAPTCHA Image Generation Systems Using Generative Adversarial Networks. IEICE Trans. Inf. Syst. 2018, E101.D, 543–546. [Google Scholar] [CrossRef]
- Mirza, M.; Osindero, S. Conditional generative adversarial nets. In Proceedings of the NIPS’14: Proceedings of the 27th International Conference on Neural Information Processing Systems, Montreal, QC, Canada, 8–13 December 2014; Volume 2, pp. 2672–2680. [Google Scholar]
- Qiao, J.; Song, H.; Zhang, K.; Zhang, X.; Liu, Q. Image super-resolution using conditional generative adversarial network. IET Image Process. 2019, 13, 2673–2679. [Google Scholar] [CrossRef]
- Shen, H.; Lin, L.; Li, J.; Yuan, Q.; Zhao, L. A residual convolutional neural network for polarimetric SAR image super-resolution. ISPRS J. Photogramm. Remote Sens. 2020, 161, 90–108. [Google Scholar] [CrossRef]
- Smith, J.W.; Alimam, Y.; Vedula, G.; Torlak, M. A Vision Transformer Approach for Efficient Near-Field SAR Super-Resolution under Array Perturbation. In Proceedings of the 2022 IEEE Texas Symposium on Wireless and Microwave Circuits and Systems (WMCS), Waco, TX, USA, 3–4 April 2022; pp. 1–6. [Google Scholar]
- Yang, W.; Ma, Z.; Shi, Y. SAR Image Super-Resolution based on Artificial Intelligence. In Proceedings of the IGARSS 2022—2022 IEEE International Geoscience and Remote Sensing Symposium, Kuala Lumpur, Malaysia, 17–22 July 2022; pp. 4643–4646. [Google Scholar]
- Wang, L.; Zheng, M.; Du, W.; Wei, M.; Li, L. Super-resolution SAR Image Reconstruction via Generative Adversarial Network. In Proceedings of the 2018 12th International Symposium on Antennas, Propagation and EM Theory (ISAPE), Hangzhou, China, 3–6 December 2018; pp. 1–4. [Google Scholar]
- Gu, F.; Zhang, H.; Wang, C.; Wu, F. SAR Image Super-Resolution Based on Noise-Free Generative Adversarial Network. In Proceedings of the IGARSS 2019—2019 IEEE International Geoscience and Remote Sensing Symposium, Yokohama, Japan, 28 July–2 August 2019; pp. 2575–2578. [Google Scholar]
- Dong, C.; Loy, C.C.; He, K.; Tang, X. Image super-resolution using deep convolutional networks. IEEE Trans. Pattern Anal. Mach. Intell. 2015, 38, 295–307. [Google Scholar] [CrossRef] [PubMed]
- Lim, B.; Son, S.; Kim, H.; Nah, S.; Lee, K.M. Enhanced Deep Residual Networks for Single Image Super-Resolution. In Proceedings of the 2017 IEEE Conference on Computer Vision and Pattern Recognition Workshops (CVPRW), Honolulu, HI, USA, 21–26 July 2017; pp. 1132–1140. [Google Scholar]
- Lei, S.; Shi, Z. Hybrid-Scale Self-Similarity Exploitation for Remote Sensing Image Super-Resolution. IEEE Trans. Geosci. Remote Sens. 2022, 60, 5401410. [Google Scholar] [CrossRef]
- Yu, J.; Li, W.; Li, Z.; Wu, J.; Yang, H.; Yang, J. SAR Image Super-Resolution Base on Weighted Dense Connected Convolutional Network. In Proceedings of the IGARSS 2020—2020 IEEE International Geoscience and Remote Sensing Symposium, Waikoloa, HI, USA, 26 September–2 October 2020; pp. 2101–2104. [Google Scholar]
- Zhan, Q.; Chen, Y.; Chen, Y.; Lu, Y.; Xu, C. SAR Image Super-Resolution Reconstruction Based on an Optimize Iterative Method for Regularization. In Proceedings of the 2021 IEEE International Geoscience and Remote Sensing Symposium IGARSS, Brussels, Belgium, 11–16 July 2021; pp. 5075–5078. [Google Scholar]
- Dosovitskiy, A.; Beyer, L.; Kolesnikov, A.; Weissenborn, D.; Zhai, X.; Unterthiner, T.; Dehghani, M.; Minderer, M.; Heigold, G.; Gelly, S.; et al. An Image is Worth 16x16 Words: Transformers for Image Recognition at Scale. In Proceedings of the International Conference on Learning Representations, Vienna, Austria, 4 May 2021. [Google Scholar]
- Lei, S.; Shi, Z.; Mo, W. Transformer-Based Multistage Enhancement for Remote Sensing Image Super-Resolution. IEEE Trans. Geosci. Remote Sens. 2022, 60, 5615611. [Google Scholar] [CrossRef]
- Liang, J.; Cao, J.; Sun, G.; Zhang, K.; Van Gool, L.; Timofte, R. SwinIR: Image Restoration Using Swin Transformer. In Proceedings of the 2021 IEEE/CVF International Conference on Computer Vision Workshops (ICCVW), Montreal, BC, Canada, 11–17 October 2021; pp. 1833–1844. [Google Scholar]
- Sui, J.; Ma, X.; Zhang, X.; Pun, M.O. DTRN: Dual Transformer Residual Network for Remote Sensing Super-Resolution. In Proceedings of the IGARSS 2023—2023 IEEE International Geoscience and Remote Sensing Symposium, Pasadena, CA, USA, 16–21 July 2023; pp. 6041–6044. [Google Scholar]
- Ledig, C.; Theis, L.; Huszár, F.; Caballero, J.; Cunningham, A.; Acosta, A.; Aitken, A.; Tejani, A.; Totz, J.; Wang, Z.; et al. Photo-Realistic Single Image Super-Resolution Using a Generative Adversarial Network. In Proceedings of the 2017 IEEE Conference on Computer Vision and Pattern Recognition (CVPR), Honolulu, HI, USA, 21–26 July 2017; pp. 105–114. [Google Scholar]
- Wang, X.; Yu, K.; Wu, S.; Gu, J.; Liu, Y.; Dong, C.; Qiao, Y.; Loy, C.C. ESRGAN: Enhanced Super-Resolution Generative Adversarial Networks. In Proceedings of the Computer Vision—ECCV 2018 Workshops, Munich, Germany, 8–14 September 2018; pp. 63–79. [Google Scholar]
- Zhang, K.; Liang, J.; Van Gool, L.; Timofte, R. Designing a Practical Degradation Model for Deep Blind Image Super-Resolution. In Proceedings of the 2021 IEEE/CVF International Conference on Computer Vision (ICCV), Montreal, QC, Canada, 10–17 October 2021; pp. 4771–4780. [Google Scholar]
- He, J.; Shi, W.; Chen, K.; Fu, L.; Dong, C. GCFSR: A Generative and Controllable Face Super Resolution Method Without Facial and GAN Priors. In Proceedings of the 2022 IEEE/CVF Conference on Computer Vision and Pattern Recognition (CVPR), New Orleans, LA, USA, 18–24 June 2022; pp. 1879–1888. [Google Scholar]
- Wang, T.C.; Liu, M.Y.; Zhu, J.Y.; Tao, A.; Kautz, J.; Catanzaro, B. High-Resolution Image Synthesis and Semantic Manipulation with Conditional GANs. In Proceedings of the 2018 IEEE/CVF Conference on Computer Vision and Pattern Recognition, Salt Lake City, UT, USA, 18–23 June 2018; pp. 8798–8807. [Google Scholar]
- Liu, B.; Li, H.; Zhou, Y.; Peng, Y.; Elazab, A.; Wang, C. A Super Resolution Method for Remote Sensing Images Based on Cascaded Conditional Wasserstein GANs. In Proceedings of the 2020 IEEE 3rd International Conference on Information Communication and Signal Processing (ICICSP), Virtual, 12–15 September 2020; pp. 284–289. [Google Scholar]
- Nasser, S.A.; Shamsi, S.; Bundele, V.; Garg, B.; Sethi, A. Perceptual cGAN for MRI Super-resolution. In Proceedings of the 2022 44th Annual International Conference of the IEEE Engineering in Medicine and Biology Society (EMBC), Glasgow, UK, 11–15 July 2022; pp. 3035–3038. [Google Scholar]
- Hanano, T.; Seo, M.; Chen, Y.W. An Improved cGAN with Self-Supervised Guidance Encoder for Generation of High-Resolution Facial Expression Images. In Proceedings of the 2023 IEEE International Conference on Consumer Electronics (ICCE), Las Vegas, NV, USA, 6–8 January 2023; pp. 1–4. [Google Scholar]
- Wang, Z.; Cun, X.; Bao, J.; Zhou, W.; Liu, J.; Li, H. Uformer: A general u-shaped transformer for image restoration. In Proceedings of the 2022 IEEE/CVF Conference on Computer Vision and Pattern Recognition, New Orleans, LA, USA, 18–24 June 2022; pp. 17683–17693. [Google Scholar]
- Kulkarni, A.; Murala, S. Aerial Image Dehazing with Attentive Deformable Transformers. In Proceedings of the 2023 IEEE/CVF Winter Conference on Applications of Computer Vision (WACV), Waikoloa, HI, USA, 2–7 January 2023; pp. 6294–6303. [Google Scholar]
- Kong, Y.; Liu, S.; Peng, X. Multi-Scale translation method from SAR to optical remote sensing images based on conditional generative adversarial network. Int. J. Remote Sens. 2022, 43, 2837–2860. [Google Scholar] [CrossRef]
- Johnson, J.; Alahi, A.; Fei-Fei, L. Perceptual losses for real-time style transfer and super-resolution. In Proceedings of the Computer Vision—ECCV 2016: 14th European Conference, Amsterdam, The Netherlands, 11–14 October 2016; Part II 14. pp. 694–711. [Google Scholar]
- Salimans, T.; Goodfellow, I.; Zaremba, W.; Cheung, V.; Radford, A.; Chen, X. Improved techniques for training gans. Adv. Neural Inf. Process. Syst. 2016, 29, 2234–2242. [Google Scholar]
- Schmitt, M.; Hughes, L.H.; Zhu, X.X. The SEN1-2 Dataset for Deep Learning in SAR-Optical Data Fusion. arXiv 2018, arXiv:1807.01569. [Google Scholar] [CrossRef]
- Setiadi, D.R.I.M. PSNR vs SSIM: Imperceptibility quality assessment for image steganography. Multimed. Tools Appl. 2021, 80, 8423–8444. [Google Scholar] [CrossRef]
- Wang, Z.; Bovik, A.C.; Sheikh, H.R.; Simoncelli, E.P. Image quality assessment: From error visibility to structural similarity. IEEE Trans. Image Process. 2004, 13, 600–612. [Google Scholar] [CrossRef] [PubMed]
- Wiener, N.; Wiener, N.; Mathematician, C.; Wiener, N.; Wiener, N.; Mathématicien, C. Extrapolation, Interpolation, and Smoothing of Stationary Time Series: With Engineering Applications; MIT Press: Cambridge, MA, USA, 1949; Volume 113. [Google Scholar]
- Heusel, M.; Ramsauer, H.; Unterthiner, T.; Nessler, B.; Hochreiter, S. GANs trained by a two time-scale update rule converge to a local nash equilibrium. Adv. Neural Inf. Process. Syst. 2017, 30, 1–12. [Google Scholar]
- Zhang, R.; Isola, P.; Efros, A.A.; Shechtman, E.; Wang, O. The unreasonable effectiveness of deep features as a perceptual metric. In Proceedings of the IEEE Conference on Computer Vision and Pattern Recognition, Salt Lake City, UT, USA, 18–23 June 2018; pp. 586–595. [Google Scholar]
- Zhu, J.Y.; Park, T.; Isola, P.; Efros, A.A. Unpaired image-to-image translation using cycle-consistent adversarial networks. In Proceedings of the IEEE International Conference on Computer Vision, Honolulu, HI, USA, 21–26 July 2017; pp. 2223–2232. [Google Scholar]
Disclaimer/Publisher’s Note: The statements, opinions and data contained in all publications are solely those of the individual author(s) and contributor(s) and not of MDPI and/or the editor(s). MDPI and/or the editor(s) disclaim responsibility for any injury to people or property resulting from any ideas, methods, instructions or products referred to in the content. |
© 2023 by the authors. Licensee MDPI, Basel, Switzerland. This article is an open access article distributed under the terms and conditions of the Creative Commons Attribution (CC BY) license (https://creativecommons.org/licenses/by/4.0/).