Article

Evaluation of the Spatiotemporal Change of Ecological Quality under the Context of Urban Expansion—A Case Study of Typical Urban Agglomerations in China

1
State Key Laboratory of Remote Sensing Science, Faculty of Geographical Science, Beijing Normal University, Beijing 100875, China
2
Beijing Engineering Research Center for Global Land Remote Sensing Products, Faculty of Geographical Science, Beijing Normal University, Beijing 100875, China
3
Institute of Remote Sensing and GIS, Peking University, Beijing 100871, China
*
Author to whom correspondence should be addressed.
Remote Sens. 2024, 16(1), 45; https://doi.org/10.3390/rs16010045
Submission received: 8 November 2023 / Revised: 15 December 2023 / Accepted: 19 December 2023 / Published: 21 December 2023

Abstract

:
As a significant manifestation of human activities influencing natural environment, rapid urbanization has enhanced economic prosperity while simultaneously posing threats to ecological quality. Beijing–Tianjin–Hebei (BTH), the core region of the Yangtze River Delta (CYRD), and the Pearl River Delta (PRD) stand as three major economic centers characterized by the highest level of urbanization in China, encompassing areas of heightened ecological sensitivity. Nevertheless, the ecological quality at the scale of urban agglomerations remains ambiguous, with many studies failing to develop a comprehensive and effective method for comparing diverse urban agglomerations. Consequently, this study integrates multi-source remote sensing data, including information on land cover and other socio-economic parameters, to construct the Ecological Quality Index (EQI) based on the “Function–Interaction–Pressure–Stability” (FIPS) framework. Through a stratified determination of indicator weights grounded in both objective importance and empirical knowledge, we mapped the spatiotemporal changes of EQI and analyzed the impact of urbanization on ecological quality in three urban agglomerations from 2001 to 2020. We determined the following: (1) The calculated EQI can further capture the nuanced details with better performance at both underlining the discrepancy of highs and lows of EQI and describing the spatial detail of urban agglomerations’ characteristics. (2) Substantial disparities in EQI and its changes are evident across different urban agglomerations. Notably, only the average EQI improves in PRD, while ecological degradation is prominent in specific regions, such as the southeastern plains of BTH area, along the Yangtze River, and around Shanghai in CYRD and central PRD. The CYRD exhibits the largest affected area. (3) Urbanization predominantly influences ecological quality through land cover transitions. In expansion areas, ecological deterioration is significantly more pronounced, constituting approximately 90% of the total area. (4) Despite significant urbanization, city-level analysis in CYRD reveals a better coordination between urban expansion and ecological protection, with a lower intensity of ecological degradation compared to urban expansion rates. Conversely, some cities in the BTH, despite modest urban expansion, exhibit substantial declines in ecological quality, highlighting the need for targeted policy interventions. In conclusion, this study elucidates the intricate relationship between urbanization and ecological quality, offering valuable insights for the development of targeted protection strategies and sustainable urban planning.

Graphical Abstract

1. Introduction

The process of urbanization has emerged as a significant driver of ecological threats and environmental degradation, underscoring the imperative to scientifically evaluate the impact of urban development on ecological quality. Specifically, urban areas, characterized by concentrated population and economic activities, constitute the foundation and nucleus of future national development. However, rapid urbanization has concurrently imposed serious pressure and inflicted damage on the ecological environment [1]. Notably, China has experienced a remarkable surge in urbanization rates, escalating from 17.92% to 63.89% in recent decades, with projections nearing 80% by 2050 [2]. This rapid urbanization has emerged as one of the most environmentally destructive forces, driven by factors such as resource consumption, population growth, and intensive human activities [3,4]. The expansion of urban areas has encroached upon arable land and other ecologically sensitive areas, giving rise to numerous ecological challenges and environmental problems, including environmental pollution, biodiversity crises, and degradation of ecological quality [5]. These issues have significantly impacted human livelihoods and disrupted normal production processes [6]. As awareness grows regarding the importance of balancing human socioeconomic development and ecological restoration, the establishment of high-quality urban ecosystems, where humans and nature coexist harmoniously, has become a key goal for governments and urban planning [7,8]. While the global urbanization process is irreversible, it is imperative to construct a robust scientific framework for assessing changes in ecological quality and exploring the impact of urbanization on ecological systems. These efforts can provide valuable suggestions for decision-making, aiding in the sustainability and reconciliation of economic development and ecological protection [9].
In response to the escalating ecological damage resulting from urbanization, numerous countries and researchers have directed their focus towards the development of methodologies to assess ecological quality. Recognizing the inherent subjectivity in ecological quality assessments, researchers have devised expert systems to articulate the quality of grassland ecosystems in Australia [10]. Additionally, successful endeavors to introduce new evaluation indicators have been made. Notably, the Chinese government has introduced the Ecological Index (EI) with the goal of standardizing national ecological quality assessment norms [11]. However, the implementation of EI has encountered challenges, particularly concerning data acquisition and visualization. To address these challenges, remote sensing (RS) technology emerges as a promising solution, offering unique advantages and resolving the aforementioned issues. Initial studies predominantly relied on single environmental variables, such as utilizing the Normalized Difference Vegetation Index (NDVI) to evaluate vegetation degradation in urban expansion [12]. Recognizing the influence of multiple factors [13], researchers have developed assessment frameworks that integrate various indicators, including the Pressure–State–Response (PSR) model and the Fuzzy Analytic Hierarchy Process (FAHP) [14]. Nevertheless, challenges have persisted, primarily related to subjective indicator assignment and limited consideration of the objective importance of indicators [13]. To overcome these limitations, the Remote Sensing-based Ecological Index (RSEI) employs principal component analysis (PCA) to comprehensively calculate both the amount of objective information and the importance of four key indicators representing greenness, heat, wetness, and dryness [15,16]. This approach enhances the reliability of ecological quality assessments. Researchers have extended the RSEI to suit specific study themes, such as adjusting it to incorporate the Continuous Change Detection and Classification (CCDC) to reduce time span sensitivity [17]. With a growing emphasis on linking ecological quality with public health and sustainable societies, researchers increasingly explore ecological risks, such as microplastics, integrating insights from other disciplines such as hydrology and biology [10,18]. Moreover, the substantial potential of multisource remote sensing and indicator weighting techniques in assessing ecological quality has become evident. Recent advancements in land use and vegetation parameter datasets for future scenarios serve as a foundation for formulating and adjusting land management policies based on estimated sustainable targets [19,20]. PCA continues to exhibit outstanding advantages in reducing redundant information and dimensionality in data. In the field of ecological remote sensing, refinements, such as spatial principal component analysis, are gradually being improved and applied to enhance ecological monitoring [21].
In spite of the efforts invested in existing indices, these indicators encounter significant challenges when assessing ecological quality on a large scale, particularly in areas undergoing intense urbanization with substantial human activities. Firstly, the majority of RSEI-related studies have been confined to small study areas, and the feasibility and scalability of RSEI in complex regions where the ecological environment interacts with human–land relations are yet to be conclusively verified [22]. Furthermore, prevailing studies tend to focus on individual cities or small regions, limiting the applicability of established indicators due to geographical restrictions [23]. The determination of weights for ecological evaluation indicators is predominantly based on objective information, often neglecting the inherent physical significance of the indicators themselves [24,25]. More critically, the evaluation of ecological quality in intricate ecosystems such as urban agglomerations necessitates a more comprehensive and scientifically grounded approach that considers the intricate biological components, regional climate changes, and supernumerary human activities [26,27]. These factors collectively alter energy flow processes and environmental conditions, resulting in pronounced spatiotemporal heterogeneity of ecological quality [28]. Therefore, our research is dedicated to the development of a more comprehensive framework and the application of scientific weighting techniques to evaluate ecological quality and the impact of urbanization at the scale of urban agglomerations, aligning with a refined understanding of the concept’s definition.
As a concept of combining various elements, ecological quality was defined as the essential indicator measuring the healthy condition of ecosystems, implying that an ecosystem with high quality can maintain a stable structure, function, and organization despite external influences [29]. Ecosystems, as integral components of interconnected natural systems, are continually developed and utilized by humans, with material and energy being conserved during the processes of production, loss, and recovery. In alignment with this understanding, we have integrated four dimensions into evaluating ecological quality: ecological function measuring resources and production, ecological interaction quantifying influence from natural elements, ecological pressure from human activities, and ecological stability depicting resilience [30]. Given the intricate nature of the factors influencing ecological quality, a comprehensive framework, the “Function–Interaction–Pressure–Stability” (FIPS) model, is proposed, which incorporates various factors, including human activities, climate change, soil conditions, and land cover [31,32]. To quantitatively assess ecological quality, we employed the PCA index weighting method, refined by the Analytic Hierarchy Process (AHP), resulting in the construction of the Ecological Quality Index (EQI). The spatiotemporal patterns of EQI were then analyzed in three urban agglomerations. We identified hotspots of ecological deterioration, and city-level synergy analysis was conducted to understand the relationship between urban expansion intensity and ecological change intensity. We also provided valuable and targeted suggestions for sustainable management in different cities according to the analysis results.

2. Materials and Methods
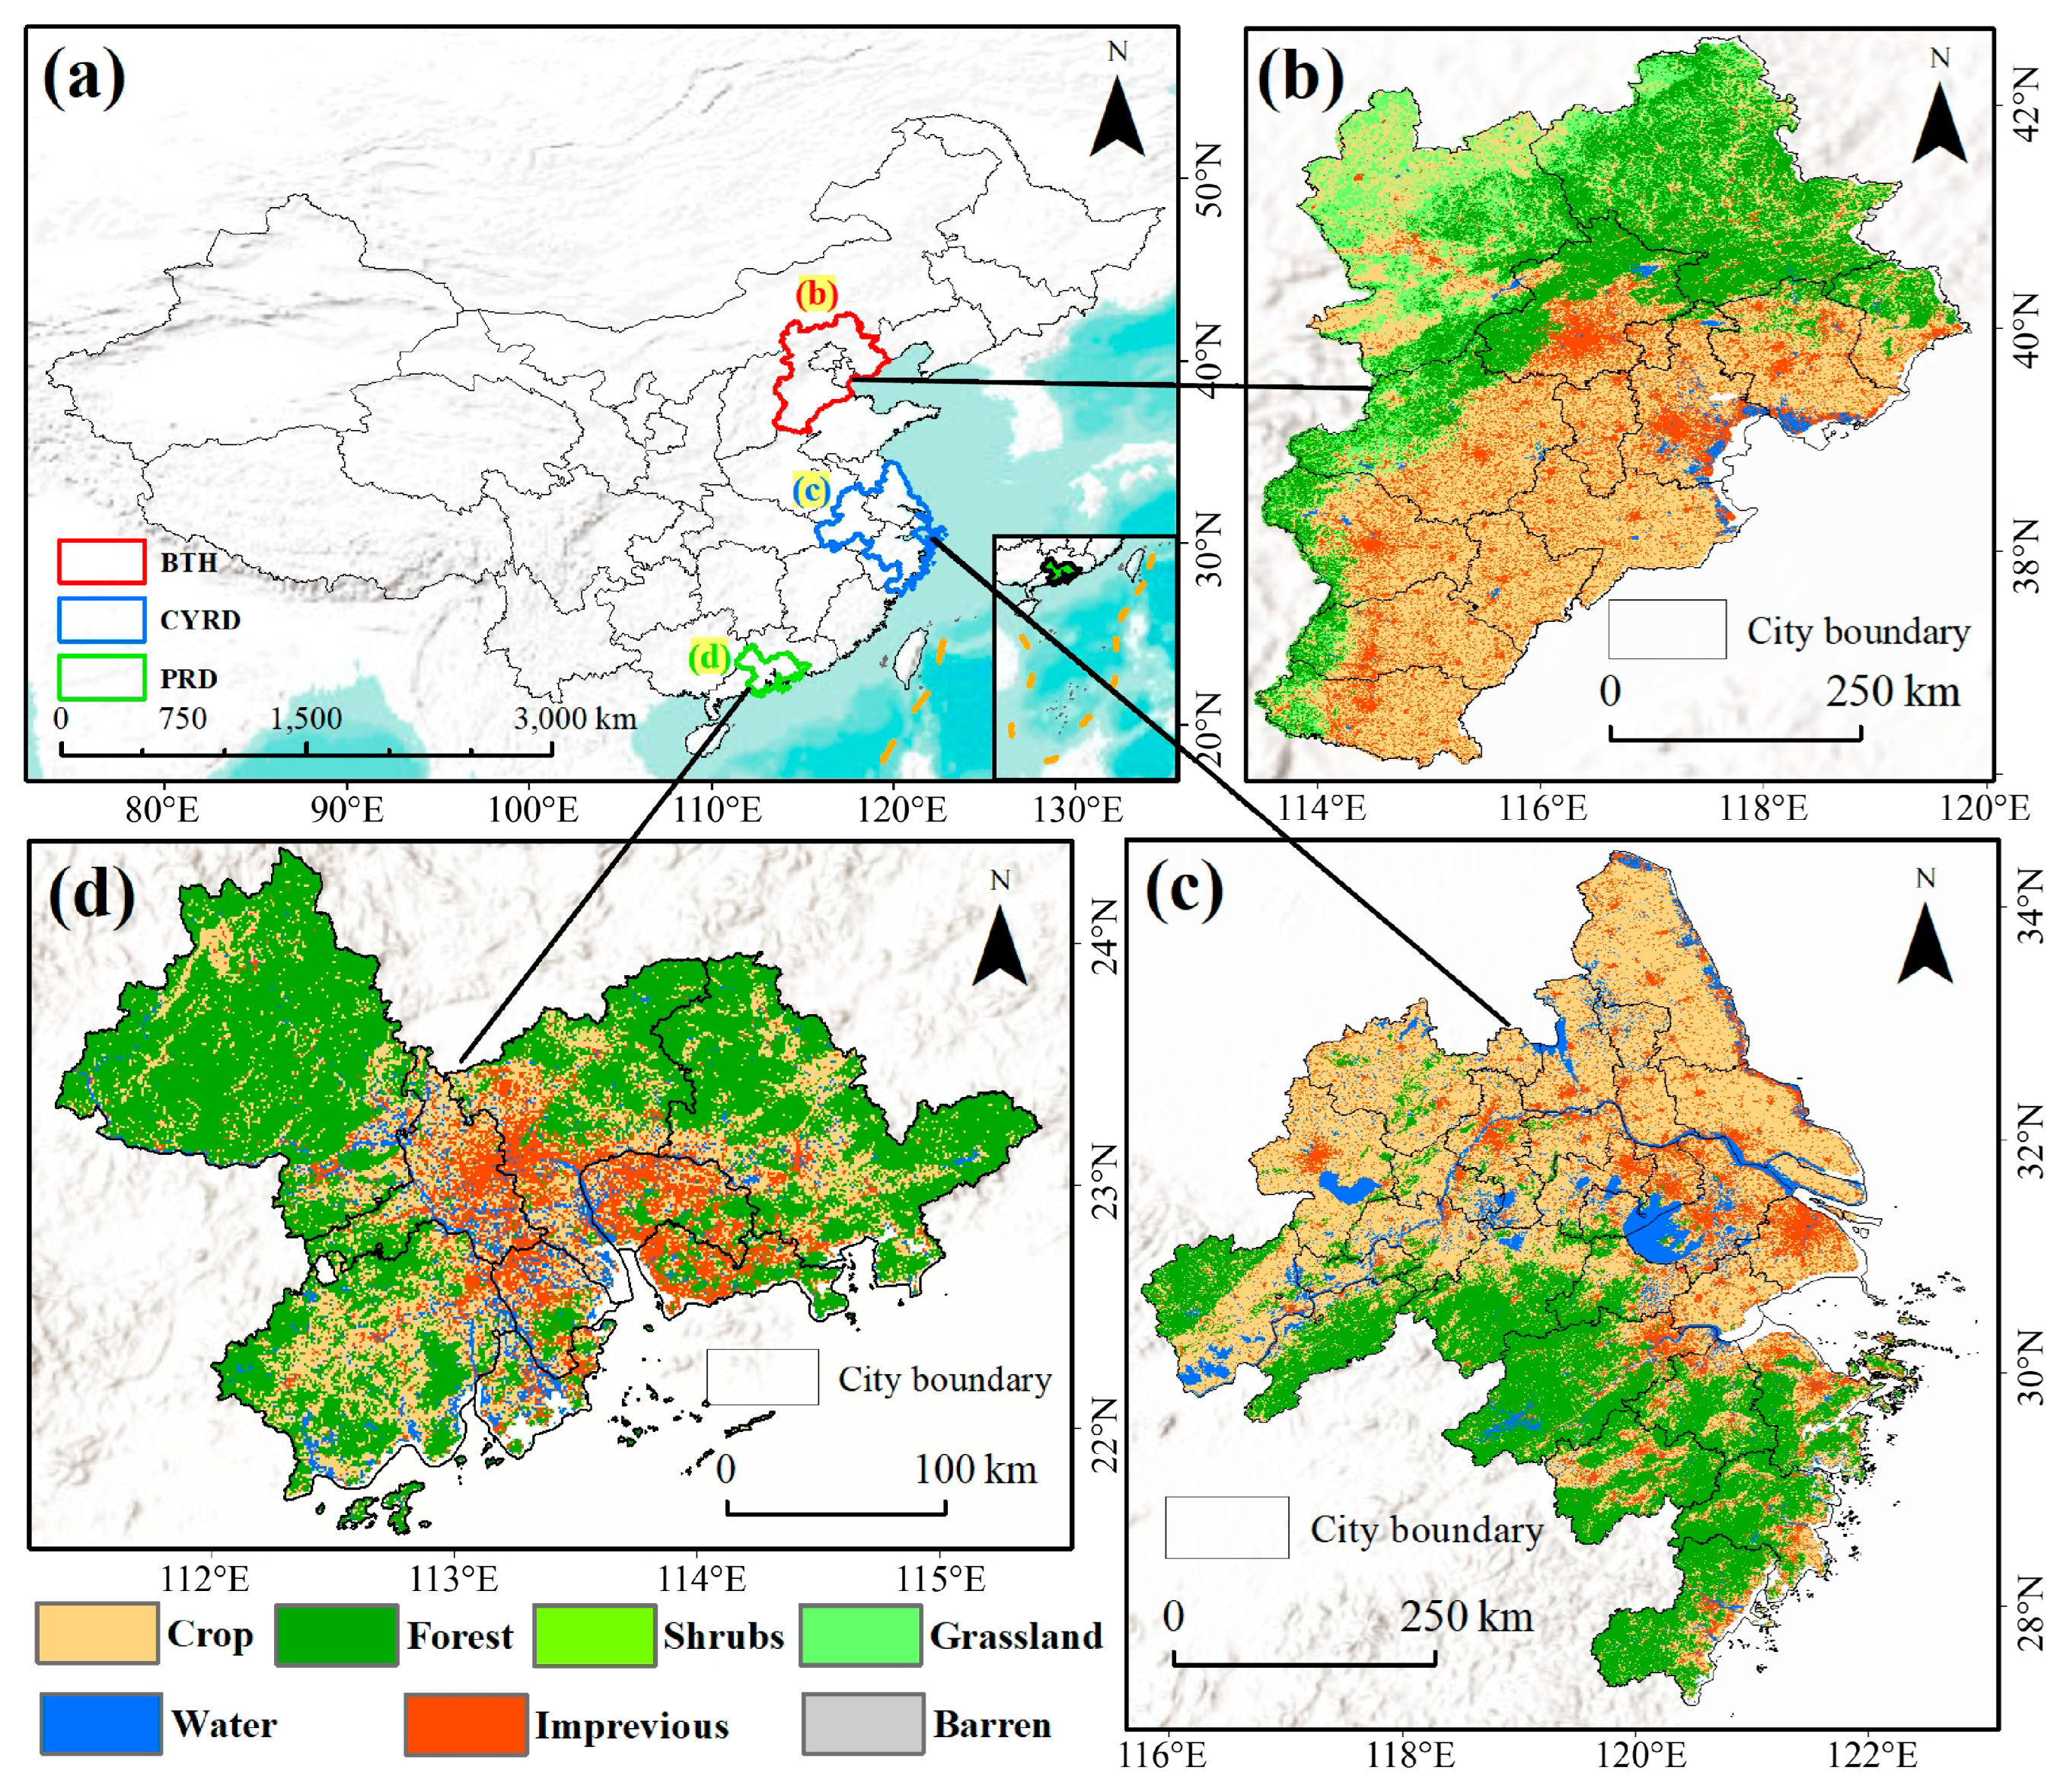
2.1. Study Area

Representing regions marked by the most significant contradictions between economic development and ecological protection, the urban agglomerations of Beijing–Tianjin–Hebei (BTH), the Yangtze River Delta (YRD), and the Pearl River Delta (PRD) have consistently garnered considerable attention and concern. The spatial location and land cover information for the three urban agglomerations in 2020 can be seen in Figure 1.
BTH is the largest urban agglomeration in northern China, contributing 8.3% to the total GDP of the country. Encompassing an expansive area of approximately 216,800 km2 (113°04′–119°53′E, 36°01′–42°37′N), it provides resources to sustain a population of approximately 110 million people [33]. CYRD comprises 27 cities in the core region of YRD, adjusted according to the Outline of the Yangtze River Delta Regional Integrated Development Plan (refer to Table S1). In comparison to BTH, CYRD covers a larger area of 225,000 km2 (115°45′–122°57′E, 29°34′–34°29′N), accommodating over 160 million people and contributing 20% to the country’s total GDP [34]. The Pearl River Delta (PRD) covers a smaller area of 50,000 km2 (111°21′–115°25′E, 29°34′–24°24′N) but supports approximately 86 million residents, contributing about 11% to the total GDP of China. PRD boasts the highest urbanization rate among the three major urban agglomerations at 86%, followed by CYRD at 75%, while BTH has an urbanization rate of 66.7% [35]. In terms of natural conditions, BTH experiences a typical temperate monsoon climate, characterized by average annual temperatures ranging between 10–12 °C and cumulative average annual precipitation between 350–700 mm [36]. On the other hand, CYRD and PRD both feature a subtropical monsoon climate, marked by simultaneous rain and heat in the summer and average temperatures above 0 °C during the coldest winter months. The distinction between the two areas lies in PRD’s more abundant rainfall and elevated temperatures.
Significant distinctions in ecological threats and factors influencing ecological quality changes exist among the three urban agglomerations. The BTH region has witnessed continuous deterioration in ecological quality due to massive resource consumption and the prolonged development of heavy industry. The ecological threat, primarily manifested as severe air pollution, has consistently impacted human well-being, reaching a critical point in 2013 when air pollution levels accounted for one-third of the national total [37]. Policies related to ecological protection and urban expansion characterized by rapid land transitions have contributed to variations in ecological quality between the southeast and northwest regions of BTH [38]. CYRD has faced heightened human–land pressure and significant urban expansion in recent decades. Frequent human-driven landscape reconstruction has increased the complexity of the landscape structure and exacerbated ecosystem fragility. Additionally, the dense population’s substantial demand for thermal power generation has resulted in severe air pollution and frequent occurrences of acid rain [39]. Urban land expansion, aquaculture, and farmland occupation are pivotal factors contributing to the degradation of ecological quality in CYRD [29]. In the case of PRD, landform, land management policies, and environmental regulations have influenced the intensity of human activities, leading to rapid expansion in plain areas and ecological protection in hilly regions [40]. Urbanization has transformed numerous natural ecological landscapes, rendering them susceptible to threats such as soil erosion and environmental pollution. In recent years, extreme weather events, such as rainstorms and continuous high temperatures, have emerged as key factors influencing the ecological status of PRD [41].

2.2. Datasets and Preprocessing

Various complex and diverse factors, including pollutant emissions and vegetation cover, contribute to changes in ecological conditions [42,43]. In response, our approach involved integrating socio-economic data and remote sensing products to establish a systematic framework for assessing alterations in ecological quality. It is important to note that all the datasets utilized in our study can be accessed by clicking on the Data Source column in Table 1. Specific links to the datasets can be obtained in the Data Availability Statement section located at the end of this paper.

2.2.1. Socio-Economic Statistics

Human activity plays an important role in the process of urbanization and the alteration of natural ecosystems [44]. Socio-economic data serve as crucial indicators that reflect disparities in regional economic development levels and variations in the intensity of human activities [45]. As indicated in Table 1, Human Density (HD) data and adjusted Gross Domestic Product (GDP) data were chosen as essential indicators to portray the distribution and characteristics of human influence [46,47,48].

2.2.2. Remote Sensing Products

Remote sensing technique has provided massive products for extracting and analyzing natural features [49]. Six types of remote sensing products were utilized in this study:
(1) Vegetation indexes, closely associated with ecological status, were selected from the GLASS (Global LAnd Surface Satellite) remote sensing parameter dataset [50]. Leaf area index (LAI) represents the sum of the one-sided area of green leaves per unit land area. It plays an important role in monitoring and measuring material and energy exchange of land surfaces [51]. Gross primary productivity (GPP) is the amount of organic carbon fixed by organisms (mainly green plants) through photosynthetic pathways per unit time, which is closely related to the quantitative description of the terrestrial ecosystems and carbon cycle [52]. NDVI data was obtained from the MOD13A1 v6.1 NDVI product of MODerate resolution Imaging Spectroradiometer (MODIS). It reflects the magnitude of vegetation cover and the land cover class of the ground background [53]. Specific information of spatial and temporal resolution can be found in Table 1.
(2) Temperature data (Tmp) and precipitation data (Pre) were sourced from the 1 km monthly mean temperature dataset for China (1901–2021) and the 1 km monthly precipitation dataset for China (1901–2021) [54], respectively.
(3) PM2.5 data [55] were obtained from the ChinaHighPM2.5 dataset, part of China High Air Pollutants (CHAP), offering long-term and full-coverage datasets of ground-level air pollutants in China.
(4) Soil nutrient availability data (SNA) were derived from the Harmonized World Soil Database (HWSD) v1.2 dataset. We used sq1 data in soil quality, i.e., nutrient availability data.
(5) Urban built-up area data were obtained from the dataset of urban built-up area in China (1992–2020) v1.0, providing support for understanding the urban expansion process and its impact in China [56,57].
(6) Land cover data used were sourced from the China Land Cover Dataset (CLCD) of Wuhan University [58], containing annual land cover information for China in 1985 and 1990–2022.

2.2.3. Data Processing

All indexes were uniformly processed as raster images using the WGS1984 coordinate system, with a temporal resolution of annual and a spatial resolution of 1 km. Initially, to enhance pixel reliability, missing data and low-quality pixels were identified based on quality marker bands. The missing positions were filled using adjacent pixels interpolation and the Savitzky–Golay filter. Subsequently, the temporal resolution was standardized to an annual scale. NDVI and LAI indicators were synthesized using the maximum value method. GPP and PM2.5 were computed as their annual averages, and annual precipitation was determined as a 12-month sum using the cumulative method. Importantly, all datasets were normalized to the range from 0 to 1. Different methods were applied based on the attributes and physical meaning of the indicators (as detailed in Table 2). The relationship between the assessment indicators and ecological quality can be categorized as positive, negative, appropriate, and corresponding.
Positive relationship: The larger the indicator is, the better ecological quality will be.
X i = X i X i m i n X i m a x X i m i n , ( i = 1 ,   2 , n )
Negative relationship: The larger the indicator is, the worse ecological quality will be.
X i = X i m i n X i X i m a x X i m i n , ( i = 1 ,   2 , n )
Appropriate relationship: There is an optimal threshold for the indicator, such as climate factors, and the more it exceeds or falls below the threshold, the worse the ecological quality.
X i = x i x 0 x i < x 0 1 x i = x 0 2 x i x 0 x i > x 0 , ( i = 1 ,   2 , n )
Corresponding relationship: Only for LC data, a specific category corresponding to a defined scalar value according to previous studies [59,60].
X i = f ( x i ) ,   ( i = C l a s s 1 , C l a s s 2 , C l a s s n )
where X i denotes the normalized value of the X i indicator, X i m i n ,   X i m a x indicate the minimum and maximum values of X i within the study area, respectively, x i means the initial value of indicator data, x 0 denotes the appropriate threshold value artificially set, and f means the correspondence function between data categories and normalized values.

2.3. Methods

As shown in Figure 2, the methodology encompasses three steps: establishing a four-dimensional hierarchical ecological assessment framework, rationally determining weights of indicators and comprehensively analyzing the impact or urbanization on ecological quality.

2.3.1. Ecological Quality Assessment Framework

This study aimed to establish an adaptive framework for ecological assessment, focusing on the interaction between the ecological environment and human activities. Multi-criteria analysis (MCA) [61], commonly employed for addressing complex indicator assessment problems such as sustainability issues [62], was utilized to delineate the study objectives. These objectives were then categorized into target, criterion, and indicator layers based on the pressure–state–response (PSR) model (refer to Table 2). Seeking to elucidate the “Function-Interaction-Pressure-Stability” relationship between humans and the environment, four aspects of indicators were employed to reflect the overall ecological quality:
  • Is the area rich in ecological resources? Are the ecological functions well developed? (Ecological function) [63]
  • Are the ecosystems in the area compatible with natural conditions and able to establish positive interactions? (Ecological interaction) [64]
  • Is there pressure from human activities in the area? What is the intensity of the pressure? (Ecological pressure) [65]
  • How well does the area maintain its stability when disturbed and disrupted? (Ecological stability) [66].
(1) Ecological function (EF) reflects the resource and health of the ecosystem, encompassing vital processes such as biological production, energy flow, and material cycling. It directly reflects the quality of the ecological environment [63]. Four types of data are employed to characterize ecological function. The combination of NDVI and LAI provides insights into the vegetation cover and greenness of the study area [67,68]. GPP is linked to fixed biological resources, as well as vegetation resistance and restoration capabilities [69]. LC delineates surface land use patterns and landscape states, with ecosystem service values varying significantly across different land use patterns. Consequently, the ecological function indicator can be calculated using Formula (5):
E F = w N D V I × N D V I n o r m + w L A I × L A I n o r m + w L U L C × L C n o r m + w G P P E F × G P P n o r m
(2) Ecological interaction (EI) signifies the interactions of the ecological environment with the surrounding natural conditions [70]. Ecological climate, which influences the survival and growth of plant and animal life, serves as a notable example of ecological interaction [71]. In this context, Tmp, Pre, and PM2.5 are utilized to delineate ecological interactions. Temperature and precipitation, being fundamental elements of climate, contribute to forming temporally and spatially diverse climatic conditions. PM2.5, as a crucial air quality indicator in densely populated and industrial areas like urban agglomerations, holds direct implications for urban livability and human health [72]. The ecological interaction indicator can be derived using Formula (6):
E I = w T m p × T m p n o r m + w P r e × P r e n o r m + w P M 2.5 × P M 2.5 n o r m
(3) Ecological pressure (EP) primarily arises from human activities, delineating the impact on the ecological environment resulting from human society’s production and life. Disturbances to the ecosystem, such as pollution emissions, indiscriminate logging, and alterations to lakes and fields, are key contributors to ecological pressure [73,74]. GDP and population density are employed as measures of ecological pressure, signifying that regions with higher GDP and population density may experience elevated resource consumption, land transitions, and more substantial pressures on the ecological environment [75]. Ecological disturbance indicators can be computed using Formula (7):
E P = w H D × H D n o r m + w G D P × G D P n o r m
(4) Ecological Stability (ES) denotes the capacity of an ecosystem to resist and recover from disturbances, maintaining its operational balance [76]. The introduction of sewage and toxic gases by human society disrupts the ecosystem’s balance, but the ecosystem possess a certain resilience within their carrying capacity. Ecosystems characterized by more intricate nutrient structures and higher organic logistics flux exhibit greater stability [77], often associated with soil properties and carbon sequestration capacity. GPP serves as an indicator not only reflecting the stability of vegetation ecology but also its ecological function [78]. Both MCA stratification principles and prior studies validate the feasibility and rationale of incorporating GPP into both EF and ES [79]. Ecological stability indicators can be computed using Formula (8):
E S = w S N A × S N A n o r m + w G P P E S × G P P n o r m
The integrated assessment of Ecological Quality Indicator (EQI) is derived from the cumulative weighting of indicators at each criterion level and is calculated using Formula (9):
E Q I = w E F × E F + w E I × E I + w E D × E P + w E S × E S

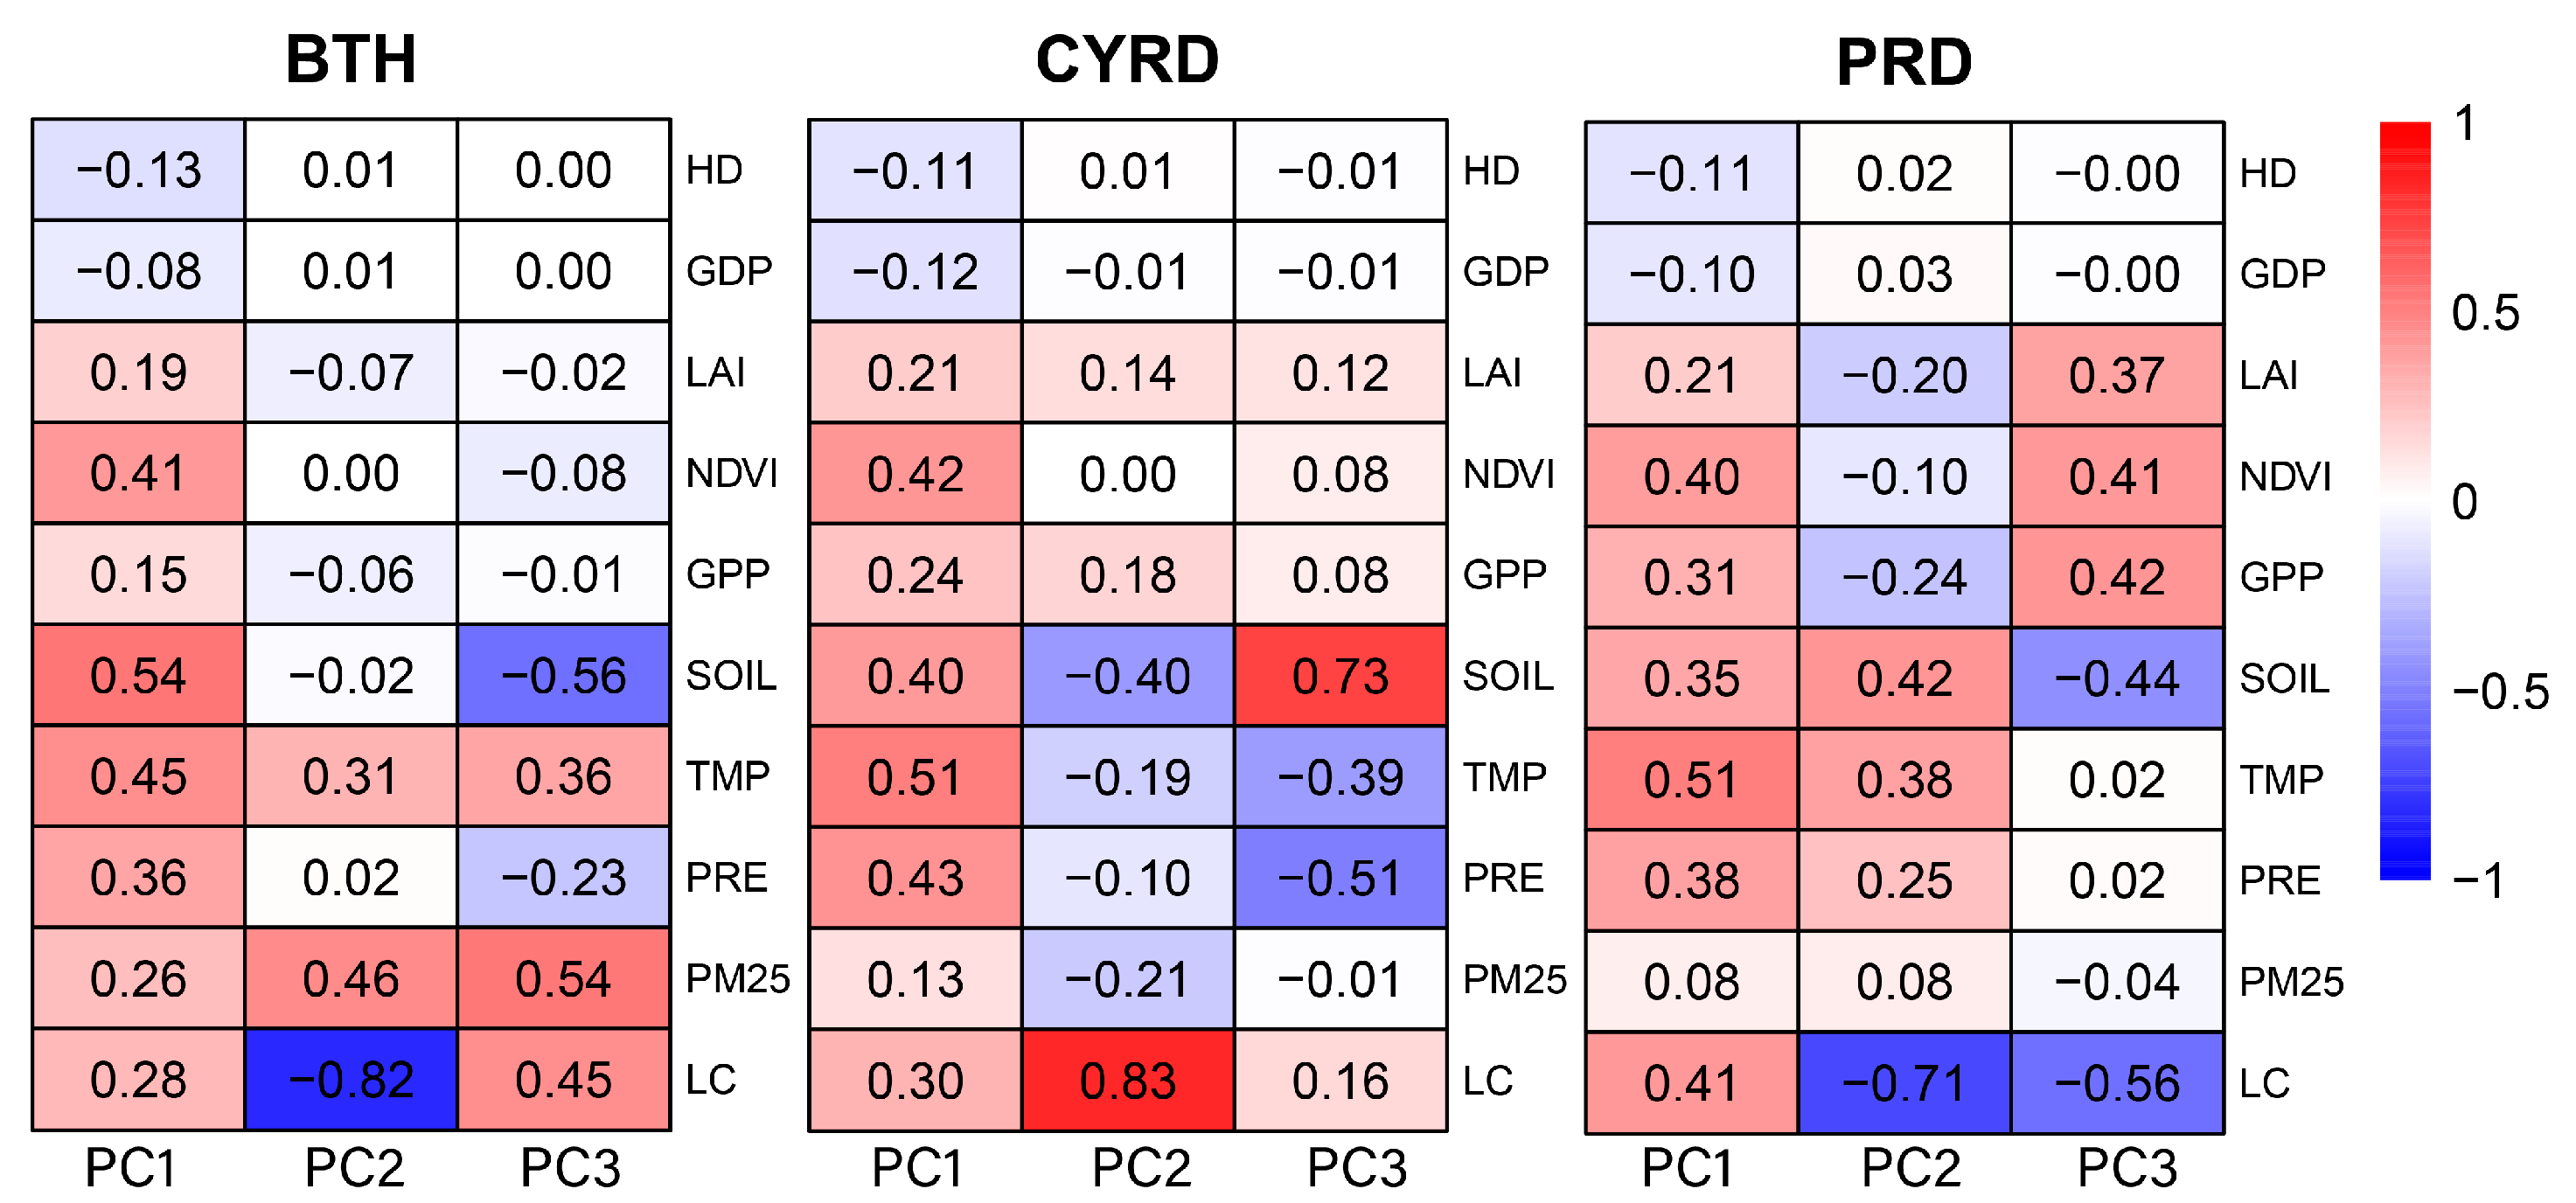
2.3.2. PCA Modified AHP Weighting Method

To address the issues of unclear weight significance, subjective judgment, and the challenges of large-scale application in previous indicator weighting methods [80], this study employs an effective and adaptable PCA-AHP method to determine the weights for each indicator. The method offers advantages in decomposing complex problems and integrating both subjective and objective information.
Initially, certain collinearity and correlation exist among factors evaluating the ecological quality of the study area, such as LAI and GPP [81]. To address this, PCA was employed for data dimension reduction and to ascertain the contribution of each indicator to the principal component. Principal components were selected based on the principle that cumulative variance should exceed 95%. Assuming p principal components were selected, with a total of n indicators, each principal component can be represented by a linear combination of indicators and their coefficients σ. The coefficient σ of indicator i in principal component p can be calculated using the formula:
σ i p = β i p α i
where α i and β i mean the eigenvalue and the corresponding value of indicator i in the eigenvectors of principal component p, respectively.
We used σ i p and cumulative explained variance ratio of the first p principal components φ p to calculate the composite score coefficient γ i using Formula (11):
γ i = j = 1 n φ p σ i p k = 1 n φ k
Finally, normalization has been operated on γ i of indicator i to obtain the final weight ω i .
ω i = γ i i = 1 n γ i
The ω i of each indicator composed the weight matrix w P obtained by PCA. However, these principal components may lack clear physical meaning, posing challenges in attributing ecological quality assessments. To address this, we introduced the Analytic Hierarchy Process (AHP) method to incorporate expert knowledge and adjust objective weights by assessing the relative importance of indicators through pairwise comparisons. A judgment matrix was provided to five experts, who scored different indicators by comparing their importance for ecological quality on a scale from 1 to 9. We utilized the judgment matrix between several indicators under a specific criterion layer to test whether the single-level sorting results passed the consistency test. Subsequently, we obtained the final weights ( w A ) until the overall hierarchical sorting also passed the test. The weight of the final indicator ( w ) was determined as the average of w P and w A , integrating subjective and objective information. The results are presented in Table 2.

2.3.3. Spatiotemporal Heterogeneity of EQI under Urban Expansion Patterns

In accordance with the “Technical specification for investigation and assessment of national ecological status-Ecosystem quality assessment” issued by the Ministry of Ecology and Environment of the People’s Republic of China, this study employed the equidistance method to classify the EQI index into five grades. For details regarding the EQI grading results and the corresponding values, please refer to Table 3.
To facilitate a more intuitive comparison of the spatial changes in EQI, we calculated the EQI change (∆EQI) for the three urban agglomerations by subtracting the EQI of the year 2020 from that of the year 2001. We categorized the EQI change into five classes, as shown in Table 3.
For a visual and quantitative analysis of the impact of urbanization on EQI changes, we determined the urban extent using the urban built-up area data for 2001 and 2020 to delineate the core and expansion areas of urban expansion. Specifically, we regarded the urban area in 2001 as the core area, and the expanding area in 2020 compared to 2001 as the expansion area. Subsequently, we employed transfer matrix methods to investigate the changes and reasons for ecological equality in the two urban areas. The ecological quality transfer matrix describes the spatial patterns of changes in different EQI classes occurring in different years [82].

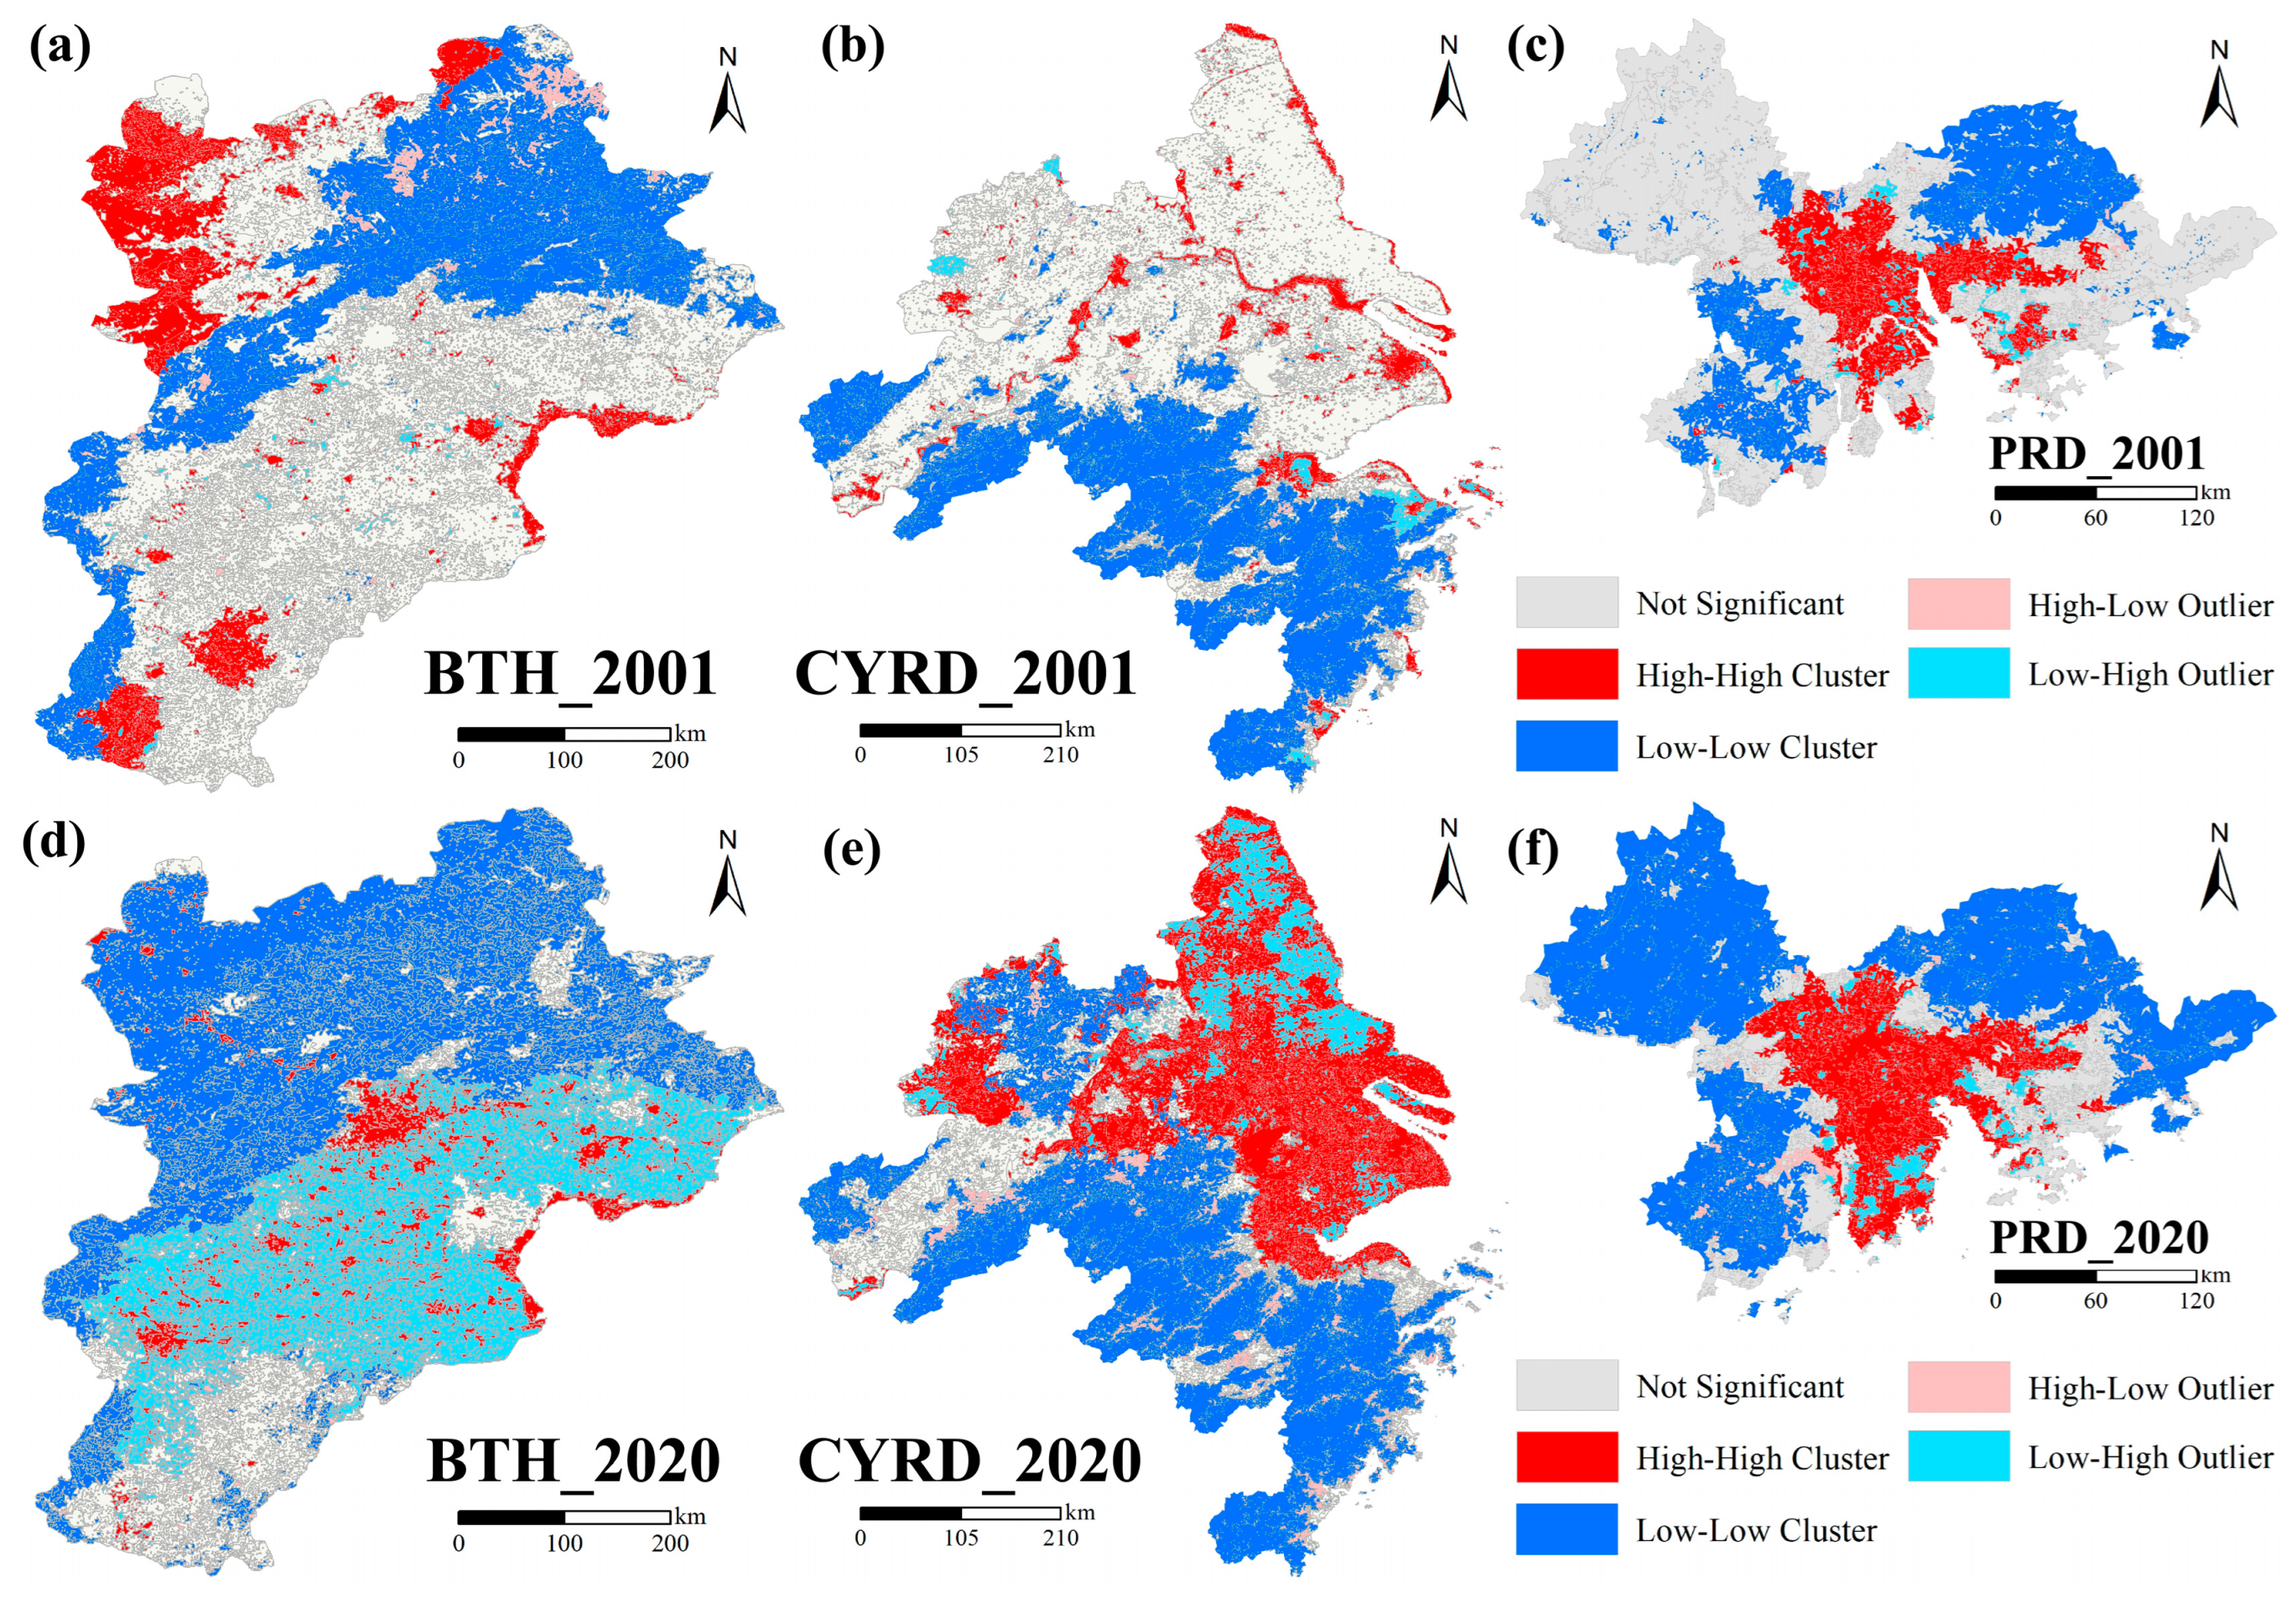
2.3.4. Urban Aggregation Patterns and Hotspot Analysis

Patterns of ecological quality within the context of urbanization exhibit significant spatial heterogeneity, with a discernible spatial dependence among pixels organized into grids, leading to either spatially aggregated or dispersed distribution patterns [83]. In order to obtain richer spatial details and more specific clustering hotspots, we converted the EQI grids into very small patches based on five EQI grades, rather than relying solely on administrative regions. After all, the division of administrative regions may hinder the understanding of spatial characteristics of some geographical elements [84]. Based on this setting, we adopted Exploratory Spatial Data Analysis (ESDA) to explore the spatial autocorrelation and detect the clustering patterns.
Employing Exploratory Spatial Data Analysis (ESDA) has proven instrumental in assisting researchers in detecting spatial mechanisms, visualizing spatial aggregation, and identifying anomalies in the EQI [85]. The global Moran’s I was used to gauge spatial autocorrelation and determine the presence of aggregation patterns or outliers in space [86]. However, global indices like global Moran’s I obscure the spatial connections between local pixels and cannot signify cold/hot spots or spatial correlations. The adoption of Local Indicators of Spatial Association (LISA) metrics addresses this limitation, revealing aggregated and discrete spatial patterns [85]. We conducted the research in our settings by creating the queen contiguity weight matrix rather than inverse distance weighting method, which may cause some unpredictable and inexplicable problems in our settings when detecting hotspots and determining distance threshold [87]. The specific calculation formulas for the two indices are appended in the Appendix A. According to the LISA results, five clustering patterns were identified in the EQI assessment: High–High (hot spots), Low–Low (cold spots), Low–High, High–Low, and “Not significant”.

2.3.5. Construction of Urban Synergy Index

Spatial variations in ecological quality result from the complex interplay of numerous influencing factors. Notably, substantial differences in natural factors, such as climatic conditions, may overshadow the positive impact of human policies on ecological quality in the face of continuous urbanization. Acknowledging the pivotal role of land transitions in the nexus between urbanization and ecological quality, we formulated an Urban Synergistic Index (USI) to compare urbanization intensity with changes in ecological quality. Cities should be seen as complex systems that gather various elements such as land management, population aggregation, and transportation [88]. Measuring the level of urbanization and urban scaling requires considering the adaptability after numerous interactions [89]. For example, one city may bring more ecological deterioration and aggregating population than two cities of the half expansion area together. For the convenience of comparing different cities, we propose a hypothesis that the expansion of the same area in different cities might lead to comparable degrees of ecological degradation. In instances where two cities exhibit similar levels of urbanization intensity, the influence of human policies and protective practices may significantly contribute to discernible differences in ecological quality changes between them. This insight can serve as a basis for diverse cities to formulate targeted coordination and sustainable development policies.
The intensity of urban expansion was computed by assessing the interannual changes in impervious surface area within each city. Simultaneously, the intensity of EQI change was determined by evaluating the city’s interannual average EQI. Cities exhibiting positive USI values have demonstrated certain success in ecological recovery and protection within the context of urbanization. A USI value less than 0 indicates a decline in urban ecological quality. However, if the absolute value of USI is very small, it suggests that these cities have recognized the value of ecological protection and implemented certain measures for its preservation. The formula for calculating USI is as follows:
U S I = E Q I m e a n t 2 E Q I m e a n t 1 / E Q I m e a n t 1 I m p a r e a t 2 I m p a r e a t 1 / I m p a r e a t 1
where E Q I m e a n t 2 , E Q I m e a n t 1 , I m p a r e a t 2 , and I m p a r e a t 1 refers to the mean value of all pixels’ EQI value and impervious surface area in a city at the end and beginning of the period, respectively.

3. Results

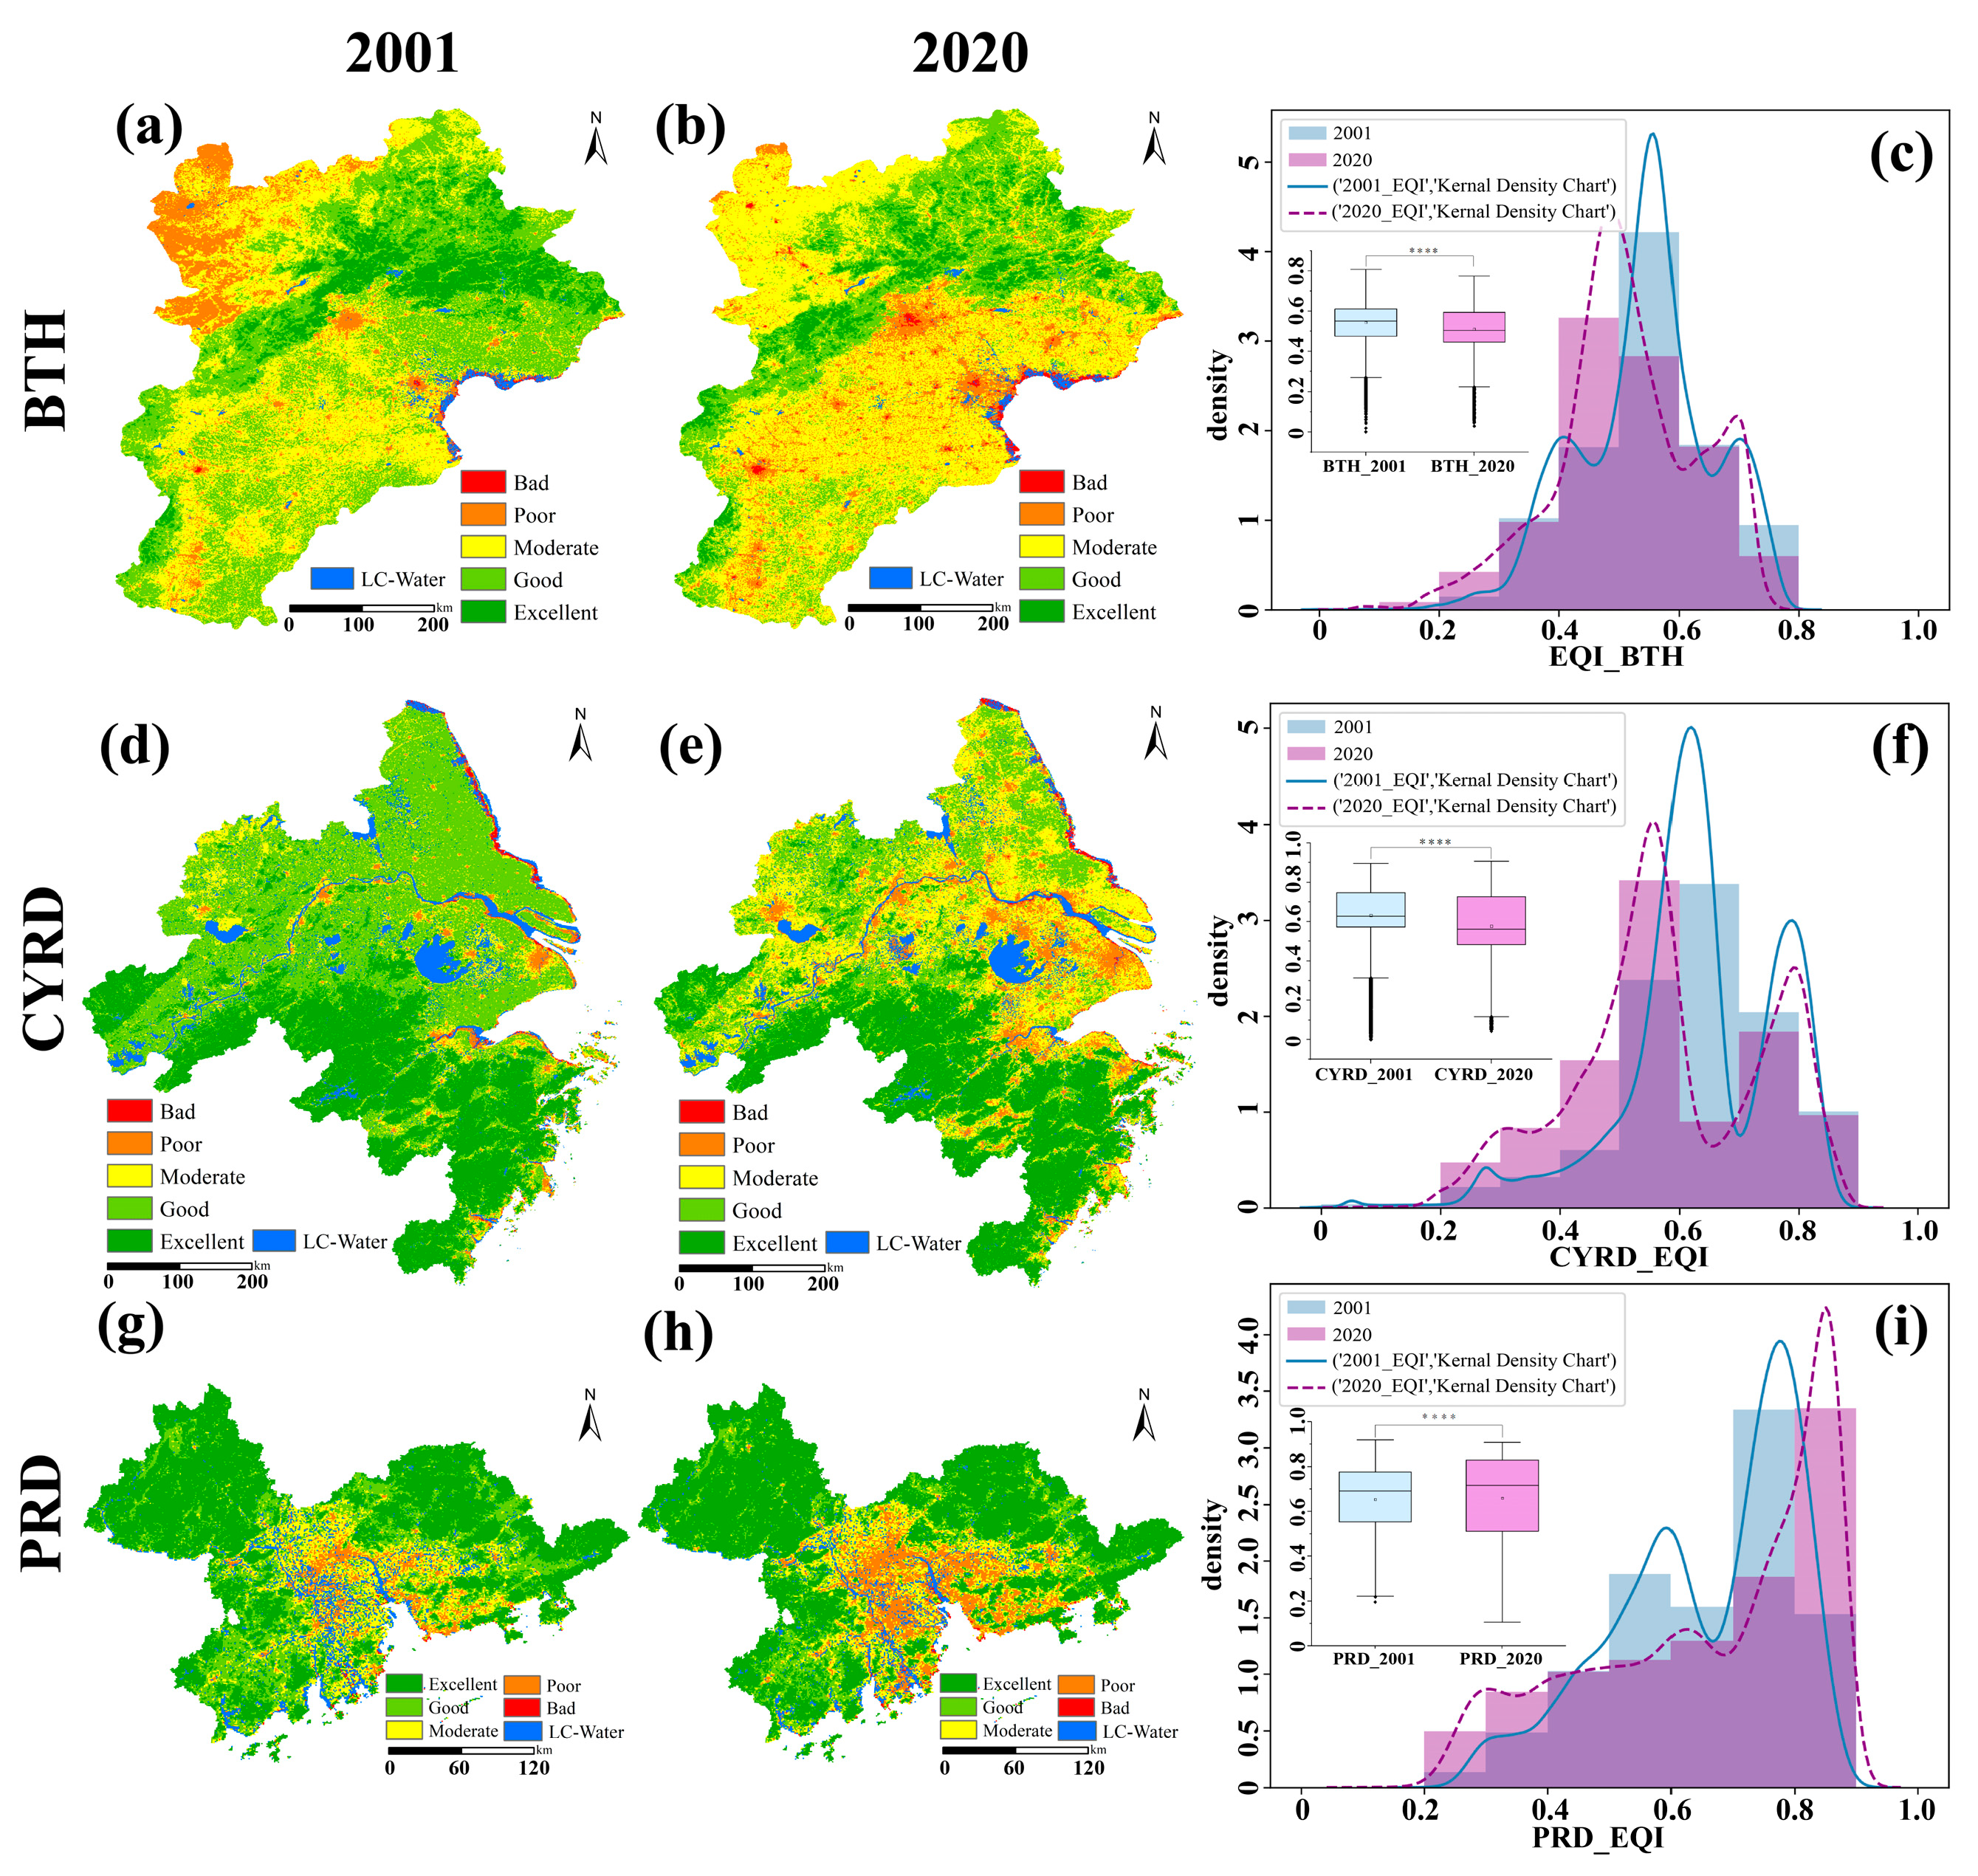
3.1. Spatiotemporal Changes of EQI in Urban Agglomerations

Figure 3 presents the grading results of the Ecological Quality Index (EQI) spatial pattern distribution in urban agglomerations of Beijing–Tianjin–Hebei (BTH), the core region of the Yangtze River Delta (CYRD), and the Pearl River Delta (PRD). In general, the spatial and temporal distribution of ecological quality in three urban agglomerations align with previous studies [90,91], showcasing highly significant changes in EQI. Across all three, there is a consistent decrease in overall EQI as latitude rises. Pixels with higher EQI are primarily concentrated in the northeastern and southern regions of BTH and CYRD, respectively (Figure 3a,e). For PRD, the statistical distribution pattern reveals a centralization of low values with dispersed high values (Figure 3i). The observed leftward shift in the highest proportion of EQI value range indicates a deterioration in the overall ecological quality of BTH and CYRD (Figure 3c,f). The polarization trend in PRD was more pronounced evidenced by the spread of EQI towards both high and low ends. Regarding the intersection area between EQI bars in 2001 and 2020, regions with higher EQI above 0.7 in BTH and CYRD exhibited little ecological change, while that of PRD increased noticeably (Figure 3c,f,i).
Table 4 quantitatively showed the changes of EQI with different levels. We found that BTH and CYRD witnessed the transformation from the pixels with “Excellent” and “Good” towards to the pixels with moderate EQI. The pixels with “Moderate” EQI increased 34.8%, and 151.6%, respectively for BTH and CYRD, making the ratio of “Moderate” pixels rise to 50.61% and 31.52%, respectively. As for PRD, the pixels with “Excellent” EQI and “Poor” EQI both increased, however the “Excellent” pixels account for the greatest proportion for both 2001 and 2020.
Figure 4 presents a chord chart illustrating the EQI changes among different EQI grades, while Table 5 provides the transition matrix within each EQI grade. It is observed that the EQI grade covering the largest area continuously improves from BTH to CYRD and PRD (Figure 4a–c). The conversion of EQI grades primarily occurs between adjacent grades, with CYRD having the lowest proportion exceeding 89%. Notably, BTH and CYRD predominantly exhibit transitions from “Good” to “Moderate” and from “Moderate” to “Poor,” respectively (Figure 4a,b). This phenomenon is correlated with the urbanization level of ecologically deteriorated areas. In Figure 4 and Table 5, the main ecological deterioration pathways of BTH and CYRD are “Good-Moderate” with the ratio at 43.7% and 46.3%, while “Moderate-Poor” occupied the maximum conversion area of ecological deterioration with 3100 km2 (Table 5). The ratio of EQI degradation area to EQI improvement area in CYRD is 3.6 times and 6.9 times that of the BTH and PRD.

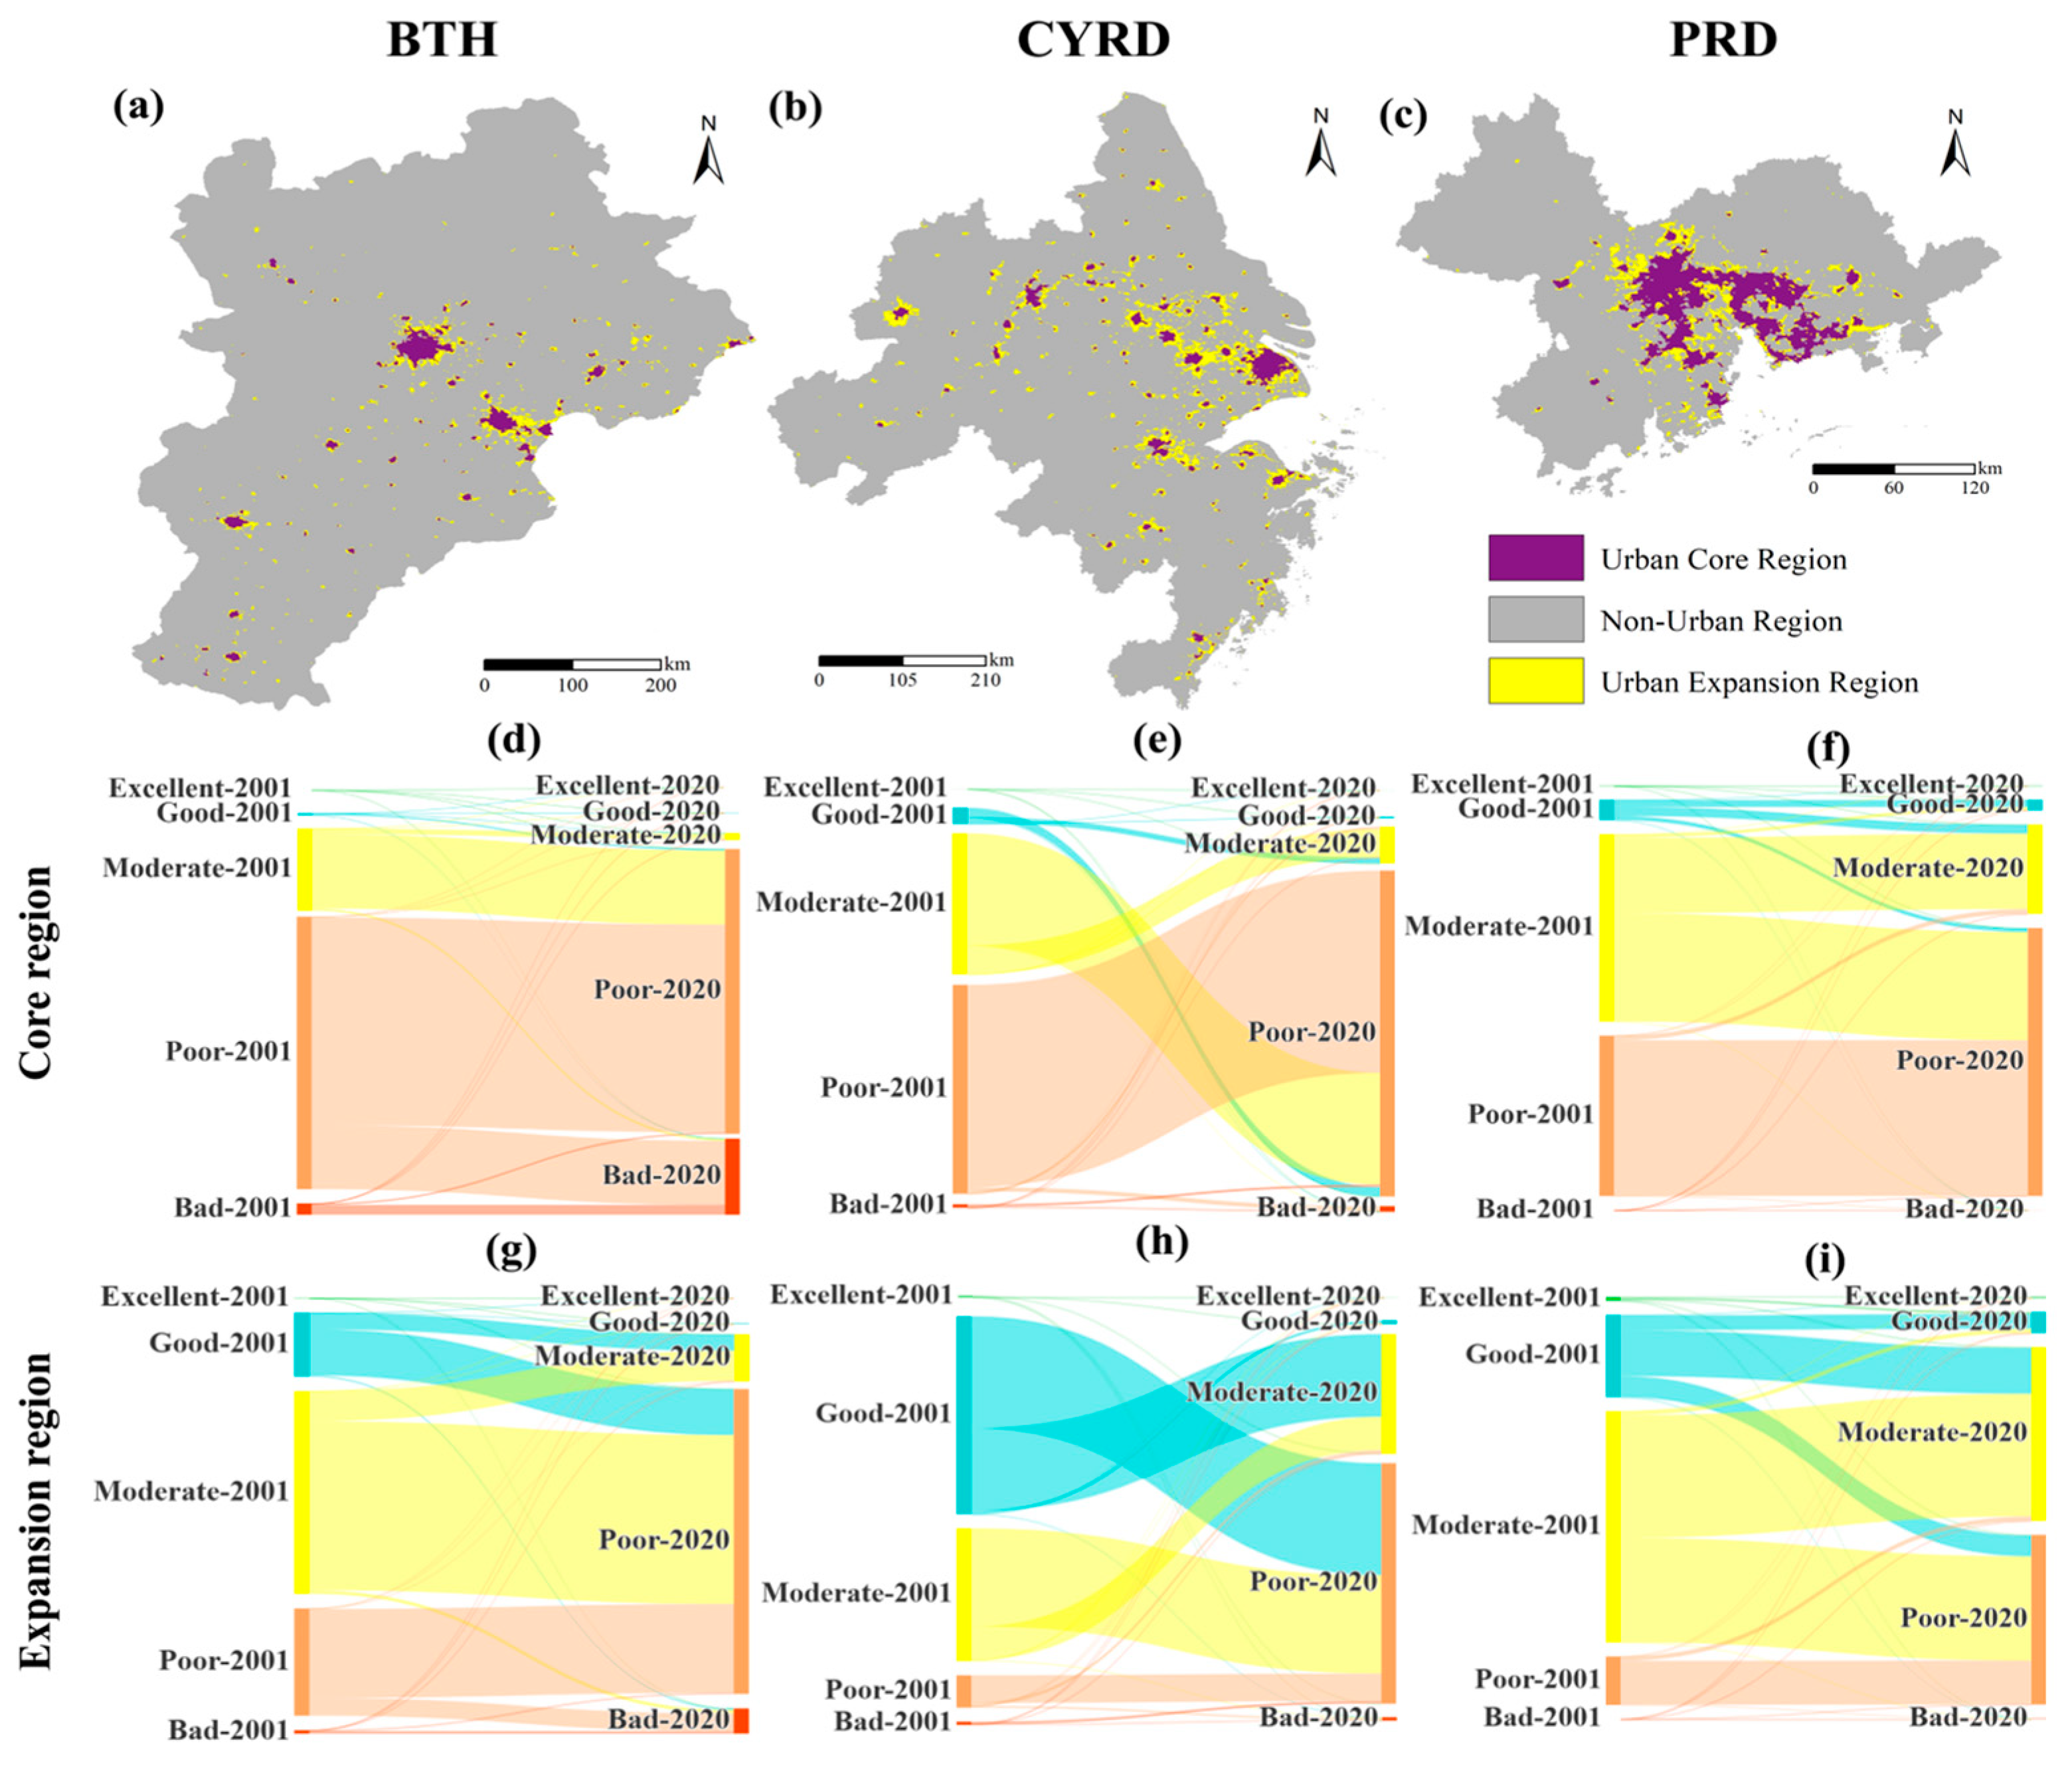
3.2. Impact of Urbanization on Ecological Quality in Urban Built-Up Area

Figure 5 displays the location of the core regions and expansion regions in the three study areas, along with the corresponding EQI transitions across different grades. The comparison results reveal that PRD has the largest core region area (5177 km2, 9.90% of the total land area) (Figure 5c), while CYRD exhibits the highest ratio of expansion areas (approximately 252.9%). Referring to Figure 3, it is evident that urban expansion primarily occurs in two types of areas: the periphery of the urban core region and flat terrains suitable for farming with sufficient water.
In the core regions of all three urban agglomerations, the main EQI transition between different levels is from “Moderate” to “Poor” (Figure 5d–f), with the conversion ratios of all “Moderate” pixels reaching 91.6%, 74%, and 52.4%, respectively (see Table S2). The expansion regions of all three study areas are experiencing a decline in EQI, with the ratio of expansion areas undergoing EQI decline being approximately 60% for BTH and CYRD and about 40% for PRD (Table S2). The main transition directions are from “Moderate” to “Poor” and “Good” to “Poor” (Figure 5g–i). Notably, in 2020, the proportion of pixels with EQI levels of “Moderate” and “Poor” in all three urban clusters exceeded 90%, with the most pronounced decline observed in CYRD (Table S2).
Table 6 depicts the land cover (LC) transition conditions in the three study areas. As depicted in the table, cropland conversion accounted for approximately 90% of the new impervious land area in both BTH and CYRD, while constituting about 78% in PRD. Speculation arises that human activities have altered scattered water systems, wetlands, and lakes around the city through water filling and land reclamation, thereby making water bodies the second most significant source of LC transition for urban built-up areas in 2020 [92]. Upon comparing the results in Table 6, it becomes apparent that pixels witnessing EQI deterioration are essentially aligned with the locations of LC undergoing urbanization-related changes. This implies that the primary means and cause of ecological quality damage from urbanization is the alteration in land use patterns; specifically, urban built-up areas correlate with pixels exhibiting poor and bad EQI. Between 2001 and 2020, the spatial location and land area where EQI degraded to ‘Poor’ in urban expansion areas demonstrate a high overlap with the region converted to impervious surfaces. Nearly all pixels degraded to ‘Bad’ are situated in the urban core area.

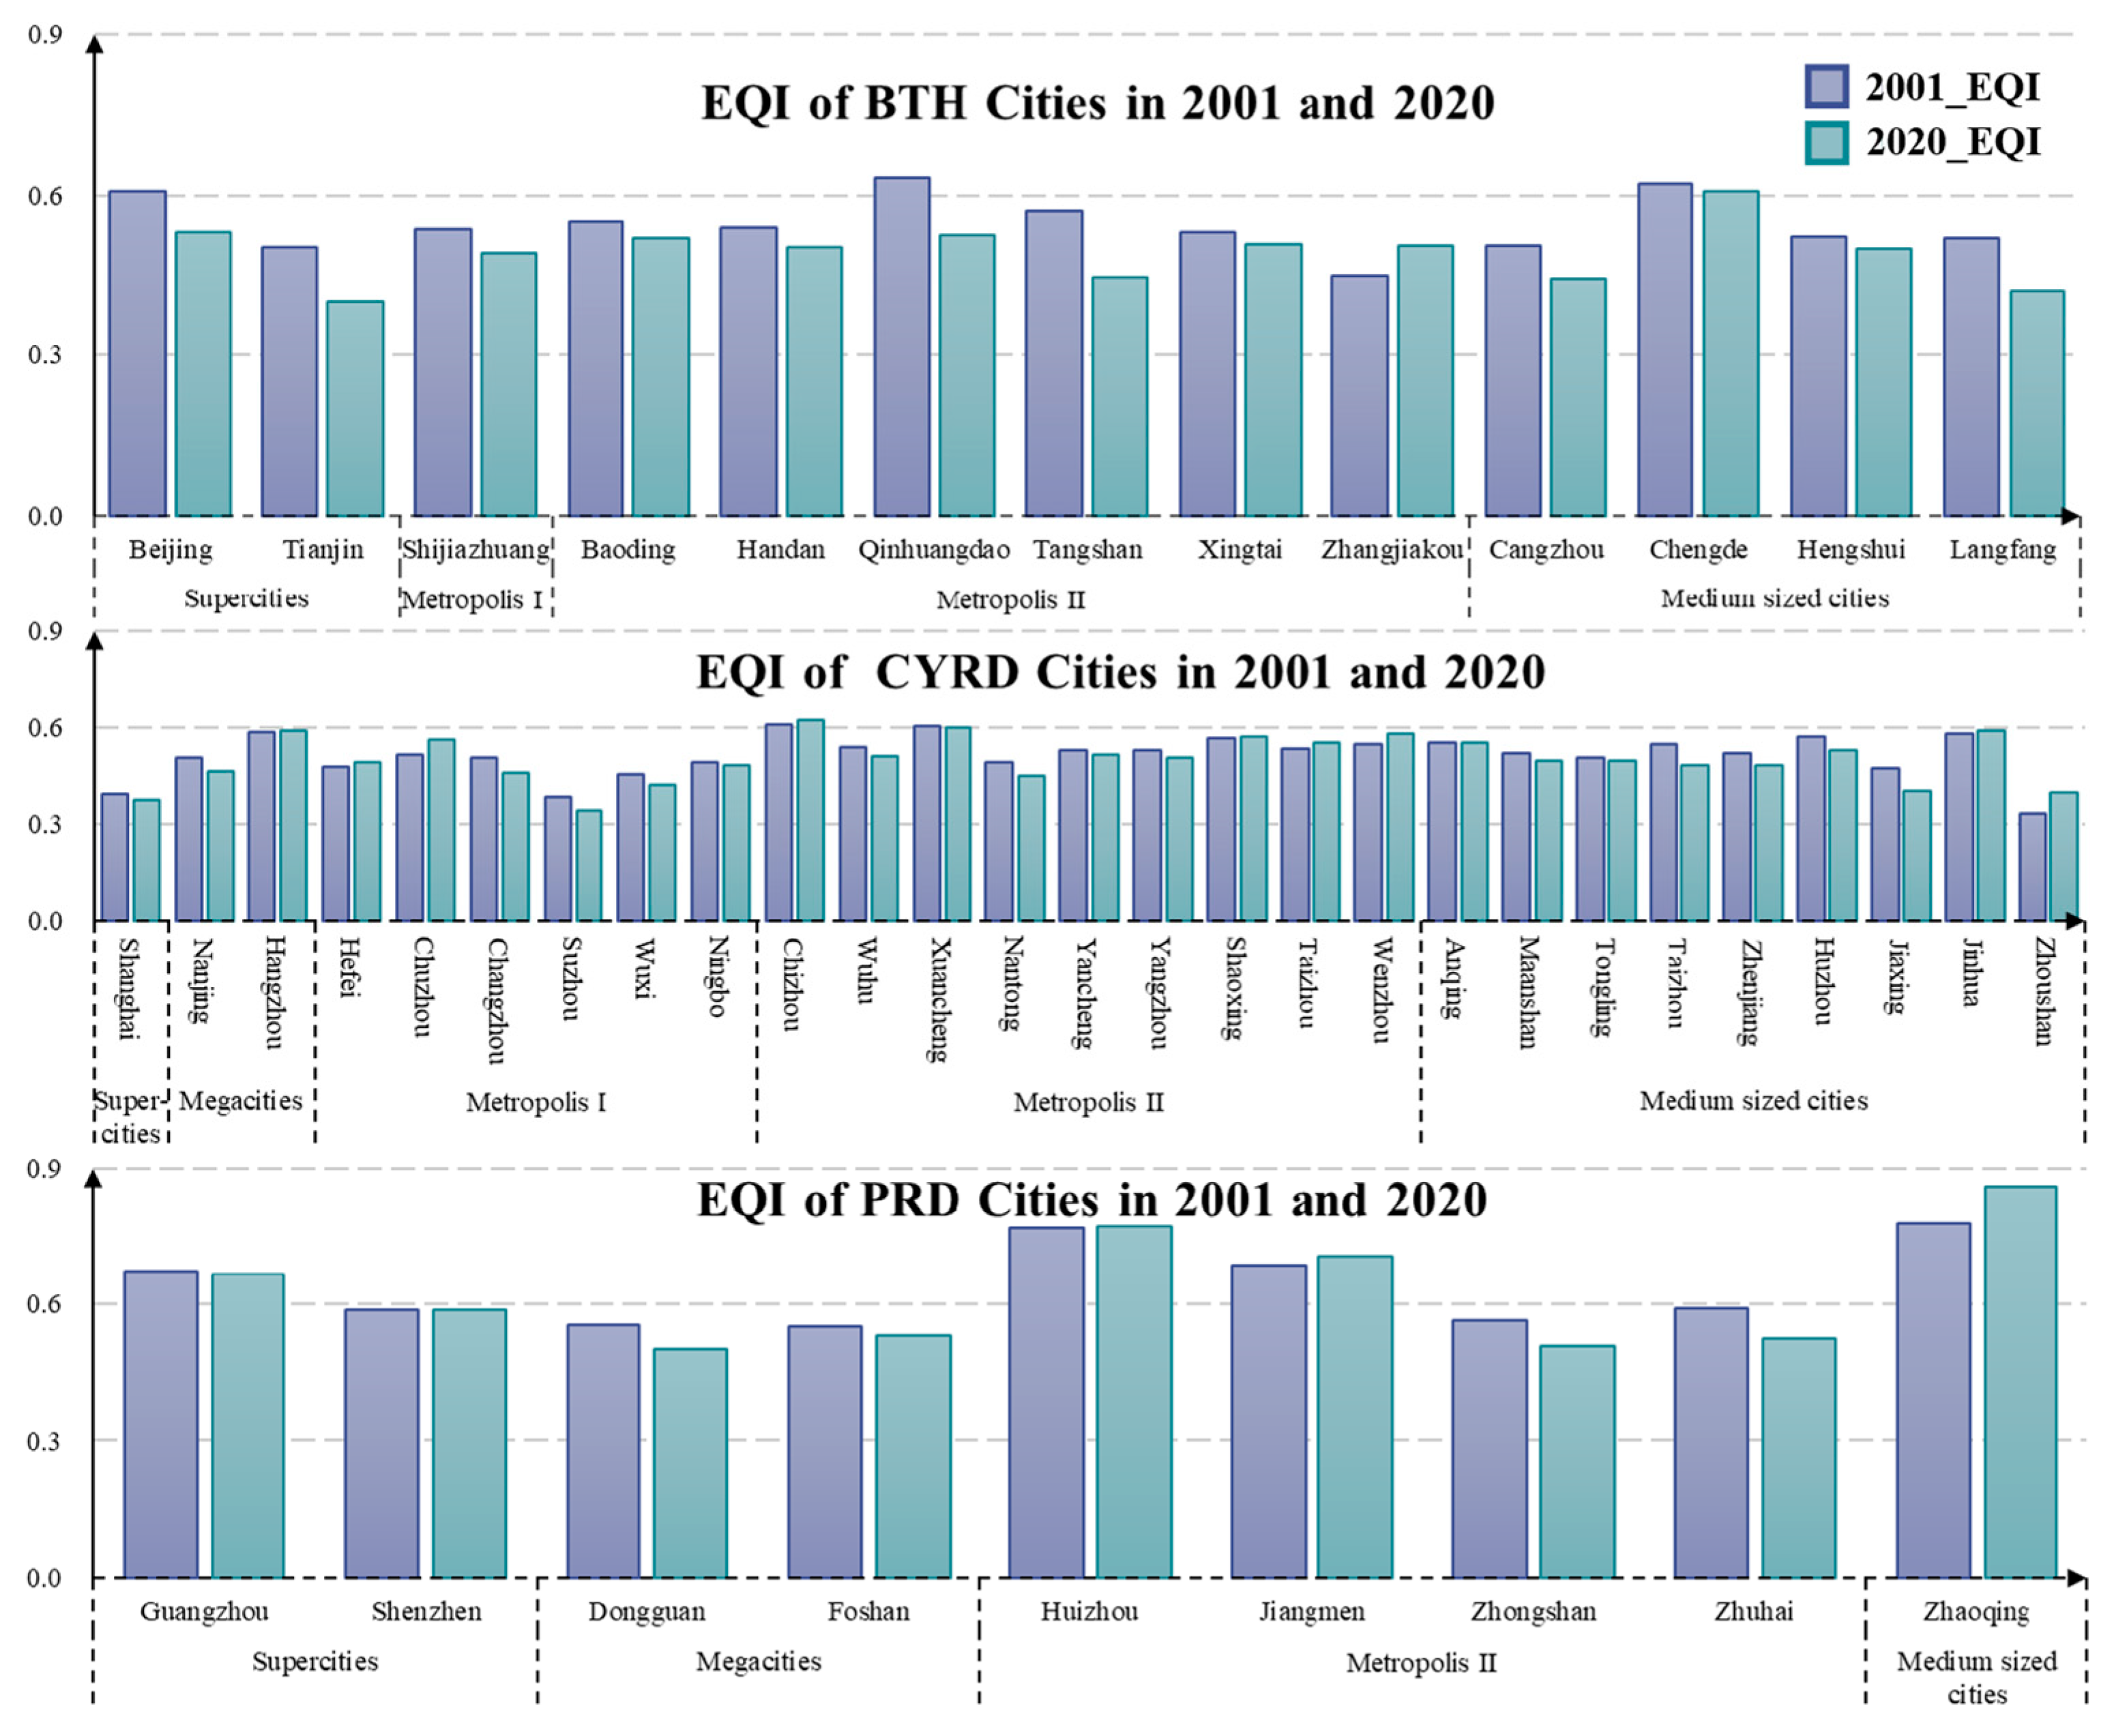
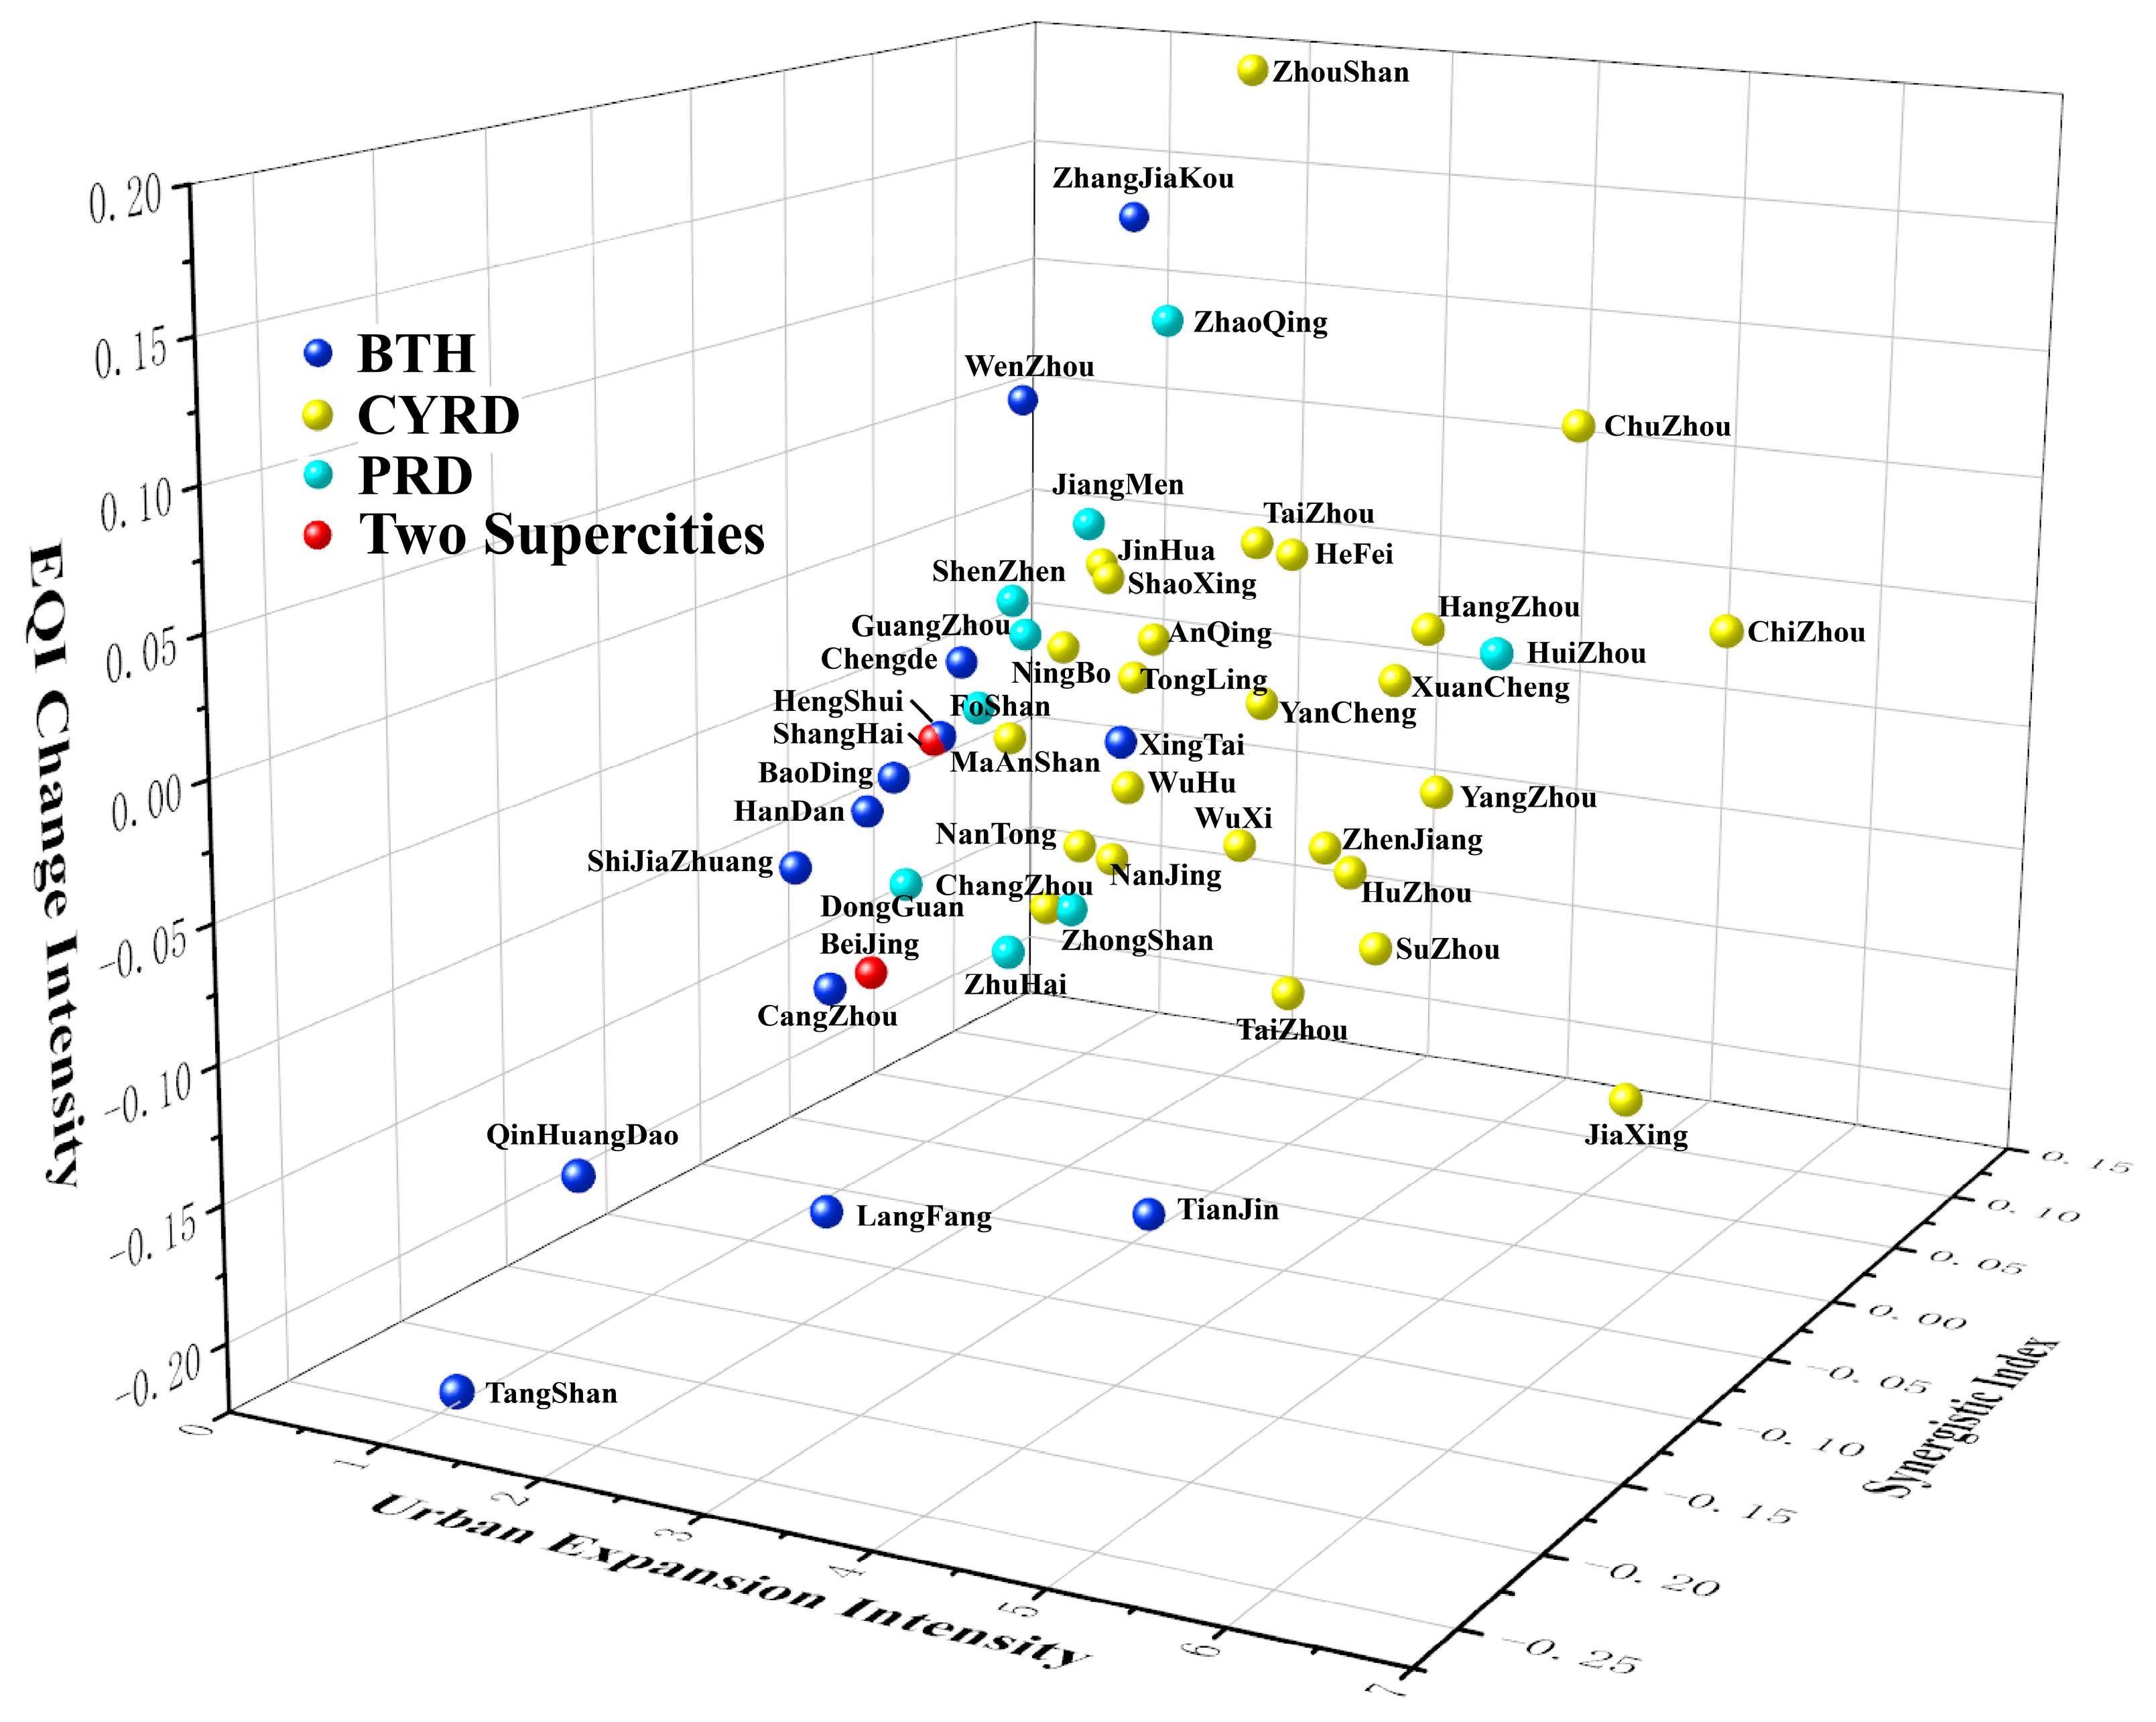
3.3. Analysis of EQI and USI in City-Level

In this study, the EQI changes of each city in the three major urban agglomerations were also calculated, as shown in Figure 6. Most of cities’ EQI in the three major urban agglomerations has decreased. In addition, the pattern of EQI in the three major urban agglomerations are not consistent, with Beijing, Tianjin, and Hebei having the worst balance. Zhangjiakou in the BTH, Zhoushan in the CYRD, and Zhaoqing in the PRD have improved their EQI mainly due to the intervention of projects such as the “Water Containment Forest”, the “Three North Protection Forest Program”, and the PRD Ecological Protection Belt. Another important reason for the ecological improvement is that these cities are farther away from urban land expansion centers and have less ecological pressure. In addition, cities with high EQI have also attracted attention. Cities such as Chengde, Zhaoqing, Huizhou, Wenzhou, and Hangzhou have high forest vegetation cover, rich natural and biological resources, great initial ecological quality, low impact by urbanization, and national ecological barrier protection projects that together guarantee ecological security. As for the cities whose EQI decreased, urban expansion and its negative effects are the main reasons. For example, in Tangshan City in the BTH, Taizhou City and Jiaxing City in the CYRD, and Zhuhai City and Zhongshan City in the PRD, the main causes of ecological degradation are reduced ecological resilience due to reduced vegetation and urbanization-induced land use changes, high levels of pollution, and industrialization. Another reason why the EQI of each city varies greatly may be the influence of economic development of cities. Shanghai already had a high level of urbanization in 2001, and the spreading effect of urbanization has allowed ecological degradation to occur mainly in its periphery, in Suzhou and Jiaxing.
The results regarding the intensity of urban expansion, EQI changes, and the Urban Synergistic Index (USI) are presented in Table S3. As illustrated in Figure 7, all cities in the CYRD exhibit a higher overall intensity of urbanization compared to those in BTH and PRD. The positioning to the right implies that the cities in the CYRD experience a high level of urbanization. PRD, on the other hand, demonstrates a relatively lower intensity of urban expansion. Several cities in the CYRD, such as Zhangjiakou, Wenzhou, and Zhaoqing, show significant improvements in EQI despite having lower levels of urbanization. Notably, most cities in the three urban agglomerations are concentrated in areas where the absolute value of USI is small. This suggests that the government has acknowledged the ecologically damaging effects of urbanization and has taken proactive measures. Consequently, the intensity of ecological deterioration is kept at a lower level despite the high intensity of urban expansion. Although the CYRD has experienced the largest area of ecological deterioration, many cities in this region have smaller absolute USI values, indicating successful efforts to reconcile urban economic development and ecological protection. However, certain cities, such as Tangshan, Langfang, and Qinhuangdao, exhibit low intensity of urban expansion but high intensity of ecological damage, necessitating close attention to ecological quality and the implementation of active measures. Effective strategies may include establishing protected areas to safeguard vegetation and biological resources, regulating industrial pollution emissions, and rigorously addressing encroachments on ecological land. In the cases of Beijing and Shanghai, Shanghai demonstrates relatively less ecological quality deterioration despite similar urban expansion intensity with Beijing. Consequently, the smaller absolute value of Shanghai’s USI indicates better performance in reconciling the human–land conflict.

4. Discussion

4.1. Feasibility and Rationality of Evaluation Methods

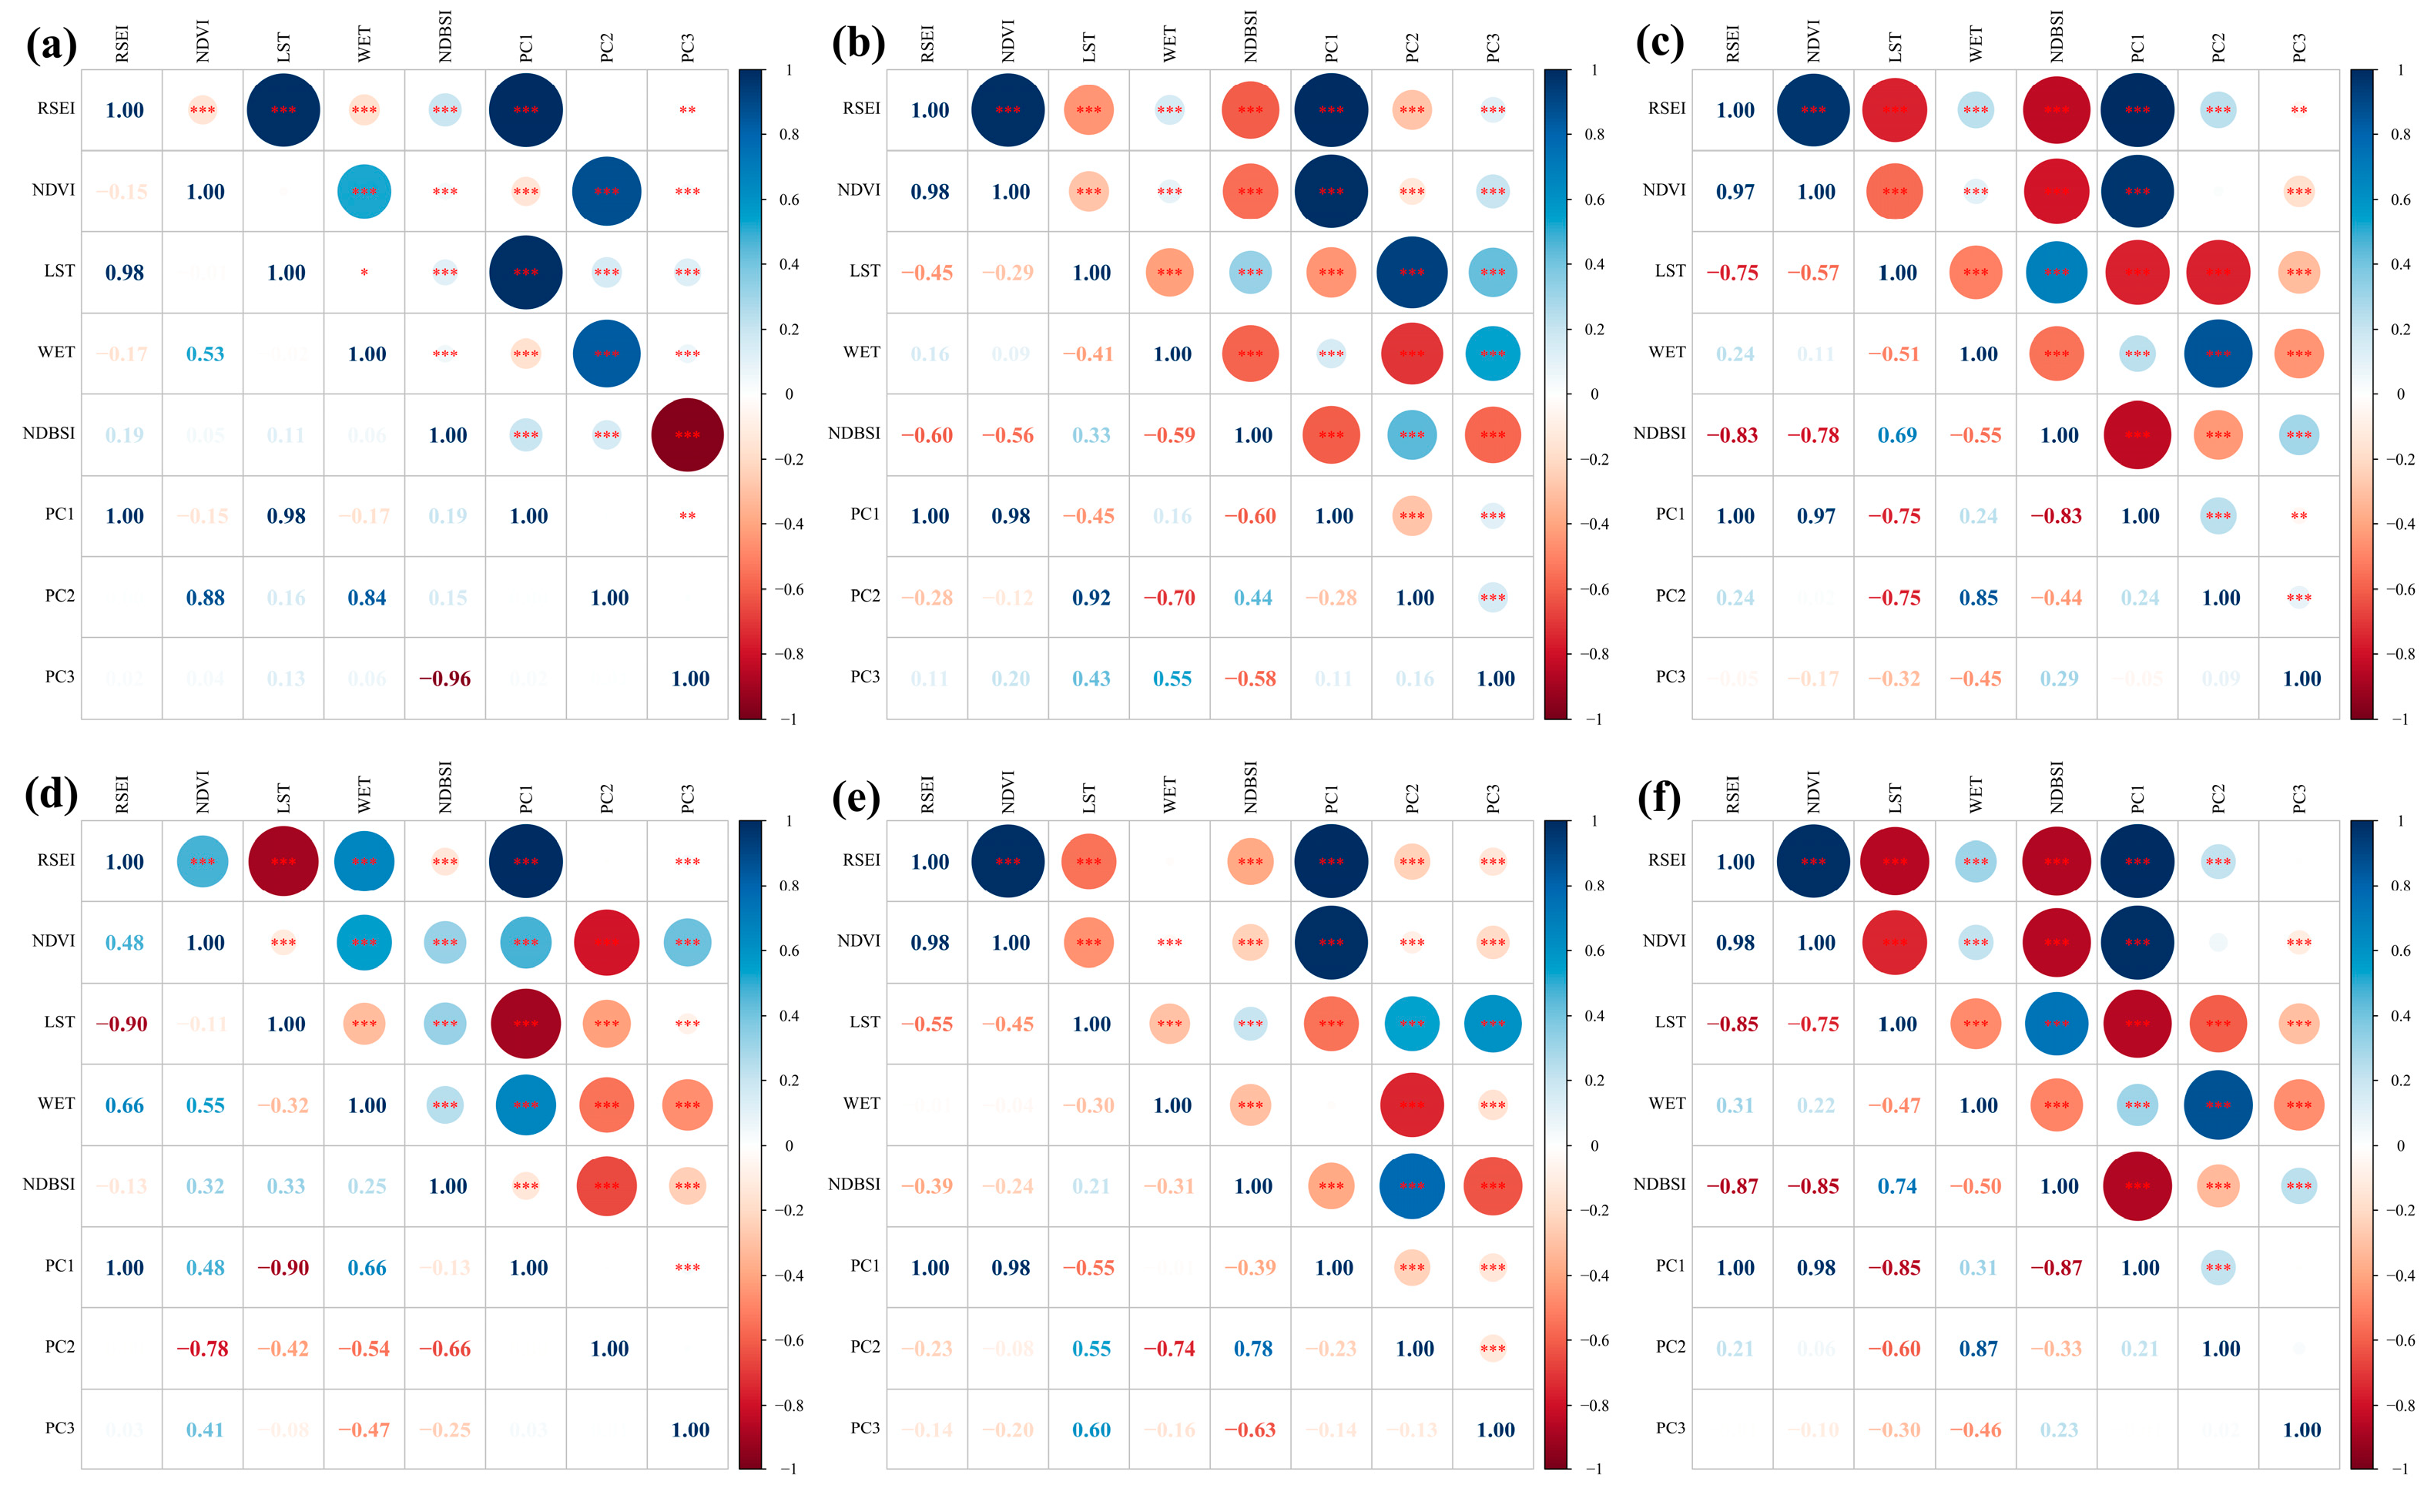
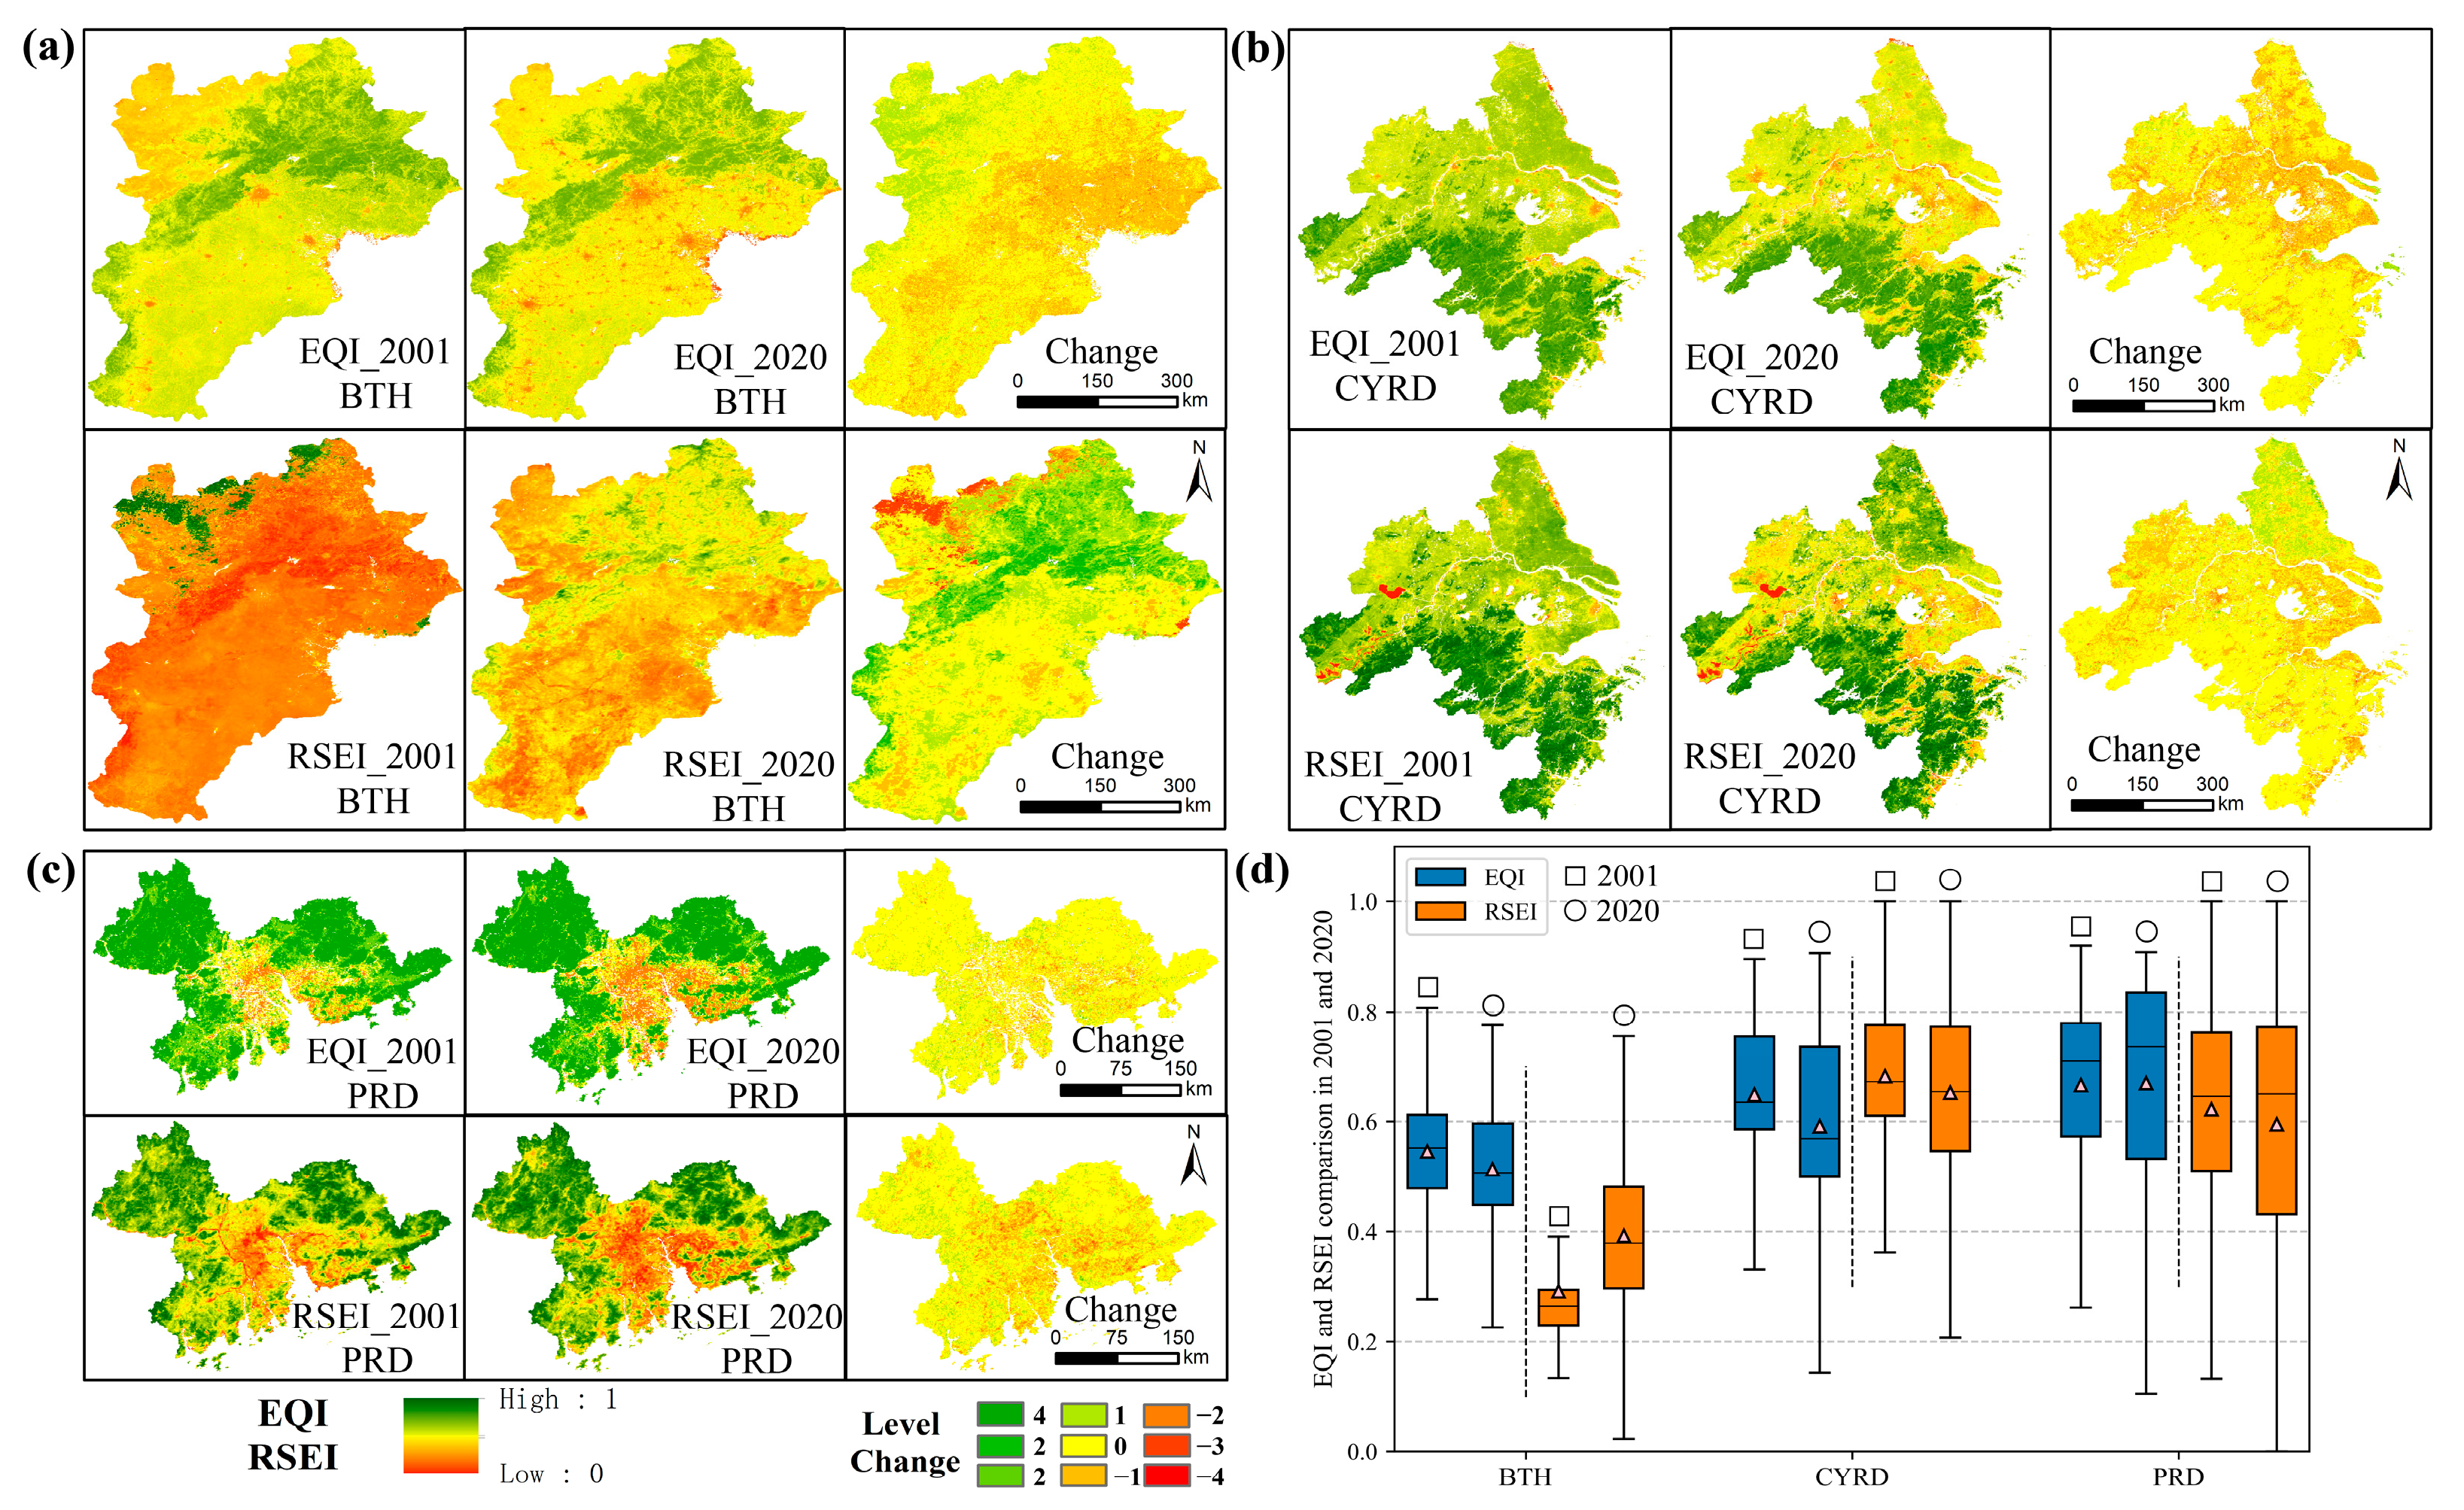
4.1.1. Comparison with Remote Sensing Ecological Index (RSEI)

RSEI serves as an effective indicator for assessing ecological quality and has been widely utilized in ecological assessment tasks across various scales. The Google Earth Engine (GEE) platform was employed to calculate the RSEI of three urban agglomerations in 2001 and 2020 using the MOD09A1, MOD11A2, and MOD13A1 datasets. We conducted an evaluation of the similarities and differences between EQI and RSEI concerning statistical distribution and spatiotemporal changes.
As depicted in Figure 8, the term “Level Change” in the third image in Figure 8a–c indicates the subtraction of ecological quality levels from 2020 to 2001 after quantifying EQI levels from the lowest (“Bad”) to the highest (“Excellent”) using a scale of 1–5. A smaller value signifies more severe ecological damage. The overall spatiotemporal distribution of EQI closely resembles that of RSEI, particularly in the YRD and PRD regions (Figure 8b,c). Both EQI and RSEI reveal an increasing polarization trend in ecological quality changes between CYRD and PRD (Figure 8d). However, in comparison to the significant differences in RSEI, EQI not only distinctly highlights variations in ecological quality and temporal changes between urban agglomerations but also exhibits a more stable effect, especially in the BTH (Figure 8a).
Moreover, there are notable distinctions in the ability of different indicators to identify low- value and high-value areas of ecological quality. In contrast to the spatial distribution map of RSEI in BTH, EQI excels in identifying ecological quality decline due to urban expansion and improvement resulting from environmental protection and afforestation (Figure 8a). We conducted correlations among RSEI, the first three principal components, and the four key indicators of building RSEI, including NDVI. Our aim was to clarify the reasons for RSEI’s less favorable performance in BTH. Figure A1 demonstrates that almost all correlations passed the significance tests. Unlike CYRD and PRD, land surface temperature (LST) exhibits the highest correlation with RSEI in BTH, surpassing NDVI. Previous studies have questioned the model applicability and exponential suitability in environments influenced by various factors [93,94]. Some scholars have confirmed that RSEI may lose key changes when depicting long time-series ecological environment status, even resulting in opposite results [95,96]. The uncertainty of feature vectors and their directions may explain this issue [97]. Some research also inferred that RSEI can effectively characterize ecological quality only when the direction of NDVI and Wet is positive in the first Principal component [97].

4.1.2. Stability of Principal Component Analysis as Indicator Weighting

The contribution rates of the first principal component obtained after applying PCA to all three urban agglomerations exceeded 83%, with BTH at about 83.1%, and CYRD and PRD reaching 86.9% and 87.8%, respectively. To assess the applicability and stability of the PCA method in this study, we analyzed the influences of each variable in the three urban agglomerations on the first three principal components. However, it is important to note that the values presented here represent the scores of each variable, not the loadings. To obtain the loadings, the score matrix needs to be transposed and multiplied by the eigenvalues after taking the square root. In our calculations, the loadings of the majority of variables surpassed 0.4, indicating the significance of the selected variables. The selection of the first three principal components was based on the total explanatory power exceeding 95%.
As shown in Figure 9, the contributions of various indicators in different urban agglomerations remain relatively stable, indicating the effectiveness of the calculated weights across different urban agglomerations. Additionally, the symbols and sizes of each indicator in the first principal component, which has the highest explanatory power, are consistent, further affirming the reliability of the weights obtained through PCA (refer to the left row of all subfigures, PC1) [98]. Variables such as HD and GDP exhibit a certain negative contribution in ecological quality assessment. By comparing the performance of a single indicator in the first principal component across different urban agglomerations, valuable information can be gleaned. For instance, the contribution of PM2.5 gradually decreases with decreasing latitude, reflecting the diverse ecological challenges faced by the three urban agglomerations [99,100]. Previous studies have also indicated that PCA demonstrates stable and outstanding performance in identifying critical factors after dimension reduction [101].

4.2. Reasons for Selecting Indicators and Testing for Collinearity and Correlation

4.2.1. Principles and Basis for Selecting Indicators

Ecological quality is significantly influenced by various changes in the natural physical environment [102], encompassing climate variations, alterations in urbanized landscape patterns resulting from human activities, and the resilience of ecosystems in resisting disturbances and maintaining stability [103]. Drawing upon the established “FIPS” framework, we discuss the reasons for selecting indicators and their impact on ecological quality based on prior research and indicator concepts.
Ecological function (EF) characterizes the functional pattern and ecological status of the ecosystem, determined by parameters such as NDVI, LAI, GPP, and LC. Both LAI and NDVI reflect the current state of vegetation cover and biological resources [67]. Though NDVI showed certain correlation with LAI in some research, recent research continues to suggest that both indicators should be used when exploring the effects of climate change or urbanization on vegetation in large areas [68]. NDVI saturation in high vegetation areas, soil factor interference in low vegetation areas, and seasonal differences caused by various ecological vegetation types make it impossible for a single index to comprehensively evaluate the ecological quality of large scale [104]. Changes in Land Cover (LC) exhibit a strong correlation with alterations in regional ecological patterns and ecological quality, especially the conversion of ecological land to urban construction land [105]. Gross Primary Productivity (GPP) represents the productive capacity of plants and other individuals in the ecosystem, affecting the energy flow and equilibrium state of the ecosystem [69].
Ecological interaction (EI) explores the relationship between ecosystems and climate change interactions, utilizing temperature, precipitation, and PM2.5 concentration as indicators. Rapid urbanization intensifies the urban heat island, making monitoring temperature changes crucial for maintaining a suitable climate environment and establishing sustainable urban ecosystems. Abnormal precipitation disrupts human production, daily life, and critical components of urban ecosystems such as agriculture and green spaces [106]. PM2.5 levels reflect the air quality of urban agglomerations, playing a vital role in assessing livability and ecosystem health, especially given its significant impact on human health and environmental quality. In fact, PM2.5 is the main source of air pollution that troubles the three major urban agglomerations, with a greater impact on human health and environmental quality [107]
Ecological pressure (EP) quantifies the pressure of human activities on the ecological environment. Human density and GDP are closely associated with the level of urbanization development, quantitatively describing the pressure and perturbation of economic development on energy flow and material cycles under human activities’ intervention.
Ecological stability (ES) reveals the stability and resilience of ecosystems [76]. GPP plays a crucial role in maintaining the stability of ecosystems and the balance of energy and material processes [69]. The structural complexity of ecosystems and soil properties profoundly influence stability and resilience when ecosystems face disturbances. Ecosystem stability improves with higher soil nutrient availability and higher reproductive capacity [77].

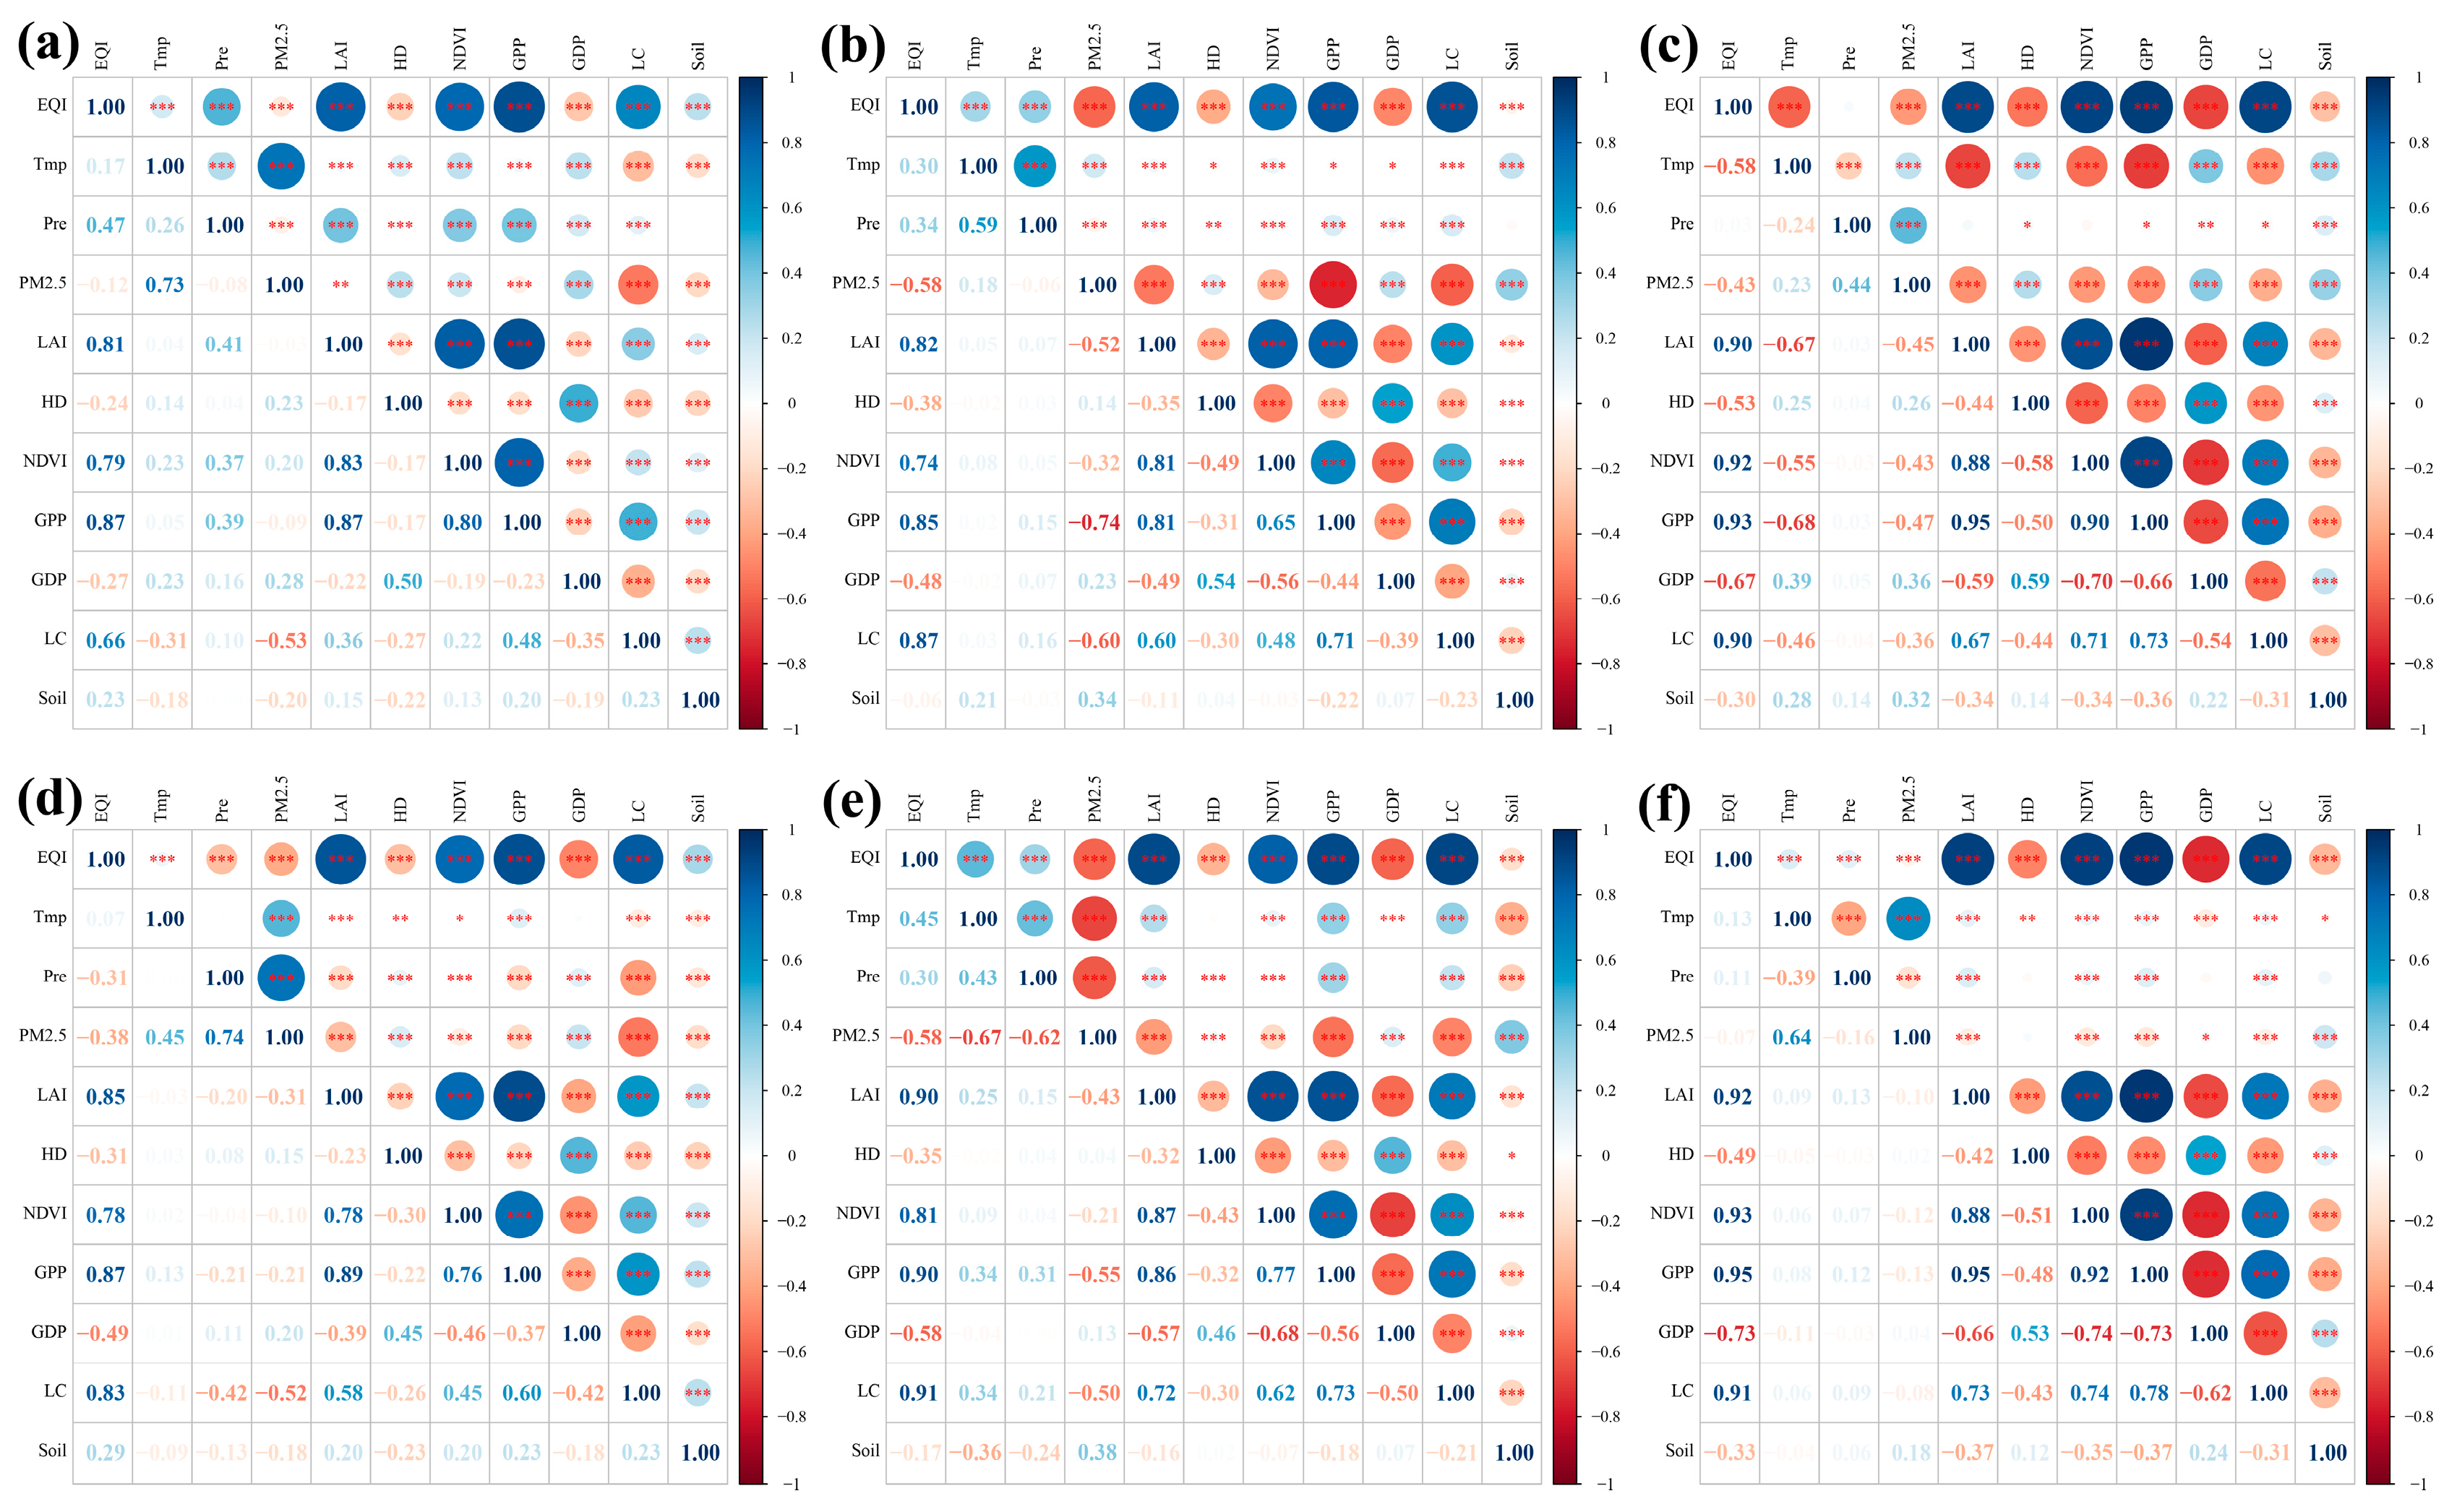
4.2.2. Correlation and Collinearity Diagnosis between Indicators

To assess the collinearity and correlation among various indicators, we randomly extracted 27,000, 30,000, and 8000 sample points from BTH, CYRD, and PRD, respectively. This extraction was based on the principle of maintaining a distance longer than 1 km between points to avoid autocorrelation while preserving the region’s area proportion. We utilized SPSS Statistics 25.0 to calculate the Variance Inflation Factor (VIF) and tolerance as indicators for diagnosing multicollinearity. A higher VIF suggests stronger collinearity. Specifically, a VIF greater than 5 indicates strong collinearity, while a VIF lower than 5 but higher than 1 implies moderate collinearity. The tolerance is an inverse measure, where a smaller value indicates stronger collinearity, and a limit of 0.2 is considered significant.
The results of the multicollinearity test for various indicators across the three major urban agglomerations, after averaging, are presented in Table 7. Notably, LAI and GPP exhibited strong collinearity, and Pre, LC, and NDVI showed more collinearity than other variables. Unfortunately, HD did not pass the significance test. It is essential to highlight that, upon separate sampling and collinearity calculation for PRD, most indicators exhibited increased collinearity, with LAI, GPP, and NDVI reaching values of 11.1, 18.6, and 7.3, respectively. The distinct relationships between various indicators across different urban agglomerations may obscure a certain degree of collinearity. Additional details regarding collinearity results for each urban agglomeration can be found in Table S5. Therefore, introducing principal component analysis (PCA) to reduce data dimension and collinearity between variables is deemed feasible.
As for exploring the influencing relationship between variables and EQI, we conducted a correlation diagnosis in the three urban agglomerations for the years 2001 and 2020. Actually, there are more studies introducing panel regression analysis due to its outstanding performance in controlling time dimension and solving the problem of heterogeneity to analyze the impact of various independent variables on the dependent variable [108,109]. However, we did not choose this method for several reasons. The first reason is that we collected various datasets in 2001 and 2020 to practice our method, lacking sufficient time information to construct a proper panel dataset. There would be more problems waiting to be solved, such as cross-sectional dependence, if we used a short panel database [110]. The second reason is that our research situation may not fit well the assumptions of many panel regression models. For example, the fixed effect model assumes that all unobserved heterogeneity is time-invariant and constant across time [111], but we are not sure to what extent the indicators have temporal variability, especially those indicators with strong correlation with other variables and geographical conditions [112].
The correlation results are presented in Figure 10. The test outcomes validate the rationale behind our framework and EQI. Combining the spatial patterns of ecological quality (see Figure 3) with correlation analysis (see Figure 10) yields important findings. It aligns with common sense that vegetation parameters and land cover in ecological function (EF) play a crucial role in influencing EQI (Figure 10). However, the negative effects from human activities, such as PM2.5 and GDP, cannot be overlooked (especially in Figure 10e,f) [44]. Furthermore, comparing the correlation between NDVI and LAI in different urban agglomerations, we observe a gradual decrease in correlation as latitude increases, with values of 0.78 in BTH and 0.88 in PRD (Figure 10d,f). This decline may be attributed to the saturation effect of NDVI in areas with high vegetation cover, underscoring the significance of selecting both NDVI and LAI as evaluation indicators [104]. Additionally, the impact of factors like precipitation and temperature on ecological quality in ecological interactions exhibits spatiotemporal variability and may even lead to negative impacts [113]. The correlations between PM2.5 and precipitation or temperature may involve the interactions of regional climate systems [114].
Examining specific urban agglomerations, the BTH region with an EQI between 0.4 and 0.6 has undergone significant ecological degradation, corresponding to the expansion of human land in the southeast (Figure 3a–c). This indicates that the influence of human activities, mainly land cover changes and socio-economic factors, on ecological quality is gradually increasing [115]. Over the past 20 years, there has been a noticeable increase in the correlation coefficients of LC, GDP, and HD with EQI (Figure 10a,d). For the CYRD, human influence factors and outcomes, including PM2.5, HD, and GDP, have steadily impacted ecological quality, especially GDP (Figure 10b,e). The higher proportion of land transitions to impervious areas, concentrated around water systems and metropolitan areas, has led to a substantial decrease in EQI, as visible in Figure 3e. In the PRD region, there are more prominent human–land contradictions due to the fragmented and complex ecological landscape and highly urbanized land management [116]. It exhibits the highest correlation of EQI with HD and GDP among the three urban agglomerations (Figure 10c,f). However, the negative impact of climate factors such as PM2.5 on ecological quality has significantly reduced, indicating that the PRD region has achieved notable success in addressing ecological degradation, particularly in managing air pollution [117]. The continuous urban land expansion in plain areas and ecological protection in hilly areas have led to a clear polarization trend in the ecological quality of PRD (Figure 3i).

4.3. Identification and Suggestions for Key Regulatory Areas

To identify areas that have experienced ecological deterioration and require key supervision and protection, we used the difference method and LISA (Local Indicators of Spatial Association) metrics (see Section 2.3.4 of Method and Appendix A) to analyze cold/hot spots to further explore ecological protection suggestions.

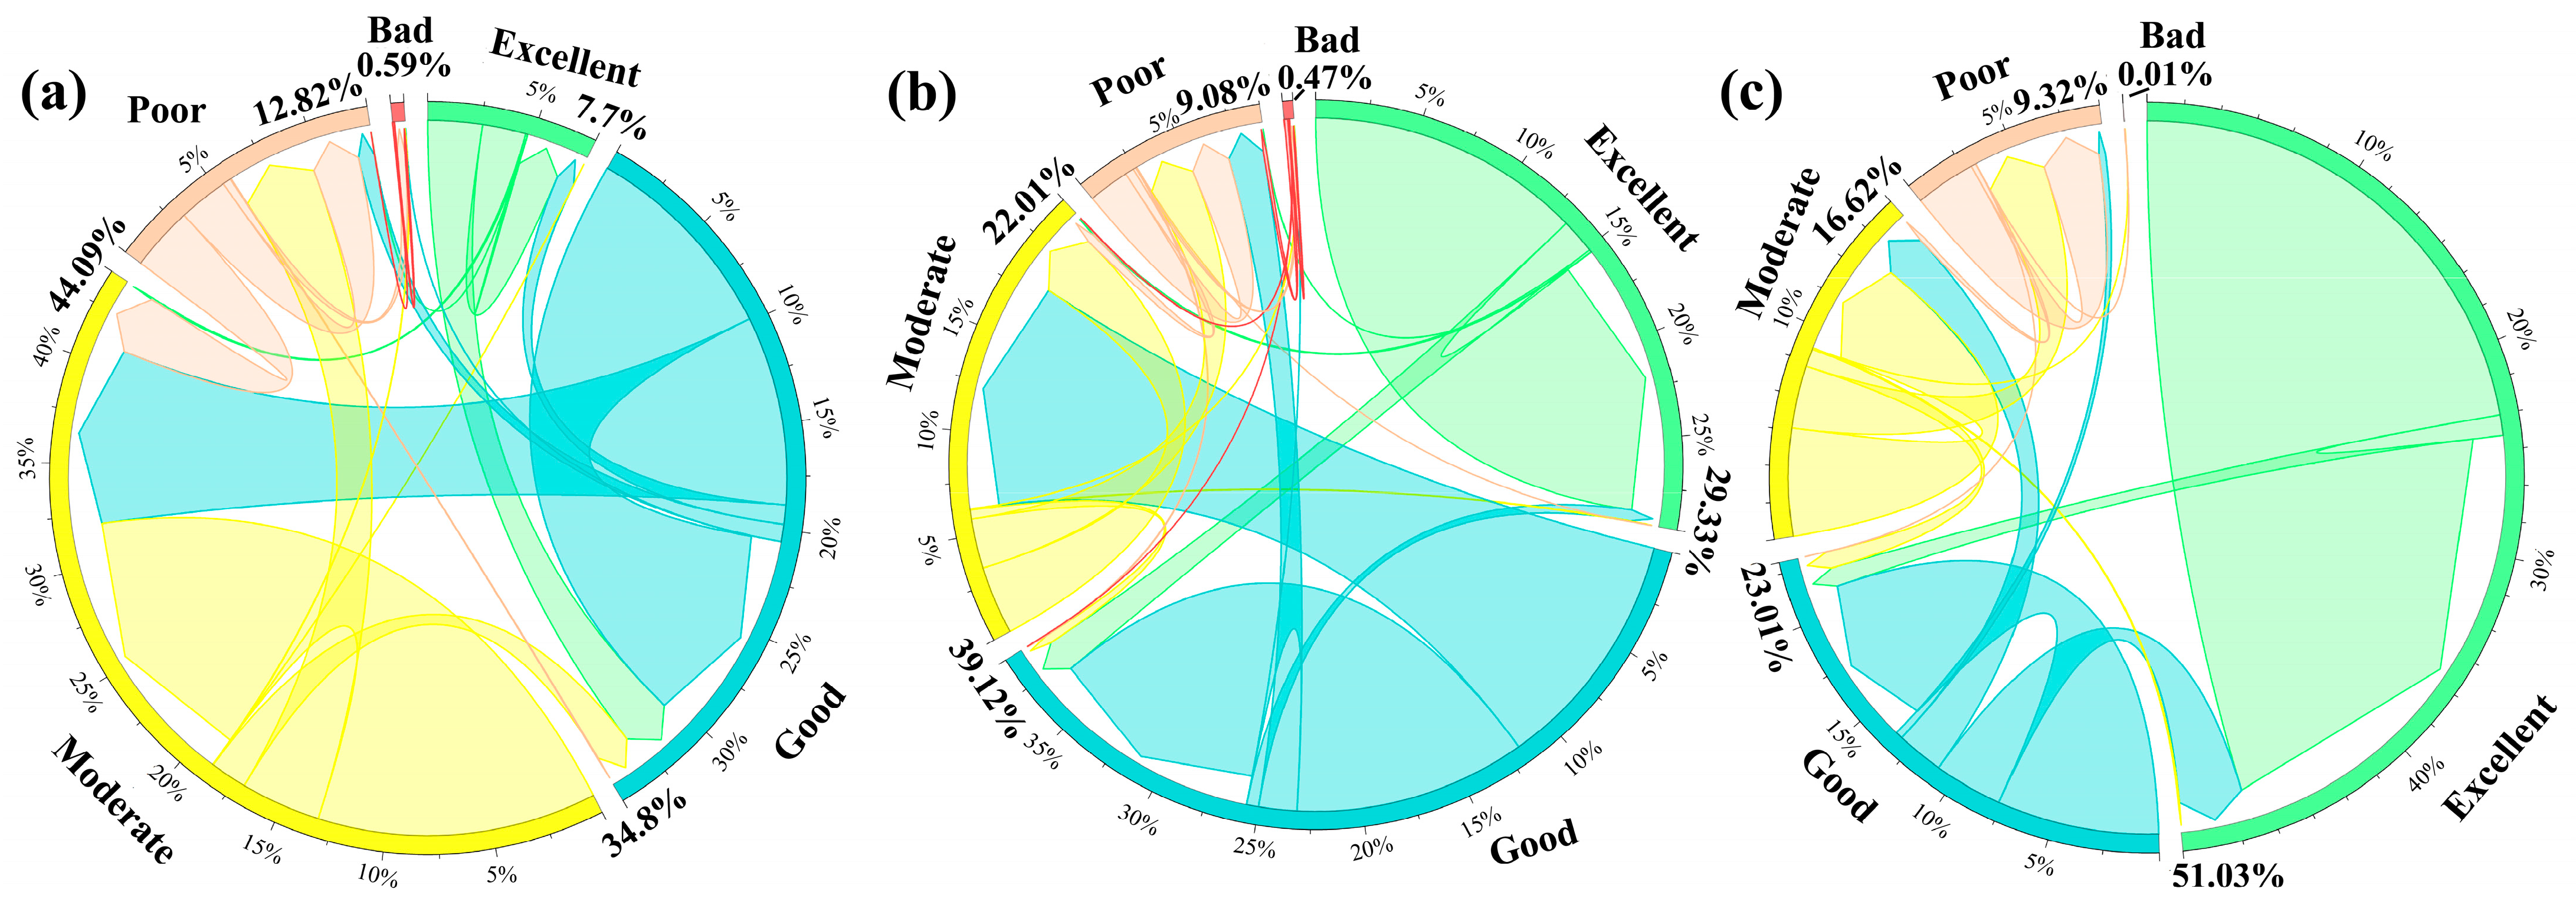
4.3.1. Spatial Distribution of EQI Changes

The spatial distribution of EQI changes is illustrated in Figure 11. It is evident that, for all three study areas, the EQI change pattern is dominated by Slight Improvement (SI) and Slight Deterioration (SD) when excluding Inapparent Change (IC) pixels. Specifically, SD has the largest proportion among pixels with changes and is distributed in the east of BTH (Qinhuangdao, Tianjin, and Tangshan), the north of CYRD (along the Yangtze River and near Shanghai), and southeastern PRD. SI mainly occurs in western BTH, coastal CYRD, and west and southwestern PRD. The distribution of pixels with increasing EQI aligns with the ecological protected area, while the distribution of pixels with decreasing EQI corresponds to the direction of urban expansion [40]. Details regarding the specific areas and percentages of EQI changes for each category can be found in Table S4.

4.3.2. Identification for Cold/Hot Spots of Ecological Quality Changes and Suggestions

Table S5 presents the global Moran’s I test results for the three study areas, with the p-value determined through 999 iterations of the Monte Carlo random permutation test. It can be inferred that both high- and low-value areas of EQI exhibit significant spatial clustering features (p < 0.0001) [118]. Subsequently, Local Indicators of Spatial Association (LISA) were employed to describe the heterogeneity of EQI clustering features and offer insights for planning and management in BTH, CYRD, and PRD. It is noteworthy that we reversed the detection focus of LISA to identify hotspots of ecological damage. The High–High (hotspot) areas and Low–Low (cold spot) areas were compared. As depicted in Figure 12, urbanization-induced ecological deterioration predominantly induces clustering in the “High–High” areas. Conversely, the “Low–Low” pixels have increased in the west of PRD, indicating improved EQI (Figure 12c,f). This underscores the potential for enhancing environmental quality through the establishment of ecological barriers or the implementation of ecological protection measures [40]. Additionally, it was observed that “Low–Low” clusters largely correspond to regions with favorable EQI conditions (Figure 3).
Two notable patterns, “Low–High” and “High–Low,” are also evident. The “Low–High” clustering pattern is primarily distributed in the southeastern part of BTH, with scattered pixels in hotspot areas facing a higher potential for further degradation (Figure 12d). These regions represent key areas requiring coordinated planning for agricultural production land and protection against urban development encroachment. “High–Low” pixels correspond to damaged or potentially damaged forested regions, providing planning suggestions for establishing protected areas (Figure 12d–f).
Analyzing the spatial heterogeneity of different regions is crucial for formulating targeted management policies. From the perspective of spatiotemporal changes in ecological quality, attention should be directed towards the expansion direction of cities, particularly in the surrounding areas of the initial urban zone. These areas include the southeastern part of the BTH region, the Yangtze River coast, the environs of Shanghai, and the central part of PRD. Persistent threats to ecological land use, such as arable land encroachment, land reclamation from lakes, and excessive animal husbandry, necessitate the development of specialized management policies for the urban–rural fringe. Additionally, raising awareness among farmers regarding ecological protection can be an effective measure. Furthermore, monitoring the ecological quality of regions exhibiting “High–Low” and “Low–High” clustering modes in Figure 12 is essential, given their higher potential for ecological changes. Additionally, substantial disparities exist in urbanization intensity and ecological quality changes among different cities. As depicted in Figure 7, commendable efforts in balancing economic development and ecological environment protection have been observed in the Yangtze River Delta region. Valuable lessons can be drawn from cities such as Chizhou, Hefei, and Huizhou, which have experienced high urbanization intensity coupled with improved ecological quality over the past two decades. Conversely, cities like Langfang, Qinhuangdao, and Tangshan, characterized by lower urbanization intensity but more severe ecological quality damage, should promptly implement ecological protection measures. Measures to reduce dependence on heavy industry and promote sustainable new energy sources can effectively enhance air quality. The classification of protection levels based on ecological quality, coupled with regular assessments and on-site inspections, will contribute to the continuous improvement of ecological environment quality and enhance public well-being.

4.4. Limitations and Future Research Prospects

The spatiotemporal distribution of ecological quality obtained in our study aligns with previous research [119], establishing a reliable method for assessing changes in Ecological Quality Index (EQI) within the three major urban agglomerations. This study reveals significant spatial heterogeneity in ecological environmental quality and identifies ecological hotspots that need protection and monitoring within the context of urban expansion. Despite these findings, it is important to acknowledge the limitations of our research. Firstly, changes in ecological quality are influenced by various factors, making it challenging to provide a comprehensive explanation of ecological quality distribution and influence pathways using limited indicators [120]. Especially for complex systems like cities, it would be more reasonable to quantify the relationship between urban scale and ecological quality changes by considering factors such as population size, land expansion, and management policies [88]. Secondly, the study focused on EQI for two specific years, 2001 and 2020. However, a more refined analysis of the temporal distribution would enhance our understanding of the driving factors behind EQI changes by introducing panel regression analysis after constructing a long panel [121]. Even strong seasonal variations in climate and vegetation factors should be considered, because vegetation activities and phenological changes can also affect local climate by regulating the surface energy budget [122]. Additionally, we can explore the excellent performance of spatial econometric models such as Spatial Durbin Model (SDM) to analyze variables’ influence on ecological quality and estimate their trend.
Therefore, future studies should aim to investigate shorter time interval data to capture the dynamics of ecological quality over time, even on a seasonal scale utilizing some spatial econometric models. Moreover, incorporating more comprehensive indicators that encompass both human activities and natural factors may be a more scientific solution to evaluating ecological quality in cities. Despite these limitations, the proposed “FIPS” framework has shown stable and good performance in large-scale ecological quality tasks, and the introduction of multi-level and more scientific indicators also provides a foundation for the popularization and promotion of the framework. More importantly, this study provides a feasible method to maintain the balance between ecological and economic development in urban areas and establishes an ecological quality monitoring network. Simultaneously, by combining the distribution of protected areas, ecological redline and ecosystem services, it is possible to analyze existing imbalances in urban planning and ecological management to provide targeted and sustainable management recommendations for improving regional ecological quality [123].

5. Conclusions

This study constructs a “Function–Interaction–Pressure–Stability” (FIPS) index system to assess the ecological quality changes in three major urban agglomerations in China. Combing AHP and PCA methods to determine the indicator weights, we constructed the Ecological Quality Index (EQI) based on a linear model, leading to the following conclusions:
(1) From 2001 to 2020, the EQI status of the three urban agglomerations changed significantly, with the overall EQI of BTH and CYRD decreasing and the EQI of PRD increasing. Ecological degradation occurred mainly in flat agricultural areas, areas with sufficient water and around economic centers, such as the southeastern part of BTH, the Yangtze River, and Shanghai neighborhoods. CYRD had the largest proportion of ecologically deteriorated areas.
(2) Comparing the ecological quality and land cover changes in the core and expansion areas of urbanization, we found that PRD has the largest share of the core area (about 9.9%) and the expansion area of the CYRD occupies the largest share of the area (252.9%). Ecological deterioration was more severe in the expansion areas, so the percentage of ecological deterioration of all land area of BTH and CYRD reaches 60%. Additionally, the location of pixels where ecological deterioration occurs is highly consistent with the location of the new impervious surface due to urbanization LC transfer. Therefore, the main reason for the deterioration of ecological quality is the change of LC.
(3) From the analysis results of the EQI and the Urban Synergistic Index (USI), we found that most cities have witnessed ecological deterioration because of the rapid urbanization. The patterns of EQI in all cities of BTH are the most discrete and unbalanced. However, many cities are concentrated in locations where USI is small in absolute value, especially cities in CYRD, meaning the intensity of ecological deterioration is maintained at a low level compared to the high intensity of urban expansion. Furthermore, some cities from BTH, such as Tangshan and Qinhuangdao, should pay more attention to balancing economic growth and ecological protection.

Supplementary Materials

The following supporting information can be downloaded at: https://www.mdpi.com/article/10.3390/rs16010045/s1, Table S1: Lists of cities of BTH, CYRD and PRD. (UA refers to urban agglomeration); Table S2: Area and occupancy rate of EQI at various levels in core and expansion areas in 2001 and 2020 in three urban agglomerations; Table S3: Result of intensity of urban expansion, EQI changes and USI of all cities in three urban agglomerations. (UEI, EQICI and USI mean the urban expansion intensity, EQI change intensity and urban synergistic index, respectively); Table S4: Total area and land occupation rate of E Q I at various levels of urban agglomerations; Table S5: Results of collinearity diagnosis of single urban agglomeration; Table S6: Global Moran’ I measurement results of EQI in three urban agglomerations.

Author Contributions

Conceptualization, Y.G., X.Z. and H.W.; methodology, Y.G.; data processing, Y.G. and S.Z.; validation, Y.G., S.Z. and W.S.; resources, X.Z.; data curation, Y.G. and S.Z.; writing—original draft preparation, Y.G. and S.Z.; writing—review and editing, Y.G. and X.Z.; visualization, W.S. and S.Z.; supervision, X.Z. and H.W.; funding acquisition, X.Z., Y.G. and S.Z. are co-first authors and contributed equally to this work. All authors have read and agreed to the published version of the manuscript.

Funding

This research was supported and funded by the National Key Research and Development Program of China (Grant No. 2021YFB3901105), the Open Research Program of the International Research Center of Big Data for Sustainable Development Goals (Grant No. CBAS2022ORP01), the National Natural Science Foundation of China (Grant No. 42090012) and Open Fund of State Key Laboratory of Remote Sensing Science and Beijing Engineering Research Center for Global Land Remote Sensing Products (Grant No. OF202312).

Data Availability Statement

Datasets can be downloaded at following links. Human density (HD) and gross domestic product (GDP) can be obtained from links https://www.worldpop.org/ and https://figshare.com/articles/dataset/17004523/1 (accessed on 16 November 2022), respectively. Leaf area index (LAI) and gross primary productivity (GPP) is available at http://www.geodata.cn/, accessed on 21 November 2022. NDVI data can be downloaded from the link of MOD13A1 v061—https://search.earthdata.nasa.gov/ (accessed on 8 February 2023). The land cover (LC) data is available at https://zenodo.org/records/8176941, accessed on 3 October 2022. The temperature (Tmp) and precipitation (Pre) datasets are available at https://poles.tpdc.ac.cn/zh-hans/, accessed on 9 November 2022. The PM2.5 data can be downloaded from https://zenodo.org/record/6398971, accessed on 21 November 2022. Finally, the soil nutrient availability (SNA) comes from https://www.fao.org/soils-portal/soil-survey/soil-maps-and-databases/harmonized-world-soil-database-v12/ (accessed on 16 November 2022), and the urban built-up dataset for dividing core and expansion regions is available at http://data.tpdc.ac.cn, accessed on 15 October 2022.

Acknowledgments

We appreciate the support of the Ministry of Ecology and Environment. We appreciate the “National Earth System Science Data Center, National Science & Technology Infrastructure of China” for providing GPP and LAI data. We appreciate the “National Tibetan Plateau/Third Pole Environment Data Center” for providing urban built-up data. We appreciate “A Big Earth Data Platform for Three Poles” for providing temperature and precipitation data. We also appreciate the “Food and Agricultural Organization of the United Nations” for providing data of soil nutrient availability. We also thank the anonymous reviewers and editor for their valuable comments on the manuscript.

Conflicts of Interest

The authors declare no conflicts of interest.

Appendix A

The calculation formula of the Global Moran’s I is as follows:
I g = N i j w i j x i μ ( x j μ ) i j w i j i x i μ 2
where w i j is the row-standardized contiguity matrix, x i and x j are the EQI at grids i and j, respectively, and μ is the average level of EQI. N is the total number of the grids in the study area. Moran’s I I g ranges from approximately +1 (for positive spatial autocorrelation) to −1 (negative autocorrelation), and zero expresses the absence of spatial autocorrelation.
Local Moran’s I was used to present LISA results, and its formula is as follows:
I l = x i μ i x i μ 2 j w i j ( x i μ )
where w i j w i j is the row-standardized contiguity matrix and x i are the EQI at grids i, and μ is the average level of EQI. The statistical quantity which examines the Local Moran’s I I l is as follows:
z i = I l E ( I l ) V A R ( I l )
where V A R ( I l ) and E I l denote the variance and expectation of I l , respectively. If | z i | < 1.96, p > 0.05, then the test of significance is considered not passed regardless of whether I l is greater than 0 or less than 0. According to the results of I l and z i , five clustering patterns were eventually created in the EQI assessment results: high–high (hot spots), low–low (cold spots), low–high, high–low, and “not significant”.

Appendix B

Figure A1. Results of correlation and significance tests among RSEI, the first three principal components (PC) and four factors constructing RSEI in different urban agglomerations. The symbols ***, **, and * display three significant level markers with p < 0.001, p < 0.01, and p < 0.05, respectively. (ac) Diagnosis results in BTH, CYRD, and PRD, respectively, in 2001. (df) Diagnosis results in BTH, CYRD, and PRD, respectively, in 2020.
Remotesensing 16 00045 g0a1

References

  1. Wang, H.; Bao, C. Scenario modeling of ecological security index using system dynamics in Beijing-Tianjin-Hebei urban agglomeration. Ecol. Indic. 2021, 125, 107613. [Google Scholar] [CrossRef]
  2. Paudyal, K.; Baral, H.; Bhandari, S.P.; Bhandari, A.; Keenan, R.J. Spatial assessment of the impact of land use and land cover change on supply of ecosystem services in Phewa watershed, Nepal. Ecosyst. Serv. 2019, 36, 100895. [Google Scholar] [CrossRef]
  3. Fang, C.; Liu, H.; Wang, S. The coupling curve between urbanization and the eco-environment: China’s urban agglomeration as a case study. Ecol. Indic. 2021, 130, 108107. [Google Scholar] [CrossRef]
  4. Li, Y.; Zhang, X.; Cao, Z.; Liu, Z.; Lu, Z.; Liu, Y. Towards the progress of ecological restoration and economic development in China’s Loess Plateau and strategy for more sustainable development. Sci. Total Environ. 2021, 756, 143676. [Google Scholar] [CrossRef]
  5. Wanyama, D.; Kar, B.; Moore, N.J. Quantitative multi-factor characterization of eco-environmental vulnerability in the Mount Elgon ecosystem. GISci. Remote Sens. 2021, 58, 1571–1592. [Google Scholar] [CrossRef]
  6. Shi, F.; Li, M. Assessing Land Cover and Ecological Quality Changes under the New-Type Urbanization from Multi-Source Remote Sensing. Sustainability 2021, 13, 11979. [Google Scholar] [CrossRef]
  7. Peng, J.; Wang, X.; Liu, Y.; Zhao, Y.; Xu, Z.; Zhao, M.; Qiu, S.; Wu, J. Urbanization impact on the supply-demand budget of ecosystem services: Decoupling analysis. Ecosyst. Serv. 2020, 44, 101139. [Google Scholar] [CrossRef]
  8. Lin, J.; Huang, J.; Prell, C.; Bryan, B.A. Changes in supply and demand mediate the effects of land-use change on freshwater ecosystem services flows. Sci. Total Environ. 2021, 763, 143012. [Google Scholar] [CrossRef]
  9. Chen, A.; Yang, X.; Guo, J.; Xing, X.; Yang, D.; Xu, B. Synthesized remote sensing-based desertification index reveals ecological restoration and its driving forces in the northern sand-prevention belt of China. Ecol. Indic. 2021, 131, 108230. [Google Scholar] [CrossRef]
  10. Sinclair, S.J.; Griffioen, P.; Duncan, D.H.; Millett-Riley, J.E.; White, M.D. Quantifying ecosystem quality by modeling multi-attribute expert opinion. Ecol. Appl. 2015, 25, 1463–1477. [Google Scholar] [CrossRef]
  11. Ministry of Ecology and Environment, the People’s Republic of China. “Technical Specifications for Evaluation of Ecological Environment Status” (for trial implementation); Ministry of Ecology and Environment: Beijing, China, 2012.
  12. Piao, S.; Wang, X.; Park, T.; Chen, C.; Lian, X.; He, Y.; Bjerke, J.W.; Chen, A.; Ciais, P.; Tommervik, H.; et al. Characteristics, drivers and feedbacks of global greening. Nat. Rev. Earth Environ. 2020, 1, 14–27. [Google Scholar] [CrossRef]
  13. Gong, E.; Shi, F.; Wang, Z.; Hu, Q.; Zhang, J.; Hai, H. Evaluating Environmental Quality and Its Driving Force in Northeastern China Using the Remote Sensing Ecological Index. Sustainability 2022, 14, 16304. [Google Scholar] [CrossRef]
  14. Wang, Y.; Zhao, Y.; Wu, J. Dynamic monitoring of long time series of ecological quality in urban agglomerations using Google Earth Engine cloud computing: A case study of the Guangdong-Hong Kong-Macao Greater Bay Area, China. Acta Ecol. Sin. 2020, 40, 8461–8473. [Google Scholar]
  15. Xu, H. A remote sensing urban ecological index and its application. Acta Ecol. Sin. 2013, 33, 7853–7862. [Google Scholar]
  16. Liu, X.; Cui, Y.; Dong, J.; Shi, Z.; Run, Y. Assessment of ecological space and ecological index changes in the affected area of the middle and lower reaches of the Yellow River. Acta Ecol. Sin. 2021, 41, 8030–8039. [Google Scholar]
  17. Sun, C.; Li, J.; Liu, Y.; Cao, L.; Zheng, J.; Yang, Z.; Ye, J.; Li, Y. Ecological quality assessment and monitoring using a time-series remote sensing-based ecological index (ts-RSEI). GISci. Remote Sens. 2022, 59, 1793–1816. [Google Scholar] [CrossRef]
  18. Gilvear, D.J.; Heal, K.V.; Stephen, A. Hydrology and the ecological quality of Scottish river ecosystems. Sci. Total Environ. 2002, 294, 131–159. [Google Scholar] [CrossRef]
  19. Li, L.; Huang, X.; Yang, H. Scenario-based urban growth simulation by incorporating ecological-agricultural-urban suitability into a Future Land Use Simulation model. Cities 2023, 137, 104334. [Google Scholar] [CrossRef]
  20. Liu, X.; Liang, X.; Li, X.; Xu, X.; Ou, J.; Chen, Y.; Li, S.; Wang, S.; Pei, F. A future land use simulation model (FLUS) for simulating multiple land use scenarios by coupling human and natural effects. Landsc. Urban Plan. 2017, 168, 94–116. [Google Scholar] [CrossRef]
  21. Song, C.; Du, H. Spatial and Temporal Variations in the Ecological Vulnerability of Northern China. J. Sens. 2022, 2022, 7232830. [Google Scholar] [CrossRef]
  22. Xu, H.; Wang, M.; Shi, T.; Guan, H.; Fang, C.; Lin, Z. Prediction of ecological effects of potential population and impervious surface increases using a remote sensing based ecological index (RSEI). Ecol. Indic. 2018, 93, 730–740. [Google Scholar] [CrossRef]
  23. Xu, H.; Wang, Y.; Guan, H.; Shi, T.; Hu, X. Detecting Ecological Changes with a Remote Sensing Based Ecological Index (RSEI) Produced Time Series and Change Vector Analysis. Remote Sens. 2019, 11, 2345. [Google Scholar] [CrossRef]
  24. Seddon, A.W.R.; Macias-Fauria, M.; Long, P.R.; Benz, D.; Willis, K.J. Sensitivity of global terrestrial ecosystems to climate variability. Nature 2016, 531, 229–232. [Google Scholar] [CrossRef] [PubMed]
  25. Lin, T.; Ge, R.; Huang, J.; Zhao, Q.; Lin, J.; Huang, N.; Zhang, G.; Li, X.; Ye, H.; Yin, K. A quantitative method to assess the ecological indicator system’s effectiveness: A case study of the Ecological Province Construction Indicators of China. Ecol. Indic. 2016, 62, 95–100. [Google Scholar] [CrossRef]
  26. Lepczyk, C.A.; Aronson, M.F.J.; Evans, K.L.; Goddard, M.A.; Lerman, S.B.; Macivor, J.S. Biodiversity in the City: Fundamental Questions for Understanding the Ecology of Urban Green Spaces for Biodiversity Conservation. Bioscience 2017, 67, 799–807. [Google Scholar] [CrossRef]
  27. Sun, X.; Jiang, Z.; Liu, F.; Zhang, D. Monitoring spatio-temporal dynamics of habitat quality in Nansihu Lake basin, eastern China, from 1980 to 2015. Ecol. Indic. 2019, 102, 716–723. [Google Scholar] [CrossRef]
  28. McPhearson, T.; Pickett, S.T.A.; Grimm, N.B.; Niemela, J.; Alberti, M.; Elmqvist, T.; Weber, C.; Haase, D.; Breuste, J.; Qureshi, S. Advancing Urban Ecology toward a Science of Cities. Bioscience 2016, 66, 198–212. [Google Scholar] [CrossRef]
  29. Chen, M.; Tan, Y.; Xu, X.; Lin, Y. Identifying ecological degradation and restoration zone based on ecosystem quality: A case study of Yangtze River Delta. Appl. Geogr. 2024, 162, 103149. [Google Scholar] [CrossRef]
  30. Rome, A. The Closing Circle: Nature, Man, and Technology. Nature 2015, 527, 443–445. [Google Scholar] [CrossRef]
  31. Guo, B.; Zang, W.; Luo, W. Spatial-temporal shifts of ecological vulnerability of Karst Mountain ecosystem-impacts of global change and anthropogenic interference. Sci. Total Environ. 2020, 741, 140256. [Google Scholar] [CrossRef]
  32. Hu, X.; Ma, C.; Huang, P.; Guo, X. Ecological vulnerability assessment based on AHP-PSR method and analysis of its single parameter sensitivity and spatial autocorrelation for ecological protection ? A case of Weifang City, China. Ecol. Indic. 2021, 125, 107464. [Google Scholar] [CrossRef]
  33. Huang, T.; Yu, Y.; Wei, Y.; Wang, H.; Huang, W.; Chen, X. Spatial-seasonal characteristics and critical impact factors of PM2.5 concentration in the Beijing-Tianjin-Hebei urban agglomeration. PLoS ONE 2018, 13, e0201364. [Google Scholar] [CrossRef] [PubMed]
  34. Luo, D.; Liang, L.; Wang, Z.; Chen, L.; Zhang, F. Exploration of coupling effects in the Economy-Society-Environment system in urban areas: Case study of the Yangtze River Delta Urban Agglomeration. Ecol. Indic. 2021, 128, 107858. [Google Scholar] [CrossRef]
  35. Guan, D.; He, X.; He, C.; Cheng, L.; Qu, S. Does the urban sprawl matter in Yangtze River Economic Belt, China? An integrated analysis with urban sprawl index and one scenario analysis model. Cities 2020, 99, 102611. [Google Scholar] [CrossRef]
  36. Zhang, D.; Huang, Q.; He, C.; Wu, J. Impacts of urban expansion on ecosystem services in the Beijing-Tianjin-Hebei urban agglomeration, China: A scenario analysis based on the Shared Socioeconomic Pathways. Resour. Conserv. Recycl. 2017, 125, 115–130. [Google Scholar] [CrossRef]
  37. Guo, X.; Fang, C.; Mu, X.; Chen, D. Coupling and coordination analysis of urbanization and ecosystem service value in Beijing-Tianjin-Hebei urban agglomeration. Ecol. Indic. 2022, 137, 108782. [Google Scholar] [CrossRef]
  38. Wu, A.; Zhao, Y.; Qin, Y.; Liu, X.; Shen, H. Analysis of Ecological Environment Quality and Its Driving Factors in the Beijing-Tianjin-Hebei Region of China. Sustainability 2023, 15, 7898. [Google Scholar] [CrossRef]
  39. Lu, X.; Zhang, Y.; Li, J.; Duan, K. Measuring the urban land use efficiency of three urban agglomerations in China under carbon emissions. Environ. Sci. Pollut. Res. 2022, 29, 36443–36474. [Google Scholar] [CrossRef]
  40. Li, T.; Dong, Y. Phased and polarized development of ecological quality in the rapidly-urbanized Pearl River Delta, China. Environ. Sci. Pollut. Res. 2022, 30, 36176–36189. [Google Scholar] [CrossRef]
  41. Wu, J.; Li, X.; Luo, Y.; Zhang, D. Spatiotemporal effects of urban sprawl on habitat quality in the Pearl River Delta from 1990 to 2018. Sci. Rep. 2021, 11, 13981. [Google Scholar] [CrossRef]
  42. Cai, Y.; Zhang, F.; Duan, P.; Jim, C.Y.; Chan, N.W.; Shi, J.; Liu, C.; Wang, J.; Bahtebay, J.; Ma, X. Vegetation cover changes in China induced by ecological restoration-protection projects and land-use changes from 2000 to 2020. Catena 2022, 217, 106530. [Google Scholar] [CrossRef]
  43. Posthuma, L.; Zijp, M.C.; De Zwart, D.; Van de Meent, D.; Globevnik, L.; Koprivsek, M.; Focks, A.; Van Gils, J.; Birk, S. Chemical pollution imposes limitations to the ecological status of European surface waters. Sci. Rep. 2020, 10, 14825. [Google Scholar] [CrossRef] [PubMed]
  44. Liu, R.; Dong, X.; Wang, X.-c.; Zhang, P.; Liu, M.; Zhang, Y. Study on the relationship among the urbanization process, ecosystem services and human well-being in an arid region in the context of carbon flow: Taking the Manas river basin as an example. Ecol. Indic. 2021, 132, 108248. [Google Scholar] [CrossRef]
  45. Zhang, J.; Zhou, T. Coupling Coordination Degree between Ecological Environment Quality and Urban Development in Chengdu-Chongqing Economic Circle Based on the Google Earth Engine Platform. Sustainability 2023, 15, 4389. [Google Scholar] [CrossRef]
  46. Stevens, F.R.; Gaughan, A.E.; Linard, C.; Tatem, A.J. Disaggregating Census Data for Population Mapping Using Random Forests with Remotely-Sensed and Ancillary Data. PLoS ONE 2015, 10, e0107042. [Google Scholar] [CrossRef] [PubMed]
  47. Reed, F.J.; Gaughan, A.E.; Stevens, F.R.; Yetman, G.; Sorichetta, A.; Tatem, A.J. Gridded Population Maps Informed by Different Built Settlement Products. Data 2018, 3, 33. [Google Scholar] [CrossRef] [PubMed]
  48. Chen, J.; Gao, M.; Cheng, S.; Hou, W.; Song, M.; Liu, X.; Liu, Y. Global 1 km x 1 km gridded revised real gross domestic product and electricity consumption during 1992-2019 based on calibrated nighttime light data. Sci. Data 2022, 9, 202. [Google Scholar] [CrossRef]
  49. Xu, D.; Yang, F.; Yu, L.; Zhou, Y.; Li, H.; Ma, J.; Huang, J.; Wei, J.; Xu, Y.; Zhang, C.; et al. Quantization of the coupling mechanism between eco-environmental quality and urbanization from multisource remote sensing data. J. Clean. Prod. 2021, 321, 128948. [Google Scholar] [CrossRef]
  50. Liang, S.; Zhao, X.; Liu, S.; Yuan, W.; Cheng, X.; Xiao, Z.; Zhang, X.; Liu, Q.; Cheng, J.; Tang, H.; et al. A long-term Global LAnd Surface Satellite (GLASS) data-set for environmental studies. Int. J. Digit. Earth 2013, 6, 5–33. [Google Scholar] [CrossRef]
  51. Ma, H.; Liang, S. Development of the GLASS 250-m leaf area index product (version 6) from MODIS data using the bidirectional LSTM deep learning model. Remote Sens. Environ. 2022, 273, 112985. [Google Scholar] [CrossRef]
  52. Zheng, Y.; Shen, R.; Wang, Y.; Li, X.; Liu, S.; Liang, S.; Chen, J.M.; Ju, W.; Zhang, L.; Yuan, W. Improved estimate of global gross primary production for reproducing its long-term variation, 1982-2017. Earth Syst. Sci. Data 2020, 12, 2725–2746. [Google Scholar] [CrossRef]
  53. Jiang, L.; Liu, Y.; Wu, S.; Yang, C. Analyzing ecological environment change and associated driving factors in China based on NDVI time series data. Ecol. Indic. 2021, 129, 107933. [Google Scholar] [CrossRef]
  54. Peng, S.; Gang, C.; Cao, Y.; Chen, Y. Assessment of climate change trends over the Loess Plateau in China from 1901 to 2100. Int. J. Climatol. 2018, 38, 2250–2264. [Google Scholar] [CrossRef]
  55. Wei, J.; Li, Z.; Cribb, M.; Huang, W.; Xue, W.; Sun, L.; Guo, J.; Peng, Y.; Li, J.; Lyapustin, A.; et al. Improved 1 km resolution PM2.5 estimates across China using enhanced space-time extremely randomized trees. Atmos. Chem. Phys. 2020, 20, 3273–3289. [Google Scholar] [CrossRef]
  56. He, C.; Liu, Z.; Tian, J.; Ma, Q. Urban expansion dynamics and natural habitat loss in China: A multiscale landscape perspective. Glob. Chang. Biol. 2014, 20, 2886–2902. [Google Scholar] [CrossRef] [PubMed]
  57. Xu, M.; He, C.; Liu, Z.; Dou, Y. How Did Urban Land Expand in China between 1992 and 2015? A Multi-Scale Landscape Analysis. PLoS ONE 2016, 11, e0154839. [Google Scholar] [CrossRef]
  58. Yang, J.; Huang, X. The 30 m annual land cover dataset and its dynamics in China from 1990 to 2019. Earth Syst. Sci. Data 2021, 13, 3907–3925. [Google Scholar] [CrossRef]
  59. Xie, G.; Lin, Z.; Lu, C.; Yu, X.; Cao, C. Expert Knowledge Based Valuation Method of Ecosystem Services in China. J. Nat. Resour. 2008, 23, 911–919. [Google Scholar]
  60. Tomaselli, V.; Dimopoulos, P.; Marangi, C.; Kallimanis, A.S.; Adamo, M.; Tarantino, C.; Panitsa, M.; Terzi, M.; Veronico, G.; Lovergine, F.; et al. Translating land cover/land use classifications to habitat taxonomies for landscape monitoring: A Mediterranean assessment. Landsc. Ecol. 2013, 28, 905–930. [Google Scholar] [CrossRef]
  61. Huang, I.B.; Keisler, J.; Linkov, I. Multi-criteria decision analysis in environmental sciences: Ten years of applications and trends. Sci. Total Environ. 2011, 409, 3578–3594. [Google Scholar] [CrossRef]
  62. Khan, I. Power generation expansion plan and sustainability in a developing country: A multi-criteria decision analysis. J. Clean. Prod. 2019, 220, 707–720. [Google Scholar] [CrossRef]
  63. Hsu, W.-L.; Shen, X.; Xu, H.; Zhang, C.; Liu, H.-L.; Shiau, Y.-C. Integrated Evaluations of Resource and Environment Carrying Capacity of the Huaihe River Ecological and Economic Belt in China. Land 2021, 10, 1168. [Google Scholar] [CrossRef]
  64. Whitehead, P.G.; Wade, A.J.; Butterfield, D. Potential impacts of climate change on water quality and ecology in six UK rivers. Hydrol. Res. 2009, 40, 113–122. [Google Scholar] [CrossRef]
  65. Galli, A.; Iha, K.; Pires, S.M.; Mancini, M.S.; Alves, A.; Zokai, G.; Lin, D.; Murthy, A.; Wackernagel, M. Assessing the Ecological Footprint and biocapacity of Portuguese cities: Critical results for environmental awareness and local management. Cities 2020, 96, 102442. [Google Scholar] [CrossRef]
  66. Wang, C.; Yu, C.; Chen, T.; Feng, Z.; Hu, Y.; Wu, K. Can the establishment of ecological security patterns improve ecological protection? An example of Nanchang, China. Sci. Total Environ. 2020, 740, 140051. [Google Scholar] [CrossRef]
  67. Martinez, A.d.l.I.; Labib, S.M. Demystifying normalized difference vegetation index (NDVI) for greenness exposure assessments and policy interventions in urban greening. Environ. Res. 2023, 220, 115155. [Google Scholar] [CrossRef]
  68. Ukasha, M.; Ramirez, J.A.; Niemann, J.D. Temporal Variations of NDVI and LAI and Interactions with Hydroclimatic Variables in a Large and Agro-Ecologically Diverse Region. J. Geophys. Res. Biogeosci. 2022, 127, e2021JG006395. [Google Scholar] [CrossRef]
  69. Hu, Z.; Piao, S.; Knapp, A.K.; Wang, X.; Peng, S.; Yuan, W.; Running, S.; Mao, J.; Shi, X.; Ciais, P.; et al. Decoupling of greenness and gross primary productivity as aridity decreases. Remote Sens. Environ. 2022, 279, 113120. [Google Scholar] [CrossRef]
  70. Bayulken, B.; Huisingh, D.; Fisher, P.M.J. How are nature based solutions helping in the greening of cities in the context of crises such as climate change and pandemics? A comprehensive review. J. Clean. Prod. 2021, 288, 125569. [Google Scholar] [CrossRef]
  71. Zhang, S.; Ye, L.; Huang, C.; Wang, M.; Yang, Y.; Wang, T.; Tan, W. Evolution of vegetation dynamics and its response to climate in ecologically fragile regions from 1982 to 2020: A case study of the Three Gorges Reservoir area. Catena 2022, 219. [Google Scholar] [CrossRef]
  72. Zhao, X.; Zhou, W.; Han, L. The spatial and seasonal complexity of PM2.5 pollution in cities from a social-ecological perspective. J. Clean. Prod. 2021, 309, 127476. [Google Scholar] [CrossRef]
  73. Dong, L.; Wan, R.; Li, B.; Tan, Z.; Yang, S.; Zhang, T. Spatiotemporal dynamics of lake wetland in the Wanjiang Plain of the Yangtze River basin, China during the recent century. Ecol. Indic. 2022, 142, 109295. [Google Scholar] [CrossRef]
  74. Kyere-Boateng, R.; Marek, M.V. Analysis of the Social-Ecological Causes of Deforestation and Forest Degradation in Ghana: Application of the DPSIR Framework. Forests 2021, 12, 409. [Google Scholar] [CrossRef]
  75. Fan, Y.; Fang, C. Evolution process and obstacle factors of ecological security in western China, a case study of Qinghai province. Ecol. Indic. 2020, 117, 106659. [Google Scholar] [CrossRef]
  76. Rahman, M.M.; Alam, K. Clean energy, population density, urbanization and environmental pollution nexus: Evidence from Bangladesh. Renew. Energy 2021, 172, 1063–1072. [Google Scholar] [CrossRef]
  77. Pennekamp, F.; Pontarp, M.; Tabi, A.; Altermatt, F.; Alther, R.; Choffat, Y.; Fronhofer, E.A.; Ganesanandamoorthy, P.; Garnier, A.; Griffiths, J.I.; et al. Biodiversity increases and decreases ecosystem stability. Nature 2018, 563, 109–112. [Google Scholar] [CrossRef]
  78. Wang, C.J.; Zhang, Z.X.; Wan, J.Z. Relationship between gross primary productivity and plant species richness at geographical scales: Evidence from protected area data in China. Environ. Earth Sci. 2021, 80, 189. [Google Scholar] [CrossRef]
  79. Song, C.; Huang, R.; Tang, X. Spatiotemporal Impact on Vegetation by Tunnel Discharging in the Jinping II Hydropower Station: Evidence from the NDVI and GPP Monitoring Dataset of 2001-2019. Front. Earth Sci. 2022, 10, 863278. [Google Scholar] [CrossRef]
  80. Torabizadeh, M.; Yusof, N.M.; Ma’aram, A.; Shaharoun, A.M. Identifying sustainable warehouse management system indicators and proposing new weighting method. J. Clean. Prod. 2020, 248, 119190. [Google Scholar] [CrossRef]
  81. Ohlan, R. The impact of population density, energy consumption, economic growth and trade openness on CO2 emissions in India. Nat. Hazards 2015, 79, 1409–1428. [Google Scholar] [CrossRef]
  82. Schaafsma, M.; Brouwer, R.; Rose, J. Directional heterogeneity in WTP models for environmental valuation. Ecol. Econ. 2012, 79, 21–31. [Google Scholar] [CrossRef]
  83. Wang, C.; Wang, L.; Zhan, J.; Liu, W.; Teng, Y.; Chu, X.; Wang, H. Spatial heterogeneity of urbanization impacts on ecosystem services in the urban agglomerations along the Yellow River, China. Ecol. Eng. 2022, 182, 106717. [Google Scholar] [CrossRef]
  84. Cao, W.; Dong, L.; Wu, L.; Liu, Y. Quantifying urban areas with multi-source data based on percolation theory. Remote Sens. Environ. 2020, 241, 111730. [Google Scholar] [CrossRef]
  85. Hu, X.; Xu, H. A new remote sensing index for assessing the spatial heterogeneity in urban ecological quality: A case from Fuzhou City, China. Ecol. Indic. 2018, 89, 11–21. [Google Scholar] [CrossRef]
  86. Boori, M.S.; Choudhary, K.; Paringer, R.; Kupriyanov, A. Spatiotemporal ecological vulnerability analysis with statistical correlation based on satellite remote sensing in Samara, Russia. J. Environ. Manag. 2021, 285, 112138. [Google Scholar] [CrossRef] [PubMed]
  87. Chen, Y. An analytical process of spatial autocorrelation functions based on Moran’s index. PLoS ONE 2021, 16, e0249589. [Google Scholar] [CrossRef]
  88. Rybski, D.; Gonzalez, M.C. Cities as complex systems-Collection overview. PLoS ONE 2022, 17, e0262964. [Google Scholar] [CrossRef]
  89. Ortman, S.G.; Lobo, J.; Smith, M.E. Cities: Complexity, theory and history. PLoS ONE 2020, 15, e0243621. [Google Scholar] [CrossRef]
  90. Wang, S.; Hu, M.; Wang, Y.; Xia, B. Dynamics of ecosystem services in response to urbanization across temporal and spatial scales in a mega metropolitan area. Sustain. Cities Soc. 2022, 77, 103561. [Google Scholar] [CrossRef]
  91. Zhang, D.; Wang, X.; Qu, L.; Li, S.; Lin, Y.; Yao, R.; Zhou, X.; Li, J. Land use/cover predictions incorporating ecological security for the Yangtze River Delta region, China. Ecol. Indic. 2020, 119, 103561. [Google Scholar] [CrossRef]
  92. Sun, R.; Wu, Z.; Chen, B.; Yang, C.; Qi, D.; Lan, G.; Fraedrich, K. Effects of land-use change on eco-environmental quality in Hainan Island, China. Ecol. Indic. 2020, 109, 105777. [Google Scholar] [CrossRef]
  93. Jiang, F.; Zhang, Y.; Li, J.; Sun, Z. Research on remote sensing ecological environmental assessment method optimized by regional scale. Environ. Sci. Pollut. Res. 2021, 28, 68174–68187. [Google Scholar] [CrossRef] [PubMed]
  94. Wang, Z.; Chen, T.; Zhu, D.; Jia, K.; Plaza, A. RSEIFE: A new remote sensing ecological index for simulating the land surface eco-environment. J. Environ. Manag. 2023, 326, 116851. [Google Scholar] [CrossRef] [PubMed]
  95. Yang, J.Y.; Wu, T.; Pan, X.Y.; Du, H.T.; Li, J.L.; Zhang, L.; Men, M.X.; Chen, Y. Ecological quality assessment of Xiongan New Area based on remote sensing ecological index. J. Appl. Ecol. 2019, 30, 277–284. [Google Scholar] [CrossRef]
  96. Zheng, Z.; Wu, Z.; Chen, Y.; Guo, C.; Marinello, F. Instability of remote sensing based ecological index (RSEI) and its improvement for time series analysis. Sci. Total Environ. 2022, 814, 152595. [Google Scholar] [CrossRef]
  97. Ning, L.; Wang, J.; Fen, Q. The improvement of ecological environment index model RSEI. Arab. J. Geosci. 2020, 13, 403. [Google Scholar] [CrossRef]
  98. Helili, P.; Zan, M. Coupling Coordination Development of Urbanization and Ecological Environment in the Urban Agglomeration on the Northern Slope of the Tianshan Mountains, China. Sustainability 2023, 15, 4099. [Google Scholar] [CrossRef]
  99. Chen, X.; Li, F.; Li, X.; Hu, Y.; Wang, Y. Mapping ecological space quality changes for ecological management: A case study in the Pearl River Delta urban agglomeration, China. J. Environ. Manag. 2020, 267, 110658. [Google Scholar] [CrossRef]
  100. Liang, L.; Wang, Z.; Li, J. The effect of urbanization on environmental pollution in rapidly developing urban agglomerations. J. Clean. Prod. 2019, 237, 117649. [Google Scholar] [CrossRef]
  101. Wu, R.M.X.; Zhang, Z.; Yan, W.; Fan, J.; Gou, J.; Liu, B.; Gide, E.; Soar, J.; Shen, B.; Fazal-E-Hasan, S.; et al. A comparative analysis of the principal component analysis and entropy weight methods to establish the indexing measurement. PLoS ONE 2022, 17, e0262261. [Google Scholar] [CrossRef]
  102. Wang, S.; Wang, J.; Zhang, L.; Xiao, Z.; Wang, F.; Sun, N.; Li, D.; Chen, B.; Chen, J.; Li, Y.; et al. A National Key R&D Program:Technologies and Guidelines for Monitoring Ecological Quality of Terrestrial Ecosystems in China. J. Resour. Ecol. 2019, 10, 105–111. [Google Scholar]
  103. Cheng, H.; Zhu, L.; Meng, J. Fuzzy evaluation of the ecological security of land resources in mainland China based on the Pressure-State-Response framework. Sci. Total Environ. 2022, 804, 150053. [Google Scholar] [CrossRef] [PubMed]
  104. Shafian, S.; Rajan, N.; Schnell, R.; Bagavathiannan, M.; Valasek, J.; Shi, Y.; Olsenholler, J. Unmanned aerial systems-based remote sensing for monitoring sorghum growth and development. PLoS ONE 2018, 13, e0196605. [Google Scholar] [CrossRef]
  105. Song, Y.; Chen, B.; Kwan, M.-P. How does urban expansion impact people’s exposure to green environments? A comparative study of 290 Chinese cities. J. Clean. Prod. 2020, 246, 119018. [Google Scholar] [CrossRef]
  106. Manoli, G.; Fatichi, S.; Schlapfer, M.; Yu, K.; Crowther, T.W.; Meili, N.; Burlando, P.; Katul, G.G.; Bou-Zeid, E. Magnitude of urban heat islands largely explained by climate and population. Nature 2019, 573, 55–60. [Google Scholar] [CrossRef] [PubMed]
  107. Liu, J.; Mauzerall, D.L.; Chen, Q.; Zhang, Q.; Song, Y.; Peng, W.; Klimont, Z.; Qiu, X.; Zhang, S.; Hu, M.; et al. Air pollutant emissions from Chinese households: A major and underappreciated ambient pollution source. Proc. Natl. Acad. Sci. USA 2016, 113, 7756–7761. [Google Scholar] [CrossRef]
  108. Khalid, K.; Usman, M.; Mehdi, M.A. The determinants of environmental quality in the SAARC region: A spatial heterogeneous panel data approach. Environ. Sci. Pollut. Res. 2021, 28, 6422–6436. [Google Scholar] [CrossRef]
  109. Khan, H.; Khan, I.; Truong Tien, B. The heterogeneity of renewable energy consumption, carbon emission and financial development in the globe: A panel quantile regression approach. Energy Rep. 2020, 6, 859–867. [Google Scholar] [CrossRef]
  110. Pesaran, M.H. General diagnostic tests for cross-sectional dependence in panels. Empir. Econ. 2021, 60, 13–50. [Google Scholar] [CrossRef]
  111. Ren, X.; Cheng, C.; Wang, Z.; Yan, C. Spillover and dynamic effects of energy transition and economic growth on carbon dioxide emissions for the European Union: A dynamic spatial panel model. Sustain. Dev. 2021, 29, 228–242. [Google Scholar] [CrossRef]
  112. Yu, D.; Zhang, Y.; Wu, X.; Li, D.; Li, G. The varying effects of accessing high-speed rail system on China’s county development: A geographically weighted panel regression analysis. Land Use Policy 2021, 100, 104935. [Google Scholar] [CrossRef]
  113. Zhang, C.; Li, L.; Guan, Y.; Cai, D.; Chen, H.; Bian, X.; Guo, S. Impacts of vegetation properties and temperature characteristics on species richness patterns in drylands: Case study from Xinjiang. Ecol. Indic. 2021, 133, 108417. [Google Scholar] [CrossRef]
  114. Tai, A.P.K.; Mickley, L.J.; Jacob, D.J. Correlations between fine particulate matter (PM2.5) and meteorological variables in the United States: Implications for the sensitivity of PM2.5 to climate change. Atmos. Environ. 2010, 44, 3976–3984. [Google Scholar] [CrossRef]
  115. Yi, L.; Chen, J.; Jin, Z.; Quan, Y.; Han, P.; Guan, S.; Jiang, X. Impacts of human activities on coastal ecological environment during the rapid urbanization process in Shenzhen, China. Ocean Coast. Manag. 2018, 154, 121–132. [Google Scholar] [CrossRef]
  116. Wang, M.-X.; Zhao, H.-H.; Cui, J.-X.; Fan, D.; Lv, B.; Wang, G.; Li, Z.-H.; Zhou, G.-J. Evaluating green development level of nine cities within the Pearl River Delta, China. J. Clean. Prod. 2018, 174, 315–323. [Google Scholar] [CrossRef]
  117. Xu, C.; Dong, L.; Yu, C.; Zhang, Y.; Cheng, B. Can forest city construction affect urban air quality? The evidence from the Beijing-Tianjin-Hebei urban agglomeration of China. J. Clean. Prod. 2020, 264, 121607. [Google Scholar] [CrossRef]
  118. Chen, C.; Liu, Y. Spatiotemporal changes of ecosystem services value by incorporating planning policies: A case of the Pearl River Delta, China. Ecol. Model. 2021, 461, 109777. [Google Scholar] [CrossRef]
  119. Liu, W.; Zhan, J.; Zhao, F.; Wang, C.; Zhang, F.; Teng, Y.; Chu, X.; Kumi, M.A. Spatio-temporal variations of ecosystem services and their drivers in the Pearl River Delta, China. J. Clean. Prod. 2022, 337, 130466. [Google Scholar] [CrossRef]
  120. Sun, T.; Lin, W.; Chen, G.; Guo, P.; Zeng, Y. Wetland ecosystem health assessment through integrating remote sensing and inventory data with an assessment model for the Hangzhou Bay, China. Sci. Total Environ. 2016, 566, 627–640. [Google Scholar] [CrossRef]
  121. Xiong, Y.; Xu, W.; Lu, N.; Huang, S.; Wu, C.; Wang, L.; Dai, F.; Kou, W. Assessment of spatial-temporal changes of ecological environment quality based on RSEI and GEE: A case study in Erhai Lake Basin, Yunnan province, China. Ecol. Indic. 2021, 125, 107518. [Google Scholar] [CrossRef]
  122. Johnson, M.D.; Hsieh, W.W.; Cannon, A.J.; Davidson, A.; Bedard, F. Crop yield forecasting on the Canadian Prairies by remotely sensed vegetation indices and machine learning methods. Agric. For. Meteorol. 2016, 218, 74–84. [Google Scholar] [CrossRef]
  123. Gusmao Caiado, R.G.; Dias, R.d.F.; Mattos, L.V.; Goncalves Quelhas, O.L.; Leal Filho, W. Towards sustainable development through the perspective of eco-efficiency—A systematic literature review. J. Clean. Prod. 2017, 165, 890–904. [Google Scholar] [CrossRef]
Figure 1. Spatial location and land cover (LC) information in 2020 of study area. (a) Location of three major urban agglomeration in China; (bd) LC information of BTH, CYRD, and PRD, respectively, in 2020. The land cover information was extracted from the China Land Cover Dataset (CLCD) which can be obtained from the link at Data Availability Statement section.
Remotesensing 16 00045 g001
Figure 2. Technical route of this study.
Remotesensing 16 00045 g002
Figure 3. The spatial and statistical patterns of EQI in urban agglomerations. (ac) Spatial distribution, histogram distribution, and fitted kernel density curves of EQI for BTH in 2001 and 2020. (df) Spatial and statistical distribution of EQI of CYRD in 2001 and 2020. (gi) PRD.
Remotesensing 16 00045 g003
Figure 4. The EQI conversion statistics at all levels of urban agglomerations. (ac) EQI conversion statistics of BTH, CYRD, and PRD, respectively.
Remotesensing 16 00045 g004
Figure 5. The spatial location and EQI transfer conditions of urban core and expansion areas in urban agglomerations. (ac) Spatial location of urban core and expansion areas by region. (df) EQI transfer rate between EQI levels in urban core region of BTH, CYRD, and PRD, respectively. (gi) EQI transfer rate in urban expansion region of BTH, CYRD, and PRD, respectively.
Remotesensing 16 00045 g005
Figure 6. EQI values of each city in the three major urban agglomerations in 2001 and 2020.
Remotesensing 16 00045 g006
Figure 7. Scatter chart of EQI change intensity, urban expansion intensity, and synergistic index of all cities in three urban agglomerations. The red balls represent two supercities, Beijing and Shanghai.
Remotesensing 16 00045 g007
Figure 8. Comparison of spatial distribution and statistics between EQI and RSEI. (ac) Spatial distribution and level changes of ecological quality in BTH, CYRD, and PRD respectively. (d) Statistical differences in EQI and RSEI among the three urban agglomerations in 2001 and 2020. The pink triangle represents the mean value.
Remotesensing 16 00045 g008
Figure 9. Principal component analysis results of ten variables in three urban agglomerations. The larger the absolute value of box is, the greater the contribution of the variable to the principal component.
Remotesensing 16 00045 g009
Figure 10. Results of correlation tests for various factors in three urban agglomerations in 2001 and 2020. The symbols ***, **, and * display three significant level markers with p < 0.001, p < 0.01, and p < 0.05, respectively. (ac) Correlation coefficients between selected factors and EQI in 2001 of BTH, CYRD, and PRD, respectively. (df) Correlation coefficients between selected factors and EQI in 2020 of BTH, CYRD, and PRD, respectively.
Remotesensing 16 00045 g010
Figure 11. The spatial distribution of EQI change ( E Q I ) in urban agglomerations. (ac) Spatial distribution of EQI change ( E Q I ) in BTH, CYRD, and PRD, respectively.
Remotesensing 16 00045 g011
Figure 12. LISA cluster map of EQI in three urban agglomerations in 2001 and 2020. (ac) Clustering patterns of EQI in 2001 of BTH, CYRD, and PRD, respectively. (df) Clustering patterns of EQI in 2020 of BTH, CYRD, and PRD, respectively.
Remotesensing 16 00045 g012
Table 1. Introduction to indicator data and their attributes.
IndicatorsThe Role of Ecological Quality AssessmentTemporal ResolutionSpatial ResolutionData Source
Gross domestic product (GDP)Quantify the contradiction between urbanization and ecological protectionYearly
(1992–2019)
1 kmReal GDP
Human density (HD)Reveal the threat of population and population growth to the ecological environmentYearly
(2001–2020)
1 kmWorldPop
Normalized difference vegetation index (NDVI)Quantify the degree of vegetation cover, reflect the growth trend and horizontal structure of vegetationYearly
(2001–2019)
1 kmMOD13A1 v061
Annual mean temperature (Tmp)Evaluate the climate suitability and urban heat island effects16 Days
(2001–2020)
500 mNational Tibetan Plateau Data Center
Annual precipitation (Pre)Evaluate the climate suitability and land desertificationMonthly
(2001–2020)
1 kmNational Tibetan Plateau Data Center
Air quality (PM2.5)Monitor inhalable particulate matter to reflect atmospheric pollutionMonthly
(2001–2020)
1 kmChinaHighPM2.5 dataset
Gross primary productivity (GPP)Measure the strength of vegetation photosynthesis and the amount of carbon sequestration16 Days
(2001–2020)
500 mGLASS GPP
Leaf area index (LAI)Reflect vegetation growth trend and complexity of vertical structure16 Days
(2001–2020)
500 mGLASS LAI
Land cover (LC)Changes in LC drive the increase or decrease of ecosystem servicesYearly
(2001–2020)
500 mCLCD dataset
Soil nutrient availability (Soil)Calculate soil nutrient content to reflect recovery capacityYearly (2008)10 kmHarmonized-world-soil-database-v12
Table 2. Layered framework and indicator weights for each layer.
Target LayerCriterion LayerIndicator LayerWeightsContribution
Evaluation of Ecological Quality Index (EQI) in Three Urban Agglomerations in ChinaEcological Pressure (EP)
(−0.014)
HD0.46Negative
GDP0.54Negative
Ecological Function (EF) (0.619)NDVI0.424Positive
LC0.245Corresponding
LAI0.236Positive
GPP0.095Positive
Ecological Interaction (EI)
(0.237)
Tmp0.664Proper
Pre0.336Proper
PM2.5−0.154Negative
Ecological Stability (ES) (0.158)SNA0.303Positive
GPP0.697Positive
Table 3. Grading rules of EQI and E Q I .
EQI LevelThe Range of EQI Value E Q I LevelThe Range of E Q I Value
Excellent E Q I 0.7 Deteriorated (DR) E Q I < 0.3
Good 0.7 > E Q I 0.55 Slightly Deteriorated (SD) 0.3 E Q I < 0.1
Moderate 0.55 > E Q I 0.4 Inapparent Change (IC) 0.1 E Q I < 0.1
Poor 0.4 > E Q I 0.2 Slightly Improved (SI) 0.1 E Q I < 0.3
Bad E Q I < 0.2 Obvious Improved (OI) E Q I 0.3
Table 4. The total area and land occupation rate of EQI at various levels of urban agglomerations.
BTH_2001BTH_2020CYRD_2001CYRD_2020
EQI LevelAreaPercentageAreaPercentageAreaPercentageAreaPercentage
Excellent20,2639.4612,7515.9566,09930.4660,87528.02
Good88,21241.1660,94328.44110,81051.0758,69327.01
Moderate80,48037.55108,47650.6127,22212.5568,48331.52
Poor24,94511.6429,99413.9911,6195.3528,24213.00
Bad3980.1921611.0112440.579720.45
PRD_2001PRD_2020
EQI levelAreaPercentageAreaPercentage
Excellent25,13148.7027,66352.11
Good13,92226.98997718.79
Moderate934318.10830115.64
Poor32126.22711013.39
Bad10.00370.07
Unit: Area (km2), Percentage (%).
Table 5. The EQI transfer matrix for each level from 2001 to 2020 of urban agglomerations.
BTHCYRD
EQI LevelExcellentGoodModeratePoorBadTotalExcellentGoodModeratePoorBadTotal
Excellent880011,03338842020,26358,071741451073066,068
Good392542,19938,53635322088,212253948,94151,23379918110,712
Moderate26752756,60716,21710380,480178192514,43110,5055327,092
Poor018412,94510,140167624,94542291833866160011,327
Bad00055343398061097262561097
Total12,75160,94310,847629,9862142214,29860,79258,51568,11627,956917216,296
PRD
EQI levelExcellentGoodModeratePoorBadTotal
Excellent24,4031025829025,519
Good337980012350355014,085
Moderate659085337311029422
Poor05241300693261
Bad000101
Total27,8479939801064811152,288
Table 6. The LC transition statistics from 2001 to 2020 in three urban agglomerations. (The corresponding relationship between each LC category and its abbreviation are as follows: Crop (Cr); Forest (Fr); Grassland (Gr); Water (Wt); Barren (Br); Impervious of Core region (CI); Impervious of Expansion region (EI)).
BTHCYRD
LC TypeCrFrGrWtBrCIEITotalCrFrGrWtBrCIEITotal
Cr11304543043615013119447311 9121071469310,611
Fr7250 1942798904 540217
Gr190141141251 0
Wt3800102139138318178 6601341931066
Br100212713 01 1
CI4 7 2492 25032 12 2855 2869
EI4 15 160316222 7 22452255
Total1203291917032974327076684735100077433966744117,019
PRD
LC TypeCrFrGrWtBrCIEITotal
Cr203075564411146173909
Fr146257 4438485
Gr6 11 16933
Wt3481153551681241182
Br 0 11
CI2 7 2102 2111
EI 1 460461
Total253233376089253212498182
Table 7. Results of collinearity diagnosis for each indicator. Numbers with underline indicate insignificant results.
GDPHDLAISoilTmpPrePM2.5NDVIGPPLC
VIF1.9391.3315.9681.5571.7183.1831.7804.5437.2502.308
Tolerance0.5160.7510.1680.6420.5820.3140.5620.2200.1380.433
Disclaimer/Publisher’s Note: The statements, opinions and data contained in all publications are solely those of the individual author(s) and contributor(s) and not of MDPI and/or the editor(s). MDPI and/or the editor(s) disclaim responsibility for any injury to people or property resulting from any ideas, methods, instructions or products referred to in the content.

