

Studying the Impact of the Geospace Environment on Solar Lithosphere Coupling and Earthquake Activity


1
Institute for Earth, Computing, Human and Observing (Institute for ECHO), Chapman University, Orange, CA 92866, USA
2
Institute of Seismology, Almaty 050060, Kazakhstan
*
Author to whom correspondence should be addressed.
Remote Sens. 2024, 16(1), 24; https://doi.org/10.3390/rs16010024
Submission received: 30 October 2023
/
Revised: 6 December 2023
/
Accepted: 8 December 2023
/
Published: 20 December 2023
(This article belongs to the Special Issue Remote Sensing Observations to Improve Knowledge of Lithosphere–Atmosphere–Ionosphere Coupling during the Preparatory Phase of Earthquakes)
Abstract
:In solar–terrestrial physics, there is an open question: does a geomagnetic storm affect earthquakes? We expand research in this direction, analyzing the seismic situation after geomagnetic storms (GMs) accompanied by the precipitation of relativistic electrons from the outer radiation belt to form an additional radiation belt (RB) around lower geomagnetic lines. We consider four widely discussed cases in the literature for long-lived (weeks, months) RBs due to GMs and revealed that the 1/GMs 24 March 1991 with a new RB at L~2.6 was followed by an M7.0 earthquake in Alaska, 30 May 1991, near footprint L = 2.69; the 2/GMs 29 October 2003 (Ap = 204) with new RB first in the slot region at L = 2–2.5 cases followed by an M7.8 earthquake on 17 November 2003 at the Aleutian Islands near footprint L = 2.1, and after forming an RB at L~1.5 which lasted for ~26 months, two mega quakes, M9.1 in 2004 and M8.6 in 2005, occurred at the globe; the 3/GMs 3 September 2012 with a new RB at L= 3.0–3.5 was followed by an M7.8 earthquake in Canada near footprint L = 3.2; and the 4/GMs 21 June 2015 with a new RB at L = 1.5–1.8 was followed by an M6.3 earthquake on 7 September 2015 in New Zealand, near footprint L = 1.58. The obtained results suggest that (1) major earthquakes occur near the footprints of geomagnetic lines filled with relativistic electrons precipitating from the outer radiation belt due to geomagnetic storms, and (2) the time delay between geomagnetic storm onset and earthquake occurrence may vary from several weeks to several months. The results may expand the framework for developing mathematical magnetosphere–ionosphere coupling models.
1. Introduction
The idea that space weather—as measured by sunspots, cosmic rays, solar wind, interplanetary magnetic fields, geomagnetic activity, and precipitation of charged particles from the radiation belt—may play a role in triggering earthquakes has a long history but has not received physical justification for the time being. It was noted in [1] that the problem’s difficulty is that the unknown is a physical mechanism of action involving relatively weak fields of cosmic origin on tectonic processes. The authors of [2] suggested that geomagnetic variations affect rocks, e.g., by inducing eddy currents in the Earth’s crust via an alternating magnetic field, leading to rocks’ additional heating. They modeled the distribution of heat flows generated by 98 magnetic storms on the surface and in the interior of the Northern Tien Shan. They showed that the average amount of energy released in the Earth in the form of heat is about 7.4 × 10¹¹ J, which is comparable to the amount of energy released in this territory over the same time interval. Simultaneously, they noted that the heat flow transferred by storms into the ground is 2–3 orders of magnitude lower than the heat flow from the ground and, therefore, cannot play a significant role in the earthquake preparation phase but can most likely accelerate the process of releasing the accumulated tectonic stress if it has already started.
It was also assumed that the action could be forceful, owing to the movement of telluric currents in the Earth’s magnetic field. However, [3] showed that these ponderomotive forces produce only the weakest stresses and deformations in the Earth’s crust. As the authors of [4,5] suggested, the Alfvèn waves, which can drive currents in the ionosphere and reradiate the energy as electromagnetic waves that propagate to the ground [6], could mediate between space weather and seismic activity.
Over the last 30 years, international community cooperation has suggested the concept of the lithosphere–atmosphere–ionosphere coupling (LAIC), which indicates that electromagnetic disturbances in the lithosphere accompany the earthquake preparation process and can modify the electric field in the global electric circuit (GEC) (see [7,8,9,10,11] and references herein). The GEC links the electric fields and currents flowing in different parts of the atmosphere [12,13]. There are three main generators of fields and currents in the global electric circuit [13]: (1) the troposphere generator (continuous thunderstorm activity of the Earth, with about 46 lightning strikes per second); (2) the ionospheric wind dynamo; and (3) the solar wind/magnetosphere dynamo. The troposphere generator may provide a 200 kV to 600 kV potential difference between the ground and the ionosphere. The ionosphere generator (ionospheric wind dynamo) may provide about 5 kV to 15 kV of potential difference between the high and low latitudes. The magnetospheric generator (solar wind/magnetospheric dynamo) can provide a potential drop of 40 kV to 130 kV across the polar cap. Thunderstorms in the troposphere are the strongest source of voltages/currents in this circuit. The electric current flows upward from the thunderstorm areas and spreads out all over the globe through the ionosphere and through the magnetosphere along magnetic field lines to the opposite hemisphere. The current returns to the surface of the Earth as the fair-weather troposphere-to-Earth current. The density of the vertical electric conduction current in the GEC depends on conductivity and is about 10−12 A/m2 on average.
The LAIC concept considers that radon emanation may accompany an earthquake preparation process [7]. The radon concentration shows relatively strong spatial variation and differs widely above continental and oceanic areas. The average radon flux density for the entire ocean is equal to 0.0382 mBq m−2 s−1 [14] and is much smaller than the typical estimates for the average flux density from land, which is in the approximate range of 20 to 35 mBq m−2 s−1 [15]. Overland, the radon concentration depends on the tectonic conditions. For example, in Mysore city (India), it is of order 20 Bq/m3 [16]; simultaneously, in the vicinity of active faults, radon concentration may reach 2000 kBq/m3, five orders of magnitude larger [17]. Thus, Radon emanation from an area of earthquake preparation (active faults) may increase the conductivity and decrease the resistance of the surface-layer air (the lower tropospheric part of the GEC). A decrease in boundary layer resistance reduces the total ground–ionosphere electrical resistance. This, in turn, increases the vertical fair-weather current in the GEC and lowers the ionosphere (to maintain the continuity of the electron flow). Hence, the effects of earthquake preparation modify the ionosphere parameters. The concept of the GEC was successfully used in [18,19] to explain the results from the DEMETER satellite observations [20], which showed a statistically significant decrease in the natural VLF (~1.7 kHz) wave intensity related to 8400 nighttime earthquakes of M ≥ 5.0 within 440 km of the epicenters.
In [21,22], a modified configuration of the GEC is discussed. Its external element is located on the magnetopause with the electromotive force generator driven by solar wind energy; its internal element is in the solid Earth, with the electromotive force generator driven by the tectonic processes [22]. The modified GEC may be considered a mediator in transmitting solar wind energy into the Earth’s crust. The functioning of a GEC will depend on electrical conductivity along the entire path from the magnetopause to the Earth’s crust. It is mentioned above that in the near-ground troposphere, ionization may be produced by the isotopes of radon [14,15,16,17], whose emanation is expected to be strong at overactive faults.
In the upper troposphere and lower stratosphere, the galactic cosmic rays influence the ionization and, therefore, the electrical parameters of the atmosphere [23,24]. Cosmic rays are energetic particles (primarily protons and α-particles), which, according to their origin, are categorized as either galactic cosmic rays (GCRs) or solar cosmic rays (solar energetic particles, SEPs) [23]. GCRs are always present in the Earth’s vicinity, while SEPs occur sporadically, usually in conjunction with the Sun’s giant eruptive events (solar flares or coronal mass ejections). The energy inputted by cosmic rays in the Earth’s atmosphere is about 10−9 times that of solar energy [25]. However, cosmic rays are the only source of ion production in the lower stratosphere and upper troposphere [23,24]. The cosmic rays are inputted to the electrical properties of the atmosphere and the global electric circuit by manipulating atmospheric conductivity, vertical electric current, and vertical ionospheric potential gradients. It is shown in [26,27] that changes in the surface potential and ionospheric potential gradients correlate well with changes in GCR. About 95% of cosmic ray particles have an energy of 0.1–15 GeV, which contains more than 60% of all cosmic ray particle energy [28,29]. The cosmic ray particles with energy ≤15 GeV undergo an 11-year modulation, and the flux of cosmic ray particles with this energy may decrease more than twofold when the solar activity period changes from the minimum to the maximum [28]. Thus, the effect of cosmic ray ionization in the lower stratosphere and upper troposphere should be more dominant during the period of minimum solar activity. In addition to continuous ionization in the Earth’s atmosphere caused by a galactic cosmic ray, sporadic ionization occurs during solar energetic particle events, potentially affecting the Earth’s environment [30,31], possibly contributing to GEC operation and earthquake occurrence. In the pure conductive mesosphere, the ionization increases due to the precipitation of energetic electrons from the radiation belt up to the stratopause (~55 km altitude). This process is more effective in times of geomagnetic storms.
In the present paper, we analyze the response of seismic activity to the effects of precipitation of relativistic electrons from the outer radiation belt during geomagnetic storms (Section 3.1). Furthermore, we compare global seismic activity’s temporal variations with solar activity’s temporal variations and galactic cosmic rays’ flux (Section 3.2).
2. Data and Methods
For analysis, we used data from the USGS Global Seismological Catalog (https://earthquake.usgs.gov/earthquake, accessed on 25 October 2018) for 1973–2017 for earthquakes with a magnitude of M ≥ 4.5 (more than 220,000 events). For the epicenters of all analyzed earthquakes, we calculated the values of the McIlvaine parameter L [32] (indicating the distance of geomagnetic lines to the center of the Earth at the equator, expressed in terms of the radii of the Earth) using the IGRF model and the computer codes of the GEOPACK [33]. The McIlwain parameter (L)—is named after the scientist Carl McIlwain and has two more names: (L-shell), magnetic shell; (L-value), number of the magnetic field line)—is taken to be equal to the ratio of the average distance of the geomagnetic shell (geomagnetic field line) from the center of the Earth in the plane from the geomagnetic equator to the radius of the Earth. The equation for calculating the value of L at a point with geographic coordinates (λ, φ) is L = Re(λ,φ)/Recos2Λ, where λ is geographic latitude, φ is geographic longitude, Λ is geomagnetic latitude, and Re is the radius of the Earth at the equator. The equation for calculating the radius of the Earth at a point with geographic coordinates (λ, φ) is Re(λ, φ) = α + b cos2 λ + c cos4 λ, where α = 6356.912 km is the radius of the Earth at the geographic pole, b = 21.3677 km, and c = 0.108 km. The value of geomagnetic latitude at a point with geographic coordinates (λ, φ) can be obtained from the equation sinΛ = sin λ sin λp + cos λ cos λp cos (φ − φp), where λp, φp are the geographic latitude and longitude of the geomagnetic pole; these change over time (secular variations of the geomagnetic field), which is reflected in the international reference model IGRF, which describes the main geomagnetic field and its secular variations produced by an internal source located in the liquid outer core of the Earth.
A geomagnetic storm is an interval of several days during which there is a significant reduction in the horizontal component of the geomagnetic field at the Earth’s surface [34]. Following [35], geomagnetic storms may be small (Dst from −30 to −50 nT), moderate (Dst from −50 to −100 nT), strong (Dst from −100 to −200 nT), powerful (Dst from −200 to −350 nT), and extra strong (giant) (Dst lower than −350 nT). We investigate the response of seismic activity to geomagnetic storms, and the data for the disturbance storm (Dst index) were obtained from NASA/GSFC’s Space Physics Data Facility’s CDAWeb service and OMNI data (https://cdaweb.gsfc.nasa.gov/index.html, accessed on 30 September 2023). Geomagnetic storms, the bright manifestation of space weather variations, influence the Earth’s radiation belts (toroids of very high-energy magnetically trapped charged particles), as discovered in 1958 by Van Allen [36]. Radiation belts typically comprise two distinct zones (inner and outer) spatially separated by the slot region (Figure 1 from [37]).
The inner Van Allen zone, mainly populated by energetic protons, extends from just above the dense atmosphere to an equatorial altitude of about 10,000 km above the Earth’s surface. The left label in Figure 1 shows several space weather concerns for the inner radiation belt zone [37]: the intense, high-energy trapped protons, the variable, trapped solar energetic particles, the trapped galactic cosmic rays, and the trapped energetic electrons. The upper label in Figure 1 shows that the slot region can present several space-weather concerns, including low- and medium-energy electron enhancements, multi-MeV electrons (on rare occasions), and strong solar energetic particle events (again on relatively rare occasions). The slot region extends from L~2.0 to L~3.0. The outer zone of the radiation belt extends from L~3.0 to L~6.5. It comprises mildly to highly relativistic electrons and varies widely in time and particle intensity. Due to geomagnetic storms, the high-energy electrons can spill down from the outer radiation belt and form a new radiation belt (storage ring) around certain geomagnetic lines in the inner magnetosphere [38,39,40,41,42,43,44,45,46]. The new radiation belts normally last for several days but very rare, they may last for up to several weeks, months, or even years. We analyze the response of seismic activity to four widely discussed geomagnetic storms in the scientific literature, which were all followed by a newly formed storage ring in the inner magnetosphere. Three of them lasted for up to several months; they were created by geomagnetic storms on 24 March 1991 [41,42], 1 September 2012 [43], and 21 June 2015 [44]; one of them, created by a giant storm on 31 October 2003, lasted for more than two years [40]. To compare seismic data variations with solar activity variations, we used sunspot numbers from the World Data Center SILSO, Royal Observatory of Belgium, Brussels (https://wwwbis.sidc.be/silso/datafiles, accessed on 30 September 2023). The sunspot number is one of the space weather parameters usually used to investigate long-term solar activity variations, including 11-year variations.
3. Results
3.1. Increasing Seismic Activity near Magnetic Field Line Footprints of Newly Created Radiation Belts Arising from Geomagnetic Storms
3.1.1. Case Study in the Years 1991, 2012, and 2015
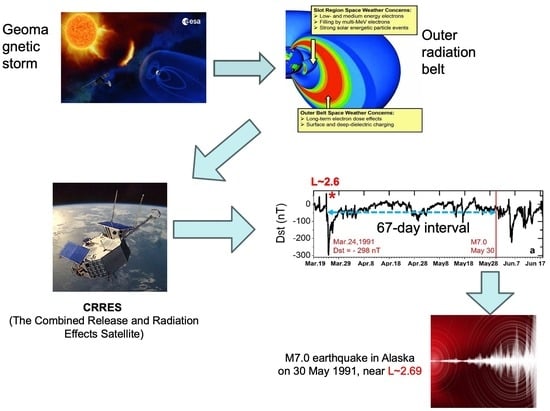
On 24 March 1991, a powerful geomagnetic storm started at 04:30 UT and reached its negative extremum in the primary phase on 25 March 1991 at 00:30 UT, with Dst = −298 nT. At that time, the CRRES satellite was near L~2.6, and its instruments recorded powerful fluxes of electrons with E~15 MeV and protons with E~20–110 MeV [41]. The MIR orbital station also observed the newly created radiation belt for about 2 years [42].
On 1 September 2012, a moderate geomagnetic storm started at 22:30 UT and reached its negative extremum in the primary phase on 3 September 2012 at 10:30 UT, with Dst = −69 nT. At that time, the Relativistic Electron Proton Telescope (REPT) on NASA’s Van Allen probes board recorded a flux of energetic electrons (3.6 MeV, 4.5 MeV, and 5.6 MeV) at geomagnetic lines 3.0 ≤ L ≤ 3.5. A newly formed belt of relativistic electrons was observed for about a month [43] and was then destroyed by the next strong geomagnetic storm on 1 October 2012 [38].
On 21 June 2015, a powerful geomagnetic storm started at 18:30 UT and reached its negative extremum in the primary phase on 23 June 2015 at 04:30 UT, with Dst = −204 nT. At that time, the Magnetic Electron Ion Spectrometer (MagEIS) on NASA’s Van Allen probes board recorded a new belt of relativistic electrons with energy E= ~1.06 MeV at geomagnetic lines L~1.5–1.8, which persisted for ~11 months [44].
Figure 2 presents monthly earthquakes of magnitude M ≥ 4.5 that occurred in 1991, 2012, and 2015 near the footprints of the newly created belts of relativistic electrons.
Figure 2a shows the histogram of the number of earthquakes of M ≥ 4.5 near the footprint of the geomagnetic lines L = 2.5–2.7 in different months of 1991. It is seen that the most significant number of earthquakes occurred in May 1991. The strongest was the M7.0 earthquake in Alaska on 30 May 1991, with epicenter coordinates of 54.57°N, 161.61°E, near the footprint of the geomagnetic line L~2.69 and closely adjacent to the new radiation belt created around L~2.6 after a magnetic storm on 24 March 1991 [41,42]. We see that an increase in seismic activity at the base L = 2.5–2.7 in May 1991 occurred ~2 months after the geomagnetic storm onset.
Figure 2b shows the distribution by month across 2012 for the number of earthquakes with a magnitude of M ≥ 4.5 that occurred near the footprint of the geomagnetic lines L = 3.0–3.5, around which a belt of high-energy electrons was formed due to a geomagnetic storm on 1 September 2012 [43]. For the base of L = 3.0–3.5, the number of earthquakes strongly increased in October 2012; the largest here was an earthquake of M = 7.8, which occurred off the coast of Canada on 28 October 2012, with coordinates 52.79°N, 132.1°W, near the footprint of L = ~3.3. This earthquake also occurred ~2 months after the geomagnetic storm onset on 1 September 2012, which created a storage ring of relativistic electrons.
Figure 2c presents the monthly number of earthquakes with M ≥ 4.5 in 2015 near the footprint of geomagnetic lines L = 1.5–1.8. A belt of high-energy electrons was formed due to a geomagnetic storm on 21 June 2015 [44]. The increase of seismic activity here started in June 2015, just after a strong geomagnetic storm, but it peaked in September 2015. The largest earthquake (M = 6.3) occurred on 7 September 2015, near New Zealand, with epicenter coordinates of 32.82 °S, 177.86 °W in the footprint of L~1.58. The M6.3 events again persisted over 2 months following the magnetic storm onset.
Figure 3 visualizes the correlation between geomagnetic storm onset and the strongest earthquake in the footprints of magnetic lines belonging to newly created radiation belts.
It is seen from Figure 3 that the time delay between storm onset and earthquake occurrence was about 67 days in 1991, 57 days in 2012, and 78 days in 2015; its mean value equals ~67 days. Figure 3b shows that the geomagnetic storm on 1 September 2012 was only moderate, but the strong one occurred on 1 October 2012, with Dst = −122 nT. One may suggest that this stronger storm induced the M7.8 earthquake. As we see it, finding a correlation between a particular magnetic storm and an induced earthquake is only possible under some initial idea. Our idea was to investigate seismicity in the footprint of magnetic lines belonging to the new radiation belts created by magnetic storms in the inner magnetosphere, and this allowed us to obtain similar results for all three considered cases. It was mentioned in [46] that long-living radiation belts are rarely created due to magnetic storms; more often, the newly created belts survive for a few days. The moderate geomagnetic storm on 1 September 2012 (Dst = −69 nT) produced a relatively long-lasting radiation belt [43], but the next strong magnetic storm (Dst = −122) destroyed it [38].
To test whether the relationship of seismic activity with the magnetic storm was significant in the spatial domain (near the footprints of magnetic lines belonging to a new radiation belt created due to the storm), we present Figure 4. It shows the distribution by month in 2012 for the number of earthquakes of M ≥ 4.5 that occurred near the footprint of L = 3.0–3.5 (red bars), as well as in neighboring geomagnetic lines L = 2.5–2.99 (green) and L = 3.51–5.0 (blue).
It is seen from Figure 4 that the distribution of earthquakes by month was uniform at the base of the lower (L = 2.5–2.99) and higher (L = 3.51–5.0) lines. For the base of L = 3.0–3.5 (around which the belt of high-energy particles was formed due to a magnetic storm in September 2012), the number of earthquakes strongly increased ~2 months after the onset of the magnetic storm. On the other hand, we present Figure 4 only as an example to demonstrate the situation for the year 2012. One cannot expect the picture to be the same for all possible cases because there are many reasons for earthquake occurrence. Sometimes, earthquakes may occur at the base of the nearest magnetic lines; these do not relate to the lines of the newly formed radiation belt. This could possibly be the next step in a more detailed investigation.
3.1.2. Case Study in the Year 2003
The deepest, most recent high-energy electron radiation belt (around L~1.5) was detected after a giant magnetic storm at the end of October (beginning of November 2003 (Halloween storm), when the Dst-index reached up to –400 nT [37]. At this time, the Solar Anomalous and Magnetospheric Particle Explorer (SAMPEX) detected multi-MeV electron transport from the outer zone of the radiation belt through the slot region into the inner magnetosphere up to L~1.5 [39,40]. Figure 5 shows the distribution of the flux intensity of relativistic electrons with energies of 2–6 MeV, according to the SAMPEX satellite data from [40] (fragment of their Figure 1).
It is seen from Figure 5 that the precipitation of high energy electrons from the outer radiation belt (which has a maximum around L~4.0) started on 31 October (304 days from the beginning of the year 2003) and lasted for about 30 days (during the entirety of November 2003). In this time interval, the relativistic electrons strongly filled the geomagnetic field lines L~2.0–2.5, as shown in Figure 5. Usually, this range of field lines is purely filled by charged particles, provided it belongs to a slot region (L~2.0–3.0, Figure 1). In analogy with the previous cases, which were presented in Figure 2, one may expect an increase in seismic activity in the regions located near the footprint of magnetic lines L~2.0–2.5 some weeks after the onset of the magnetic storm on 31 October 2023, and this does indeed occur. Hence, Figure 6 presents monthly earthquakes of magnitude M ≥ 4.5 that occurred in January–December of 2003 near the footprints of L = 2.0–2.5. It is seen that for the base of L = 2.0–2.5, the number of earthquakes strongly increased in November 2003; the largest here was an earthquake with M = 7.8, which occurred at the Rat Islands, Aleutian Islands, Alaska, on 17 November 2003, with coordinates 51.146°N, 178.650°E near the footprint of L~2.1. This earthquake happened ~17 days (over 2 weeks) after the geomagnetic storm onset on 31 October 2003.
The SAMPEX instruments detected a newly formed belt of relativistic electrons in the inner magnetosphere around L~1.5 for ~26 months (from November 2003 to December 2005 [39,40]). It is reasonable to compare the amount of global seismic energy released before and after this 26-month interval. To do this, we used the USGS Seismological Catalog for representative magnitudes M ≥ 4.5 (https://earthquake.usgs.gov/earthquakes/search, accessed on 25 October 2018) from July 1999 to April 2010 (65,684 earthquakes). For each of the events, the released seismic energy was estimated using the Gutenberg and Richter relation [47] (Es = 10(11.8+1.5M), where M is the magnitude, and the Es value is in ergs. Then, the sum of Es in each of the five 26-month intervals was estimated. The intervals were July 1999–August 2001 (10,427 events), September 2001–October 2003 (10,709 events), November 2003–December 2005 (15,106 events), January 2006–February 2008 (15,233 events), and March 2008–April 2010 (14,209 events). In Figure 7, the released seismic energy is given in Joules. It is seen in the 26-months bin (November 2003–December 2005) (when a belt of relativistic electrons was present in the inner magnetosphere due to the giant storm of 31 October 2003) that the released seismic energy peaked strongly (~3.7 × 10¹⁸ Joule) according to results in the 26-month intervals before and after. According to statistics, one earthquake with a magnitude of M8 or more occurs annually. However, when an intense belt of relativistic electrons existed in the lower magnetosphere in November 2003–December 2005 (after a giant magnetic storm in late October 2003), three such events occurred around the globe relatively rapidly (slightly more than 3 months). These were M8.1 (north of Macquarie Island on 23 December 2004), M9.1 (Sumatra, the Andaman Islands on 26 December 2004), and M8.6 (northern Sumatra on 28 March 2005).
The results in Figure 2, Figure 3, Figure 4, Figure 5, Figure 6 and Figure 7 clearly show that the geomagnetic field lines, when they are filled with high-energy particles, may take part in seismic processes (earthquakes tend to occur near the footprints of these magnetic lines). Here, we need to mention another result showing that the magnetic field lines are somehow involved in the earthquake preparation process [48]. For example, Figure 8 shows the geomagnetic field lines connecting 38 geomagnetically conjugated points at the Earth’s surface in the southern and northern hemispheres.
In the southern hemisphere, the coordinates of 38 points were determined, distributed relatively evenly along one of the seismic belts (the boundary of the Antarctic lithospheric plate). By using the GEOPACK computational package [33], we calculated the L-value (McIlwain parameter) for each of the 38 points, and the coordinates of a magnetically conjugate point in the northern hemisphere were determined. Figure 8 shows that the Antarctic lithospheric plate border, which is traced by the earthquake epicenters, is in magnetic conjugation with the zone at the junction of orogenic and platform structures in the northern hemisphere. The effect of geomagnetic conjugation is most clearly manifested between the southern boundary of the Nazca tectonic Plate and the northern boundaries of the Cocos and Caribbean tectonic plates. It is well known that many processes in the upper geospheres (ionosphere, magnetosphere) are magnetically conjugated (occur at the same geomagnetic L-line); the same is evidently true for the solid Earth.
3.2. On Temporal Variations of Solar Activity, Galactic Cosmic Rays, and Global Seismicity
The results in Figure 2, Figure 3, Figure 4, Figure 5, Figure 6 and Figure 7 support the idea that seismic activity increases when the atmosphere conductivity increases. In the considered cases, the precipitation of high-energy electrons from the outer radiation belt due to the magnetic storms increased conductivity at mesosphere heights [45], which is, on average, purely conductive. It was considered above that in a purely conductive stratosphere and troposphere, the galactic cosmic rays (GCRs) are mainly input to ionization and conductivity [23,24,25,26,27,28,29,30,31]. The flux of GCR increases in a solar minimum [28,29]; thus, one may expect increasing seismic activity in a solar minimum. Nowadays, earthquake rows are insufficient (especially for strong events [49]) to carry out such analysis with a high statistical significance; nevertheless, a tendency to increase seismic activity with decreasing solar activity is evident.
Hence, in [50], an out-of-phase relationship was found between secular variations in solar activity and seismic energy released on the planet in 1690–2002. The same result was obtained in [51,52]. It was shown in [53] that out of the 12 strongest earthquakes (with a magnitude of more than 7.5) that occurred in Japan in 1700–2005, nine events (~70%) were confined to periods of low solar activity when the intensity of galactic cosmic rays was increased.
Figure 9 presents the daily counts of earthquakes with a magnitude of M ≥ 4.5 that occurred on the Earth from 1 January 1973 to 31 December 2017, estimated based on the USGS Global Seismological Catalog. Over 226,000 earthquakes with a magnitude of M ≥ 4.5 occurred during these years.
Figure 9 shows that the number of seismic events around the globe has shown a sharp increase since the beginning of the 21st century. To underline that this is not a result of increasing global seismic network, which could register more effectively low magnitude earthquakes, we present in Figure 10 daily values of the released at the Earth seismic energy (log Es = 11.8 + 1.5 M) for the same period, from 1 January 1973 to 31 December 2017. The thick red line is a linear trend, which shows a monotonic, slightly increasing seismic energy from 1973 to 2017; the dashed square marks the cluster of the five strongest earthquakes (magnitudes more than 8.5) that occurred on the globe at the beginning of the 21st century: M9.1 (Sumatra, the Andaman Islands on 26 December 2004), M8.6 (northern Sumatra on 28 March 2005), M 8.8 (Chile on 27 February 2010), M 9.0 (Great Tohoku Earthquake, Japan on 11 March 2011), and M 8.6 (northern Sumatra on 11 April 2012).
Because of the hypothesis that seismic activity increases with increasing galactic cosmic ray (GCR) flux—which increases conductivity in the lower stratosphere and upper troposphere and thus increases the effectivity of the global electric circuit functioning, of which one element is an earthquake [8]—we show in Figure 11 the monthly time variation of galactic cosmic ray count (pink curve) and sunspot number (black curve) for the period 1979–2020, as obtained from [54]. Figure 11 shows out-of-phase variations in galactic cosmic rays and sunspot numbers. The black dashed line in Figure 11 is the time mean value of GCR counts. In contrast, the gold and green dashed lines indicate the one-half standard deviation above and below the mean, defining the maximum and minimum GCR groups, respectively. It can be seen that during the two decades of the 21st century, the intensity of GCR increased compared to previous decades. This supports the suggestion that the functioning of the GEC may have been more effective at the beginning of the 21st century, which could be responsible for a monotonic increase in global seismic activity from 1973 to 2017 (red trend in Figure 10).
4. Discussion
In [4], it was suggested that the Sun may be considered a significant agent provoking earthquakes during substantial increases in solar wind activity. One of Earth’s most striking manifestations of solar wind activity is geomagnetic storms. It is shown in many papers that a geomagnetic storm may precede the occurrence of an earthquake. The authors in [55] investigated seismicity variations in the Northern Tien-Shan region from 1975 to 1996, before and after geomagnetic storms with a sudden storm commencement (SSC). They showed that in the territories underlain by rocks with low electrical resistivity, the seismic activity increased on average 2–6 days after the onset of a geomagnetic storm. In [56], it was found for 1994–2017 that 17 earthquakes with magnitudes M ≥ 6.5 occurred within 2 days after 50 magnetic storms, when Kp-indices were above 7; all these events took place in the eastern hemisphere but were absent in the western hemisphere. In [57], 4666 earthquakes with magnitudes of Mw ≥ 6 that occurred between 1932 and 2016 in the Pacific Rim region with longitudes of 120°–160°E and 70°–130°W were investigated, and it was concluded that external forces acting at the time of geomagnetic storms might trigger an earthquake with a time delay of ~12–14 days. In [58], the authors investigated the correlation between geomagnetic storms and Mw ≥ 7.0 global earthquakes from 1957 to 2020; their results gave statistically significant evidence that the probability of geomagnetic storms increased around 26–27 days before earthquakes. In [59], the response of global seismicity to St. Patrick’s Day (17 March) geomagnetic storms in 2013 and 2015 was investigated. It was found that after a time delay of ~30 and ~39 days after storm onsets in 2013 and 2015, respectively, strong crust earthquakes occurred in relatively close continental areas: in Iran (M7.7, 16 April 2013) and Nepal (M7.8, 25 April 2015). Besides this, after a time delay of ~68 and ~74 days after storm onsets in 2013 and 2015, respectively, strong deep-focused earthquakes occurred at relatively close ocean areas: beneath the Sea of Okhotsk (M8.3, 24 May 2013, Russia) and beneath the Pacific Ocean (M7.8, 30 May 2015, Japan). The authors of [60] analyzed the magnetic field data from the Swarm three-identical satellite constellation concerning global Mw5.5+ shallow earthquakes from November 2013 to November 2021. They revealed that after the magnetic storm, the anticipation time of large earthquakes (Mw7.5+) may reach up to several years before an event occurrence.
Many years of searching for statistical connections between solar, geomagnetic, and seismic processes finally led to the first mathematical model [61] to consider the hypothesis of electromagnetic earthquakes being triggered by a sharp rise of telluric currents in the lithosphere, including crust faults due to the interaction of solar flare X-ray radiation with the ionosphere–atmosphere–lithosphere system producing an increase in telluric currents in the crust faults. The results of their numerical estimations showed that after an X-class solar flare, the telluric current density in the conductive layer of the lithosphere might be 2–3 orders higher than the average telluric current density in the lithosphere, and that it may be comparable with the parameters of the electric current pulses generated in the lithosphere by artificial pulsed power sources [62]. As they noted, these artificial electrical pulses injected into the Earth’s crust in seismic-prone areas resulted in the electromagnetic triggering of weak earthquakes and the spatiotemporal re-distribution of the regional seismicity of Pamir and Northern Tien Shan. Our results in Figure 2, Figure 3, Figure 4, Figure 5, Figure 6 and Figure 7 show that due to the impact of the geospace environment on the lithosphere, relatively strong earthquakes may occur (magnitude 7+). Moreover, these earthquakes may look as addressed (targeted) because they occurred exactly near the footprint of geomagnetic lines filled with relativistic electrons precipitating from the outer radiation belt due to geomagnetic storms.
Moreover, the time delay between the onset of a geomagnetic storm and the occurrence of an earthquake may vary from weeks to months. This means the solar wind energy is somehow delivered to some regions of the lithosphere. For several weeks or months, it somehow prepares rock media in those regions for destruction in a kind of earthquake. These results may be helpful for the further development of mathematical models of the solar–terrestrial coupling stated in [61].
Figure 9 and Figure 10 compare temporal variations in global seismicity, sunspot numbers, and galactic cosmic rays. Understandably, the rows of seismic and cosmic ray data were relatively short in comparison with sunspot data, which have been known about since 1755; nevertheless, a tendency of increasing global seismic activity with decreasing sunspot numbers and increasing galactic cosmic rays is evident and agrees with the findings of other authors, e.g., [50,51,52,53].
The dashed red square in Figure 10 marks the cluster of five mega-earthquakes in 2004–2012. The clustering started shortly after the giant magnetic storm in late October 2003, which provoked the long-lived storage of relativistic electrons forming around L~1.5. This storage persisted for more than 2 years (~26 months). It could have been repeatedly replenished with high-energy charged particles during other geomagnetic storms, as seen in Figure 5. Such an assumption does not seem very irrational because in [60], it was found that the delay time can be as long as several years for very strong earthquakes (Mw7.5+).
It is necessary to mention that after a cluster of strong earthquakes at the beginning of the 21st century (and especially after the M9.0 event in Japan), at the meeting of the Seismological Society of America in 2011, a heated debate ensured regarding whether the observed temporary clustering of strong earthquakes had some physical cause [49,63]. It was noted [49], “If global clustering of earthquakes is so important that it should be taken into account when assessing seismic hazard, then seismological data should reject the “null hypothesis” that the temporal distribution of earthquakes on the planet is described by the distribution Poisson (uniform distribution of random independent events that occur at a constant speed).” However, questions immediately arose about the reliability of the results of such testing conducted on a time-limited sample of sporadic events (which are the strongest earthquakes). In [64], the effectiveness of traditional statistical tests to unambiguously answer the question of the existence or absence of the clustering of earthquakes in catalogs with a small number of events was evaluated. It was concluded that the test results cannot be considered reliable when analyzing a relatively short sample with rare events. Thus, it was concluded [49], “… even if there is a global process leading to the generation and clustering of earthquakes, the length of the instrumental seismological series is currently too small to discover reliably. This situation may change either with the accumulation of seismological data in the future or with the advent of the physically justified hypothesis of earthquake generation, which will positively affect the test results.” We can consider a new hypothesis that the Sun could be a significant earthquake-provoking agent [4]. One of these hypotheses [61] suggests that electromagnetic earthquakes are triggered by a sharp rise of telluric currents in the lithosphere due to the interaction of solar flare X-ray radiation with the ionosphere–atmosphere–lithosphere system. Another hypothesis [8,65] suggests that the process of earthquake preparation and realization could be related to the functioning of the global electric circuit (GEC), and earthquake statistics support this suggestion. Hence, one of the main characteristics of the GEC is a unitary variation—a dependence of the fair-weather electric field on universal time, called the Carnegie curve [66,67]—which demonstrates a steady increase of the electric field in fair-weather regions at ~19:00 UT. It was revealed in [68,69] that the global seismic activity also shows a unitary variation, which has a rather strong correlation with the Carnegie curve.
5. Conclusions
We analyzed seismic activity for four well-known cases of the appearance of long-lived (several weeks, months, or years) radiation belts (storage rings) newly created by geomagnetic storms. In addition, some short-lived storage rings (several days’ duration) were also generated by each storm. Thus, it seems appropriate to conduct similar studies on short-lived storage rings using data from, for example, NASA’s “Van Alllen Probes” satellite (2012–2019), which carried high-tech equipment that did not fail during magnetic storms and intensified solar wind streams. Since it has been discovered that the delay time between a geomagnetic storm and the occurrence of an earthquake can be several weeks or even months, and since an earthquake is an intra-terrestrial phenomenon, it seems appropriate to begin retrospective studies of variations in the parameters of the solid Earth in the vicinity of the epicenters of those (targeted) earthquakes that appeared after geomagnetic storms.
Author Contributions
D.O. and G.K. provided the concepts for the manuscript. G.K. organized and wrote the manuscript. All authors provided critical feedback and helped shape the research, analysis, and manuscript. All authors have read and agreed to the published version of the manuscript.
Funding
This research is partly funded by the Science Committee of the Ministry of Science and Higher Education of the Republic of Kazakhstan under the grant #IRN-AP19677977.
Institutional Review Board Statement
Not applicable.
Informed Consent Statement
Not applicable.
Data Availability Statement
The original contributions presented in the study are included in the article; further inquiries can be directed to the corresponding author.
Acknowledgments
We thank the US Geological Survey and European–Mediterranean Seismological Centre for providing earthquake information services and data. We acknowledge the use of the NASA/GSFC’s Space Physics Data Facility’s CDAWeb service, OMNIdata. We especially thank the CRRES and Van Allen Probes scientific missions for providing observations of the radiation belt dynamics, and J. B. Blake et al., 1992, [41]; D. N. Baker et al., 2004, [39], 2007 [40]; R. M. Thorne et al., 2013, [43]; and S. G. Claudepierre et al., 2017, [44], whose results we used in our investigations. Lastly, we thank our reviewers.
Conflicts of Interest
The authors declare that the research was conducted without any commercial or financial relationships that could be construed as a potential conflict of interest.
References
- Guglielmi, A.V.; Klain, B.I. On the influence of the Sun on the seismicity of the Earth. Sol. Terr. Phys. 2020, 6, 111–115. [Google Scholar] [CrossRef]
- Fainberg, E.B.; Avagimov, A.A.; Zeigarnik, V.A.; Vasil’eva, T.A. Generation of heat flows in the Earth’s interior by global geomagnetic storms. Phys. Solid Earth 2004, 40, 315–322. (In Russian) [Google Scholar]
- Guglielmi, A.V. Ponderomotor forces in the crust and in the Earth’s magnetosphere. Earth Phys. 1992, 7, 35–39. [Google Scholar]
- Anagnostopoulos, G.; Spyroglou, I.; Rigas, A.; Preka-Papadema, P.; Mavromichalaki, H.; Kiosses, I. The Sun as a Significant Agent Provoking Earthquakes. Eur. Phys. J. Spec. Top. 2021, 230, 287–333. [Google Scholar] [CrossRef]
- Guglielmi, A.V.; Zotov, O.D. On geoseismic noise and helioseismic oscillations. Izvestiya Phys. Solid. Earth 2021, 57, 567–572. [Google Scholar] [CrossRef]
- McPherron, R. Magnetic Pulsations: Their Sources and Relation to Solar Wind and Geomagnetic Activity. Surv. Geophys. 2005, 26, 545–592. [Google Scholar] [CrossRef]
- Pulinets, S.A.; Boyarchuk, K. Ionospheric Precursors of Earthquakes; Springer: Berlin/Heidelberg, Germany, 2004. [Google Scholar]
- Pulinets, S.A. Physical mechanism of the vertical electric field generation over active tectonic faults. Adv. Space Res. 2009, 44, 767–773. [Google Scholar] [CrossRef]
- Pulinets, S.; Ouzounov, D. Lithosphere-Atmosphere-Ionosphere Coupling (LAIC) model—An unified concept for earthquake precursors validation. J. Asian Earth Sci. 2011, 41, 371–382. [Google Scholar] [CrossRef]
- Ouzounov, D.; Pulinets, K.S.; Hattori, P.; Taylor, P. (Eds.) Pre-Earthquake Processes: A Multi-disciplinary Approach to Earthquake Prediction Studies, American Geophysical Union; John Wiley & Sons: Hoboken, NJ, USA, 2018; 385p. [Google Scholar]
- Pulinets, S.; Ouzounov, D.; Karelin, A.; Davidenko, D. Lithosphere–Atmosphere–Ionosphere–Magnetosphere Coupling—A Concept for Pre-Earthquake Signals Generation. In Pre Earthquake Processes: A Multidisciplinary Approach to Earthquake Prediction Studies; John Wiley & Sons: Hoboken, NJ, USA, 2018; pp. 79–98. [Google Scholar]
- Roble, R.G.; Tzur, I. The Global Atmospheric Electrical Circuit. In Study in Geophysics—The Earth’s Electrical Environment; National Academy Press: Washington, DC, USA, 1986; pp. 206–231. [Google Scholar]
- Roble, R.G. On Modeling Component Processes in the Earth’s Global Electric Circuit. J. Atmos. Terr. Phys. 1991, 53, 831–847. [Google Scholar] [CrossRef]
- Schery, S.D.; Huang, S. An estimate of the global distribution of radon emissions from the ocean. Geophys. Res. Lett. 2004, 31, L19104. [Google Scholar] [CrossRef]
- Schery, S.D.; Wasiolek, M.A. Modeling 222Rn flux from the Earth’s surface. In Radon and Thoron in the Human Environment; Katase, A., Shimo, M., Eds.; World Scientific River Edge: River Edge, NJ, USA, 1998; pp. 207–217. [Google Scholar]
- Chandrashekara, M.S.; Sannappa, J.; Paramesh, L. Studies on atmospheric electrical conductivity related to radon and its progeny concentrations in the lower atmosphere at Mysore. Atmos. Envir. 2006, 40, 87–95. [Google Scholar] [CrossRef]
- Kobeissi, M.A.; Gomez, F.; Tabet, C. Measurement of anomalous radon gas emanation across the Yammouneh Fault in southern Lebanon: A possible approach to earthquake prediction. Int. J. Disaster Risk Sci. 2015, 6, 250–266. [Google Scholar] [CrossRef]
- Harrison, R.; Aplin, K.; Rycroft, M. Atmospheric Electricity Coupling Between Earthquake Regions and the Ionosphere. J. Atmos. Sol. Terr. Phys. 2010, 72, 376–381. [Google Scholar] [CrossRef]
- Rycroft, M.J.; Harrison, G. Electromagnetic Atmosphere-Plasma Coupling: The Global Atmospheric Electric Circuit. Space Sci. Rev. 2012, 168, 363–384. [Google Scholar] [CrossRef]
- Němec, F.; Santolík, O.; Parrot, M. Decrease of Intensity of ELF/VLF Waves Observed in the Upper Ionosphere Close to Earthquakes: A Statistical Study. J. Geophys. Res. 2009, 114, A04303. [Google Scholar] [CrossRef]
- Bering, E.A.; Few, A.A.; Benbrook, J.R. The global electric circuit. Phys. Today 1998, 51, 24–30. [Google Scholar] [CrossRef]
- Makarova, L.N.; Shirochkov, A.V. A New Approach to the Global Electric Circuit Conception. 1998. Available online: http://www.sgo.fi/SPECIAL/Contributions/Makarova.pdf (accessed on 10 November 2021).
- Bazilevskaya, G.A.; Usoskin, I.G.; Flückiger, E.O.; Harrison, R.G.; Desorgher, L.; Bütikofer, R.; Krainev, M.B.; Makhmutov, V.S.; Stozhkov, Y.I.; Svirzhevskaya, A.K.; et al. Cosmic ray induced ion production in the atmosphere. Space Sci. Rev. 2008, 137, 149–173. [Google Scholar] [CrossRef]
- Phillips, T.; Johnson, S.; Koske-Phillips, A.; White, M.; Yarborough, A.; Lamb, A.; Schultz, J. Space weather ballooning. Space Weather 2016, 14, 697–703. [Google Scholar] [CrossRef]
- Frohlich, C.; Lean, J. Total solar irradiance variation in new eyes to see inside the sun and stars. In Proceedings of the IAU Symposium, Kyoto, Japan, 26–30 August 1997; p. 185. [Google Scholar]
- Markson, R. Modulation of the Earth’s electric field by cosmic radiation. Nature 1981, 291, 304–308. [Google Scholar] [CrossRef]
- Harrison, R.G. The Global Atmospheric Electrical Circuit and Climate. Surv. Geophys. 2004, 25, 441–484. [Google Scholar] [CrossRef]
- Carslaw, K.S.; Harrison, R.G.; Kirkby, J. Cosmic rays, clouds, and climate. Science 2002, 298, 1732–1737. [Google Scholar] [CrossRef] [PubMed]
- Kirkby, J. Cosmic Rays and Climate. SurvGeophys 2007, 28, 333–375. [Google Scholar] [CrossRef]
- Usoskin, I.G.; Desorgher, L.; Velinov, P.; Storini, M.; Flückiger, E.O.; Bütikofer, R.; Kovaltsov, G.A. Ionization of the Earth’s atmosphere by solar and galactic cosmic rays. Acta Geophys. 2009, 57, 88–101. [Google Scholar] [CrossRef]
- Vainio, R.; Desorgher, L.; Heynderickx, D.; Storini, M.; Flückiger, E.; Horne, R.B.; Kovaltsov, G.A.; Kudela, K.; Laurenza, M.; McKenna-Lawlor, S.; et al. Dynamics of the Earth’s particle radiation environment. Space Sci. Rev. 2009, 147, 187–231. [Google Scholar] [CrossRef]
- McIlwain, C.E. Coordinates for mapping the distribution of geomagnetically trapped particles. J. Geophys. Res. 1961, 66, 3681–3691. [Google Scholar] [CrossRef]
- Tsyganenko, N.A. Geopack: A Set of Fortran Subroutines for Computations of the Geomagnetic Field in the Earth’s Magnetosphere. 2008. Available online: https://geo.phys.spbu.ru/~tsyganenko/Geopack-2008.html (accessed on 1 October 2012).
- Gonzalez, W.D.; Joselyn, J.A.; Kamide, Y.; Kroehl, H.W.; Rostoker, G.; Tsurutani, B.T.; Vasyliunas, V.M. What is a Geomagnetic Storm? J. Geophys. Res. 1994, 99, 5771–5792. [Google Scholar] [CrossRef]
- Loewe, C.A.; Prölss, G.W. Classification and mean behavior of magnetic storms. J. Geophys. Res. Space Phys. 1997, 102, 14209–14213. [Google Scholar] [CrossRef]
- Van Allen, J.A.; Ludwig, G.H.; Ray, E.C.; McIlwain, C.E. Observation of high intensity radiation by satellites 1958 alpha and gamma. J. Jet Propuls. 1958, 28, 588–592. [Google Scholar] [CrossRef]
- Baker, D.N.; Erickson, P.J.; Fennell, J.F.; Foster, J.C.; Jaynes, A.N.; Verronen, P.T. Space Weather Effects in the Earth’s Radiation Belts. Space Sci. Rev. 2018, 214, 17. [Google Scholar] [CrossRef]
- Baker, D.N.; Kanekal, S.G.; Hoxie, V.C.; Henderson, M.G.; Li, X.; Spence, H.E.; Elkington, S.R.; Friedel, R.H.W.; Goldstein, J.; Hudson, M.K.; et al. A long-lived relativistic electron storage ring embedded in Earth’s outer Van Allen belt. Science 2013, 340, 186–190. [Google Scholar] [CrossRef]
- Baker, D.N.; Kanekal, S.G.; Li, X.; Monk, S.P.; Goldstein, J.; Burch, J.L. An extreme distortion of the Van Allen belt arising from the Halloween solar storm in 2003. Nature 2004, 432, 878–881. [Google Scholar] [CrossRef] [PubMed]
- Baker, D.N.; Kanekal, S.G.; Horne, R.B.; Meredith, N.P.; Glauert, S.A. Low-altitude measurements of 2–6 MeV electron trapping lifetimes at 1.5 ≤ L ≤ 2.5. Geophys. Res. Lett. 2007, 34, L20110. [Google Scholar] [CrossRef]
- Blake, J.B.; Kolasinski, W.A.; Fillius, R.W.; Mullen, E.G. Injection of electrons and protons with energies of tens of MeV into L < 3 on March 24 1991. Geophys. Res. Lett. 1992, 19, 821–824. [Google Scholar] [CrossRef]
- Galper, A.M. Earth radiation belt. Soros Educ. J. 1999, 75–81. Available online: http://cosmic-rays.ru/Resource/9906_075.pdf (accessed on 10 November 2021).
- Thorne, R.M.; Li, W.; Ni, B.; Ma, Q.; Bortnik, J.; Baker, D.N.; Spence, H.E.; Reeves, G.D.; Henderson, M.G.; Kletzing, C.A.; et al. Evolution and slow decay of an unusual narrow ring of relativistic electrons near L~3.2 following the September 2012 magnetic storm. Geophys. Res. Lett. 2013, 40, 3507–3511. [Google Scholar] [CrossRef]
- Claudepierre, S.G.; O’Brien, T.P.; Fennell, J.F.; Blake, J.B.; Clemmons, J.H.; Looper, M.D.; Mazur, J.E.; Roeder, J.L.; Turner, D.L.; Reeves, G.D.; et al. The hidden dynamics of relativistic electrons (0.7-1.5 MeV) in the inner zone and slot region. J. Geophys. Res. Space Phys. 2017, 122, 3127–3144. [Google Scholar] [CrossRef]
- Kavanagh, A.J.; Cobbett, N.; Kirsch, P. Radiation Belt Slot Region Filling Events: Sustained Energetic Precipitation Into the Mesosphere. J. Geophys. Res. Space Phys. 2018, 123, 7999–8020. [Google Scholar] [CrossRef]
- Li, W.; Hudson, M.K. Earth’s Van Allen Radiation Belts: From Discovery to the Van Allen Probes Era. J. Geophys. Res. Space Phys. 2019, 124, 8319–8351. [Google Scholar] [CrossRef]
- Gutenberg, B.; Richter, C. Magnitude and energy of earthquakes. Nature 1955, 176, 795. [Google Scholar] [CrossRef]
- Khachikyan, G.; Zhakupov, N.; Kadyrkhanova, N. Geomagnetic conjugacy of modern tectonic structures. Geodyn. Tectonophys. 2013, 4, 187–195. [Google Scholar] [CrossRef]
- Michael, A.J. Random variability explains apparent global clustering of large earthquakes. Geophys. Res. Lett. 2011, 38, L21301. [Google Scholar] [CrossRef]
- Shestopalov, I.P.; Kharin, E.P. Secular variations of solar activity and seismicity of the Earth. Geophys. J. 2006, 28, 59–70. [Google Scholar]
- Zhang, G.Q. Relationship between global seismicity and solar activities. Acta Seismol. Sin. 1998, 11, 495–500. [Google Scholar]
- Huzaimy, J.M.; Yumoto, K. Possible correlation between solar activity and global seismicity. In Proceeding of the 2011 IEEE International Conference on Space Science and Communication (IconSpace), Penang, Malaysia, 12–13 July 2011; pp. 138–141. [Google Scholar]
- Ebisuzaki, T.; Miyahara, H.; Katoaka, R.; Sato, T.; Ishimine, Y. Explosive volcanic eruptions triggered by cosmic rays: Volcano as a bubble chamber. Gondwana Res. 2011, 19, 1054–1061. [Google Scholar] [CrossRef]
- Kumar, V.; Dhaka, S.K.; Hitchman, M.H.; Yoden, S. The influence of solar-modulated regional circulations and galactic cosmic rays on global cloud distribution. Sci. Rep. 2023, 13, 3707. [Google Scholar] [CrossRef]
- Sobolev, G.A.; Zakrzhevskaya, N.A.; Kharin, E.P. On the relation between seismicity and magnetic storms. Phys. Solid. Earth. 2001, 37, 917–927. [Google Scholar]
- Sobolev, G.A. The effect of strong magnetic storms on the occurrence of large earthquakes. Izv. Phys. Solid. Arth. 2021, 57, 20–36. [Google Scholar] [CrossRef]
- Urata, N.; Duma, G.; Freund, F. Geomagnetic Kp Index and Earthquakes. Open J. Earthq. Res. 2018, 7, 39–52. [Google Scholar] [CrossRef]
- Chen, H.; Wang, R.; Miao, M.; Liu, X.; Ma, Y.; Hattori, K.; Han, P. A Statistical Study of the Correlation between Geomagnetic Storms and M ≥ 7.0 Global Earthquakes during 1957–2020. Entropy 2020, 22, 1270. [Google Scholar] [CrossRef]
- Ouzounov, D.; Khachikyan, G. A similarity in patterns of global seismicity after St. Patrick’s Day geomagnetic storms of 2013 and 2015. arXiv 2023, arXiv:2302.14173. [Google Scholar] [CrossRef]
- Marchetti, D.; De Santis, A.; Campuzano, S.A.; Zhu, K.; Soldani, M.; D’arcangelo, S.; Orlando, M.; Wang, T.; Cianchini, G.; Di Mauro, D.; et al. Worldwide Statistical Correlation of Eight Years of Swarm Satellite Data with M5.5+ Earthquakes: New Hints about the Preseismic Phenomena from Space. Remote Sens. 2022, 14, 2649. [Google Scholar] [CrossRef]
- Sorokin, V.; Yaschenko, A.; Mushkarev, G.; Novikov, V. Telluric Currents Generated by Solar Flare Radiation: Physical Model and Numerical Estimations. Atmosphere 2023, 14, 458. [Google Scholar] [CrossRef]
- Zeigarnik, V.A.; Bogomolov, L.M.; Novikov, V.A. Electromagnetic Earthquake Triggering: Field Observations, Laboratory Experiments, and Physical Mechanisms—A Review. Izv. Phys. Solid. Earth 2022, 58, 30–58. [Google Scholar] [CrossRef]
- Bufe, C.G.; Perkins, D. The 2011 Tohoku earthquake: Resumption of temporal clustering of Earth’s megaquakes. Seismol. Res. Lett. 2011, 82, 455. [Google Scholar]
- Ammon, C.J.; Aster, R.C.; Lay, T.; Simpson, D.W. The Tohoku earthquake and a 110-year spatio-temporal record of global seismic strain release. Seismol. Res. Lett. 2011, 82, 454. [Google Scholar]
- Namgaladze, A.A. Earthquakes, and global electrical circuit. Russ. J. Phys. Chem. 2013, 7, 589–593. [Google Scholar] [CrossRef]
- Whipple, F.J.W. On the association of the diurnal variation of electric potential gradient in fine weather with the distribution of thunderstorms over the globe. Q. J. R. Meteorol. Soc. 1929, 55, 1–18. [Google Scholar] [CrossRef]
- Harrison, R.G. The Carnegie Curve. Surv. Geophys. 2013, 34, 209–232. [Google Scholar] [CrossRef]
- Pulinets, S.A.; Khachikyan, G.Y. Unitary Variation in the Seismic Regime of the Earth: Carnegie-Curve Matching. Geomagn. Aeron. 2020, 60, 787–792. [Google Scholar] [CrossRef]
- Pulinets, S.; Khachikyan, G. The Global Electric Circuit and Global Seismicity. Geosciences 2021, 11, 491. [Google Scholar] [CrossRef]
Figure 1.
Schematic diagram of Earth’s radiation belt, reprinted from Ref. [37].
Figure 1.
Schematic diagram of Earth’s radiation belt, reprinted from Ref. [37].

Figure 2.
Histograms of the monthly number of earthquakes of M ≥ 4.5 occurring near the footprints of geomagnetic lines belonging to the newly created belts of relativistic electrons: (a) 1991, L = 2.5–2.7; (b) 2012, L = 3.0–3.5; and (c) 2015, L = 1.5–1.8.
Figure 2.
Histograms of the monthly number of earthquakes of M ≥ 4.5 occurring near the footprints of geomagnetic lines belonging to the newly created belts of relativistic electrons: (a) 1991, L = 2.5–2.7; (b) 2012, L = 3.0–3.5; and (c) 2015, L = 1.5–1.8.

Figure 3.
Variations of hourly mean Dst index for 3 92-day periods: (a) 1991, from 19 March, 04:30 UT; (b) 2012, from 27 August, 22:30 UT; and (c) 2015, from 16 June, 18:30 UT. Upper red star marks dates of geomagnetic storm onsets in March 1991, September 2012, and June 2015, and red vertical lines indicate the dates of the strongest earthquakes that occurred in the footprint of magnetic lines belonging to the radiation belts newly created in the inner magnetosphere due to indicated magnetic storms: M7.0 in Alaska on 30 May 1991, near the footprint of L~2.69; M7.8 near Canada on 28 October 2012, near the footprint of L~3.3; and M6.3 in New Zealand on 7 September 2015, near the footprint of L~1.58.

Figure 4.
Distribution by month in 2012 for the number of earthquakes of magnitude M ≥ 4.5 that occurred at the base of geomagnetic lines L = 2.5–2.99 (green, 115 events), L = 3.0–3.5 (red, around which a belt of high-energy electrons was formed after the geomagnetic storm on 1 September 2012, 119 events), and L = 3.51–5.0 (blue, 29 events).

Figure 5.
Distribution on geomagnetic lines in 2003–2005 the flux intensity of relativistic electrons with energies of 2–6 MeV according to the SAMPEX satellite data adapted from Ref. [40] (fragment of their Figure 1).
Figure 5.
Distribution on geomagnetic lines in 2003–2005 the flux intensity of relativistic electrons with energies of 2–6 MeV according to the SAMPEX satellite data adapted from Ref. [40] (fragment of their Figure 1).

Figure 6.
Histograms of the monthly number of earthquakes of M ≥ 4.5 occurring near the footprints of geomagnetic lines L = 2.0−2.5 from January to December of 2003.
Figure 6.
Histograms of the monthly number of earthquakes of M ≥ 4.5 occurring near the footprints of geomagnetic lines L = 2.0−2.5 from January to December of 2003.

Figure 7.
Histograms of the global seismic energy released into the five 26-month intervals: July 1999−August 2001, September 2001−October 2003, November 2003−December 2005, January 2006−February 2008, and March 2008−April 2010, based on the USGS seismological catalog for M ≥ 4.5.
Figure 7.
Histograms of the global seismic energy released into the five 26-month intervals: July 1999−August 2001, September 2001−October 2003, November 2003−December 2005, January 2006−February 2008, and March 2008−April 2010, based on the USGS seismological catalog for M ≥ 4.5.

Figure 8.
Geomagnetic field lines connecting magnetically conjugated sites, adapted with permission from Ref. [48].
Figure 8.
Geomagnetic field lines connecting magnetically conjugated sites, adapted with permission from Ref. [48].

Figure 9.
The daily counts of earthquakes with a magnitude of M ≥ 4.5 occurred on the Earth from 1 January 1973 to 31 December 2017.
Figure 9.
The daily counts of earthquakes with a magnitude of M ≥ 4.5 occurred on the Earth from 1 January 1973 to 31 December 2017.

Figure 10.
The logarithm of the daily amount of released global seismic energy (Joules) from 1 January 1973 to 31 December 2017 in earthquakes of M ≥ 4.5; the red line is a linear trend; the dashed square marks the cluster of the five strongest earthquakes (magnitudes more than 8.5).
Figure 10.
The logarithm of the daily amount of released global seismic energy (Joules) from 1 January 1973 to 31 December 2017 in earthquakes of M ≥ 4.5; the red line is a linear trend; the dashed square marks the cluster of the five strongest earthquakes (magnitudes more than 8.5).

Figure 11.
Monthly time variation of sunspot number (black curve) and galactic cosmic ray (GCR) count (pink curve) for the period 1979−2020, adapted from Ref. [54] (fragment of their Figure 1).
Figure 11.
Monthly time variation of sunspot number (black curve) and galactic cosmic ray (GCR) count (pink curve) for the period 1979−2020, adapted from Ref. [54] (fragment of their Figure 1).

Disclaimer/Publisher’s Note: The statements, opinions and data contained in all publications are solely those of the individual author(s) and contributor(s) and not of MDPI and/or the editor(s). MDPI and/or the editor(s) disclaim responsibility for any injury to people or property resulting from any ideas, methods, instructions or products referred to in the content. |
© 2023 by the authors. Licensee MDPI, Basel, Switzerland. This article is an open access article distributed under the terms and conditions of the Creative Commons Attribution (CC BY) license (https://creativecommons.org/licenses/by/4.0/).
Share and Cite
MDPI and ACS Style
Ouzounov, D.; Khachikyan, G. Studying the Impact of the Geospace Environment on Solar Lithosphere Coupling and Earthquake Activity. Remote Sens. 2024, 16, 24. https://doi.org/10.3390/rs16010024
AMA Style
Ouzounov D, Khachikyan G. Studying the Impact of the Geospace Environment on Solar Lithosphere Coupling and Earthquake Activity. Remote Sensing. 2024; 16(1):24. https://doi.org/10.3390/rs16010024
Chicago/Turabian StyleOuzounov, Dimitar, and Galina Khachikyan. 2024. "Studying the Impact of the Geospace Environment on Solar Lithosphere Coupling and Earthquake Activity" Remote Sensing 16, no. 1: 24. https://doi.org/10.3390/rs16010024
Note that from the first issue of 2016, this journal uses article numbers instead of page numbers. See further details here.