
Spatiotemporal Evolution and Rank–Size Pattern of Chinese Urban Settlements
by
 , ,
, ,
Jing Zhang
1,2, 
Chunlin Li
2,3,*,
Baolei Zhang
1,
Yuanman Hu
2,3,
Hao Wang
4,
Zhenxing Li
5 and
Qian Zhang
1,2 1
College of Geography and Environment, Shandong Normal University, Jinan 250300, China
2
CAS Key Laboratory of Forest Ecology and Management, Institute of Applied Ecology, Chinese Academy of Sciences, Shenyang 110016, China
3
E’erguna Wetland Ecosystem National Research Station, Hulunbuir 022250, China
4
Piesat Information Technology Company Limited, Beijing 100195, China
5
School of Architecture and Urban planning, Shenyang Jianzhu University, Shenyang 110168, China
*
Author to whom correspondence should be addressed.
Remote Sens. 2024, 16(1), 19; https://doi.org/10.3390/rs16010019
Submission received: 6 November 2023
/
Revised: 14 December 2023
/
Accepted: 18 December 2023
/
Published: 20 December 2023
(This article belongs to the Topic Sustainable Development and Coordinated Governance of Urban and Rural Areas under the Guidance of Ecological Wisdom)
Abstract
:Accurate and timely urban boundaries can effectively quantify the spatial characteristics of urban evolution and are essential for understanding the impacts of urbanization processes and land-use changes on the environment and biodiversity. Currently, there is a lack of long time-series, high-resolution, nationally consistent Chinese urban boundary data for urban research. In this study, the city clustering algorithm was used to generate urban settlement boundaries in China based on the local density, size, and spatial relationships of impervious surfaces. The results showed that both the area and the number of urban settlements in China revealed an upward trend from 1985 to 2020, with East China (EC) being much higher than other regions and South China showing the most significant growth rate. The average area ratio of urban green space in China was 41.68%, with the average area ratio in EC being higher than in other regions. Meanwhile, Zipf’s law was used to verify the universality of urban settlement rank–size; the changes in the Zipf index from 1985 to 2020 also revealed that China’s urban size tended to be concentrated, and the development of large urban settlements was relatively prominent. The urban definition method we propose in this study can divide urban boundaries efficiently and accurately, identify urban expansion hotspots, and promote research on farmland loss and ecological land degradation, further exploring the impacts of urbanization on food security, biodiversity, and carbon sequestration. By coupling big data such as economy, energy, and population with urban evolution patterns, urban managers can analyze current and future problems in urban development, thereby providing scientific decision-making for urban sustainability.
1. Introduction
Urban settlements are places of concentrated human habitation, production, and living, and they are projected to house 68 percent of people globally in 2050 [1]. Urban settlements have a wide range of related research topics, including human activities [2,3], ecological environment [4,5], biodiversity conservation [6,7,8], economic development [9,10], and social activities [11]. The research of relevant urban settlements requires a defined spatial scope. Urban settlements are distinguished from “built-up areas” and “administrative districts” by the fact that they have urban characteristics, reflect human activities, and are the boundaries of urban entities. The urban entity boundary is superior to the traditional administrative boundary and can reflect urban evolution and expansion. Currently, there is no standardized definition of an urban entity. Therefore, the unified identification of urban settlement boundaries through urban entities has important scientific research and significance [12,13].
In recent years, the continuous enrichment of long time-series, multi-temporal, and time-sensitive remote sensing big data has provided data support for the identification of urban settlement boundaries [14,15,16,17,18]. Currently, scholars have done a lot of research on the identification of urban settlement boundaries using spatial clustering based on remote sensing images [19], nighttime lights [20], impervious surfaces [21], and POI data [22]. However, the identification of entities and uniform boundaries based on urban settlements is still a great challenge. On the one hand, the definition of urban settlement boundaries varies depending on the application and dataset, and there is no uniform or standardized definition yet. For example, urban boundaries based on nighttime lighting are mainly determined by the lights emitted by the city at night, potentially ignoring small, low-light human settlements [23]. On the other hand, it is difficult to obtain high-resolution data sources with spatial and temporal consistency. Most studies are based on auxiliary datasets or complex models [21]. The growing size of cities has led to an increasing blurring of urban–rural boundaries, and it is difficult to capture the full range of urban functions with traditional urban classification methods [24]. Currently, there are two main types of classification for cities: one is to classify cities based on regular pixel units using remotely sensed raster data; the other is to delineate city boundaries based on the density, size, and space of raster pixels or vector data (e.g., street nodes), and both methods use city clustering algorithms (CCAs) [21,25]. The CCA is an algorithm that defines urban boundaries based on the geographic distribution of social activities on a finer spatial scale, breaks through the traditional boundaries of administrative divisions, and effectively makes up for the shortcomings of the basic administrative unit that underestimates the number of large cities and the city cluster that underestimates the number of small cities. Therefore, overcoming the mixing of urban and rural landscapes as well as the constraints of administrative boundaries, delineating urban boundaries as objectively and clearly as possible, and analyzing the spatial and temporal characteristics of urban evolution are crucial to a better understanding of urbanization.
Accurate urban settlement boundaries can help scholars and urban managers grasp the characteristics of urban scale, optimize spatial structure and pattern, and guide future urban evolution. Research on the evolution of urban size has focused on methods such as Zipf’s law, the first-degree index, and the Herfindahl index, utilizing a variety of data sources, such as demographic data, nighttime lighting data, and land remote sensing data, and focusing on spatial scales across the country and in different regions, provinces, and urban agglomerations. The classic theory on the size distribution of urban is Zipf’s law. Zipf’s law can characterize whether the development of urban size is characterized by dispersion or concentration and can better describe national urban hierarchies as well as the size of urban in individual regions [26,27]. Wen et al. (2016) used urban population data, a double logarithmic regression model, and Zipf’s law to test the size and class of Chinese urban, and the results indicated that the distribution of Chinese urban size is relatively balanced and basically conforms to Zipf’s law [28]. Deng et al. (2019) explored the built-up area of Chinese urban areas using Zipf’s law, explaining that the built-up areas of all Chinese urban maintain a growing trend, but the rate of expansion varies greatly from one period to another [29]. Huang et al. (2015) conducted a study on urban evolution based on nighttime lighting data and found that the Zipf’s law approach is effective in revealing the dynamics of urban development from both national and city perspectives [30]. Most studies not only used Zipf’s law for regionalization and descriptive analysis but also deeply explored the influencing factors of urban rank–size. It has also been found that the rank–size distribution of cities in developed countries is relatively stable, whereas, in developing countries, the magnitude of change is significant [31,32].
Impervious surfaces, as an indicator of the intensity of human activity and economic development, are the key characteristic of urbanization and can be an important basis for distinguishing urban from non-urban areas [33]. Impervious surfaces are the basic cover type for characterizing built-up areas and urban extent and are important indicators for understanding the impacts of urbanization on human society and the environment [34]. Therefore, exploring urban evolution characteristics based on impervious surfaces has explanatory power. Many studies have integrated multidimensional feature information, such as temporal, spatial, spectral, and others, to extract continuously varying impervious surface cover, obtain more accurate dynamic urban extensions, and analyze the characteristics of urban evolution [35,36].
In this paper, based on the local density, size, and spatial relationship of impervious surfaces, we used the CCA to identify the boundaries of urban settlements in China and explore their evolutionary characteristics. The main objectives were (1) to determine the unified, objective, and clear boundaries of urban settlements in China for the period 1985–2020 and (2) to explore the spatial and temporal characteristics of the size distribution of urban settlements using Zipf’s law. By achieving the objectives, this study could accurately and objectively grasp the evolution of urban settlements in China and provide basic data and scientific decision-making for various urban studies.
2. Materials and Methods
2.1. Study Area
In this paper, the territory of China (73°33′~135°05′E, 3°51′~53°33′N) was selected as the study area. Meanwhile, combining the geographical characteristics, natural environment, and socioeconomic development status of different regions in China, the study area was divided into seven geographical regions: Northeast China (NEC), East China (EC), North China (NC), Central China (CC), South China (SC), Northwest China (NWC), and Southwest China (SWC) (Figure 1) [37,38]. With the rapid development of urbanization, China’s urbanization rate and built-up areas are increasing. According to the China Statistical Yearbook 2021 [39], the region with the highest population urbanization rate as of 2020 is NC (72.47%), followed by EC (69.35%), and the lowest is SWC, with an urbanization rate of 53.02%.
2.2. Data Source
The data sources used in this study are shown in Table 1. The impervious surface dynamic datasets and water body datasets were used for urban settlement identification. The MODIS Global Urban Extent Products (MGUP), global urban boundaries (GUB), and standardized urban built-up area dataset for China (SUBAD) were used as the validation data.
2.3. Methods
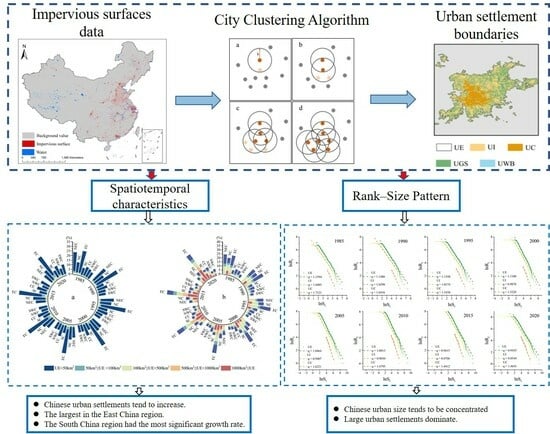
The local density of impervious surfaces based on the moving window algorithm was used to distinguish three types of patches—urban, suburban, and rural areas—according to the threshold of local density. Cluster analysis was performed on urbanized patches (including urban and suburban patches) using the CCA to identify the boundary of urban settlements, which is the urban extent (UE). The urban settlement is a geographically contiguous and separate urban patch that may contain several cities and serve as the entity boundary of the urban. Within the UE, the urban settlement compositions were identified based on the density, area size, and spatial relationships of impervious surfaces, such as urban impervious area (UI), urban dense center (UC), urban water body (UWB), and urban green space (UGS). Zipf’s law was used to explore the scale evolution characteristics of the Chinese urban system. The research framework is shown in Figure 2.
2.3.1. Patch Type Identification
The local density of impervious surfaces and topological relationships of different patches were used to identify urban, suburban, and rural patches. The local density of the impervious surface is the ratio of the number of impermeable surface pixels to the total number of pixels in a certain neighborhood window. A moving window was used to count the number of pixels with the following formula:
where Pbuilt represents the local density, Cimpervious represents the total number of impervious surface pixels in the neighborhood window, N represents the total number of pixels in the window, and Cwater represents the total number of permanent water body pixels in the neighborhood window. The size of the neighborhood window was chosen to be 33 by 33, which is a walking distance of 10 min [44] and an area of approximately 1 km2. The impervious surface data were processed as described above using Google Earth Engine to obtain the local density. Urban patches were defined as impervious surface local densities higher than 0.5 [44,45,46]; suburban patches were defined as impervious surface local densities between 0.25 and 0.5 [44] and spatially adjacent to urban patches; impervious surface local densities less than 0.25 were defined as rural patches. According to the empirical threshold, the local density of impervious surfaces was classified, and three sets of vector data were obtained for urban patches, suburban patches, and rural patches, among which urban patches and suburban patches were collectively referred to as urbanized patches.
2.3.2. City Clustering Algorithm
In this study, the CCA method was applied to the urbanized patches to define the extent of each Chinese city. The CCA method proposed by Rozenfeld et al. (2010) utilizes the concept of spatial continuity to define urban beyond administrative boundaries [47]. The CCA is defined by two parameters: the area threshold S* and the search distance h, which denote the minimum area and distance to form an independent urban settlement, respectively. According to previous studies, the average population density is approximately 10,000 persons/square kilometer through a global survey of urban populations of different ranks, and usually, a population of 50,000 is considered an independent urban settlement [44,48]. Therefore, the minimum area threshold S* was set as 5 km2 in this paper. The search distance h was set as 1 km in this paper, which is approximately a 10 min walking distance [44]. The CCA process is shown in Figure 3, where the small points of different colors are the geometric centers of the urbanized patches.
Based on the defined UE, other boundaries were identified by the degree of density aggregation, area size, and spatial relationships. The UI was obtained by extracting the impervious surface data according to the UE range. The UC is the area where the local density of the UI is greater than 20% or the area is greater than 50 km2. The UWB was obtained by extracting permanent water bodies from the UE, and the UGS was obtained by removing the UI and UWB from the UE. The UE, as an independent urban settlement, can have obvious differences in size. Referring to the criteria for dividing urban resident population size and average population density [48,49], this study divided urban settlement areas into five categories based on UE area: UE < 50 km2, 50 km2 ≤ UE <100 km2, 100 km2 ≤ UE < 500 km2, 500 km2 ≤ UE < 1000 km2, and 1000 km2 ≤ UE.
2.3.3. Accuracy Verification
To assess the accuracy of the urban agglomeration identification results objectively, we used the results of urban and non-urban area delineation as the actual delineation results to establish the urban confusion matrix and calculate the overall accuracy (OA). For the UE and UI, we randomly generated 3165 sample points and compared them with the urban boundary datasets of “MGUP”, “GUB”, and “SUBAD”. Meanwhile, the equal area buffer was made based on the UE, and 2000 points were randomly selected in urban buffer areas and the UE area. Based on the high-resolution Google imagery, we manually and visually interpreted whether the point was in the UE, UGS, UWB areas or non-urban areas. The confusion matrices were established based on our urban identification results, urban boundary datasets, and interpretation results. The OA of these confusion matrices was calculated based on the following formula:
where OA indicates the percentage of the total number of correctly categorized test points in the sample, N is the total number of sample points, r is the total number of rows, and xii is the diagonal element of the confusion matrix.
2.3.4. Zipf’s Law
Zipf’s law is a quantitative relationship between the frequency of words in English literature and their sequence number, as proposed by George K. Zipf of Harvard University, based on a large number of statistics on the frequency of words appearing in English literature [50]. Zipf’s law was used to test the characteristics of the urban size distribution and states that the product of urban rank and size is a constant [51]. Zipf’s law is not universally applicable to all cities, but it has been accepted by many as the ideal state of equilibrium. The calculation formula is as follows:
For ease of understanding, the natural logarithmic transformation was applied to Equation (2) as follows:
where q is the Zipf index, which reflects the characteristics of urban development distribution. Si is the urban size, Ri is the rank of urban size, and S1 is the maximum urban size. A value of q close to 1 means that the urban development is close to the equilibrium state and satisfies Zipf’s law; 0 < q < 1 indicates that the development of large cities is prominent and plays the role of a monopoly position, and the development of small and medium-sized urban areas is relatively insufficient, which means that the distribution of urban development is relatively concentrated; q > 1 indicates that the development of urban scale is relatively decentralized, and the development of large, small, and medium-sized urban areas is relatively balanced. For the analysis of urban development in a long time series, a value of q gradually increasing indicates that urban development tends to be balanced, and a value of q gradually decreasing indicates that the urban development distribution tends to be concentrated.
3. Results
3.1. Accuracy Verification of Urban Settlements
The UE was compared with “urban extent” in the MGUP dataset and “urban boundaries” in the GUB dataset of 2015 for validation, and the OA was 85.09% and 87.24%, respectively. The OA of UI was 85.54% when compared with the SUBAD dataset. The results of the manual and visual interpretation showed that the OA of UE, UGS, and UWB identification in this study were 82.91%, 93.56%, and 94.71%, respectively. The spatial urban boundary results of four representative Chinese cities, Beijing, Tianjin, Shanghai, and Chongqing, were selected for comparison with validation datasets (Figure 4), indicating that the urban boundaries extracted in this study were continuous, smooth, and with low fragmentation.
3.2. Spatiotemporal Distribution of Urban Settlements
Based on the impervious surface data, water body data, and the CCA method, the UE, UI, UC, UGS, and UWB of China in 1985, 1990, 1995, 2000, 2005, 2010, 2015, and 2020 were obtained in this paper (Table 2). From 1985 to 2020, the increases in the urban settlement number and area were 289% and 663%, respectively, and the areas of UI and UC both presented increasing trends. The growth rates of UE per 5 years from 1985 to 2020 were 33.52%, 34.11%, 50.68%, 46.91%, 33.86%, 27.75%, and 12.60%, respectively. The Beijing–Tianjin–Hebei (BTH), Yangtze River Delta (YRD), and Pearl River Delta (PRD), as China’s most fully developed and intensively developed urban regions, showed sustained growth in urban evolution. The urban settlement growth rates of the BTH, YRD, and PRD regions from 1985 to 2020 were 378%, 495%, and 160%, respectively (Figure 5).
Figure 6 reveals the quantitative characteristics of urban settlements of different sizes in China from 1985 to 2020. The percentage of the number of urban settlements larger than 100 km2 in 1985 was 5.51%, and the area accounted for 38.71%; the percentages of urban settlements less than 100 km2 in number and area were 94.48% and 61.30%, respectively. By 2020, the number of urban settlements larger than 100 km2 accounted for 8.33%, and the area ratio was 65.08%; the number and area of urban settlements less than 100 km2 accounted for 91.67% and 34.92%, respectively. From 1985 to 2020, the trend of urban settlement development in China was characterized by the rapid development of large urban settlements, with the proportion of urban settlements larger than 100 km2 in number and area increasing by 2.82% and 26.37%, respectively.
3.3. Characteristics of Urban Settlements in Different Regions
For different regions, there are great variations in the number, size, and spatial distribution of urban settlements (Figure 7). A total of 50.11% of urban settlements in China in 1985 were distributed in NEC and EC, with a relatively small difference in number and area. Among the seven regions, the proportion of urban settlements less than 50 km2 was the highest, followed by urban settlements with sizes ranging from 50 km2 to 500 km2 distributed in all seven regions, and urban settlements larger than 500 km2 were mainly distributed in NC and EC. By 2020, the number and area of urban settlements in seven regions were increasing, with 58.52% of urban settlements distributed in EC, NC, and CC. In the seven regions, the proportion of urban settlements less than 50 km2 showed a slightly decreasing trend, while those larger than 50 km2 showed an increasing trend. NEC had the highest total area of urban settlements in 1985, followed by EC and NC, and SWC had the smallest area. However, by 2020, EC had the largest area, followed by NC and CC, and NWC had the smallest area. The rate of urban area evolution in SC was 1265.71%, much higher than the other six regions (Figure 8).
Based on the boundaries of urban settlements we delineated, the largest urban settlements in different regions of China from 1985 to 2020 were determined (Figure 9). There were spatial and temporal differences in the largest urban settlements in different regions, which indicated significant differences in urban development under different geographic and environmental conditions. The evolution of urban entities was not limited by administrative boundaries, and neighboring urban areas were geospatially connected, creating spatial co-urbanization. For example, before 2005, the largest urban settlement in the NC region was located only in Beijing. Since 2005, patches of Beijing, Langfang, and Tianjin have been geospatially linked to form the largest urban settlement. The largest urban settlements in China were located in the NC region in 1985. By 2020, the largest urban settlements in China were located in the SC region.
3.4. The Rank–Size Pattern of Urban Settlements
Zipf’s law was used to compare and evaluate the rank–size rule for Chinese urban settlements at the national scale, and the fitting results for UE, UI, and UC are presented in Figure 10. The overall trend of the distribution of urban settlement sizes in China was analyzed based on the changes in the q-value of the Zipf index. The Zipf index for UE and UI was close to 1, indicating that the development was relatively consistent with Zipf’s law. The Zipf indices for UC were not close to 1, indicating that the development did not conform to Zipf’s law. The Zipf index of Chinese urban settlements was the largest in 1985, indicating that the development of small and medium-sized urban settlements was common and the distribution of urban size was decentralized. The Zipf index of Chinese urban settlements in 2020 was the smallest, which indicated that the distribution of city size was concentrated and the development of large urban settlements was more prominent. There was a decreasing trend in the q-value of the Zipf index from 1985 to 2020, which indicated that the size of the development of urban settlements in China was changing from decentralization to concentration.
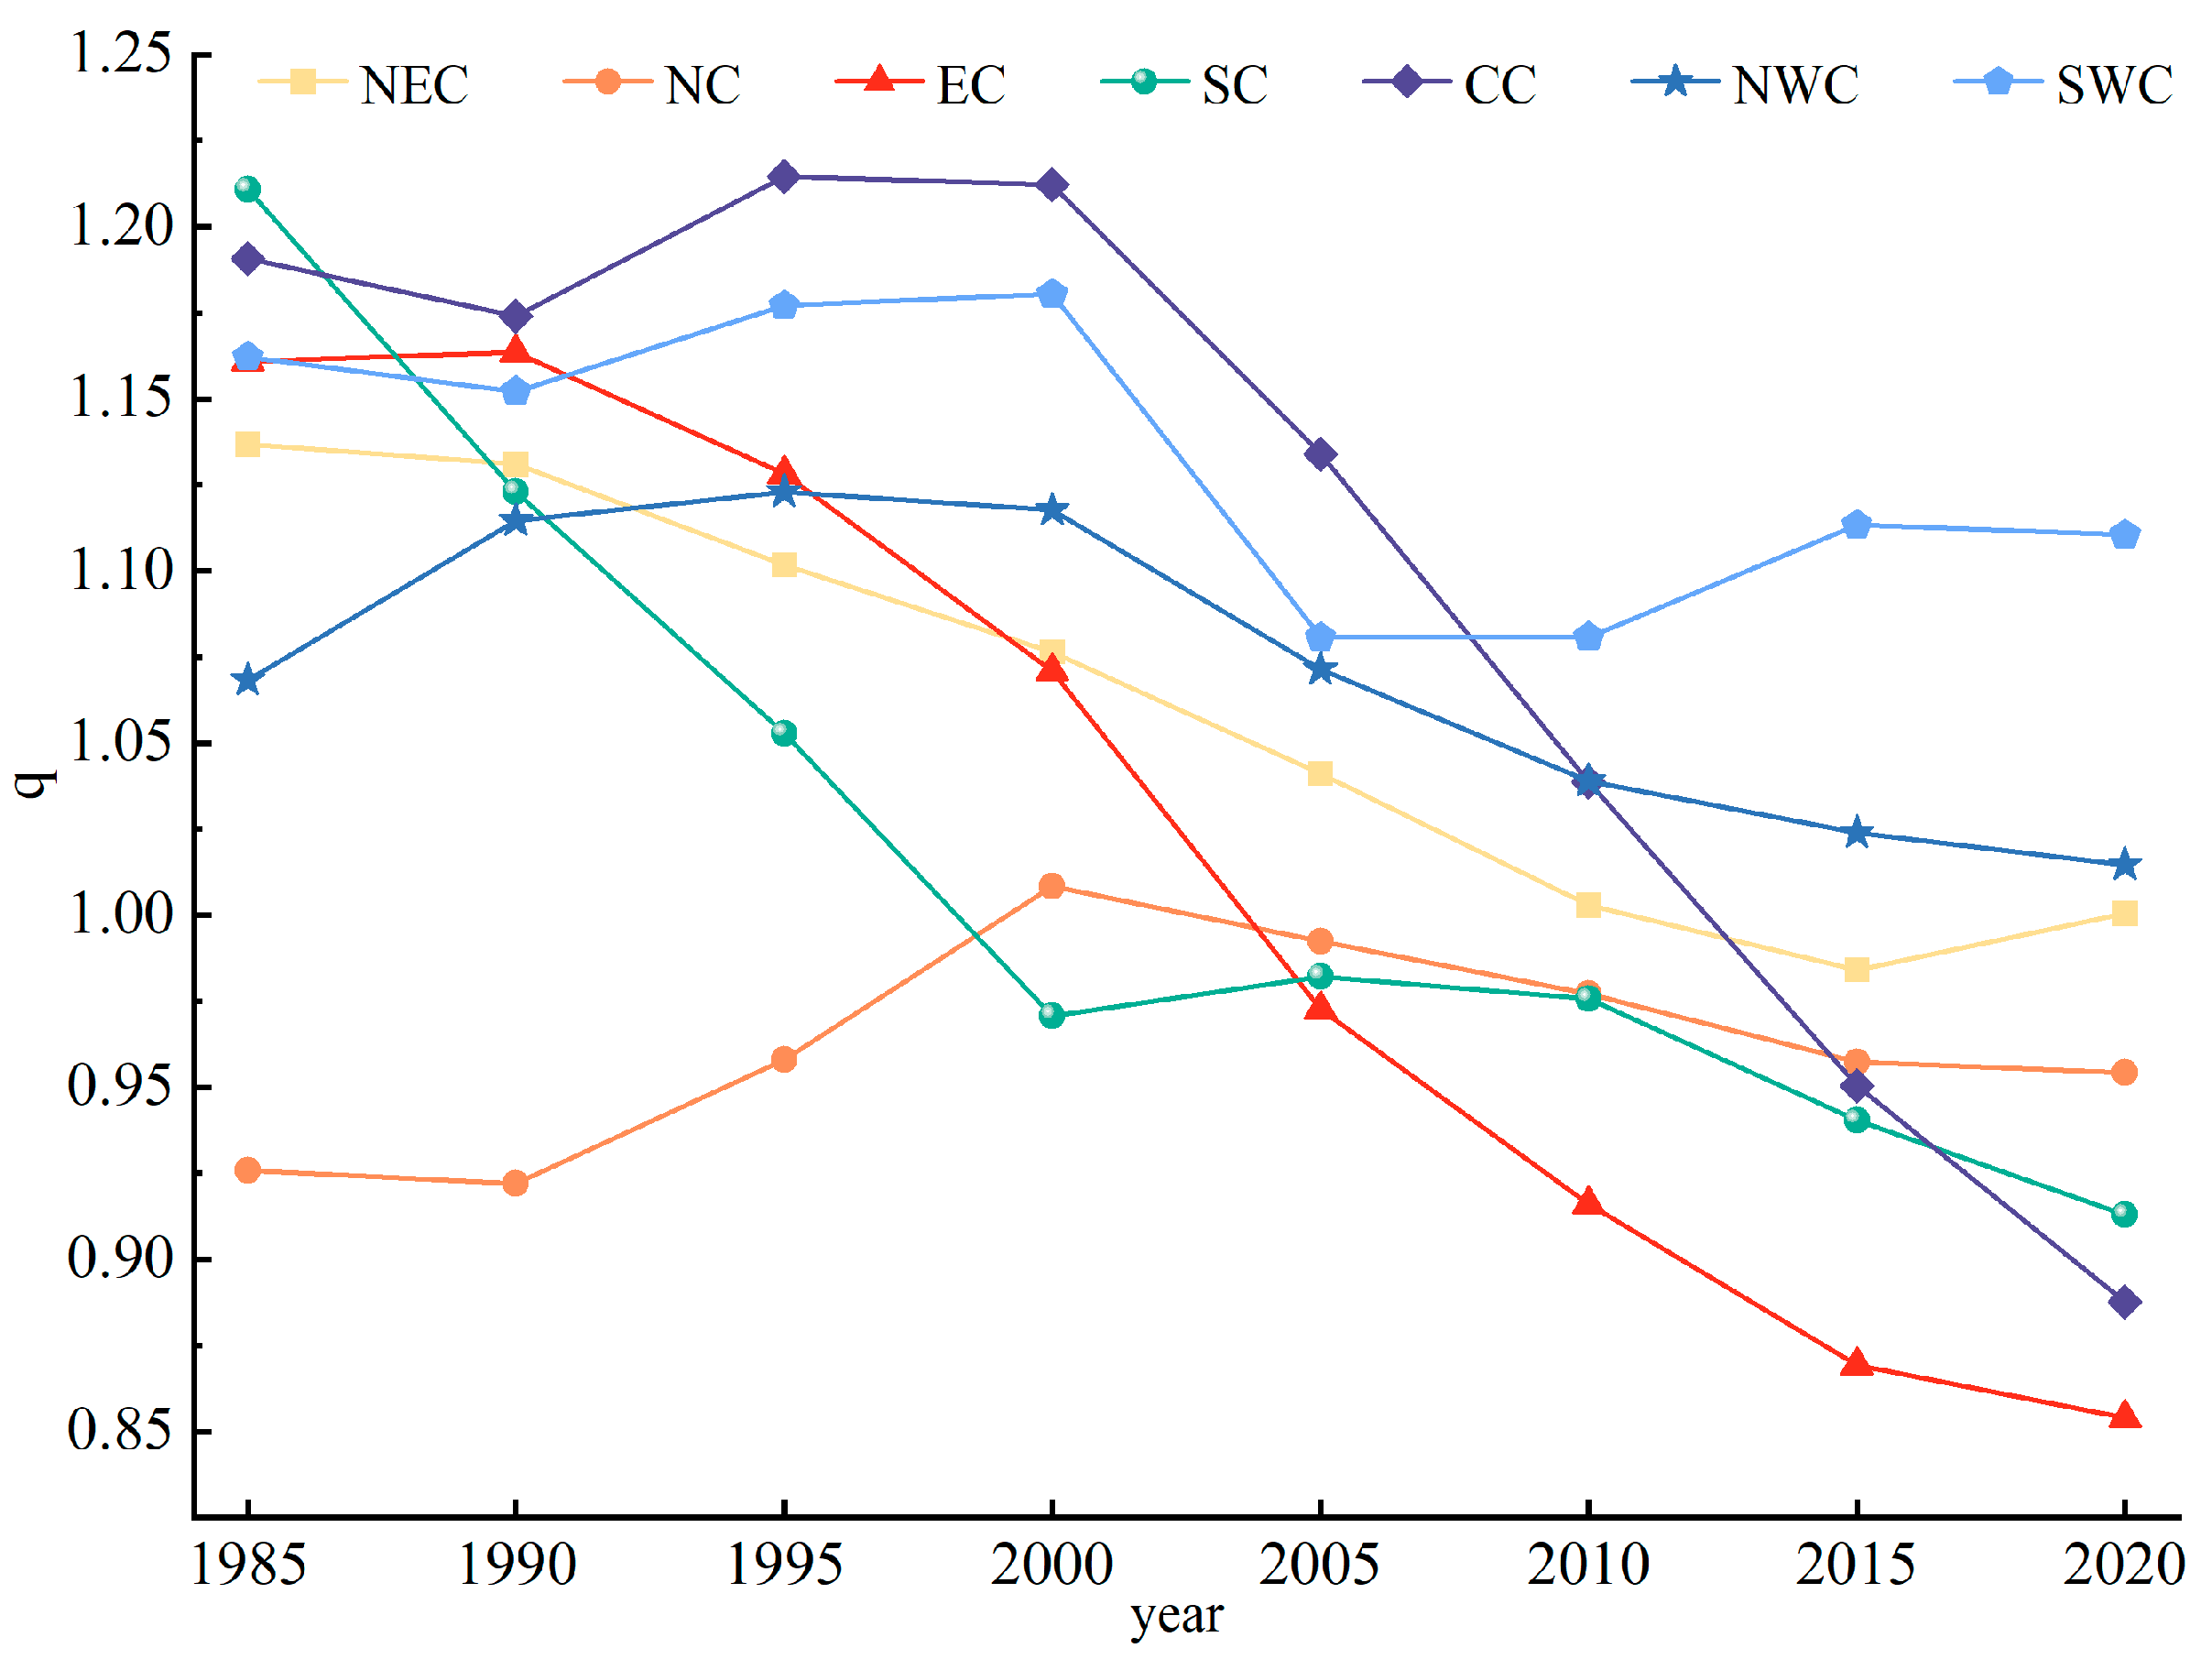
The distributions of urban settlement sizes in the seven regions of China were consistent with Zipf’s law (Figure 11). In 1985, the Zipf index in NC was less than 1, and the distribution of urban settlement sizes was concentrated, focusing mainly on the development of large urban settlements. Meanwhile, the Zipf indices of the NEC, EC, SC, CC, NWC, and SWC were all larger than 1, indicating that the distributions of urban settlement sizes in these regions were relatively decentralized, with a focus on the development of small and medium-sized urban settlements. By 2020, the Zipf Indices of NC, EC, SC, and CC regions were less than 1, indicating that the development of large urban settlements was prominent and the size distribution was relatively concentrated. The Zipf indices of the NEC, NWC, and SWC regions in 2020 were all larger than 1, indicating that small and medium-sized urban settlements were common, with a relatively decentralized distribution of urban size. In conclusion, the size distribution of China’s urban settlement development from 1985 to 2020 tended to be concentrated from decentralized, and the development of large urban settlements was relatively prominent.
4. Discussion
4.1. Urban Spatiotemporal Evolution and Its Influencing Factors
Our results indicated that the urban evolution in China from 1985 to 2020 was very rapid, which is consistent with previous studies [52,53], and the characteristics of urban evolution in different periods were closely related to the tasks of the five-year plans for China’s national economic and social development [54]. Urban evolution is the result of a combination of different socioeconomic factors. Population growth is one of the most important factors of urban evolution; much research has revealed that the increase in the intensity of human activity inevitably leads to large-scale urban expansion [55,56,57]. Policy guidance is another important factor affecting urban evolution. Government policies drive industrial development, industrialization promotes urbanization, and the government attracts large amounts of resource investment through policies, thereby improving the level of urbanization [58]. Rapid economic development has brought about the expansion of industry and services, created a large number of employment opportunities, attracted the non-farming population to concentrate in cities, promoted the rapid expansion of urban land use, and accelerated urban evolution [54]. Our study revealed an upward trend in the number and area expansion of urban settlements in China from 1985 to 2020 and a downward trend in the rate of urban expansion that began after peaking in 2000. The implementation of the reform and opening-up policy in 1978 led to rapid urban development in China. However, the high speed of urbanization triggered a series of social and environmental problems, and the strict implementation of various policies led to a decline in the rate of urbanization, which is consistent with the trend found in our research [59].
The marked differences in natural conditions and the imbalance in the level of socioeconomic development have led to different characteristics of urban evolution in different regions. The results of our study revealed that China’s urban settlements were mainly distributed in NEC and EC in 1985, with a proportion of 50.11%, mainly because of the solid industrial foundation and superior transportation conditions that are conducive to urban development [60,61]. In 2020, 58.52% of the urban settlements were located in EC, NC, and CC, with EC far outpacing the other regions, which were highly correlated with the strategic policies of prioritizing the development of coastal regions, integrating Beijing–Tianjin–Hebei and the rise of Central China [54,60]. The above results were similar to the findings of the research on the influencing factors of China’s development and the temporal and spatial differences in China’s urban expansion [53,62]. Our results also revealed that the rate of urban settlement area evolution was significantly higher in SC than in the other six regions, mainly related to the establishment of the Shenzhen Special Economic Zone and the reform and opening up of SC [54].
4.2. Urban Rank–Size Patterns and Its Influencing Factors
Different scholars have different views on the distribution of urban sizes in China. Our results indicated that Chinese urban size, in general, conforms to the rank–size law and exhibited the characteristic of decentralization to centralization from 1985 to 2020, which is consistent with the findings of other scholars. For example, Song et al. (2011) found that the rank–size of Chinese cities generally conformed to Zipf’s law but was not strictly linearly distributed [63]. Hong et al. (2022), based on census data, revealed that the distribution of urban sizes in China conforms to the rank–size law and presents a concentrated distribution [64]. Sun et al. (2022) pointed out that the size distribution of Chinese cities evolved from decentralized to concentrated from 2000 to 2014 [65]. Economic development [66], population [67], and transportation conditions [68] were all important influencing factors in the transition from decentralized to concentrated urban size characteristics. Because of the different definitions of urban area by scholars, some research results are inconsistent with ours, suggesting that the distribution of urban sizes in China does not conform to Zipf’s law but is in line with the double Pareto lognormal distribution [68].
Our study revealed that the distribution of urban size varies significantly and evolves dynamically across different geographic regions. From 1985 to 2020, the Zipf Index in the NEC, NWC, and SWC were all greater than 1, and the distribution of urban settlement was decentralized, mainly concentrated in the development of small and medium-sized cities. This is due to influencing factors, such as the special geographical location, the single industrial structure, and the serious brain drain, which have led to unbalanced economic development, slow urban development, and a lack of prominence in the development of large cities [69]. In contrast, the Zipf index of EC, SC, and CC changed from greater than 1 to less than 1, indicating that the distribution of urban size changed from decentralized to concentrated. Meanwhile, the development of small and medium-sized cities generally shifted to the predominance of the development of large cities. This is related to China’s policy of reform and opening up, the deepening process of globalization, and the priority transformation of the production mode, all of which have contributed to the rapid development of these regions and led to the trend of urban size concentration [70,71]. The Zipf indexes of NC in different years were all less than 1, with a concentrated distribution of urban sizes and prominent development of large cities. This is because Beijing and Tianjin in NC, as municipalities directly under the central government of China, have developed economies, abundant resources, and infrastructure and have attracted a large amount of investment [72].
4.3. Advantages and Limitations
This paper overcomes the traditional administrative boundaries based on urban entities to divide urban boundaries, enhances the quantitative understanding of the boundary characteristics of urban settlements, and grasps the spatiotemporal evolution of urban settlements through long time series analysis, which provides scientific references for future urban spatial planning. The remote sensing data with 30 m spatial resolution in this paper is sufficiently representative at a large scale, which can help to better understand the characteristics and structural differences of urban evolution.
Certain limitations were observed in this paper. In this study, only the local density of impervious surfaces was used to delineate urban settlement boundaries, so the data and methods used in this paper were very limited. In the future, multiple sources of big data, such as nighttime lighting and POI data, should be considered when designing a comprehensive metric to identify city boundaries. Meanwhile, population distribution data were not considered because of the variability of population movement and the uncertainty of spatial distribution. In addition, this paper has only explored the two-dimensional expansion characteristics of urban settlement growth, and three-dimensional perspectives, such as the changes in urban building heights, can be considered in future research to analyze urban evolution.
5. Conclusions
In this paper, based on 30 m resolution remote sensing data of impervious surfaces and water bodies, the local density, size, and spatial relationship of impervious surfaces, as well as CCA, were used to uniformly identify a set of Chinese urban settlement boundaries for the period of 1985–2020, and the spatiotemporal evolutionary characteristics were analyzed. Zipf’s law was used to explore urban rank–size patterns. This study forms a unified, clear, and closed urban boundary in the time series, which is conducive to the spatial and temporal evolution of urban evolution, as well as the comparison of the distribution of urban size in different regions, and provides scientific guidance for urban spatial planning. The conclusions are as follows:
(1) From 1985 to 2020, the increases in the urban settlement number and area were 289% and 663%, respectively. In 1985, 50.11% of the urban settlements were located mainly in NEC and EC. By 2020, 58.52% of the urban settlements were located in EC, NC, and CC. The rate of urban evolution in SC was 1265.71%, much higher than the other six regions. The average area percentage of UGSs in China from 1985 to 2020 was 41.68%, among which the average area percentage of UGSs in EC was 29.68%, which was much higher than that in other regions.
(2) From 1985 to 2020, the evolution of China’s urban size conformed to Zipf’s law, with the overall characteristics shifting from decentralized to concentrated and small and medium-sized urban settlements developing into large urban settlements. The evolution of urban size in NC showed a concentrated trend, and the development of large urban settlements was prominent. The evolution of urban size in EC, CC, and SC shifted from decentralized to concentrated, with the development of small and medium-sized urban settlements transforming into the dominant development of large urban settlements. The evolution of urban size in the NEC, NWC, and SWC regions indicated a decentralized trend, and the development of small and medium-sized urban settlements was common.
(3) This study delineated urban settlement boundaries based on urban entities, which has great potential for quantifying the evolutionary characteristics and microstructure of urban settlements. More importantly, the urban definition method and urban evolution pattern characteristics proposed in this study can be used to explore the impacts of urbanization on food security, biodiversity, climate change, and urban health and can help to grasp the distribution and characteristics of urban settlements in China.
Author Contributions
Conceptualization, J.Z. and C.L.; methodology, J.Z. and H.W.; software, Y.H.; writing—original draft preparation, J.Z.; writing—review and editing, C.L., Z.L., B.Z. and Q.Z. All authors have read and agreed to the published version of the manuscript.
Funding
Funding for this project was provided by the National Natural Science Foundation of China (Nos. 41871192 and 41730647) and the Youth Innovation Promotion Association of CAS (2021194).
Data Availability Statement
The data presented in this study are available on request from the corresponding author. The data are not publicly available due to the results of subsequent research have not yet been published.
Conflicts of Interest
Author Hao Wang was employed by the company Piesat Information Technology Company Limited. The remaining authors declare that the research was conducted in the absence of any commercial or financial relationships that could be construed as a potential conflict of interest.
References
- UN-Habitat. World Cities Report 2020: The Value of Sustainable Urbanization; UN-Habitat: Nairobi, Kenya, 2020. [Google Scholar]
- Liu, Y.L.; Zhang, X.H.; Kong, X.S.; Wang, R.; Chen, L. Identifying the relationship between urban land expansion and human activities in the Yangtze River Economic Belt, China. Appl. Geogr. 2018, 94, 163–177. [Google Scholar] [CrossRef]
- Yang, J.X.; Yuan, M.; Yang, S.B.; Zhang, D.X.; Wang, Y.G.; Song, D.Y.; Dai, Y.Z.; Gao, Y.; Gong, J. Spatial Diffusion Waves of Human Activities: Evidence from Harmonized Nighttime Light Data during 1992–2018 in 234 Cities of China. Remote Sens. 2023, 15, 1426. [Google Scholar] [CrossRef]
- Chu, N.C.; Zhang, P.Y.; Wu, X.L. Spatiotemporal evolution characteristics of urbanization and its coupling coordination degree in Russia—Perspectives from the population, economy, society, and eco-environment. Environ. Sci. Pollut. Res. 2022, 29, 61334–61351. [Google Scholar] [CrossRef] [PubMed]
- Qian, W.Q.; Zhao, Y.; Li, X.Y. Construction of ecological security pattern in coastal urban areas: A case study in Qingdao, China. Ecol. Indic. 2023, 154, 110754. [Google Scholar] [CrossRef]
- Fischer, J.D.; Schneider, S.C.; Ahlers, A.A.; Miller, J.R. Categorizing wildlife responses to urbanization and conservation implications of terminology. Conserv. Biol. 2015, 29, 1246–1248. [Google Scholar] [CrossRef] [PubMed]
- Rega-Brodsky, C.C.; Aronson, M.F.J.; Piana, M.R.; Carpenter, E.S.; Hahs, A.K.; Herrera-Montes, A.; Knapp, S.; Kotze, D.J.; Lepczyk, C.A.; Moretti, M.; et al. Urban biodiversity: State of the science and future directions. Urban Ecosyst. 2022, 25, 1083–1096. [Google Scholar] [CrossRef]
- Wu, W.; Zheng, T.H. Establishing a “dynamic two-step floating catchment area method” to assess the accessibility of urban green space in Shenyang based on dynamic population data and multiple modes of transportation. Urban For. Urban Green. 2023, 82, 127893. [Google Scholar] [CrossRef]
- Lv, Z.K.; Xu, T. Urbanization and the informal economy: New evidence from partially linear functional-coefficient models. Cities 2021, 119, 103383. [Google Scholar] [CrossRef]
- Wang, Y.; Miao, Z.Y.; Lu, Y.Q.; Zhu, Y.M. The impact of economic development on urban livability: Evidence from 40 large and medium-sized cities of China. J. Geogr. Sci. 2023, 33, 1767–1790. [Google Scholar] [CrossRef]
- Niu, H.F.; Silva, E.A. Understanding temporal and spatial patterns of urban activities across demographic groups through geotagged social media data. Comput. Environ. Urban Syst. 2023, 100, 101934. [Google Scholar] [CrossRef]
- Batty, M.; Ferguson, P. Defining city size. Environ. Plan. B Plan. Des. 2011, 38, 753–756. [Google Scholar] [CrossRef]
- Zhou, Y. The Primary Scientific Issue of Urban Research in China Is the Correctness of Basic Urban Concepts. Urban Plan. Forum 2006, 1, 1–5. [Google Scholar]
- Chen, Y.G.; Wang, J.J.; Long, Y.Q.; Zhang, X.H.; Li, X.S. Defining urban boundaries by characteristic scales. Comput. Environ. Urban Syst. 2022, 94, 101799. [Google Scholar] [CrossRef]
- Zhen, F.; Cao, Y.; Qin, X.; Wang, B. Delineation of an urban agglomeration boundary based on Sina Weibo microblog ‘check-in’ data: A case study of the Yangtze River Delta. Cities 2017, 60, 180–191. [Google Scholar] [CrossRef]
- Gao, B.; Huang, Q.X.; He, C.Y.; Dou, Y.Y. Similarities and differences of city-size distributions in three main urban agglomerations of China from 1992 to 2015: A comparative study based on nighttime light data. J. Geogr. Sci. 2017, 27, 533–545. [Google Scholar] [CrossRef]
- Burke, M.; Driscoll, A.; Lobell, D.B.; Ermon, S. Using satellite imagery to understand and promote sustainable development. Science 2021, 371, eabe8628. [Google Scholar] [CrossRef]
- Liu, X.P.; Huang, Y.H.; Xu, X.C.; Li, X.C.; Li, X.; Ciais, P.; Lin, P.R.; Gong, K.; Ziegler, A.D.; Chen, A.N.; et al. High-spatiotemporal-resolution mapping of global urban change from 1985 to 2015. Nat. Sustain. 2020, 3, 564–570. [Google Scholar] [CrossRef]
- Li, X.J.; Zheng, K.; Qin, F.; Wang, H.Y.; Zhao, C.H. Deriving Urban Boundaries of Henan Province, China, Based on Sentinel-2 and Deep Learning Methods. Remote Sens. 2022, 14, 3752. [Google Scholar] [CrossRef]
- Liu, S.R.; Shi, K.F.; Wu, Y.Z. Identifying and evaluating suburbs in China from 2012 to 2020 based on SNPP-VIIRS nighttime light remotely sensed data. IJAEO 2022, 114, 103401. [Google Scholar] [CrossRef]
- Li, X.; Gong, P.; Zhou, Y.; Wang, J.; Bai, Y.; Chen, B.; Hu, T.; Xiao, Y.; Xu, B.; Yang, J. Mapping global urban boundaries from the global artificial impervious area (GAIA) data. Environ. Res. Lett. 2020, 15, 094044. [Google Scholar] [CrossRef]
- Wang, Z.; Wang, H.Y.; Qin, F.; Han, Z.G.; Miao, C.H. Mapping an Urban Boundary Based on Multi-Temporal Sentinel-2 and POI Data: A Case Study of Zhengzhou City. Remote Sens. 2020, 12, 4103. [Google Scholar] [CrossRef]
- Li, X.C.; Zhou, Y.Y. Urban mapping using DMSP/OLS stable night-time light: A review. IJRS 2017, 38, 6030–6046. [Google Scholar] [CrossRef]
- Thomas, I.; Jones, J.; Caruso, G.; Gerber, P. City delineation in European applications of LUTI models: Review and tests. Transp. Rev. 2018, 38, 6–32. [Google Scholar] [CrossRef]
- Taubenbck, H.; Weigand, M.; Esch, T.; Staab, J.; Dech, S. A new ranking of the world’s largest cities—Do administrative units obscure morphological realities? Remote Sens. Environ. 2019, 232, 111353. [Google Scholar] [CrossRef]
- Wan, G.H.; Zhu, D.Q.; Wang, C.; Zhang, X. The size distribution of cities in China: Evolution of urban system and deviations from Zipf’s law. Ecol. Indic. 2020, 111, 106003. [Google Scholar] [CrossRef]
- Giesen, K.; Suedekum, J. Zipf’s law for cities in the regions and the country. J. Econ. Geogr. 2010, 11, 667–686. [Google Scholar] [CrossRef]
- Ziqin, W. Zipf law analysis of urban scale in China. Asian J. Soc. Sci. Stud. 2016, 1, 53. [Google Scholar] [CrossRef]
- Deng, Y.; Qi, W.; Fu, B.J.; Wang, K. Geographical transformations of urban sprawl: Exploring the spatial heterogeneity across cities in China 1992–2015. Cities 2020, 105, 102415. [Google Scholar] [CrossRef]
- Huang, Q.X.; He, C.Y.; Gao, B.; Yang, Y.; Liu, Z.F.; Zhao, Y.Y.; Dou, Y. Detecting the 20 year city-size dynamics in China with a rank clock approach and DMSP/OLS nighttime data. Landsc. Urban Plan. 2015, 137, 138–148. [Google Scholar] [CrossRef]
- Eaton, J.; Eckstein, Z. Cities and growth: Theory and evidence from France and Japan. Boston Univ. Inst. Econ. Dev. 2000, 27, 443–474. [Google Scholar]
- Anderson, G.; Ge, Y. The size distribution of Chinese cities. Reg. Sci. Urban Econ. 2005, 35, 756–776. [Google Scholar] [CrossRef]
- Gong, P.; Li, X.C.; Wang, J.; Bai, Y.Q.; Cheng, B.; Hu, T.Y.; Liu, X.P.; Xu, B.; Yang, J.; Zhang, W.; et al. Annual maps of global artificial impervious area (GAIA) between 1985 and 2018. Remote Sens. Environ. 2020, 236, 111510. [Google Scholar] [CrossRef]
- Liu, Z.; He, C.; Zhou, Y.; Wu, J. How much of the world’s land has been urbanized, really? A hierarchical framework for avoiding confusion. Landsc. Ecol. 2014, 29, 763–771. [Google Scholar]
- Liu, S.; Su, H.; Cao, G.; Wang, S.; Guan, Q. Learning from data: A post classification method for annual land cover analysis in urban areas. ISPRS J. Photogramm. Remote Sens. 2019, 154, 202–215. [Google Scholar] [CrossRef]
- Chai, B.; Li, P. Annual Urban Expansion Extraction and Spatio-Temporal Analysis Using Landsat Time Series Data: A Case Study of Tianjin, China. IEEE J. Sel. Top. Appl. Earth Obs. Remote Sens. 2018, 11, 2644–2656. [Google Scholar] [CrossRef]
- Li, W.C.; Li, H.; Wang, S.J.; Feng, Z.Q. Spatiotemporal Evolution of County-Level Land Use Structure in the Context of Urban Shrinkage: Evidence from Northeast China. Land 2022, 11, 1709. [Google Scholar] [CrossRef]
- Ren, W.X.; Xue, B.; Yang, J.; Lu, C.P. Effects of the Northeast China Revitalization Strategy on Regional Economic Growth and Social Development. Chin. Geogr. Sci. 2020, 30, 791–809. [Google Scholar] [CrossRef]
- Fu, L.; Liu, A. China Statistical Yearbook; Chinese Statitical Bureau: Beijing, China, 2021. [Google Scholar]
- Zhang, X.; Liu, L.; Zhao, T.; Gao, Y.; Chen, X.; Mi, J. GISD30: Global 30 m impervious-surface dynamic dataset from 1985 to 2020 using time-series Landsat imagery on the Google Earth Engine platform. Earth Syst. Sci. Data 2022, 14, 1831–1856. [Google Scholar] [CrossRef]
- Pekel, J.F.; Cottam, A.; Gorelick, N.; Belward, A.S. High-resolution mapping of global surface water and its long-term changes. Nature 2016, 540, 418. [Google Scholar] [CrossRef]
- Huang, X.; Huang, J.; Wen, D.; Li, J. An updated MODIS global urban extent product (MGUP) from 2001 to 2018 based on an automated mapping approach. IJAEO 2021, 95, 102255. [Google Scholar] [CrossRef]
- Jiang, H.; Sun, Z.; Guo, H.; Xing, Q.; Cai, G. A standardized dataset of built-up areas of China’s cities with populations over 300,000 for the period 1990–2015. Big Earth Data 2021, 6, 1–24. [Google Scholar] [CrossRef]
- Angel, S.; Blei, A.M.; Parent, J.; Lamson-Hall, P.; Galarza-Sanchez, N.; Civco, D.L.; Thom, K. Atlas of Urban Expansion—2016 Edition; The NYU Urbanization Project: New York, NY, USA, 2016. [Google Scholar]
- He, C.Y.; Liu, Z.F.; Gou, S.Y.; Zhang, Q.F.; Zhang, J.S.; Xu, L.L. Detecting global urban expansion over the last three decades using a fully convolutional network. Environ. Res. Lett. 2019, 14, 034008. [Google Scholar] [CrossRef]
- Schneider, A.; Friedl, M.A.; Potere, D. Mapping global urban areas using MODIS 500-m data: New methods and datasets based on ‘urban ecoregions’. Remote Sens. Environ. 2010, 114, 1733–1746. [Google Scholar] [CrossRef]
- Rozenfeld, H.; Rybski, D.; Gabaix, X.; Makse, H.A. The Area and Population of Cities: New Insights from a Different Perspective on Cities. Am. Econ. Rev. 2011, 101, 2205–2225. [Google Scholar] [CrossRef]
- Florczyk, A.J.; Melchiorri, M.; Corbane, C.; Schiavina, M.; Zanchetta, L. Description of the GHS Urban Centre Database 2015. Public Release 2019, 1, 1–75. [Google Scholar]
- General Office of the State Council. Notice of The State Council on Adjusting the Standards for Dividing the Size of Cities. 2014. Available online: https://www.gov.cn/zhengce/content/2014-11/20/content_9225.htm (accessed on 25 March 2023).
- Zipf, G.K. Human Behavior and the Principle of Least Effort; Addison-Wesley: Cambridge, MA, USA, 1949; p. 573. [Google Scholar]
- Auerbach, F. Das gesetz der bevölkerungskonzentration. Petermanns Geogr. Mitteilungen 1913, 59, 74–76. [Google Scholar]
- Shi, P.; Bai, X.; Kong, F.; Fang, J.; Gong, D.; Zhou, T.; Guo, Y.; Liu, Y.; Dong, W.; Wei, Z. Urbanization and air quality as major drivers of altered spatiotemporal patterns of heavy rainfall in China. Landsc. Ecol. 2017, 32, 2317–2327. [Google Scholar] [CrossRef]
- Fang, L.; Zengxiang, Z.; Lifeng, S.; Xiaoli, Z.; Jinyong, X.U.; Ling, Y.I.; Bin, L. Urban expansion in China and its spatial-temporal differences over the past four decades. J. Geogr. Sci. 2016, 26, 1477–1496. [Google Scholar]
- Fang, L.; Zengxiang, Z.; Xiaoli, Z.; Bin, L.; Xiao, W.; Ling, Y.I.; Lijun, Z.; Jinyong, X.U.; Shunguang, H.U.; Feifei, S. Urban Expansion of China from the 1970s to 2020 Based on Remote Sensing Technology. Chin. Geogr. Sci. 2021, 31, 765–781. [Google Scholar]
- Angel, S.; Parent, J.; Civco, D.L.; Blei, A.; Potere, D. The dimensions of global urban expansion: Estimates and projections for all countries, 2000–2050. Prog. Plan. 2011, 75, 53–107. [Google Scholar] [CrossRef]
- Maimaitijiang, M.; Ghulam, A.; Sandoval, J.S.O.; Maimaitiyiming, M. Drivers of land cover and land use changes in St. Louis metropolitan area over the past 40 years characterized by remote sensing and census population data. IJAEO 2015, 35, 161–174. [Google Scholar] [CrossRef]
- Zhang, Q.; Su, S. Determinants of urban expansion and their relative importance: A comparative analysis of 30 major metropolitans in China. Habitat Int. 2016, 58, 89–107. [Google Scholar] [CrossRef]
- Bik, I.; Jeleek, L.; Těpánek, V. Land-Use Changes and their Social Driving Forces in Czechia in the 19th and 20th Centuries. Land Use Policy 2001, 18, 65–73. [Google Scholar]
- Kuang, W.; Liu, J.; Dong, J.; Chi, W.; Zhang, C. The rapid and massive urban and industrial land expansions in China between 1990 and 2010: A CLUD-based analysis of their trajectories, patterns, and drivers. Landsc. Urban Plan. 2016, 145, 21–33. [Google Scholar] [CrossRef]
- Chen, M.; Zheng, Y. China’s Regional Disparity and Its Policy Responses. China World Econ. 2008, 4, 20–36. [Google Scholar] [CrossRef]
- Murakami, A.; Zain, A.M.; Takeuchi, K.; Tsunekawa, A.; Yokota, S. Trends in urbanization and patterns of land use in the Asian mega cities Jakarta, Bangkok, and Metro Manila. Landsc. Urban Plan. 2005, 70, 251–259. [Google Scholar] [CrossRef]
- Li, C.; Li, J.; Wu, J. What drives urban growth in China? A multi-scale comparative analysis. Appl. Geogr. 2018, 98, 43–51. [Google Scholar]
- Song, S.; Zhang, K.H. Urbanization and City-Size Distribution in China. In The Great Urbanization of China; World Scientific Publishing Company: Singapore, 2011. [Google Scholar]
- Hong, G.; Xie, S.H.; Li, H.B. Spatial and Temporal Evolution Characteristics of China’s City Size Distribution Based on New Criteria. Sustainability 2022, 14, 16952. [Google Scholar] [CrossRef]
- Sun, B.; Wang, Y.; Zhang, Z.; Li, W. The form and evolution of city size distribution and urban growth model in China: An analysis based on Zipf’s Law and Gibrat’s Law. Prog. Geogr. 2022, 41, 361–370. [Google Scholar] [CrossRef]
- Xuan, C.; Chen, X. City Size Distribution, Export-Oriented Economies, and Regional Technical Efficiency: The Case of China. Emerg. Mark. Financ. Trade 2020, 56, 1474–1489. [Google Scholar] [CrossRef]
- Egidi, G.; Salvati, L.; Vinci, S. The long way to tipperary: City size and worldwide urban population trends, 1950–2030. Sustain. Cities Soc. 2020, 60, 102148. [Google Scholar] [CrossRef]
- Arshad, S.; Hu, S.G.; Ashraf, B.N. Zipf’s law and city size distribution: A survey of the literature and future research agenda. Phys. A Stat. Mech. Its Appl. 2018, 492, 75–92. [Google Scholar] [CrossRef]
- Guo, Y.H.; Tong, L.J.; Mei, L. The effect of industrial agglomeration on green development efficiency in Northeast China since the revitalization. J. Clean. Prod. 2020, 258, 120584. [Google Scholar] [CrossRef]
- Seto, K.C.; Kaufmann, R.K. Modeling the drivers of urban land use change in the Pearl River Delta, China: Integrating remote sensing with socioeconomic data. Land Econ. 2003, 79, 106–121. [Google Scholar] [CrossRef]
- Gao, J.L.; Wei, Y.D.; Chen, W.; Chen, J.L. Economic transition and urban land expansion in Provincial China. Habitat Int. 2014, 44, 461–473. [Google Scholar] [CrossRef]
- Chang, Z.J.; Liu, S.R.; Wu, Y.Z.; Shi, K.F. The Regional Disparity of Urban Spatial Expansion Is Greater than That of Urban Socioeconomic Expansion in China: A New Perspective from Nighttime Light Remotely Sensed Data and Urban Land Datasets. Remote Sens. 2022, 14, 4348. [Google Scholar] [CrossRef]
Figure 1.
Location and geographical region distribution of the study area. NEC: Northeast China; EC: East China; NC: North China; CC: Central China; SC: South China; NWC: Northwest China; and SWC: Southwest China.
Figure 1.
Location and geographical region distribution of the study area. NEC: Northeast China; EC: East China; NC: North China; CC: Central China; SC: South China; NWC: Northwest China; and SWC: Southwest China.
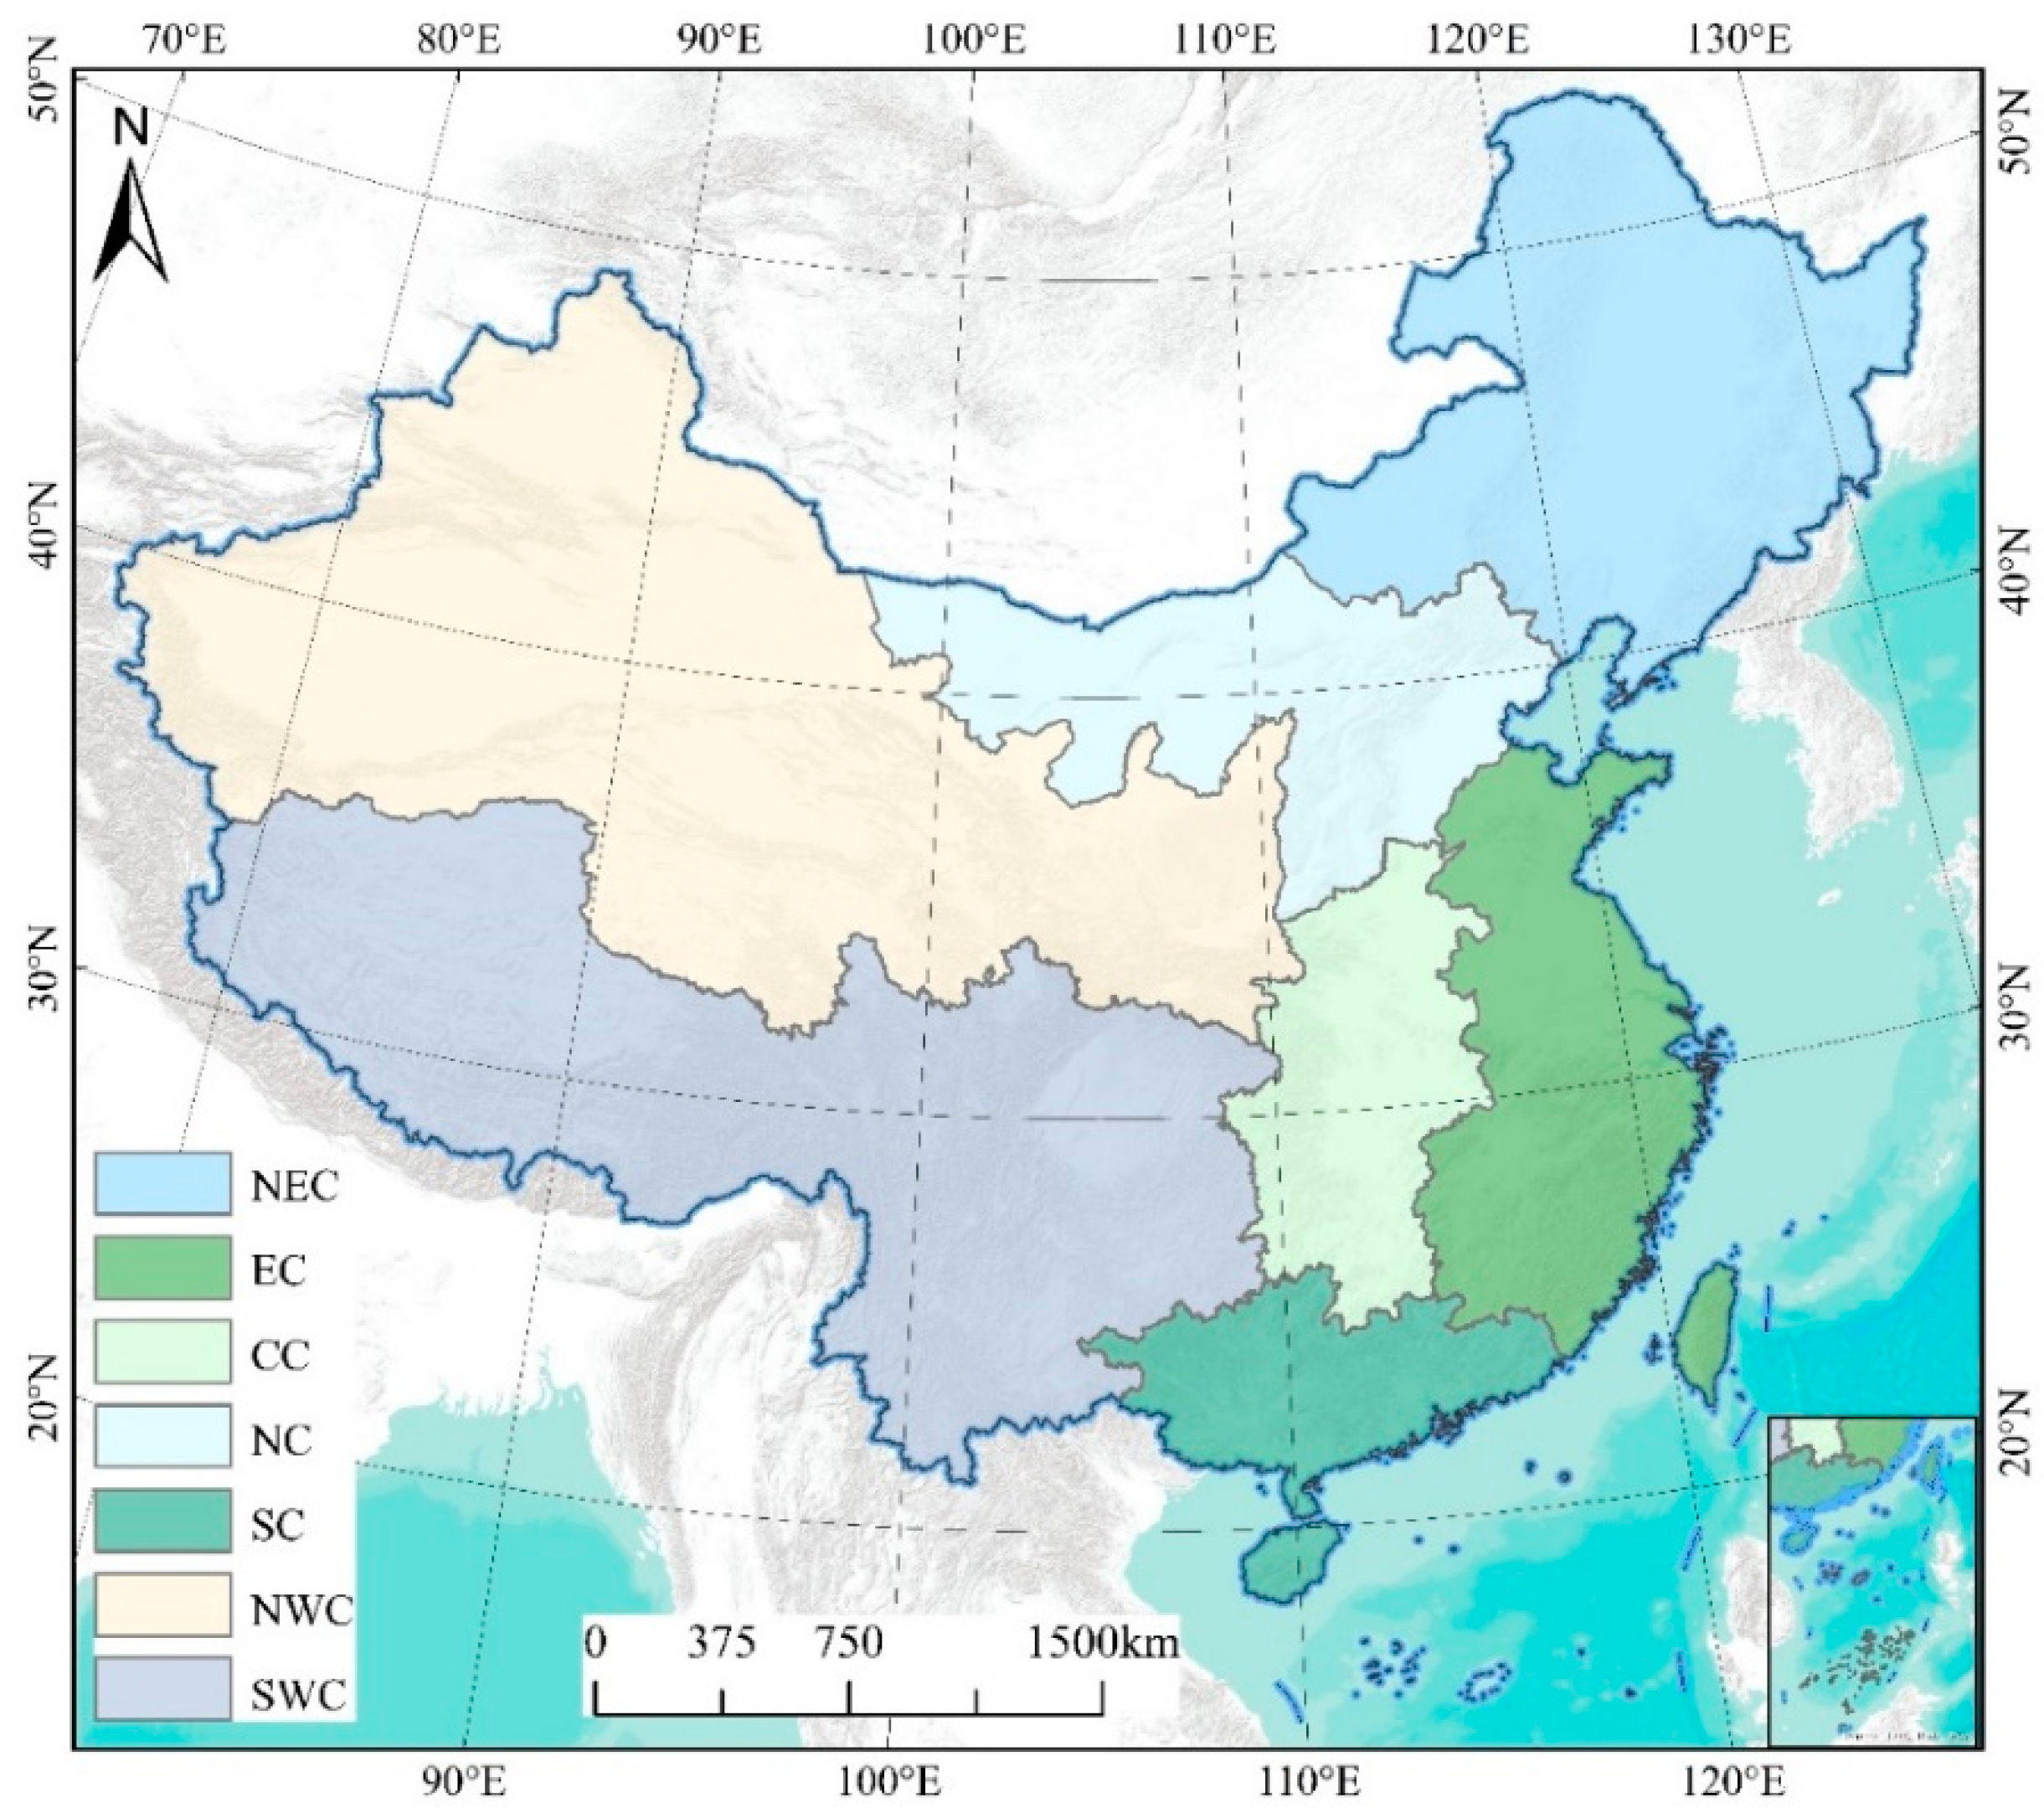
Figure 2.
The research framework of this paper.

Figure 3.
Schematic diagram of the CCA. (a) Select a small point and draw a circle of radius h. (b,c) Continue to draw circles of radius h centered on the new points in this radius so that more points become part of the urban clustering. (d) Until there are no clustered points within the radius, the clustering stops, and the area threshold in the same cluster becomes the urban extent. Gray dots indicated urban patches that have not been clustered by the CCA algorithm, and orange dots indicated urban patches that have been clustered by the CCA algorithm.

Figure 4.
Comparison of urban boundary results of representative Chinese cities in 2015. UE: urban extent; UI: urban impervious area; UC: urban dense center; UGS: urban green space; UWB: urban water body. MGUP: MODIS Global Urban Extent Products; GUB: global urban boundaries; SUBAD: standardized urban built-up areas dataset.
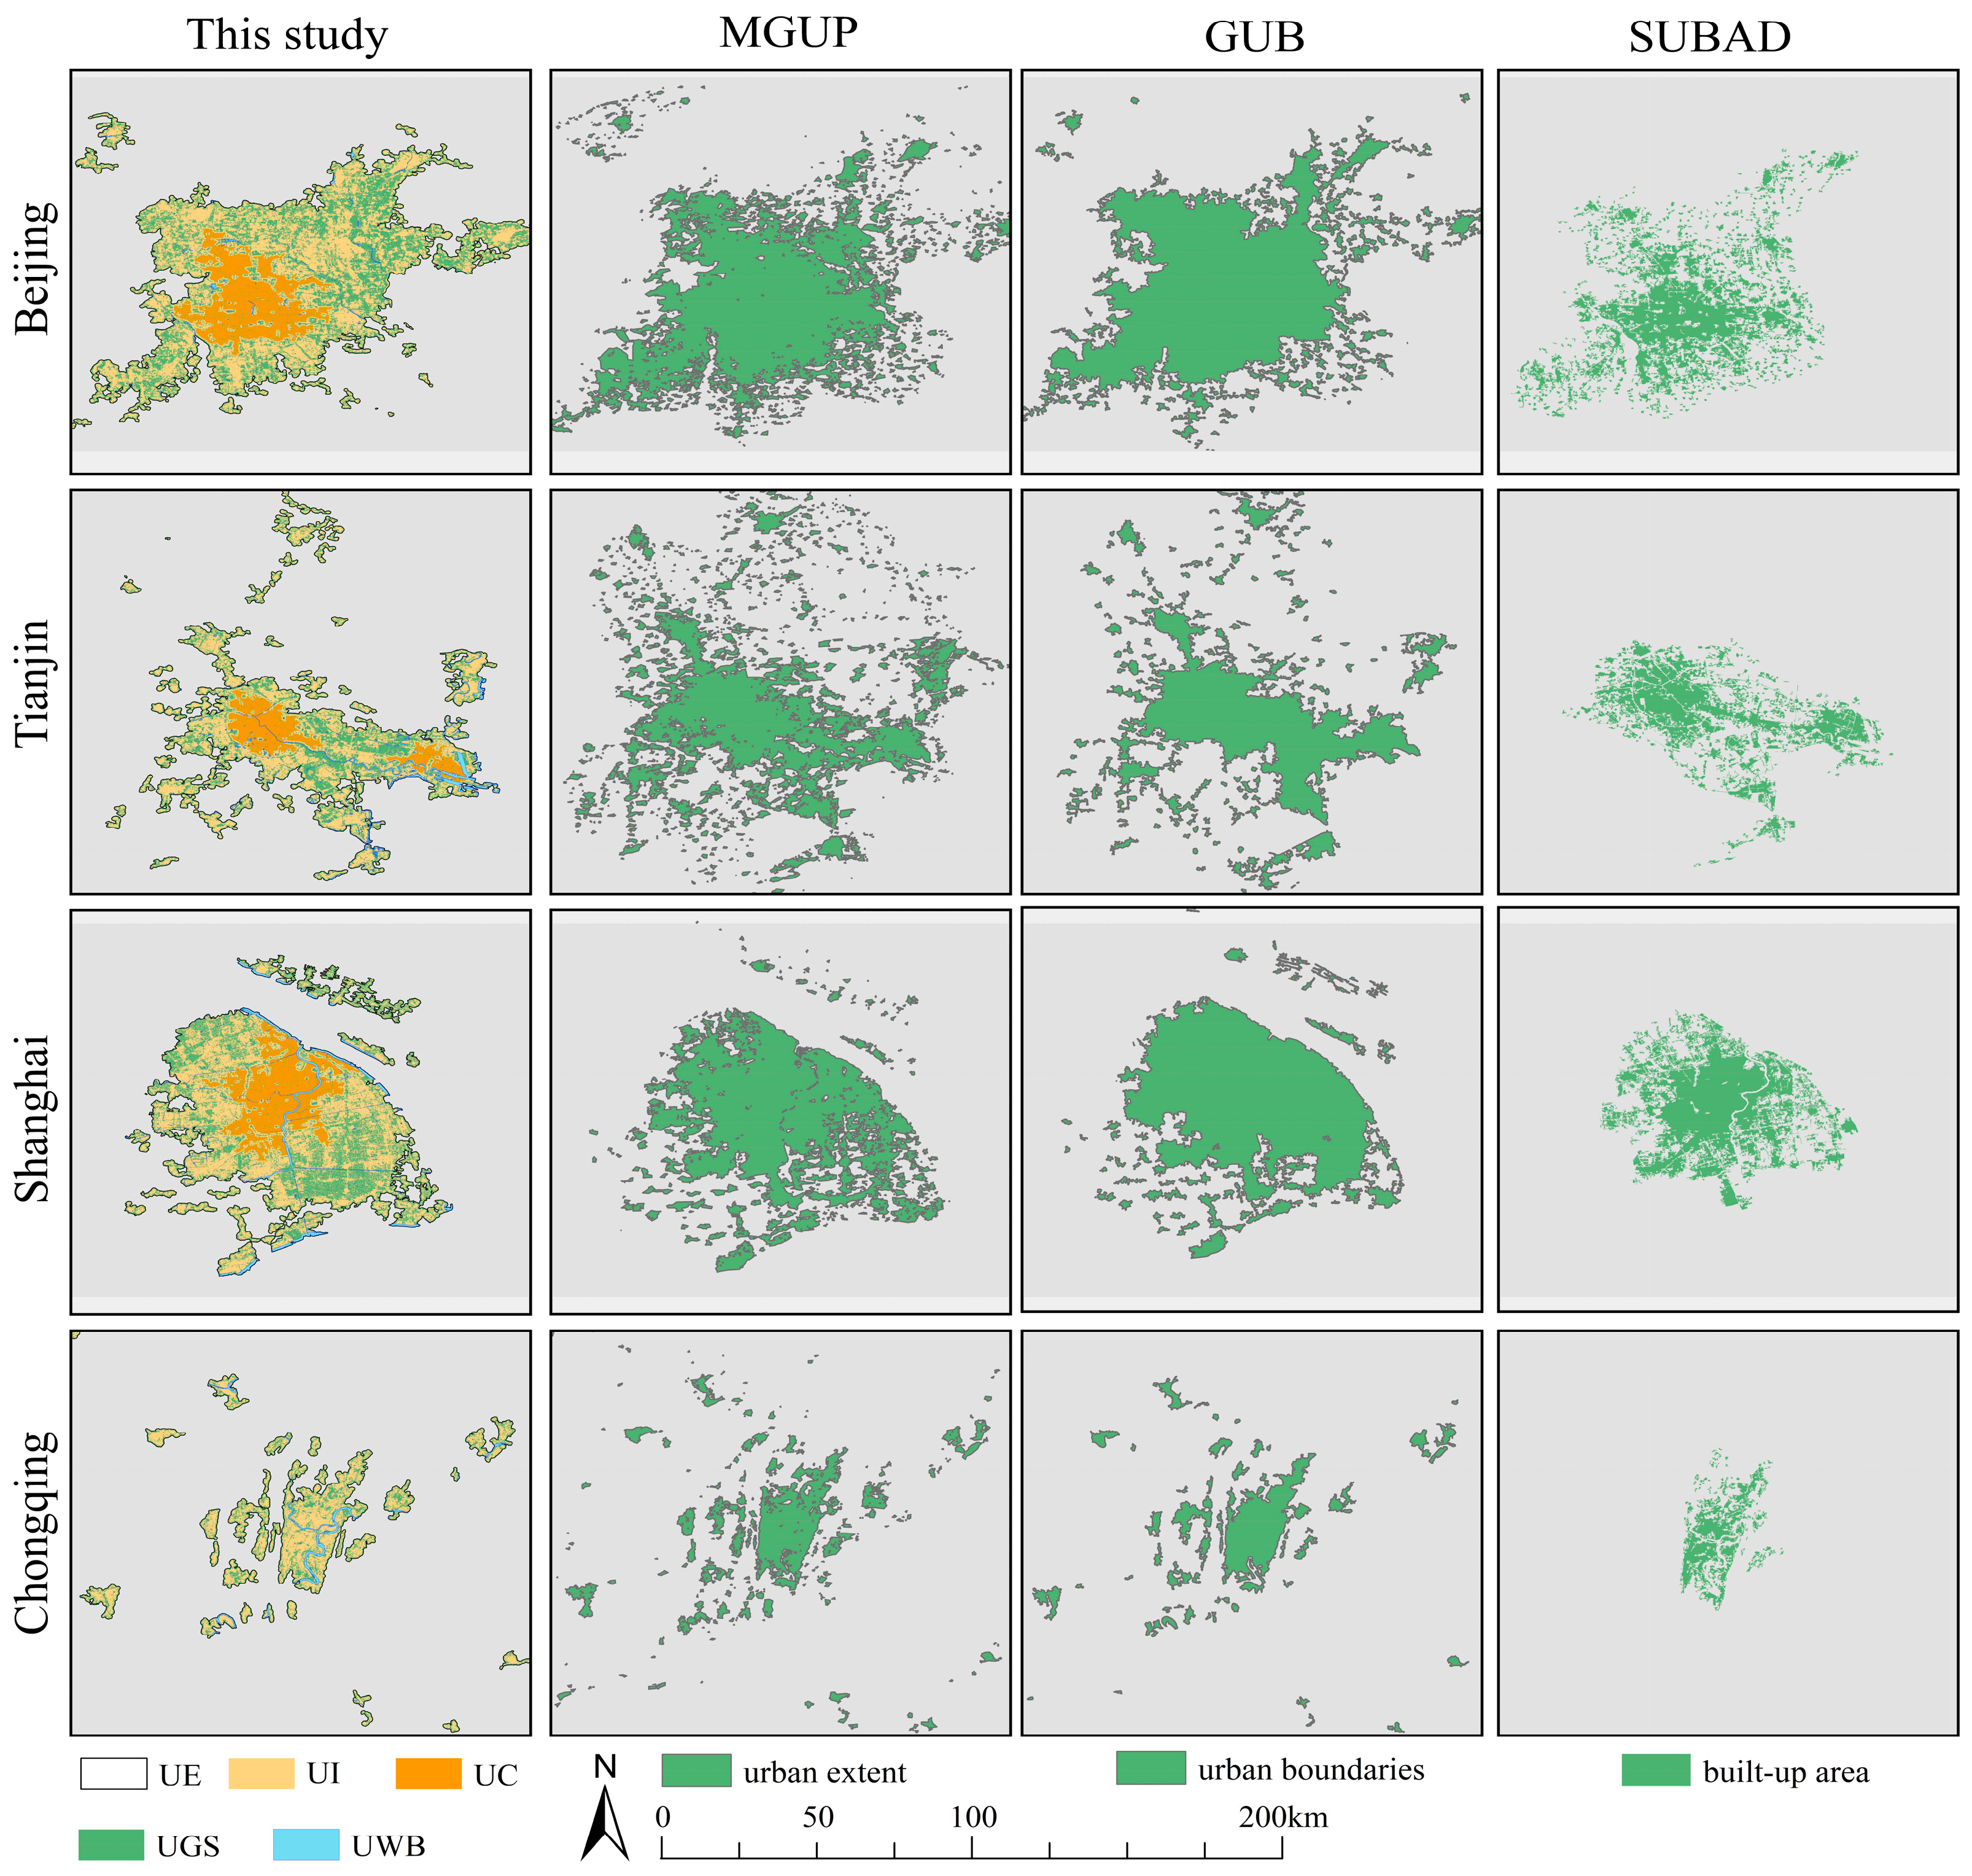
Figure 5.
Spatial distribution pattern of urban expansion in China from 1985 to 2020.
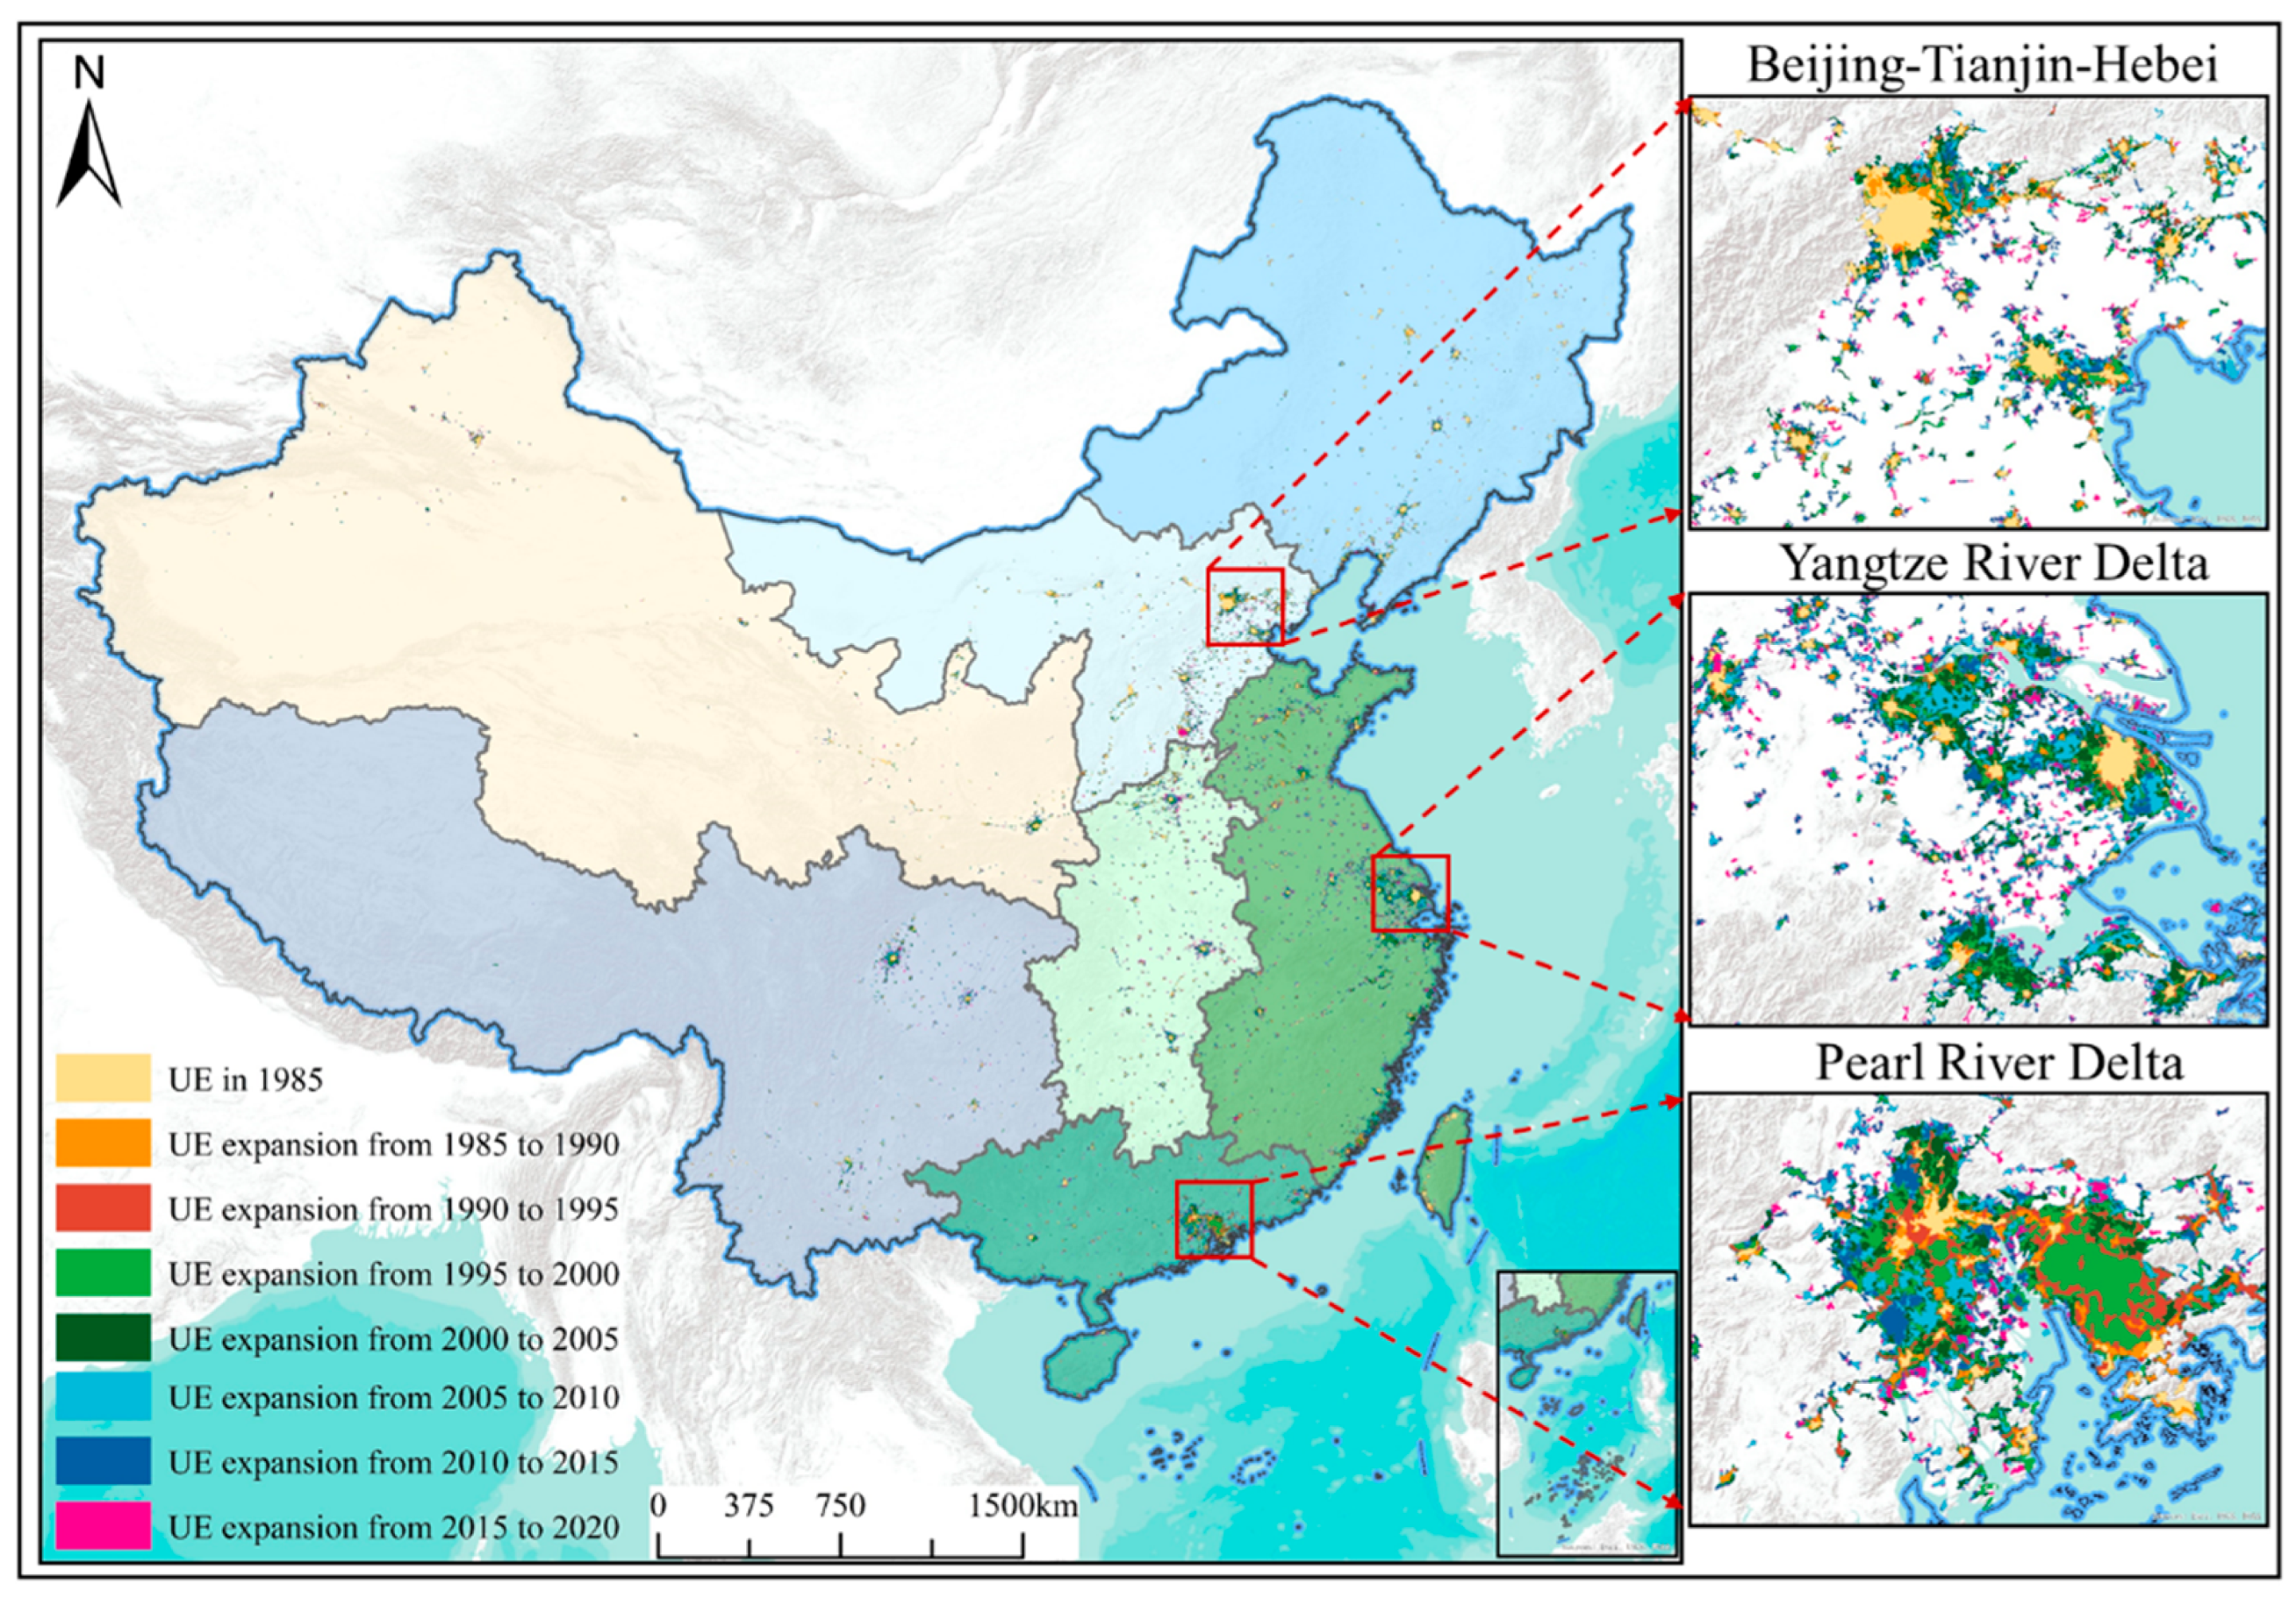
Figure 6.
The quantitative characteristics of urban settlements of different sizes from 1985 to 2020. (a) Number of urban settlements at different urban sizes; (b) area proportions of urban settlements at different urban sizes.
Figure 6.
The quantitative characteristics of urban settlements of different sizes from 1985 to 2020. (a) Number of urban settlements at different urban sizes; (b) area proportions of urban settlements at different urban sizes.

Figure 7.
Characteristics of urban settlements in different regions in China from 1985 to 2020. (a) The number of urban settlements in different regions; (b) the proportion of urban settlement areas in different regions. NEC: Northeast China; EC: East China; NC: North China; CC: Central China; SC: South China; NWC: Northwest China; and SWC: Southwest China. UE: urban extent.

Figure 8.
The quantitative characteristics of urban settlements in different regions from 1985 to 2020. NEC: Northeast China; EC: East China; NC: North China; CC: Central China; SC: South China; NWC: Northwest China; and SWC: Southwest China. UE: urban extent; UI: urban impervious area; UC: urban dense center.

Figure 9.
Characteristics of the largest urban settlements in different regions of China from 1985 to 2020. NEC: Northeast China; EC: East China; NC: North China; CC: Central China; SC: South China; NWC: Northwest China; and SWC: Southwest China. UE: urban extent; UI: urban impervious area; UC: urban dense center; UWB: urban water body; UGS: urban green space.
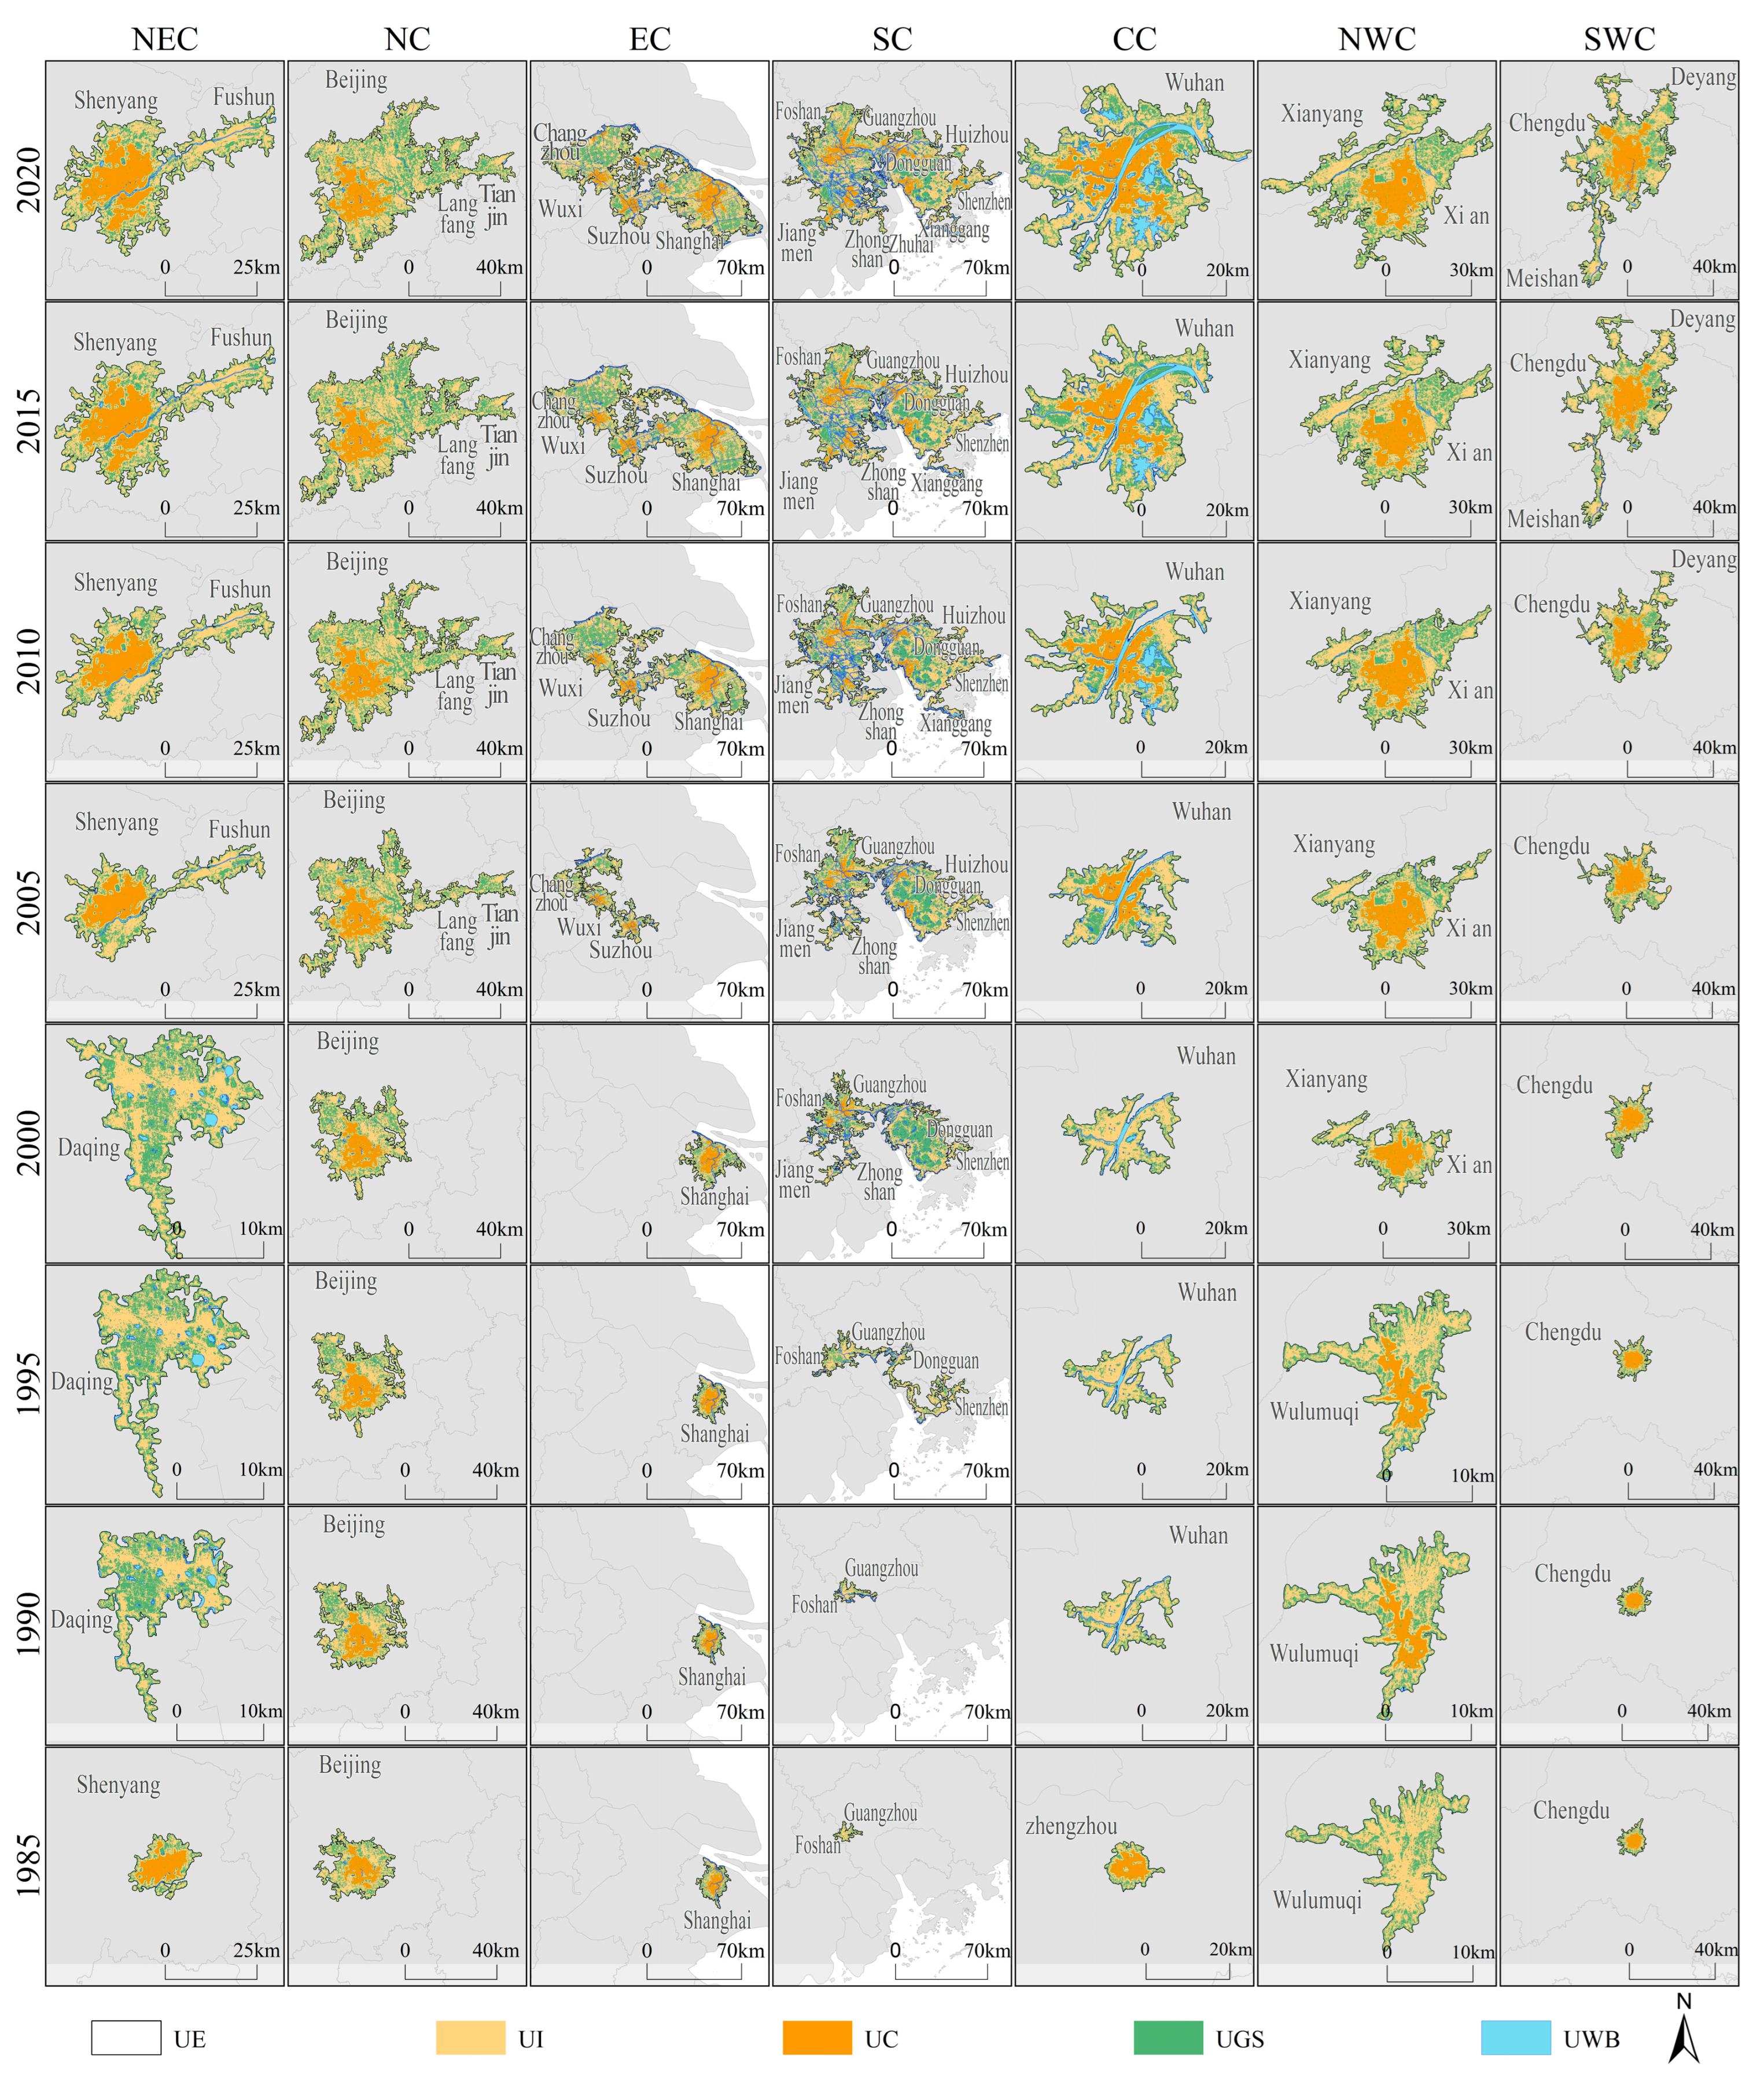
Figure 10.
The rank–size pattern of urban settlements in China from 1985 to 2020. UE: urban extent; UI: urban impervious area; UC: urban dense center.
Figure 10.
The rank–size pattern of urban settlements in China from 1985 to 2020. UE: urban extent; UI: urban impervious area; UC: urban dense center.

Figure 11.
Changes in the Zipf index in different regions of China from 1985 to 2020. NEC: Northeast China; EC: East China; NC: North China; CC: Central China; SC: South China; NWC: Northwest China; and SWC: Southwest China.
Figure 11.
Changes in the Zipf index in different regions of China from 1985 to 2020. NEC: Northeast China; EC: East China; NC: North China; CC: Central China; SC: South China; NWC: Northwest China; and SWC: Southwest China.

Table 1.
Datasets used in this study.
| Dataset | Spatial Resolution | Year | Source | Reference |
|---|---|---|---|---|
| Impervious surface dynamic data | 30 m | 1985, 1990, 1995, 2000, 2005, 2010, 2015, 2020 | https://doi.org/10.5281/zenodo.5220816 (accessed on 5 December 2022). | [40] |
| Water body dataset | 30 m | 1985, 1990, 1995, 2000, 2005, 2010, 2015, 2020 | https://global-surface-water.appspot.com (accessed on 2 December 2022). | [41] |
| MGUP | 250 m | 2001–2018 | https://www.rsearchgate.net/publication/339873537_MGUP_annual_global_2001_2018 (accessed on 25 June 2023). | [42] |
| GUB | 30 m | 1990–2018 | http://data.ess.tsinghua.edu.cn (accessed on 25 June 2023). | [21] |
| SUBAD | Vector | 1990–2015 | http://www.doi.org/10.11922/sciencedb.j00076.00004 (accessed on 25 June 2023). | [43] |
Table 2.
Characteristics of urban settlements from 1985 to 2020 in China. UE: urban extent; UI: urban impervious area; UC: urban dense center; UGS: urban green space; UWB: urban water body.
Table 2.
Characteristics of urban settlements from 1985 to 2020 in China. UE: urban extent; UI: urban impervious area; UC: urban dense center; UGS: urban green space; UWB: urban water body.
| Time | Number of UEs | UE (km2) | UI (km2) | UC (km2) | UGS (km2) | UWB (km2) |
|---|---|---|---|---|---|---|
| 1985 | 870 | 25,679.19 | 14,715.96 | 1541.24 | 10,619.74 | 359.60 |
| 1990 | 1106 | 34,285.76 | 19,250.63 | 1965.85 | 14,055.86 | 1008.18 |
| 1995 | 1418 | 45,980.02 | 25,535.69 | 2377.77 | 18,881.29 | 1606.76 |
| 2000 | 1898 | 69,283.41 | 37,326.47 | 3429.58 | 29,515.09 | 2511.07 |
| 2005 | 2346 | 101,785.36 | 55,226.06 | 6244.24 | 43,072.80 | 3608.54 |
| 2010 | 2700 | 136,251.06 | 74,652.62 | 8697.47 | 57,016.67 | 4759.75 |
| 2015 | 3165 | 174,056.77 | 95,749.52 | 11,584.27 | 72,421.03 | 6054.82 |
| 2020 | 3385 | 195,995.38 | 107,905.46 | 13,547.30 | 81,641.82 | 6634.56 |
Disclaimer/Publisher’s Note: The statements, opinions and data contained in all publications are solely those of the individual author(s) and contributor(s) and not of MDPI and/or the editor(s). MDPI and/or the editor(s) disclaim responsibility for any injury to people or property resulting from any ideas, methods, instructions or products referred to in the content. |
© 2023 by the authors. Licensee MDPI, Basel, Switzerland. This article is an open access article distributed under the terms and conditions of the Creative Commons Attribution (CC BY) license (https://creativecommons.org/licenses/by/4.0/).
Share and Cite
MDPI and ACS Style
Zhang, J.; Li, C.; Zhang, B.; Hu, Y.; Wang, H.; Li, Z.; Zhang, Q. Spatiotemporal Evolution and Rank–Size Pattern of Chinese Urban Settlements. Remote Sens. 2024, 16, 19. https://doi.org/10.3390/rs16010019
AMA Style
Zhang J, Li C, Zhang B, Hu Y, Wang H, Li Z, Zhang Q. Spatiotemporal Evolution and Rank–Size Pattern of Chinese Urban Settlements. Remote Sensing. 2024; 16(1):19. https://doi.org/10.3390/rs16010019
Chicago/Turabian StyleZhang, Jing, Chunlin Li, Baolei Zhang, Yuanman Hu, Hao Wang, Zhenxing Li, and Qian Zhang. 2024. "Spatiotemporal Evolution and Rank–Size Pattern of Chinese Urban Settlements" Remote Sensing 16, no. 1: 19. https://doi.org/10.3390/rs16010019
Note that from the first issue of 2016, this journal uses article numbers instead of page numbers. See further details here.