
The Benefits of Continental-Scale High-Resolution Hydrological Modeling in the Detection of Extreme Hydrological Events in China

1
College of Water Resource Science and Engineering, Taiyuan University of Technology, Taiyuan 030024, China
2
State Key Laboratory of Remote Sensing Science, Faculty of Geographical Science, Beijing Normal University, Beijing 100875, China
*
Author to whom correspondence should be addressed.
Remote Sens. 2023, 15(9), 2402; https://doi.org/10.3390/rs15092402
Submission received: 23 April 2023
/
Accepted: 28 April 2023
/
Published: 4 May 2023
Abstract
:High-resolution hydrological modeling is crucial for detecting extreme hydrological events and understanding fundamental terrestrial processes. However, spatial resolutions in current hydrological modeling studies have been mostly constrained to relatively coarse resolution (~10–100 km), and they therefore have a difficult time addressing flooding or drought issues with fine resolutions. In this study, a continental-scale high-resolution hydrological modeling framework (0.0625°, ~6 km) driven by remote sensing products was used to detect extreme hydrological event occurrences in China and evaluated based on the Variable Infiltration Capacity (VIC) model. The results showed that the developed model provided more detailed information than the coarser resolution models (a 0.25° and 1°), thereby capturing the timing, duration, and spatial extent of extreme hydrologic events regarding the 2012 Beijing flood and 2009/10 drought in Hai River Basin. Here, the total water storage changes were calculated based on the VIC model (−0.017 mm/year) and Gravity Recovery and Climate Experiment (GRACE) satellite (−0.203 mm/year) to reflect the water availability caused by climate change and anthropogenic factors. This study found that the 0.0625° dataset could capture detailed changes, thereby providing reliable information during occurrences of extreme hydrological events. The high-resolution model integrated with remote sensing products could be used for accurate evaluations of continental-scale extreme hydrological events and can be valuable in understanding its long-term occurrence and water resource security.
1. Introduction
Human activities have contributed to the worsening impacts of climate change, in which hydrological events such as floods and droughts are likely to become more extreme, with a higher frequency and intensity, and this has resulted in an increased vulnerability of ecosystems [1,2,3]. Detecting and evaluating these events remains challenging despite their significance in environmental and socioeconomic security. Moreover, with rapid urbanization, urban flash flooding events have become more frequent and severe, owing to the expansion of impermeable areas [4]. Drought has also intensified and expanded in other previously drought-tolerant regions, demonstrating the shifting water cycle dynamics, which exacerbate water storage. Hence, the monitoring and timely determination of drought periods, patterns, and severity can reduce or prevent its negative impacts on people and ecosystems.
The occurrence of frequent floods and droughts in China has contributed to the hindrance of the societal, economic, and agricultural development of the country [5], and the lack of high-resolution data on these events makes it nearly impossible to detect in short timescale periods (pentads or weeks) [6]. Moreover, its monitoring in small regions, such as remote areas, is also challenging without sufficient and reliable observation data [7]. Therefore, high-resolution modeling is crucial to conducting a better historical analysis and prediction to assist decision making for flood and drought management [8]. Although flood and drought data have been increasingly more common at regional and county scales [9], most ground-based monitoring systems use coarse data, which are insufficient to support detection and monitoring reliably.
Previous research on extreme flooding and drought events has focused on modeling and remote sensing at global and regional scales, in which the Moderate Resolution Imaging Spectroradiometer (MODIS) and Soil Moisture and Ocean Salinity (SMOS) have been largely used in agricultural drought monitoring [10,11]. Particularly, both were used in 2010–2015, using a spatial resolution of 0.05° with a 15-day interval [12]. Carozza and Boudreault [13] presented a global flood model developed using machine learning methods, and it provided flood hazard and risk maps to assist large-scale socioeconomic and financial planning. Meanwhile, the Gravity Recovery and Climate Experiment (GRACE), with a resolution of 1°, was widely adopted in regional studies to detect drought events in the Northern China Plain [14] and Amazon [15], in which it provided useful information on the hydrological effects of meteorological drought on regional water storages. Drought indexes are generally used to evaluate drought events, such as the Standardized Precipitation Index (SPI), Crop Moisture Index (CMI), and Streamflow Drought Index (SDI). The indexes are usually calculated based on single variables (e.g., rainfall, soil moisture) and are thus not able to reflect the comprehensive effects on water resources of hydrological extreme events. The assimilation of data from the GRACE system of satellites into a land-surface model yields an improved simulation of water storage and flux estimates. GRACE assimilation was applied over North America, and GRACE-based drought indicators were developed as part of a larger effort to investigate the drought conditions.
However, the dataset obtained from the remote sensing and data assimilation systems is limited to a single water budget [14], as the water and energy balance is not integrated into the remote sensing technology. The spatial and temporal heterogeneities, such as vegetation types and soil properties, also tend to be averaged or excluded in coarse-resolution models of hydrological or land model simulations. This results in uncertainties and inaccuracies from actual field conditions [15]. Therefore, high-resolution flood and drought simulations that consider the influence of meteorological forcing, land cover change, detailed topography, and hydrological processes are required to accurately detect and monitor extreme events at all scales (regional, urban, county, and sub-county).
Extreme hydrological events often lead to changes in regional water storage, affecting agricultural and industrial water supply. GRACE satellite images have been commonly used in numerous studies to evaluate such terrestrial water storage shortages induced by climate change impacts such as drought [16,17,18]. However, the resolution used in GRACE remained at 1° despite the launching of the GRACE-FO (follow-on) satellite (https://gracefo.jpl.nasa.gov/data/grace-fo-data/ (accessed on 1 April 2023)) in 2018, with a higher resolution of 0.25° [19]. However, this is still considered a relatively coarse resolution that cannot capture regional water storage changes [20].
In this study, a hydrological model with a high resolution of ~6 km and daily data collection was used to quantify the severity and coverage of two typical extreme events in China that caused significant economic and agricultural losses: the 2012 flood event in Beijing and 2009/10 drought in Northern China. The modeling is based on the Variable Infiltration Capacity (VIC) hydrological model [21], in combination with remote sensing and meteorological station observation data for comparing the water fluxes and conditions at finer spatial scales with the existing 0.25° and 1° datasets. This study is the extension of our previous research for the application of high-resolution modeling over China [22]. This study aims to conduct the following: (1) analyze the simulated evapotranspiration (ET), soil moisture (SM), and runoff changes between the two periods of 1970–1990 and 1995–2015 under the effects of climate change; (2) evaluate the spatial distribution pattern, intensity, and duration of flood and drought events and quantify the differences among the three datasets; and (3) calculate the total water storage and groundwater changes in China based on the VIC model.
This paper was organized as follows: the high-resolution hydrological datasets and methods are introduced in Section 2, while the flood and drought event evaluation and total water storage changes are presented in Section 3, followed by a discussion of the potential applications and limitations in Section 4. Finally, the conclusions are summarized in Section 5.
2. Data and Methods
2.1. High-Resolution Hydrological Modeling
In this study, we developed a high-resolution hydrological modeling framework for China based on a land surface hydrological model (i.e., the Variable Infiltration Capacity (VIC)) [23] with a spatial resolution of 0.0625° (~6 km) [24]. This framework has the following features: First, 2481 meteorological forcing stations over China were used to generate VIC model inputs (e.g., precipitation, temperature, humidity, and wind speed). The density of observation stations is higher than that of other studies [25,26,27]; Second, the soil parameters used in the VIC model are also updated to reflect recently developed soil datasets for China and hence can provide a more accurate representation of current hydrological and biogeochemical characteristics [28,29]; Third, the model inputs were integrated with remote sensing products. For example, the land cover and leaf area index (LAI) data were derived from Land Satellite Thematic Mapper (Landsat TM) images and the Global Land Surface Satellite (GLASS) product. The ground-based measurements (Figure 1) and remote sensing datasets including GLASS ET and European Space Agency Water Cycle Multimission Observation Strategy and Climate Change Initiative projects (ESA-CCI SM) were used to evaluate the simulated hydrological fluxes and states. The simulations were fully validated against observations and the remote sensing dataset (Table 1). Most of the calibrated basins had a high correlation coefficient (R) and Nash–Sutcliffe efficiency (NSE) values over 0.70. Most of the Kling–Gupta efficiency (KGE) values were higher than 0.40. The simulations are consistent with satellite remote sensing products of ET and SM, the mean differences between the VIC ET and the remote sensing ET range from −2 to 2 mm/day, and the differences for the SM of the top thin layer range from −2 to 3 mm.
This framework has practical applications, as it can also be potentially extended to larger spatial scales. For instance, the simulated water budgets can be important in analyzing the effects of climate change and human activities on the hydrological cycle at regional and watershed scales [30]. As it uses high-resolution data, it provides more detailed and accurate information for the detection of hydrological extreme events at various scales.
2.2. Extreme Hydrologic Events Detection
We apply the high-resolution framework to analyze two typical extreme events (the 2012 flood event at Beijing and the 2009/10 drought event in North China) and to evaluate the potential and advantages of the 0.0625° modeling in detecting flood and drought events. Due to the data availability for the two events, we do not evaluate the modeling performance for streamflow and SM.
To fully emphasize the advantage of the high-quality modeling, instead, we compare it with the other two VIC simulation datasets at coarser resolutions. One dataset with 0.25° resolution (~30 km) has been well calibrated and validated by Zhu et al. [31]. The other simulation dataset with 1° resolution (~100 km) is from the Global Land Data Assimilation Systems (GLDAS) [32], which have been widely used for global- and regional-scale hydrological cycles (e.g., Long et al. [33]). Only the VIC dataset, instead of the datasets from the other land surface models in GLDAS, is used in this study, given that there are different soil depths in the models when simulating water and energy balances.
2.3. Total Water Storage Changes
As the total water storage changes were partly induced by flooding and drought events, both the VIC simulations and GRACE-FO datasets were used in the calculation of the total water storage changes (TWSC) and its comparison. GRACE-FO is a successor to the original GRACE mission, which began orbiting Earth on 17 March 2002. It contains two satellites and measures their distance to reflect mass changes of the earth. The GRACE-FO involves global surface mass anomaly observation on a monthly interval, which has been one of its main features [34]. It analyzes mass land anomaly parameters caused by terrestrial water amounts, including surface water (SWSC), soil moisture (SMSC), and groundwater storage (GWSC) [35]. These datasets are expressed in terms of water-height-equivalent (mm), and it is the same as that in the VIC simulations, as given by the equation:
The difference in the GRACE anomaly in two successive months is equivalent to the monthly water storage changes:
where the subscript represents the th month and stands for the th month TWSC anomaly.
For the VIC simulation results, total water storage changes were calculated based on the monthly water balance at the basin scale, as given by:
where , , and denote precipitation, evapotranspiration, and runoff, respectively.
The resulting consistencies of total water storage changes calculated from Equations (2) and (3) can be useful indicators of the accuracy of high-resolution VIC simulations, indicating that it successfully captures the total water storage. The GRACE-FO data were also interpolated into the 0.0625° resolution and subtracted from the VIC SM simulations to calculate the GWSC.
Notably, Equation (3) can result in lesser uncertainties, as it only uses hydrological modeling data that exclude the effects of human activities. The VIC model may inevitably introduce uncertainties, particularly in the TWSC calculation, which will be discussed in the Uncertainties section.
3. Results
3.1. High-Resolution Hydrological Dataset
A high-resolution hydrological dataset was used to explore the spatial distributions of the mean ET, SM, surface runoff, and baseflow during the period of 1970–2015. As shown in Figure 2a, the daily ET ranges from 0 mm/day in the northwest to more than 5 mm/day in the southwest, which was similar to the distribution of precipitation. In the Tibetan Plateau, where there is a dominant permafrost soil type and rare vegetation, the SM was relatively lower. Figure 2c,d present the spatial patterns of daily surface runoff and baseflow, in which the runoff was higher in the southeast regions, owing to the abundant rainfall, high-density river net systems, and vegetation coverage.
Figure 3 shows the cumulative distribution functions (CDFs) of the average daily ET, SM, surface runoff, and baseflow simulations during the 1970–1990 and 1995–2015 periods. While the ET in the 1995–2015 period approaches higher temperature values (Figure 3a), the ET in the 1970–1990 simulations decreased, which may be attributed to the regional decreased precipitation. Meanwhile, the SM (Figure 3b), surface runoff (Figure 3c), and baseflow (Figure 3d) increased the water budgets in the 1995–2015 period, which may have been caused by the increasing temperatures arising from climate change. The SM was found to have a lower sensitivity in both the higher and lower percentiles. The CDFs of the simulated surface runoff mostly overlapped in the low percentiles during the two periods; however, the baseflow was higher than that in the 1995–2015 period. Based on the comparisons between the two periods (Figure 3), it can be inferred that global temperature has a dominant effect on the extreme values of the water budget.
3.2. The 2012 Flood Event in Beijing
On 21 July 2012, the heaviest rainfall in the past six decades, which resulted in flooding and affected an area of ~16,000 km2 and more than 1.6 million people, was recorded in Beijing [36]. Consequently, this event has been subjected to numerous studies; however, few have focused on its causes and patterns [37,38,39], while little to no attention has been given to associated hydrological processes such as runoff generation.
In this study, the flood coverage, which is represented by the runoff depth, was detected and analyzed. Based on gauge observations, the intensive rainfall area extends from southwestern Beijing to the northeastern areas [40]. As shown in Figure 4, the runoff depth was found at the SW–NE zonal distribution in both the 0.0625° and 0.25° models, whereas the GLDAS dataset showed fewer than four grids over the study area and, hence, does not accurately capture spatial distribution patterns. The central region of Beijing, which has a high-density population and infrastructure, obtained the highest runoff yield with >100 mm/d.
To further evaluate the intensity of the flooding event, the frequency distributions of rainfall and runoff based on the 0.0625° model were analyzed (Figure 5). The mean and maximum rainfall recorded were 103 mm and 287 mm over 24 h, respectively, on July 21, 2012. As values of >50 mm are recognized as a high rainstorm level, 76% of the area of Beijing underwent heavy rainstorms. Under such conditions, the mean and maximum runoff yields were ~26 mm and 172 mm, respectively. Specifically, in the central urban area, the runoff coefficient, given by runoff/precipitation, was 0.89. This indicates a high flooding risk, which may be partly attributed to the effects of urbanization, in which water drainage is limited by the permeability of concrete surfaces [36].
3.3. The 2009/10 Drought Event in North China
From 2009 to 2010, a widespread and severe drought that lasted for several months occurred in northern and southwestern China, which has been considered one of the most dramatic drought events in history and incurred a total of USD 100 million in losses [41]. In this study, drought was defined as an SM deficit (negative SM anomaly) relative to the long-term mean. The SM anomalies for the period of May 2009 to April 2010 were apparent exactly during the drought occurrence [14]. To distinguish the regional differences between the three simulations, the Hai River Basin (HRB) was selected, as it is drought-prone and is also one of the largest river basins in northern China, covering a population of nearly 137 million [42].
The three drought simulations showed an SW–NE zonal distribution pattern in China (Figure 6a,c,e). Here, notable differences can be observed: first, the 0.0625° simulation showed larger areas with negative SM anomalies in northwestern and southern regions compared to those of the other two coarse-resolution simulations. Meanwhile, the SM anomaly in the HRB shows more visual details with increasing spatial resolution. Specifically, the 0.0625° simulation detected the drought that occurred in the northwestern and northeastern regions, including the southwestern area. This result was consistent with the study by Wu et al. [43], which used RS data with a 1 km resolution. However, the two coarser-resolution simulations failed to detect the detailed visual distribution of the drought in the same regions. The magnitude of the SM anomaly in the 0.0625° simulation was larger than that in the 0.25° and 1° simulations, ranging from 10.12 to 10.50 mm, while that of the other simulations ranged from 7.94 to 4.75 mm and from 7.08 to 7.08 mm, respectively (Figure 6g). In addition, the HRB portions also obtained different drought distribution results in each of three simulations; the 0.0625°, 0.25°, and 1° simulations obtained distributions of 53.79% (0.0625°), 48.13% (0.25°), and 25% (1°), respectively (Figure 6h). This indicates that the 0.0625° simulation successfully captured detailed spatial distributions and the severity of drought events.
The 0.0625° model was found to be capable of detecting the agricultural drought events that occurred in the HRB for the past four decades. Figure 7 shows the SM anomalies and durations of the droughts, which were calculated based on the percentage of days with negative SM anomalies/year from 1970 to 2015. Approximately 50% of these anomalies were recorded drought events, and the most severe drought events occurred in 1972, 1999, and 2006. Further, 36 years of the total recorded drought duration also recorded relatively long drought periods lasting >6 months. In particular, >75% of the days in 2006 had negative SM anomalies. These droughts were also recorded to be intensive and long, especially between 1980 and 1985 and between 1999 and 2006. These findings were consistent with those reported by Qin, Yang, Lei, Xu, and Xu [42].
3.4. Total Water Storage Changes
Changes in total water storage are mainly influenced by flooding and drought events, including anthropogenic activities involving irrigation and groundwater pumping. In this study, the TWSC was computed using the VIC high-resolution modeling and the GRACE-FO data. Although the dTWSC/dt displayed a larger amplitude, the dTWSC/dt series obtained from the GRACE were consistent with those values obtained from VIC (Figure 8). This suggests a certain degree of consistency between the two data sources. The TWSC shows a decreasing trend, with 0.203 mm/year and 0.017 mm/year from GRACE and VIC, respectively. The smaller magnitude of the VIC simulation may result from differences in the input forcing data, model formulations, and resolution.
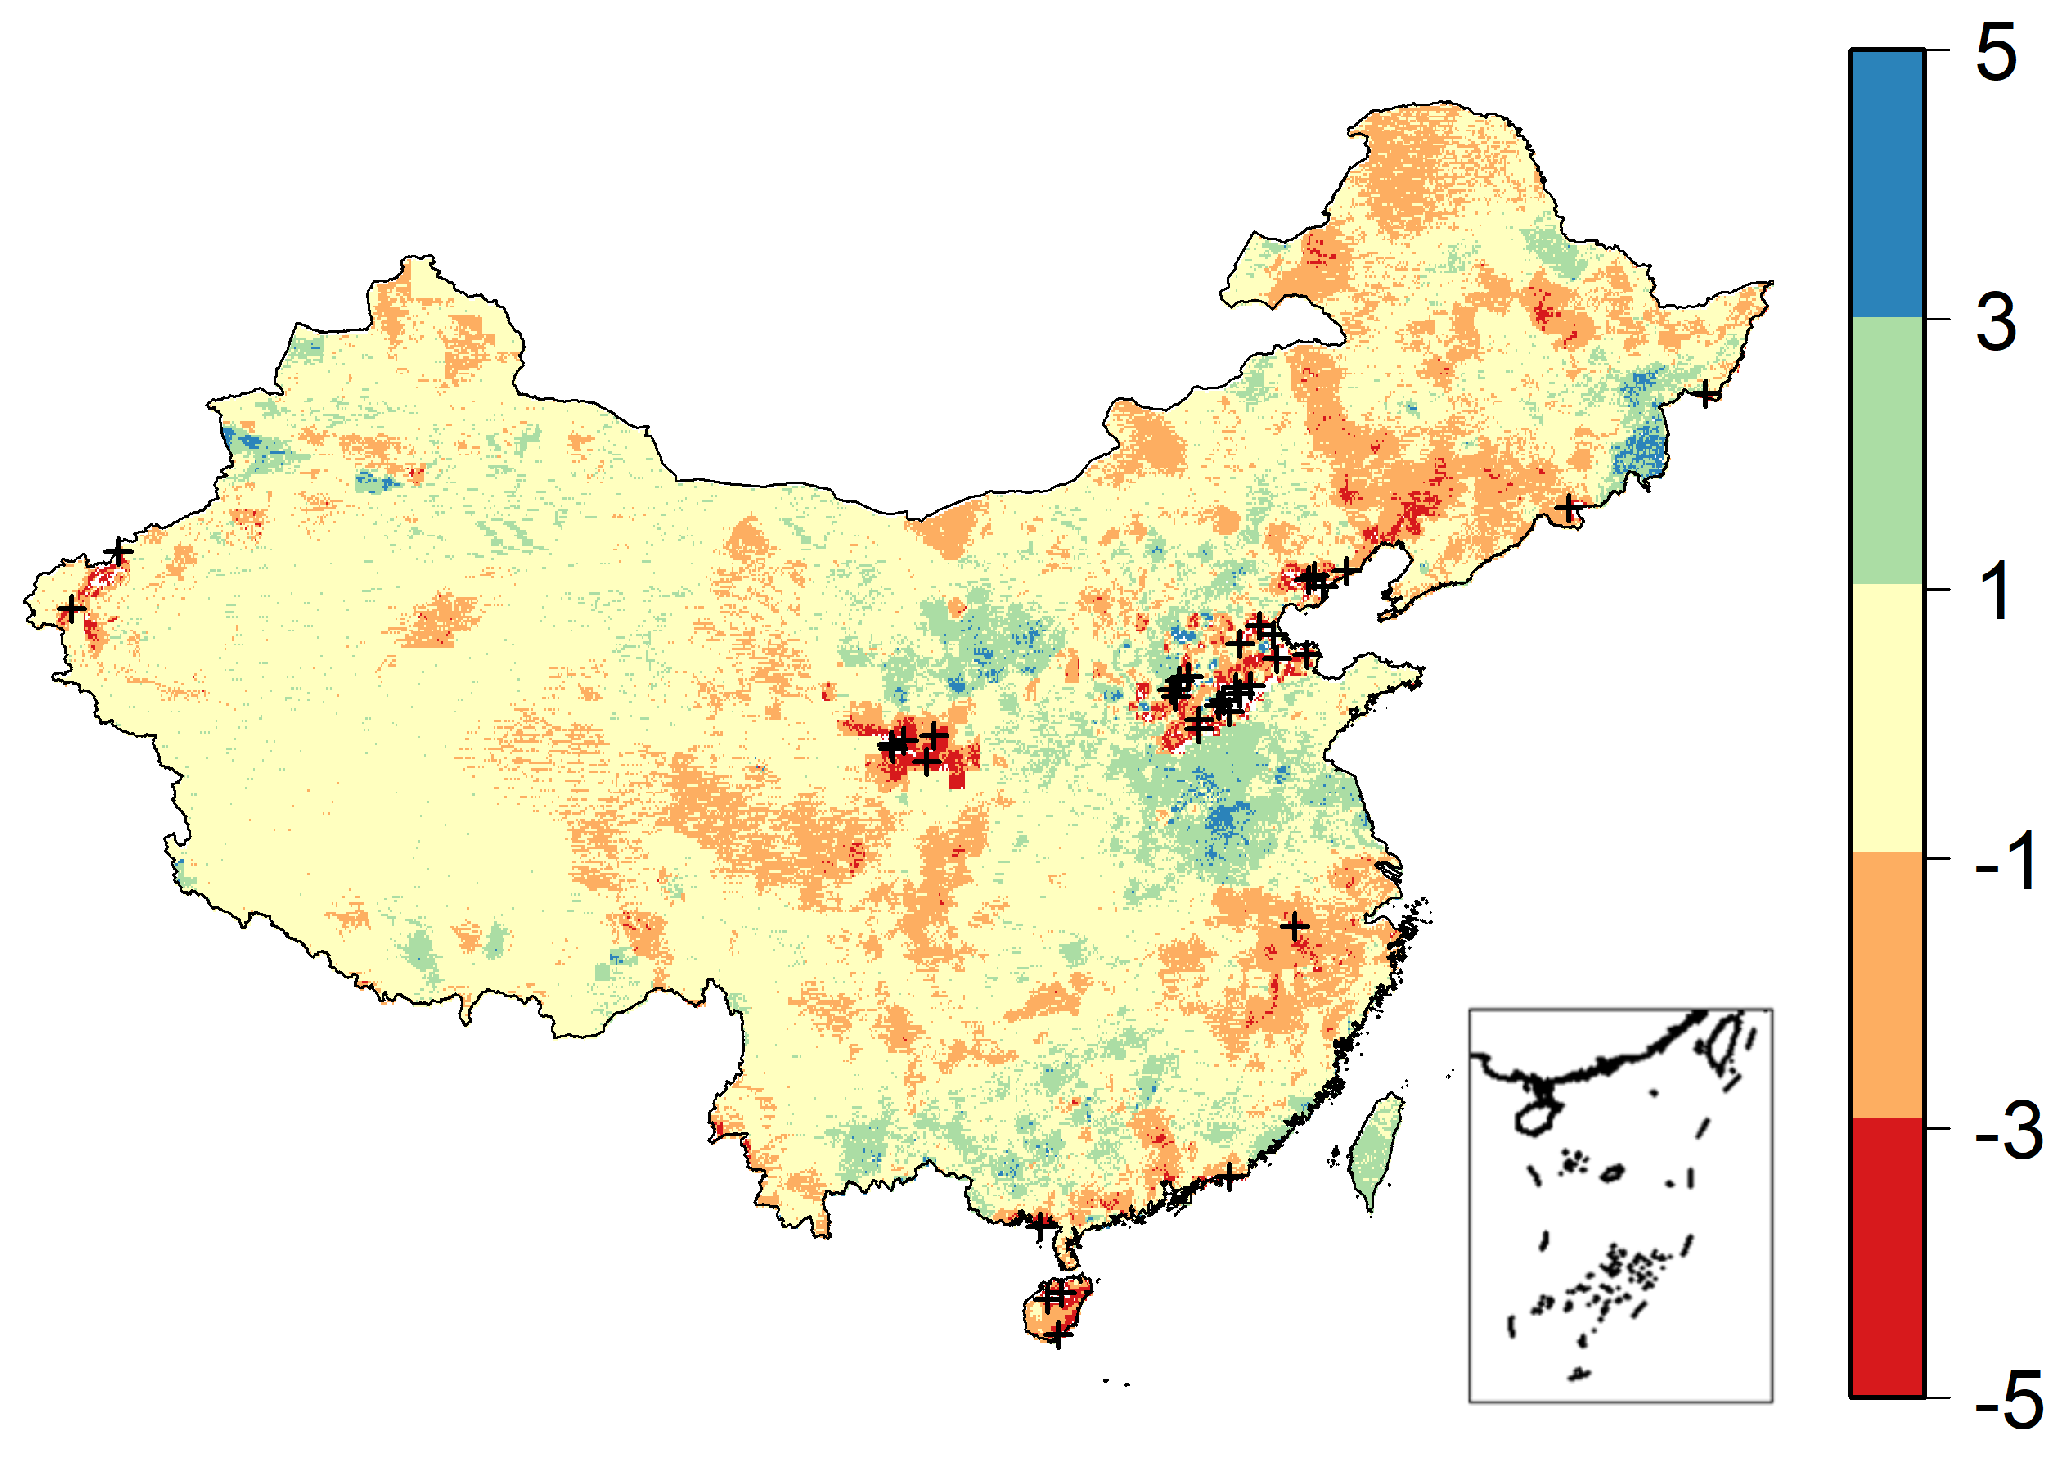
As groundwater is a vital source of freshwater for agricultural, industrial, and domestic use, the GRACE and VIC model simulations were used to create a high-resolution groundwater change dataset and quantify these changes between 2003 and 2015. It was found that the spatial distribution of the groundwater changes was not uniform (Figure 9), in which groundwater was observed to significantly decrease by more than 10 mm/year in the North China Plain, and this may be attributed to the agricultural irrigation and groundwater withdrawal. These results were consistent with those of the previous studies [14]. Meanwhile, it was found that groundwater in other regions, such as in the Huai and Pearl river basins, was increasing; however, it slightly decreased at the center of the Yellow and Yangtse river basins, where there is a high population density and water consumption. The groundwater change dataset using the 0.0625° model provided more detailed visual information compared with those of the coarse resolution models derived from limited in situ observations or land surface modeling. Therefore, the VIC high-resolution dataset detected the factors affecting TWSC and accurately evaluated extreme hydrological events, including those involving anthropogenic activities (e.g., crops management and land cover change).
4. Discussion
4.1. Potential Applications
This study developed a high-resolution hydrological model based on VIC for evaluating flooding and drought events, including their total water storage change. This was then compared with existing datasets that used coarser resolutions, and it was found that the 0.0625° dataset could capture detailed changes, thereby providing reliable information during occurrences of extreme hydrological events.
The satellite products including land cover, vegetation, evaporation, and soil properties were used to construct the high-resolution VIC modeling. These datasets provide continuous data in both spatial and temporal scales, which are important information sources in poorly gauged regions. Furthermore, the satellite data observe the dynamics of water fluxes and states and thus could be developed as satellite-based remote sensing drought indices for drought monitoring under complex environmental conditions. Therefore, the remote sensing provides spatial data that can improve hydrological models by enhancing data accuracy and temporal resolution, which can serve as a valuable tool for driving the hydrological model and evaluating model performance.
VIC modeling can also be applied to flash flood and agricultural drought detection using real-time and hourly meteorological forcing, in which it can be valuable for local water resource management [44,45,46]. In addition, as the traditional drought index normally uses coarser resolutions and singularly focuses on one aspect of meteorological or hydrological processes, the simulated runoff, ET, and SM in this study can be used for comprehensive drought index calculations, which can be significant in evaluating the causes and effects of regional droughts. The hydrological dataset and GRACE-FO data can also be combined to create and reconstruct long time-series and high-resolution groundwater storage change using by data interpolation and assimilation [22], which are necessary for quantifying the effects of regional climate change and anthropogenic activities, respectively, on groundwater dynamics.
4.2. Uncertainties and Future Studies
Few studies have used hydrological model simulations to detect drought or flood events, and this study applies the widely used VIC model to compare validated extreme hydrological events in China, with a focus on spatial resolution. The VIC dataset with a 0.0625° resolution was more accurate than the coarse datasets studied. However, uncertainties regarding model inputs and structures may exist [47]. For instance, radiation, albedo, and dynamic vegetation growth, which could significantly alter land processes, were not considered in the model inputs, although they are relevant parameters affecting actual field conditions [48,49]. The flooding events also focused on the runoff rather than the routing results, including urban expansion and impermeable areas, which were generally excluded in the model configuration. In addition, an explicit groundwater module was also not included in the VIC model, whereas the GRACE captured TWSC variations, including groundwater. Therefore, the VIC model can be more applicable for actual hydrology simulations, whereas the GRACE can be applicable for those that consider anthropogenic impacts.
To better apply the high-resolution VIC modeling framework for extreme hydrological event evaluation and detection, several challenges and limitations pertaining to the model configurations should be addressed in future studies. First, surface albedo, longwave and shortwave radiations, and dynamic leaf area index (LAI) should be included in the model inputs to characterize the effects of radiative forcing on the water budget [50]. Second, irrigation and urban expansion modules should also be integrated into the VIC model to improve the model simulations [51]. Lastly, real-time meteorological forcing is important in modeling for the detection of extreme flash floods and drought occurrences.
5. Conclusions
High-resolution hydrological modeling has potential applications in the detection of extreme hydrologic events. To investigate such applications, the VIC model was calibrated with a 0.0625° resolution to detect flood and drought occurrences in China and was compared with other existing datasets with coarser resolutions of 0.25° and 1° to validate its accuracy. It was found that the high-resolution dataset provides more detailed information than the other two coarse-resolution models. The frequency and intensity of the two extreme events were also simulated by the hydrological model, in which the results were consistent with those of previous regional studies. Furthermore, this model also accurately captured flooding and drought hotspots compared with the coarser model simulations. The total water storage and groundwater storage changes were then calculated based on 0.0625° simulations. The major conclusions of this study are as follows:
- (1)
- For the 2012 Beijing flood event, the runoff depth showed an SW–NE zonal distribution in both the 0.0625° and 0.25° models. Meanwhile, the GLDAS dataset failed to capture this same spatial distribution pattern. The maximum rainfall intensity was recorded to be 287 mm over 24 h, which was considered to be under a strong rainstorm. The mean runoff yield was ~26 mm, with a maximum of 172 mm.
- (2)
- The three simulations showed an SW–NE zonal distribution pattern for the 2009/10 drought in China. However, the 0.0625° simulation presented larger drought areas. In the HRB, the magnitude of the SM anomaly in the 0.0625° simulation was larger than that in the 0.25° and 1° simulations. The three also yielded different drought-stricken areas with 53.79% (0.0625°), 48.13% (0.25°), and 25% (1°), respectively.
- (3)
- Based on the VIC simulation, the regional TWSC in China showed a decreasing trend with 0.017 mm/year, which was smaller than that of the GRACE dataset. The groundwater storage changes in northern China were also calculated and were found to significantly decrease by > 10 mm/year—mainly attributable to human activities.
Lastly, this study recommends considerations for future studies, as uncertainties regarding model inputs and configurations may exist. Specifically, temporal and spatial resolutions should be improved. VIC applications may also be extended to higher spatial scales and resolutions with longer data durations. This study can also serve as a first step for the ongoing integrated VIC and real-time hydrologic extreme event forecasting system coupling study, in which results will be reported in the future.
Author Contributions
Conceptualization, B.Z. and X.X.; methodology, X.X.; validation, B.Z.; data curation, Y.W.; writing—original draft preparation, B.Z.; writing—review and editing, X.X.; visualization, X.X.; supervision, X.X.; project administration, X.X.; funding acquisition, X.X. and X.Z. All authors have read and agreed to the published version of the manuscript.
Funding
This research was funded by grants from the National Natural Science Foundation of China (41971030, 52279020). It was also partly supported by the special fund for Science and Technology Innovation Teams of Shanxi Province (202204051002027).
Data Availability Statement
Not applicable.
Acknowledgments
We would like to thank all the anonymous reviewers and editors for their constructive comments and careful language editing.
Conflicts of Interest
The authors declare no conflict of interest.
References
- Liu, M.; Yin, Y.; Wang, X.; Ma, X.; Chen, Y.; Chen, W. More frequent, long-lasting, extreme and postponed compound drought and hot events in eastern China. J. Hydrol. 2022, 614, 128499. [Google Scholar] [CrossRef]
- Venkatappa, M.; Sasaki, N.; Han, P.; Abe, I. Impacts of droughts and floods on croplands and crop production in southeast Asia—An application of google earth engine. Sci. Total Environ. 2021, 795, 148829. [Google Scholar] [CrossRef] [PubMed]
- Dai, A. Increasing drought under global warming in observations and models. Nat. Clim. Change 2012, 3, 52–58. [Google Scholar] [CrossRef]
- Wan Mohtar, W.H.M.; Abdullah, J.; Abdul Maulud, K.N.; Muhammad, N.S. Urban flash flood index based on historical rainfall events. Sustain. Cities Soc. 2020, 56, 102088. [Google Scholar] [CrossRef]
- Zhang, Q.; Gu, X.; Singh, V.P.; Liu, L.; Kong, D. Flood-induced agricultural loss across China and impacts from climate indices. Glob. Planet. Change 2016, 139, 31–43. [Google Scholar] [CrossRef]
- Zhang, Y.; You, Q.; Chen, C.; Li, X. Flash droughts in a typical humid and subtropical basin: A case study in the Gan river basin, China. J. Hydrol. 2017, 551, 162–176. [Google Scholar] [CrossRef]
- Wood, E.F.; Roundy, J.K.; Troy, T.J.; van Beek, L.P.H.; Bierkens, M.F.P.; Blyth, E.; de Roo, A.; Döll, P.; Ek, M.; Famiglietti, J.; et al. Hyperresolution global land surface modeling: Meeting a grand challenge for monitoring earth’s terrestrial water. Water Resour. Res. 2011, 47, W05301. [Google Scholar] [CrossRef]
- Melsen, L.A.; Teuling, A.J.; Torfs, P.J.J.F.; Zappa, M.; Mizukami, N.; Mendoza, P.A.; Clark, M.P.; Uijlenhoet, R. Subjective modeling decisions can significantly impact the simulation of flood and drought events. J. Hydrol. 2019, 568, 1093–1104. [Google Scholar] [CrossRef]
- Broich, M.; Tulbure, M.G.; Verbesselt, J.; Xin, Q.; Wearne, J. Quantifying Australia’s dryland vegetation response to flooding and drought at sub-continental scale. Remote Sens. Environ. 2018, 212, 60–78. [Google Scholar] [CrossRef]
- Brakenridge, R.; Anderson, E. Modis-based flood detection, mapping and measurement: The potential for operational hydrological applications. In Transboundary Floods: Reducing Risks through Flood Management; Marsalek, J., Stancalie, G., Balint, G., Eds.; Springer: Dordrecht, The Netherlands, 2006; pp. 1–12. [Google Scholar]
- Tran, H.; Nguyen, P.; Ombadi, M.; Hsu, K.; Sorooshian, S.; Andreadis, K. Improving hydrologic modeling using cloud-free modis flood maps. J. Hydrometeorol. 2019, 20, 2203–2214. [Google Scholar] [CrossRef]
- Sánchez, N.; González-Zamora, Á.; Martínez-Fernández, J.; Piles, M.; Pablos, M. Integrated remote sensing approach to global agricultural drought monitoring. Agric. For. Meteorol. 2018, 259, 141–153. [Google Scholar] [CrossRef]
- Carozza, D.A.; Boudreault, M. A global flood risk modeling framework built with climate models and machine learning. J. Adv. Model. Earth Syst. 2021, 13, e2020MS002221. [Google Scholar] [CrossRef]
- Zhu, B.; Xie, X.; Zhang, K. Water storage and vegetation changes in response to the 2009/10 drought over north China. Hydrol. Res. 2018, 49, 1618–1635. [Google Scholar] [CrossRef]
- Thomas, A.C.; Reager, J.T.; Famiglietti, J.S.; Rodell, M. A grace-based water storage deficit approach for hydrological drought characterization. Geophys. Res. Lett. 2014, 41, 1537–1545. [Google Scholar] [CrossRef]
- Fang, B.; Kansara, P.; Dandridge, C.; Lakshmi, V. Drought monitoring using high spatial resolution soil moisture data over Australia in 2015–2019. J. Hydrol. 2021, 594, 125960. [Google Scholar] [CrossRef]
- Zhu, B.; Huang, M.; Cheng, Y.; Xie, X.; Liu, Y.; Bisht, G.; Chen, X. Impact of vegetation physiology and phenology on watershed hydrology in a semi-arid watershed in the pacific northwest in a changing climate. Water Resour. Res. 2021, 57, e2020WR028394. [Google Scholar] [CrossRef]
- Seka, A.M.; Zhang, J.; Zhang, D.; Ayele, E.G.; Han, J.; Prodhan, F.A.; Zhang, G.; Liu, Q. Hydrological drought evaluation using grace satellite-based drought index over the lake basins, east Africa. Sci. Total Environ. 2022, 852, 158425. [Google Scholar] [CrossRef]
- Wang, F.; Lai, H.; Li, Y.; Feng, K.; Zhang, Z.; Tian, Q.; Zhu, X.; Yang, H. Identifying the status of groundwater drought from a grace mascon model perspective across China during 2003–2018. Agric. Water Manag. 2022, 260, 107251. [Google Scholar] [CrossRef]
- Zhang, Z.; Chao, B.F.; Chen, J.; Wilson, C.R. Terrestrial water storage anomalies of Yangtze river basin droughts observed by grace and connections with ENSO. Glob. Planet. Chang. 2015, 126, 35–45. [Google Scholar] [CrossRef]
- Landerer, F.W.; Flechtner, F.M.; Save, H.; Webb, F.H.; Bandikova, T.; Bertiger, W.I.; Bettadpur, S.V.; Byun, S.H.; Dahle, C.; Dobslaw, H.; et al. Extending the global mass change data record: Grace follow-on instrument and science data performance. Geophys. Res. Lett. 2020, 47, e2020GL088306. [Google Scholar] [CrossRef]
- Ali, S.; Liu, D.; Fu, Q.; Cheema, M.J.M.; Pal, S.C.; Arshad, A.; Pham, Q.B.; Zhang, L. Constructing high-resolution groundwater drought at spatio-temporal scale using grace satellite data based on machine learning in the Indus basin. J. Hydrol. 2022, 612, 128295. [Google Scholar] [CrossRef]
- Liang, X.; Lettenmaier, D.P.; Wood, E.F.; Burges, S.J. A simple hydrologically based model of land surface water and energy fluxes for general circulation models. J. Geophys. Res. Atmos. 1994, 99, 14415–14428. [Google Scholar] [CrossRef]
- Zhu, B.; Xie, X.; Lu, C.; Lei, T.; Wang, Y.; Jia, K.; Yao, Y. Extensive evaluation of a continental-scale high-resolution hydrological model using remote sensing and ground-based observations. Remote Sens. 2021, 13, 1247. [Google Scholar] [CrossRef]
- Zhang, X.; Tang, Q.; Pan, M.; Tang, Y. A long-term land surface hydrologic fluxes and states dataset for China. J. Hydrometeorol. 2014, 15, 2067–2084. [Google Scholar] [CrossRef]
- Xie, Z.; Yuan, F.; Duan, Q.; Zheng, J.; Liang, M.; Chen, F. Regional parameter estimation of the vic land surface model: Methodology and application to river basins in China. J. Hydrometeorol. 2007, 8, 447–468. [Google Scholar] [CrossRef]
- Pan, M.; Sahoo, A.K.; Troy, T.J.; Vinukollu, R.K.; Sheffield, J.; Wood, E.F. Multisource estimation of long-term terrestrial water budget for major global river basins. J. Clim. 2012, 25, 3191–3206. [Google Scholar] [CrossRef]
- Dai, Y.; Shangguan, W.; Duan, Q.; Liu, B.; Fu, S.; Niu, G. Development of a China dataset of soil hydraulic parameters using pedotransfer functions for land surface modeling. J. Hydrometeorol. 2013, 14, 869–887. [Google Scholar] [CrossRef]
- Shangguan, W.; Dai, Y.; Liu, B.; Zhu, A.; Duan, Q.; Wu, L.; Ji, D.; Ye, A.; Yuan, H.; Zhang, Q.; et al. A China data set of soil properties for land surface modeling. J. Adv. Model. Earth Syst. 2013, 5, 212–224. [Google Scholar] [CrossRef]
- Xie, X.; Liang, S.; Yao, Y.; Jia, K.; Meng, S.; Li, J. Detection and attribution of changes in hydrological cycle over the three-north region of China: Climate change versus afforestation effect. Agric. For. Meteorol. 2015, 203, 74–87. [Google Scholar] [CrossRef]
- Zhu, B.; Xie, X.; Meng, S.; Lu, C.; Yao, Y. Sensitivity of soil moisture to precipitation and temperature over China: Present state and future projection. Sci. Total Environ. 2020, 705, 135774. [Google Scholar] [CrossRef]
- Rodell, M.; Houser, P.R.; Jambor, U.; Gottschalck, J.; Mitchell, K.; Meng, C.J.; Arsenault, K.; Cosgrove, B.; Radakovich, J.; Bosilovich, M.; et al. The global land data assimilation system. Bull. Am. Meteorol. Soc. 2004, 85, 381–394. [Google Scholar] [CrossRef]
- Long, D.; Longuevergne, L.; Scanlon, B.R. Global analysis of approaches for deriving total water storage changes from grace satellites. Water Resour. Res. 2015, 51, 2574–2594. [Google Scholar] [CrossRef]
- Sun, A.Y.; Scanlon, B.R.; Save, H.; Rateb, A. Reconstruction of GRACE total water storage through automated machine learning. Water Resour. Res. 2021, 57, e2020WR028666. [Google Scholar] [CrossRef]
- Zhang, K.; Xie, X.; Zhu, B.; Meng, S.; Yao, Y. Unexpected groundwater recovery with decreasing agricultural irrigation in the yellow river basin. Agric. Water Manag. 2019, 213, 858–867. [Google Scholar] [CrossRef]
- Wang, K.; Wang, L.; Wei, Y.-M.; Ye, M. Beijing storm of July 21, 2012: Observations and reflections. Nat. Hazards 2013, 67, 969–974. [Google Scholar] [CrossRef]
- Liu, J.; Liu, M.; Zhuang, D.; Zhang, Z.; Deng, X. Study on spatial pattern of land-use change in China during 1995–2000. Sci. China Ser. D 2003, 46, 373–384. [Google Scholar]
- Huang, Y.; Chen, S.; Cao, Q.; Hong, Y.; Wu, B.; Huang, M.; Qiao, L.; Zhang, Z.; Li, Z.; Li, W.; et al. Evaluation of version-7 TRMM multi-satellite precipitation analysis product during the Beijing extreme heavy rainfall event of 21 July 2012. Water 2014, 6, 32–44. [Google Scholar] [CrossRef]
- Wang, Y.; Xie, X.; Liang, S.; Zhu, B.; Yao, Y.; Meng, S.; Lu, C. Quantifying the response of potential flooding risk to urban growth in Beijing. Sci. Total Environ. 2020, 705, 135868. [Google Scholar] [CrossRef]
- Chen, S.; Liu, H.; You, Y.; Mullens, E.; Hu, J.; Yuan, Y.; Huang, M.; He, L.; Luo, Y.; Zeng, X.; et al. Evaluation of High-Resolution Precipitation Estimates from Satellites during July 2012 Beijing Flood Event Using Dense Rain Gauge Observations. PLoS ONE 2014, 9, e89681. [Google Scholar] [CrossRef]
- Ye, T.; Shi, P.; Wang, J.a.; Liu, L.; Fan, Y.; Hu, J. China’s drought disaster risk management: Perspective of severe droughts in 2009–2010. Int. J. Disaster Risk Sci. 2012, 3, 84–97. [Google Scholar] [CrossRef]
- Qin, Y.; Yang, D.; Lei, H.; Xu, K.; Xu, X. Comparative analysis of drought based on precipitation and soil moisture indices in Haihe basin of north China during the period of 1960–2010. J. Hydrol. 2015, 526, 55–67. [Google Scholar] [CrossRef]
- Wu, J.; Zhou, L.; Mo, X.; Zhou, H.; Zhang, J.; Jia, R. Drought monitoring and analysis in China based on the integrated surface drought index (ISDI). Int. J. Appl. Earth Obs. Geoinf. 2015, 41, 23–33. [Google Scholar] [CrossRef]
- Suárez-Almiñana, S.; Andreu, J.; Solera, A.; Madrigal, J. Integrating seasonal forecasts into real-time drought management: Júcar river basin case study. Int. J. Disaster Risk Reduct. 2022, 70, 102777. [Google Scholar] [CrossRef]
- Xu, B.; Huang, X.; Mo, R.; Zhong, P.-a.; Lu, Q.; Zhang, H.; Si, W.; Xiao, J.; Sun, Y. Integrated real-time flood risk identification, analysis, and diagnosis model framework for a multireservoir system considering temporally and spatially dependent forecast uncertainties. J. Hydrol. 2021, 600, 126679. [Google Scholar] [CrossRef]
- Wu, H.; Adler, R.F.; Tian, Y.; Huffman, G.J.; Li, H.; Wang, J. Real-time global flood estimation using satellite-based precipitation and a coupled land surface and routing model. Water Resour. Res. 2014, 50, 2693–2717. [Google Scholar] [CrossRef]
- Xie, X.; Meng, S.; Liang, S.; Yao, Y. Improving streamflow predictions at ungauged locations with real-time updating: Application of an ENKF-based state-parameter estimation strategy. Hydrol. Earth Syst. Sci. 2014, 18, 3923–3936. [Google Scholar] [CrossRef]
- Huang, Q.; Qin, G.; Zhang, Y.; Tang, Q.; Liu, C.; Xia, J.; Chiew, F.H.S.; Post, D. Using remote sensing data-based hydrological model calibrations for predicting runoff in ungauged or poorly gauged catchments. Water Resour. Res. 2020, 56, e2020WR028205. [Google Scholar] [CrossRef]
- Stisen, S.; Jensen, K.H.; Sandholt, I.; Grimes, D.I.F. A remote sensing driven distributed hydrological model of the Senegal river basin. J. Hydrol. 2008, 354, 131–148. [Google Scholar] [CrossRef]
- Jiang, F.; Xie, X.; Liang, S.; Wang, Y.; Zhu, B.; Zhang, X.; Chen, Y. Loess plateau evapotranspiration intensified by land surface radiative forcing associated with ecological restoration. Agric. For. Meteorol. 2021, 311, 108669. [Google Scholar] [CrossRef]
- Xie, X.; Cui, Y. Development and test of swat for modeling hydrological processes in irrigation districts with paddy rice. J. Hydrol. 2011, 396, 61–71. [Google Scholar] [CrossRef]
Figure 1.
Distribution of VIC model inputs and validation stations.
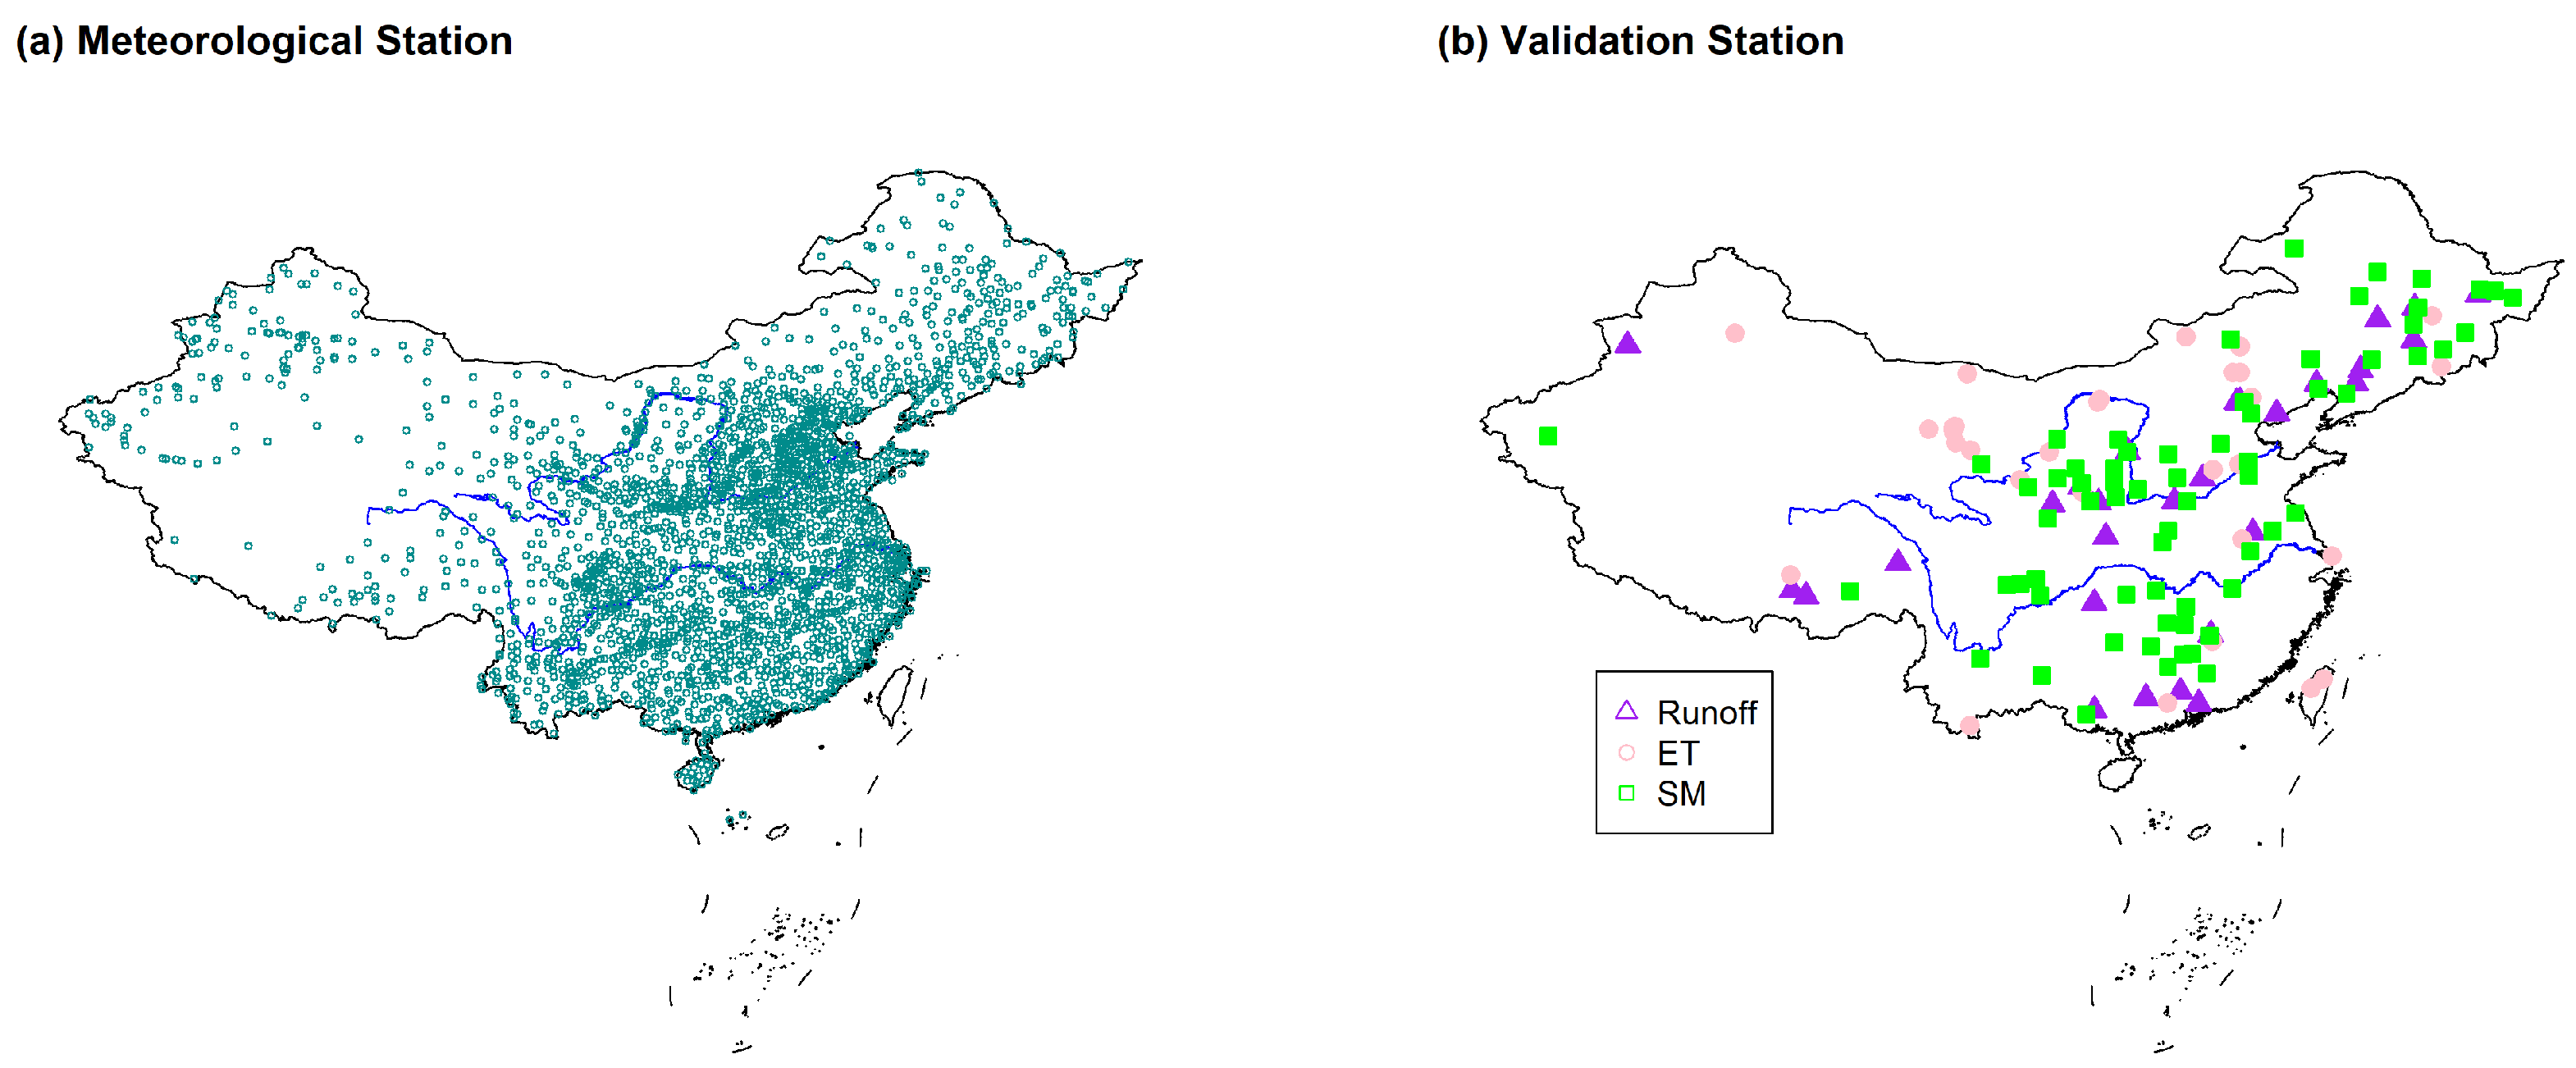
Figure 2.
The long-term average daily (a) ET, (b) SM, (c) surface runoff, and (d) baseflow with a 0.0625° resolution simulated by the VIC model for the period of 1970–2015.
Figure 2.
The long-term average daily (a) ET, (b) SM, (c) surface runoff, and (d) baseflow with a 0.0625° resolution simulated by the VIC model for the period of 1970–2015.
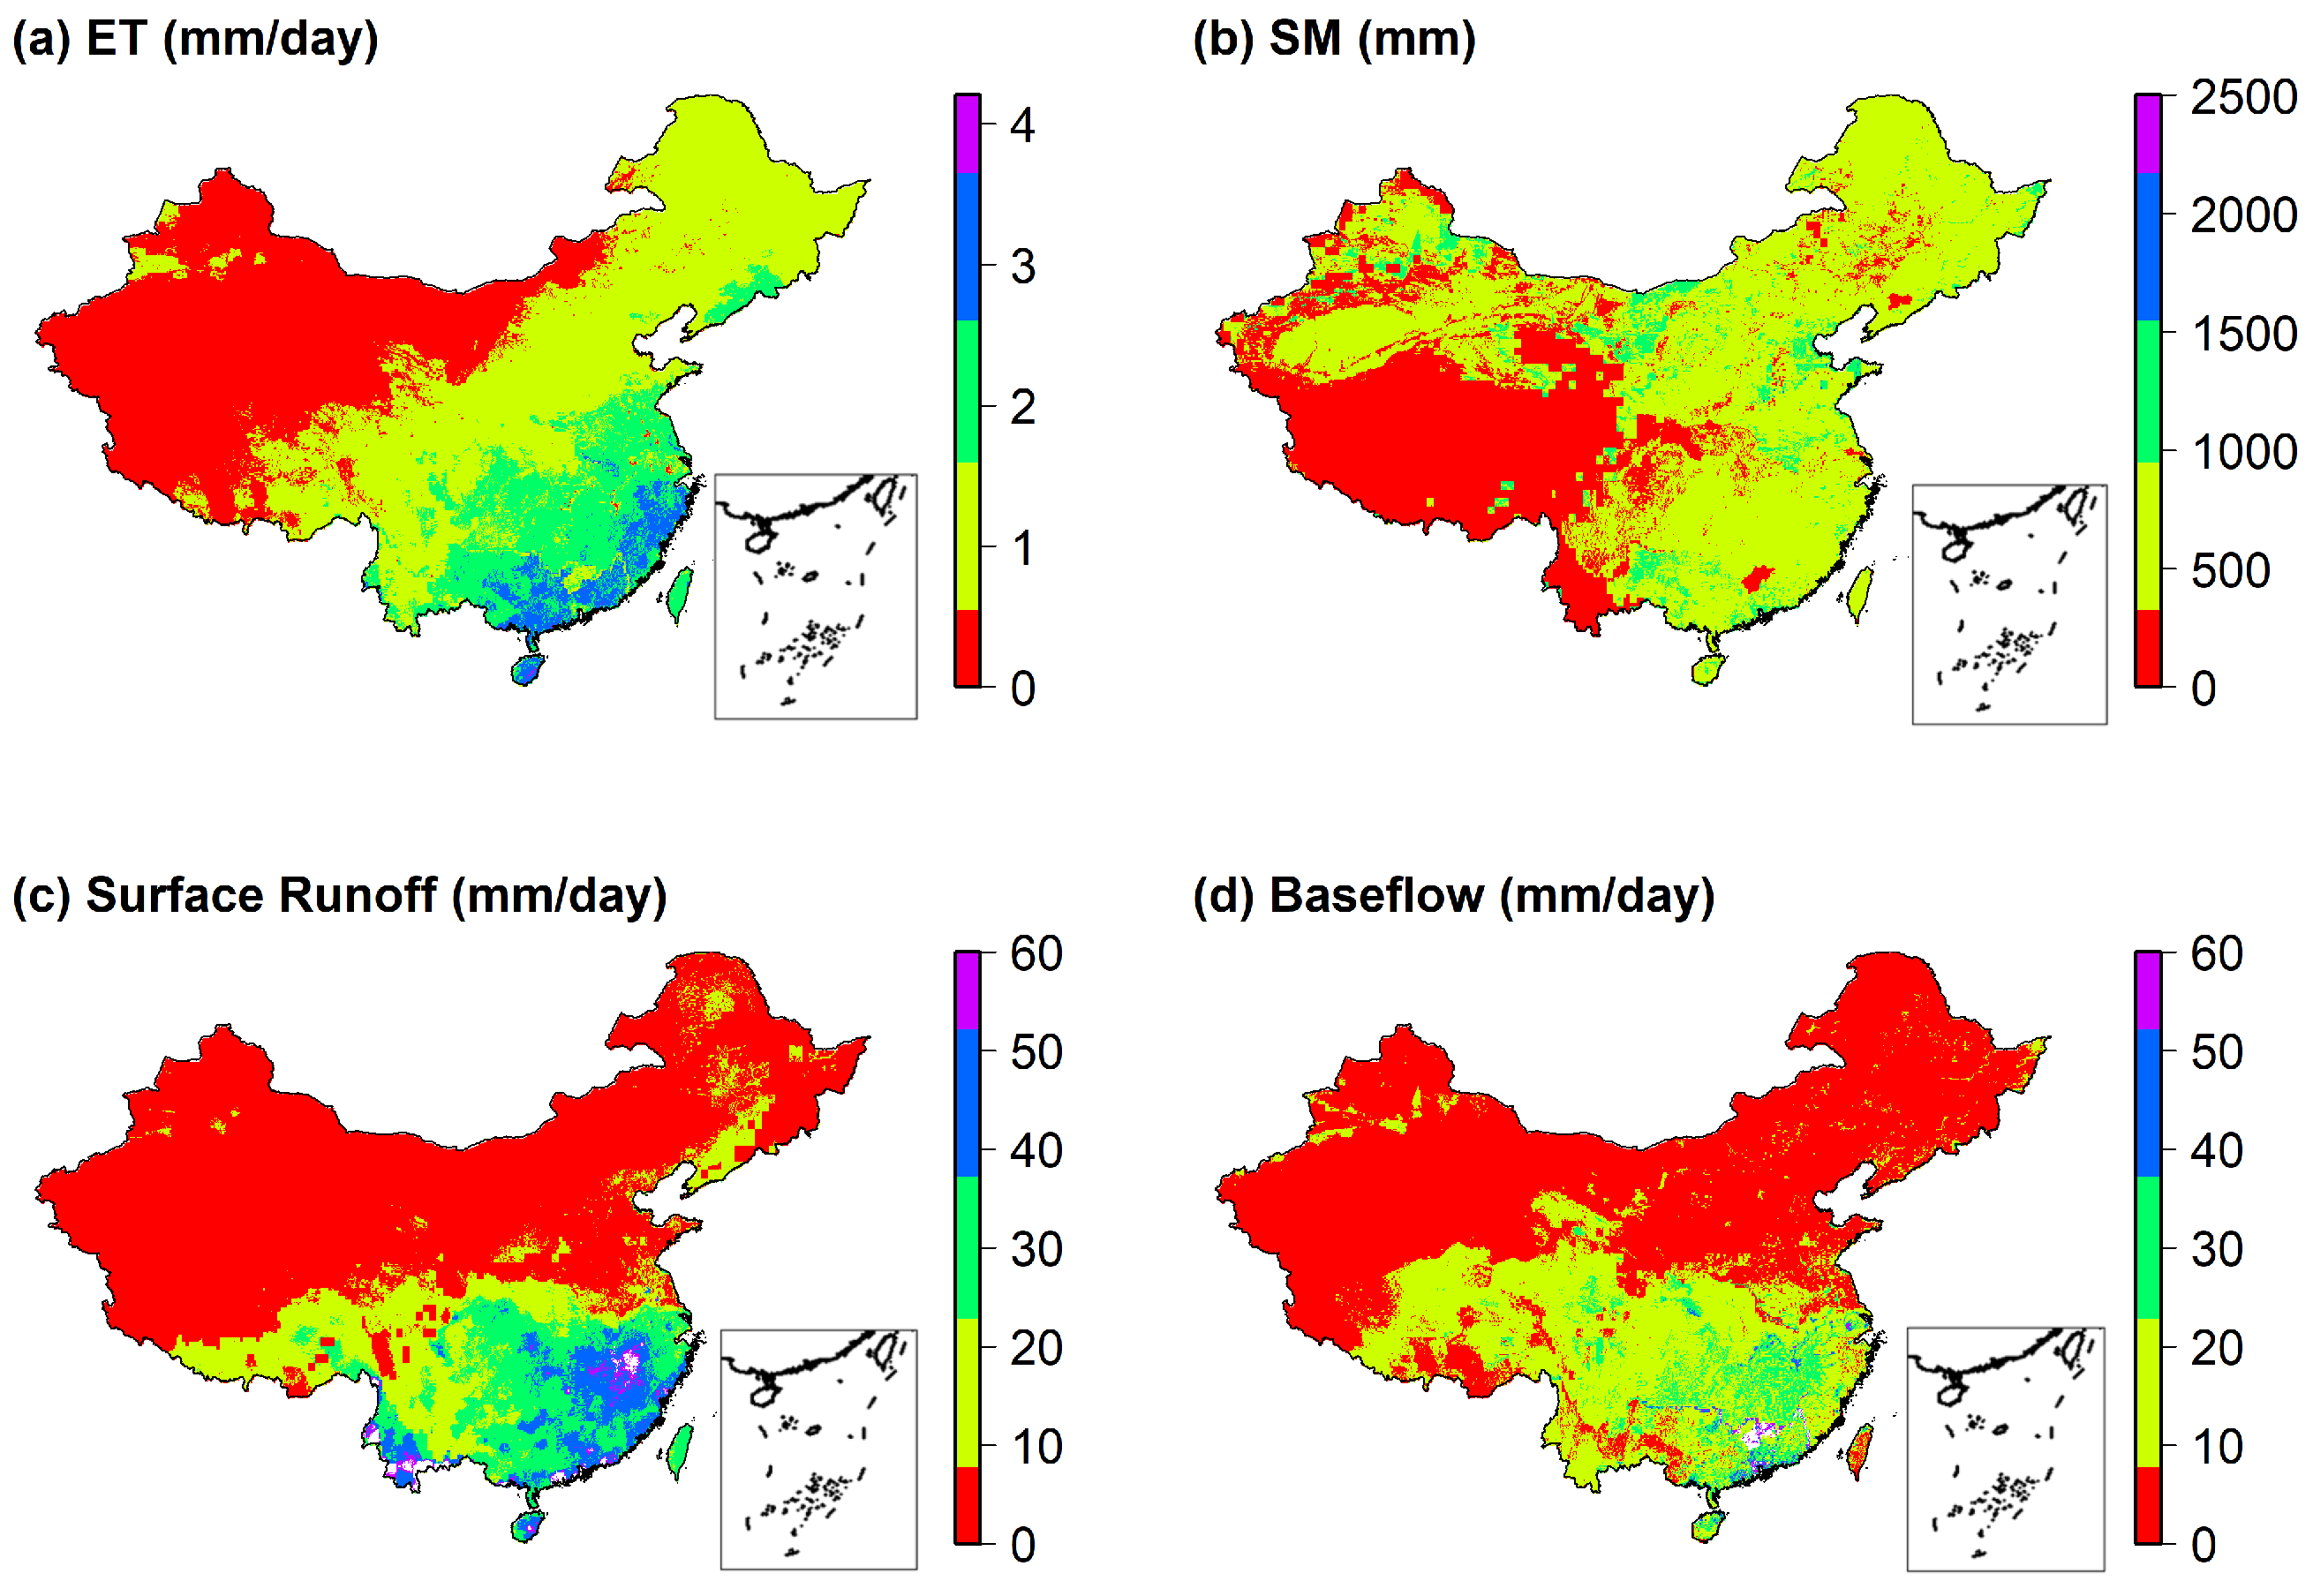
Figure 3.
The CDFs for the daily (a) ET, (b) SM, (c) surface runoff, and (d) baseflow in response to 1970–1990 and 1995–2015. CDF, cumulative frequency distributions.
Figure 3.
The CDFs for the daily (a) ET, (b) SM, (c) surface runoff, and (d) baseflow in response to 1970–1990 and 1995–2015. CDF, cumulative frequency distributions.
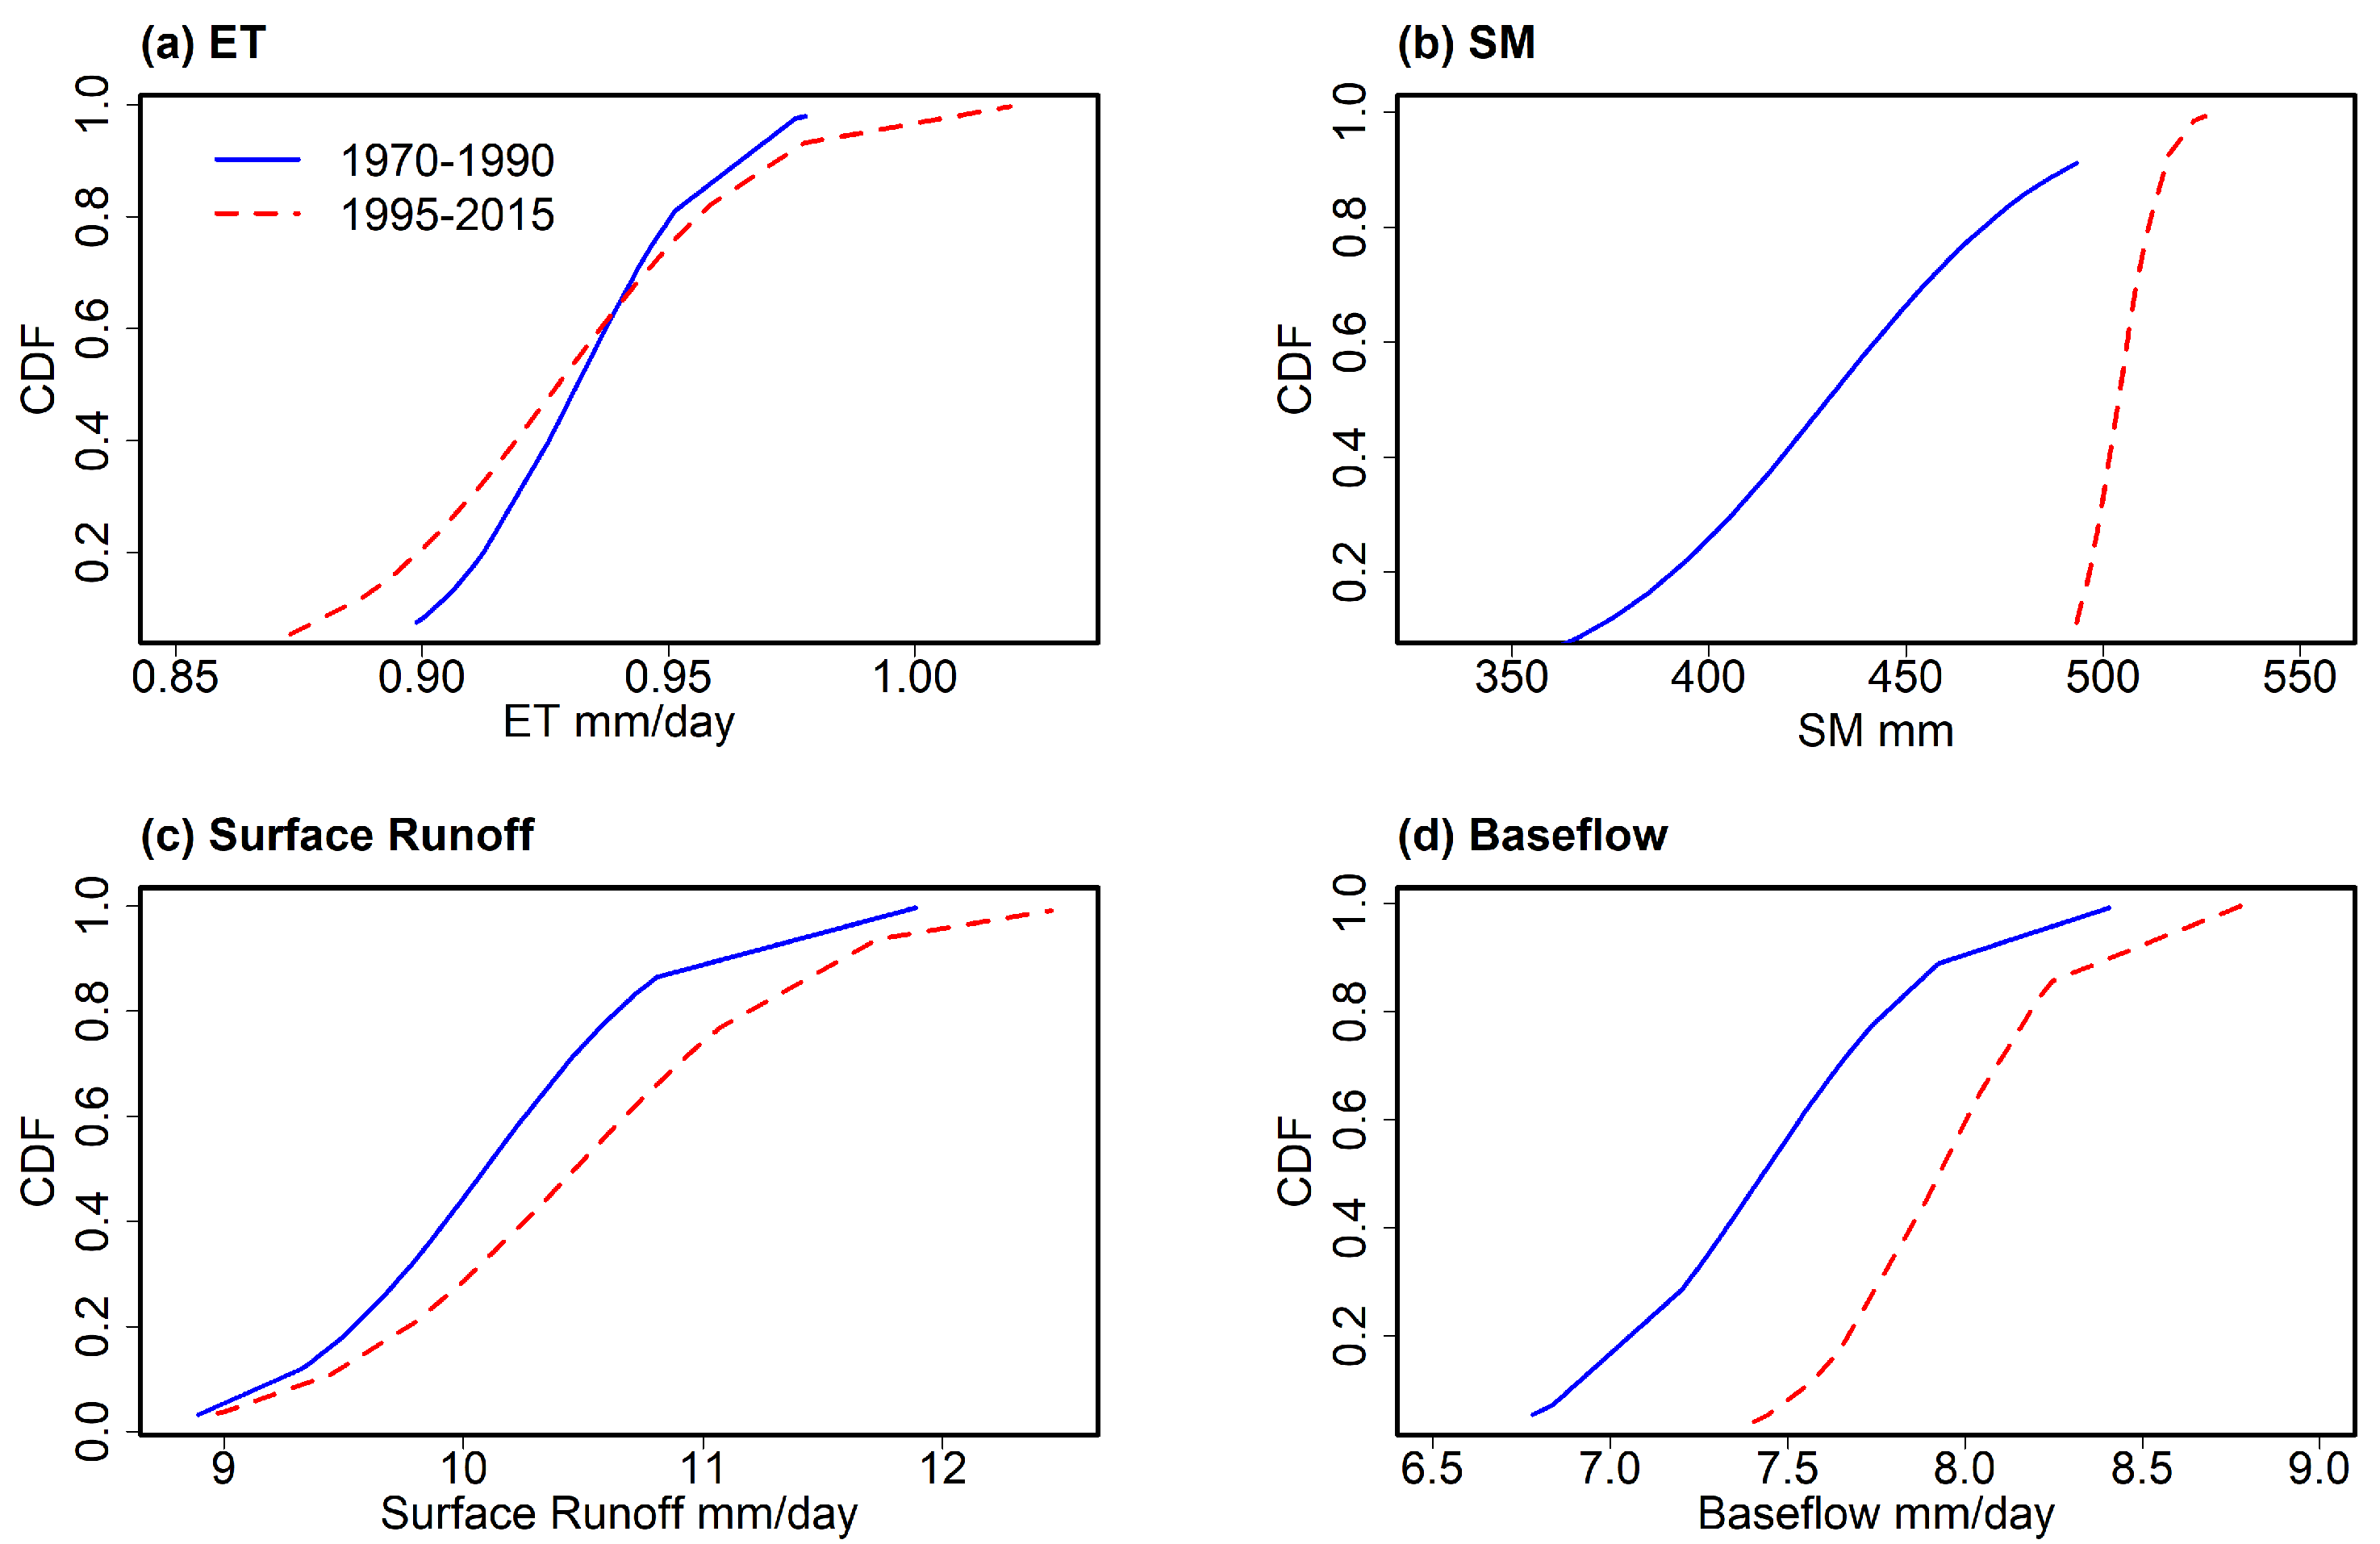
Figure 4.
Simulated runoff in the Beijing 2012 flooding event: (a) at 0.0625° resolution, (b) at 0.25° resolution, and (c) at 1° resolution from GLDAS.
Figure 4.
Simulated runoff in the Beijing 2012 flooding event: (a) at 0.0625° resolution, (b) at 0.25° resolution, and (c) at 1° resolution from GLDAS.
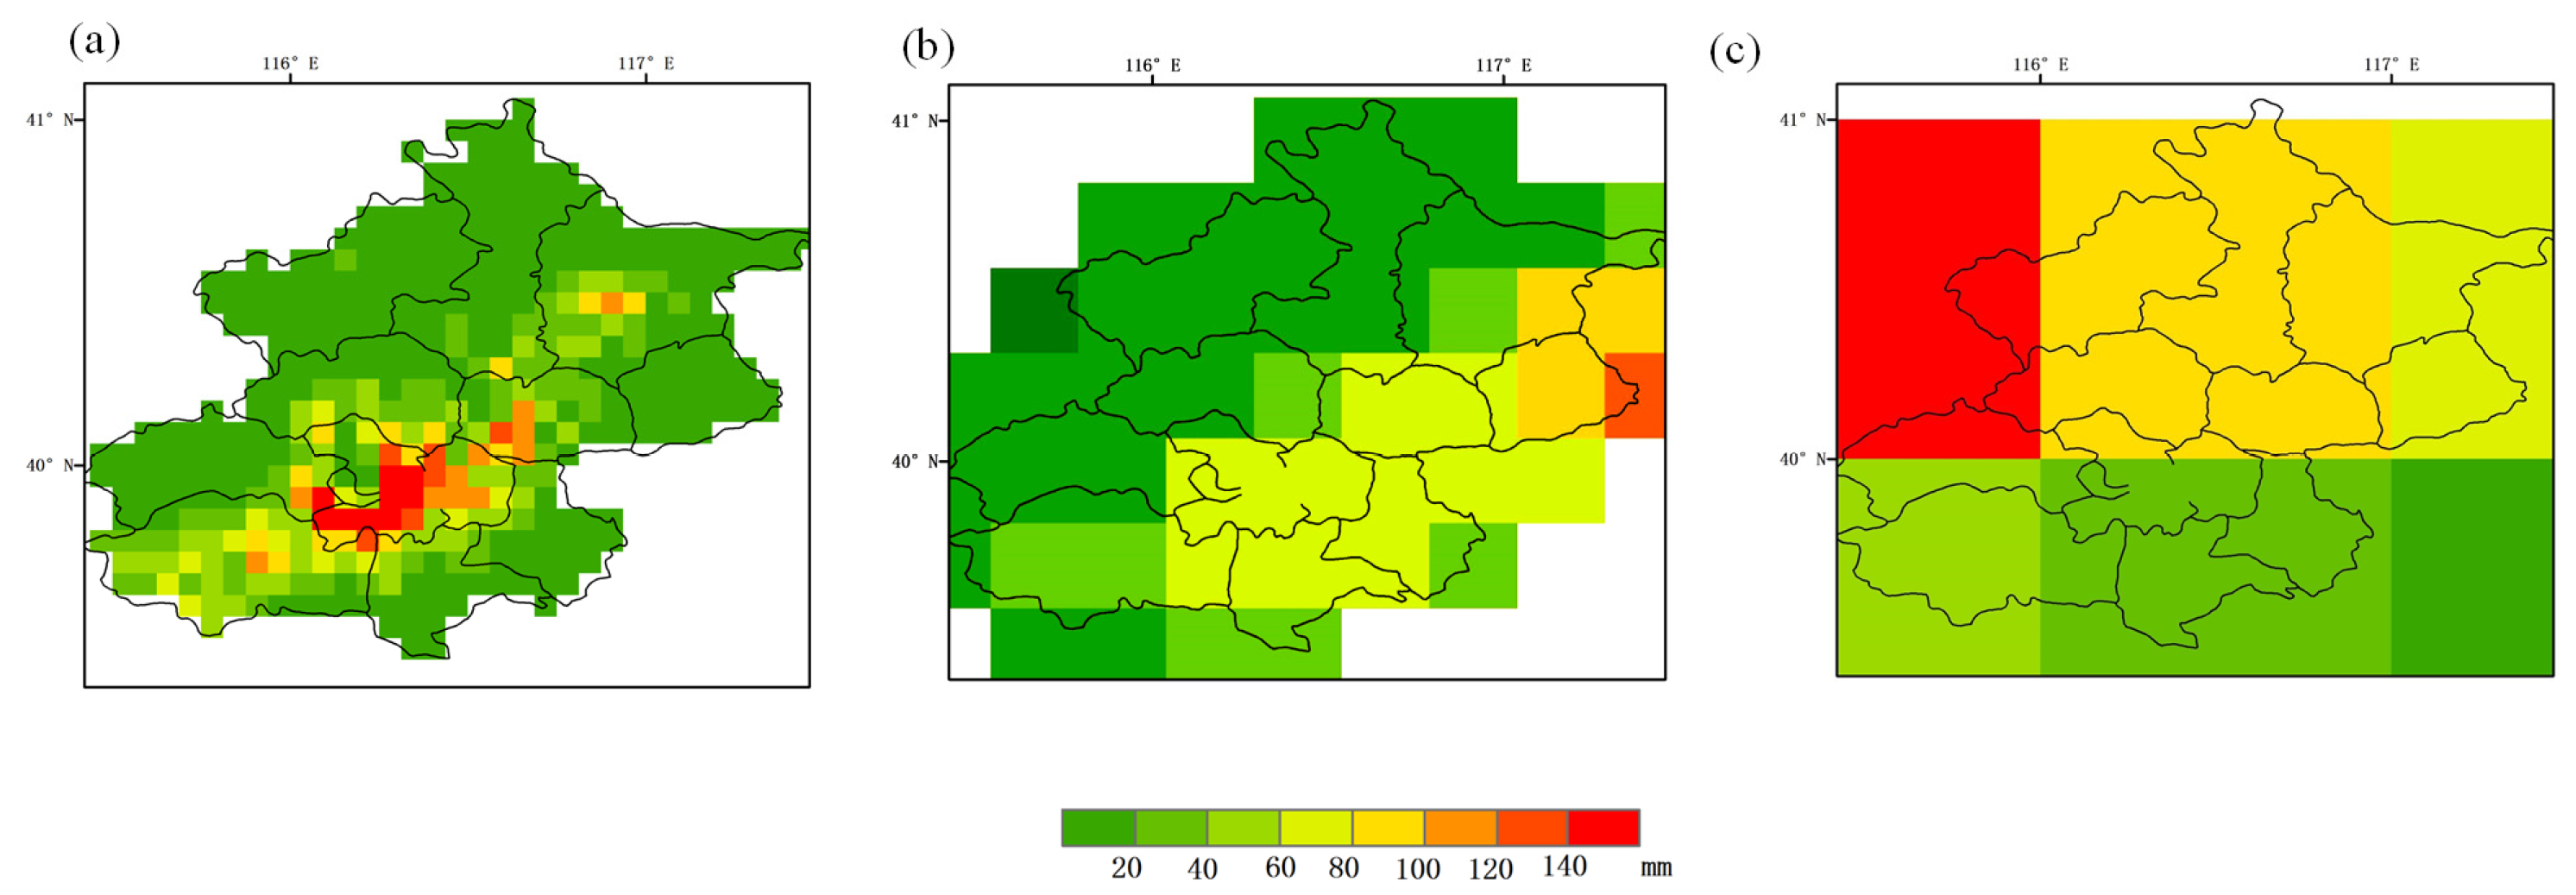
Figure 5.
Descriptive statistics of the grid numbers with different precipitation and runoff levels.
Figure 5.
Descriptive statistics of the grid numbers with different precipitation and runoff levels.

Figure 6.
Soil moisture anomalies for China (a,c,e) and Hai River Basin (b,d,f) at three resolutions: 0.0625° (a,b), 0.25° (c,d), and 1° (e,f). (g) The variability of the SM anomaly in the Hai River Basin (mean, media, standard deviation, and maximum–minimum); and (h) the drought-attacked area.
Figure 6.
Soil moisture anomalies for China (a,c,e) and Hai River Basin (b,d,f) at three resolutions: 0.0625° (a,b), 0.25° (c,d), and 1° (e,f). (g) The variability of the SM anomaly in the Hai River Basin (mean, media, standard deviation, and maximum–minimum); and (h) the drought-attacked area.

Figure 7.
Monthly SM anomaly and drought duration as a percentage of each year from 1970 to 2015 in the Hai River Basin.
Figure 7.
Monthly SM anomaly and drought duration as a percentage of each year from 1970 to 2015 in the Hai River Basin.

Figure 8.
Comparison of total water storage changes from GRACE and VIC.
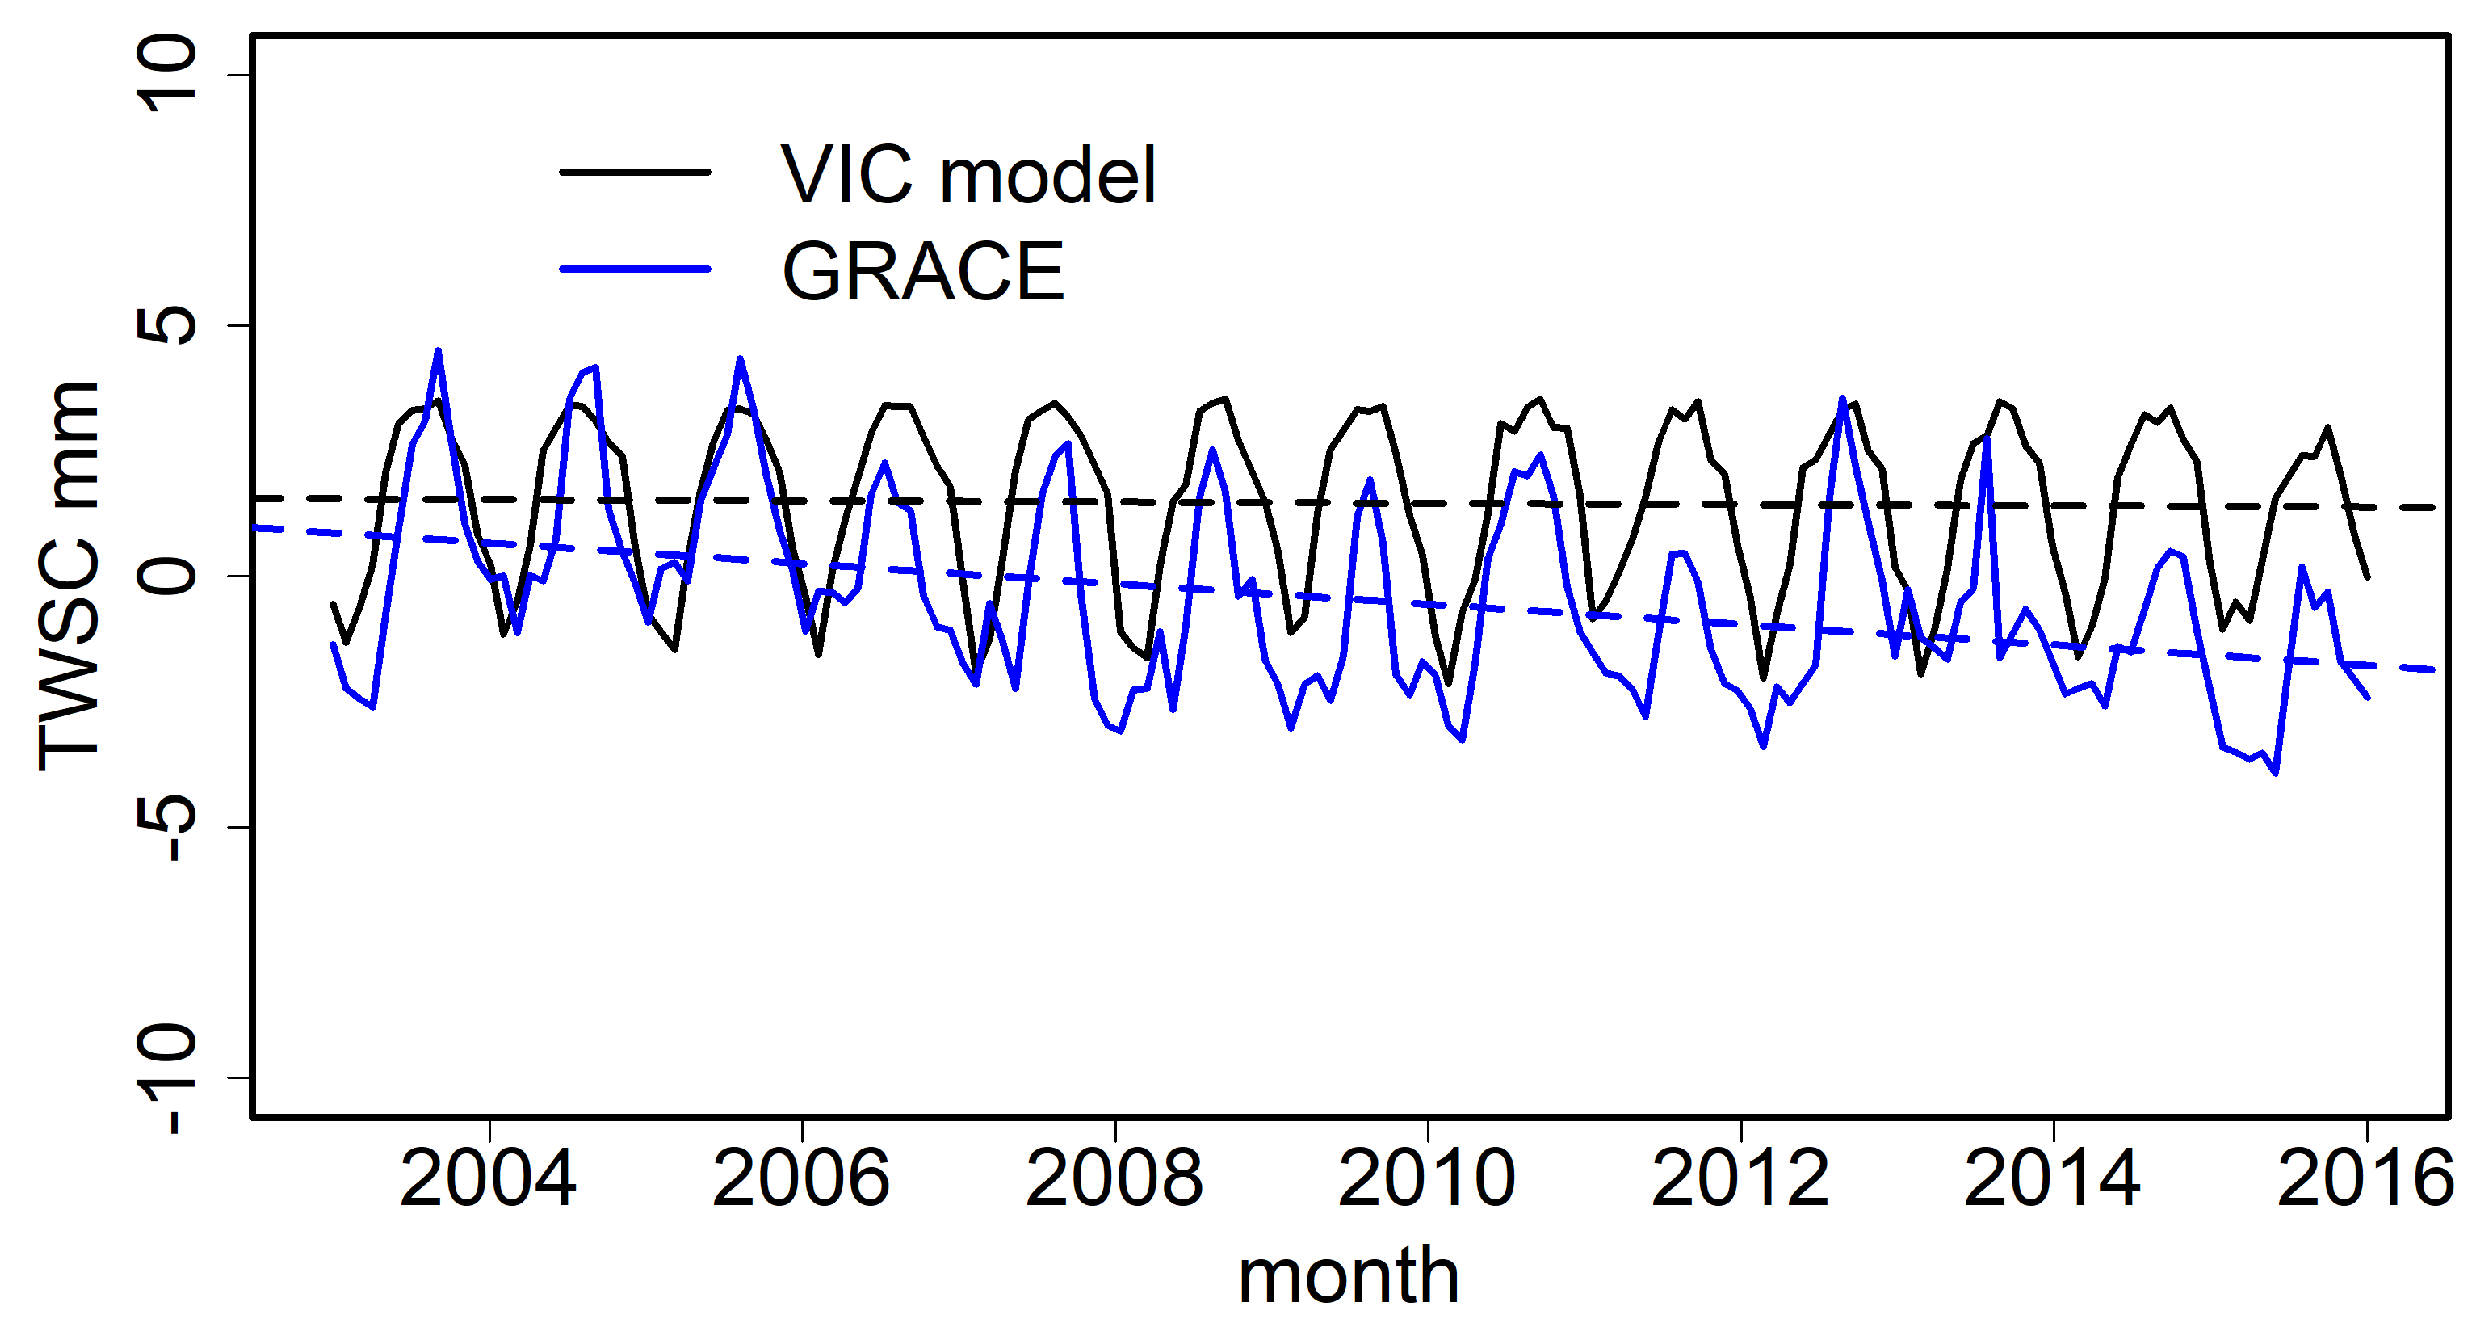
Figure 9.
The groundwater storage changes over China with 0.0625° resolution from 2003 to 2015.

Table 1.
Hydrological modeling variables.
| Variables | Resolution | Validation Datasets |
|---|---|---|
| ET | 0.0625°, daily | 33 covariance tower stations, GLASS ET products |
| SM | 66 in situ stations, ESA-CCI SM products | |
| R | 29 hydrologic gauge stations | |
| Rb |
Disclaimer/Publisher’s Note: The statements, opinions and data contained in all publications are solely those of the individual author(s) and contributor(s) and not of MDPI and/or the editor(s). MDPI and/or the editor(s) disclaim responsibility for any injury to people or property resulting from any ideas, methods, instructions or products referred to in the content. |
© 2023 by the authors. Licensee MDPI, Basel, Switzerland. This article is an open access article distributed under the terms and conditions of the Creative Commons Attribution (CC BY) license (https://creativecommons.org/licenses/by/4.0/).
Share and Cite
MDPI and ACS Style
Zhu, B.; Xie, X.; Wang, Y.; Zhao, X. The Benefits of Continental-Scale High-Resolution Hydrological Modeling in the Detection of Extreme Hydrological Events in China. Remote Sens. 2023, 15, 2402. https://doi.org/10.3390/rs15092402
AMA Style
Zhu B, Xie X, Wang Y, Zhao X. The Benefits of Continental-Scale High-Resolution Hydrological Modeling in the Detection of Extreme Hydrological Events in China. Remote Sensing. 2023; 15(9):2402. https://doi.org/10.3390/rs15092402
Chicago/Turabian StyleZhu, Bowen, Xianhong Xie, Yibing Wang, and Xuehua Zhao. 2023. "The Benefits of Continental-Scale High-Resolution Hydrological Modeling in the Detection of Extreme Hydrological Events in China" Remote Sensing 15, no. 9: 2402. https://doi.org/10.3390/rs15092402
Note that from the first issue of 2016, this journal uses article numbers instead of page numbers. See further details here.