
How Do Underwater Cultural Heritage Sites Affect Coral Assemblages?
by
 , ,
, ,
John H. R. Burns
1,*,
Kailey H. Pascoe
1,2,
Sofia B. Ferreira
1,
Haunani Kane
1,3,
Clifford Kapono
1,2,
Toni L. Carrell
4,
Andres Reyes
5,† and
Atsuko Fukunaga
1,2 1
MEGA Lab, College of Natural and Health Sciences, University of Hawaii at Hilo, Hilo, HI 96720, USA
2
Center for Global Discovery and Conservation Science, Arizona State University, Hilo, HI 96720, USA
3
School of Ocean & Earth Science & Technology, University of Hawaii at Manoa, Honolulu, HI 96822, USA
4
Ships of Discovery, Santa Fe, NM 87508, USA
5
Marine Scientist, NAVFAC Systems Command Marianas, Joint Region Marianas, Santa Rita, GU 96915, USA
*
Author to whom correspondence should be addressed.
†
Although The Matter Herein May Deal with Ongoing or Announced Policies and Programs of The Navy, Contributions by This Coauthor are The Author’s Personal Views and not Necessarily Those of The Department of Defense or Its Components.
Remote Sens. 2023, 15(8), 2130; https://doi.org/10.3390/rs15082130
Submission received: 2 March 2023
/
Revised: 11 April 2023
/
Accepted: 12 April 2023
/
Published: 18 April 2023
(This article belongs to the Special Issue Application of Remote Sensing in Cultural Heritage Research)
Abstract
:Underwater cultural heritage sites (UCH), such as shipwrecks and sunken aircrafts, can provide physical structures to support coral recruitment and habitats for marine organisms. Conversely, these archaeological artifacts can also be detrimental to live coral and release pollutants into the environment. The military history of Guam has resulted in a high abundance of UCH sites on shallow coral reef habitats, and little is known about how these artifacts may affect the ecology of these natural systems. In this study, we used photogrammetry techniques to survey coral assemblages on both natural and artificial reef substrata. We statistically examined patterns in coral cover, diversity, richness, and 3D habitat complexity. Our results found significant differences in live coral cover and assemblage structure between natural and artificial reef substrata. The results from univariate modeling and multivariate analyses indicate that coral assemblage structure plays an important role in supporting 3D habitat complexity, and the archaeological artifacts themselves can be a significant source of habitat structure. There is still a lack of clarity as to the overall implications of archaeological artifacts on underwater habitats, and the approach described here can be applied elsewhere to better understand the ecological impacts of UCH sites on coral reefs.
1. Introduction
Underwater cultural heritage (UCH) artifacts refer to physical objects from human activities found in underwater habitats, including shipwrecks, sunken aircraft, and other archaeological remains. UCH sites are often located on shallow coral reef habitats from events such as ship groundings and military activity [1,2]. These artifacts not only provide useful information about historical events but also interact with the environment and can affect ecological processes. It is difficult to determine the overall influence of UCH sites on coral reefs as these submerged artifacts can have both positive and negative impacts on living corals and habitat structure. For example, the artificial substrata created by shipwrecks or military equipment can provide physical structures that support coral recruitment and additional habitat space for a multitude of reef organisms such as fish and invertebrates [3,4,5]. UCH artifacts can also pose threats to coral reefs by causing physical damage to benthic organisms and releasing pollutants into the environment [6,7]. Live coral and three-dimensional (3D) habitat complexity play important roles in supporting biomass and biodiversity and facilitating key ecological functions on coral reefs [8,9]. Investigating patterns in habitat characteristics at UCH sites can provide valuable insights into the ecological impacts of underwater archaeological artifacts on coral reef communities.
Coral reefs throughout the global oceans have experienced declines in coral cover due to both anthropogenic and natural disturbances, which has ultimately resulted in a loss of live coral cover and subsequent reductions in 3D habitat complexity [9,10,11,12,13]. Habitat complexity plays an integral role in structuring ecological communities [14,15]. The 3D structure created by ecosystem engineers, such as living corals, creates microhabitats, which lead to greater diversity and an abundance of organisms [12,14]. Reef building corals exhibit high levels of morphological plasticity, which results in dynamic topographic complexity that maintains biodiversity and ecological function in coral reef ecosystems [16,17,18,19]. The architectural complexity of benthic habitats created by living corals supports some of the most diverse and productive ecosystems on the planet [20]. Considering the importance of healthy and diverse coral reef communities for facilitating bottom-up ecological control, it is necessary to determine if the artificial substrata created by archaeological artifacts are beneficial or detrimental to living coral assemblages and the overall habitat complexity of the reef system.
Corals exhibit varying responses to disturbance and disease. Species- or genus-specific vulnerability to stressors can result in monotypic reef dominance that can impact habitat complexity characteristics [21,22]. Corals exhibiting complex morphologies, such as branching and plating growth forms, are generally more susceptible to disturbance than slow-growing corals with less complex growth forms such as mounding and encrusting corals [17,23]. Disturbance events have been shown to detrimentally impact complex coral morphologies and cause a significant decline in multiple metrics of 3D habitat complexity [9,22,24]. More research is needed to accurately quantify relationships among coral assemblage composition and 3D structural complexity to determine how losses of certain species and morphologies may impact reef ecology. UCH sites provide a useful setting for comparing coral assemblages growing on artificial substrata to undisturbed natural reef habitats to investigate how physical alterations by humans influence coral assemblages over time, and in turn, coral morphology and 3D habitat complexity.
Coral reefs surrounding the island of Guam have a high abundance of UCH sites due to Guam’s storied maritime history and heightened military activity during World War I (WWI) and World War II (WWII). Military developments in Apra Harbor in 1944 also led to the creation of the Glass Breakwater that was built on top of the outer barrier reef, Luminao. This engineering project altered the coral reef ecosystem within Apra Harbor by restricting water flow and wave energy within the protected embayment [25,26]. The Apra Harbor region contains several large sunken ships and other artifacts from various historical eras that now serve as artificial reefs supporting coral reef communities [1,2,27] Figure 1 and Table 1. The WWI wreck was coal powered and, at the time of sinking, had little remaining coal in the bunkers, and any fuel in the WWII shipwrecks has largely dissipated and has limited to no visible traces today [1,2,27]. Several of the historic sites in Apra Harbor, most of which date to WWI and WWII, are popular sport scuba diving destinations, while outside Apra Harbor, the recreational scuba diving focus is on reefs and natural features. The abundance of UCH sites in the Apra Harbor regions creates an ideal study system to examine how archaeological artifacts influence coral assemblages and 3D habitat complexity. While it is beyond the scope of this study, it is worth mentioning that the dated substrata of UCH sites can facilitate the long-term monitoring of the biological characteristics of corals, such as growth, colonization, and succession, to extract valuable data for ecological research.
Coral reef habitats and UCH artifacts were surveyed in 2019 across multiple regions surrounding the island of Guam as part of a larger project to characterize coral reef communities and UCH sites on naval submerged lands. In this study, we specifically analyzed data from the UCH sites within the Apra Harbor region and compared them to those from natural reefs in the Apra Harbor region and the Telecommunications region (Figure 1). High wave and wind exposure in the Telecommunications region continuously flushes the shallower reef crest/slope zone while the shallower reef slope zone in Apra Harbor has calm waters year round [27]. Including data from both regions lets us examine how coral assemblages on UCH artifacts compare to both protected and exposed natural reef habitats. We believe including both regions is more informative because the consistently calm conditions and higher levels of turbidity in Apra Harbor have led to many reefs being dominated by monotypic coral assemblages with high structural complexity, which may not be representative of all natural reef habitats surrounding the island of Guam [27]. We used photogrammetry tools to create high-resolution 3D reconstructions of all study sites in order to accurately quantify reef characteristics. Specifically, structure-from-motion (SfM) algorithms were applied to render 2D imagery into 3D models as this low-cost photogrammetric method is capable of generating high-resolution orthophotos and digital elevation models (DEM) that enable the precise quantitative analysis of coral reef characteristics [28,29,30]. The resulting coral assemblage data (live coral cover, coral diversity, and richness) and 3D habitat complexity data (surface complexity, terrain ruggedness, slope, fractal dimension, and curvature) were integrated into analyses of variance, univariate statistical models, and multivariate analyses to examine patterns in reef habitats among all study sites and to determine if UCH sites influence coral reef ecology and habitat complexity. The results from this study provide insight into the ecological ramifications of UCH artifacts on coral reefs and can be scaled and adapted to other locations to properly manage and conserve marine resources.
2. Materials and Methods
2.1. Three-Dimensional Photogrammetry Surveys
Survey sites were selected using a stratified random sampling design on natural reef substrata from two regions of naval submerged lands surrounding the island of Guam: Naval Base Guam Apra Harbor (AH) and Naval Base Guam Telecommunication Sites (TS). Surveys were also conducted on artificial substrata at known UCH sites (e.g., shipwrecks and sunken aircrafts) within the AH region (Figure 1 and Table 1). Photogrammetry techniques were used to create high-resolution 3D reconstructions of the survey plots within each site. The non-intrusive photogrammetry surveys enable comprehensive characterization of benthic substrata to enhance seafloor mapping and quantitative examination of coral reef communities. Eight 2 × 2 m plots were surveyed on the natural reef sites at each randomly selected survey location within a known reef area (e.g., Orote Point). From one to three survey locations were randomly selected within each known reef area depending on the spatial size of the reef tract. For UCH sites, six 2 × 2 m plots were surveyed on the artificial substrata produced by the archaeological artifacts. Large-area surveys were also conducted to capture the entire UCH sites for documentation purposes. Overlapping images (70–80%) were collected from both planar and oblique angles of all survey areas. Images were acquired with a full frame single lens reflex camera (Sony a7rIII) equipped with a 24 mm lens while using SCUBA to swim approximately 1 m above the survey sites in a “lawn mower” pattern. Scale bars with ground control points were placed at the corners of each plot for accurate scaling and orthorectification of the resulting 3D reconstructions. Data were extracted from the 2 × 2 survey plots to statistically examine patterns in coral assemblage structure and 3D habitat complexity among sites on natural and artificial reef substrata.
2.2. 3D Reconstructions and Annotations
Three-dimensional reconstructions of the survey plots were rendered using Agisoft Metashape Software (Agisoft LLC, St. Petersburg, Russia) following methods described in Burns et al. [28]. The SfM software is able to align a series of images using scale-invariant feature transform algorithms to automatically detect static objects (“key points”) that overlap in the images to create a system of geometrical projective matrices and determine the position and orientation of each camera position [31,32]. The software reconstructs the 3D geometry on the 2D image plane using the extrinsic parameters that are calculated during the photo alignment (i.e., camera position and feature points) in conjunction with the intrinsic parameters and focal length of the camera that are extracted from the metadata of each image. The photo alignment and rectification processes create a 3D point cloud that results from the projection and intersection of pixel rays from the different positions and oriented images in a 3D space. Ground control points and scale markers were used to ensure accurate spatial reconstruction [28] of the study sites at millimeter precision. The reconstructions were then used to export high-resolution orthomosaic images and 2.5D DEMs set to a 1 cm resolution (Figure 2). These data products were integrated into geospatial software tools to annotate the orthomosaics for quantifying coral composition and extract 3D structural metrics from the associated DEMs. Coral diversity, richness, and percentage of live coral cover were calculated for each 2 × 2 m plot to facilitate comparisons in coral assemblage structure among natural reef and UCH sites. Benthic features were digitally annotated using CoralNet software tools [33] and coral colonies were identified down to genus level. Coral diversity was calculated using the Shannon diversity index (H’) and richness was calculated as the number of different species identified via annotations within each survey plot. Multiple 3D metrics (surface complexity, slope, fractal dimension, vector ruggedness measure (VRM), and profile and planform curvature) known to be important for ecological function on coral reefs [18] were extracted from the 1 cm resolution DEMs following the protocols described by Fukunaga and Burns [34].
2.3. Data Analysis
Statistical analyses of the coral assemblage data were conducted using the software package PRIMER 7 with the PERMANOVA+ add-on (PRIMER-e, Auckland, New Zealand). The survey design consisted of two factors: habitat categories (fixed with three levels, including AH, TS, and UCH) and sites (random, nested in habitat categories). Individual variables (live coral cover, coral richness, and diversity) were analyzed according to the full two-factor design using permutational analysis of variance (PERMANOVA) based on Euclidean distances with 4999 permutations of residuals under a reduced model [35,36]. PERMANOVA pairwise comparisons followed the overall partitioning when significant differences were found among the habitat categories. The structure of coral assemblages as a whole was examined using the zero-adjusted Bray–Curtis measure [37] calculated from square-root transformed live coral cover. Differences in coral assemblages among the three habitat categories were examined by PERMANOVA using the same methodology as above.
In order to characterize coral assemblages in the three habitat categories, we used similarity percentage analysis (SIMPER) to determine coral genera that typified each habitat category and those contributed to separating them [38]. Live cover of each coral genus was first averaged per survey site across plots to obtain site-level coral cover data, and Bray–Curtis similarities within each habitat category and Bray–Curtis dissimilarities among different habitat categories were broken down into the contribution from each genus. A coral genus with a high average similarity contribution and a low standard deviation indicates that the genus typifies the habitat category, while one with a high average dissimilarity contribution and a low standard deviation highly contributes to separating the habitat categories.
The metrics of 3D habitat complexity were also analyzed using PERMANOVA according to the full two-factor design. Due to a high correlation between profile and planform curvature values (Pearson correlation coefficient = 0.999), planform curvature was removed from analyses. Thus, metrics for statistical analyses included surface complexity, slope, fractal dimension, VRM, and profile curvature. A principal component analysis (PCA) was performed using standardized metrics of 3D habitat complexity to visualize the overall pattern of habitat complexity across the three habitat categories and determine which structural features explained variability among study plots across sites. Variation explained by each principal component (PC) and the corresponding coefficients for the habitat metrics indicate which 3D metrics influence variability in the 3D habitat data among the study sites on both natural and artificial substrata.
Relationships between live coral cover and metrics of 3D habitat complexity were evaluated using generalized linear mixed effects models (GLMMs) in R software. GLMMs were used to account for the hierarchical sampling design (survey plots are located within sites nested within three habitat categories (AH, TS, and UCH sites) and for potential zero inflation and overdispersion in the data. Models were constructed for all surveys from natural reef habitats and UCH artifacts to compare the relationships between live coral cover and habitat complexity on natural and artificial substrata. The site regions (AH, TS, and UCH) were included as a fixed effect in the models to determine if spatial location influenced the results.
3. Results
In total, 276 survey plots were analyzed among 11 natural reef sites and 14 UCH sites. Ground sample distance (GSD) is the distance between two consecutive pixels and provides a standard measure of spatial resolution for 3D photogrammetric reconstructions. The GSD values on the orthorectified DEMs and orthomosaics ranged from 0.2 to 0.6 mm/pixel. On average, live coral cover was highest at the AP sites (28%) followed by the TS sites (22%) and the UCH sites (8%), while coral richness and diversity were higher at the TS sites (richness = 4.5, diversity = 0.75) than the AP sites (richness = 3.4, diversity = 0.62) or the UCH sites (richness = 2.3, diversity = 0.48). Live coral cover was the only coral assemblage metric that was statistically significantly different among the three habitat categories (PERMANOVA, Pseudo-F2,21 = 6.9, p = 0.011) with pairwise comparisons showing that the UCH sites had lower values of coral cover than the natural sites in both the AH and TS regions (p < 0.05, Figure 3f), which were not significantly different from one another. The structure of the coral assemblages on the basis of the zero-adjusted Bray–Curtis measure exhibited the same pattern with UCH sites being significantly different from natural reefs in the AH and TS regions, which were not significantly different from one another (PERMANOVA, Pseudo-F2,21 = 2.9, p = 0.017). No statistically significant differences were found in the PERMANOVA analyses comparing the 3D structure metrics of the three habitat categories (Figure 3a–e).
The SIMPER analysis based on the Bray–Curtis dissimilarity confirmed the contributions of coral genera, which explains the differences in coral assemblage structure among the three study regions (Table 2 and Table 3). The average Bray–Curtis dissimilarity in coral assemblage structure on the natural reef substratum in the AP region and the artificial substrata at UCH sites was 76.5 and is attributed to differences in the abundances of Porites, Leptastrea, Montipora, Astreopora, Pocillopora, and Leptoria corals (average percent contributions to the dissimilarity of 68.9%, 6.9%, 5.2%, 4.4%, 3.1%, and 1.8%, respectively, for a cumulative contribution of 91%). Similarly, the average Bray–Curtis dissimilarity in coral assemblage structure on natural reef substrata in the TS region and artificial substrata at UCH sites was 74.8 and attributed to differences in the abundances of Porites, Montipora, Leptastrea, Millepora, Astreopora, Leptoria and Goniastrea corals (average percent contributions to the dissimilarity of 61.2%, 13.5%, 4.8%, 3.2%, 2.9%, 2.3%, and 2.1%, respectively, for the cumulative contribution of 91%). In both cases, Porites was more abundant on the natural substrata than at the UCH sites (average cover of 24% at the AP sites, 15% at the TS sites, and 5% at the UCH sites). Montipora and Leptoria were also more abundant on the natural substrata than at the UCH sites, whereas Leptastrea and Atreopora were more abundant at the UCH sites. The average Bray–Curtis similarity in coral assemblage structure on the natural reef substrata in the AP region was 43.1 and typified by the consistent presence of Porites, Leptastrea, and Montipora corals (average percent contributions to the similarity of 82.9%, 4.3%, and 3.2%, respectively, for a cumulative contribution of 90%). The average Bray–Curtis similarity in the coral assemblage structure on the natural reef substrata in the TS region was 64.9 and typified by the consistent presence of Porites and Montipora corals (average percent contributions to the similarity of 82.1% and 7.5%, respectively, for a cumulative contribution of 90%). On the other hand, the average Bray–Curtis similarity in the coral assemblage structure on the artificial reef substrata at the UCH sites was only 17.3, indicating more variable assemblages across UCH sites than the natural reef sites. The UCH sites were characterized by the consistent presence of Porites, Leptastrea, Astreopora, and Lobophyllia corals (average percent contributions to the similarity of 55.8%, 16.8%, 10.7%, and 6.7%, respectively, for a cumulative contribution of 90%). Specific contributions by coral genera to both similarity and dissimilarity in the assemblage structures among the three study regions are provided in Table 2 and Table 3.
The first two principal coordinates of the PCA on the 3D habitat complexity data cumulatively explained 87.3% of the observed variability in the habitat metrics among study plots across sites, capturing a substantial proportion of the observed variability in the reduced dimensions (Figure 4). PC1 is predominantly influenced by slope, VRM, fractal dimension, and surface complexity, while PC2 is predominantly influenced by curvature. The PCA results indicate UCH sites tend to exhibit lower values for all of the 3D habitat complexity metrics (slope, VRM, fractal dimension, and surface complexity) except for curvature, for which several sites exhibited uniquely high values.
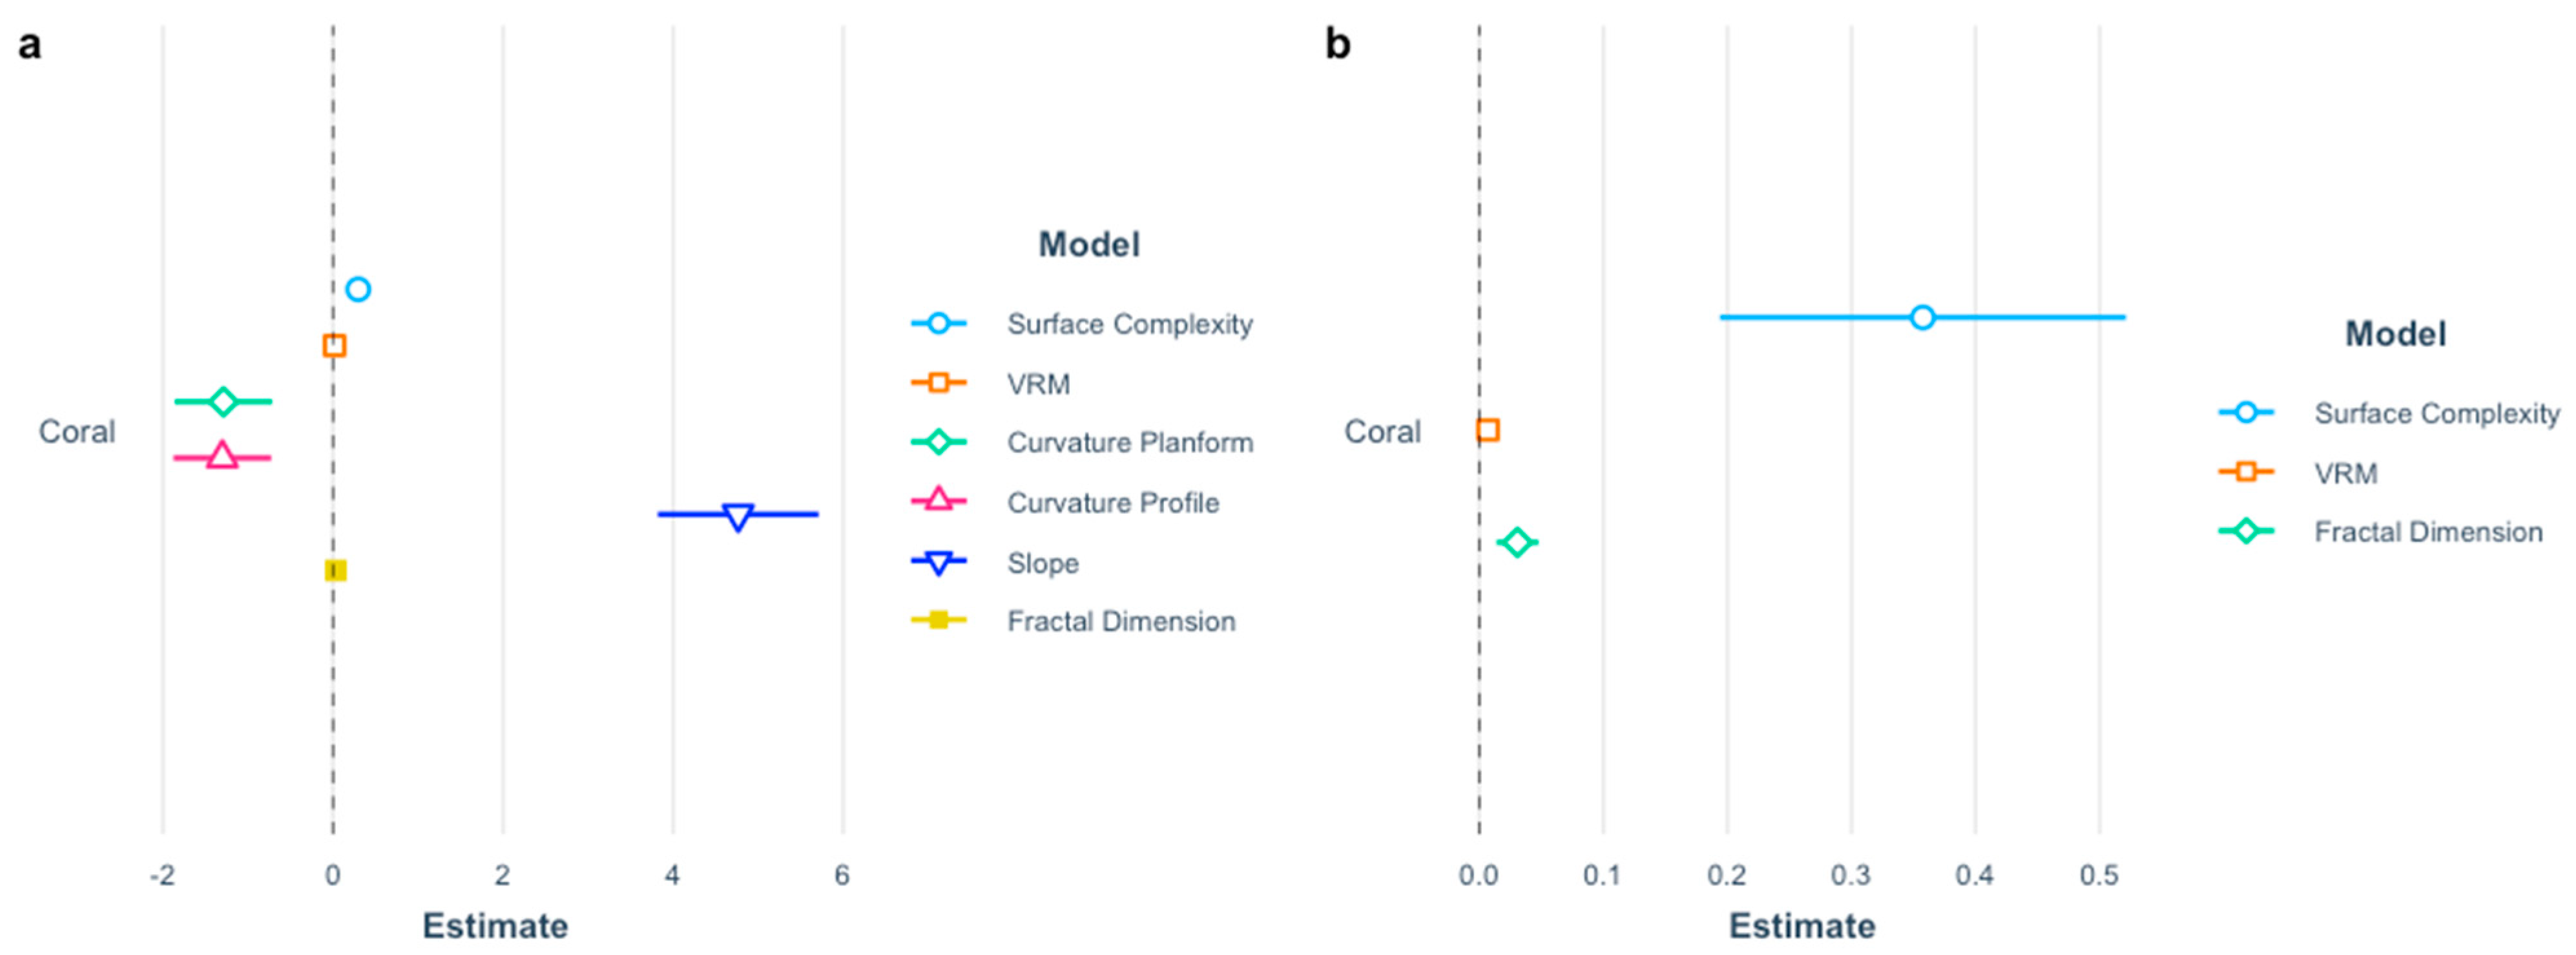
The GLMMs indicated that live coral cover influenced a different suite of 3D metrics on natural reef substrata in comparison to UCH artifacts (Figure 5). On natural reef substrata, live coral cover exhibited a statistically significant (p < 0.001) positive influence on surface complexity (β = 0.30 ± 0.04, R2 = 0.26), VRM (β = 0.02 ± 0.00, R2 = 0.50), slope (β = 4.76 ± 0.49, R2 = 0.31), and fractal dimension (β = 0.03 ± 0.00, R2 = 0.30). Live coral cover exhibited a statistically significant (p < 0.001) negative influence on profile curvature (β = −1.30 ± 0.31, R2 = 0.10). On UCH artifacts, live coral cover exhibited a statistically significant (p < 0.001) positive influence on surface complexity (β = 0.36 ± 0.09, R2 = 0.26), VRM (β = 0.01 ± 0.00, R2 = 0.14), and fractal dimension (β = 0.03 ± 0.01, R2 = 0.19).
4. Discussion
The study of artificial reef substrata created by UCH artifacts is important for understanding the complex interactions between human activities and natural ecosystems. Analyzing reef characteristics using 3D photogrammetry tools allows for deciphering how UCH artifacts influence coral assemblages and habitat structural complexity. This approach improves our understanding of the implications, both positive and negative, of UCH artifacts on coral reef ecology.
Our study compared coral assemblages growing on artificial substrata at UCH sites to natural reef substrata. We examined reefs in the semi-protected Apra Harbor (AH) region and the exposed reefs in the Telecommunications (TS) region. Integrating data from both regions allowed for a more detailed comparison of artificial reefs to natural reefs in both protected and exposed environments. We found statistically significantly higher values of live coral cover on natural reef substrata, with reefs in both the AH and TS region having more live coral cover than artificial substrata at UCH sites in the AH region (Figure 3f). We did not find any statistically significant differences among the habitat categories for coral diversity or richness, but higher values were typically observed on natural substratum sites on exposed reefs in comparison to natural reef substrata or artificial substrata in the more protected Apra Harbor sites. These findings indicate that the natural reef substrata in the TS and AH regions exhibit general patterns of coral zonation where more exposed forereef habitats tend to exhibit lower values of coral cover and higher values of diversity and richness due to more frequent wave energy disturbances [39,40].
Combining the PERMANOVA and SIMPER statistical approaches helps to comprehensively characterize factors that contribute to the observed variability in coral assemblage structure. Here, PERMANOVA tested the statistical significance of differences in assemblage structure as a whole among the three habitat categories, while SIMPER identified specific coral genera highly contributing to the observed similarities or dissimilarities in the assemblage structure. The abundance of Porites coral had the strongest role in dictating similarities or differences in assemblage patterns among the natural and artificial reef sites. At natural reef sites, similarity was also influenced by Montipora coral abundance, while conversely, Astreopora and Lobophyllia corals were drivers of similarity in assemblage structure on artificial reefs. In addition to the variability in the abundance of Porites coral, the dissimilarity between the coral assemblage structures on natural and artificial substrata was influenced by the abundance of Montipora and Leptastrea corals. Our results show that the abundance and compositional diversity of the coral assemblages clearly differentiates the artificial and natural reef substrata. The lower values of live coral cover observed on UCH sites, and the distinct difference in coral assemblage structure, may be due to the artificial substrata both limiting coral growth and selectively supporting the recruitment of species that typically have a lower abundance on natural substrata. The physical characteristics and material comprising the artificial substrata might also contribute to the higher average dissimilarity in the coral assemblages across the UCH sites than the natural reef sites. It is important to characterize these differences in assemblage structure because the morphological growth forms produced by living corals are highly diverse and play an important role in shaping the architectural framework of reefs and supporting multiple ecological functions.
Habitat metrics including surface complexity, slope, fractal dimension, and VRM have been found to be influenced by live coral cover and play an important role in facilitating habitat complexity and supporting the abundance and diversity of reef organisms [8,9,18,19,41]. Despite the unique assemblage structures and differences in the live coral cover on the natural and artificial substrata, we found no statistically significant differences in the 3D structural metrics among the three habitat categories. While this could be an indication that artificial reefs sufficiently mimic natural reefs in terms of structural complexity, interpretations of the results may require some caution. Sites on both the natural and artificial substrata exhibited among-site variability in all values of 3D habitat complexity, as well as within-site variability in some cases (Figure 3a–e). Such variability was also apparent in the PCA plot (Figure 4). In the PCA analysis, the UCH sites typically had lower structural complexity values (surface complexity, fractal dimensionality, slope, and VRM) along PC1, but the plot with the lowest PC1 score (i.e., highest complexity) was also from a UCH site (Figure 4, left bottom of the plot). Along PC2, one plot at a UCH site exhibited uniquely high values of curvature. As coral reefs are highly structurally heterogeneous, the choice of plot size, as well as the number of plots per site, for extracting habitat metrics likely has considerable effects on the capacity to capture the habitat characteristics of each site. Given the differences in the sizes of artificial reefs, further studies are warranted to investigate the appropriate plot sizes when comparing structural complexity among different types of artificial reefs or between natural and artificial reefs.
The generalized linear mixed effects models found live coral cover to be a significant driver of all 3D metrics of habitat complexity for natural reefs. Interestingly, slope and curvature were only affected by live coral on natural reef substrata (Figure 5). Curvature is the second derivative of surface elevation and represents rates of change in slope. These values represent the concave and convex curvature of the reef substrata from both overhead and side-angle perspectives. The negative association between live coral cover and curvature suggests that increases in live coral cover on natural substrata influence the concavity and convexity of the reef surface, resulting in higher values of heterogeneity and complexity of the substrata. Given that the GLMM found live coral to significantly influence slope and curvature on natural reef substrata but not on artificial substrata, and that there were no statistically significant differences in these 3D habitat metrics among the three habitat categories, our results collectively indicate that the physical structures of the UCH artifacts themselves can provide some levels of slope and curvature to make them comparable to those of natural reefs, and that habitat complexity at the UCH sites is not solely dependent on living coral.
The artificial substratum material of UCH sites can impact coral growth and survival, with metal materials typically supporting the lowest rates of growth, settlement, and survival in comparison to concrete and rubber debris [42,43]. These documented trends seem applicable at the UCH sites used in this study, as the artificial substrata were primarily metal and exhibited significantly lower values of live coral cover in comparison to natural reefs in our statistical analysis. Only the Barge Glass Breakwater site, which is primarily composed of an artificial concrete substratum, had relatively high values of coral cover (Figure 3f). It is possible that the limited capacity for coral growth on the UCH substrata resulted in the tendency for the UCH sites to have lower values of structural complexity (Figure 4, along PC1) and for live coral to not be a statistically significant driver of slope and curvature on artificial substrata (Figure 5). The amorphous shapes of coral morphologies are known to contribute to 3D metrics of habitat complexity on reef habitats [34], and the reduced coral growth on artificial substrata [42] may hinder the contribution of corals to habitat complexity at UCH sites. The results from the GLMMs suggest that the importance of live coral for 3D habitat complexity is more pronounced on natural substrata, and that UCH artifacts themselves can be significant sources of habitat structure, particularly in regard to slope and curvature. More detailed analyses of the structure provided by UCH artifacts across a range of spatial scales will be required to determine if artificial habitat complexity can offset the reduction in complexity provided by living corals.
While coral diversity is often thought to be positively related to reef complexity due to a variety of morphological growth forms [15], our data suggest that 3D structural complexity at the natural and artificial substrata within these regions of Guam are driven primarily by a few dominant coral genera, such as Porites. Although monotypic reefs have the potential to be more vulnerable to disturbances [44,45], Porites coral has been shown to be resilient to bleaching and paling compared to other common coral species and may offset the overall vulnerability of these habitats to stressors [23]. Investigating how coral cover, diversity, and 3D habitat complexity are interconnected can assist with developing targeted conservation strategies at these monotypic sites to ensure that environmental stressors are not compromising coral health. Considering the connection of live coral to 3D complexity on both natural and artificial substrata, both natural reefs and UCH sites could lose important structural complexity if dominant coral genera were detrimentally impacted by natural and anthropogenic disturbances.
There is still a lack of clarity as to whether the positive benefits of artificial reef structures created by UCH sites, such as providing substrata for the recruitment of sessile organisms and 3D habitats for mobile organisms, outweigh the potential negative effects associated with pollution and damage to natural reef substrata [4,5]. This study highlights the value of integrating non-invasive photogrammetric tools to conduct high-resolution analyses of relationships among substratum type, coral assemblage composition, and 3D habitat complexity. Our approach here can be scaled to other systems to critically evaluate the benefits of UCH artificial substrata for supporting coral growth and reef biodiversity, as well as the possible impacts on natural reef habitats. Integrating assessments of fish and other reef organisms will provide more useful information on how habitat dynamics alter overall reef biodiversity and ecosystem function.
5. Conclusions
The photogrammetry techniques outlined in this study illustrate how high-resolution 3D reconstructions of benthic habitats can enhance both ecological and archaeological studies in underwater environments. The statistical approach used here to analyze 3D data products can decipher the specific benthic features contributing to multiple metrics of 3D habitat complexity. These results equip scientists with the ability to determine specific coral morphologies, benthic features, and types or forms of cultural artifacts that provide habitat structures, which can promote the abundance and diversity of marine organisms. While the goals of this study were specifically designed to compare coral assemblage structure and 3D habitat complexity on artificial and natural substrata, these analytical tools can be used in other studies to improve our understanding of how artificial habitats influence the ecology of underwater ecosystems. Coupling these methods with chemical pollutant analyses and long-term studies will greatly assist with determining the positive and negative environmental impacts of underwater cultural heritage sites.
Author Contributions
Conceptualization, J.H.R.B. and K.H.P.; methodology, J.H.R.B. and K.H.P.; formal analysis, K.H.P., S.B.F., A.F. and J.H.R.B.; resources, J.H.R.B., H.K. and C.K.; data curation, K.H.P. and S.B.F.; writing—original draft preparation, J.H.R.B. and K.H.P.; writing—review and editing, J.H.R.B., K.H.P., S.B.F., H.K., C.K., A.R., A.F. and T.L.C.; project administration, J.H.R.B., K.H.P., C.K. and A.R.; funding acquisition, J.H.R.B. All authors have read and agreed to the published version of the manuscript.
Funding
This work was funded by the Department of Navy on behalf of Joint Region Marianas, Guam under Cooperative Agreement Number N40192-18-2-8008.
Data Availability Statement
Data can be made available upon request pending authorization by the Department of Navy on behalf of Joint Region Marianas, Guam.
Acknowledgments
We thank the students at the Multiscale Environmental Graphical Analysis (MEGA) Laboratory at the University of Hawaii at Hilo for their assistance in processing data. We also thank Gen-X Sports and Ships of Discovery for their assistance with field work and data collection.
Conflicts of Interest
The authors declare no conflict of interest.
References
- Carrell, T. Submerged Cultural Resources Assessment of Micronesia; Southwest Region, Southwest Cultural Resources Center, Submerged Cultural Resources Unit; National Park Service: Santa Fe, NM, USA, 1991; Volume 3. [Google Scholar]
- Carrell, T. Maritime History and Archaeology of the Commonwealth of the Northern Mariana Islands; Ships of Exploration and Discovery Research: Santa Fe, NM, USA, 2009. [Google Scholar]
- Consoli, P.; Martino, A.; Romeo, T.; Sinopoli, M.; Perzia, P.; Canese, S.; Vivona, P.; Andaloro, F. The effect of shipwrecks on associated fish assemblages in the central Mediterranean Sea. J. Mar. Biol. Assoc. U. K. 2015, 95, 17–24. [Google Scholar] [CrossRef]
- Van der Schyff, V.; Du Preez, M.; Blom, K.; Kylin, H.; Yive, N.S.C.K.; Merven, J.; Raffin, J.; Bouwman, H. Impacts of a shallow shipwreck on a coral reef: A case study from St. Brandon’s Atoll, Mauritius, Indian Ocean. Mar. Environ. Res. 2020, 156, 104916. [Google Scholar] [CrossRef] [PubMed]
- Asner, G.P.; Giardina, S.F.; Balzotti, C.; Drury, C.; Hopson, S.; Martin, R.E. Are Sunken Warships Biodiversity Havens for Corals? Diversity 2022, 14, 139. [Google Scholar] [CrossRef]
- Kelly, L.W.; Barott, K.L.; Dinsdale, E.; Friedlander, A.M.; Nosrat, B.; Obura, D.; Sala, E.; Sandin, S.A.; Smith, J.E.; Vermeij, M.J.A.; et al. Black reefs: Iron-induced phase shifts on coral reefs. ISME J. 2012, 6, 638–649. [Google Scholar] [CrossRef]
- Burns, J.H.R.; Bahr, K.D.; Fukunaga, A.; Swatland, D.; Kosaki, R. Innovative 3D Imaging Tools for Assessing Damages to Coral Reef Habitats Caused by Grounding Events; DOC Marine Conservation Services Series; The National Science Foundation: Alexandria, VA, USA, 2018. [Google Scholar]
- Fukunaga, A.; Kosaki, R.K.; Pascoe, K.H.; Burns, J.H.R. Fish assemblage structure in the Northwestern Hawaiian Islands is associated with the architectural complexity of coral-reef habitats. Diversity 2020, 12, 430. [Google Scholar] [CrossRef]
- Pascoe, K.H.; Fukunaga, A.; Kosaki, R.K.; Burns, J.H.R. 3D assessment of a coral reef at Lalo Atoll reveals varying responses of habitat metrics following a catastrophic hurricane. Sci. Rep. 2021, 11, 12050. [Google Scholar] [CrossRef]
- Lorenzo, A.-F.; Dulvy, N.K.; Gill, J.A.; Côté, I.M.; Watkinson, A.R. Flattening of Caribbean coral reefs: Region-wide declines in architectural complexity. Proc. R. Soc. B Biol. Sci. 2009, 276, 3019–3025. [Google Scholar]
- Graham, N.A.J.; Nash, K.L. The importance of structural complexity in coral reef ecosystems. Coral Reefs 2013, 32, 315–326. [Google Scholar] [CrossRef]
- Graham, N.A.J.; Jennings, S.; MacNeil, M.A.; Mouillot, D.; Wilson, S.K. Predicting climate-driven regime shifts versus rebound potential in coral reefs. Nature 2015, 518, 94–97. [Google Scholar] [CrossRef]
- Couch, C.S.; Burns, J.H.R.; Liu, G.; Steward, K.; Gutlay, T.N.; Kenyon, J.; Eakin, C.M.; Kosaki, R.K. Mass coral bleaching due to unprecedented marine heatwave in Papahānaumokuākea Marine National Monument (Northwestern Hawaiian Islands). PLoS ONE 2017, 12, e0185121. [Google Scholar] [CrossRef]
- Wilson, E.O.; MacArthur, R.H. The Theory of Island Biogeography; Princeton University Press: Princeton, NJ, USA, 2016. [Google Scholar]
- Bruno, J.F. Habitat modification and facilitation in benthic marine communities. In Marine Community Ecology; Sinauer Associates: Sunderland, MA, USA, 2001; pp. 201–218. [Google Scholar]
- Alvarez-Filip, L.; Dulvy, N.K.; Côté, I.M.; Watkinson, A.R.; Gill, J.A. Coral identity underpins architectural complexity on Caribbean reefs. Ecol. Appl. 2011, 21, 2223–2231. [Google Scholar] [CrossRef]
- Gates, R.D.; Ainsworth, T.D. The nature and taxonomic composition of coral symbiomes as drivers of performance limits in scleractinian corals. J. Exp. Mar. Biol. Ecol. 2011, 408, 94–101. [Google Scholar] [CrossRef]
- Fukunaga, A.; Burns, J.H.R.; Pascoe, K.H.; Kosaki, R.K. Associations between benthic cover and habitat complexity metrics obtained from 3D reconstruction of coral reefs at different resolutions. Remote Sens. 2020, 12, 1011. [Google Scholar] [CrossRef]
- Helder, N.K.; Burns, J.H.R.; Green, S.J. Intra-habitat structural complexity drives the distribution of fish trait groups on coral reefs. Ecol. Indic. 2022, 142, 109266. [Google Scholar] [CrossRef]
- Hoegh-Guldberg, O.; Mumby, P.J.; Hooten, A.J.; Steneck, R.S.; Greenfield, P.; Gomez, E.; Harvell, C.D.; Sale, P.F.; Edwards, A.J.; Caldeira, K.; et al. Coral reefs under rapid climate change and ocean acidification. Science 2007, 318, 1737–1742. [Google Scholar] [CrossRef]
- Pratchett, M.S.; Trapon, M.; Berumen, M.L.; Chong-Seng, K. Recent disturbances augment community shifts in coral assemblages in Moorea, French Polynesia. Coral Reefs 2011, 30, 183–193. [Google Scholar] [CrossRef]
- Magel, J.M.T.; Burns, J.H.R.; Gates, R.D.; Baum, J.K. Effects of bleaching-associated mass coral mortality on reef structural complexity across a gradient of local disturbance. Sci. Rep. 2019, 9, 2512. [Google Scholar] [CrossRef]
- Padilla-Gamiño, J.L.; Hanson, K.M.; Stat, M.; Gates, R.D. Phenotypic plasticity of the coral Porites rus: Acclimatization responses to a turbid environment. J. Exp. Mar. Biol. Ecol. 2012, 434, 71–80. [Google Scholar] [CrossRef]
- Burns, J.H.R.; Delparte, D.; Kapono, L.; Belt, M.; Gates, R.D.; Takabayashi, M. Assessing the impact of acute disturbances on the structure and composition of a coral community using innovative 3D reconstruction techniques. Methods Oceanogr. 2016, 15, 49–59. [Google Scholar] [CrossRef]
- Carr, J.H. Final Report [Apra Harbor, Guam]; California Institute of Technology: Pasadena, CA, USA, 1954. [Google Scholar]
- Nelson, D.S.; McManus, J.; Richmond, R.H.; King, D.B., Jr.; Gailani, J.Z.; Lackey, T.C.; Bryant, D. Predicting dredging-associated effects to coral reefs in Apra Harbor, Guam–Part 2: Potential coral effects. J. Environ. Manag. 2016, 168, 111–122. [Google Scholar] [CrossRef]
- Schils, T.; Houk, P.; Biggs, J.; Donaldson, T.; Kense, A.; McLean, M. Marine Resources Surveys of Naval Base Guam and Naval Support Activity Andersen Air Force Base; ResearchGate: Berlin, Germany, 2017; Volume 158. [Google Scholar]
- Burns, J.H.R.; Delparte, D.; Gates, R.D.; Takabayashi, M. Integrating structure-from-motion photogrammetry with geospatial software as a novel technique for quantifying 3D ecological characteristics of coral reefs. PeerJ 2015, 3, e1077. [Google Scholar] [CrossRef] [PubMed]
- Figueira, W.; Ferrari, R.; Weatherby, E.; Porter, A.; Hawes, S.; Byrne, M. Accuracy and precision of habitat structural complexity metrics derived from underwater photogrammetry. Remote Sens. 2015, 7, 16883–16900. [Google Scholar] [CrossRef]
- Fukunaga, A.; Burns, J.H.R.; Craig, B.K.; Kosaki, R.K. Integrating three-dimensional benthic habitat characterization techniques into ecological monitoring of coral reefs. J. Mar. Sci. Eng. 2019, 7, 27. [Google Scholar] [CrossRef]
- Verhoeven, G. Getting computer vision airborne: Using structure from motion for accurate orthophoto production. RSPSoc Archaeol. Spec. Interest Group Meet. Spring 2012, 2012, 4–6. [Google Scholar]
- Westoby, M.J.; Brasington, J.; Glasser, N.F.; Hambrey, M.J.; Reynolds, J.M. ‘Structure-from-Motion’photogrammetry: A low-cost, effective tool for geoscience applications. Geomorphology 2012, 179, 300–314. [Google Scholar] [CrossRef]
- Beijbom, O.; Edmunds, P.J.; Roelfsema, C.; Smith, J.; Kline, D.I.; Neal, B.P.; Dunlap, M.J.; Moriarty, V.; Fan, T.Y.; Tan, C.J.; et al. Towards automated annotation of benthic survey images: Variability of human experts and operational modes of automation. PLoS ONE 2015, 10, e0130312. [Google Scholar] [CrossRef]
- Fukunaga, A.; Burns, J.H.R. Metrics of coral reef structural complexity extracted from 3D mesh models and digital elevation models. Remote Sens. 2020, 12, 2676. [Google Scholar] [CrossRef]
- Anderson, M.J. A new method for non-parametric multivariate analysis of variance. Austral Ecol. 2001, 26, 32–46. [Google Scholar]
- McArdle, B.H.; Anderson, M.J. Fitting multivariate models to community data: A comment on distance-based redundancy analysis. Ecology 2001, 82, 290–297. [Google Scholar] [CrossRef]
- Clarke, K.R.; Somerfield, P.J.; Chapman, M.G. On resemblance measures for ecological studies, including taxonomic dissimilarities and a zero-adjusted Bray–Curtis coefficient for denuded assemblages. J. Exp. Mar. Biol. Ecol. 2006, 330, 55–80. [Google Scholar] [CrossRef]
- Clarke, K.R.; Warwick, R.M. Change in marine communities. Approach Stat. Anal. Interpret. 2001, 2, 1–68. [Google Scholar]
- Jackson, J.B.C. Adaptation and diversity of reef corals. BioScience 1991, 41, 475–482. [Google Scholar]
- Williams, G.J.; Smith, J.E.; Conklin, E.J.; Gove, J.M.; Sala, E.; Sandin, S.A. Benthic communities at two remote Pacific coral reefs: Effects of reef habitat, depth, and wave energy gradients on spatial patterns. PeerJ 2013, 1, e81. [Google Scholar] [CrossRef]
- Fukunaga, A.; Pascoe, K.H.; Pugh, A.R.; Kosaki, R.K.; Burns, J.H.R. Underwater photogrammetry captures the initial recovery of a coral reef at Lalo Atoll. Diversity 2022, 14, 39. [Google Scholar] [CrossRef]
- Fitzhardinge, R.C.; Bailey-Brock, J.H. Colonization of artificial reef materials by corals and other sessile organisms. Bull. Mar. Sci. 1989, 44, 567–579. [Google Scholar]
- Kaufman, L.S. If you build it, will they come? Toward a concrete basis for coral reef gardening. In Coral Reef Restoration Handbook; CRC Press: Boca Raton, FL, USA, 2006; pp. 119–142. [Google Scholar]
- Ninio, R.; Meekan, M. Spatial patterns in benthic communities and the dynamics of a mosaic ecosystem on the Great Barrier Reef, Australia. Coral Reefs 2002, 21, 95–104. [Google Scholar] [CrossRef]
- Tkachenko, K.S.; Wu, B.-J.; Fang, L.-S.; Fan, T.-Y. Dynamics of a coral reef community after mass mortality of branching Acropora corals and an outbreak of anemones. Mar. Biol. 2007, 151, 185–194. [Google Scholar] [CrossRef]
Figure 1.
Study sites are in the protected Apra Harbor region (left) on both natural (blue) and artificial (orange) substrata. Natural reef sites from exposed reef habitats were surveyed in the Telecommunications region (right).
Figure 1.
Study sites are in the protected Apra Harbor region (left) on both natural (blue) and artificial (orange) substrata. Natural reef sites from exposed reef habitats were surveyed in the Telecommunications region (right).
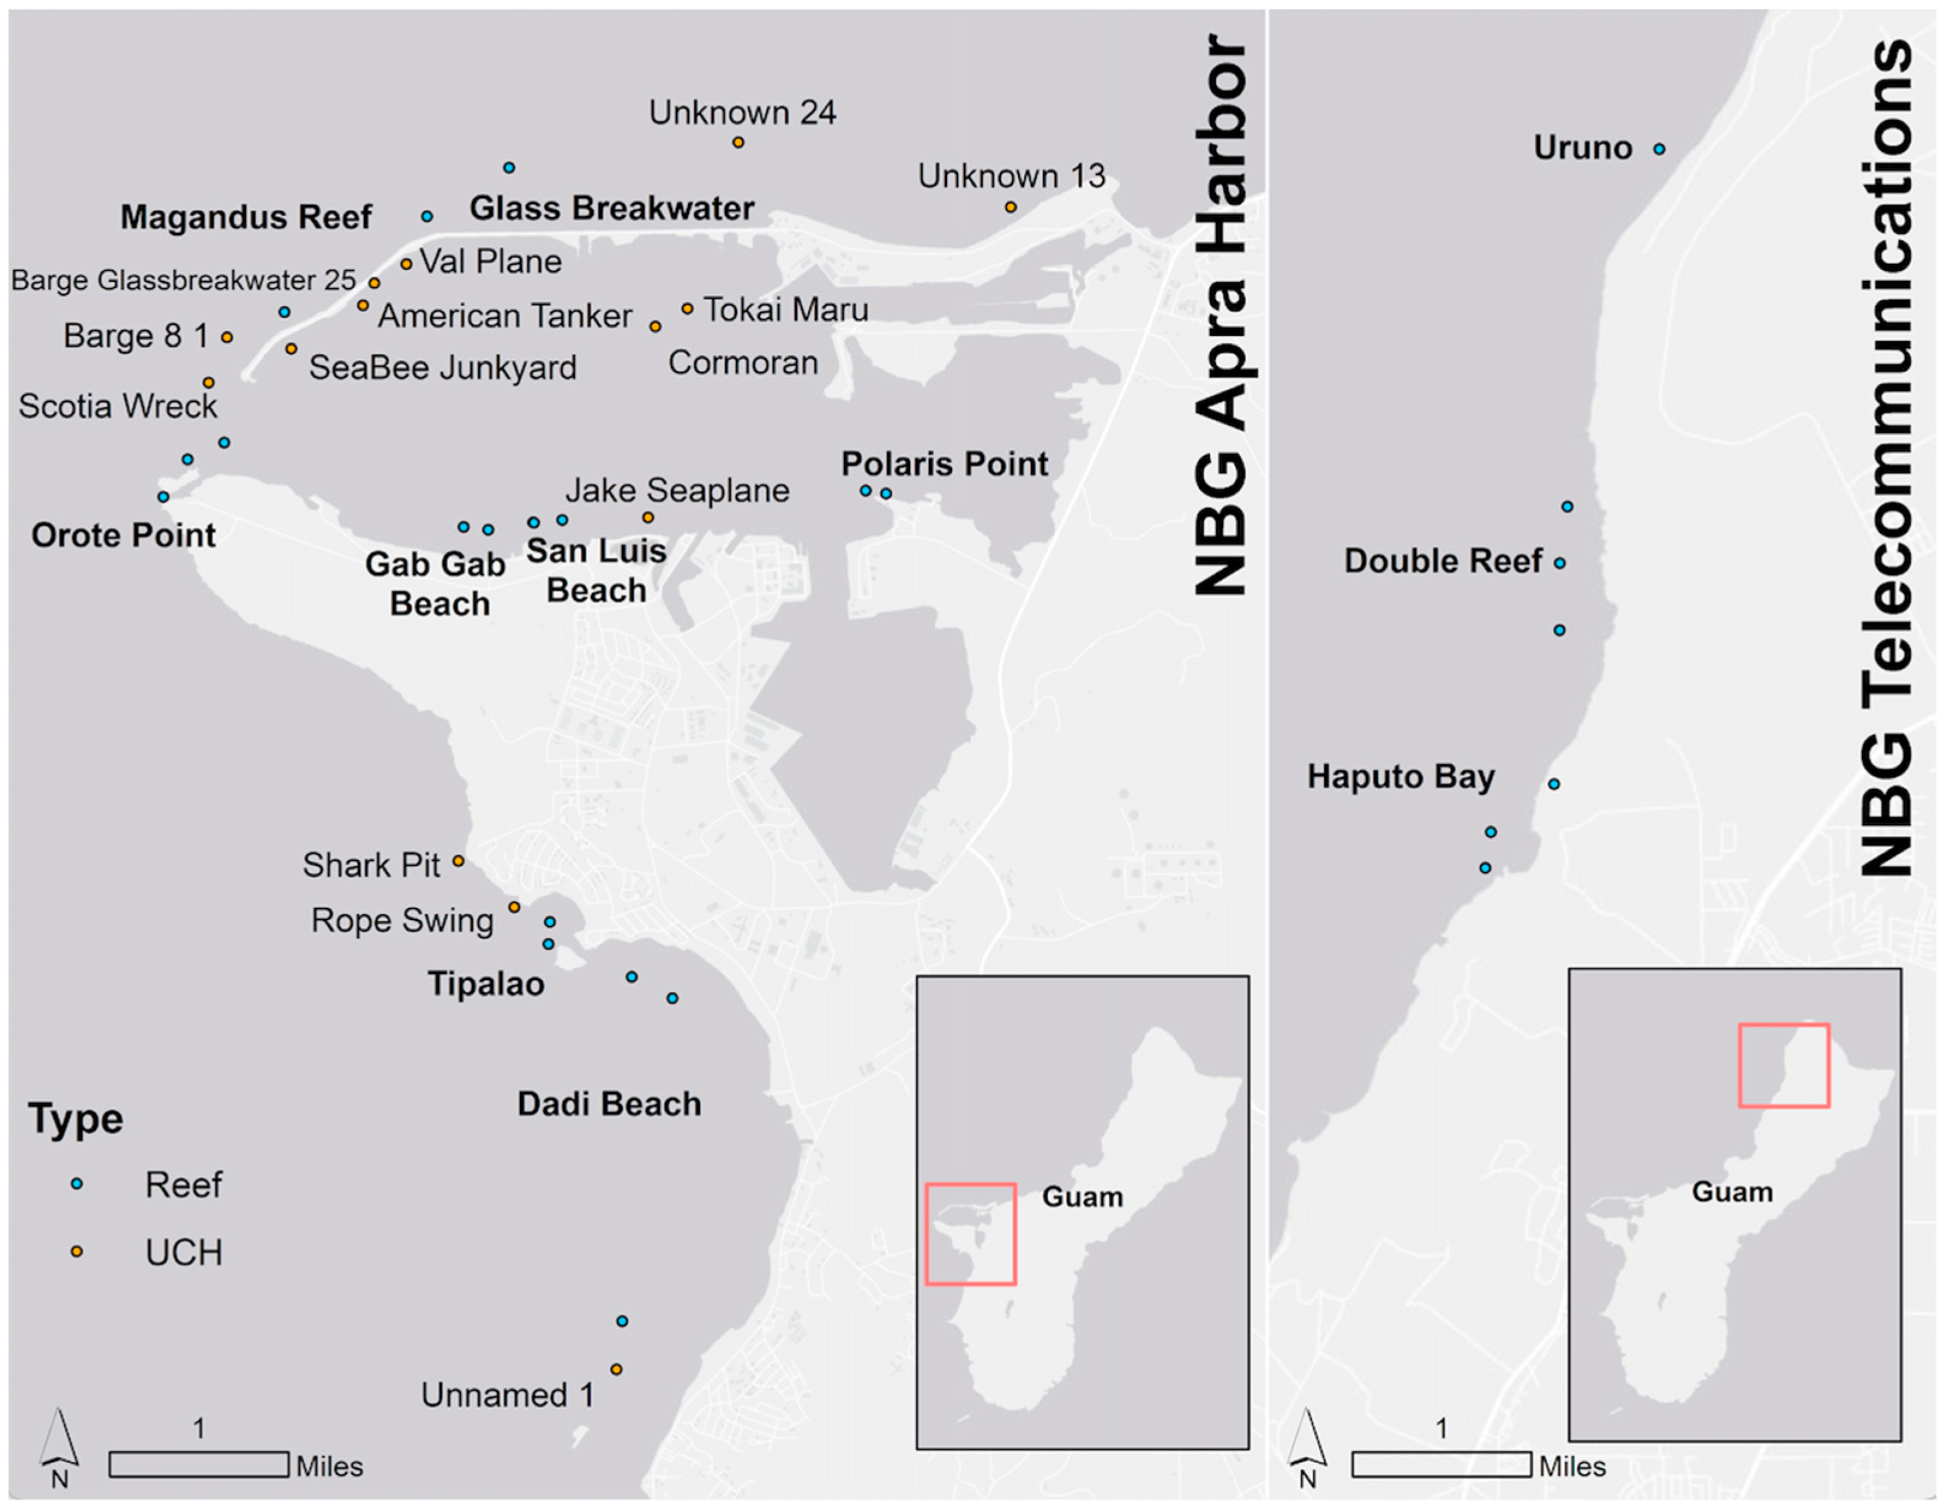
Figure 2.
Examples of data products derived from 3D reconstructions of the benthic habitats in this study. Digital elevation models (left) are used to extract multiple metrics of 3D habitat complexity, and orthomosaics (right) are used for digital annotations to quantify coral assemblage structure.
Figure 2.
Examples of data products derived from 3D reconstructions of the benthic habitats in this study. Digital elevation models (left) are used to extract multiple metrics of 3D habitat complexity, and orthomosaics (right) are used for digital annotations to quantify coral assemblage structure.

Figure 3.
Comparison of 3D metrics of structural complexity (a) surface complexity, (b) slope, (c) fractal dimension, (d) vector ruggedness measure, and (e) profile curvature) and coral assemblage structure metrics (f) coral cover (%), (g) diversity (H’), and (h) richness) among all natural and artificial reef sites within the three study regions (AH, TS, and UCH).
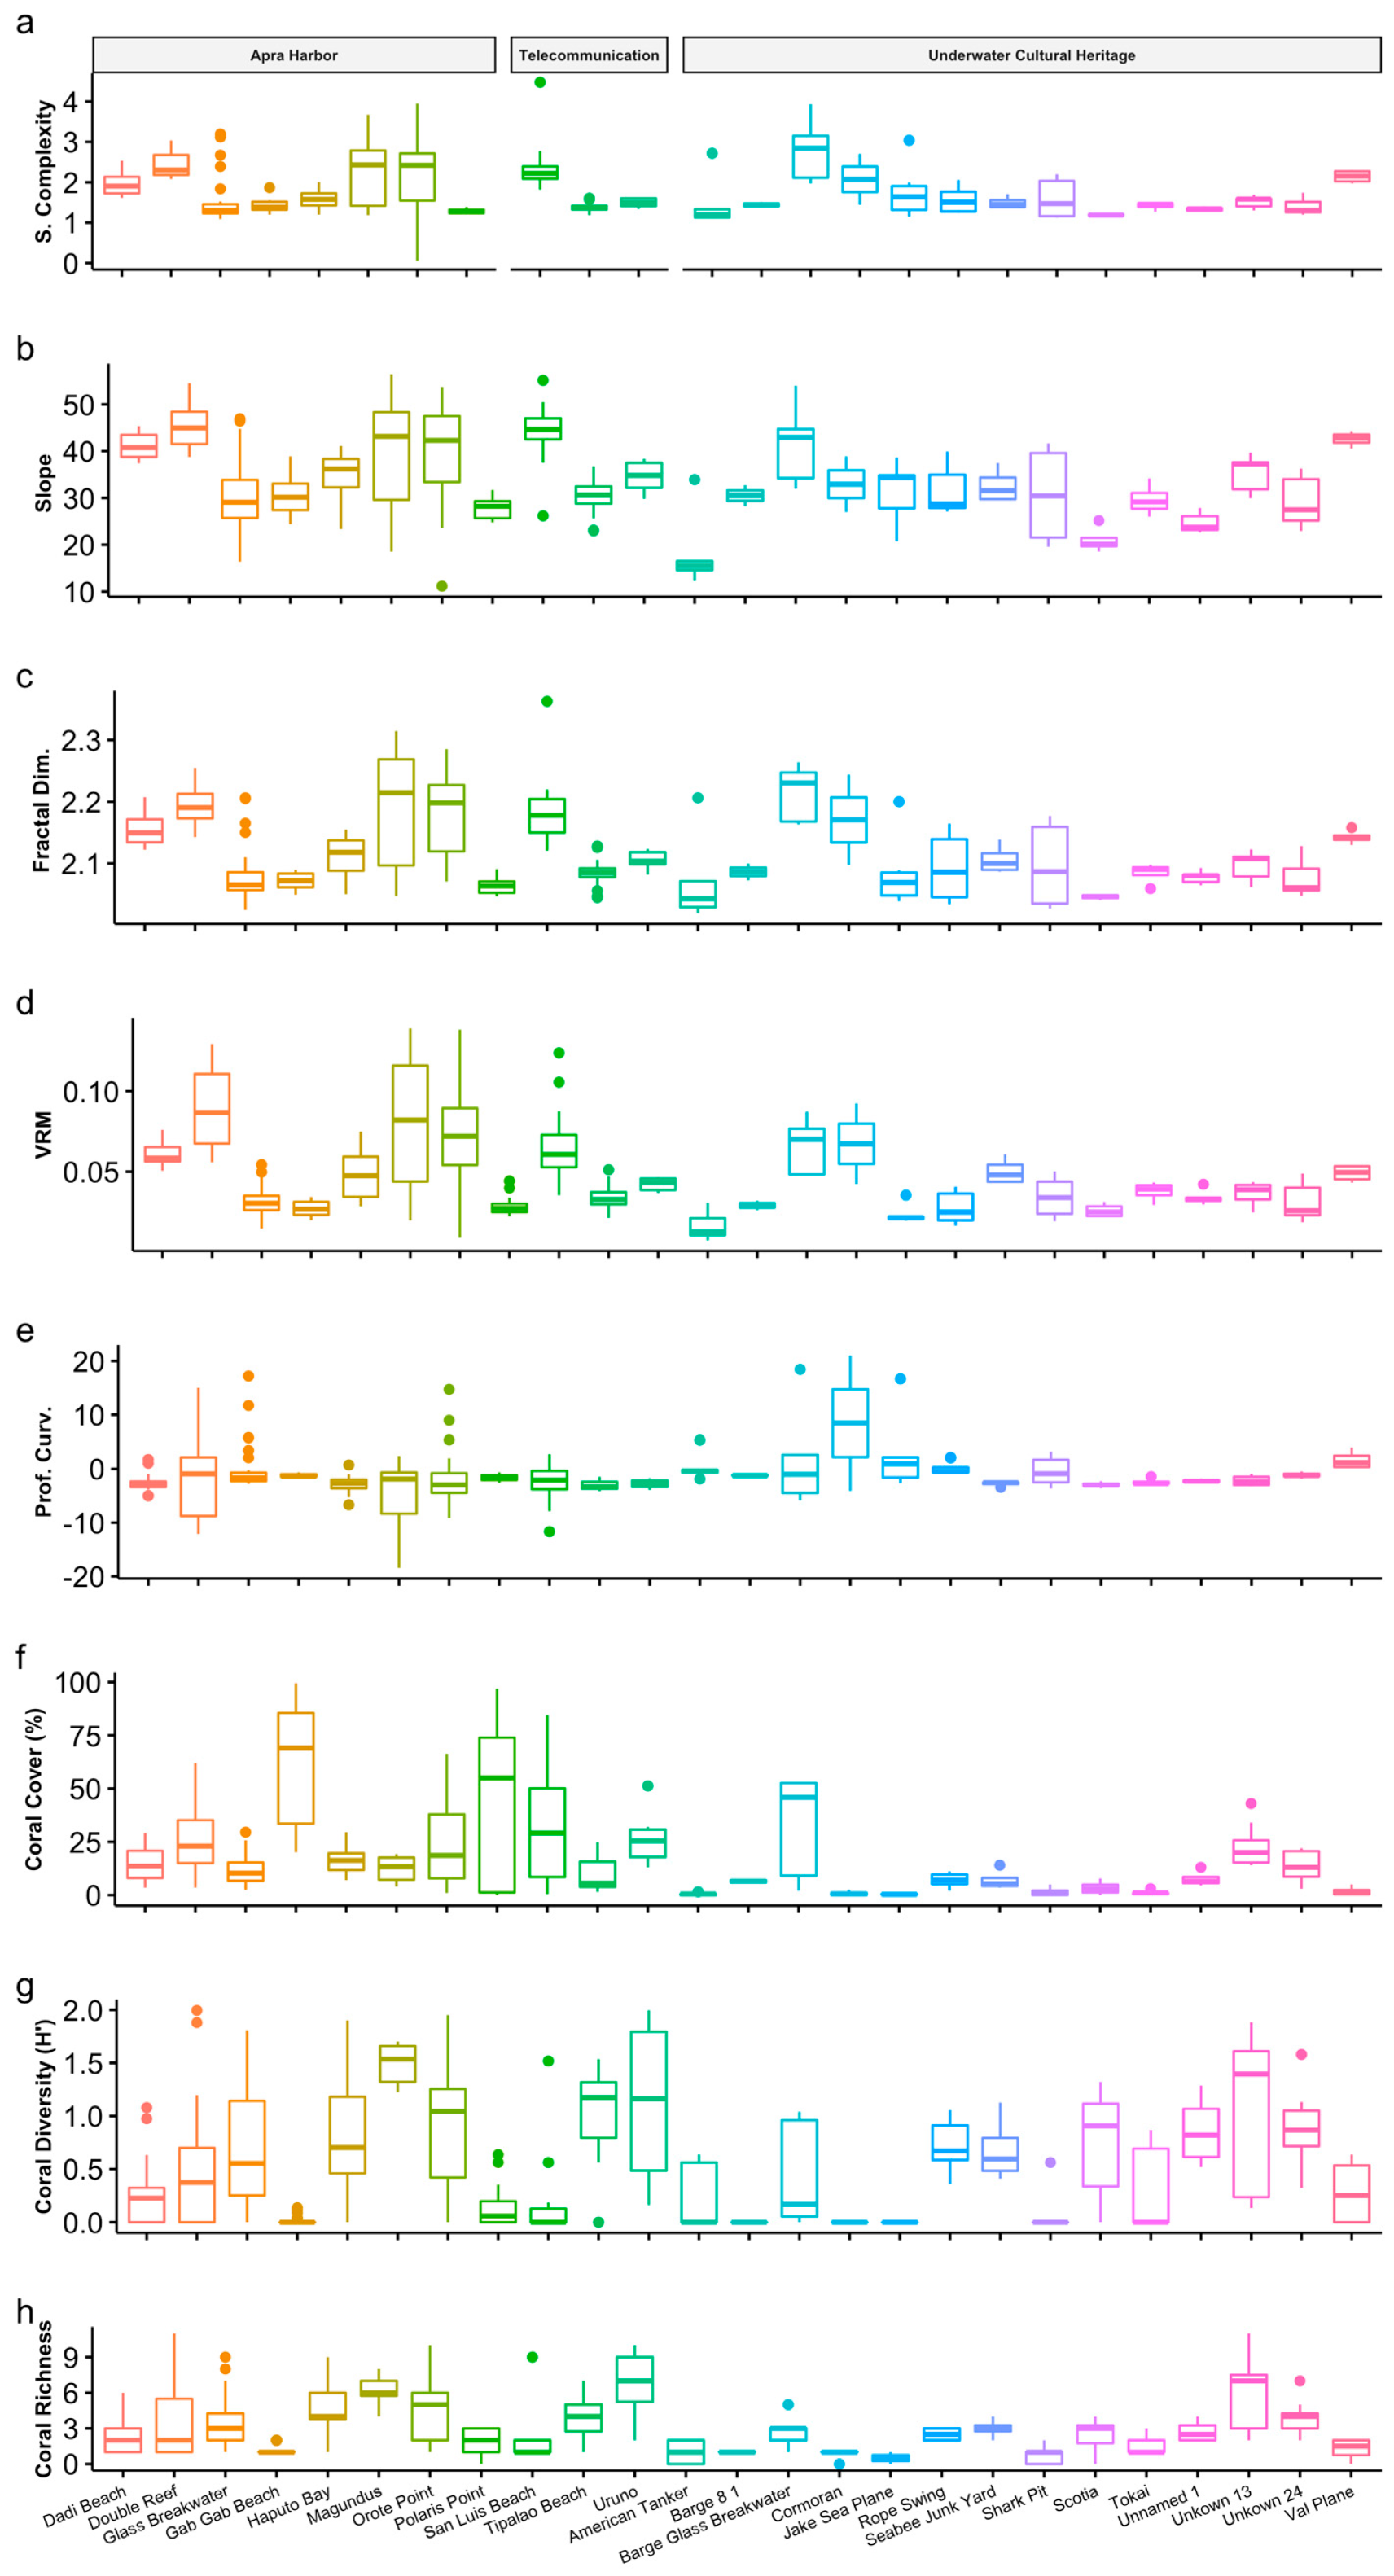
Figure 4.
PCA analysis of variation in 3D metrics of structural complexity among all sites. PC1 accounts for 66.1% of the observed variability in 3D habitat complexity and PC2 accounts for 21.2%. The coefficients primarily contributing to the variance explained by PC1 are slope, VRM, fractal dimension, and surface complexity. Profile curvature was the primary contributor to the variance explained by PC2. Data are labeled by the three habitat categories: AP (natural protected reefs in Apra Harbor region), TS (natural exposed reefs in the Telecommunications region), and UCH (artificial reefs).

Figure 5.
Univariate generalized mixed effects models examining the influence of live coral cover on metrics of habitat complexity at (a) natural reef sites (b) and UCH sites. Live coral was used as a predictor variable and tested against each metric of 3D habitat complexity. The beta coefficient estimates represent the strength and direction of the relationship between live coral cover and each 3D metric.

Table 1.
Underwater cultural heritage site descriptions. Mixed materials refers to a combination of material including metal, rubber, and wood [1,2].
| UCH Site | Submerged Date | Era | Material |
|---|---|---|---|
| American Tanker | 09/30/1944 | WWII | Ferro Cement |
| Barge 8 1 | unknown | WWII | Steel |
| Barge Glass Breakwater | 09/24/1944 | WWII | Ferro Cement |
| Cormoran | 04/7/1917 | WWI | Steel, Wood |
| Jake Sea Plane | 05/1944–07/1944 | WWII | Aluminum |
| Rope Swing | 09/1945 | WWII | Mixed (War Debris) |
| Seabee Junk Yard | 09/1945 | WWII | Mixed (War Debris) |
| Shark Pit | 09/1945 | WWII | Mixed (War Debris) |
| Scotia | 03/11/1904 | 1904 | Iron, Wood |
| Tokai Maru | 08/27/1943 | WWII | Steel |
| Unnamed 1 (Amtrac) | 06/21/1944 | WWII | Steel |
| Unknown 13 | unknown | - | unknown metal |
| Unknown 24 | unknown | - | unknown metal |
| Val Plane | 06/19/1944 | WWII | Aluminum |
Table 2.
List of coral genera that contributed to ≈90% of cumulative dissimilarity between coral assemblages on natural reefs and artificial substrata based on SIMPER analysis on the Bray–Curtis dissimilarity for (a) the AP region vs. the UCH sites and (b) the TS region vs. the UCH sites. The heading of each column shows ‘‘Av.Abund’’, average cover (%); ‘‘Av.Diss’’, average dissimilarity contribution; ‘‘Diss/SD’’, ratio of the average dissimilarity contribution to the standard deviation of dissimilarity contribution; and ‘‘%Contrib’’, percentage of the contribution by the genus to the between-group dissimilarity.
| (a) AP vs. UCH | |||||
| Genus | Av.Abund (AP) | Av.Abund (UCH) | Av.Diss | Diss/SD | Contrib% |
| Porites | 23.79 | 5.03 | 52.76 | 1.76 | 68.98 |
| Leptastrea | 0.88 | 0.92 | 5.34 | 0.81 | 6.99 |
| Montipora | 0.75 | 0.20 | 3.97 | 0.53 | 5.19 |
| Astreopora | 0.48 | 0.62 | 3.39 | 0.62 | 4.44 |
| Pocillopora | 0.35 | 0.39 | 2.40 | 0.77 | 3.13 |
| Leptoria | 0.27 | 0.05 | 1.37 | 0.80 | 1.79 |
| (b) TS vs. UCH | |||||
| Genus | Av.Abund (TS) | Av.Abund (UCH) | Av.Diss | Diss/SD | Contrib% |
| Porites | 14.89 | 5.03 | 46.35 | 1.96 | 61.97 |
| Montipora | 3.05 | 0.20 | 10.13 | 1.30 | 13.55 |
| Leptastrea | 0.71 | 0.92 | 3.61 | 1.22 | 4.83 |
| Millepora | 0.59 | 0.39 | 2.39 | 1.27 | 3.20 |
| Astreopora | 0.21 | 0.62 | 2.14 | 0.45 | 2.86 |
| Leptoria | 0.54 | 0.05 | 1.72 | 1.32 | 2.31 |
| Goniastrea | 0.50 | 0.06 | 1.57 | 0.89 | 2.10 |
Table 3.
List of coral genera that contributed to ≈90% of cumulative similarity within each region based on SIMPER analysis on the Bray–Curtis similarity for (a) the AP region, (b) the TS region, and (c) the UCH sites. The heading of each column shows ‘‘Av.Abund’’, average cover (%); ‘‘Av.Sim’’, average similarity contribution; ‘‘Sim/SD’’, ratio of the average similarity contribution to the standard deviation of similarity contribution; and ‘‘%Contrib’’, percentage of the contribution by the genus to the within-group similarity.
| (a) AP | ||||
| Genus | Av.Abund | Av.Sim | Sim/SD | Contrib% |
| Porites | 23.79 | 35.73 | 1.50 | 82.9 |
| Leptastrea | 0.88 | 1.86 | 0.46 | 4.33 |
| Montipora | 0.75 | 1.36 | 0.75 | 3.15 |
| (b) TS | ||||
| Genus | Av.Abund | Av.Sim | Sim/SD | Contrib% |
| Porites | 14.89 | 53.22 | 15.98 | 82.05 |
| Montipora | 3.05 | 4.84 | 0.67 | 7.46 |
| (c) UCH | ||||
| Genus | Av.Abund | Av.Sim | Sim/SD | Contrib% |
| Porites | 5.03 | 9.63 | 0.67 | 55.8 |
| Leptastrea | 0.92 | 2.9 | 0.42 | 16.8 |
| Astreopora | 0.62 | 1.85 | 0.58 | 10.72 |
| Lobophyllia | 0.09 | 1.15 | 0.20 | 6.69 |
Disclaimer/Publisher’s Note: The statements, opinions and data contained in all publications are solely those of the individual author(s) and contributor(s) and not of MDPI and/or the editor(s). MDPI and/or the editor(s) disclaim responsibility for any injury to people or property resulting from any ideas, methods, instructions or products referred to in the content. |
© 2023 by the authors. Licensee MDPI, Basel, Switzerland. This article is an open access article distributed under the terms and conditions of the Creative Commons Attribution (CC BY) license (https://creativecommons.org/licenses/by/4.0/).
Share and Cite
MDPI and ACS Style
Burns, J.H.R.; Pascoe, K.H.; Ferreira, S.B.; Kane, H.; Kapono, C.; Carrell, T.L.; Reyes, A.; Fukunaga, A. How Do Underwater Cultural Heritage Sites Affect Coral Assemblages? Remote Sens. 2023, 15, 2130. https://doi.org/10.3390/rs15082130
AMA Style
Burns JHR, Pascoe KH, Ferreira SB, Kane H, Kapono C, Carrell TL, Reyes A, Fukunaga A. How Do Underwater Cultural Heritage Sites Affect Coral Assemblages? Remote Sensing. 2023; 15(8):2130. https://doi.org/10.3390/rs15082130
Chicago/Turabian StyleBurns, John H. R., Kailey H. Pascoe, Sofia B. Ferreira, Haunani Kane, Clifford Kapono, Toni L. Carrell, Andres Reyes, and Atsuko Fukunaga. 2023. "How Do Underwater Cultural Heritage Sites Affect Coral Assemblages?" Remote Sensing 15, no. 8: 2130. https://doi.org/10.3390/rs15082130
Note that from the first issue of 2016, this journal uses article numbers instead of page numbers. See further details here.