Article

Stratospheric Temperature Observations by Narrow Bands Ultra-High Spectral Resolution Sounder from Nadir-Viewing Satellites

1
Key Laboratory of Spectral Imaging Technology of Chinese Academy of Science, Xi’an Institute of Optics and Precision Mechanics, Chinese Academy of Sciences, Xi’an 710119, China
2
University of Chinese Academy of Sciences, Beijing 100049, China
3
Key Laboratory of Radiometric Calibration and Validation for Environmental Satellites, National Satellite Meteorological Center (National Center for Space Weather), Innovation Center for Feng Yun Meteorological Satellite (FYSIC), China Meteorological Administrations, Beijing 100049, China
*
Author to whom correspondence should be addressed.
These authors contributed equally to this work.
Remote Sens. 2023, 15(8), 1967; https://doi.org/10.3390/rs15081967
Submission received: 24 February 2023 / Revised: 30 March 2023 / Accepted: 5 April 2023 / Published: 7 April 2023

Abstract

:
Accurate stratospheric temperature observations are crucial for weather forecasts and climate change studies. This paper discusses a precise measurement method for the stratospheric temperature profile using narrow bands with ultra-high spectral resolution from nadir-viewing satellites. First, the CO2 absorption band around 15 μm is selected as the major sounding source by the calculation and analysis of the temperature Jacobian and the atmospheric molecular spectra. Next, the influence of spectral resolution, spectral range and instrumental noise on the sounding capability is analyzed, and the sounding feasibility of the single spectral band and multiple spectral bands is discussed under the condition that the spaceborne long-wave infrared space heterodyne spectrometer (SHS) is selected as suggested sounder onboard the satellite. Finally, the optimal joint-sounding scheme of narrow bands is proposed. The temperature retrieval and validation show that the joint-sounding of two discontinuous narrow bands can realize the high precision measurement of the stratospheric temperature profile for the given spectral resolution, spectral range, and instrumental noise. When the sounder adopts two narrow bands (the regions of 666.87–676.44 cm−1 and 683.58–693.15 cm−1) and a spectral resolution of 0.03 cm−1, the retrieval accuracy (RMSE) is about 0.9 K over a pressure range of 200 to 0.7 hPa (11.5–50 km). This study will provide technical preparation for high-precision and low-cost satellite sounder design for stratospheric temperature observations.

Graphical Abstract

1. Introduction

Stratospheric temperature variation is very important for climate change studies [1], and is even preferred by the science community for stratosphere-troposphere exchange (STE) and gravity wave observations [2,3]. The stratosphere is the region between 100 and 0.7 hPa (~16–50 km) [4,5]. For convenience, the atmospheric pressure regions of 100–30 hPa, 30–3 hPa and 3–0.7 hPa are referred to as the lower stratosphere, the middle stratosphere and the upper stratosphere in this study, respectively [4,5]. Stratospheric temperature variation can cause a change in the temperature, wind, and pressure in the troposphere, thus leading to the change of climate and circulation of the troposphere [6]. It was found that Sudden Stratospheric Warming (SSW) can cause a significant increase in temperature (tens of degrees within a few days) in the polar stratosphere, resulting in extreme weather events [7,8]. The generation of atmospheric gravity waves is related to SSW [8]. The stratospheric temperature sounding is particularly useful for the study of atmospheric gravity waves. The Intergovernmental Panel on Climate Change (IPCC) [1996] has taken the subject of trends in stratospheric temperature as a crucial assessment [5]. As a fundamental prerequisite for the research of the trends, the accurate measurement of the stratospheric temperature is meaningful for weather prediction and global climate change monitoring.
The atmospheric temperature profile is usually measured by lidars, radiosondes, rocketsondes and sounders onboard satellites [9]. Although lidars, radiosondes and rocketsondes provide high measurement accuracy, it is difficult for them to obtain continuous temperature distribution data over a large range, not to mention the sounding data of the ocean [4,10,11]. Therefore, it remains challenging to build a high-quality climate database [4]. With the development of satellite meteorology, satellite observation with the unique advantage of global coverage is widely used for the soundings of atmospheric parameters. There are three satellite observation modes: limb observation, occultation observation. and nadir observation [12]. Limb observation can sound the temperature of high altitude with high vertical resolution, but at the expense of reduced signal-to-noise ratio and horizontal resolution [12]. The global positioning system (GPS) radio occultation is a representative occultation observation. The stratospheric temperature measurement from GPS radio occultation is best for global coverage [4], but it offers discrete point records due to the limitations of the GPS satellite position. Compared with the above two modes, nadir observation can provide higher horizontal resolution with unified ground resolution and higher sounding efficiency, which is widely used in atmospheric parameter sounding. The early spaceborne stratospheric temperature sounders from nadir-viewing satellites are mainly the Television and Infrared Observation Satellite Operational Vertical Sounder (TOVS) that is composed of a Stratospheric Sounding Unit (SSU), a High Resolution Infrared Radiation Sounder (HIRS/2), and a Microwave Sounding Unit (MSU) [13]. The SSU has three spectral channels and measures temperatures from 20 to 55 km [14]. HIRS/2 has 20 spectral channels with a spectral resolution of 15 cm−1 and a spectral range of 0.6–15 μm, which sounds temperature from the surface to 20 km [1,15]. The MSU has four channels that are located in the O2 60 GHz absorption band and a sounding altitude range of 10–30 km [14]. Studies have reported that the retrieval accuracy of TOVS is about 2–3 K [15]. Given that the low spectral resolution in these sounders leads to a wide weighting function of the spectral channel, the radiation observed by the sounder comes from a thick atmospheric layer and only provides information about the low-order atmospheric vertical structure [13]. With the development of interference technology and grating technology, the improvement of the spectral resolution of the sounder makes the channels increase to thousands and realizes hyperspectral atmospheric detection.
At present, the hyperspectral infrared atmosphere vertical sounders mainly include The Advanced Infrared Sounder (AIRS), the Infrared Atmospheric Sounding Interferometer (IASI), the Cross-track Infrared Sounder (CrIS), the Infrared Sounder (IRS), the Hyperspectral Infrared Atmospheric Sounder (HIRAS), and the Geostationary Interferometric Infrared Sounder (GIIRS), the parameters of which are shown in Table 1 [12,16,17,18,19,20,21]. These sounders are usually carried by polar-orbiting meteorological satellites and geostationary meteorological satellites. The current constellation of polar-orbiting meteorological satellites operates in morning and afternoon orbits, providing global observations every 6 h. In addition, the geostationary meteorological satellites have been able to provide hyperspectral sounding every 2 h since 2016. The data indicate that AIRS can provide the atmospheric temperature profiles with a root mean square error of 2–3 K from the surface to 1 hPa (about 0–48 km) [22]. IASI can sound the temperature profile for the whole stratosphere, and its accuracy is required to be 1 K (cloud free) [23]. However, the accuracy reported in the studies is between 1.5–6 K [24,25]. GIIRS can measure the temperature profile from the surface to 35 km [26]. The literature shows that the temperature product used in India from 4–10 February 2020 was 3–4.5 K for the stratosphere [27]. NWP (numerical weather prediction) requires an accuracy of 1 K above 100 hPa [13]. It can be seen that the retrieval accuracy of these sounders for the stratospheric temperature profile are still not high enough. There are two reasons: (1) The spectral bands sensitive to the middle and upper stratosphere are few and narrow. The limitation of spectral resolution directly leads to the lack of sounding channels, particularly above 20 hPa [28]. As a result, the sounder provides poor information, and the capability of the fine measurement of the stratospheric temperature profile needs to be improved. (2) The noise of the spectral channel sensitive to the stratosphere temperature is large [29,30]. In addition, these hyperspectral sounders are large and heavy. They have wide spectral ranges, and there are usually redundant bands that do not contribute to sounding atmospheric parameters [31].
This paper will discuss a high-precision measurement method for the stratospheric temperature profile using narrow bands with ultra-high spectral resolution. We claim “ultra-high spectral resolution” because the spectral resolutions of current sounders in orbit are between 0.25 cm−1 and 0.625 cm−1, while the one proposed in this paper is as high as 0.03 cm−1. The method takes advantage of the high sensitivity of the CO2 15 μm absorption band to the stratospheric temperature profile. It proposes the scheme where multiple narrow bands are combined to measure the temperature of the different pressure ranges based on the analysis of the impact of spectral resolution, spectral range, and instrumental noise on the sounding capability and the feasibility of the soundings of the single spectral band and multiple spectral bands by taking SHS as the sounder model. The paper is organized as follows: Section 2 introduces the spectral consideration, Section 3 provides a simulation analysis on the sounding capability of a narrow band, and finally Section 4 presents the conclusions.

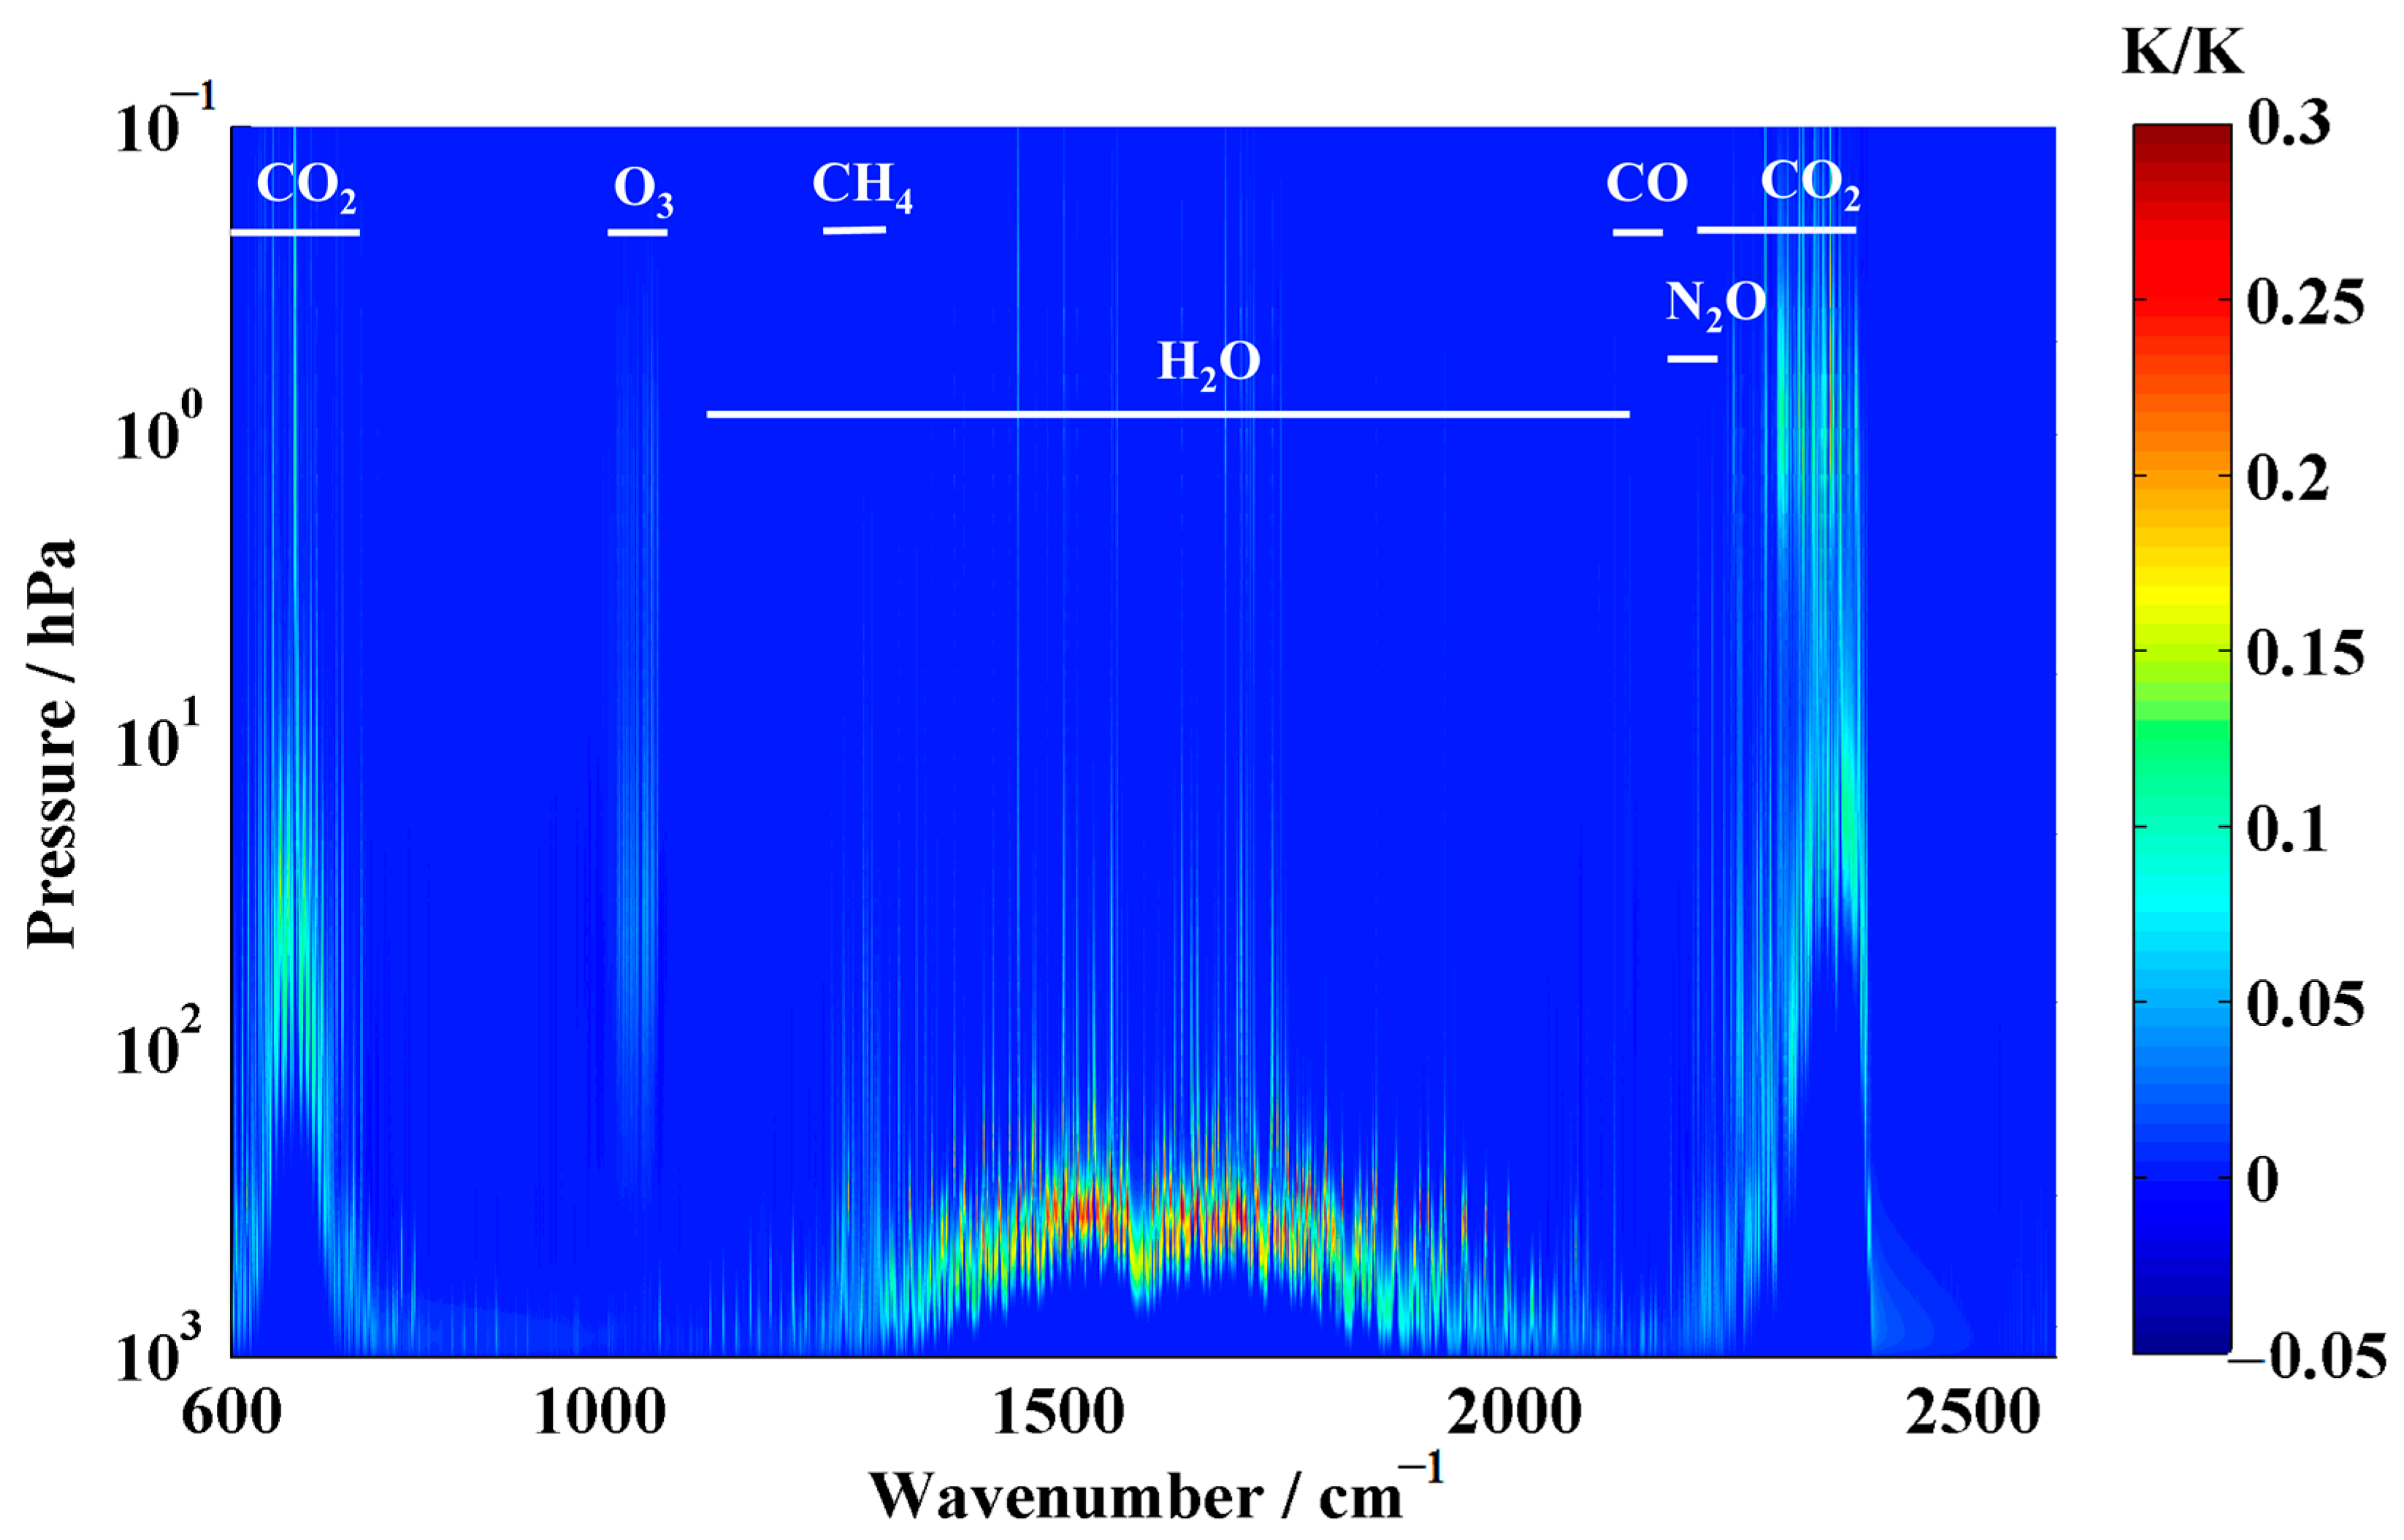
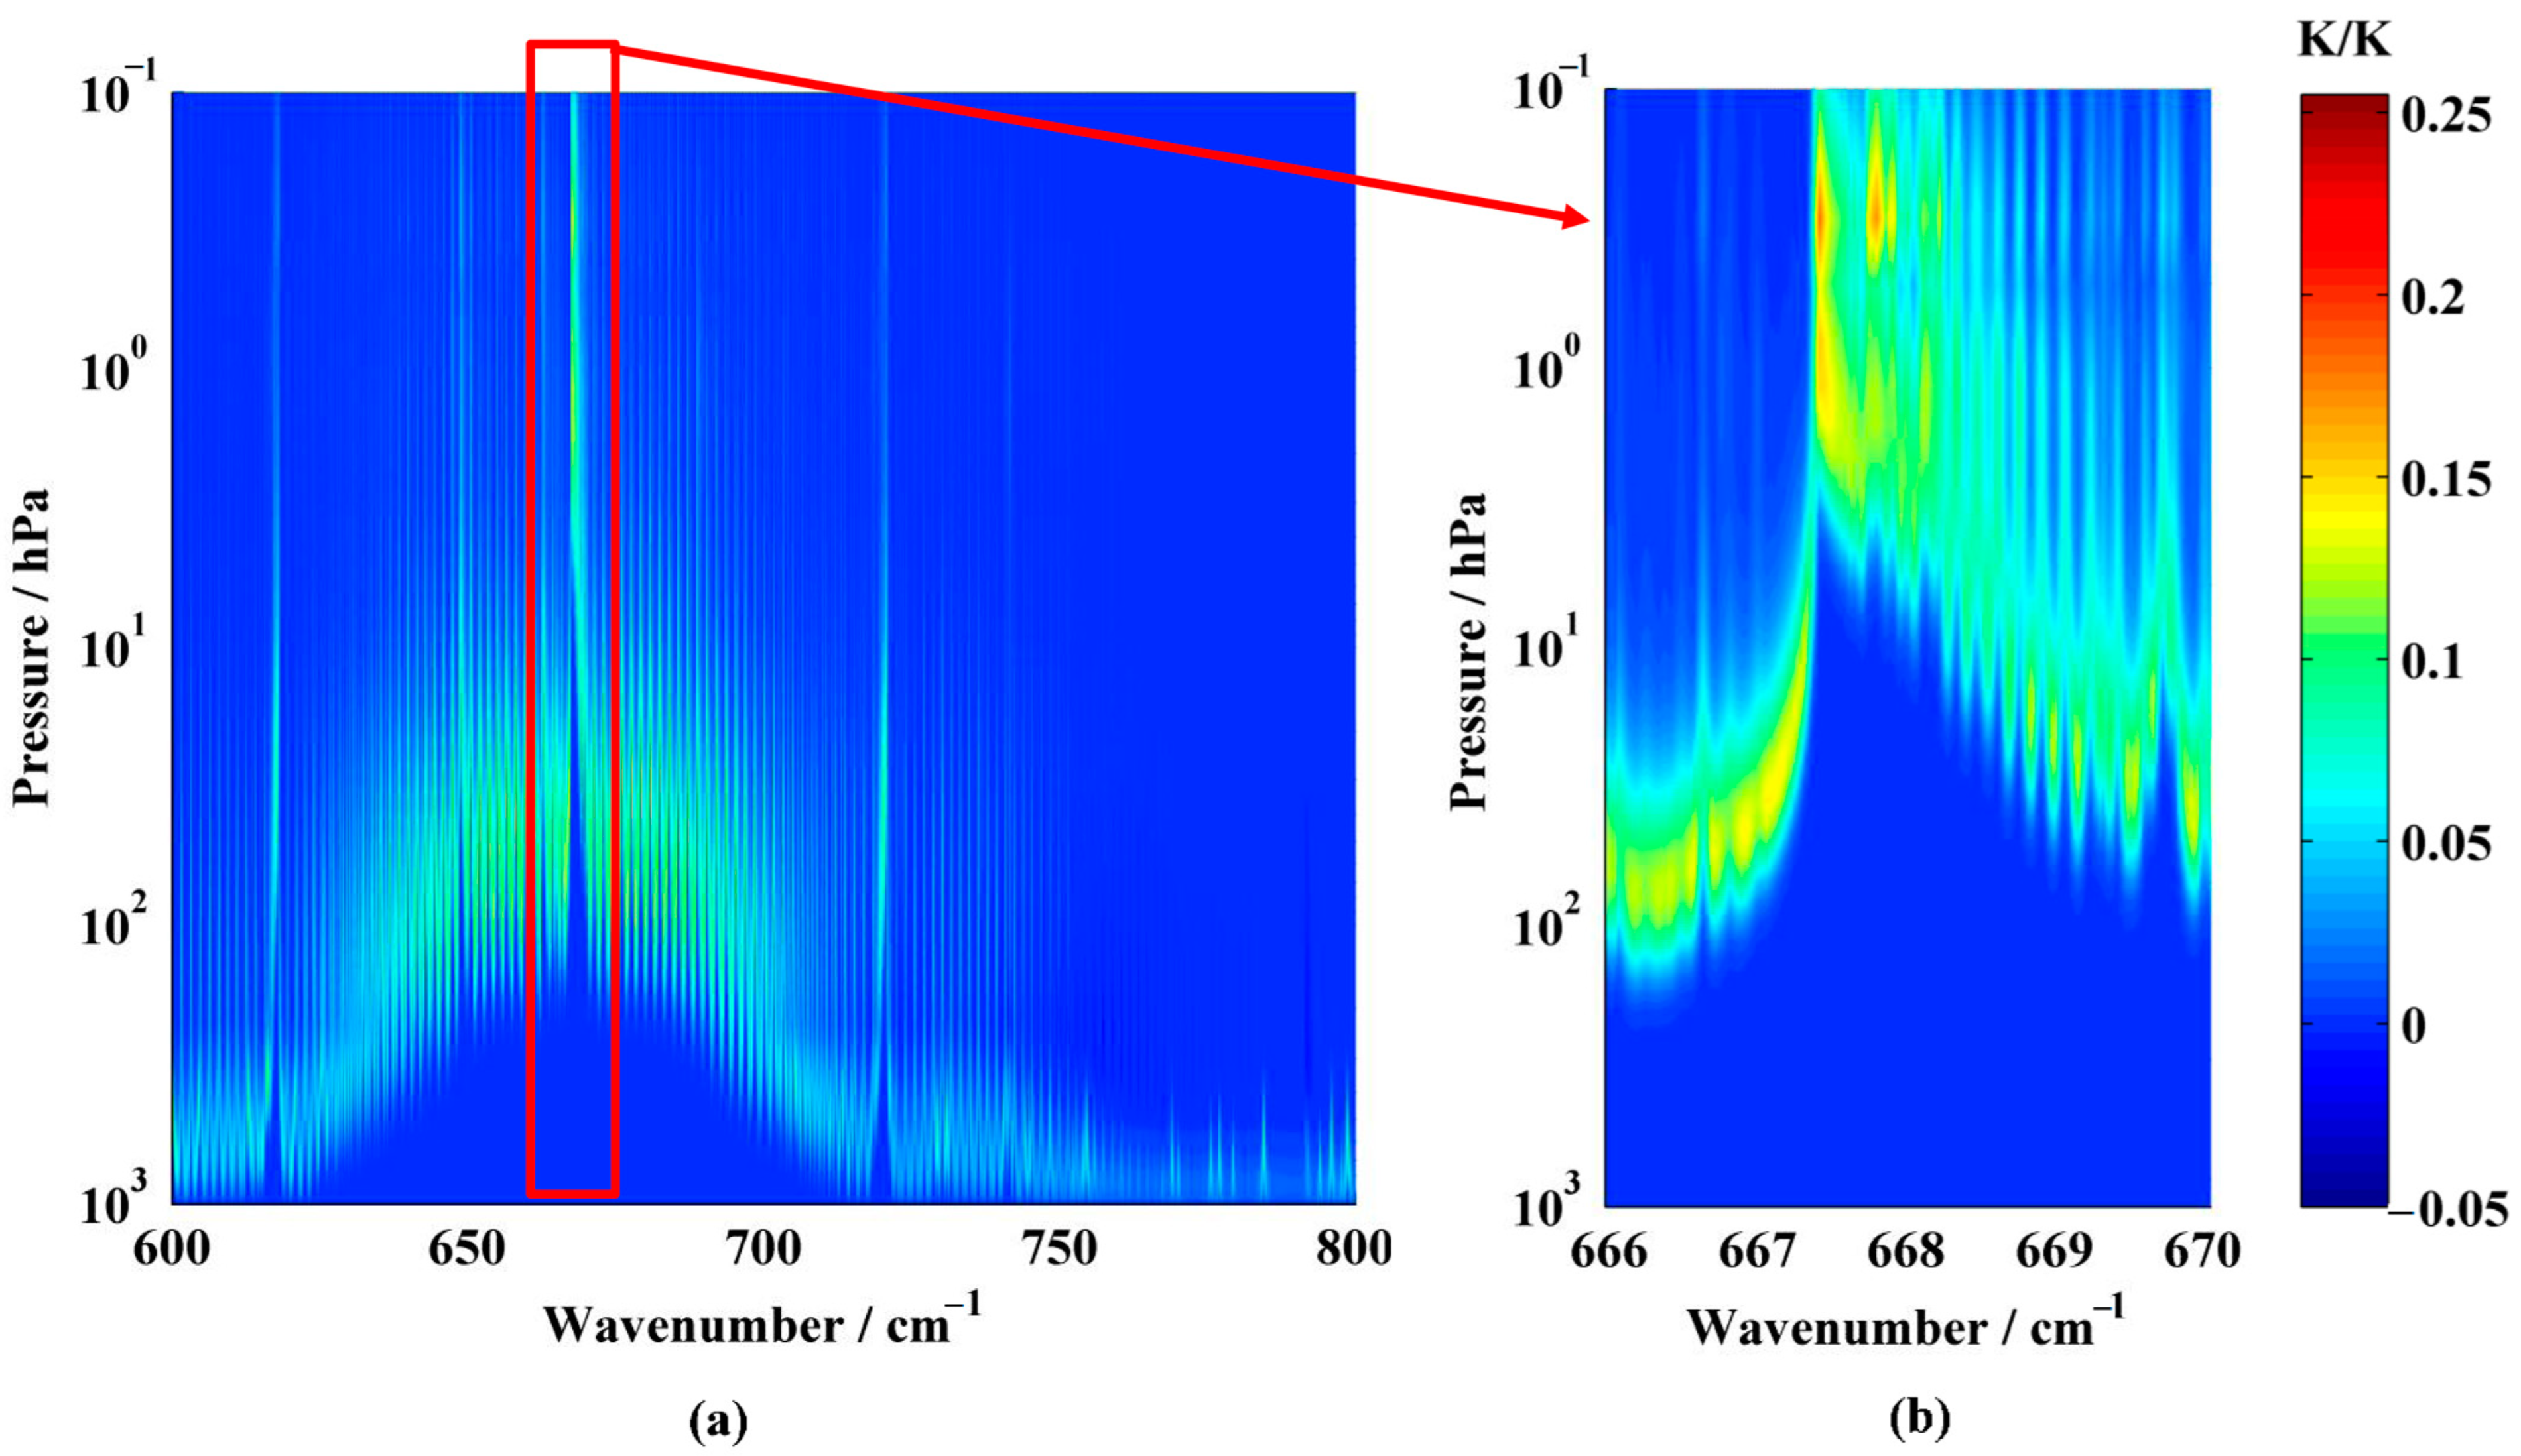
2. Spectral Consideration

The temperature sounding with the nadir-viewing mode acquires the vertical distribution of the atmospheric temperature profile by using the difference in radiation absorption of different spectral bands via atmospheric composition [32]. When the atmosphere is stratified, each layer is both a radiation source and an absorber for other layers in the radiative transfer process [32]. The sounder selects a spectral band sensitive to the temperature profile, and then the total radiation obtained by every spectral channel is the sum of all the layers. Each layer of the atmosphere contributes differently to the total radiation. A specific layer that contributes the most is called the “optimal information layer” [33]. The total radiation generally reflects the temperature information of this layer [33]. The radiation obtained by a spectral channel corresponds to the temperature of its optimal information layer. Therefore, the vertical distribution of atmospheric temperature can be calculated indirectly by measuring the radiation of each spectral channel.
The target narrow band for temperature sounding should be sensitive to the temperature profile. Temperature Jacobian can express the sensitivity of the spectrum to temperature. It indicates to which layer in the atmosphere the brightness temperature (BT) at a given wavenumber (σ) is sensitive with respect to atmospheric temperature (T) [19], and can be expressed as follows [34]:
J σ T = BT σ T
A large part of the infrared spectral region does not only contain a variety of molecular absorption bands, but is also sensitive to atmospheric temperature and is little affected by solar radiation. Most spaceborne atmospheric temperature sounders with nadir viewing mode use the infrared spectral band, and a few use the microwave band. We will discuss the infrared spectral region, but not the microwave region, because this study only selects the potentially available narrow bands for soundings in the optical domain. Figure 1 indicates the temperature Jacobians of the infrared spectral region. The x-axis is the wavenumber, the y-axis is the atmospheric pressure, and the color is the sensitivity. It can be seen that the spectral bands sensitive to the stratospheric temperature mainly include 640–700 cm−1, 1000–1100 cm−1, near 1300 cm−1, near 2100 cm−1, 2150–2400 cm−1, and a partially discontinuous band between 1500 and 2000 cm−1. Figure 2 shows the emission spectra of the major atmospheric molecules. As shown in Figure 1 and Figure 2, the spectral regions of 640–700 cm−1 and 2150–2400 cm−1 are the 15 μm and 4.3 μm carbon dioxide (CO2) absorption bands, respectively, with a strong sensitivity to the stratospheric temperature. The spectral region of 1000–1100 cm−1 is the 9.6 μm ozone (O3) absorption band, which is sensitive to the stratospheric temperature. The spectral regions of near 1300 cm−1, 1500–2000 cm−1, near 2100 cm−1 and 2150–2250 cm−1 are the 7.7 μm methane (CH4), the moisture (H2O), the 4.7 μm carbon monoxide (CO), and the 4.5 μm nitrous oxide (N2O) absorption bands, respectively, which are all very weakly sensitive to the lower stratospheric temperature. To ensure that the radiation obtained by each spectral channel mainly reflects the temperature information rather than variations of the atmospheric molecular volume mixing ratio, the absorption band of the gas with a stable atmospheric mixing ratio is generally selected as the detection source in the temperature sounding [33]. CO2 meets this requirement, but O3, CH4, H2O, N2O and CO do not because of their unstable mixing ratio. The 15 μm and 4.3 μm CO2 absorption bands are highly sensitive to almost the whole stratospheric temperature profile. However, the 4.3 μm CO2 absorption band is affected by the local thermodynamic equilibrium (Non-LTE) effects [35]. The related energy level is directly pumped by solar radiation, which causes more electron transitions [36]. The radiation received by the sounder then increases, which is not conducive to temperature retrieval [37]. The 15 μm CO2 absorption band is almost unaffected by Non-LTE effects [38], and the radiation is relatively stable. Therefore, the 15 μm CO2 absorption band is used as the sounding source of the stratospheric temperature profile.
Figure 3 shows the temperature Jacobians of the infrared spectral region of 600–800 cm−1, the radiation information of which mainly comes from the 15 μm CO2 band. The spectral region of 667–669 cm−1 is sensitive to the upper and part of the middle stratosphere (approximately the 10–0.7 hPa region), the bandwidth, which is narrow and about 2 cm−1 (in Figure 3b). Hence, it requires a high spectral resolution to obtain enough spectral channels for the sounding. In addition, with the wavenumber of 668 cm−1 as the axis, the temperature Jacobians of the left and right spectral bands have a certain similarity in Figure 3a. Figure 4 shows the temperature Jacobian peak corresponding to atmospheric pressure with different spectral resolutions and the same spectral region of 600–800 cm−1. In Figure 4, the x-axis coordinate of the blue point represents the peak value of temperature Jacobian of the spectral channel. The y-axis coordinate of the blue point represents the atmospheric pressure corresponding to the peak of temperature Jacobians (“peak pressure” for short [40]), which means that the channel is most sensitive to the temperature of peak pressure. With the improvement in spectral resolution, there are more Jacobian peaks in the stratosphere. This means that the spectral channels sensitive to stratospheric temperature increase. Suppose that we still utilize a wide spectral band for the sounding under the condition of improved spectral resolution. It will be easy to cause problems with data storage and processing capacity due to the enormous amount of channels. Thus, this study proposes to use several narrow bands to measure the temperature of the different altitude ranges. Furthermore, combined with the similar characteristics of the temperature Jacobian in Figure 3a, a narrow band can be mainly selected in the left or right spectral band of 668 cm−1 to avoid spectral channel redundancy caused by the overlapping of the sounding altitude ranges.

3. Simulation Analysis on the Sounding Capability of Narrow Band

A space heterodyne spectrometer (SHS) is a type of Fourier transform spectrometer (FTS) that can achieve radiation measurement with ultra-high spectral resolution [41,42]. It offers the possibility of applying high-precision sounding for the atmospheric temperature profile. Therefore, we use the spaceborne long-wave infrared SHS as the sounder model to assess the sounding capability of the narrow band. The sounder adopts the nadir viewing mode. The interferogram signal collected by the sounder along the x-axis (diffraction direction of grating) can be written as [43]
I x = B σ ( 1 + cos ( 2 π ( 4 x ( σ σ 0 )   tan θ ) ) ) d σ  
where x is the location on the detector array, B σ is the radiance of the incident spectrum, σ is the wavenumber of the incident spectrum, θ is the Littrow angle of the gratings, and σ 0 is the Littrow wavenumber.
The interferogram signal can be converted into the radiance of the incident spectrum after preprocessing, inverse Fourier transforms, etc. The radiance of the incident spectrum is changed into observation brightness temperature based on the Planck law. The temperature profile can then be calculated by the brightness temperature of the spectral channels and the related retrieval method.
In the simulation, we chose the LBLRTM (Line-By-Line Radiative Transfer Model) [44] as the radiative transfer calculation tool for forward and retrieval simulation. LBLRTM is internationally recognized as an accurate and efficient model which can simulate the observation (radiance or brightness temperature) of the Fourier transform spectrometer [45], calculate the Jacobians of atmospheric parameters, and include line mixing in the radiative transfer calculation for CO2 [46]. The optimal estimation method with the Newton nonlinear iterative approach [47,48] is used as the temperature retrieval method in this paper. The sample data of the 60-level atmospheric profiles from ECMWF (European Centre for Medium-Range Weather Forecasts) is used to make the training and testing data, and to calculate the a priori profiles and the a priori error covariance matrix of temperature. The flowchart of the simulation is shown in Figure 5.

3.1. The Main Influence Factors of Sounding Capability

Spectral resolution, spectral range, and instrumental noise can influence the observation of the sounders, and then affect the sounding capability for the atmospheric temperature profile. This subsection will discuss the three influence factors, respectively.

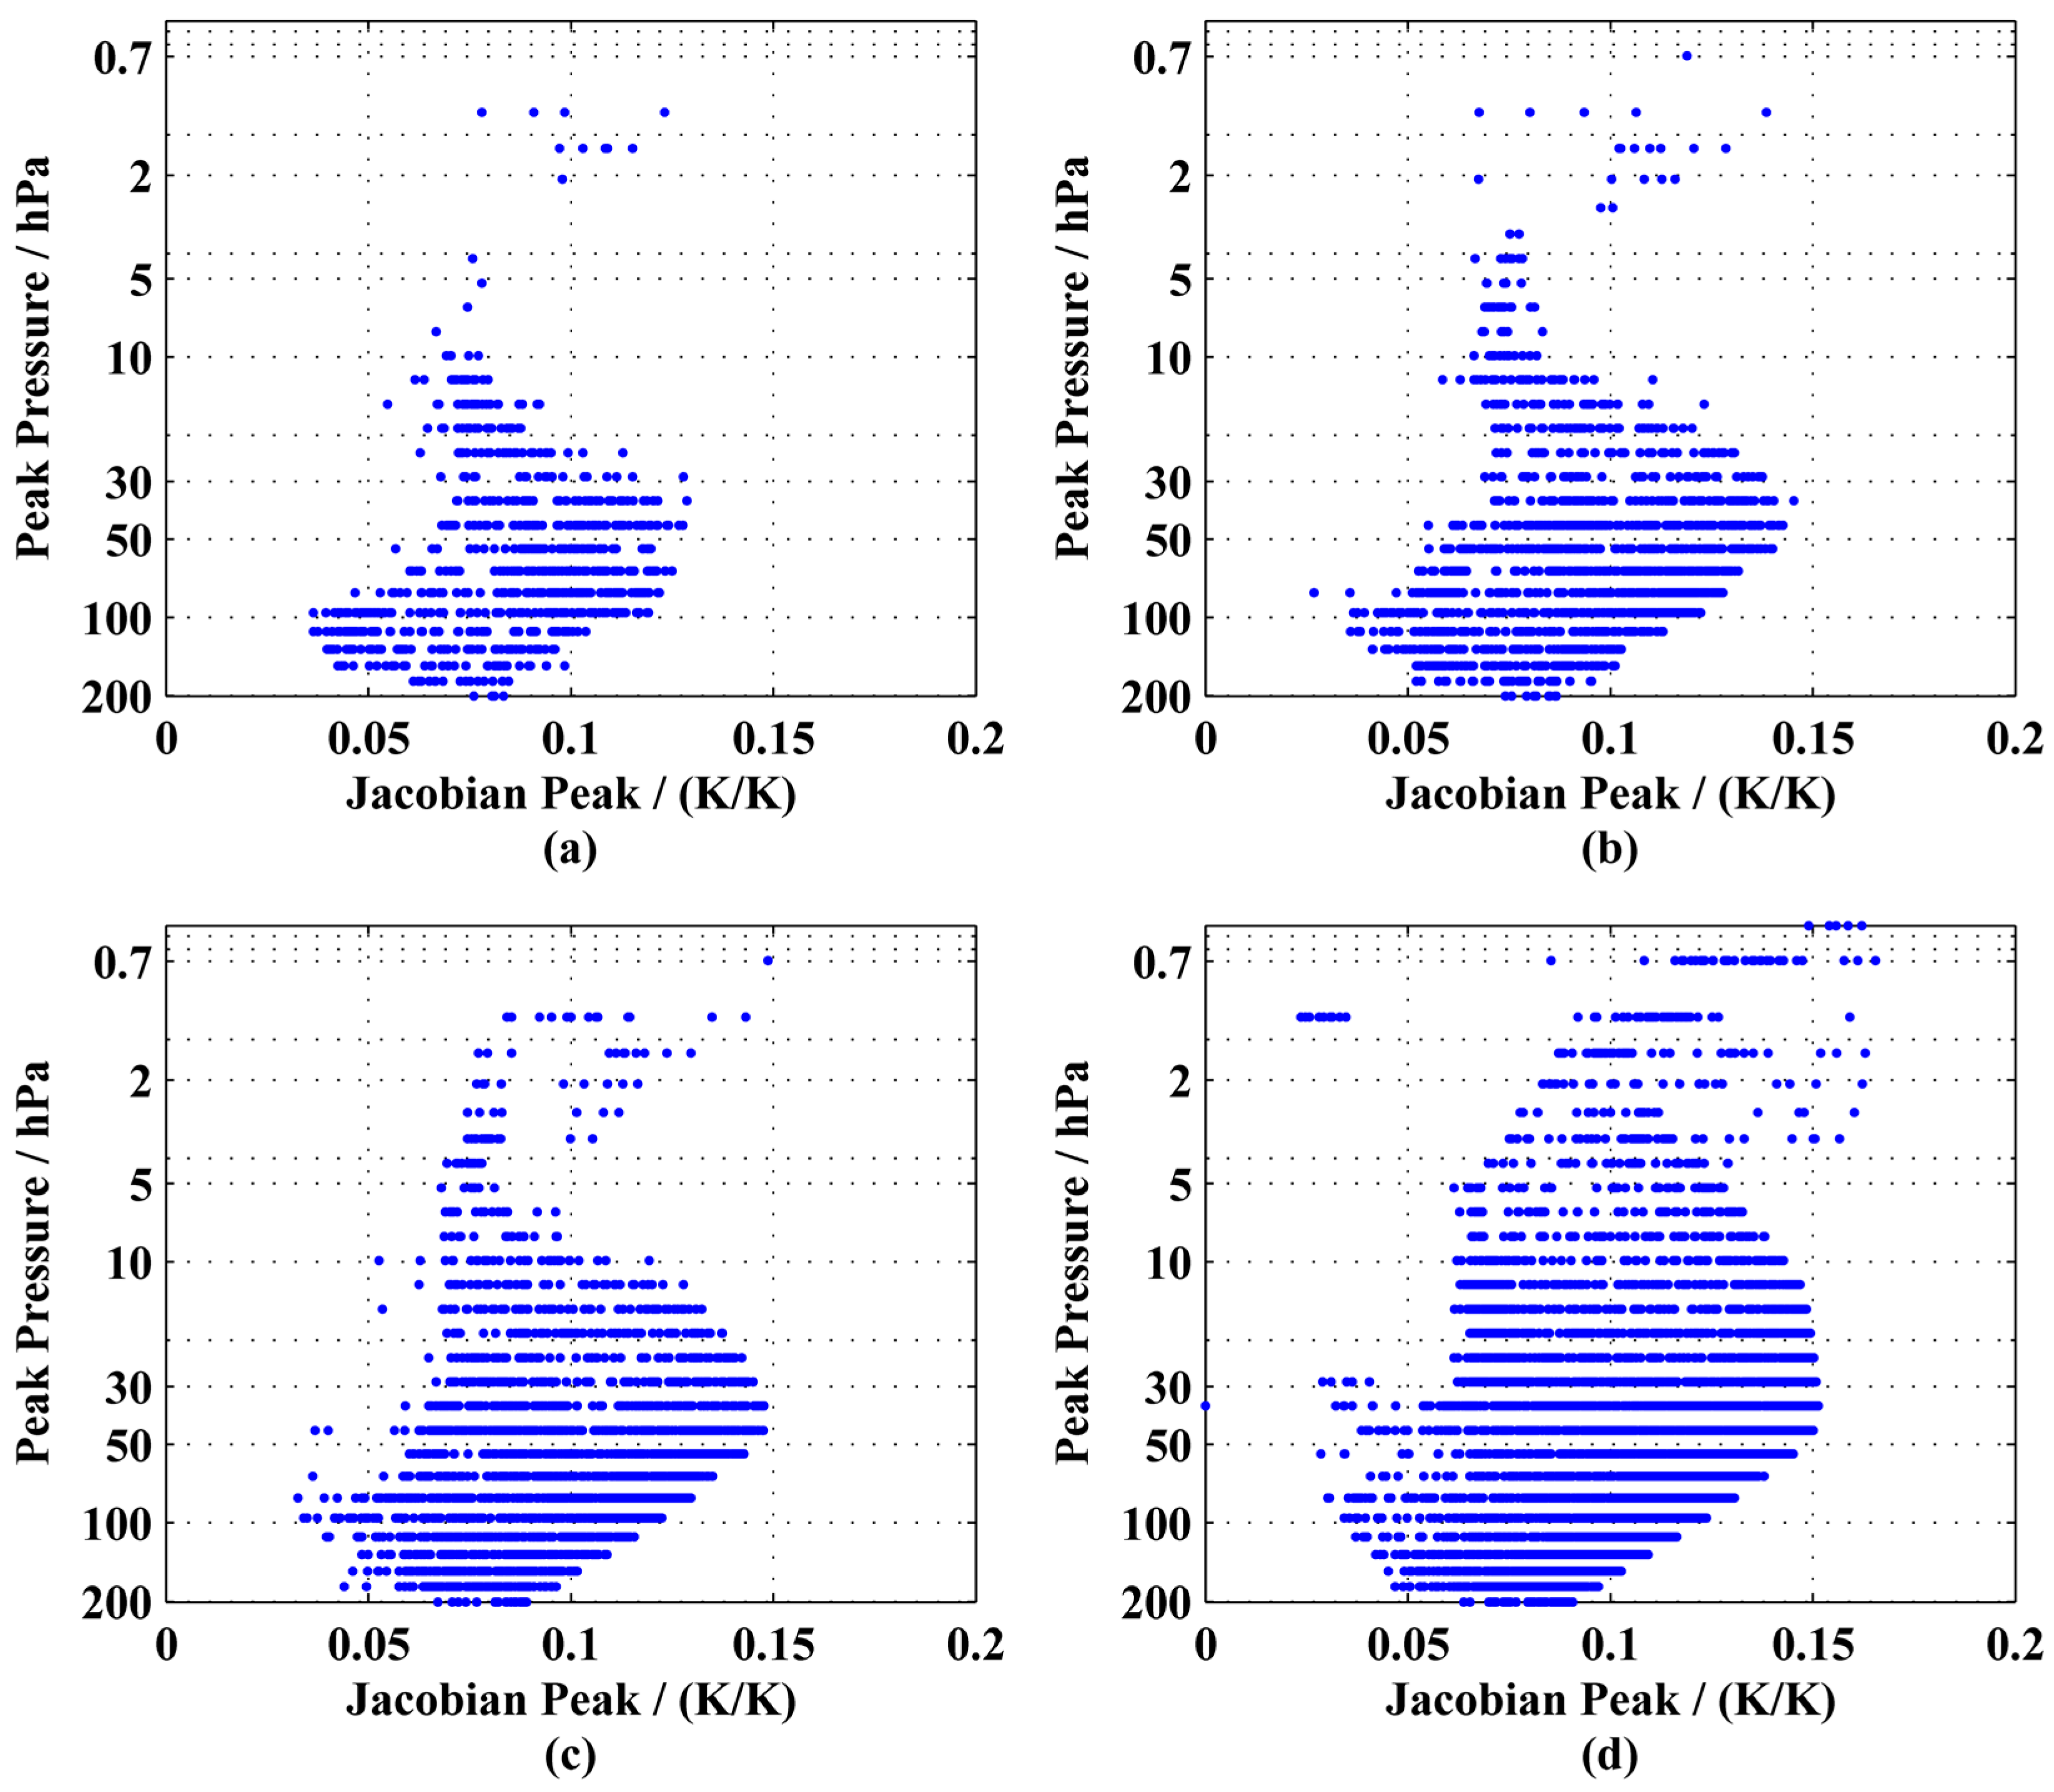
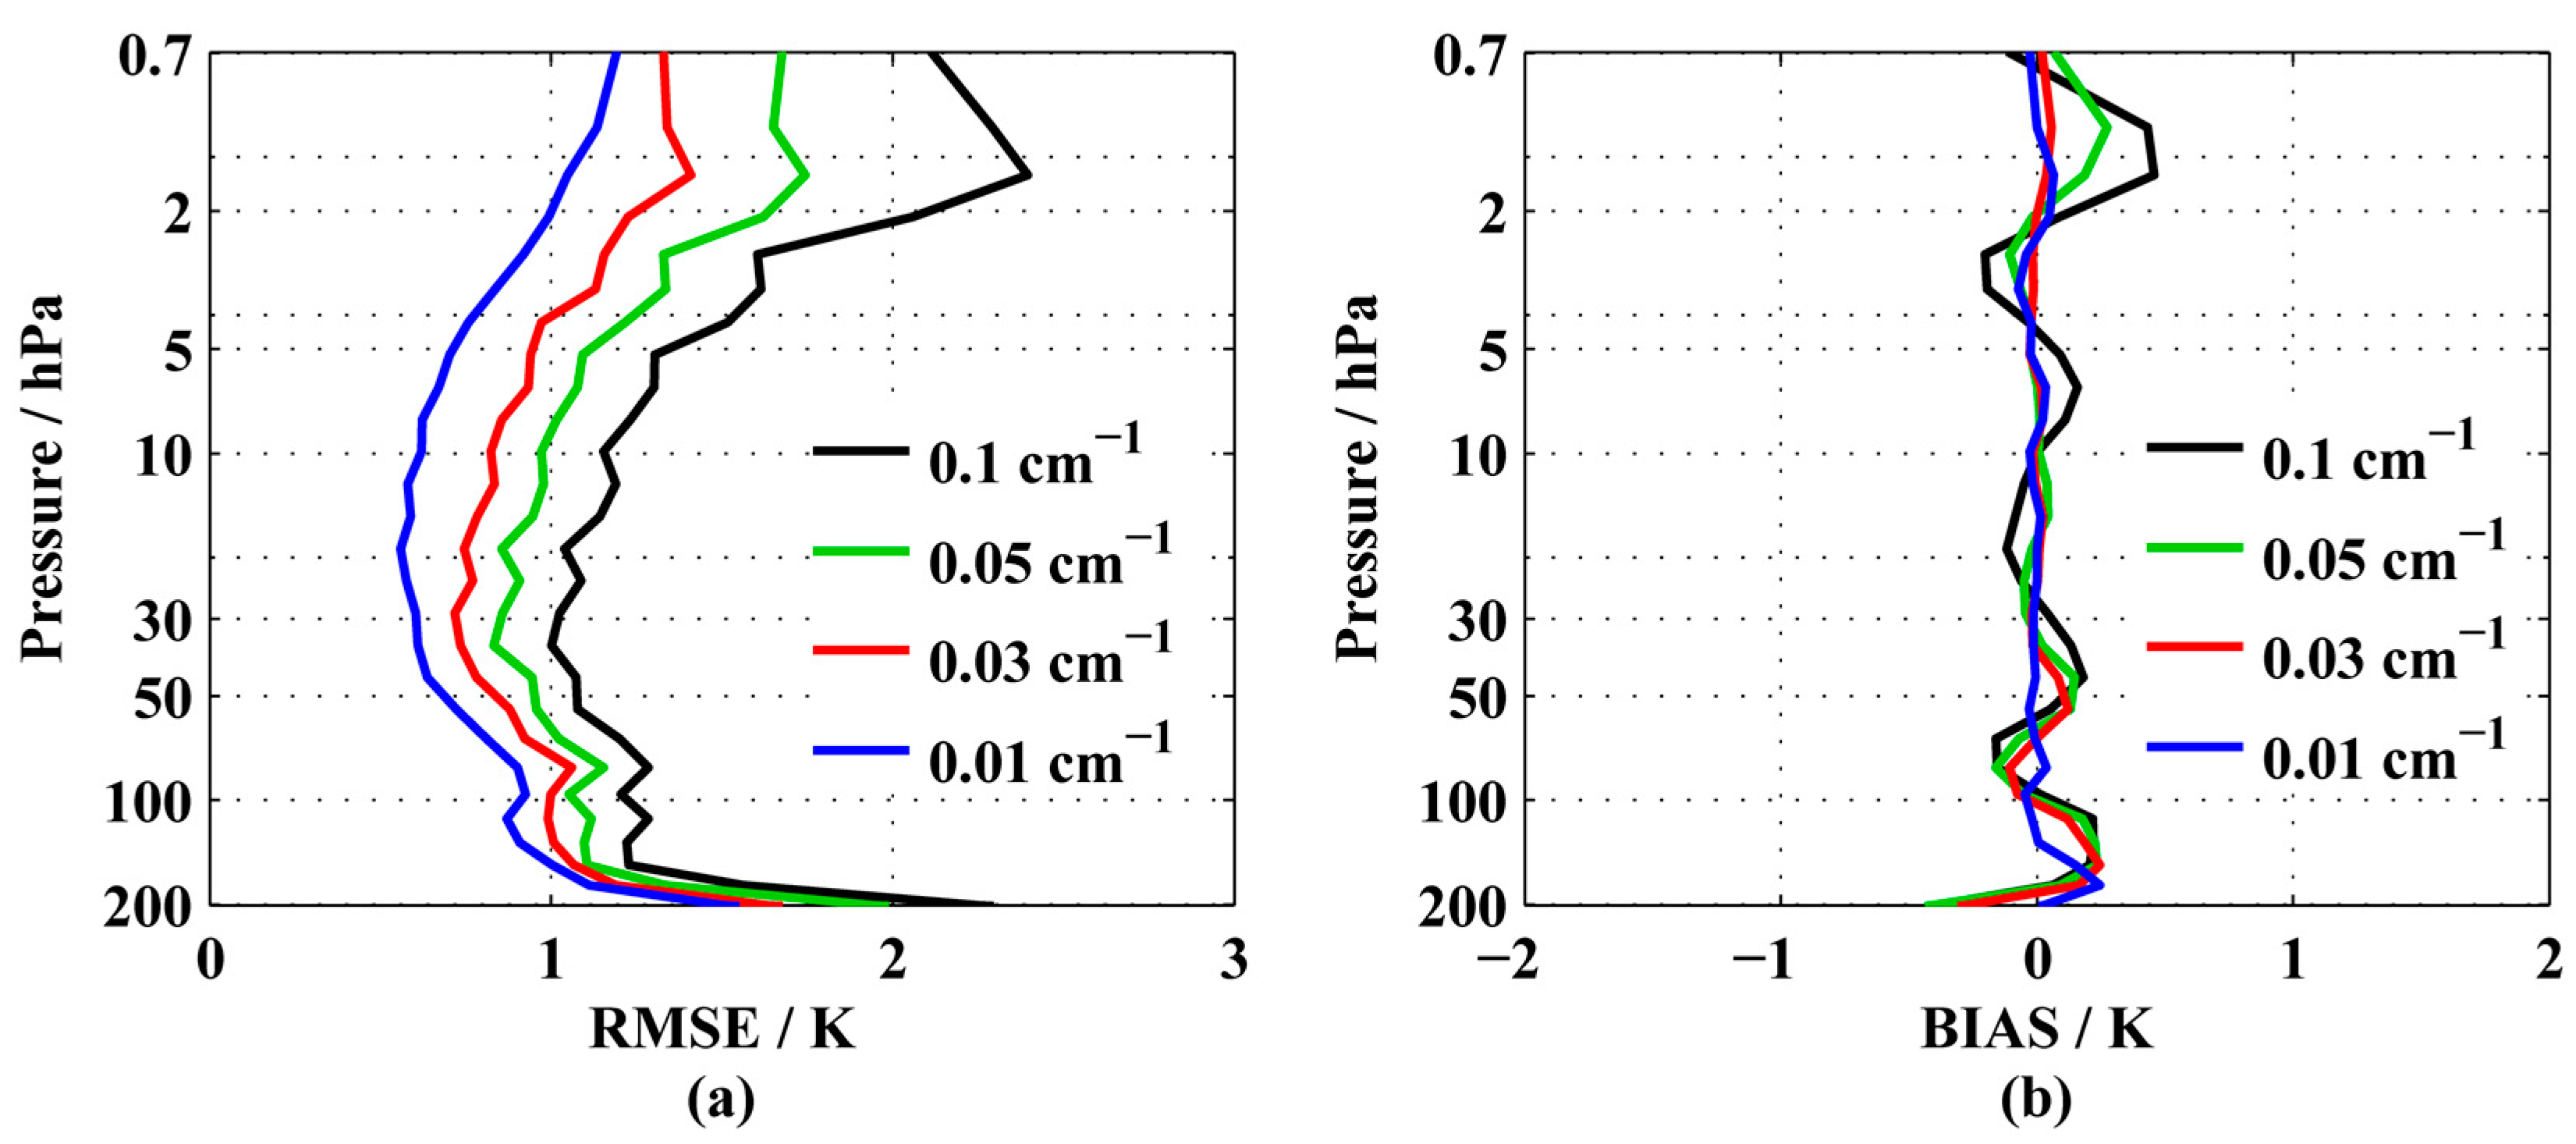
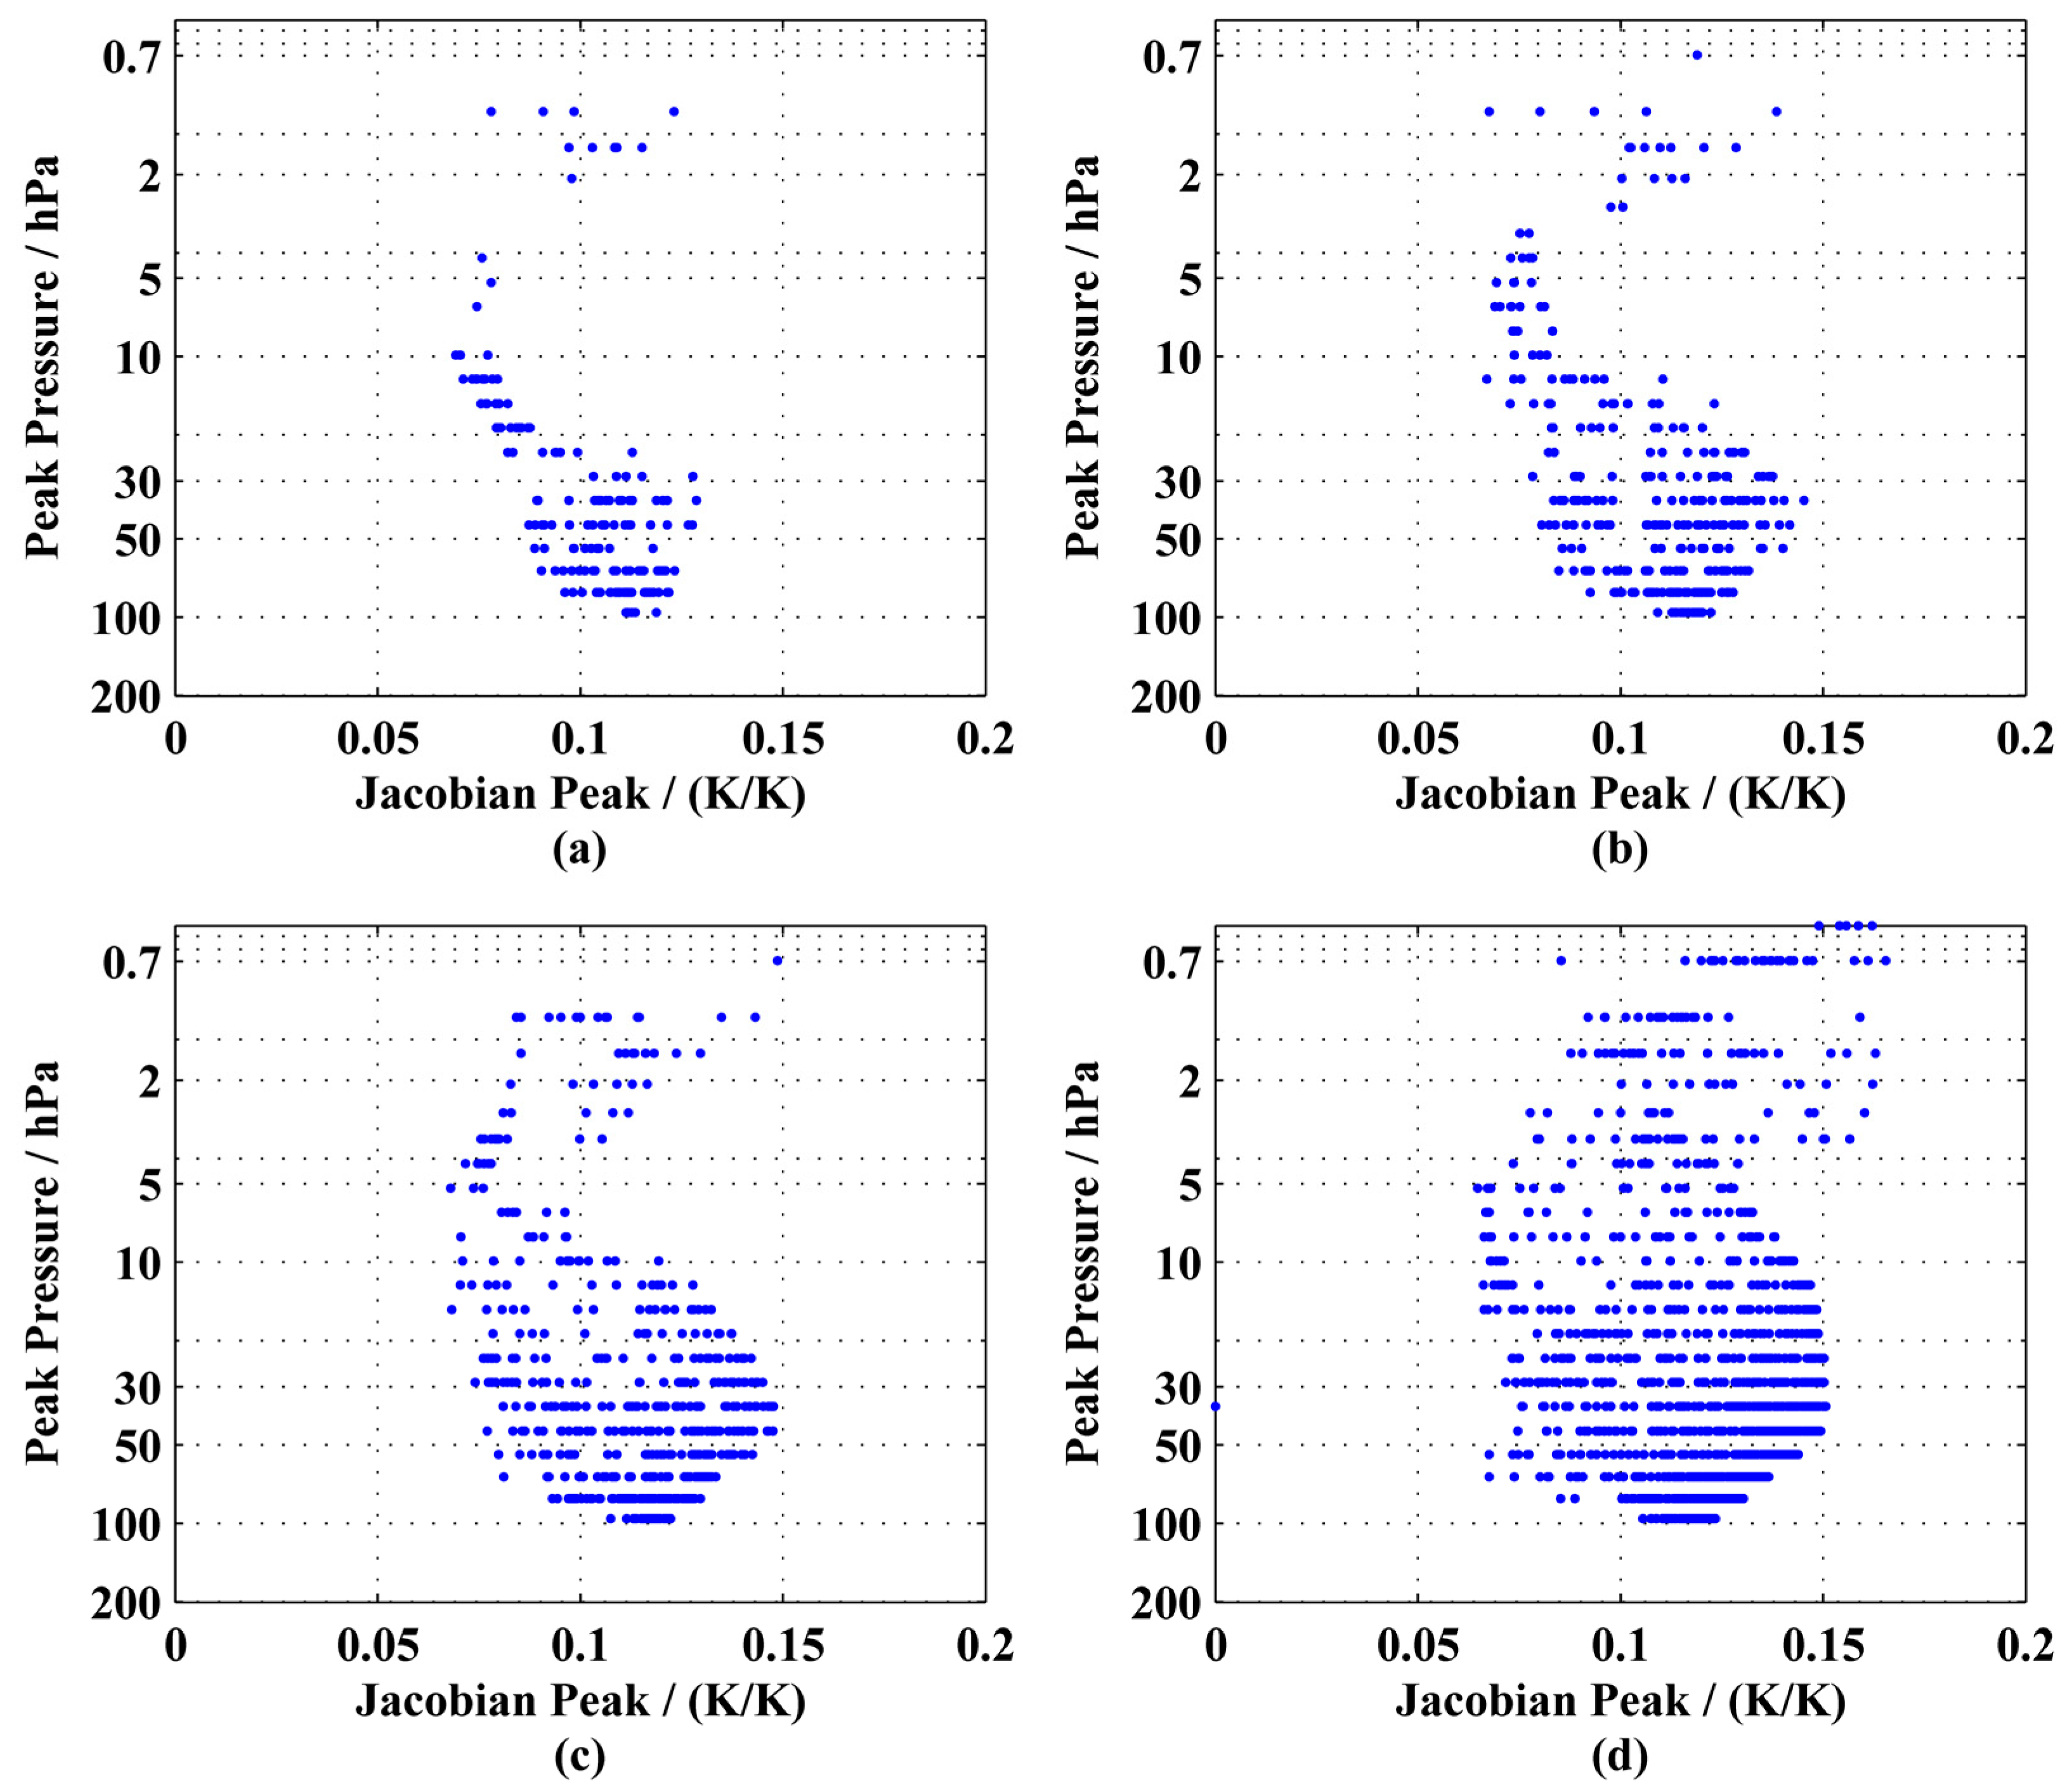
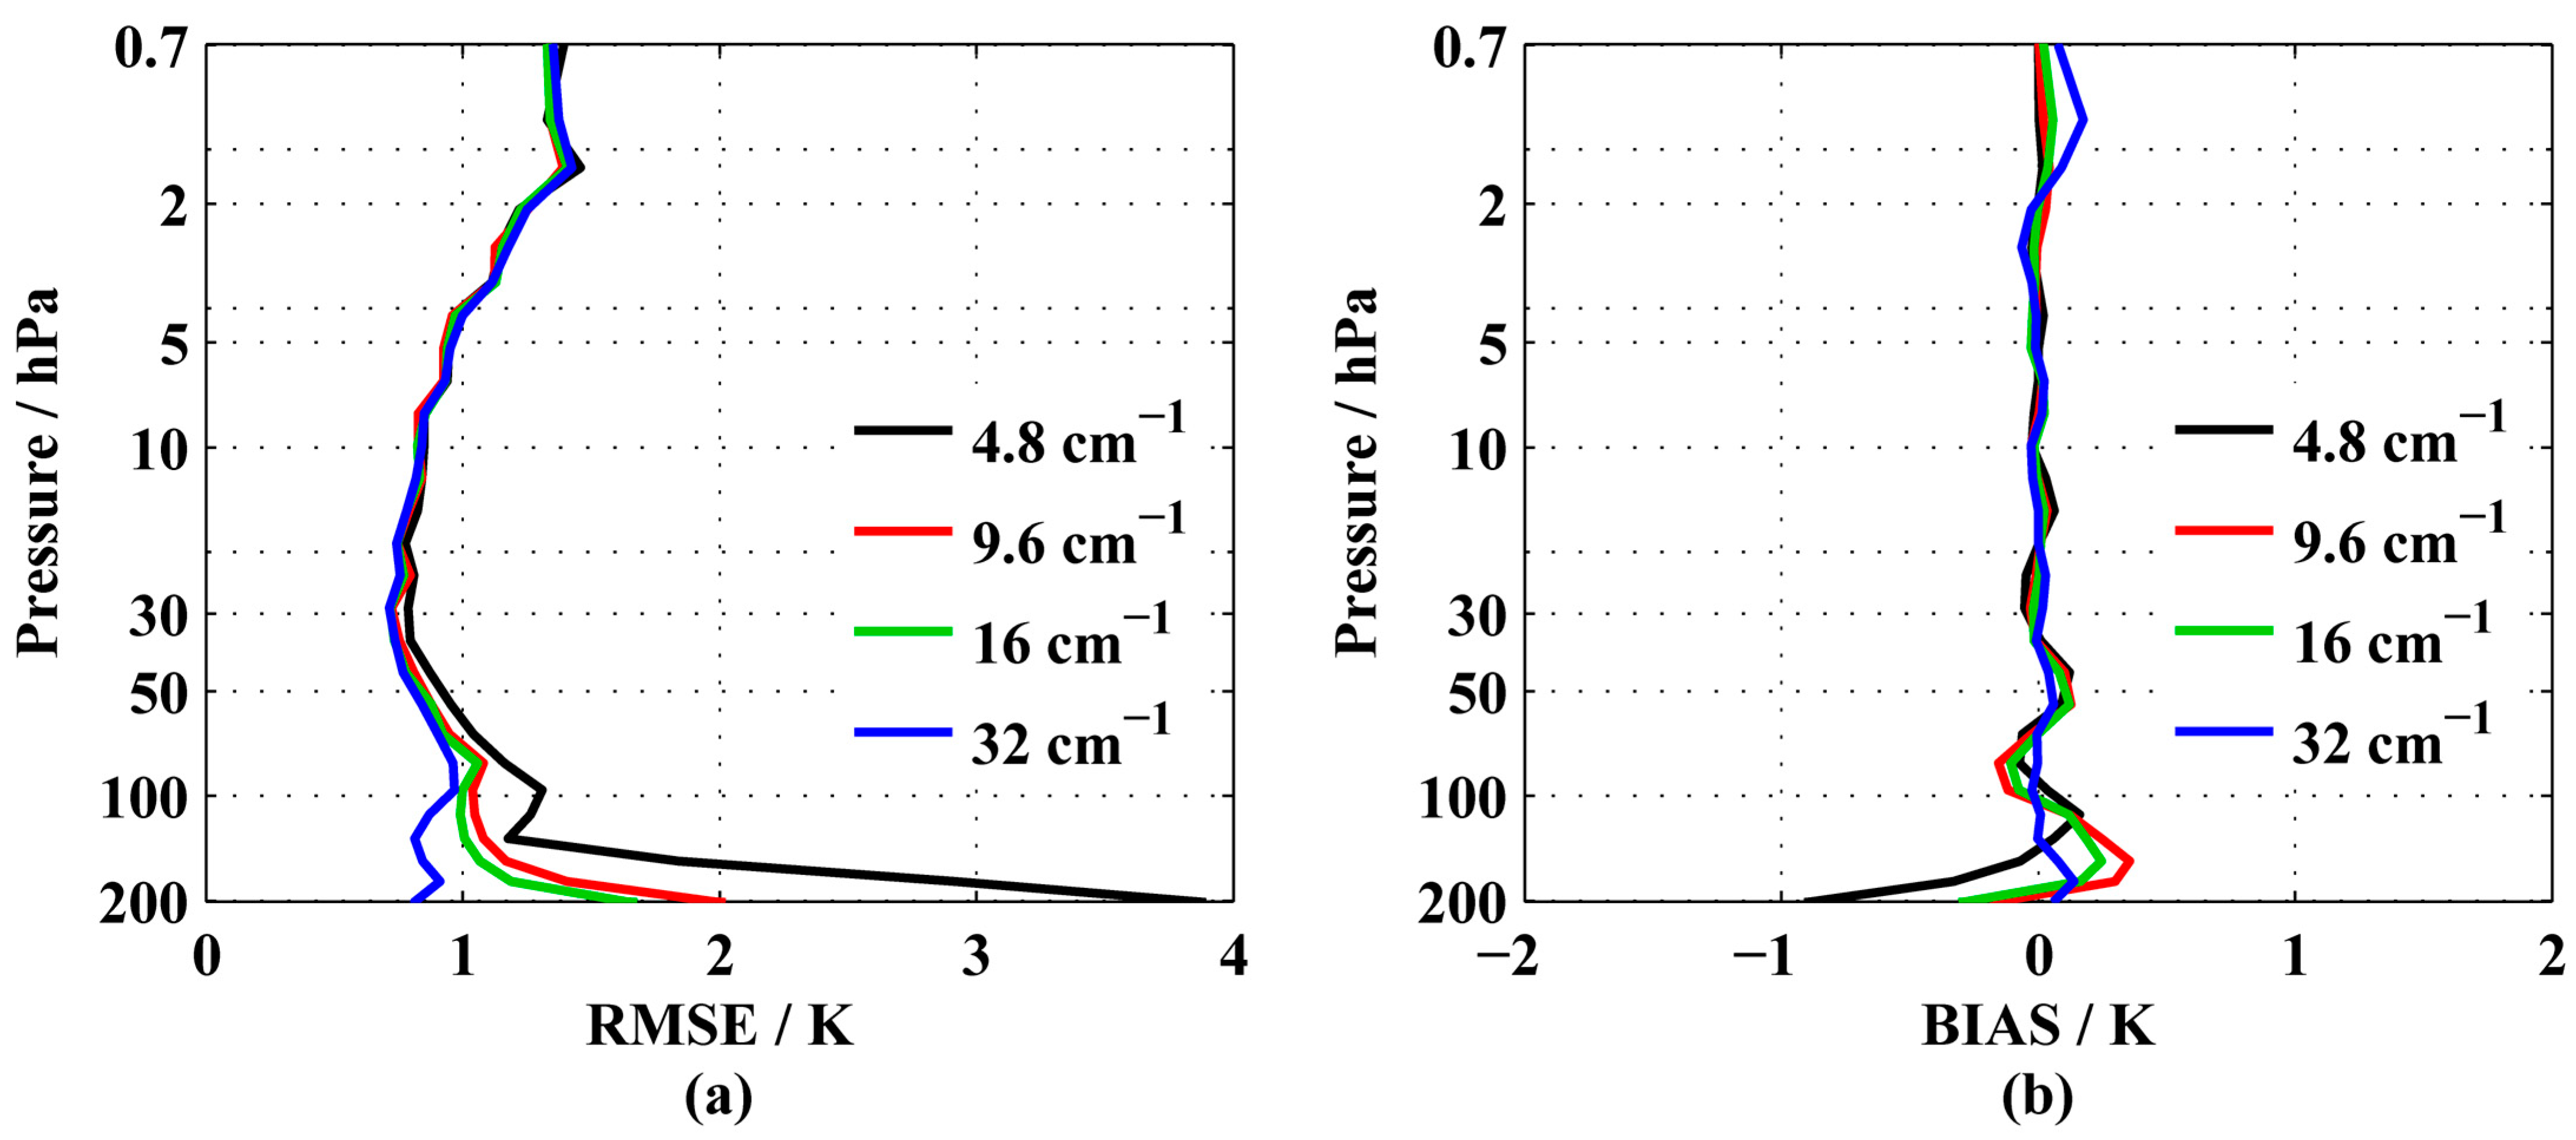
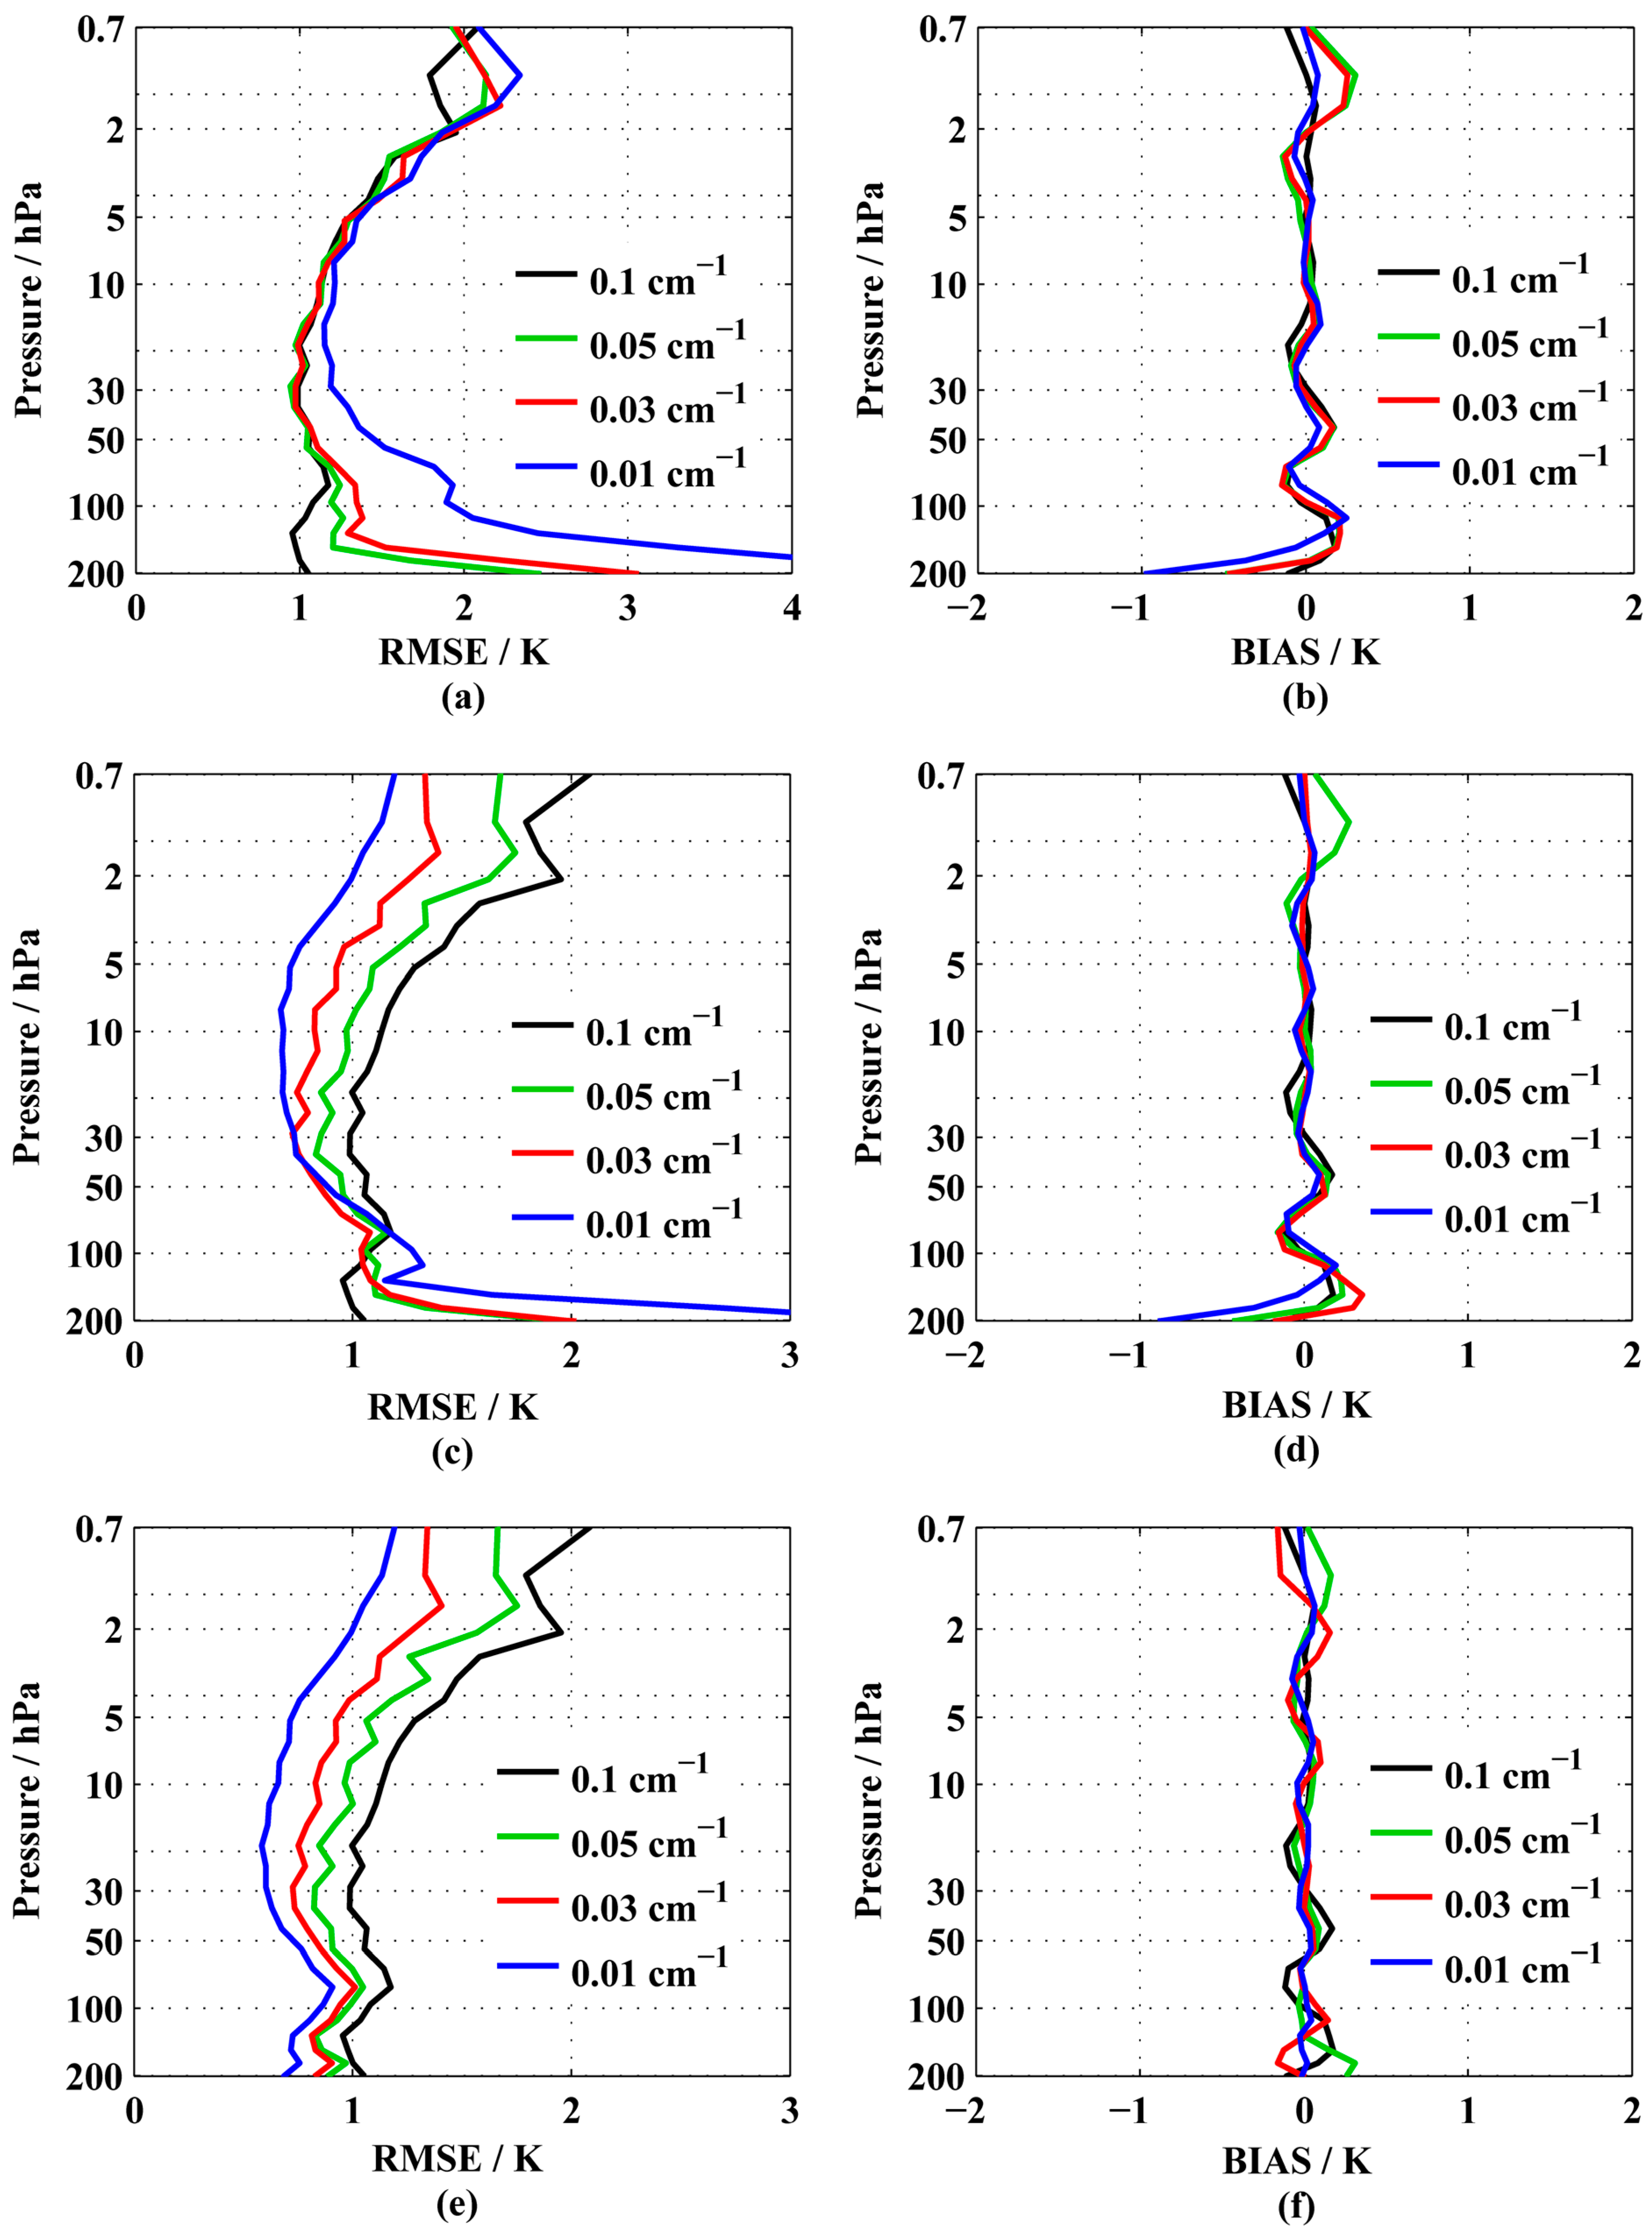
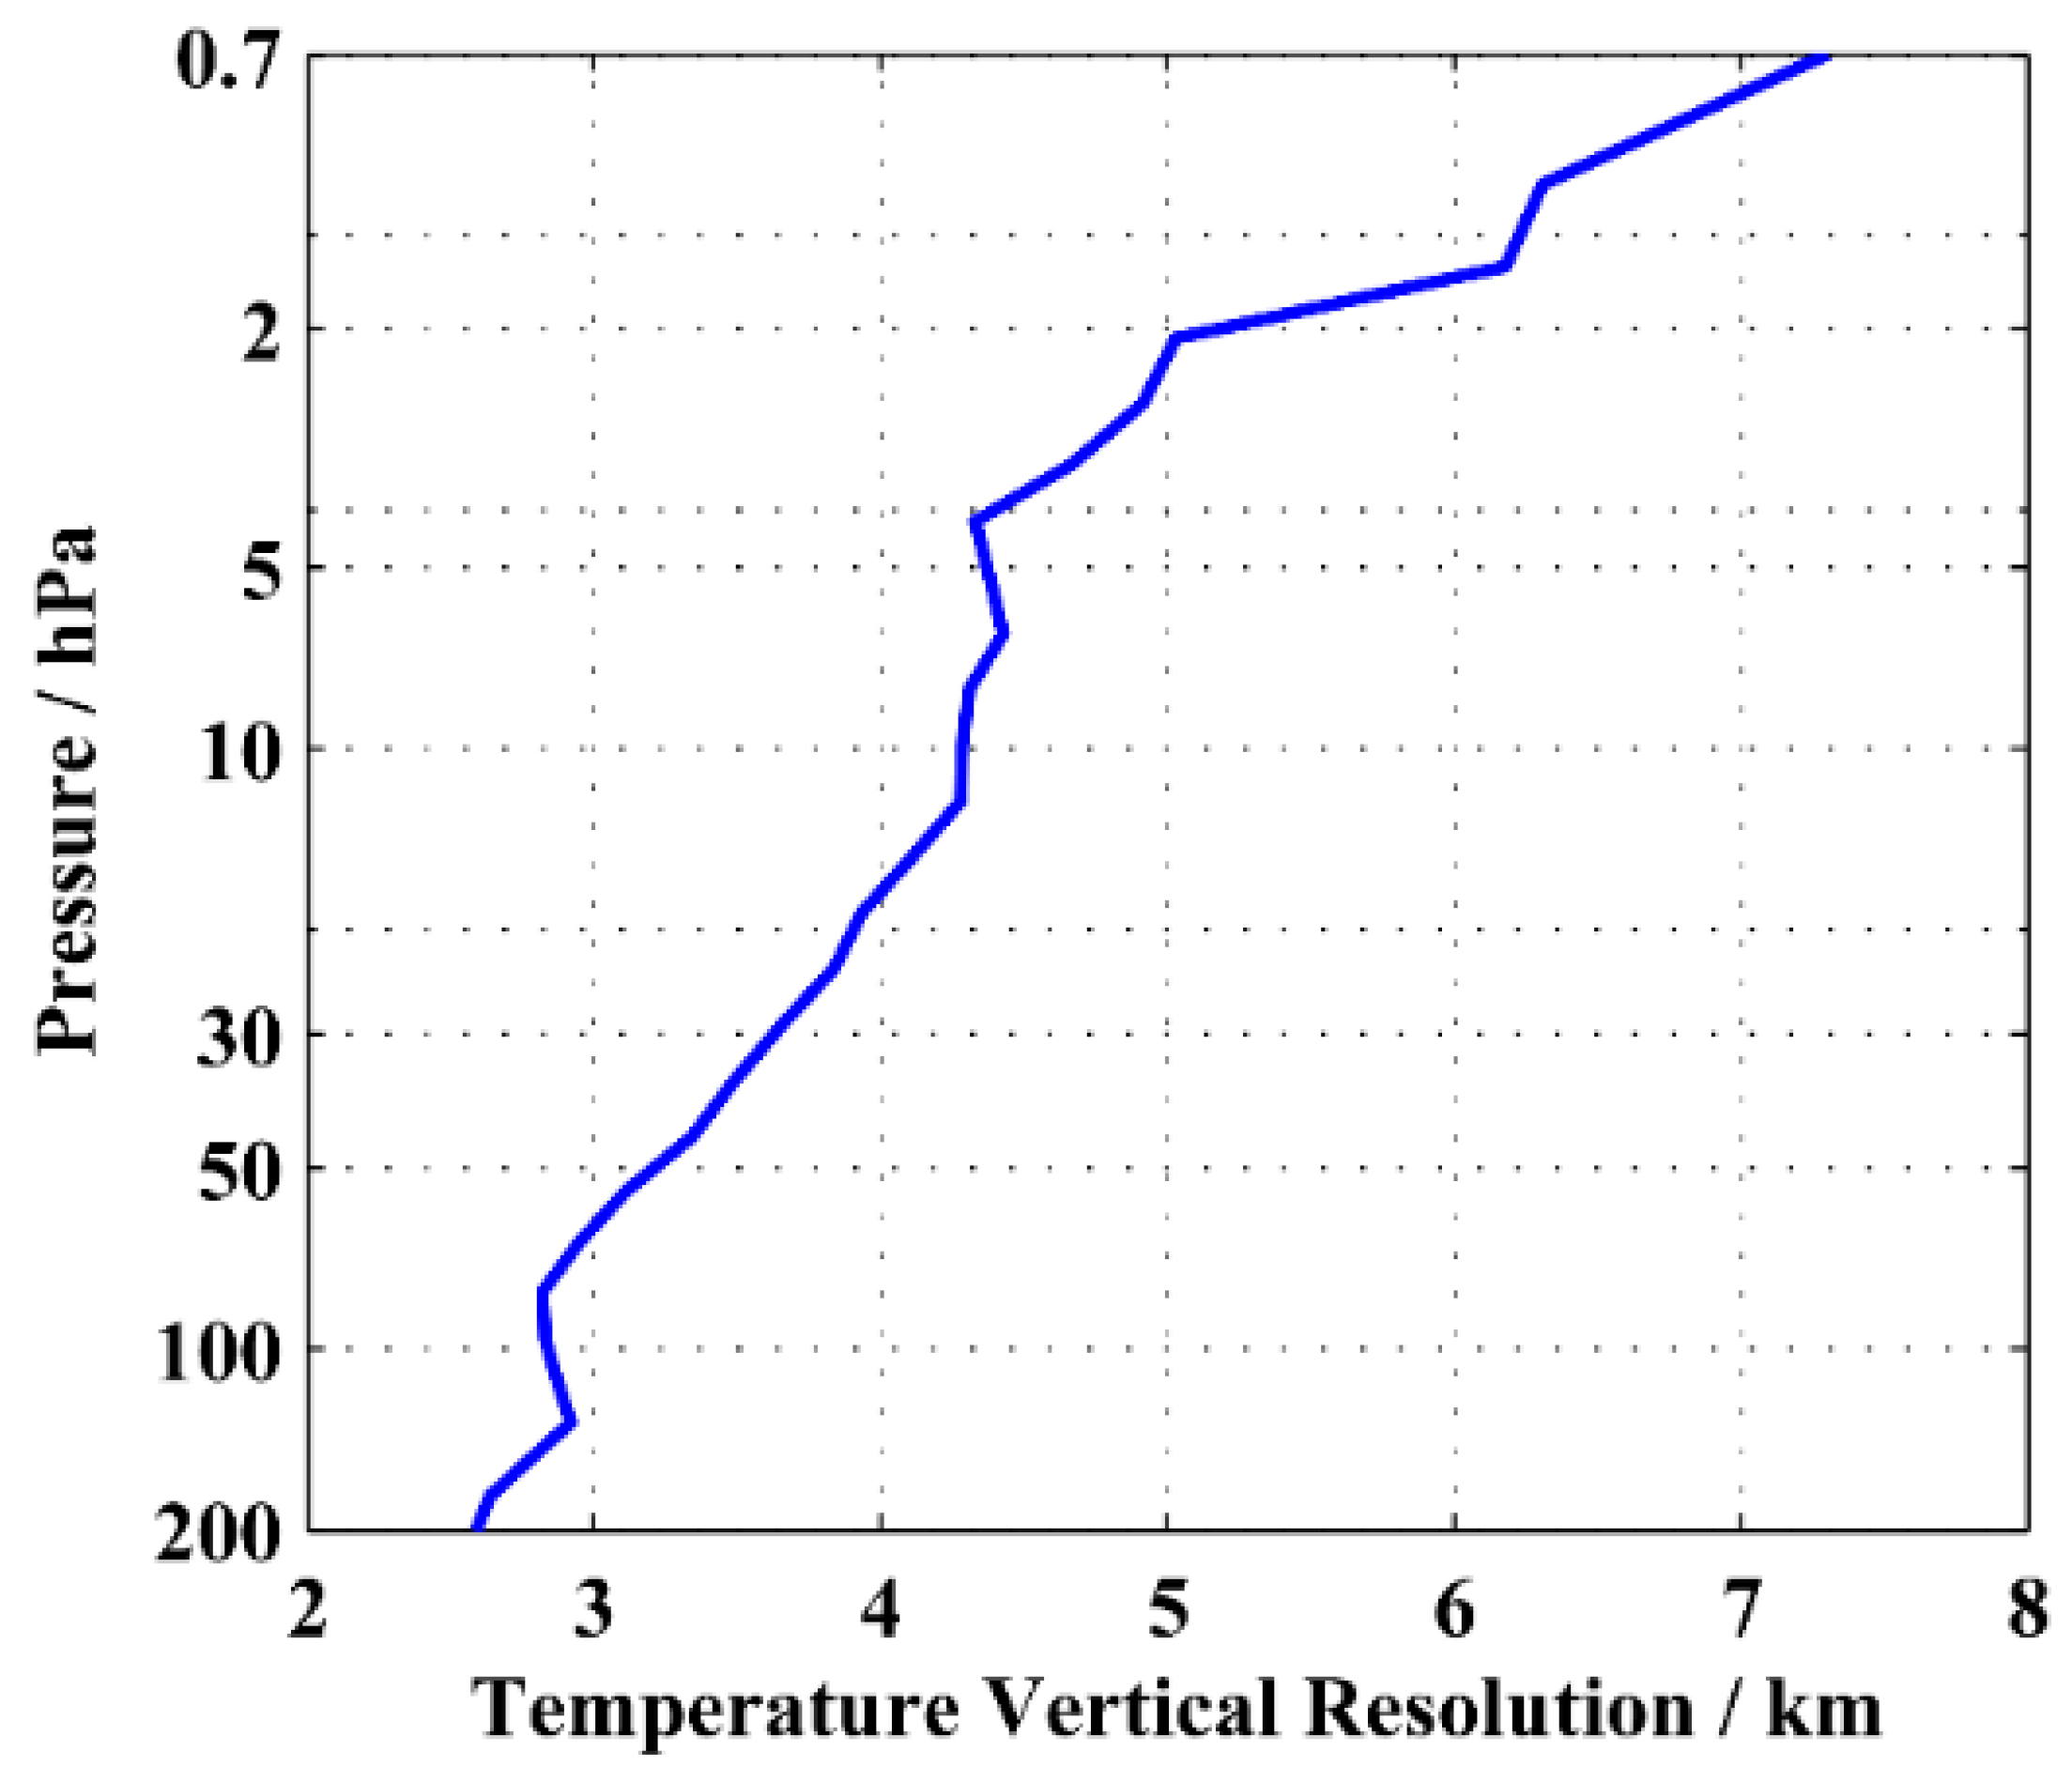
3.1.1. Spectral Resolution

Four retrieval tests are set to analyze the influence of spectral resolution on the sounding capability. Root mean square error (RMSE) and bias are utilized as the evaluation criteria. The spectral resolutions of the four retrieval tests are set to 0.1 cm−1, 0.05 cm−1, 0.03 cm−1, and 0.01 cm−1, respectively, in the condition of a spectral range of 16 cm−1, a spectral region of 666.1–682 cm−1, and an instrumental noise (NeDT) of 0.1 K (at 226 K reference level). When the spectral resolution is increased and the spectral range is not changed, the number of channels is increased. As shown in Figure 6, RMSE is obviously improved, and the variation of BIAS is relatively small with increasing spectral resolution. When the spectral resolution is improved from 0.1 cm−1 to 0.05 cm−1, 0.03 cm−1 and 0.01 cm−1, respectively, RMSE can be increased by 0.7 K, 1.0 K and 1.4 K at most, with an average increase of 0.3 K, 0.4 K and 0.6 K per layer.
Considering that the temperature Jacobian can reflect the sensitivity of the channels to the temperature profile, we will discuss how the spectral resolution affects the detection capability in terms of temperature Jacobians. Figure 7 shows the sensitivity of the channels to the pressure in the spectral region 666.1–682 cm−1. The axis coordinates of the blue point are defined in the same manner as in Figure 4. When the spectral resolution increases from 0.1 cm−1 to 0.01 cm−1, the number of blue points increases in each peak pressure, so there are more channels sensitive to the stratospheric temperature profile. Figure 8 shows the variation of temperature Jacobian curves with the spectral resolution by taking three channels of 668.4 cm−1, 669 cm−1 and 671 cm−1, for example. As spectral resolution improves, the temperature Jacobian curves gradually become narrow, and the peak values increase. The result is that the channel is more sensitive to the temperature of the peak pressure, and the variation of the observation brightness temperature becomes more obvious. The radiation contribution of the peak pressure to the total radiation increases. That is, the total radiation can better reflect the temperature information of the peak pressure. The change of spectral resolution can affect the peak value and curve width of the temperature Jacobian of the channel and the number of the peak pressure. Therefore, the improvement in spectral resolution is beneficial for the sounding of the stratospheric temperature profiles.

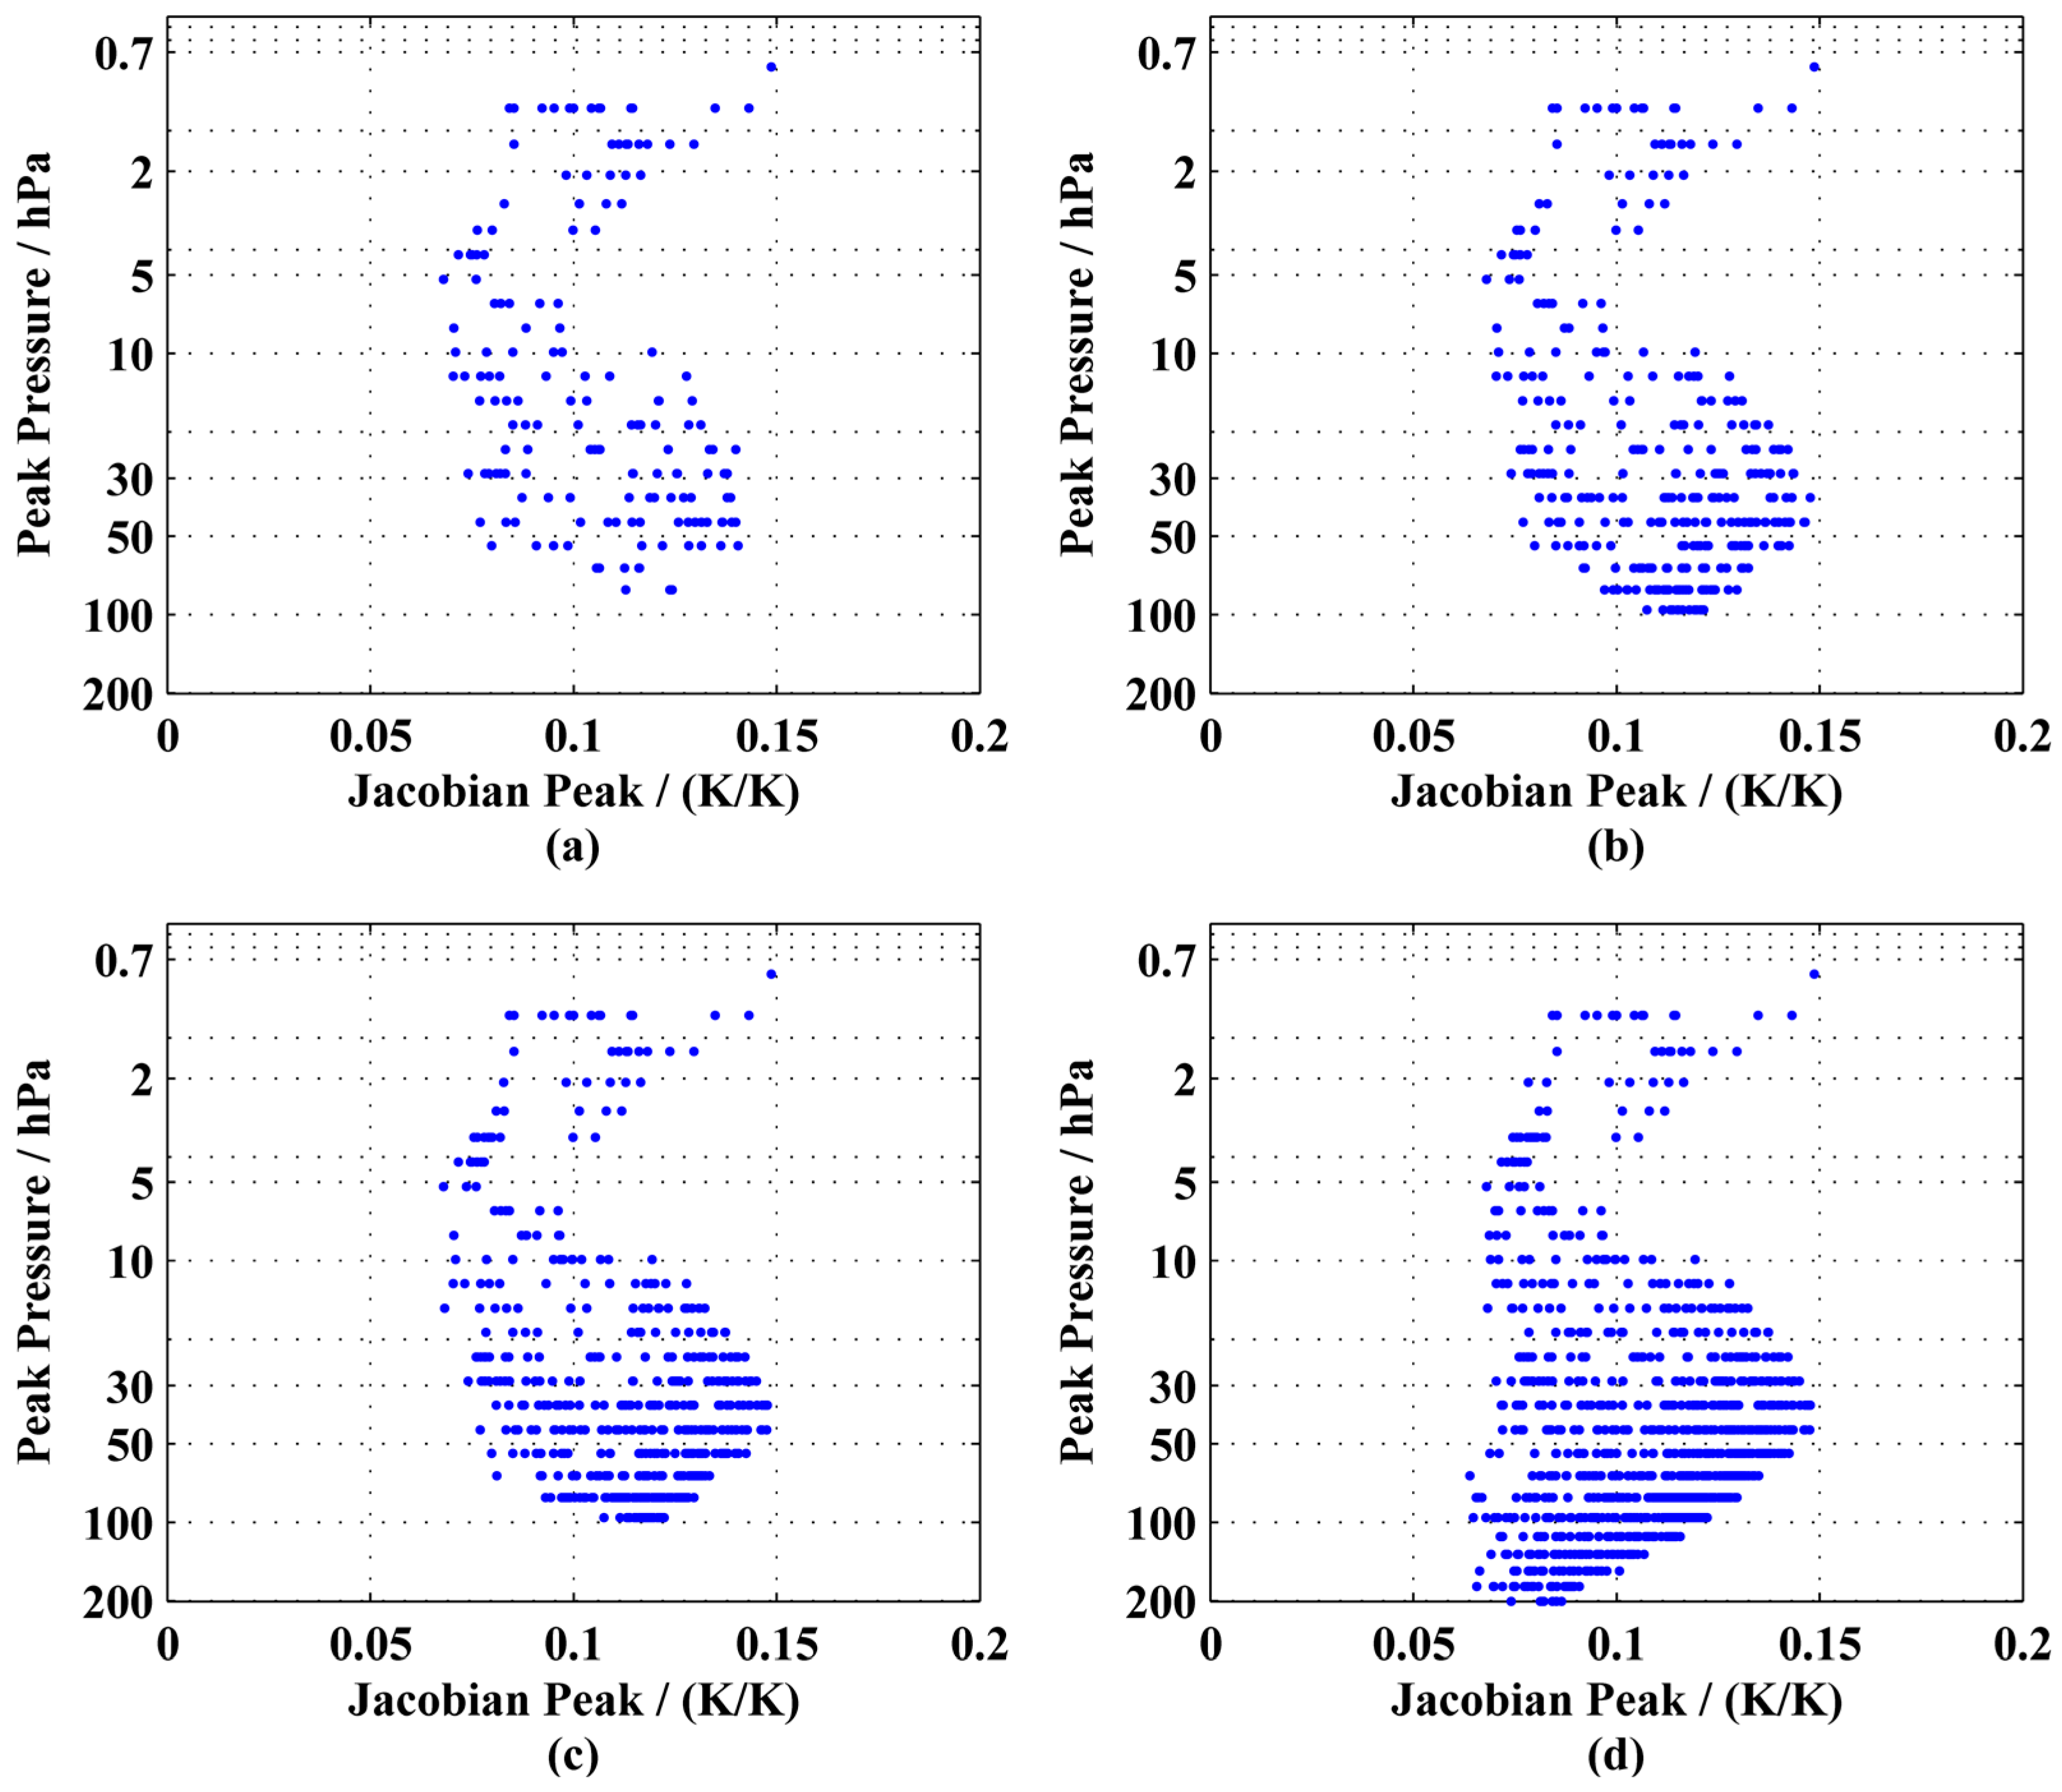
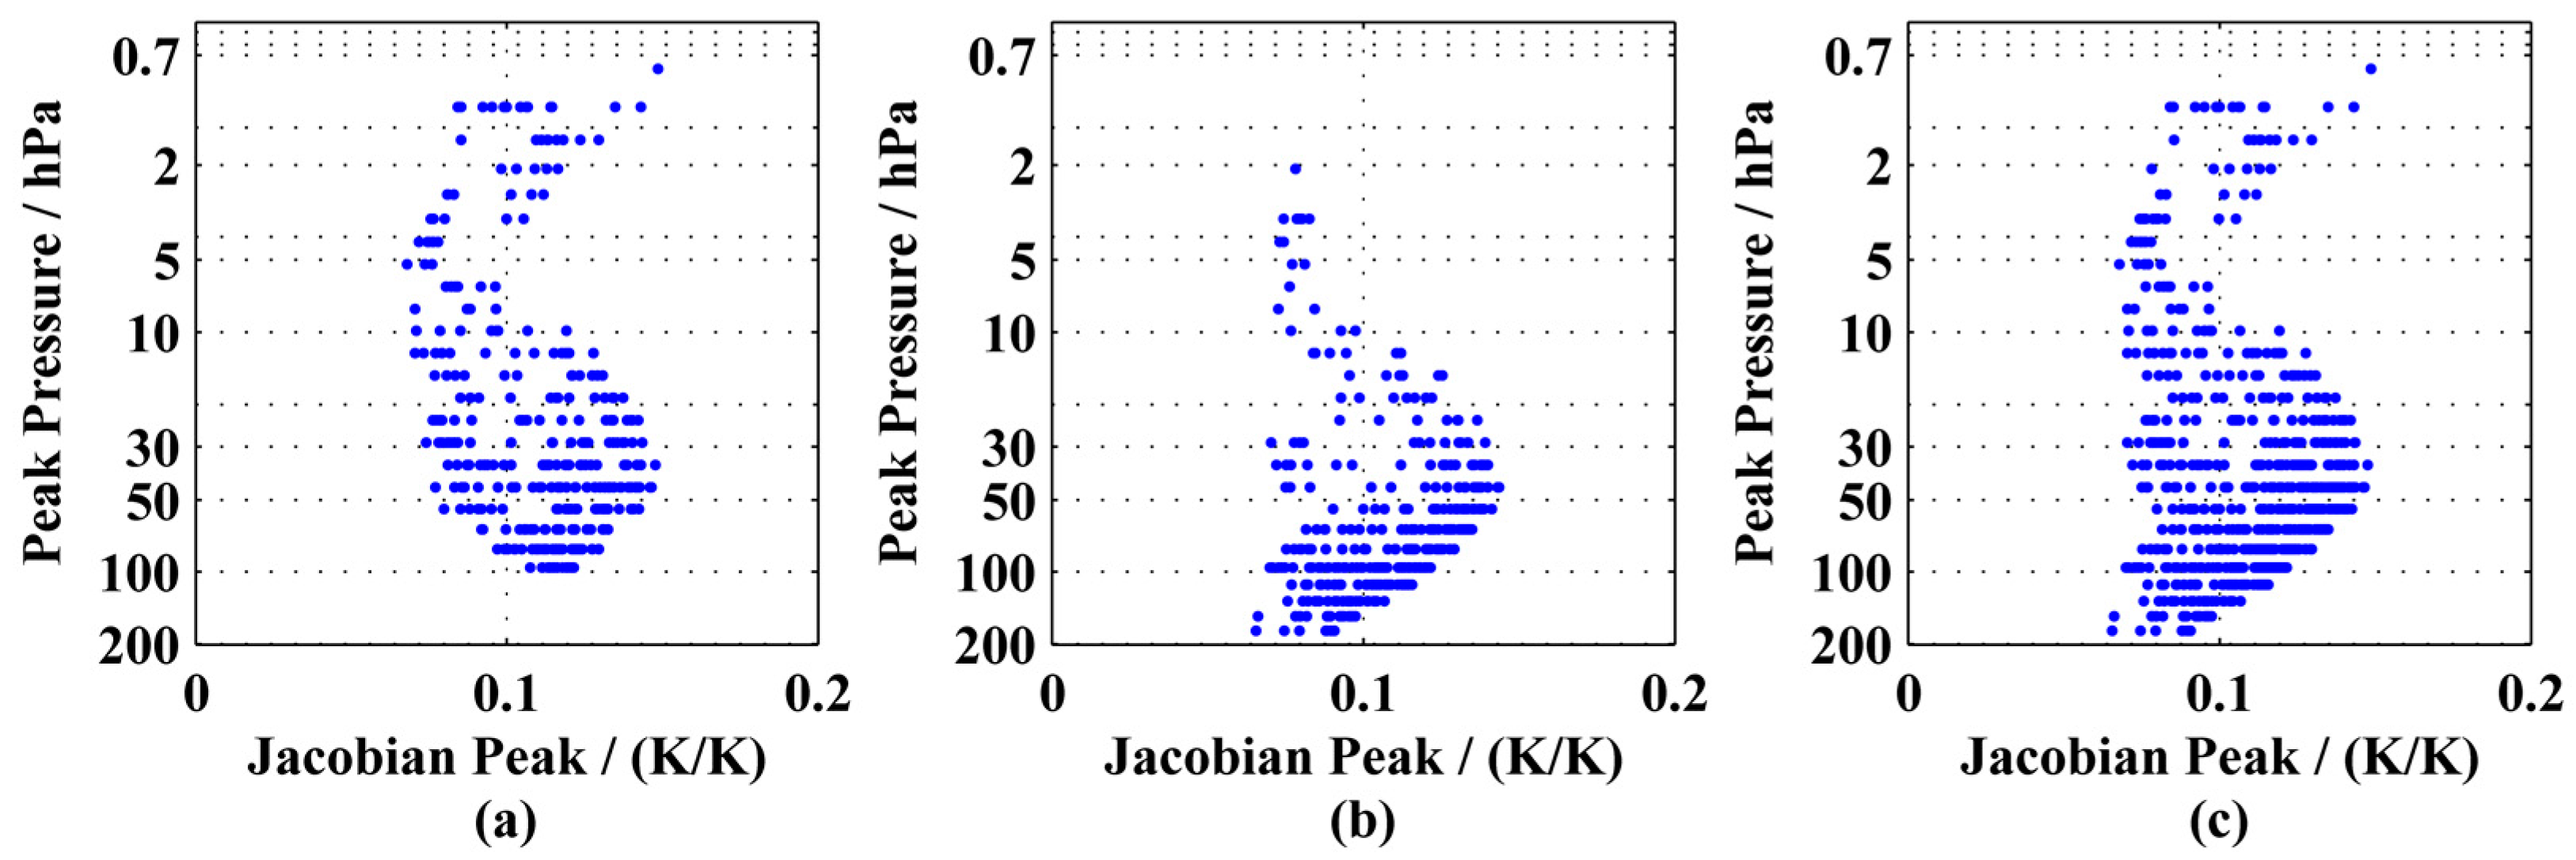
3.1.2. Spectral Range

We also set four retrieval tests to analyze the effect of spectral range on the vertical sounding capability. The spectral ranges of the four retrieval tests are set to 4.8 cm−1, 9.6 cm−1, 16 cm−1, and 32 cm−1, respectively, in the condition of a spectral resolution of 0.03 cm−1 and instrumental noise of 0.1 K. As shown in Figure 9, as the spectral range gradually widens, the accuracy changes slightly between 80 and 0.7 hPa, but improves between 200 and 80 hPa.
We still discuss how the spectral range influences the sounding capability in terms of temperature Jacobians. As shown in Figure 10a–d, the distributions of the blue points are almost unchanged from 10 to 0.7 hPa. This indicates that the number of channels sensitive to the peak pressures does not increase obviously, which leads to no significant improvement in the retrieval accuracy (RMSE) in Figure 9. Between 80 and 10 hPa, the blue points increase as the spectral range increases. This shows there are more channels sensitive to these pressures, but the RMSE does not improve significantly. This indicates that when the spectral range is narrow, the channels sensitive to this pressure range contain sufficient information to satisfy the requirement of the retrieval. Further increasing the spectral range leads to the slight improvement in the retrieval accuracy of this pressure range. Then, between 200 and 80 hPa, the blue points still increase as the spectral range increases. The number of peak pressures corresponding to the blue points tends to increase, resulting in a significant improvement of the RMSE in Figure 9. This illustrates that widening the spectral range can help improve the retrieval accuracy of the temperature of this pressure range.
Thus, increasing the spectral range can significantly improve the temperature retrieval accuracy for some atmospheric pressure levels, but not for other pressure levels. If a wide spectrum with the ultra-high spectral resolution is used for sounding, there will be some channels that make little or no contribution to the retrieval. Thus, several discontinuous narrow bands can be used for joint-sounding for different pressure ranges to improve the effectiveness of the spectrum.

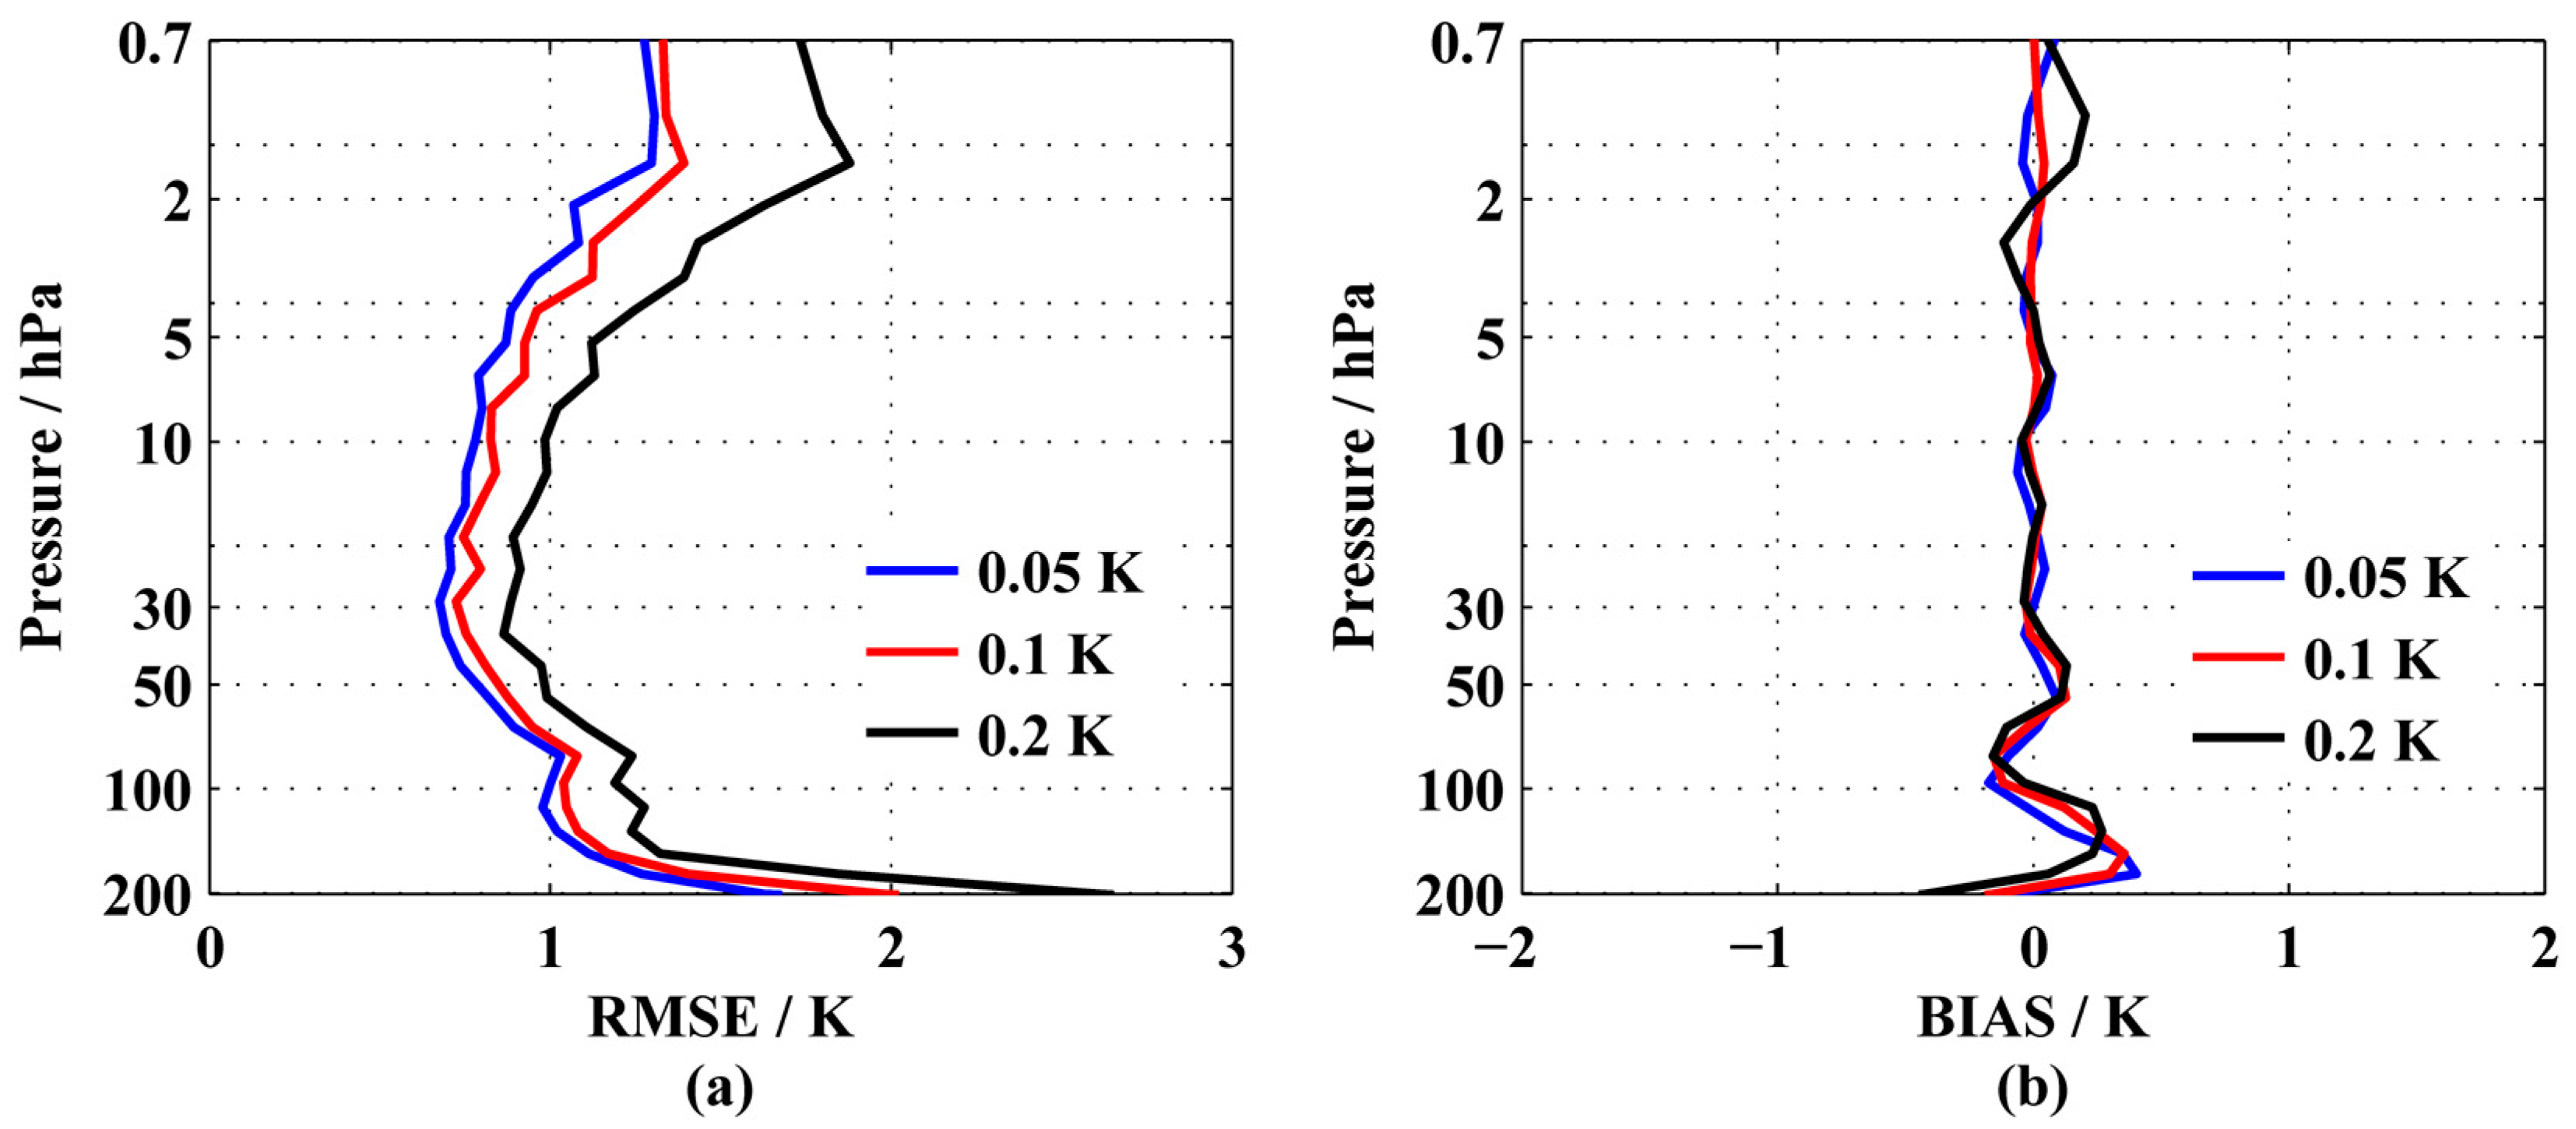
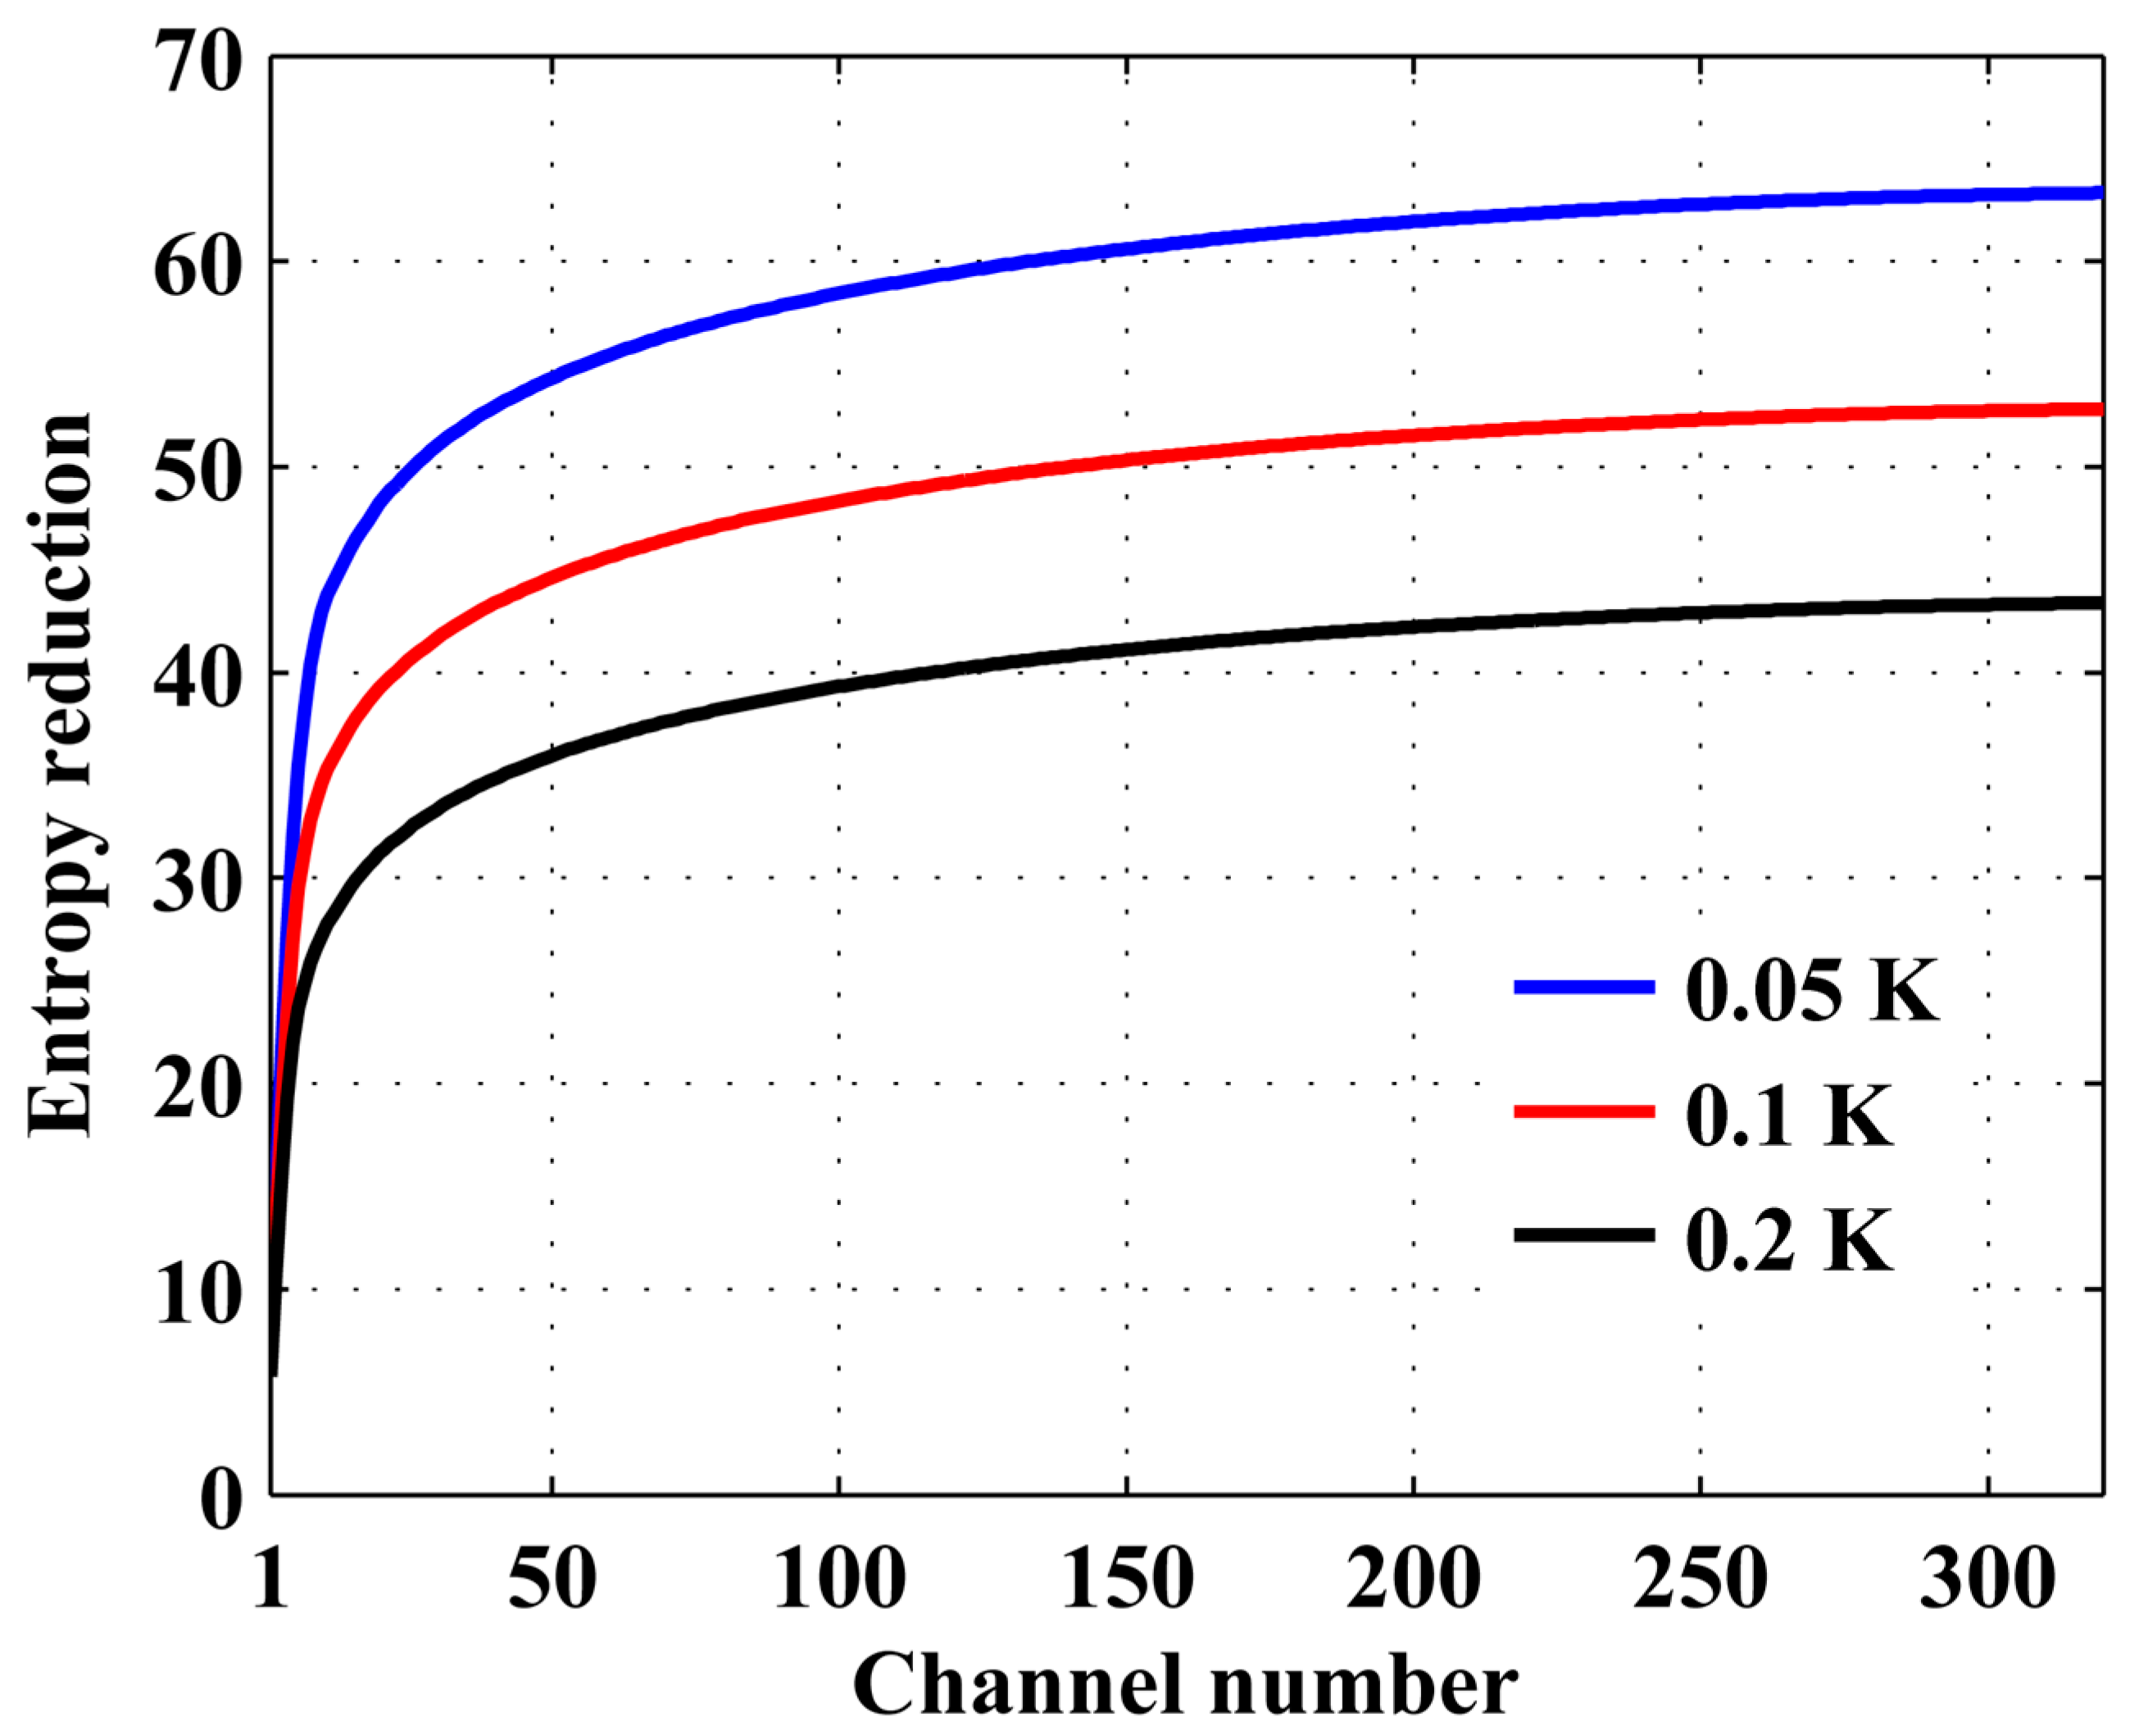
3.1.3. Instrumental Noise

Three retrieval tests were used to analyze the influence of instrumental noise on the sounding capability. The instrumental noises of the three retrieval tests are set to 0.05 K, 0.1 K and 0.2 K, respectively, with a spectral resolution of 0.03 cm−1, a spectral range of 9.6 cm−1, and a spectral region of 666.87–676.44 cm−1. As shown in Figure 11, the retrieval accuracy improves with the reduction of the instrumental noise. When the instrumental noise is reduced from 0.2 K to 0.1 K and from 0.1 K to 0.05 K, the RMSE can be increased by 0.6 K and 0.4 K at most, with an average increase of 0.2 K and 0.1 K. We analyze how the instrumental noise influences the sounding capability in terms of information content. The information content is an index of sounder performance. The larger the information content is, the more information the sounder can observe. Sufficient observation information is advantageous to retrieval. In Figure 12, with the reduction of instrumental noise, the total information content of the spectral channels increases. This means that the information observed by the sounder increases, which is conducive to retrieval. Therefore, the retrieval accuracy can be improved by reducing the instrumental noise to a certain extent.

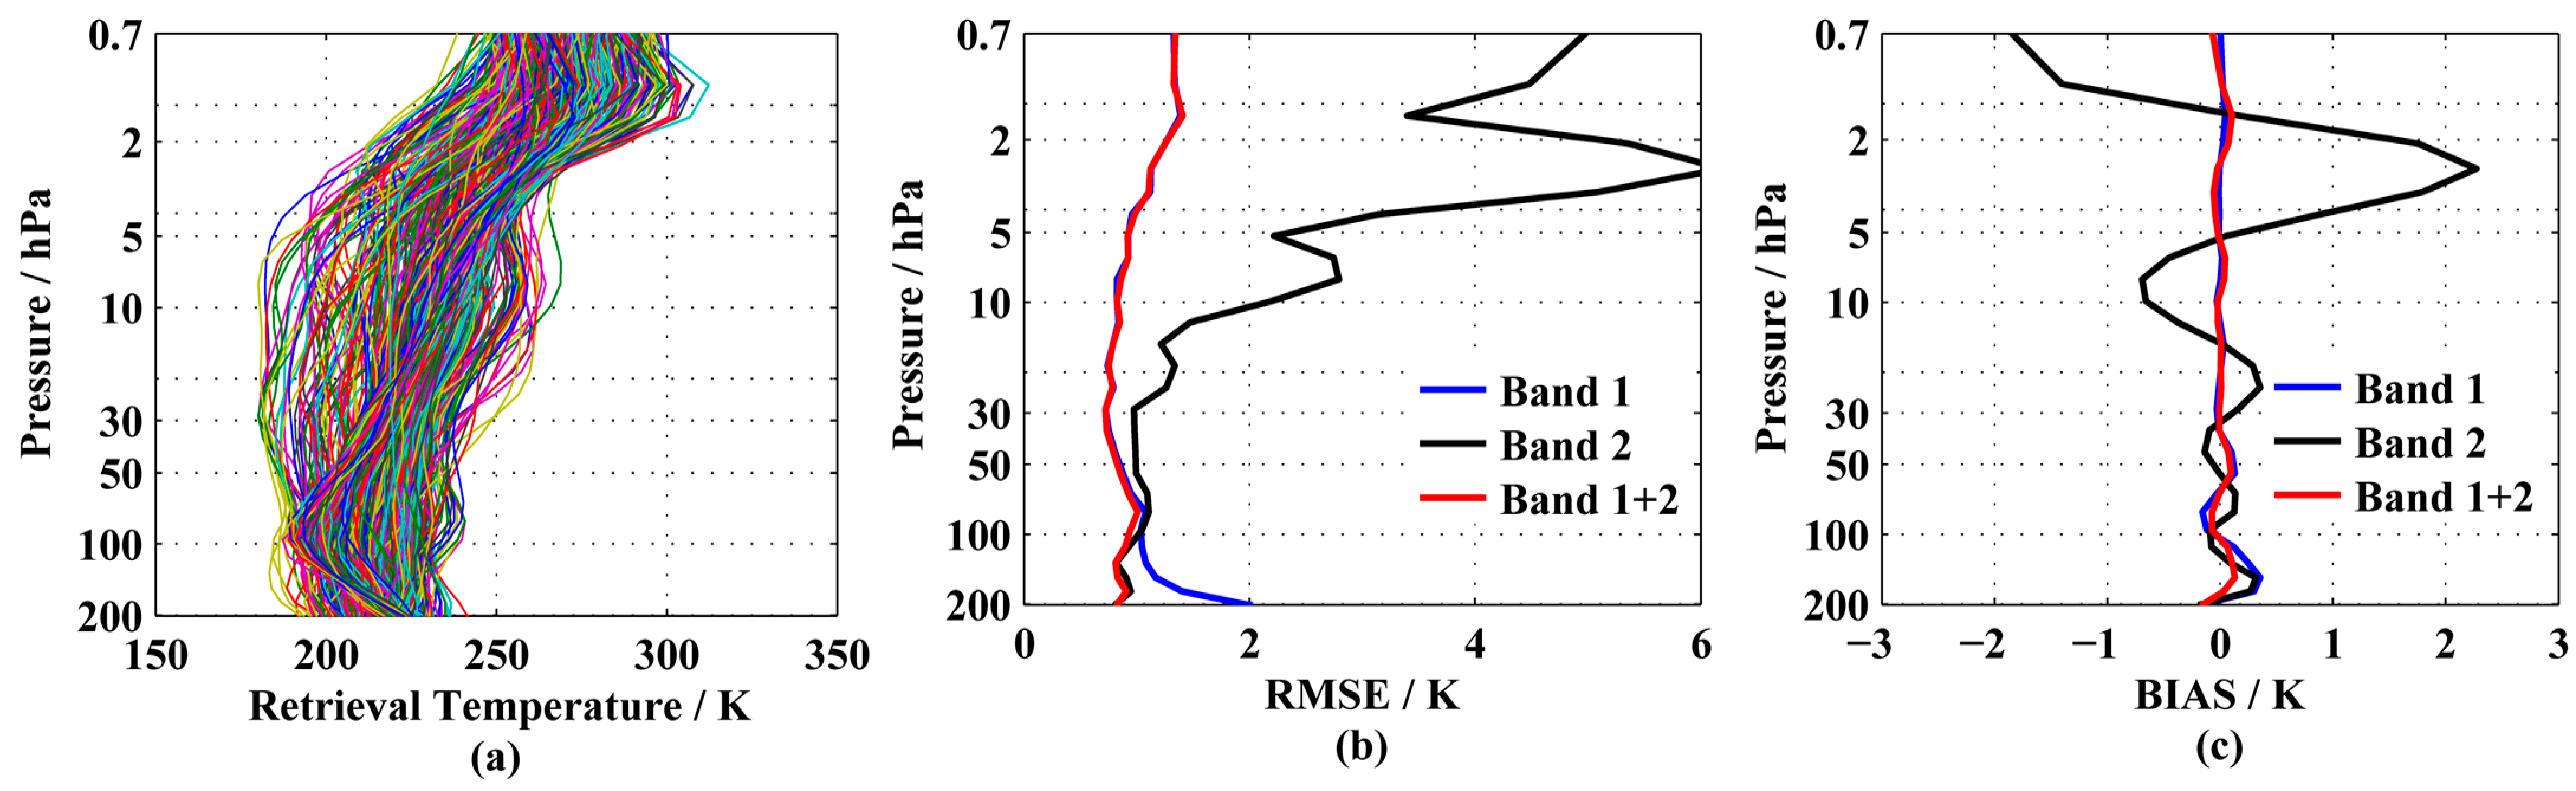
3.2. The Soundings of the Single Spectral Band and Multiple Spectral Bands

As seen from Section 3.1, spectral resolution, spectral range and instrumental noise impact the sounding capability, and the three are mutually restrictive. Spectral range ( σ ) is determined by spectral resolution ( δ σ ) and the number of the detector pixels (N), using the following equation [50]:
σ = δ σ   ·   N / 2
Instrumental noise is expressed as NeDT [51]
NeDT = NeDR R   /   T B
where R is the Planck function, and T B is the reference temperature. This formula can be derived as follows [52,53]:
NeDT = 2 F 2   ·   T B 2   ·   [ exp ( c 2   ·   σ / T B )     1 ] 2 t   ·   N   ·   A D   ·   τ 0   ·   δ σ   ·   D *   ·   c 1   ·   c 2   ·   σ 4   ·   exp ( c 2   ·   σ / T B )
where F is the F number of the optical system, c1 is the first radiation constant, c2 is the second radiation constant, σ is the wavenumber of the channel, t is the exposure time, AD is the area of detector pixels, τ 0 is the transmittance of the optical system, and D* is the detectivity of the detector.
According to Equation (5), instrumental noise is determined by multiple parameters and is inversely proportional to spectral resolution. When the instrumental noise corresponding to a spectral resolution of 0.1 cm−1 is 0.1 K, those corresponding to the spectral resolution of 0.05 cm−1, 0.03 cm−1 and 0.01 cm−1 are 0.2 K, 0.33 K and 1 K, respectively, in the condition that the exposure time and other parameters remain unchanged. The number of detector pixels is set to 640 (according to the literature investigation, the maximum pixel number of the long-wave infrared detector is 640). When the spectral resolutions are 0.1 cm−1, 0.05 cm−1, 0.03 cm−1 and 0.01 cm−1, respectively, the corresponding spectral ranges are 32 cm−1, 16 cm−1, 9.6 cm−1, and 3.2 cm−1.
Suitable narrow bands should be selected for the soundings. They are picked out from the infrared spectral region of 600–800 cm−1 based on two basic selection principles. One principle is that the peak pressure layers of the band should cover most or even the whole sounding pressure range; the other is that the total information content of all the spectral channels should be the largest of the candidate bands. The selection method will be described in detail in another paper. The number of narrow bands required will be different for different spectral resolutions to realize the entire stratospheric temperature soundings.
The spectral schemes of the single narrow bands used for stratospheric temperature sounding are shown in Table 2. Under the constraints of the above instrument parameters, the retrieval accuracy is shown in Figure 13a,b. In general, RMSE corresponding to the spectral resolution of 0.01 cm−1 is the worst. The RMSE of spectral resolutions of 0.05 cm−1 and 0.03 cm−1 is inferior to that of 0.1 cm−1 at 2–0.7 hPa and 200–50 hPa. The retrieval accuracy is not improved by only increasing the spectral resolution without broadening the spectral range and reducing the instrumental noise. These three instrument parameters should be set reasonably to facilitate the sounding.
In practice, the exposure time in Equation (5) is an adjustable parameter, which can be increased to decrease the instrumental noise. The retrieval is further discussed by adjusting the exposure time to keep the instrumental noise at 0.1 K with different spectral resolutions. The retrieval results are shown in Figure 13c,d. With the improvement of spectral resolution, the accuracy increases obviously between 30 and 0.7 hPa, but is still low: between 200 and 30 hPa. This is because the spectral range is too narrow, leading to a lack of channels sensitive to temperatures between 200 and 30 hPa. If the sounder adopts a spectral resolution of 0.05 cm−1, 0.03 cm−1 or 0.01 cm−1, it should add several narrow bands and use joint-sounding to achieve the purpose of increasing the spectral range.
We can adopt two, two, and three narrow bands for spectral resolutions of 0.05 cm−1, 0.03 cm−1 and 0.01 cm−1, respectively. The scheme is shown in Table 3, and the retrieval results are shown in Figure 13e,f. Relatively high retrieval accuracy is obtained by the joint-sounding of multiple narrow bands. In addition, the accuracy improvement from 30 to 0.7 hPa is more significant than that from 200 to 30 hPa. This may be related to information content. The spectrum sensitive to the temperatures at 30–0.7 hPa is narrow and mainly located at the spectral region of 667–670 cm−1. When a spectral resolution is low, there are few channels and a serious lack of information about the temperature of this pressure range. The improvement of spectral resolution can solve the problem of insufficient information caused by the channel. The retrieval accuracy is thus significantly improved. The spectrum sensitive to the temperature between 200 and 30 hPa is wide, and is mainly located at the spectral regions of 636.6–667 cm−1 and 670–697.3 cm−1. There are many channels for sounding, and the lack of information is small, so the improvement of spectral resolution brings little increase in retrieval accuracy.
Considering the current technical level of SHS (the highest spectral resolution of SHS reported in the literature can be 0.029 cm−1 [54]), two narrow bands with a spectral resolution of 0.03 cm−1 and a spectral range of 9.6 cm−1 are preliminarily adopted for sounding. The specific system parameters are shown in Table 4. Band 1 (the spectral region of 666.87–676.44 cm−1) is used for the temperature sounding between 80 and 0.7 hPa, while Band 2 (the spectral region of 645.87–655.44 cm−1) is used for temperature sounding between 200 and 80 hPa, as the peak pressures of them are mainly distributed in the corresponding pressure range, as shown in Figure 14. Band 1 is the stratospheric band, and Band 2 is the lower stratospheric and the upper tropospheric band. As shown in Figure 15, the accuracy of the two spectral bands’ joint-sounding is superior to that of a separate sounding. The RMSE is from 0.7 K to 1.4 K over a pressure range of 200 to 0.7 hPa, with an average value of 0.9 K. In Figure 16, the vertical resolution of stratospheric temperature ranges from 2.6 km to 7.3 km, with an average value of 4.0 km. As shown in Figure 2, O3 has a contribution to the observation of the narrow bands that we have chosen. However, we have excluded the channels heavily affected by O3 in the narrow band selection. The results of brightness temperature variation and retrieval comparison calculation indicate that the change of the O3 volume mixing ratio has almost no influence on observation brightness temperature and temperature retrieval for our selected narrow bands (the results are not shown). Therefore, the joint-sounding scheme of two narrow bands is theoretically feasible. The sounding pressure range can cover the whole stratosphere, and improving the spectral resolution can increase the retrieval accuracy of the middle and upper stratospheric temperature profile, while the narrow range can improve the effective utilization of the spectrum.

4. Conclusions

This paper discusses a precise measurement method for the stratospheric temperature sounding by using a narrow band ultra-high spectral resolution sounder from nadir-viewing satellites. The method takes advantage of the high sensitivity of the CO2 15 μ m absorption band to the stratospheric temperature variation. Using SHS as the sounder model, the influence of spectral resolution, spectral range, and instrumental noise on the sounding capability is analyzed. With the increase of spectral resolution, the retrieval accuracy is obviously improved. When the spectral resolution is improved from 0.1 cm−1 to 0.05 cm−1, 0.03 cm−1, and 0.01 cm−1, respectively, the temperature sounding accuracy (RMSE) can be increased by 0.7 K, 1.0 K and 1.4 K at most, with an average increase of 0.3 K, 0.4 K, and 0.6 K per layer. Increasing the spectral range can significantly improve the temperature retrieval accuracy for some atmospheric pressure levels, but not for other pressure levels, and can lead to the problem that some channels make little or no contribution to the retrieval. This can be improved by using several discontinuous narrow bands for joint-sounding for different pressure ranges. Reducing the instrumental noise can increase the retrieval accuracy to a certain extent. When the instrumental noise is reduced from 0.2 K to 0.1 K and from 0.1 K to 0.05 K, the RMSE can be increased by 0.6 K and 0.4 K at most, with the average increase of 0.2 K and 0.1 K. The sounding schemes of the single spectral band and multiple spectral bands are compared. The accuracy of multiple spectral bands is superior to that of the single spectral band. Considering the current technical level of SHS, two narrow bands (the regions of 666.87–676.44 cm−1 and 683.58–693.15 cm−1) with a spectral resolution of 0.03 cm−1 are adopted for sounding. The RMSE of the temperature retrieval is about 0.9 K. The retrieval tests presented here are idealized, as various systematic measurement errors of real instruments were not taken into account. This is a limitation of the study, but it is obviously beyond the scope of the study to address this.
The joint-sounding of narrow bands with an ultra-high spectral resolution for stratospheric temperature profiles is theoretically feasible. It can not only improve the effective utilization of the spectrum, but also provide more effective spectral channels for sounding and increase the retrieval accuracy for the stratospheric temperature profile. Using SHS as the sounder can realize the miniaturization and lightweight nature of the instrument, providing convenience for the on-orbit sounding. Compared with the measurements of current sounders from nadir-viewing satellites, such as IASI, this study proposes more channels that are sensitive to the stratospheric temperature, with a higher spectral resolution, which would help to achieve higher accuracies for stratospheric temperature sounding. The narrow band ultra-high spectral resolution sounder is planned to be carried by polar-orbiting meteorological satellites, such as IASI, and will provide global observations every 12 h for a single satellite. This would provide a global coverage that is restricted to a particular time of day, which is governed by the satellite’s orbit. The time-of-day coverage can be expanded by having a constellation of satellites with different equatorial crossing times. As a preliminary theoretical evaluation work, this study provides the technical preparation for the high-precision and low-cost satellite sounder design for stratospheric temperature observations.

Author Contributions

Conceptualization, S.W., F.L. and Y.F.; methodology, S.W., F.L., Y.F. and B.H.; software, S.W., L.K and D.F.; validation, S.W., F.L., D.F. and Y.F.; formal analysis, S.W., B.H., F.L., L.K. and H.L.; investigation, S.W., L.K. and H.L.; resources, F.L. and Y.F.; data curation, S.W. and D.F.; writing—original draft preparation, S.W.; writing—review and editing, S.W., Y.F., and F.L.; visualization, S.W.; supervision, Y.F. and F.L.; project administration, Y.F. and F.L.; funding acquisition, F.L. and Y.F. All authors have read and agreed to the published version of the manuscript.

Funding

This research was funded by the National Natural Science Foundation of China (41005019, 61527805, 41965001), the West Light Foundation of the Chinese Academy of Sciences (XAB 2016A07), the Natural Science Basic Research Program of Shaanxi Province (2019JQ-931), and the West Light Cross-Disciplinary Innovation team of the Chinese Academy of Sciences (E1294301).

Data Availability Statement

All data generated or analyzed during this study are included in this article.

Acknowledgments

We would like to thank AER (Atmospheric and Environmental Research) for providing the LBLRTM code, which can be obtained on the website (http://rtweb.aer.com/lblrtm_frame.html, accessed on 1 September 2019), and the ECMWF for providing the 60-level atmosphere profile sample data used here (https://nwp-saf.eumetsat.int/site/software/atmospheric-profile-data/, accessed on 20 April 2020). Finally, we also thank the anonymous reviewers for the comments that helped improve our manuscript.

Conflicts of Interest

The authors declare that they have no conflict of interest.

References

  1. Chung, E.S.; Soden, B.J. Investigating the influence of carbon dioxide and the stratosphere on the long-term tropospheric temperature monitoring from HIRS. Am. Meteorol. Soc. 2010, 49, 1927–1937. [Google Scholar] [CrossRef]
  2. Holton, J.R.; Haynes, P.H.; Mclntyre, M.E.; Douglass, A.R.; Rood, R.B.; Pfister, L. Stratosphere-Troposphere Exchange. Rev. Geophys. 1995, 33, 403–439. [Google Scholar] [CrossRef]
  3. Meriwether, J.W.; Gerrard, A.J. Mesosphere inversion layers and stratosphere temperature enhancements. Rev. Geophys. 2004, 42, 133. [Google Scholar] [CrossRef]
  4. Fan, Z.Q.; Sheng, Z.; Shi, H.Q.; Zhang, X.H.; Zhou, C.J. A Characterization of the Quality of the Stratospheric Temperature Distributions from SABER based on Comparisons with COSMIC Data. J. Atmos. Ocean. Technol. 2016, 33, 2401–2413. [Google Scholar] [CrossRef]
  5. Ramaswamy, V.; Chanin, M.L.; Angell, J.; Barnett, J.; Gaffen, D.; Gelman, M.; Keckhut, P.; Koshelkov, Y.; Labitzke, K.; Lin, J.J.R.; et al. Stratospheric temperature trends: Observations and model simulations. Rev. Geophys. 2001, 39, 71–122. [Google Scholar] [CrossRef]
  6. Baldwin, M.P.; Thompson, D.W.; Shuckburgh, E.F.; Norton, W.A.; Gillett, N.P. Weather from the stratosphere? Science 2003, 301, 317–319. [Google Scholar] [CrossRef] [PubMed] [Green Version]
  7. He, M.; Chau, J.L.; Forbes, J.M.; Thorsen, D.; Li, G.; Siddiqui, T.A.; Yamazaki, Y.; Hocking, W.K. Quasi-10-Day Wave and Semidiurnal Tide Nonlinear Interactions During the Southern Hemispheric SSW 2019 Observed in the Northern Hemispheric Mesosphere. Geophys. Res. Lett. 2020, 47, 1453. [Google Scholar] [CrossRef]
  8. Ma, Z.; Gong, Y.; Zhang, S.; Zhou, Q.; Huang, C.; Huang, K.; Luo, J.; Yu, Y.; Li, G. Study of a Quasi 4-Day Oscillation During the 2018/2019 SSW Over Mohe, China. J. Geophys. Res.-Space 2020, 125, 27687. [Google Scholar] [CrossRef]
  9. Keckhut, P.; Claud, C.; Funatsu, B.; Hauchecorne, A.; Maury, P.; Khaykin, S.; Pichon, A.L.; Steinbrecht, W. Temperature Trends Observed in the Middle Atmosphere and Future Directions. In Infrasound Monitoring for Atmospheric Studies; Springer: Berlin/Heidelberg, Germany, 2019; pp. 805–823. [Google Scholar]
  10. Dou, X.; Han, Y.; Sun, D.; Xia, H.; Shu, Z.; Zhao, R.; Shangguan, M.; Guo, J. Mobile Rayleigh Doppler lidar for wind and temperature measurements in the stratosphere and lower mesosphere. Opt. Express 2014, 22, A1203–A1221. [Google Scholar] [CrossRef] [Green Version]
  11. Wang, Y.; Wang, Q.; Hua, D. Preliminary exploration of atmospheric water vapor, liquid water and ice water by ultraviolet Raman lidar. Opt. Express 2019, 27, 36311–36328. [Google Scholar]
  12. Dudhia, A. Satellites and Satellite Remote Sensing|Temperature Soundings. In Encyclopedia of Atmospheric Sciences; Elsevier: Amsterdam, The Netherlands, 2015; pp. 145–156. [Google Scholar]
  13. Dong, C.; Li, J.; Zhang, P. The Principle and Application of Satellite Hyperspectral Infrared Atmospheric Remote Sensing, 1st ed.; Science Press: Beijing, China, 2013; pp. 2–9. [Google Scholar]
  14. Zou, C.Z.; Qian, H. Stratospheric Temperature Climate Data Record from Merged SSU and AMSU-A Observations. J. Atmos. Ocean. Technol. 2016, 33, 1967–1984. [Google Scholar] [CrossRef]
  15. Li, J.; Wolf, W.W.; Menzel, W.P.; Zhang, W.; Huang, H.L.; Achtor, T.H. Global soundings of the atmosphere from ATOVS measurements: The algorithm and validation. J. Appl. Meteorol. 2000, 39, 1248–1268. [Google Scholar] [CrossRef]
  16. Irion, F.W.; Kahn, B.H.; Schreier, M.M.; Fetzer, E.J.; Fishbein, E.; Fu, D.; Kalmus, P.; Wilson, R.C.; Wong, S.; Yue, Q. Single-footprint retrievals of temperature, water vapor and cloud properties from AIRS. Atmos. Meas. Technol. 2018, 11, 971–995. [Google Scholar] [CrossRef] [Green Version]
  17. Grieco, G.; Masiello, G.; Matricardi, M.; Serio, C. Partially scanned interferogram methodology applied to IASI for the retrieval of CO, CO2, CH4 and N2O. Opt. Express 2013, 21, 24753–24769. [Google Scholar] [CrossRef]
  18. Nalli, N.R.; Gambacorta, A.; Liu, Q.; Barnet, C.D.; Tan, C.; Iturbide-Sanchez, F.; Reale, T.; Sun, B.; Wilson, M.; Borg, L.; et al. Validation of Atmospheric Profile Retrievals from the SNPP NOAA-Unique Combined Atmospheric Processing System. Part 1: Temperature and Moisture. IEEE Trans. Geosci. Remote Sens. 2018, 56, 180–190. [Google Scholar] [CrossRef]
  19. Coopmann, O.; Fourrie, N.; Guidard, V. Analysis of MTG-IRS observations and general channel selection for numerical weather prediction models. Q. J. R. Meteorol. Soc. 2022, 148, 1864–1885. [Google Scholar] [CrossRef]
  20. Li, S.; Hu, H.; Fang, C.; Wang, S.; Xun, S.; He, B.; Wu, W.; Huo, Y. Hyperspectral Infrared Atmospheric Sounder (HIRAS) atmospheric sounding system. Remote Sens. 2022, 14, 3882. [Google Scholar] [CrossRef]
  21. Cai, X.; Bao, Y.; Petropoulos, G.P.; Lu, F.; Lu, Q.; Zhu, L.; Wu, Y. Temperature and humidity profile retrieval from FY4-GIIRS hyperspectral data using artificial neural networks. Remote Sens. 2020, 12, 1872. [Google Scholar] [CrossRef]
  22. Olsen, E.T. AIRS/AMSU/HSB Version 5 CalVal Status Summary. 2007. Available online: https://docserver.gesdisc.eosdis.nasa.gov/repository/Mission/AIRS/3.7_ScienceDataProductValidation/V5_CalVal_Status_Summary.pdf (accessed on 1 September 2022).
  23. Schluessel, P. IASI instrument performances just before the launch of MetOp. In Proceedings of the ESA Atmospheric Science Conference, Frascati, Italy, 8–12 May 2006. [Google Scholar]
  24. Wu, H.; Ni, L.; Wang, N.; Qian, Y.; Tang, B.H.; Li, Z.L. Estimation of Atmospheric Profiles from Hyperspectral Infrared IASI Sensor. IEEE J. Sel. Top. Appl. Earth Obs. Remote Sens. 2013, 6, 1485–1494. [Google Scholar] [CrossRef]
  25. Wu, X.; Yao, Z.; Han, Z.; Zhao, Z. Retrieval of Stratospheric Temperature from Radiance Measurements by Infrared Atmospheric Sounding Interferometer. Infrared 2016, 37, 11–17. [Google Scholar]
  26. Song, C.; Yin, Q. Research on vertical spatial characteristic of satellite infrared hyperspectral atmospheric sounding data. Front. Earth Sci. 2021, 16, 265–276. [Google Scholar] [CrossRef]
  27. Huang, P.; Guo, Q.; Han, C.; Zhang, C.; Yang, T.; Huang, S. An improved method combining ANN and 1D-Var for the retrieval of atmospheric temperature profiles from FY-4A/GIIRS hyperspectral data. Remote Sens. 2021, 13, 481. [Google Scholar] [CrossRef]
  28. Aires, F.; Chédin, A.; Scott, N.A.; Rossow, W.B. A regularized neural net approach for retrieval of atmospheric and surface temperatures with the IASI instrument. J. Appl. Meteorol. 2002, 41, 144–159. [Google Scholar] [CrossRef]
  29. Chang, S.; Sheng, Z.; Du, H.; Ge, W.; Zhang, W. A channel selection method for hyperspectral atmospheric infrared sounders based on layering. Atmos. Meas. Technol. 2020, 13, 629–644. [Google Scholar] [CrossRef] [Green Version]
  30. Serio, C.; Standfuss, C.; Masiello, G.; Liuzzi, G.; Dufour, E.; Tournier, B.; Stuhlmann, R.; Tjemkes, S.; Antonelli, P. Infrared atmospheric sounder interferometer radiometric noise assessment from spectral residuals. Appl. Opt. 2015, 54, 5924–5936. [Google Scholar] [CrossRef]
  31. Yang, Y.H.; Yin, Q.; Shu, J. Channel selection of atmosphere vertical sounder (GIIRS) onboard the FY-4A geostationary satellite. J. Infrared Millim. Waves 2018, 37, 545–552. [Google Scholar]
  32. Yang, X. Retrieval of Temperature for Near Space Atmoshpere Based on Oxygen A-Band Emission Spectrum. Ph.D. Thesis, University of Chinese Academy of Sciences, Beijing, China, 2020. [Google Scholar]
  33. Zeng, Q. The Principle of Atmospheric Infrared Remote Sensing; Science Press: Beijing, China, 1974; pp. 13–36. [Google Scholar]
  34. Coopmann, O.; Guidard, V.; Fourrié, N.; Josse, B.; Marécal, V. Update of Infrared Atmospheric Sounding Interferometer (IASI) channel selection with correlated observation errors for numerical weather prediction (NWP). Atmos. Meas. Technol. 2020, 13, 2659–2680. [Google Scholar] [CrossRef]
  35. Masiello, G.; Matricardi, M.; Serio, C. The use of IASI data to identify systematic errors in the ECMWF forecasts of temperature in the upper stratosphere. Atmos. Chem. Phys. 2011, 11, 1009–1021. [Google Scholar] [CrossRef] [Green Version]
  36. López-Puertas, M.; Zaragoza, G.; López-Valverde, M.Á.; Taylor, F.W. Non local thermodynamic equilibrium (LTE) atmospheric limb emission at 4.6 μm: 1. An update of the CO2 non-LTE radiative transfer model. J. Geophys. Res. Atmos. 1998, 103, 8499–8513. [Google Scholar] [CrossRef]
  37. Liu, D.; Dai, C.; Wei, H. CO2 limb radiation in the middle and upper atmosphere: Comparison analysis of simulation and measurement. Infrared Laser Eng. 2016, 45, 154–160. [Google Scholar]
  38. Barnet, C.D.; Smith, N.; Ide, K.; Garrett, K.; Jones, E. Evaluating the Value of CrIS Shortwave-Infrared Channels in Atmospheric-Sounding Retrievals. Remote Sens. 2023, 15, 547. [Google Scholar] [CrossRef]
  39. Gordon, I.E.; Rothman, L.S.; Hargreaves, R.J.; Hashemi, R.; Karlovets, E.V.; Skinner, F.M.; Conway, E.K.; Hill, C.; Kochanov, R.V.; Tan, Y.; et al. The HITRAN2020 molecular spectroscopic database. J. Quant. Spectrosc. Radiat. Transf. 2022, 277, 107949. [Google Scholar] [CrossRef]
  40. Bormann, N.; Collard, A.; Bauer, P. Estimates of spatial and interchannel observation-error characteristics for current sounder radiances for numerical weather prediction. II: Application to AIRS and IASI data. Q. J. R. Meteorol. Soc. 2010, 136, 1051–1063. [Google Scholar] [CrossRef]
  41. Chu, Q.; Li, X.; Jirigalantu; Sun, C.; Chen, J.; Wang, J.; Sun, Y.; Bayanheshig. Design study of a cross-dispersed spatial heterodyne spectrometer. Opt. Express 2022, 30, 10547–10562. [Google Scholar] [CrossRef]
  42. Nemeth, G.; Pekker, A. New design and calibration method for a tunable single-grating spatial heterodyne spectrometer. Opt. Express 2020, 28, 22720–22731. [Google Scholar] [CrossRef]
  43. Englert, C.R.; Babcock, D.D.; Harlander, J.M. Doppler asymmetric spatial heterodyne spectroscopy (DASH): Concept and experimental demonstra. Appl. Opt. 2007, 46, 7297–7307. [Google Scholar] [CrossRef] [Green Version]
  44. Clough, S.A.; Shephard, M.W.; Mlawer, E.J.; Delamere, J.S.; Iacono, M.J.; Cady-Pereira, K.; Boukabara, S.; Brown, P.D. Atmospheric radiative transfer modeling: A summary of the AER codes. J. Quant. Spectros. Radiat. Transf. 2005, 91, 233–244. [Google Scholar] [CrossRef]
  45. Wu, X. Study on the Methodology and Applications of Retrieving Atmospheric Parameter Profiles Using Infrared High-Resolution Spectra. Ph.D. Thesis, University of Science and Technology of China, Hefei, China, 2019. [Google Scholar]
  46. LBLRTM Specification File. Available online: http://rtweb.aer.com/lblrtm_frame.html (accessed on 1 September 2019).
  47. Lerner, J.A.; Weisz, E.; Kirchengast, G. Temperature and humidity retrieval from simulated Infrared Atmospheric Sounding Interferometer (IASI) measurements. J. Geophys. Res. 2002, 107, 4189–4199. [Google Scholar] [CrossRef] [Green Version]
  48. Rodgers, C.D. Inverse Methods for Atmospheres: Theory and Practice; World Scientific: Singapore, 2000; pp. 81–85. [Google Scholar]
  49. Feng, J.; Huang, Y.; Qu, Z. A simulation-experiment-based assessment of retrievals of above-cloud temperature and water vapor using a hyperspectral infrared sounder. Atmos. Meas. Technol. 2021, 14, 5717–5734. [Google Scholar] [CrossRef]
  50. Fineschi, S.; Watchorn, S.; Fennelly, J.A.; Noto, J.; Waldrop, L.S. 8446-Angstrom observations of neutral oxygen with the Spatial Heterodyne Spectrometer at Millstone Hill. Proc. SPIE 2009, 7438, 111–120. [Google Scholar]
  51. Wang, F.; Li, J.; Schmit, T.J.; Ackerman, S.A. Trade-off studies of a hyperspectral infrared sounder on a geostationary satellite. Appl. Opt. 2007, 46, 200–209. [Google Scholar] [CrossRef] [PubMed]
  52. Griffiths, P.R.; Haseth, J.A. Fourier Transform Infrared Spectrometry, 2nd ed.; John Wiley & Sons, Inc.: Hoboken, NJ, USA, 2007; pp. 161–176. [Google Scholar]
  53. Davis, S.P.; Abrams, M.C.; Brault, J.W. Fourier Transform Spectrometry; Academic Press: San Diego, CA, USA, 2001; pp. 119–142. [Google Scholar]
  54. Solheim, B.; Brown, S.; Sioris, C.; Shepherd, G. SWIFT-DASH: Spatial Heterodyne Spectroscopy Approach to Stratospheric Wind and Ozone Measurement. Atmos. Ocean 2013, 53, 50–57. [Google Scholar] [CrossRef]
Figure 1. The temperature Jacobians of the infrared spectral region. The calculation is performed by using LBLRTM and US Standard Atmosphere (1976 version).
Remotesensing 15 01967 g001
Figure 2. The emission spectra of the major atmospheric molecules. The calculation is performed by using the HITRAN 2020 database [39] and US Standard Atmosphere (1976 version).
Remotesensing 15 01967 g002
Figure 3. The temperature Jacobians. (a) The spectral region of 600–800 cm−1 with a spectral resolution of 0.03 cm−1. (b) The spectral region of 666–670 cm−1 with a spectral resolution of 0.03 cm−1.
Remotesensing 15 01967 g003
Figure 4. The temperature Jacobian peak corresponding to atmospheric pressure with different spectral resolutions and the same spectral region of 600–800 cm−1. (a) A spectral resolution of 0.1 cm−1. (b) A spectral resolution of 0.05 cm−1. (c) A spectral resolution of 0.03 cm−1. (d) A spectral resolution of 0.01 cm−1.
Remotesensing 15 01967 g004
Figure 5. The processing flowchart of the simulation. ( S ε is the observation error covariance matrix, a diagonal matrix, and the diagonal element is the square of the instrumental noise [49]. x a is the a priori profile. S a is the a priori error covariance matrix which is obtained from the deviation statistics of x a and the temperature profile of the training data [27]. Gaussian-distributed random noise with a zero mean and a standard deviation equal to NeDT is added to the calculated observation brightness temperature to simulate actual satellite data [49]).
Remotesensing 15 01967 g005
Figure 6. The retrieval results with different spectral resolutions, the same spectral range (16 cm−1), and instrumental noise (0.1 K). (a) RMSE of temperature. (b) BIAS of temperature.
Remotesensing 15 01967 g006
Figure 7. The temperature Jacobian peak corresponding to atmospheric pressure with different spectral resolutions and the same spectral region of 666.1–682 cm−1. (a) A spectral resolution of 0.1 cm−1. (b) A spectral resolution of 0.05 cm−1. (c) A spectral resolution of 0.03 cm−1. (d) A spectral resolution of 0.01 cm−1. (The definition of the axis coordinate is the same as that of Figure 4).
Remotesensing 15 01967 g007
Figure 8. The variation of temperature Jacobian curves of the channels with the spectral resolution and the spectral region of 666.1–682 cm−1. (a) The channel of 668.4 cm−1. (b) The channel of 669 cm−1. (c) The channel of 671.1 cm−1.
Remotesensing 15 01967 g008
Figure 9. The retrieval results with different spectral ranges, the same spectral resolution (0.03 cm−1), and the same instrumental noise (0.1 K). The spectral ranges of 4.8 cm−1, 9.6 cm−1, 16 cm−1 and 32 cm−1 correspond to the spectral regions of 666.87–671.64 cm−1, 666.87–676.44 cm−1, 666.87–682.83 cm−1 and 666.87–698.82 cm−1, respectively. (a) RMSE of temperature. (b) BIAS of temperature.
Remotesensing 15 01967 g009
Figure 10. The temperature Jacobian peak corresponding to atmospheric pressure with different spectral ranges and the same spectral resolution of 0.03 cm−1. (a) A spectral range of 4.8 cm−1. (b) A spectral range of 9.6 cm−1. (c) A spectral range of 16 cm−1. (d) A spectral range of 32 cm−1.
Remotesensing 15 01967 g010
Figure 11. The retrieval results with different instrumental noise, the same spectral range (9.6 cm−1), and the same spectral resolution (0.03 cm−1). (a) RMSE of temperature. (b) BIAS of temperature.
Remotesensing 15 01967 g011
Figure 12. The information content provided by the sounder with different instrumental noises. (Entropy reduction represents the difference of the information entropy before and after the retrieval, which is the information content observed by the sounder. [13]).
Remotesensing 15 01967 g012
Figure 13. The temperature retrieval results. (a,b) are the results of the single narrow band with different spectral resolutions when the exposure time and other parameters remain unchanged. (c,d) are the results of the single narrow band with different spectral resolutions when the exposure time is adjusted to keep instrumental noise at 0.1 K. (e,f) are the results of multiple narrow bands with different spectral resolutions.
Remotesensing 15 01967 g013
Figure 14. The temperature Jacobians peak corresponding to atmospheric pressure. (a) The spectral region of 666.87–676.44 cm−1. (b) The spectral region of 683.58–693.15 cm−1. (c) The combination of the two spectral regions.
Remotesensing 15 01967 g014
Figure 15. The separate and joint retrieval accuracy with the two narrow bands. (a) All the retrieval temperature profiles. (b) RMSE of temperature. (c) BIAS of temperature.
Remotesensing 15 01967 g015
Figure 16. The vertical resolution of the joint-sounding with two narrow bands.
Remotesensing 15 01967 g016
Table 1. The parameters of spaceborne hyperspectral infrared atmosphere vertical sounders.
SatelliteInstrumentTechniqueSpectral Range/cm−1Spectral
Resolution/cm−1
ChannelsNeDT/NeDR
EOS-AquaAIRSGS650–1135
1215–1615
2180–2665
0.5
1.2
2
23780.15–0.35 K
@280 K
MetOpIASIMI645–1210
1210–2000
2000–2760
0.5 (a spectral sampling of 0.25)84610.2–0.3 K@280 K
0.2–0.5 K@280 K
0.5–2 K@280 K
SNPPCrISMI650–1095
1210–1750
2155–2550
0.625
1.25
2.5
13050.1–0.5 K@250 K
MTGIRSMI680–1210
1600–2250
~0.62519600.17 K
@280 K
FY-3HIRASMI667–1136
1210–1750
2155–2550
0.625
1.25
2.5
13430.15 K@250 K
0.2 K@250 K
0.3 K@250 K
FY-4GIIRSMI680–1130
1650–2250
0.62516820.5 mW/m2 srcm−1
0.1 mW/m2 srcm−1
NeDT = noise-equivalent temperature difference, NeDR = noise-equivalent radiance, GS = Grating Spectrometer, MI = Michelson Interferometer.
Table 2. The spectral region scheme of the single narrow band.
Spectral Resolution/cm−1Spectral Region/cm−1Spectral Range/cm−1
0.1659.60–691.5032
0.05666.70–682.6516
0.03666.87–676.449.6
0.01667.32–670.513.2
Table 3. The spectral region scheme of multiple narrow bands.
Spectral
Resolution/cm−1
Spectral
Region/cm−1
Spectral Range/cm−1Pressure Range/Height
0.1659.60–691.5032200–0.7 hPa/11.5–50 km
0.05666.70–682.651680–0.7 hPa/17.5–50 km
682.70–698.65200–80 hPa/11.5–17.5 km
0.03666.87–676.449.680–0.7 hPa/17.5–50 km
683.58–693.15200–80 hPa/11.5–17.5 km
0.01638.98–642.173.2200–80 hPa/11.5–17.5 km
658.09–661.2880–10 hPa/17.5–31 km
667.32–670.5110–0.7 hPa/31–50 km
Table 4. System parameters of the spatial heterodyne spectrometer.
ParametersValue
Spectral regionBand 1: 666.87–676.44 cm−1
Band 2: 683.58–693.15 cm−1
Spectral resolution0.03 cm−1
Horizontal pixel number640
Vertical pixel number512
Pixel pitch30 μm
NeDT~0.1 K@ 226 K
Exposure time 1.15 s
F number 1.2
Transmittance0.2
Detectivity2.8 × 1011  H c m / W
Disclaimer/Publisher’s Note: The statements, opinions and data contained in all publications are solely those of the individual author(s) and contributor(s) and not of MDPI and/or the editor(s). MDPI and/or the editor(s) disclaim responsibility for any injury to people or property resulting from any ideas, methods, instructions or products referred to in the content.

