

Unsupervised Transformer Boundary Autoencoder Network for Hyperspectral Image Change Detection
by
 , ,
, ,
Song Liu
1,2,
Haiwei Li
1,
Feifei Wang
3,
Junyu Chen
1,2,
Geng Zhang
1,
Liyao Song
4 and
Bingliang Hu
1,* 1
Key Laboratory of Spectral Imaging Technology of CAS, Xi’an Institute of Optics and Precision Mechanics, Chinese Academy of Sciences, Xi’an 710119, China
2
University of Chinese Academy of Sciences, Beijing 100049, China
3
School of Instrumentation and Optoelectronic Engineering, Beihang University, Beijing 100191, China
4
School of Information and Communications Engineering, Xi’an Jiaotong University, Xi’an 710049, China
*
Author to whom correspondence should be addressed.
Remote Sens. 2023, 15(7), 1868; https://doi.org/10.3390/rs15071868
Submission received: 9 February 2023
/
Revised: 10 March 2023
/
Accepted: 30 March 2023
/
Published: 31 March 2023
(This article belongs to the Special Issue Hyperspectral Remote Sensing Imaging and Processing)
Abstract
:In the field of remote sens., change detection is an important monitoring technology. However, effectively extracting the change feature is still a challenge, especially with an unsupervised method. To solve this problem, we proposed an unsupervised transformer boundary autoencoder network (UTBANet) in this paper. UTBANet consists of a transformer structure and spectral attention in the encoder part. In addition to reconstructing hyperspectral images, UTBANet also adds a decoder branch for reconstructing edge information. The designed encoder module is used to extract features. First, the transformer structure is used for extracting the global features. Then, spectral attention can find important feature maps and reduce feature redundancy. Furthermore, UTBANet reconstructs the hyperspectral image and boundary information simultaneously through two decoders, which can improve the ability of the encoder to extract edge features. Our experiments demonstrate that the proposed structure significantly improves the performance of change detection. Moreover, comparative experiments show that our method is superior to most existing unsupervised methods.
1. Introduction
As an effective monitoring method, change detection has been widely used for disaster evaluation [1], building planning [2,3], sea ice monitoring [4], forest vegetation management [5,6], and land use analysis [7,8]. Because hyperspectral images can provide more abundant spectral information to reveal subtle changes in land cover [9,10], hyperspectral image change detection has become a hot research field [11,12,13].
In general, change detection can be divided into supervised change detection and unsupervised change detection. Supervised methods need to train the model through labeled data. Wu et al. proposed a general end-to-end 2-D convolutional neural network (CNN) framework based on unmixing spectral information [14]. To further combine spectral and spatial features, Zhan et al. designed a spectral–spatial CNN to extract the features from the spectral information and two spatial directions [15]. Wang et al. designed a low-complexity network with few parameters and a residual self-calibrated structure [16]. To solve the band redundancy, a slow–fast band selection CNN framework was proposed to extract effective spectral information [17]. Zhang et al. designed a multi-scale Siamese transformer to extract global features [3]. However, there are only a few public hyperspectral change detection datasets with labeled data [18], resulting in limited applications for supervised methods.
Because unsupervised methods can be used on unlabeled datasets, many researchers have exploited unsupervised methods for change detection. The early unsupervised change detection methods were mainly direct comparison and algebraic transformation. Although pixel-based comparison methods, such as change vector analysis (CVA) [19,20], are simple and efficient and are vulnerable to various types of noise. To reduce noise interference, algebraic transformation is used for change detection to extract image features. Deng et al. proposed adding a principal components analysis into the CVA method, which enhances the change information [21]. Nielsen et al. proposed iteratively reweighted multivariate alteration detection (IR-MAD) for hyperspectral image change detection [22]. This method uses a canonical correlation analysis to transform the original variables and assigns each pixel a different weight. Slow feature analysis (SFA) change detection aims to minimize the difference between the invariant points in the new transformation space [23]. Compared to direct comparison, analyzing the difference between two temporal features causes the change detection results to be more robust and accurate. In addition, some change detection algorithms based on other perspectives have been proposed in recent years. Inspired by orthogonal subspace projection, Wu et al. proposed a subspace-based change detection (SCD) method that calculates the distance from the pixel to the subspace form by another time image [24]. Spectral unmixing has also been applied to change detection, and abundance is considered an image feature that identifies changes [25,26,27,28]. However, these methods usually only focus on spectral dimension information and lack the use of spatial information.
As CNN and transformers can combine spectral and spatial features and perform well in other computer vision tasks, in recent years, many unsupervised change detection methods based on deep learning have been proposed. Transfer learning, autoencoders, and generative adversarial networks (GANs) have attracted great attention for unsupervised change detection [2,29,30,31]. Du et al. proposed an unsupervised deep learning SFA that uses an optimizer based on SFA to train the feature extraction module in the neural network [32]. Hu et al. used two autoencoders to reconstruct two temporal hyperspectral images, respectively, and then used the reconstructed data to obtain the change results [30]. Nevertheless, these methods lack attention to the edge features, resulting in the poor detection of changed boundaries.
Although a lot of research has been carried out, there are still several problems in unsupervised change detection. First, the boundary of change targets is not easy to distinguish using an unsupervised method. Many surrounding environment factors, such as noise and resolution, will confuse the boundaries of change objects and increase the difficulty of feature extraction [33]. Second, the redundancy of feature maps will affect the detection results. To extract more image features, the network usually uses many convolution kernels. However, some feature maps contain little useful information, reducing the final detection accuracy [34].
To overcome the abovementioned problems, an unsupervised transformer boundary autoencoder network (UTBANet) is proposed for hyperspectral image change detection in this paper. Our method is an unsupervised method based on an autoencoder structure. A transformer structure based on spectral attention is used in the encoder to enhance the global features and to select effective feature maps. Furthermore, we design a boundary information reconstruction module that allows the autoencoder to reconstruct the edge information of the image in addition to the hyperspectral image. In this way, the ability of the encoder to extract boundary features can be improved. The main contributions of our article are as follows:
- (1)
- An unsupervised UTBANet based on a transformer is proposed to improve global feature representation in change detection.
- (2)
- The encoder structure with spectral attention can give different weights to each feature map and select important feature maps, thus reducing the impact of feature map redundancy.
- (3)
- The boundary information reconstruction module forces the encoder to pay more attention to the edge information, which causes the feature map to contain more discriminative boundary features and improves the accuracy of change detection.
2. Method
2.1. Overall Architecture
The structure of UTBANet consists of one encoder and two decoders, as shown in Figure 1. The encoder is designed based on the transformer and spectral attention, which can effectively extract global features and give weight to the feature map. The feature maps with weight are output by the encoder, as shown by the green arrow in Figure 1a. During training, the feature maps are sent to the hyperspectral reconstruction module (as shown by the red arrow in Figure 1) and the boundary reconstruction module (as shown by the blue arrow in Figure 1). The HLoss function is used to calculate the hyperspectral reconstruction error, as shown by the red dotted arrow in Figure 1. At the same time, after edge detection of the original hyperspectral image, the boundary reconstruction error is calculated using the BLoss function, as shown by the blue dotted arrow in Figure 1. Boundary reconstruction allows the encoder to focus on boundary features, thus improving the boundary feature extraction ability of the encoder. These two reconstruction errors train the whole network in an unsupervised pattern. Once the UTBANet is trained, we use the encoder to extract the feature map (as shown by the yellow arrow in Figure 1) from two temporal hyperspectral images and calculate the detection result.
2.2. Feature Extraction
Because the transformer can capture long-range correlations between spatial regions and has good versatility, it performs well in various visual tasks [35,36,37,38,39,40]. Therefore, we use it as the basic structure of the encoder to enhance the extraction of global features. Moreover, we designed the spectral attention transformer (SAT) structure to extract effective features from redundant feature maps, as shown in Figure 2.
First, the input HSI generates patches through embedding. Due to the strong correlation between spectra, we use a convolution operation with the kernel size 3 × 3 as the embedding operation and deem each spectral channel a patch [41,42]. Then, these patches undergo two SAT blocks to obtain feature maps.
The structure of the SAT has two sub-layers and a squeeze-and-excitation (SE) block. Each sub-layer employs a residual structure. Let be the input feature maps of SAT, where H, W, and are the height, width, and number of feature map channels. First, is reshaped to the size of , and then three parallel linear layers are used to generate , , and , respectively. The attention matrix Z is computed by:
Then, for subsequent convolution operations, Z is reshaped to . Considering the continuity between spectra, we do not use random initialization to add position embedding. Referring to Cai et al. [39], we regard V as the initial position embedding and use the reshape operation, two convolution layers, and a GELU activation to obtain the position embedding.
The feed-forward sub-layer consists of a LayerNorm operation and convolution block (Conv Block), which is used to increase the ability of feature representations. The Conv Block comprises three convolution layers and three GELU activations, as shown in the gray rectangle in Figure 2.
Through a series of convolution operations, we obtain a multi-channel feature map. However, not every channel has useful information. Thus, the SE block is used to select the important feature maps [43], as shown in Figure 3. First, a convolution layer is used for dimension reduction () and spectral feature extraction. Then, the SE block generates the weight of each channel through global average pooling and a full connection layer. Finally, we use the dot product to assign a high weight to the important channels. In this way, redundant information can be involved in feature transmission as little as possible, thus reducing feature redundancy.
2.3. Boundary and Hyperspectral Reconstruction
We add a boundary information decoder branch into the autoencoder network to obtain more effective boundary features to distinguish objects, as shown in Figure 1c. We employ the Sobel operator to detect edges for each channel of the hyperspectral image. The result is regarded as the boundary ground truth (GT) of the hyperspectral image. Figure 4 shows the boundary GT map of a spectral band. During training, this decoder reconstructs the boundary information from the features extracted by the encoder, as shown by the blue arrow in Figure 1. The purpose of this strategy is to make the encoder pay more attention to boundary features by boundary reconstruction.
Another decoder branch is in typical autoencoder mode, which reconstructs the original hyperspectral image via the deep features of the hyperspectral image, as shown by the red arrow in Figure 1. These two decoders are designed to have the same structure with two residual blocks. The residual block is shown in Figure 5. The first convolution layer is used to recover the number of channels and corresponds to the dimension reduction operation in the encoder.
2.4. Loss Function
According to the above description, our UTBANet does not need labeled data for training and is, therefore, an unsupervised method. The original hyperspectral data are both the input data and the GT of hyperspectral reconstruction. The corresponding edge detection result is the GT of boundary reconstruction. To optimize the whole network, we use two loss functions during training. The hyperspectral loss HLoss is used to measure the similarity between input and reconstructed hyperspectral images, and the boundary loss BLoss is used to evaluate the similarity between the boundary GT and the reconstruction boundary. We use mean square error (MSE), which is widely used in hyperspectral reconstruction tasks [44,45,46], as the calculation formula for two functions. The final loss function L can be written as:
where is a weight to balance the two loss functions.
2.5. Change Detection
After training UTBANet, we use the encoder to obtain the feature maps of two temporal hyperspectral images, as shown by the yellow arrow in Figure 1. Then, we calculate their Euclidean distance to determine the gray difference map (GDM):
where and represent the feature maps of the two temporal hyperspectral images. Finally, we use the Otsu algorithm to segment the GDM into a binary change map. For the binary change map, a value of 1 represents a change pixel, and 0 represents no change.
3. Experiment and Discussion
3.1. Datasets
Three public datasets were used in our experiments. The three datasets were all acquired using a Hyperion sensor. The sensor provides 242 spectral bands with wavelengths ranging from 0.4 to 2.5 m. The spectral resolution is about 10 m, and the spatial resolution is approximately 30 m.
The first dataset is Farmland, as shown in Figure 6a,b. The two temporal hyperspectral images were acquired on 3 May 2006, and 23 April 2007, respectively. The main scene is a farmland in Yancheng, Jiangsu Province, China, with a size of 450 × 140 pixels. After removing the bands with a low signal-to-noise ratio, 155 bands were retained. The main changes are caused by the seasonal change in crops.
The second dataset is Hermiston, as shown in Figure 6c,d. The two images were acquired on 1 May 2004, and 8 May 2007. The main scenes are rivers and circular irrigation areas in Hermiston City, USA, with a size of 390 × 200 pixels. In total, 163 bands were selected after noise removal. The main changes are also caused by the seasonal change in crops.
The third dataset is River, as shown in Figure 6e,f. The two images were acquired on 3 May 2013, and 31 December 2013. The main scenes are rivers and residential areas in Jiangsu Province, China, with 463 × 241 pixels. In total, 167 bands were selected after noise removal. The main change is sediment in rivers and residential areas.
3.2. Implementation Details
To improve the convergence speed of our model, the three datasets were normalized from 0 to 1. To increase the training samples, before training, we cropped each hyperspectral image into sub-images sized 32 × 32 with a step size of eight. The boundary GT was also cropped to the sub-images. The two temporal sub-images were mixed and shuffled and input into the network as training data. In addition, during training, these sub-images were randomly rotated, vertically flipped, and horizontally flipped.
The UTBANet was trained by Pytorch with GeForce RTX 3090 24 GB. The learning rate is 0.01 in the beginning, and the decay coefficient is 0.1 with every 100 epochs. Early stopping was used to prevent overfitting. The optimizer was Adma with the default parameter.
To evaluate the performance of our method, we used three metrics: overall accuracy (OA), the kappa coefficient (KC), and intersection over union (IoU). TP is a true positive, TN is a true negative, FP is a false positive, and FN is a false negative. The three metrics can be defined as:
where
3.3. Parameter Setting
In our proposed method, the number of kernels, batch size, and the weight of the two loss functions will affect the change detection result. We carry out a series of comparison experiments to explore the influence of these hyperparameters. When analyzing one parameter, the other parameters are fixed.
3.3.1. The Analysis of Kernel Number
Here, we suppose that the kernel number in the embedding layer is K. Then, the number of output channels of SAT1, SAT2, Residual block 1, and Residual block 2 are K/2, K/4, K/2, and C, respectively, where C is the number of hyperspectral image channels. We tested the K values of 32, 64, 128, and 256. Table 1 shows that as the kernel number increases, the OA of Farmland and River increase and then decrease. The best numbers of kernels are 64, 256, and 64 for the three datasets, respectively.
3.3.2. The Analysis of the Batch Size
In this experiment, we compared three different batch sizes: 32, 64, and 128. Table 2 shows that the number of batch sizes greatly influences the results of the Hermiston and River datasets. The best batch sizes for the three datasets are 128, 32, and 64, respectively.
3.3.3. The Analysis of the Weight of Two Loss Functions
In this experiment, six different (0.1, 0.5, 1, 2, 5, and 10) were used for comparison. Table 3 shows that when the weight of the hyperspectral loss is higher than or equal to the boundary loss, the OA of Farmland and Hermiston are relatively high. The best weights for the three datasets are 5, 5, and 2.
3.3.4. The Analysis of the Edge Detection Operator
In this experiment, two common edge detection operators (Sobel and Canny) were used for comparison. As shown in Table 4, different operators had little effect on Farmland and Hermiston. However, the Sobel operator performed better than the Canny operator on the River dataset. Therefore, we selected the Sobel operator for edge detection.
3.4. Comparison with Other Methods
In this section, we compared our model with other unsupervised change detection methods, including CVA, PCA-CVA [7], IR-MAD [8], DCVA [21], and convolutional autoencoder multiresolution features (CAMF) [26].
- CVA: The Euclidean distance between two pixels is calculated to determine whether the point changes.
- PCA-CVA: This is an improved CVA method. It first obtains the principal components of the hyperspectral image and then uses the CVA algorithm to detect changes.
- IR-MAD: This method adds weight to each pixel while using a canonical correlation analysis for algebraic transformation.
- DCVA: This method first trains a CNN with other images to extract image features. Then, feature variance is used to select useful feature maps. Finally, global and local thresholding is used to make judgments.
- CAMF: This method uses two temporal images to train an autoencoder. Then, the feature comparison and selection are used to extract features.
For all comparison methods, the parameters have been optimized. These methods first generate gray results, and then we use Otsu for segmentation. Although the quantitative evaluation is carried out on the binary map, we also show the gray results in the experimental section.
3.4.1. Experiment on the Farmland Dataset
The gray results are shown in Figure 7. Figure 8 shows the binary change detection results of all methods. Compared with the ground truth, the CVA, PCA-CVA, and CAMF results show many white pixels in unchanged road areas, as shown in Figure 8. The misjudgment of the unchanged pixels causes these false alarm pixels to present as changed pixels. IR-MAD performed poorly, with many types of noise being observed. For DCVA, there was a large false alarm region in the bottom left corner of the result. Because UTBANet combines global and boundary features, our method only generated a few false alarm pixels, and the overall performance of its result was the closest to the ground truth; therefore, it can better identify the boundary of Farmland. Table 5 displays the metrics of these methods. Our method achieved the best value of the three metrics, with an OA of 0.9663, a KC of 0.9195, and an IoU of 0.9434.
3.4.2. Experiment on the Hermiston Dataset
Figure 9 shows the gray results of Hermiston dataset. And Figure 10 displays the binary results of six methods. CVA identified the most changed areas but also misjudged some unchanged areas. PCA-CVA and DCVA mistakenly detected the river as a changed area. IR-MAD also did not perform well on this dataset, with many types of noise being produced in the results. UTBANet has the highest consistency with the ground truth. Figure 10f indicates that after paying more attention to edge features, our method is more accurate in identifying changed irrigation areas, and there are no obvious false alarm pixels. Table 6 shows the results of all methods. Because there are many false alarm pixels in the PCA-CAV results, its KC value is only 0.2996. Figure 10e shows that CAMF missed many changed pixels and generated many false alarm pixels. Therefore, the KC and IoU values of the CAMF are all low. UTBANet demonstrated good performance in the three metrics, with an OA of 0.9858, a KC of 0.9362, and an IoU of 0.9443.
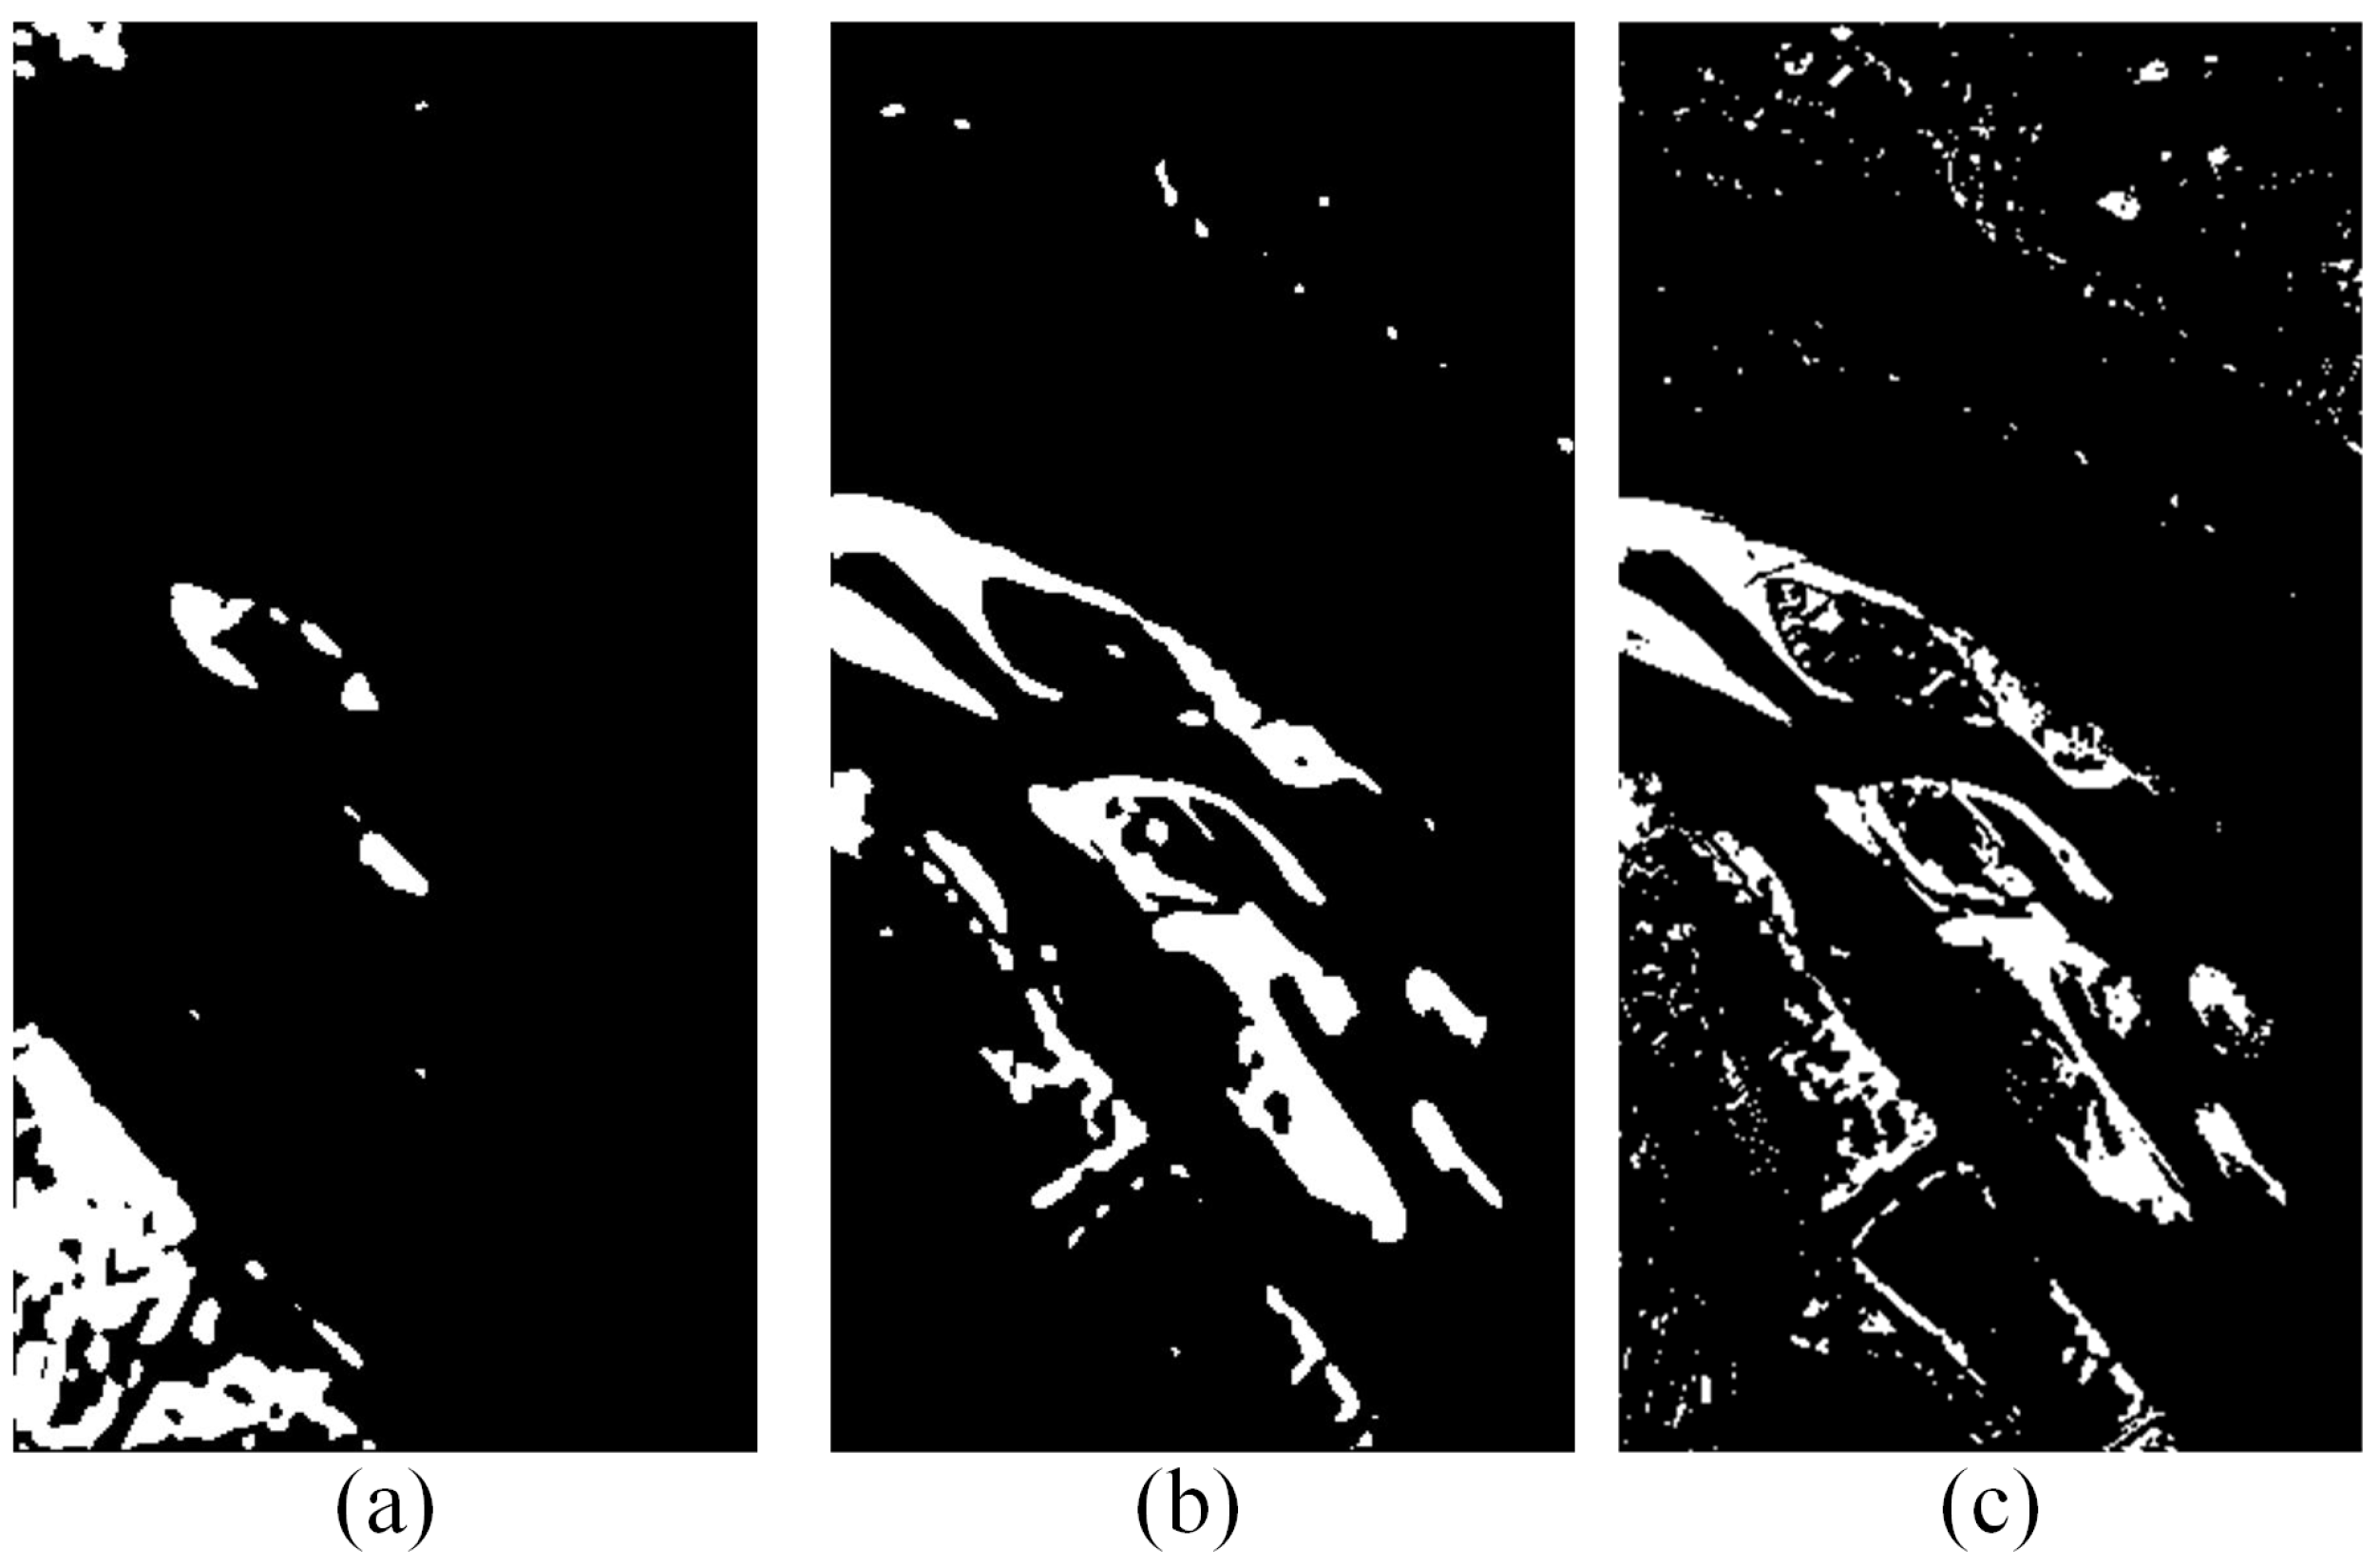
3.4.3. Experiment on the River Dataset
Gray and binary change detection results are shown in Figure 11 and Figure 12, respectively. Table 7 shows the quantitative indicators of the six methods. PCA-CVA misjudged the river as a changed region, which may be due to the low signal-to-noise ratio of the river region. IR-MAD did not detect the changed area in the middle of the river. Figure 12d shows a large white area compared with the ground truth, indicating that the DCVA performance is poor. This may be because no suitable data were found to pre-train the CNN for DCVA. For CAMF, there were many false alarm pixels in the residential area. Therefore, the KC value of CAMF was only 0.2769. Figure 12 shows that CVA and our method are the closest to the ground truth. Compared with CVA, our method shows fewer false alarm pixels, which may be because the boundary reconstruction allows our method to better identify rivers and riversides. However, compared with the ground truth, UTBANet missed the detection of some changed small targets. Therefore, our method achieved higher OA and KC values than those of CVA, but the IoU is lower than that of CVA.
3.5. Ablation Analysis
In our model, the boundary decoder and SE block are used for feature extraction. To verify the effectiveness of these two structures, we designed model experiments with and without the boundary decoder and SE block. The network without the boundary decoder (Net without BD) consists only of feature extraction and the hyperspectral reconstruction module. The network without the SE block (Net without SE) still comprises two decoder modules, but the SE block is removed from the SAT. Figure 13a shows that without the boundary decoder, the boundary of changed areas is blunt and cannot detect the unchanged road between the farmlands. Figure 14 and Figure 15 show that the boundary decoder is effective, not only for changed edges, but also for improving the overall detection results. Table 8 shows quantitatively that the boundary decoder and SE block improved the change detection results.
4. Conclusions
In this paper, we proposed an unsupervised change detection method called UTBANet. The proposed method was based on an autoencoder network that consisted of an encoder and two decoders. In UTBANet, the boundary information reconstruction module is added to the traditional hyperspectral reconstruction module, which has a positive influence on feature extraction. Furthermore, the designed SAT block, which integrates the transformer and spectral attention block, can adaptively extract and select important feature maps. The experimental results obtained for the three public datasets with the five compared methods show that our proposed method performed well. Furthermore, the ablation analysis verifies that the boundary information reconstruction and spectral attention block improved the change detection results. In future work, we hope to apply UTBANet to more vegetation and river area monitoring.
Author Contributions
Conceptualization, S.L. and H.L.; methodology, J.C.; validation, S.L. and L.S.; investigation, F.W.; writing—original draft preparation, S.L.; writing—review and editing, H.L., G.Z. and B.H.; project administration, B.H.; funding acquisition, H.L. and G.Z. All authors have read and agreed to the published version of the manuscript.
Funding
This work was supported in part by the National Natural Science Foundation of China (Grant No. 42101380); in part by the National Key Research and Development Program of China (Grant Nos. 2022YFF1300201 and 2021YFD2000102); and in part by the Youth Innovation Promotion Association CAS.
Data Availability Statement
The data presented in this study are available on request from the corresponding author.
Conflicts of Interest
The authors declare no conflict of interest.
References
- de Alwis Pitts, D.A.; So, E. Enhanced change detection index for disaster response, recovery assessment and monitoring of accessibility and open spaces (camp sites). Int. J. Appl. Earth Obs. Geoinf. 2017, 57, 49–60. [Google Scholar] [CrossRef] [Green Version]
- Saha, S.; Bovolo, F.; Bruzzone, L. Building Change Detection in VHR SAR Images via Unsupervised Deep Transcoding. IEEE Trans. Geosci. Remote Sens. 2021, 59, 1917–1929. [Google Scholar] [CrossRef]
- Zhang, M.; Liu, Z.; Feng, J.; Liu, L.; Jiao, L. Remote Sensing Image Change Detection Based on Deep Multi-Scale Multi-Attention Siamese Transformer Network. Remote Sens. 2023, 15, 842. [Google Scholar] [CrossRef]
- Gao, F.; Wang, X.; Gao, Y.; Dong, J.; Wang, S. Sea Ice Change Detection in SAR Images Based on Convolutional-Wavelet Neural Networks. IEEE Geosci. Remote Sens. Lett. 2019, 16, 1240–1244. [Google Scholar] [CrossRef]
- Xiang, J.; Xing, Y.; Wei, W.; Yan, E.; Jiang, J.; Mo, D. Dynamic Detection of Forest Change in Hunan Province Based on Sentinel-2 Images and Deep Learning. Remote Sens. 2023, 15, 628. [Google Scholar] [CrossRef]
- Zhu, F.; Shen, W.; Diao, J.; Li, M.; Zheng, G. Integrating cross-sensor high spatial resolution satellite images to detect subtle forest vegetation change in the Purple Mountains, a national scenic spot in Nanjing, China. J. For. Res. 2020, 31, 1743–1758. [Google Scholar] [CrossRef] [Green Version]
- Mubea, K.; Menz, G. Monitoring Land-Use Change in Nakuru (Kenya) Using Multi-Sensor Satellite Data. Adv. Remote Sens. 2012, 1, 74–84. [Google Scholar] [CrossRef] [Green Version]
- Lv, Z.; Wang, F.; Cui, G.; Benediktsson, J.A.; Lei, T.; Sun, W. Spatial–Spectral Attention Network Guided With Change Magnitude Image for Land Cover Change Detection Using Remote Sensing Images. IEEE Trans. Geosci. Remote Sens. 2022, 60, 1–12. [Google Scholar] [CrossRef]
- Shi, Y.; Fu, B.; Wang, N.; Cheng, Y.; Fang, J.; Liu, X.; Zhang, G. Spectral-Spatial Attention Rotation-Invariant Classification Network for Airborne Hyperspectral Images. Drones 2023, 7, 240. [Google Scholar] [CrossRef]
- Nan, W.; Yuetian, S.; Fanchao, Y.; Geng, Z.; Siyuan, L.; Xuebin, L. Collaborative representation with multipurification processing and local salient weight for hyperspectral anomaly detection. J. Appl. Remote Sens. 2022, 16, 036517. [Google Scholar] [CrossRef]
- Liu, S.; Marinelli, D.; Bruzzone, L.; Bovolo, F. A Review of Change Detection in Multitemporal Hyperspectral Images: Current Techniques, Applications, and Challenges. IEEE Geosci. Remote Sens. Mag. 2019, 7, 140–158. [Google Scholar] [CrossRef]
- Liu, S.; Song, L.; Li, H.; Chen, J.; Zhang, G.; Hu, B.; Wang, S.; Li, S. Spatial weighted kernel spectral angle constraint method for hyperspectral change detection. J. Appl. Remote Sens. 2022, 16, 016503. [Google Scholar] [CrossRef]
- Liu, S.; Li, H.; Chen, J.; Li, S.; Song, L.; Zhang, G.; Hu, B. Adaptive convolution kernel network for change detection in hyperspectral images. Appl. Opt. 2023, 62, 2039–2047. [Google Scholar] [CrossRef]
- Wang, Q.; Yuan, Z.; Du, Q.; Li, X. GETNET: A General End-to-End 2-D CNN Framework for Hyperspectral Image Change Detection. IEEE Trans. Geosci. Remote Sens. 2019, 57, 3–13. [Google Scholar] [CrossRef] [Green Version]
- Zhan, T.; Song, B.; Sun, L.; Jia, X.; Wan, M.; Yang, G.; Wu, Z. TDSSC: A Three-Directions Spectral–Spatial Convolution Neural Network for Hyperspectral Image Change Detection. IEEE J. Sel. Top. Appl. Earth Obs. Remote Sens. 2021, 14, 377–388. [Google Scholar] [CrossRef]
- Wang, L.; Wang, L.; Wang, Q.; Bruzzone, L. RSCNet: A Residual Self-Calibrated Network for Hyperspectral Image Change Detection. IEEE Trans. Geosci. Remote Sens. 2022, 60, 1–17. [Google Scholar] [CrossRef]
- Ou, X.; Liu, L.; Tu, B.; Zhang, G.; Xu, Z. A CNN Framework With Slow-Fast Band Selection and Feature Fusion Grouping for Hyperspectral Image Change Detection. IEEE Trans. Geosci. Remote Sens. 2022, 60, 1–16. [Google Scholar] [CrossRef]
- Zhao, C.; Cheng, H.; Feng, S. A Spectral–Spatial Change Detection Method Based on Simplified 3-D Convolutional Autoencoder for Multitemporal Hyperspectral Images. IEEE Geosci. Remote Sens. Lett. 2022, 19, 1–5. [Google Scholar] [CrossRef]
- Bovolo, F.; Bruzzone, L. A Theoretical Framework for Unsupervised Change Detection Based on Change Vector Analysis in the Polar Domain. IEEE Trans. Geosci. Remote Sens. 2007, 45, 218–236. [Google Scholar] [CrossRef] [Green Version]
- Bovolo, F.; Marchesi, S.; Bruzzone, L. A Framework for Automatic and Unsupervised Detection of Multiple Changes in Multitemporal Images. IEEE Trans. Geosci. Remote Sens. 2012, 50, 2196–2212. [Google Scholar] [CrossRef]
- Deng, J.S.; Wang, K.; Deng, Y.H.; Qi, G.J. PCA-based land-use change detection and analysis using multitemporal and multisensor satellite data. Int. J. Remote Sens. 2008, 29, 4823–4838. [Google Scholar] [CrossRef]
- Nielsen, A.A. The regularized iteratively reweighted MAD method for change detection in multi- and hyperspectral data. IEEE Trans. Image Process. 2007, 16, 463–478. [Google Scholar] [CrossRef] [PubMed] [Green Version]
- Wu, C.; Du, B.; Zhang, L. Slow Feature Analysis for Change Detection in Multispectral Imagery. IEEE Trans. Geosci. Remote Sens. 2014, 52, 2858–2874. [Google Scholar] [CrossRef]
- Wu, C.; Du, B.; Zhang, L. A Subspace-Based Change Detection Method for Hyperspectral Images. IEEE J. Sel. Top. Appl. Earth Obs. Remote Sens. 2013, 6, 815–830. [Google Scholar] [CrossRef]
- Erturk, A.; Iordache, M.D.; Plaza, A. Sparse Unmixing-Based Change Detection for Multitemporal Hyperspectral Images. IEEE J. Sel. Top. Appl. Earth Obs. Remote Sens. 2016, 9, 708–719. [Google Scholar] [CrossRef]
- Erturk, A.; Iordache, M.D.; Plaza, A. Sparse Unmixing With Dictionary Pruning for Hyperspectral Change Detection. IEEE J. Sel. Top. Appl. Earth Obs. Remote Sens. 2017, 10, 321–330. [Google Scholar] [CrossRef]
- Liu, S.; Bruzzone, L.; Bovolo, F.; Du, P. Unsupervised Multitemporal Spectral Unmixing for Detecting Multiple Changes in Hyperspectral Images. IEEE Trans. Geosci. Remote Sens. 2016, 54, 2733–2748. [Google Scholar] [CrossRef]
- Ertürk, A. Constrained Nonnegative Matrix Factorization for Hyperspectral Change Detection. In Proceedings of the IGARSS 2019—2019 IEEE International Geoscience and Remote Sensing Symposium, Yokohama, Japan, 28 July–2 August 2019; pp. 1645–1648. [Google Scholar] [CrossRef]
- Saha, S.; Bovolo, F.; Bruzzone, L. Unsupervised Deep Change Vector Analysis for Multiple-Change Detection in VHR Images. IEEE Trans. Geosci. Remote Sens. 2019, 57, 3677–3693. [Google Scholar] [CrossRef]
- Hu, M.; Wu, C.; Zhang, L.; Du, B. Hyperspectral Anomaly Change Detection Based on Autoencoder. IEEE J. Sel. Top. Appl. Earth Obs. Remote Sens. 2021, 14, 3750–3762. [Google Scholar] [CrossRef]
- Bergamasco, L.; Martinatti, L.; Bovolo, F.; Bruzzone, L. An Unsupervised Change Detection Technique Based on a Super-Resolution Convolutional Autoencoder. In Proceedings of the 2021 IEEE International Geoscience and Remote Sensing Symposium IGARSS, Brussels, Belgium, 11–16 July 2021; pp. 3337–3340. [Google Scholar] [CrossRef]
- Du, B.; Ru, L.; Wu, C.; Zhang, L. Unsupervised Deep Slow Feature Analysis for Change Detection in Multi-Temporal Remote Sensing Images. IEEE Trans. Geosci. Remote Sens. 2019, 57, 9976–9992. [Google Scholar] [CrossRef] [Green Version]
- Lei, J.; Gu, Y.; Xie, W.; Li, Y.; Du, Q. Boundary Extraction Constrained Siamese Network for Remote Sensing Image Change Detection. IEEE Trans. Geosci. Remote Sens. 2022, 60, 1–13. [Google Scholar] [CrossRef]
- Bergamasco, L.; Saha, S.; Bovolo, F.; Bruzzone, L. Unsupervised Change Detection Using Convolutional-Autoencoder Multiresolution Features. IEEE Trans. Geosci. Remote Sens. 2022, 60, 1–19. [Google Scholar] [CrossRef]
- Dosovitskiy, A.; Beyer, L.; Kolesnikov, A.; Weissenborn, D.; Zhai, X.; Unterthiner, T.; Dehghani, M.; Minderer, M.; Heigold, G.; Gelly, S. An Image is Worth 16 ×16 Words: Transformers for Image Recognition at Scale. In Proceedings of the 9th International Conference on Learning Representations, Virtual Event, Austria, 3–7 May 2021. [Google Scholar]
- Chen, C.F.R.; Fan, Q.; Panda, R. CrossViT: Cross-Attention Multi-Scale Vision Transformer for Image Classification. In Proceedings of the 2021 IEEE/CVF International Conference on Computer Vision (ICCV), Montreal, BC, Canada, 11–17 October 2021; pp. 347–356. [Google Scholar] [CrossRef]
- Dai, Z.; Cai, B.; Lin, Y.; Chen, J. UP-DETR: Unsupervised Pre-training for Object Detection with Transformers. In Proceedings of the 2021 IEEE/CVF Conference on Computer Vision and Pattern Recognition (CVPR), Nashville, TN, USA, 20–25 June 2021; pp. 1601–1610. [Google Scholar] [CrossRef]
- Han, K.; Wang, Y.; Chen, H.; Chen, X.; Guo, J.; Liu, Z.; Tang, Y.; Xiao, A.; Xu, C.; Xu, Y.; et al. A Survey on Vision Transformer. IEEE Trans. Pattern Anal. Mach. Intell. 2023, 45, 87–110. [Google Scholar] [CrossRef]
- Liu, Z.; Lin, Y.; Cao, Y.; Hu, H.; Wei, Y.; Zhang, Z.; Lin, S.; Guo, B. Swin Transformer: Hierarchical Vision Transformer Using Shifted Windows. In Proceedings of the 2021 IEEE/CVF International Conference on Computer Vision (ICCV), Montreal, BC, Canada, 11–17 October 2021; pp. 9992–10002. [Google Scholar] [CrossRef]
- Touvron, H.; Cord, M.; Matthijs, D.; Massa, F.; Sablayrolles, A.; Jegou, H. Training data-efficient image transformers and distillation through attention. In Proceedings of the International Conference on Machine Learning, Virtual Conference, 18–24 July 2021. [Google Scholar]
- Cai, Y.; Lin, J.; Hu, X.; Wang, H.; Yuan, X.; Zhang, Y.; Timofte, R.; Gool, L.V. Mask-guided Spectral-wise Transformer for Efficient Hyperspectral Image Reconstruction. In Proceedings of the 2022 IEEE/CVF Conference on Computer Vision and Pattern Recognition (CVPR), New Orleans, LA, USA, 18–24 June 2022; pp. 17481–17490. [Google Scholar] [CrossRef]
- Cai, Y.; Lin, J.; Lin, Z.; Wang, H.; Zhang, Y.; Pfister, H.; Timofte, R.; Gool, L.V. MST++: Multi-stage Spectral-wise Transformer for Efficient Spectral Reconstruction. In Proceedings of the 2022 IEEE/CVF Conference on Computer Vision and Pattern Recognition Workshops (CVPRW), New Orleans, LA, USA, 19–20 June 2022; pp. 744–754. [Google Scholar] [CrossRef]
- Hu, J.; Shen, L.; Albanie, S.; Sun, G.; Wu, E. Squeeze-and-Excitation Networks. IEEE Trans. Pattern Anal. Mach. Intell. 2020, 42, 2011–2023. [Google Scholar] [CrossRef] [Green Version]
- Li, T.; Gu, Y. Progressive Spatial-Spectral Joint Network for Hyperspectral Image Reconstruction. IEEE Trans. Geosci. Remote Sens. 2021, 60, 1–14. [Google Scholar] [CrossRef]
- Yan, L.; Wang, X.; Zhao, M.; Kaloorazi, M.; Chen, J.; Rahardja, S. Reconstruction of Hyperspectral Data From RGB Images With Prior Category Information. IEEE Trans. Comput. Imaging 2020, 6, 1070–1081. [Google Scholar] [CrossRef]
- Fu, Y.; Zhang, T.; Zheng, Y.; Zhang, D.; Huang, H. Joint Camera Spectral Response Selection and Hyperspectral Image Recovery. IEEE Trans. Pattern Anal. Mach. Intell. 2020, 44, 256–272. [Google Scholar] [CrossRef]
Figure 1.
The overall structure of our UTBANet.
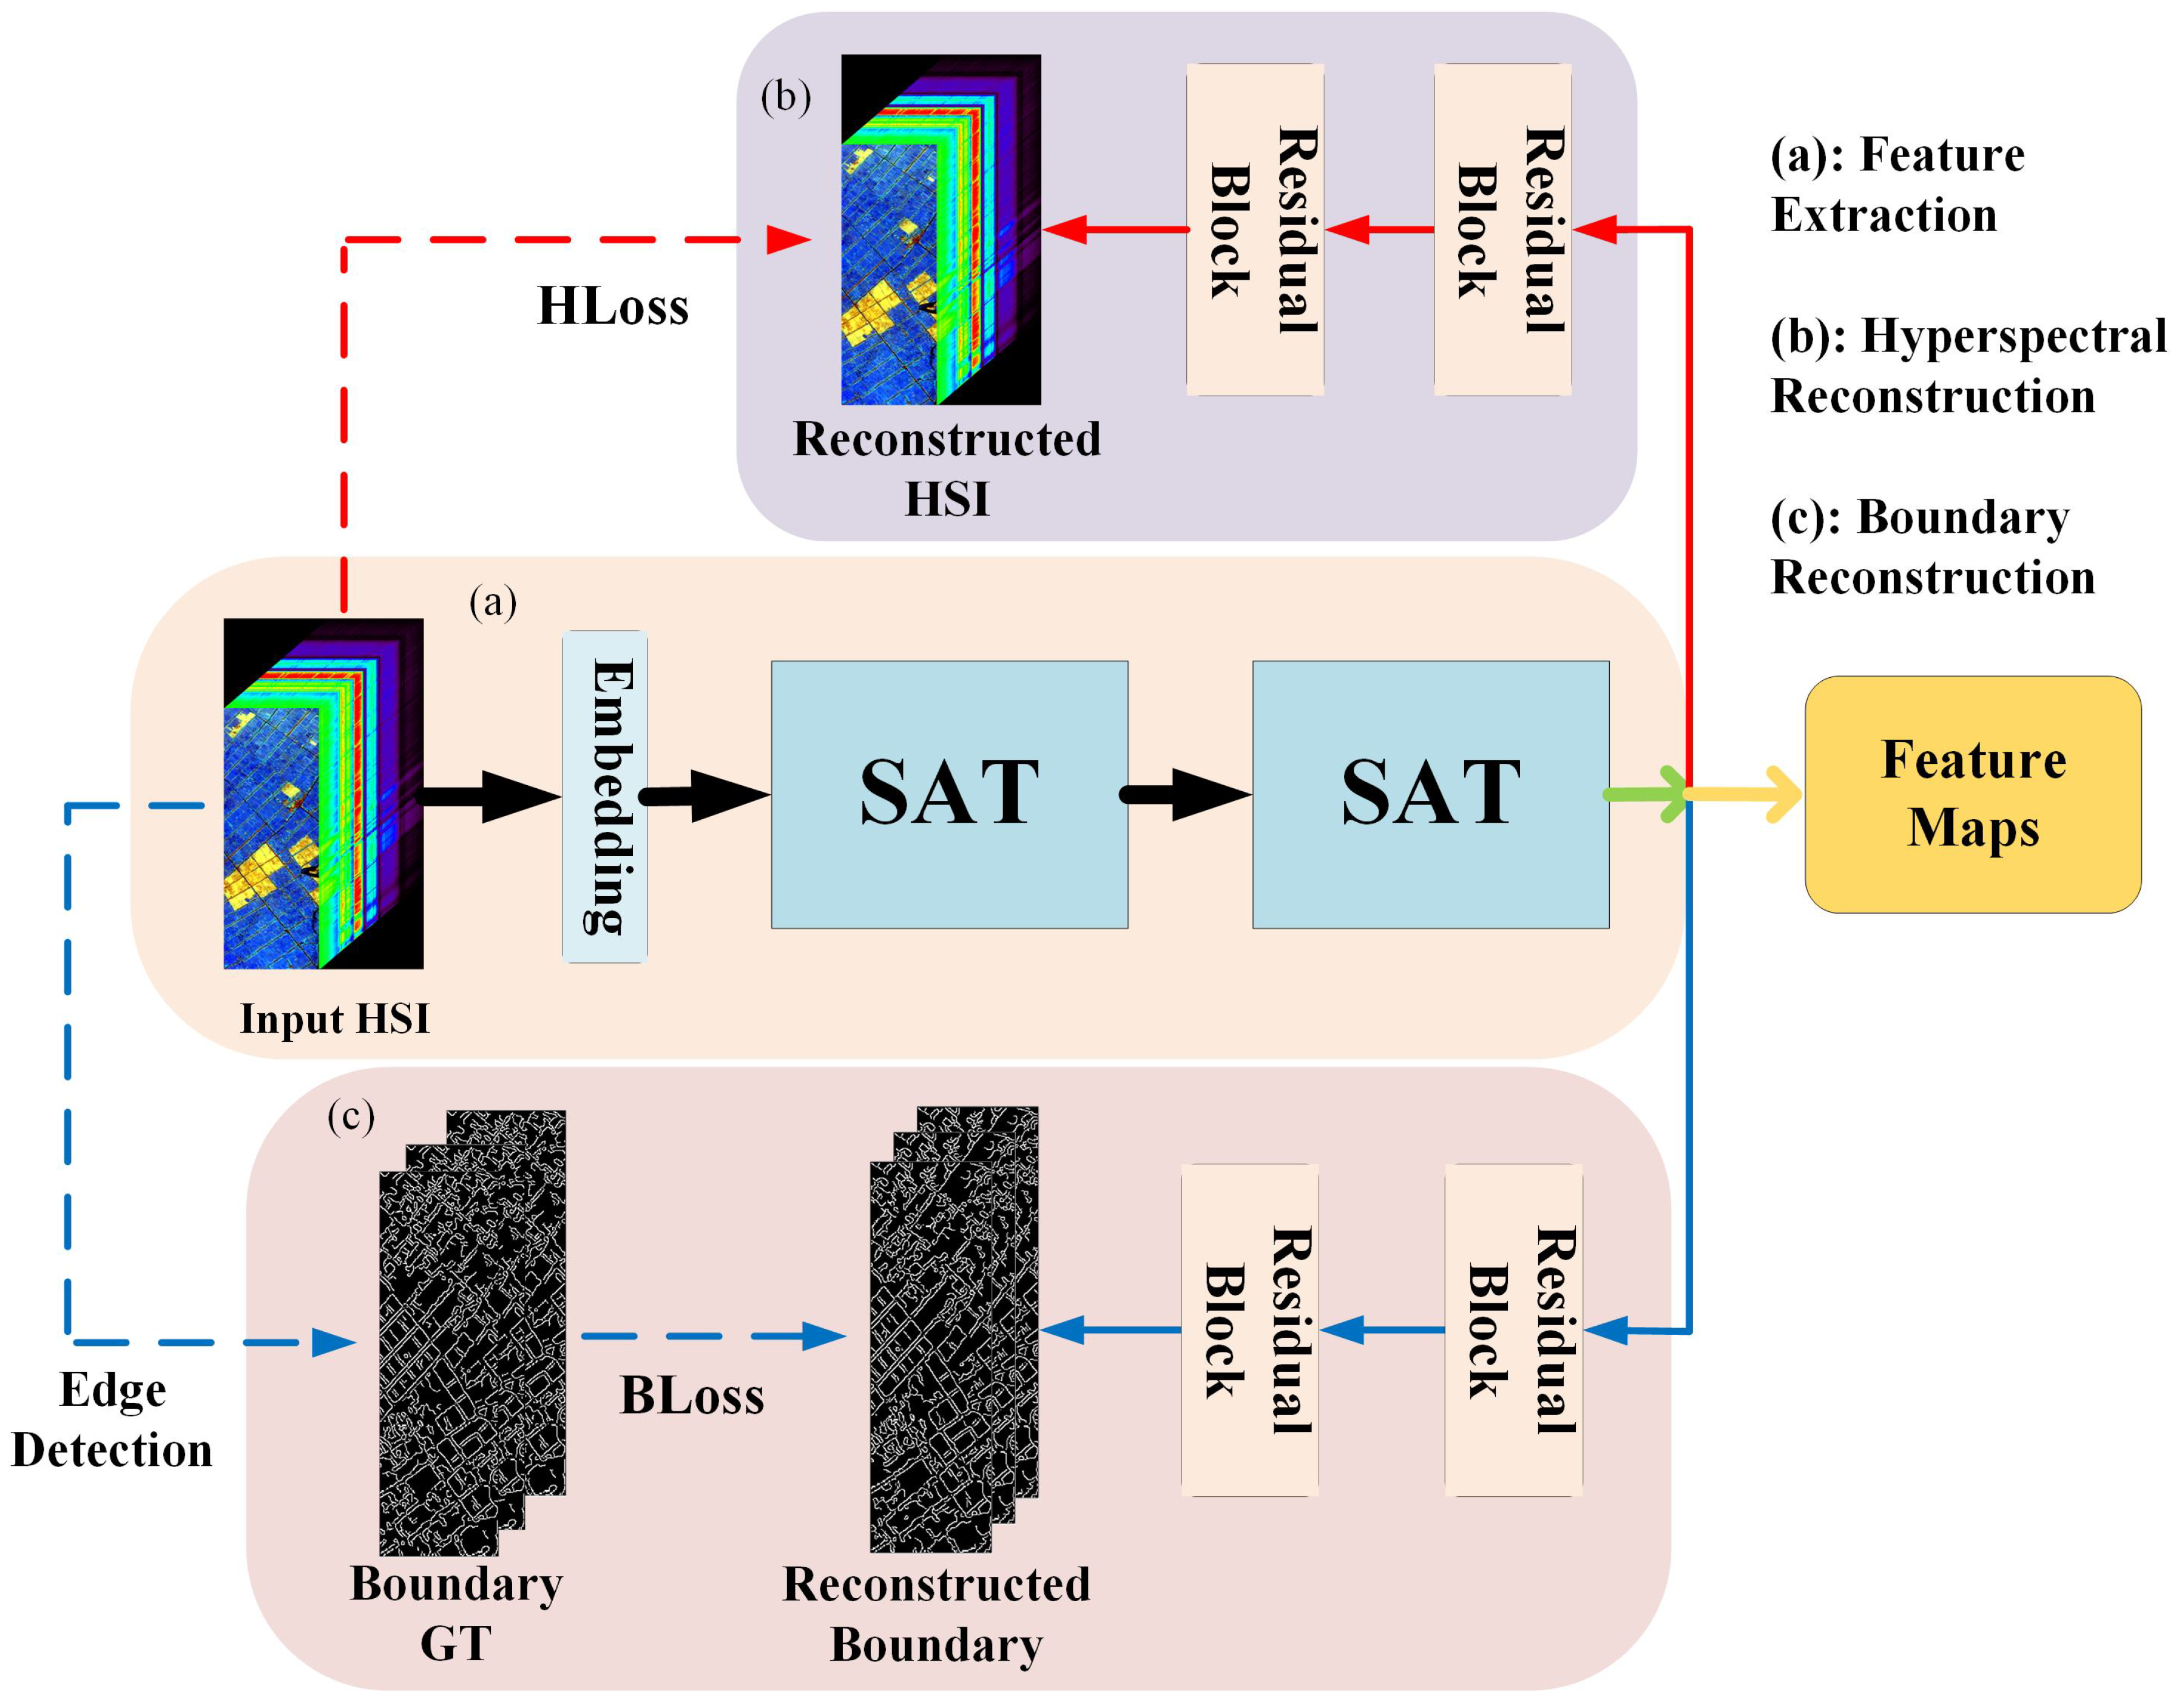
Figure 2.
Diagram of SAT block.
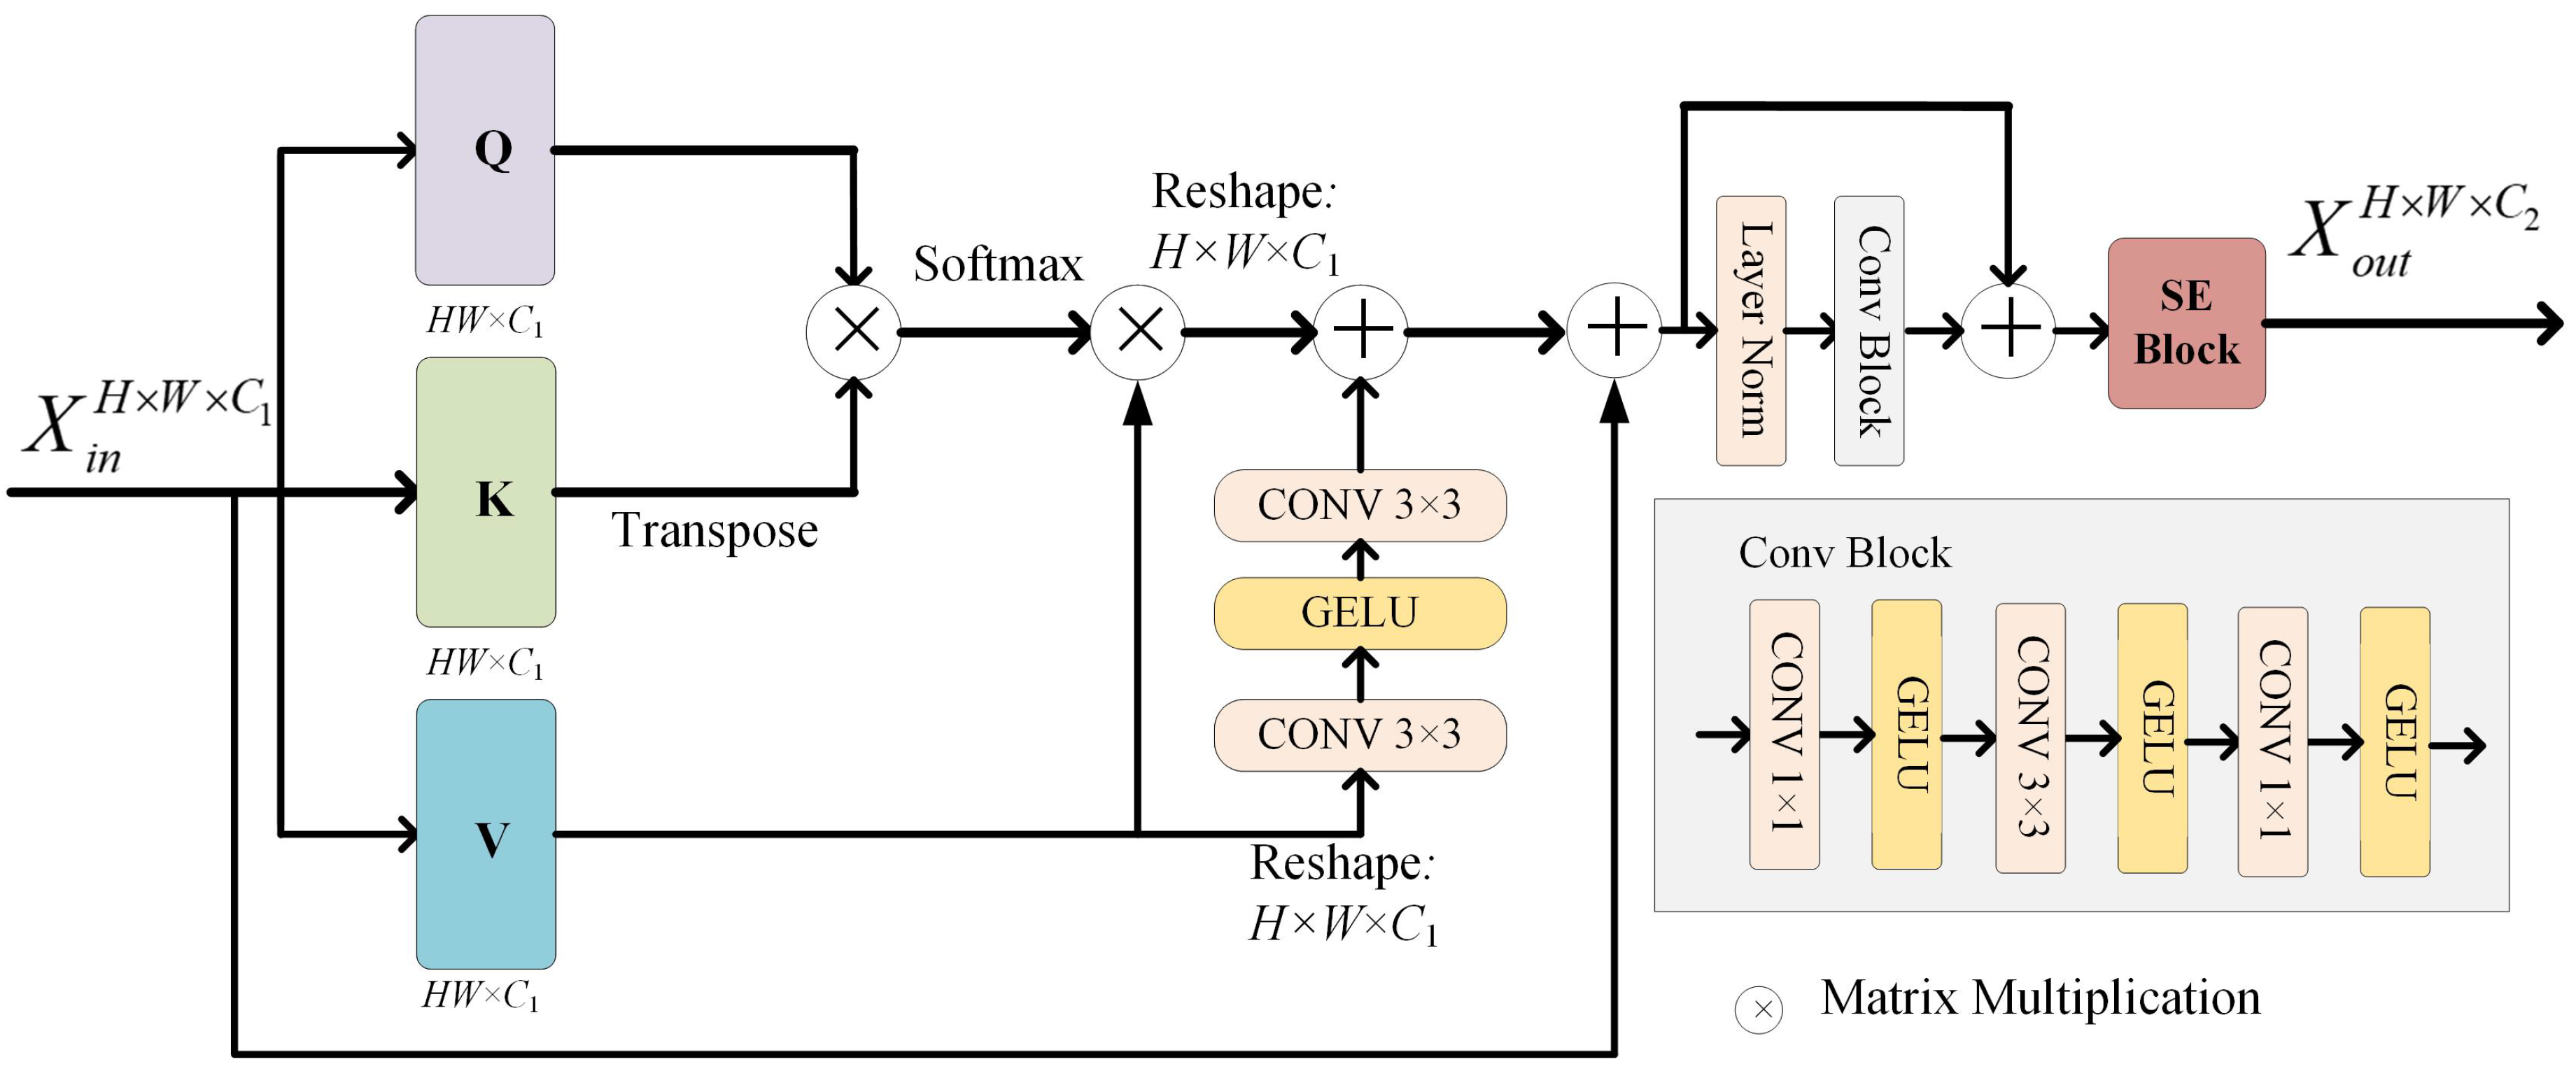
Figure 3.
Diagram of SE block.

Figure 4.
Boundary ground truth. (a,c,e) are the false color of the first temporal of three datasets. (b,d,f) are the edge detection results of the 120th band.
Figure 4.
Boundary ground truth. (a,c,e) are the false color of the first temporal of three datasets. (b,d,f) are the edge detection results of the 120th band.
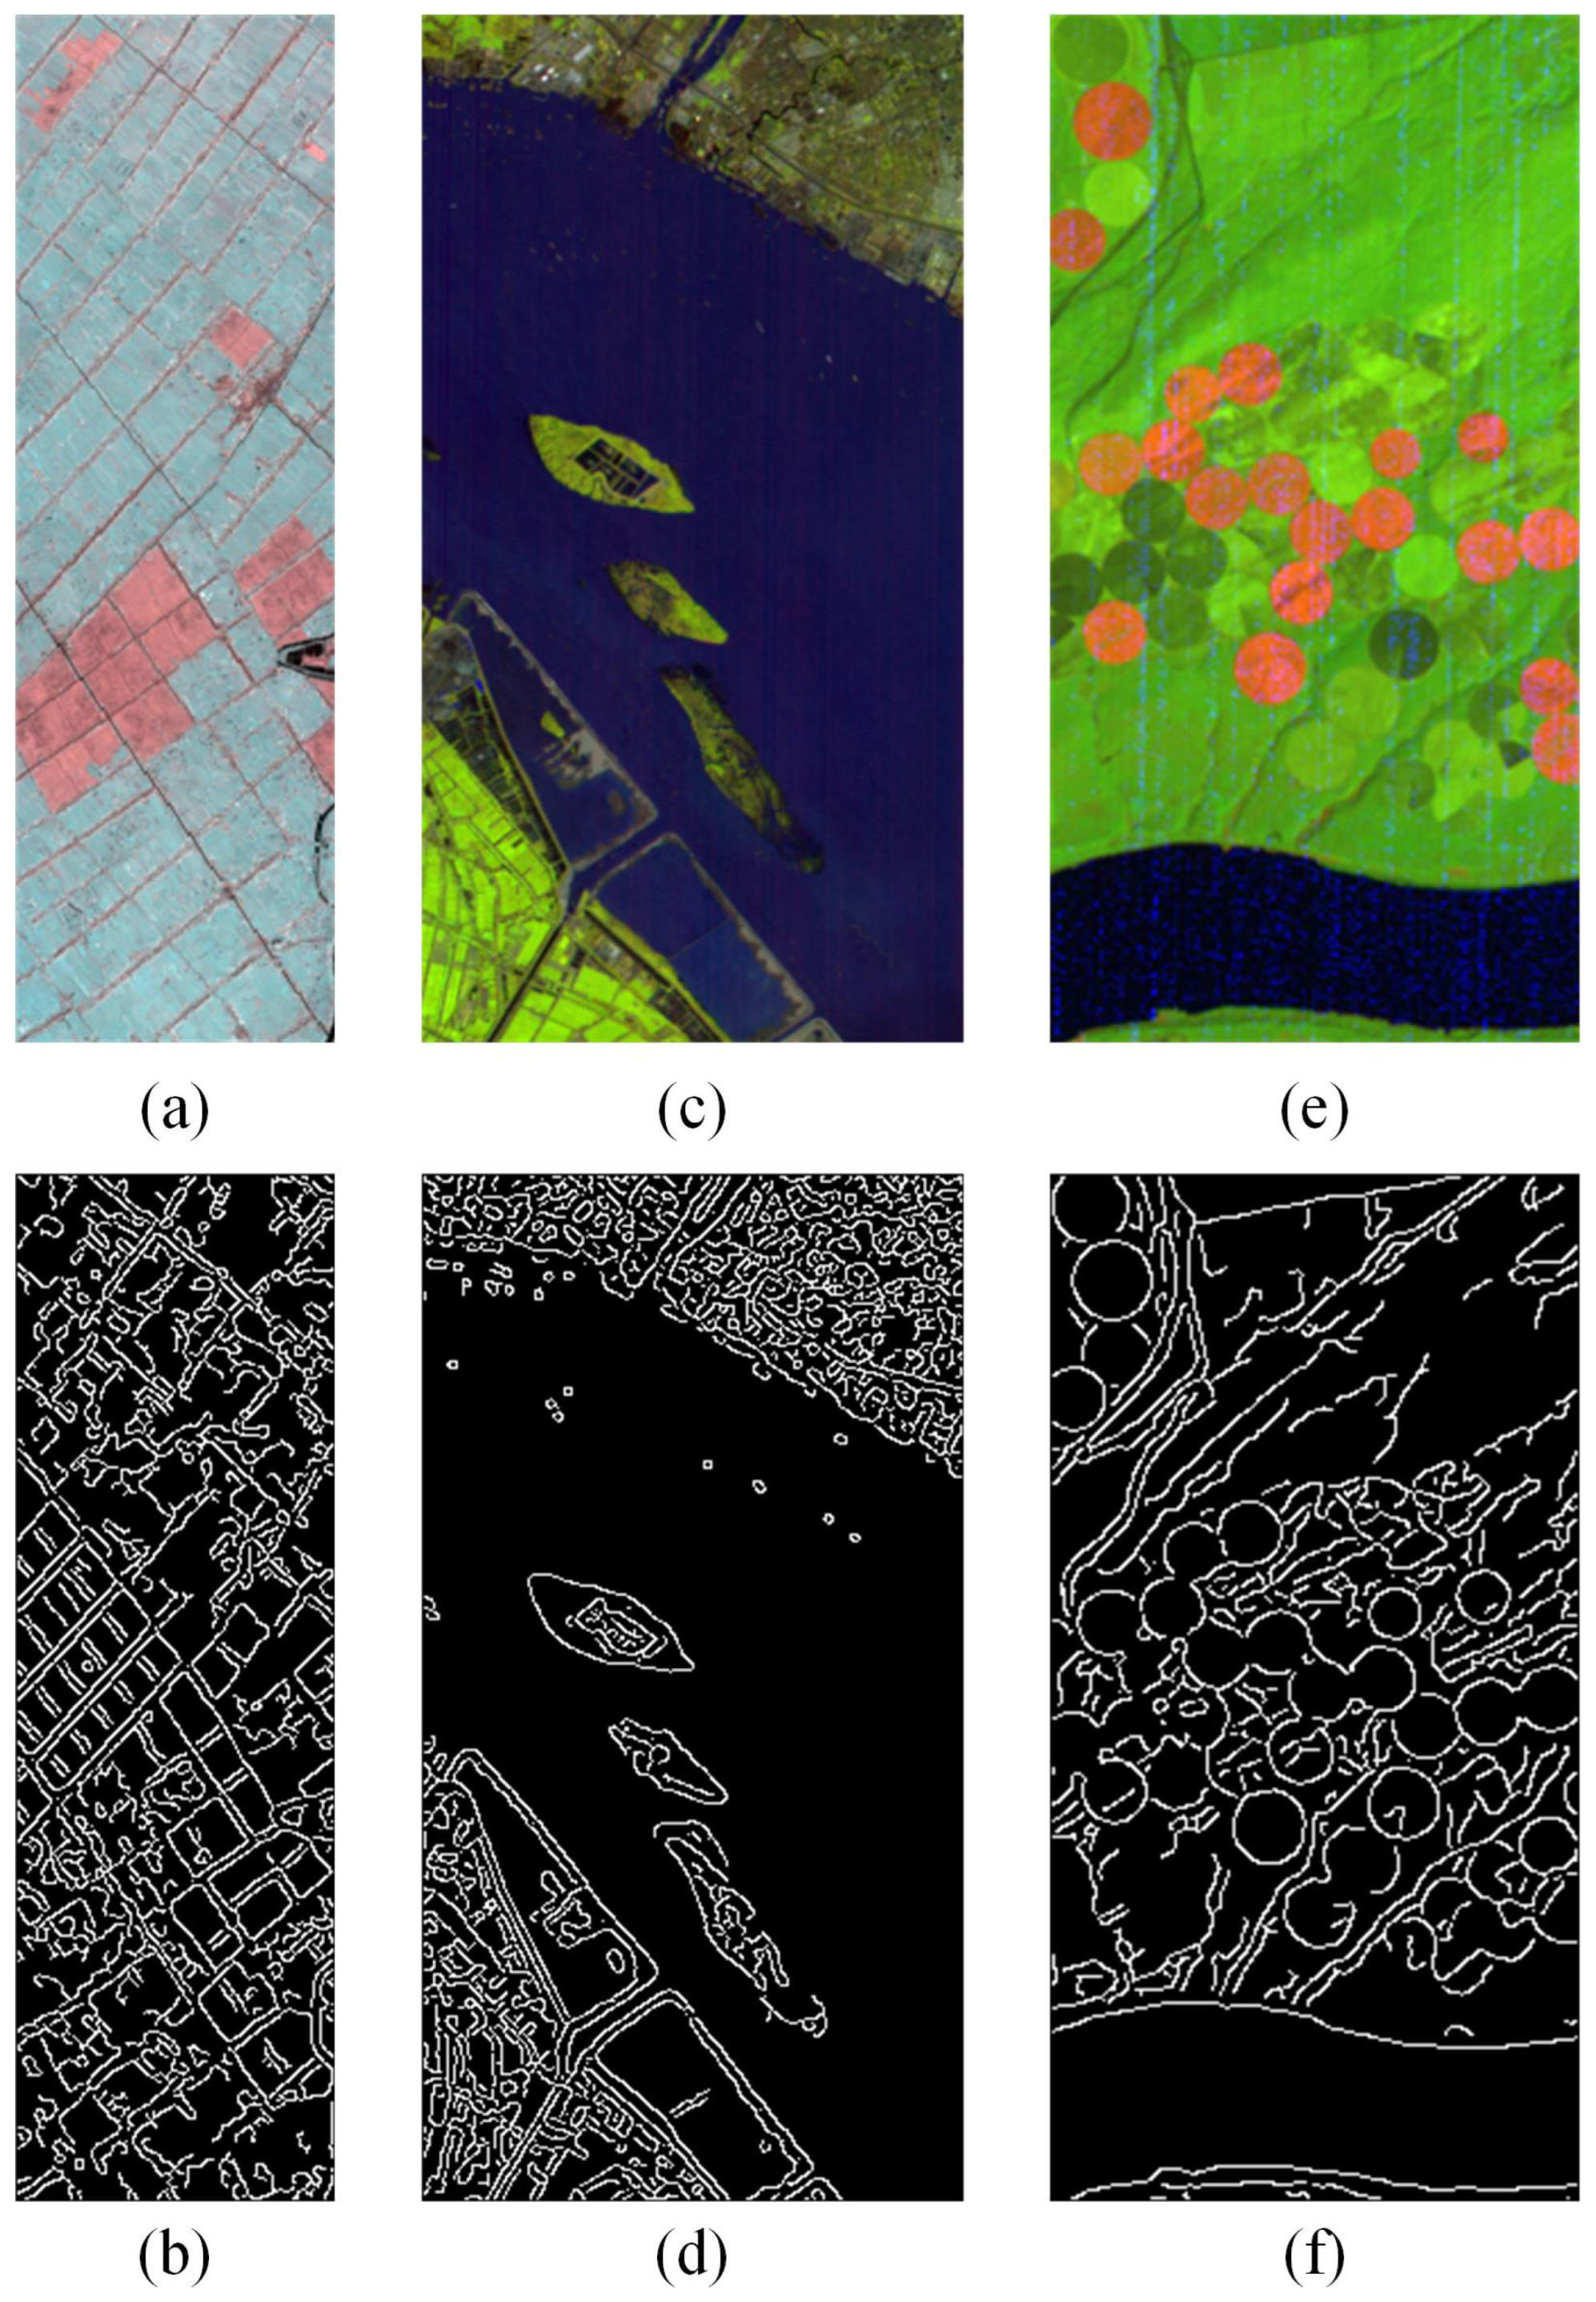
Figure 5.
Residual block.
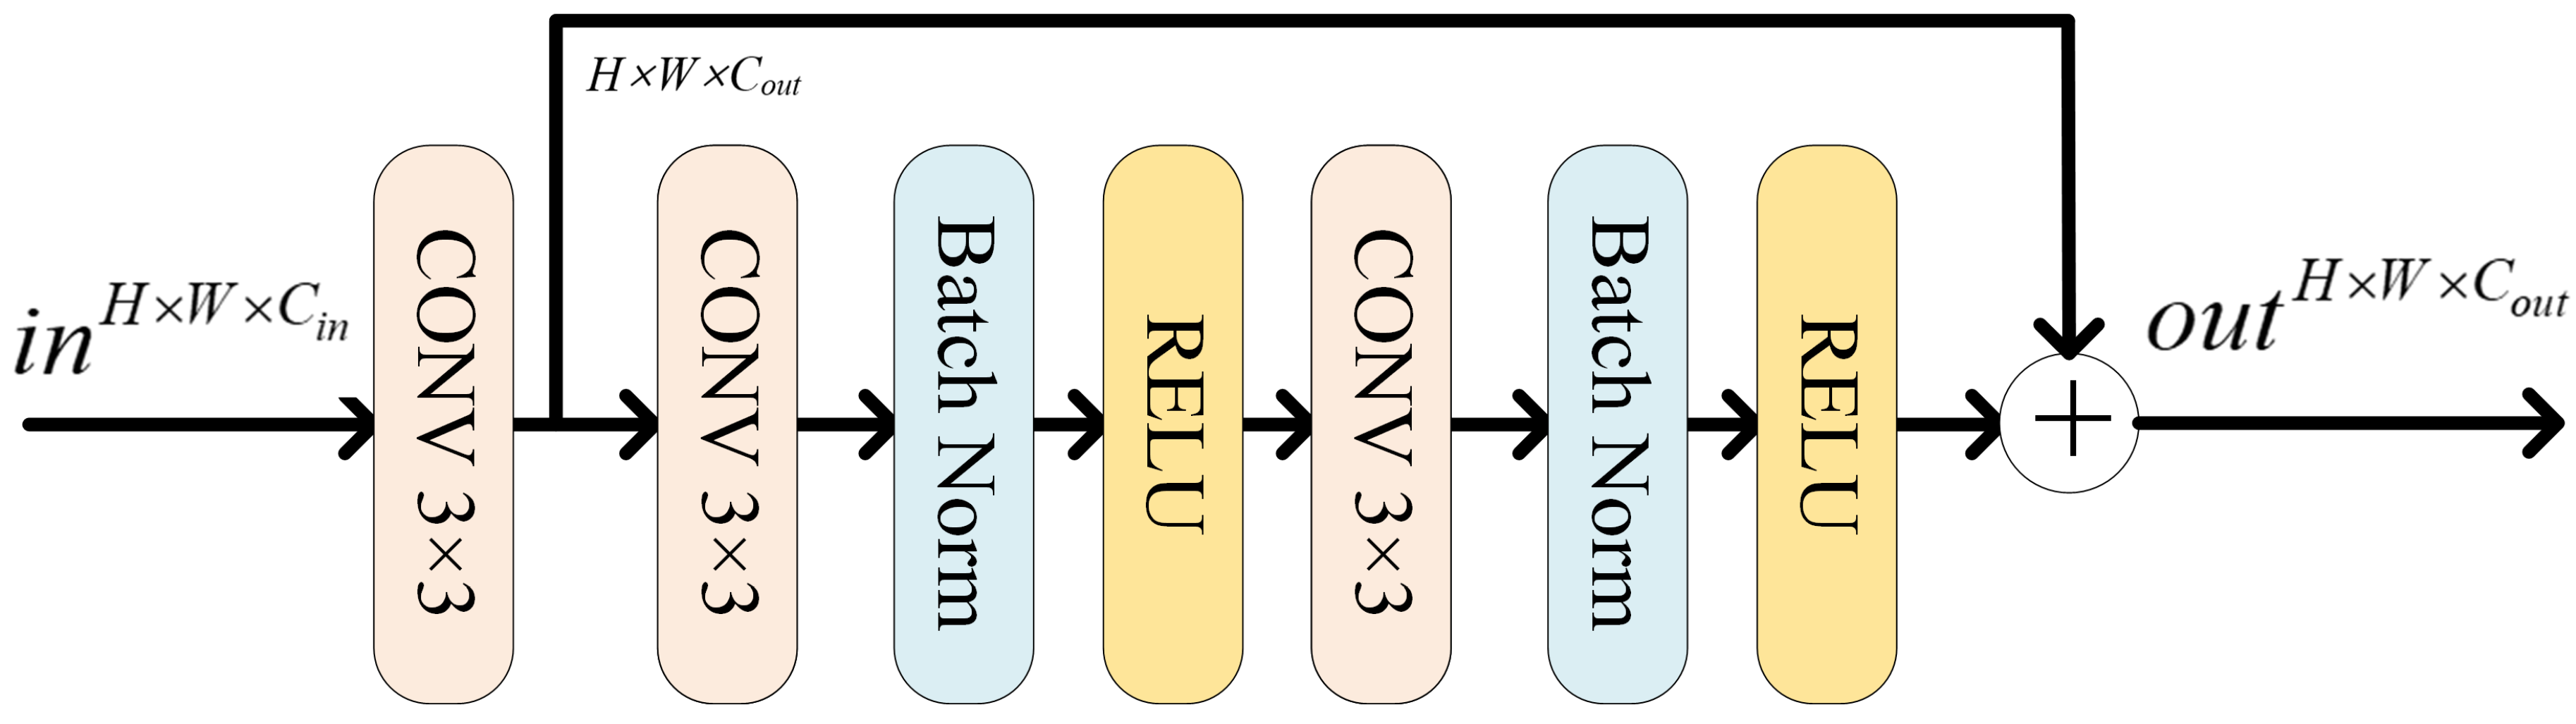
Figure 6.
The false color images for three datasets. (a) Farmland dataset (3 May 2006). (b) Farmland dataset (23 April 2007). (c) Hermiston dataset (1 May 2004). (d) Hermiston dataset (8 May 2007). (e) River dataset (3 May 2013). (f) River dataset (31 December 2013).
Figure 6.
The false color images for three datasets. (a) Farmland dataset (3 May 2006). (b) Farmland dataset (23 April 2007). (c) Hermiston dataset (1 May 2004). (d) Hermiston dataset (8 May 2007). (e) River dataset (3 May 2013). (f) River dataset (31 December 2013).

Figure 7.
Gray results of different methods on the Farmland dataset. (a) CVA. (b) PCA-CVA. (c) IR-MAD. (d) DCVA. (e) CAMF. (f) UTBANet. (g) Ground truth.
Figure 7.
Gray results of different methods on the Farmland dataset. (a) CVA. (b) PCA-CVA. (c) IR-MAD. (d) DCVA. (e) CAMF. (f) UTBANet. (g) Ground truth.
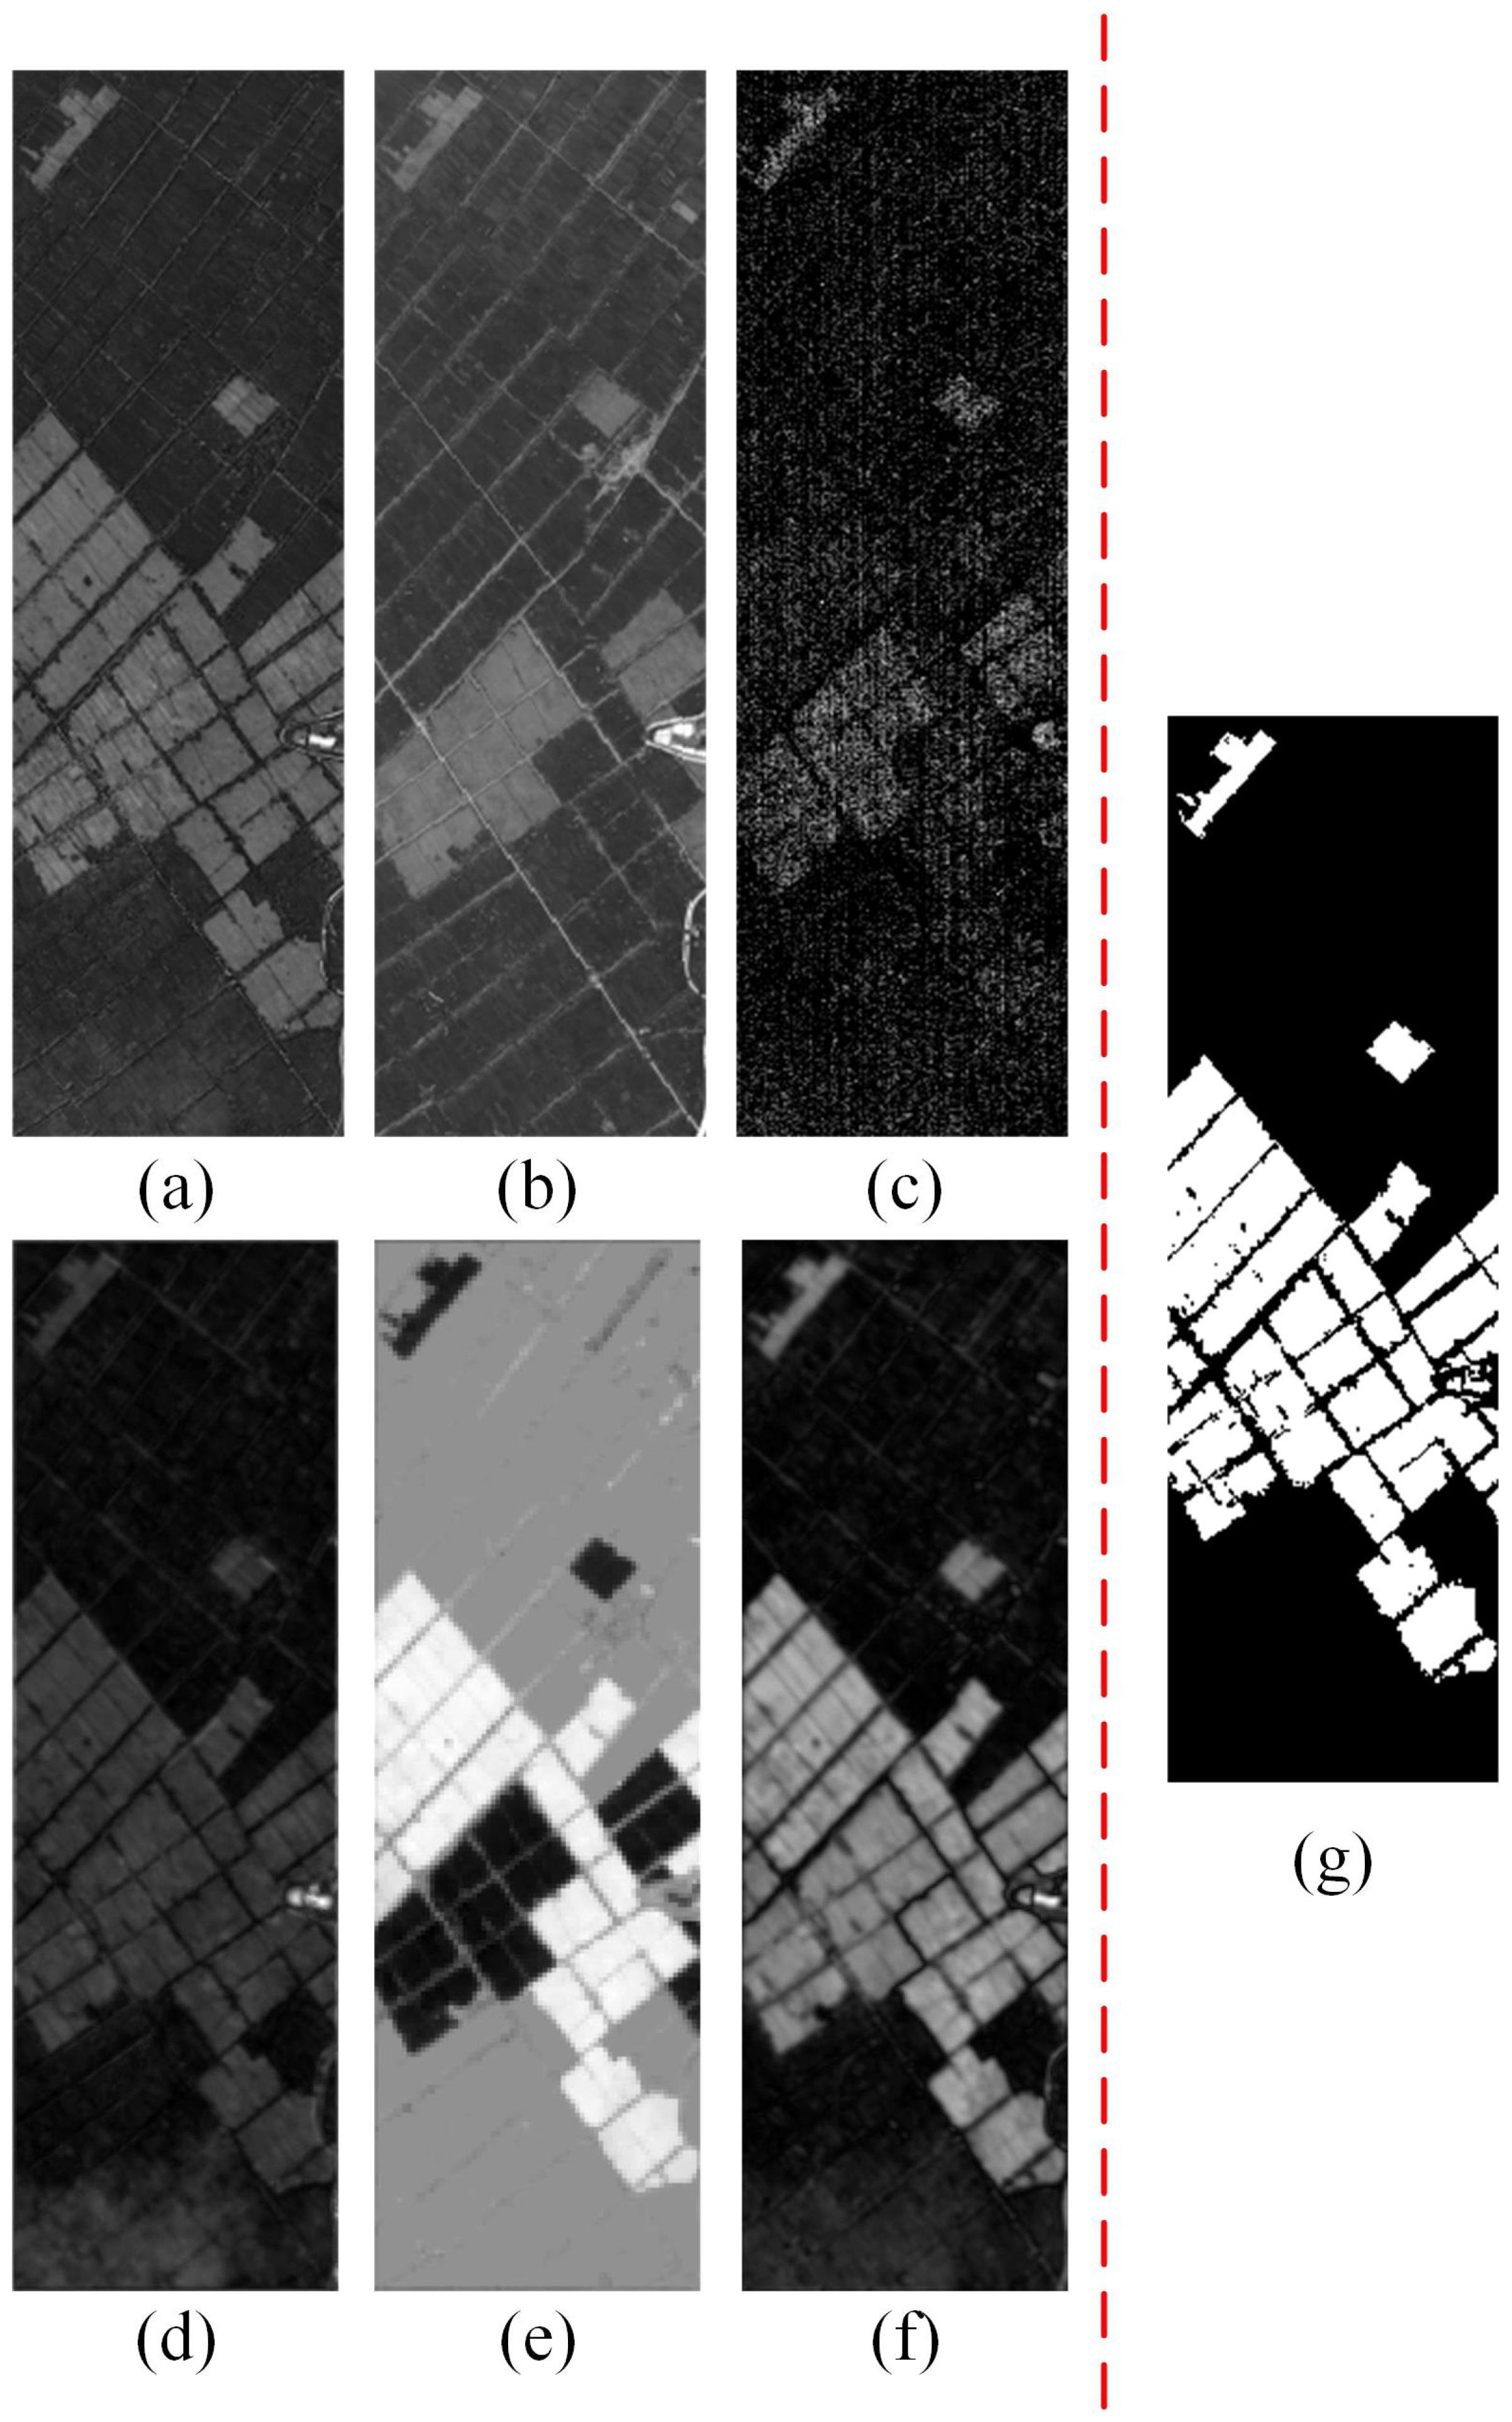
Figure 8.
Binary results of different methods on the Farmland dataset. (a) CVA. (b) PCA-CVA. (c) IR-MAD. (d) DCVA. (e) CAMF. (f) UTBANet. (g) Ground truth.
Figure 8.
Binary results of different methods on the Farmland dataset. (a) CVA. (b) PCA-CVA. (c) IR-MAD. (d) DCVA. (e) CAMF. (f) UTBANet. (g) Ground truth.

Figure 9.
Gray results of different methods on the Hermiston dataset. (a) CVA. (b) PCA-CVA. (c) IR-MAD. (d) DCVA. (e) CAMF. (f) UTBANet. (g) Ground truth.
Figure 9.
Gray results of different methods on the Hermiston dataset. (a) CVA. (b) PCA-CVA. (c) IR-MAD. (d) DCVA. (e) CAMF. (f) UTBANet. (g) Ground truth.
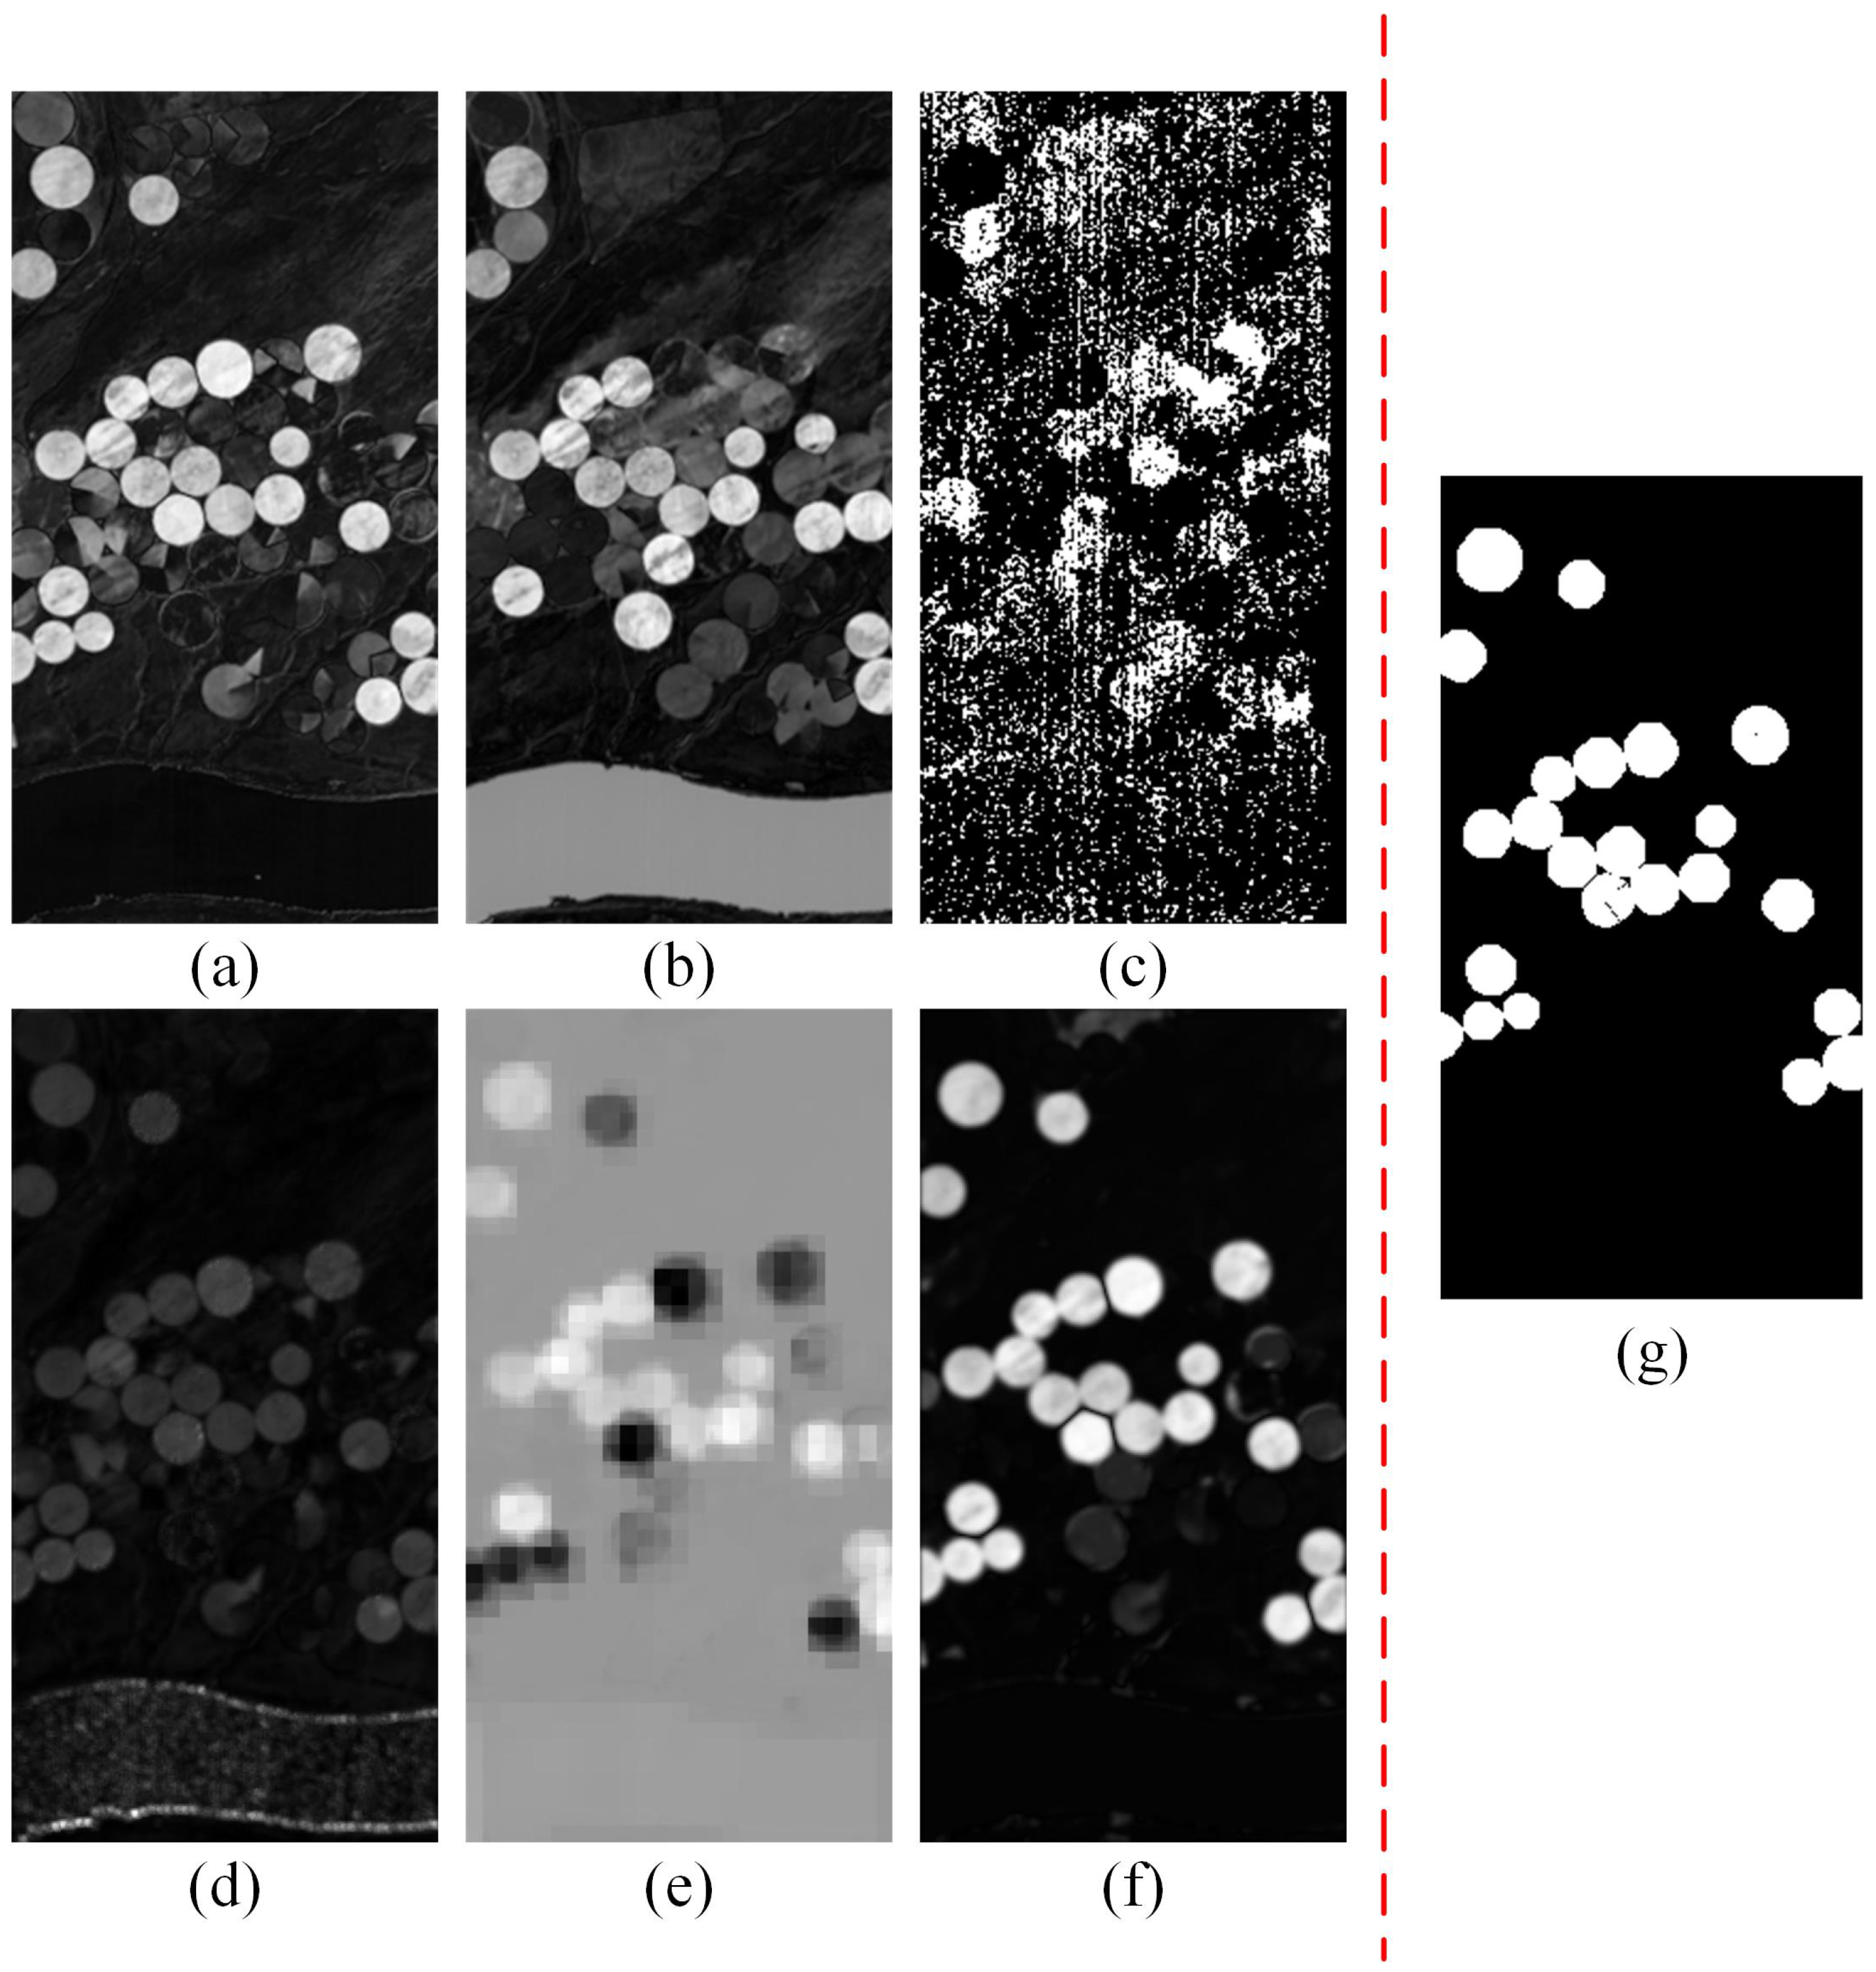
Figure 10.
Binary results of different methods on the Hermiston dataset. (a) CVA. (b) PCA-CVA. (c) IR-MAD. (d) DCVA. (e) CAMF. (f) UTBANet. (g) Ground truth.
Figure 10.
Binary results of different methods on the Hermiston dataset. (a) CVA. (b) PCA-CVA. (c) IR-MAD. (d) DCVA. (e) CAMF. (f) UTBANet. (g) Ground truth.
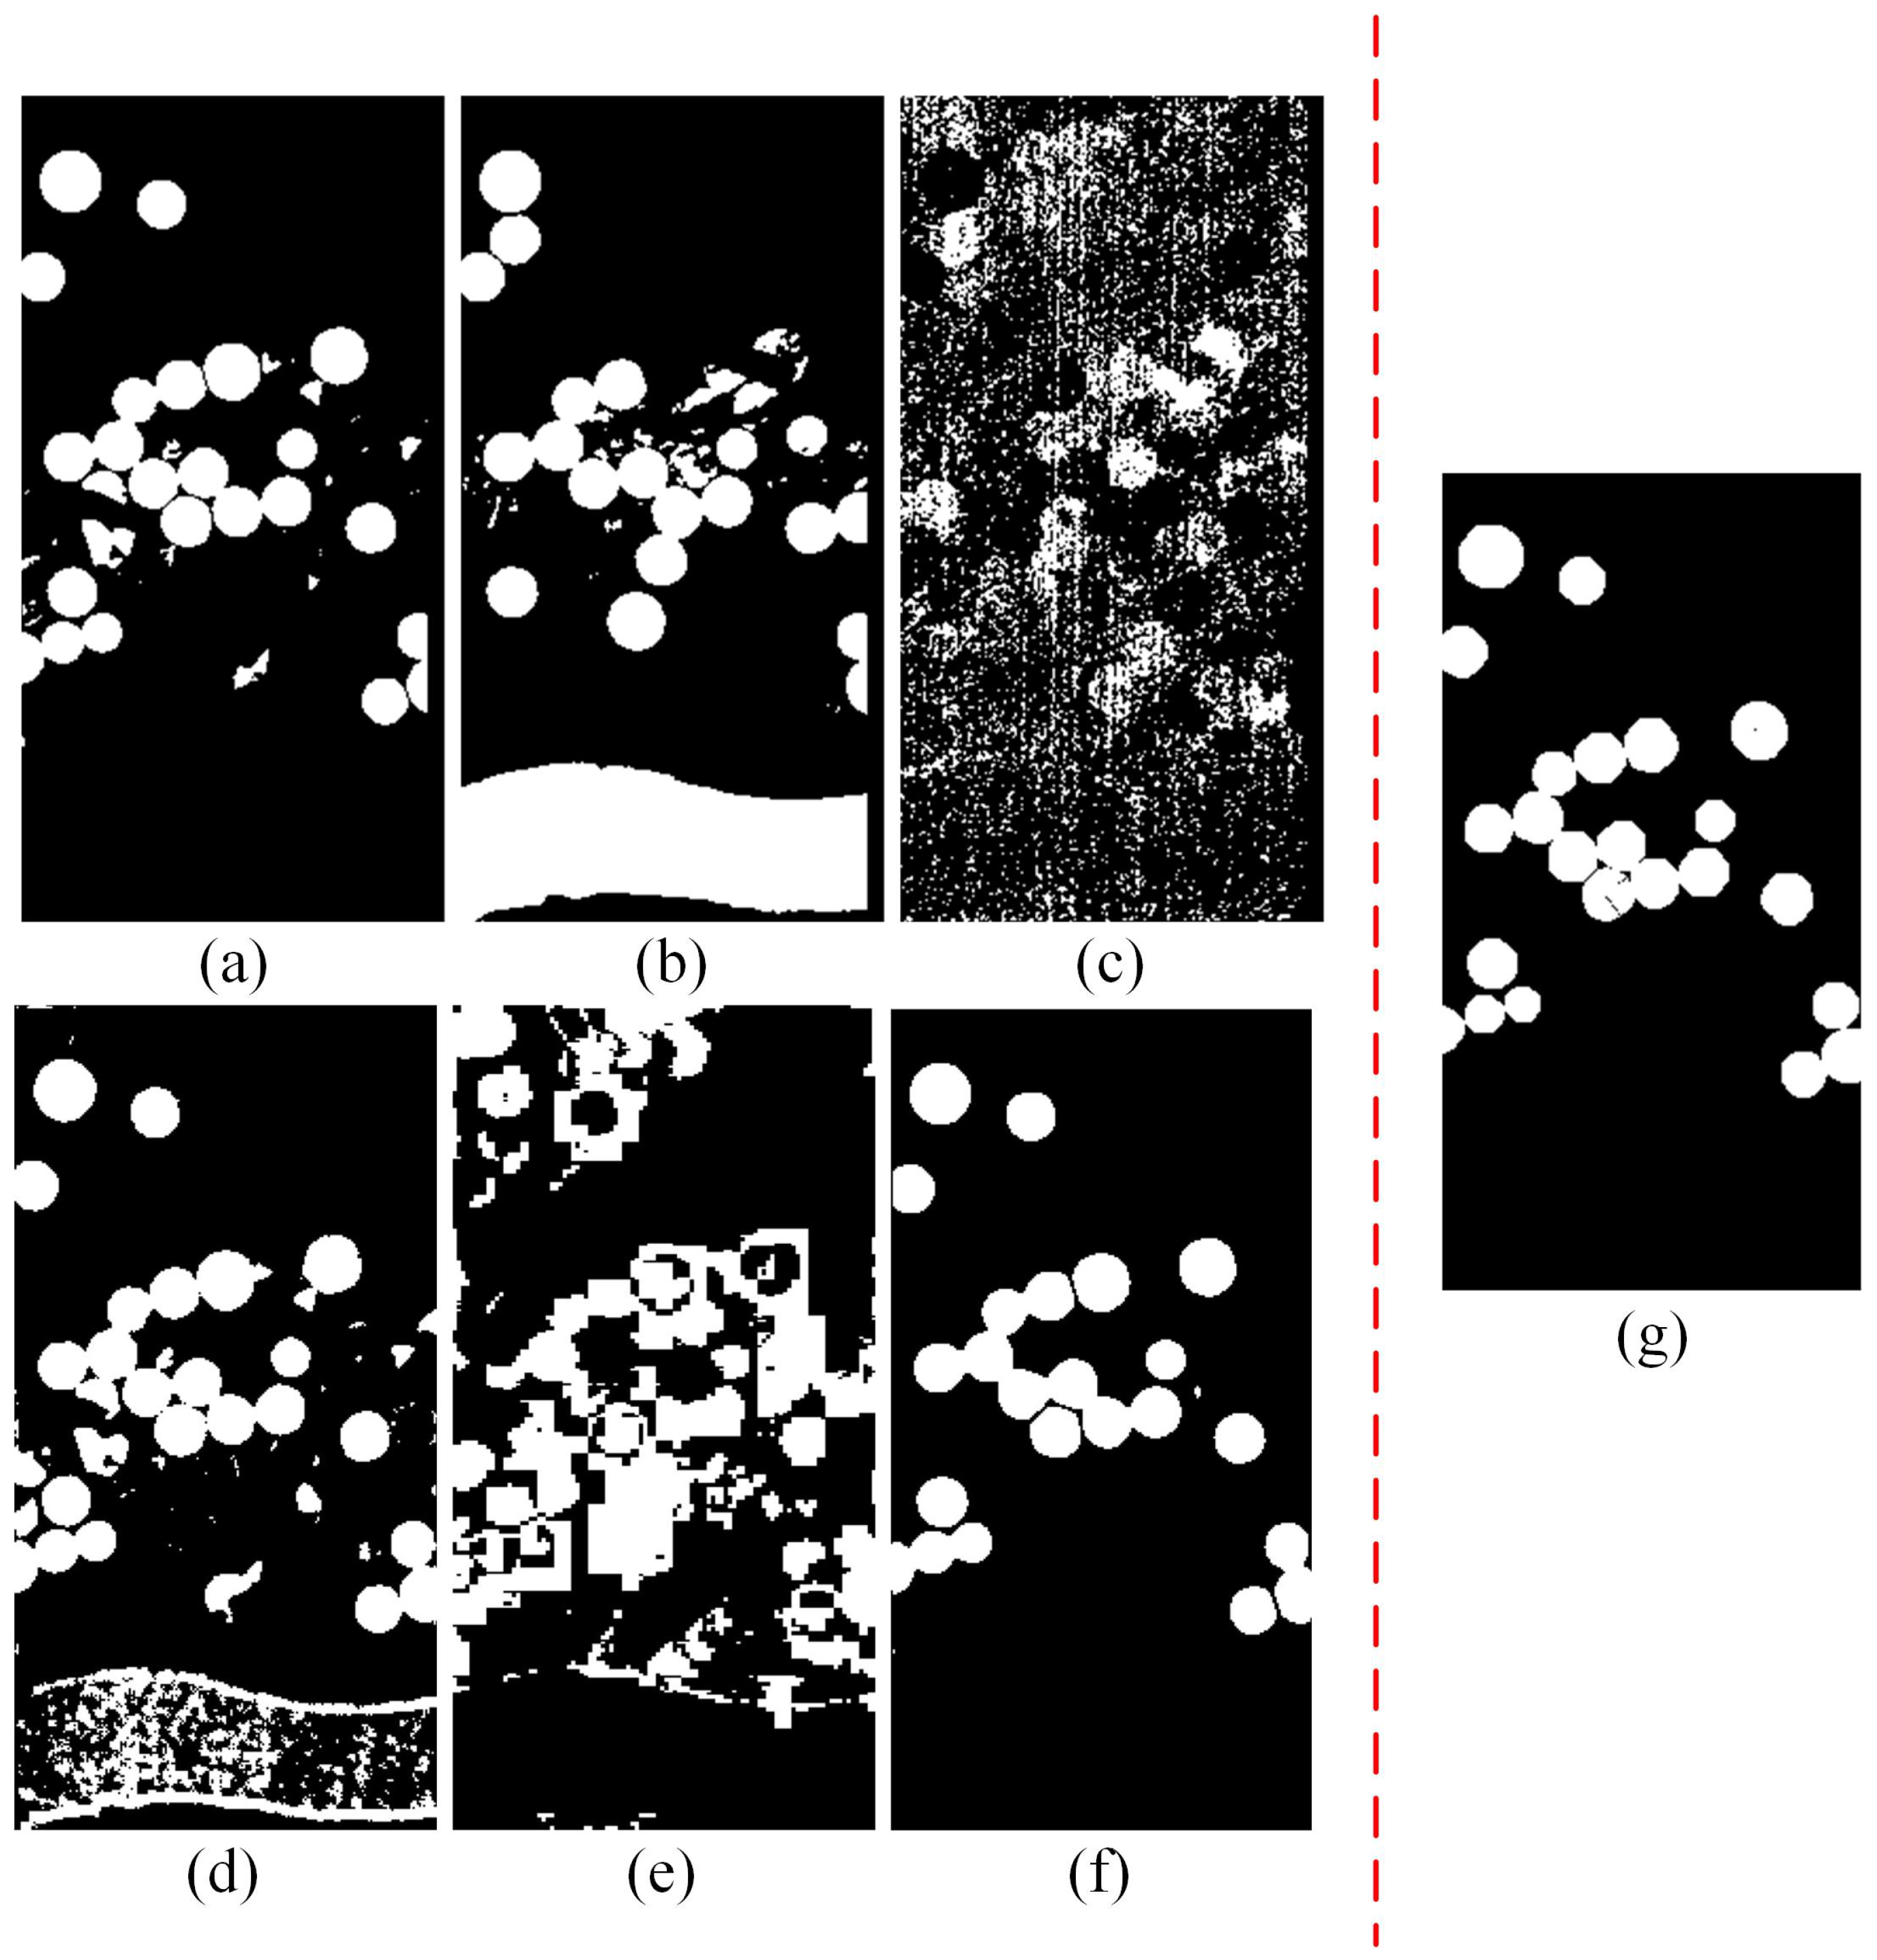
Figure 11.
Gray results of different methods on the River dataset. (a) CVA. (b) PCA-CVA. (c) IR-MAD. (d) DCVA. (e) CAMF. (f) UTBANet. (g) Ground truth.
Figure 11.
Gray results of different methods on the River dataset. (a) CVA. (b) PCA-CVA. (c) IR-MAD. (d) DCVA. (e) CAMF. (f) UTBANet. (g) Ground truth.
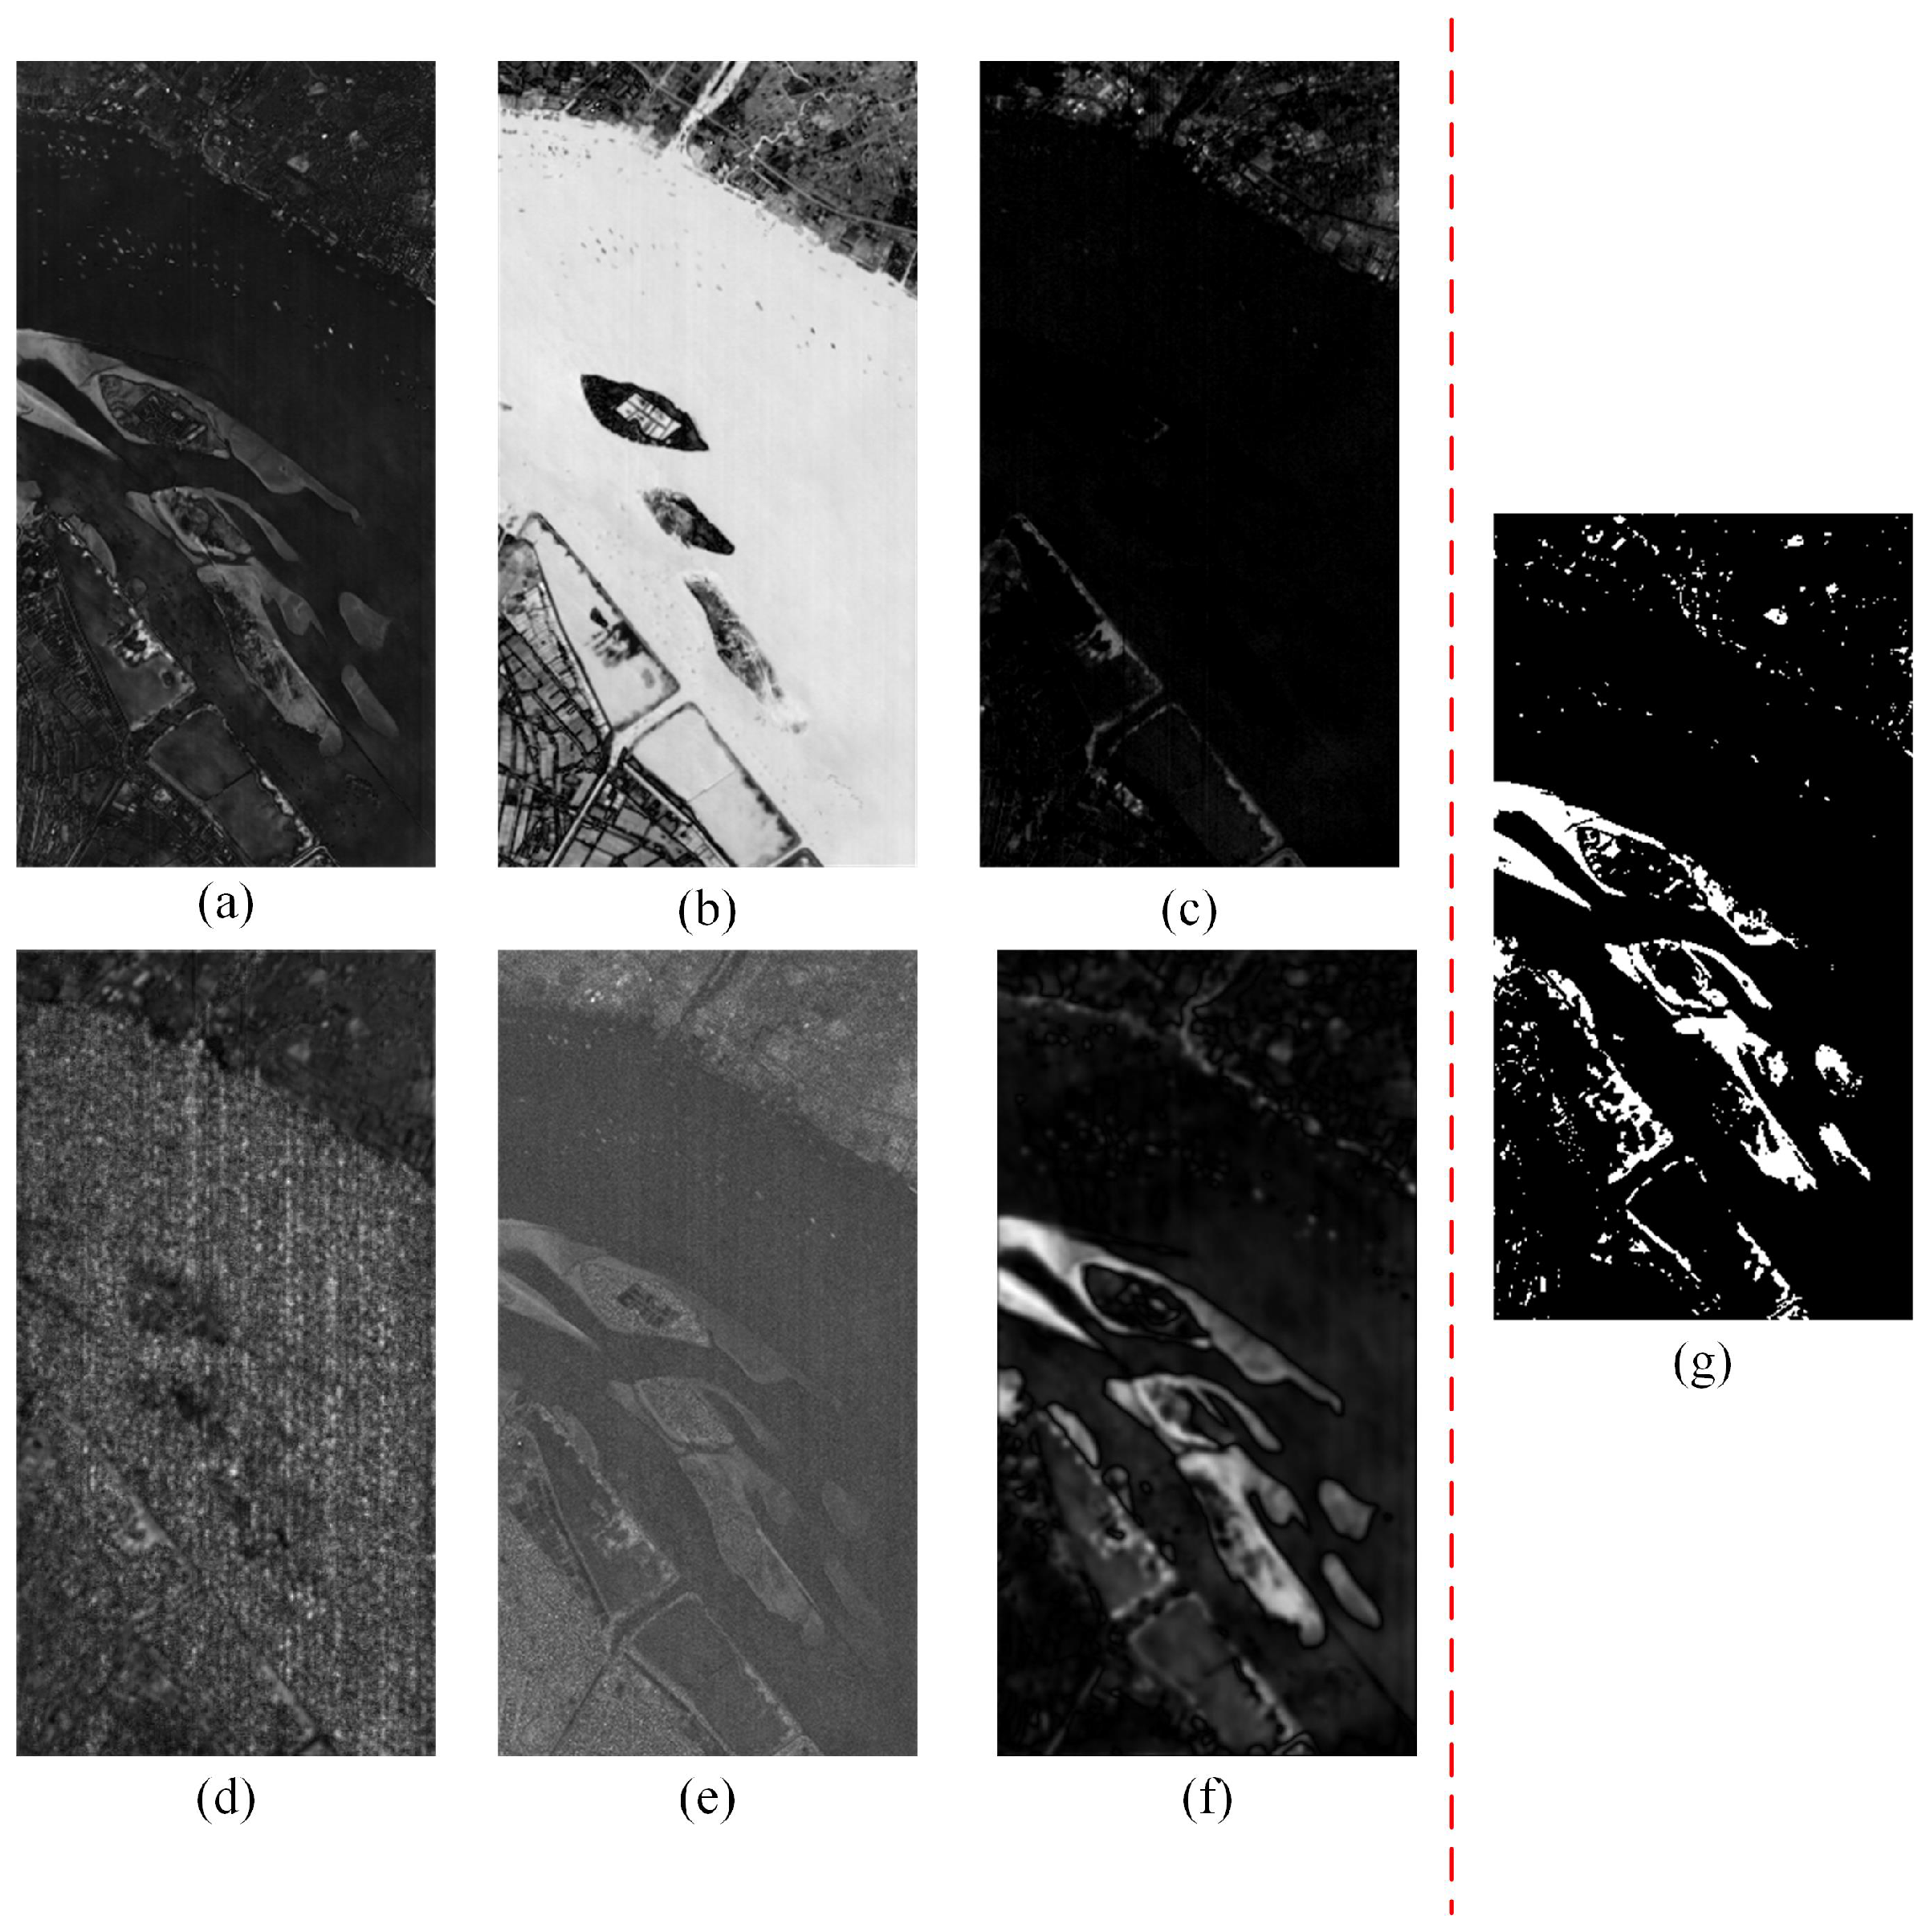
Figure 12.
Binary results of different methods on the River dataset. (a) CVA. (b) PCA-CVA. (c) IR-MAD. (d) DCVA. (e) CAMF. (f) UTBANet. (g) Ground truth.
Figure 12.
Binary results of different methods on the River dataset. (a) CVA. (b) PCA-CVA. (c) IR-MAD. (d) DCVA. (e) CAMF. (f) UTBANet. (g) Ground truth.

Figure 13.
Contribution of BD on Farmland dataset. (a) Net without BD. (b) UTBANet. (c) Ground truth.
Figure 13.
Contribution of BD on Farmland dataset. (a) Net without BD. (b) UTBANet. (c) Ground truth.

Figure 14.
Contribution of BD on Hermiston dataset. (a) Net without BD. (b) UTBANet. (c) Ground truth.
Figure 14.
Contribution of BD on Hermiston dataset. (a) Net without BD. (b) UTBANet. (c) Ground truth.
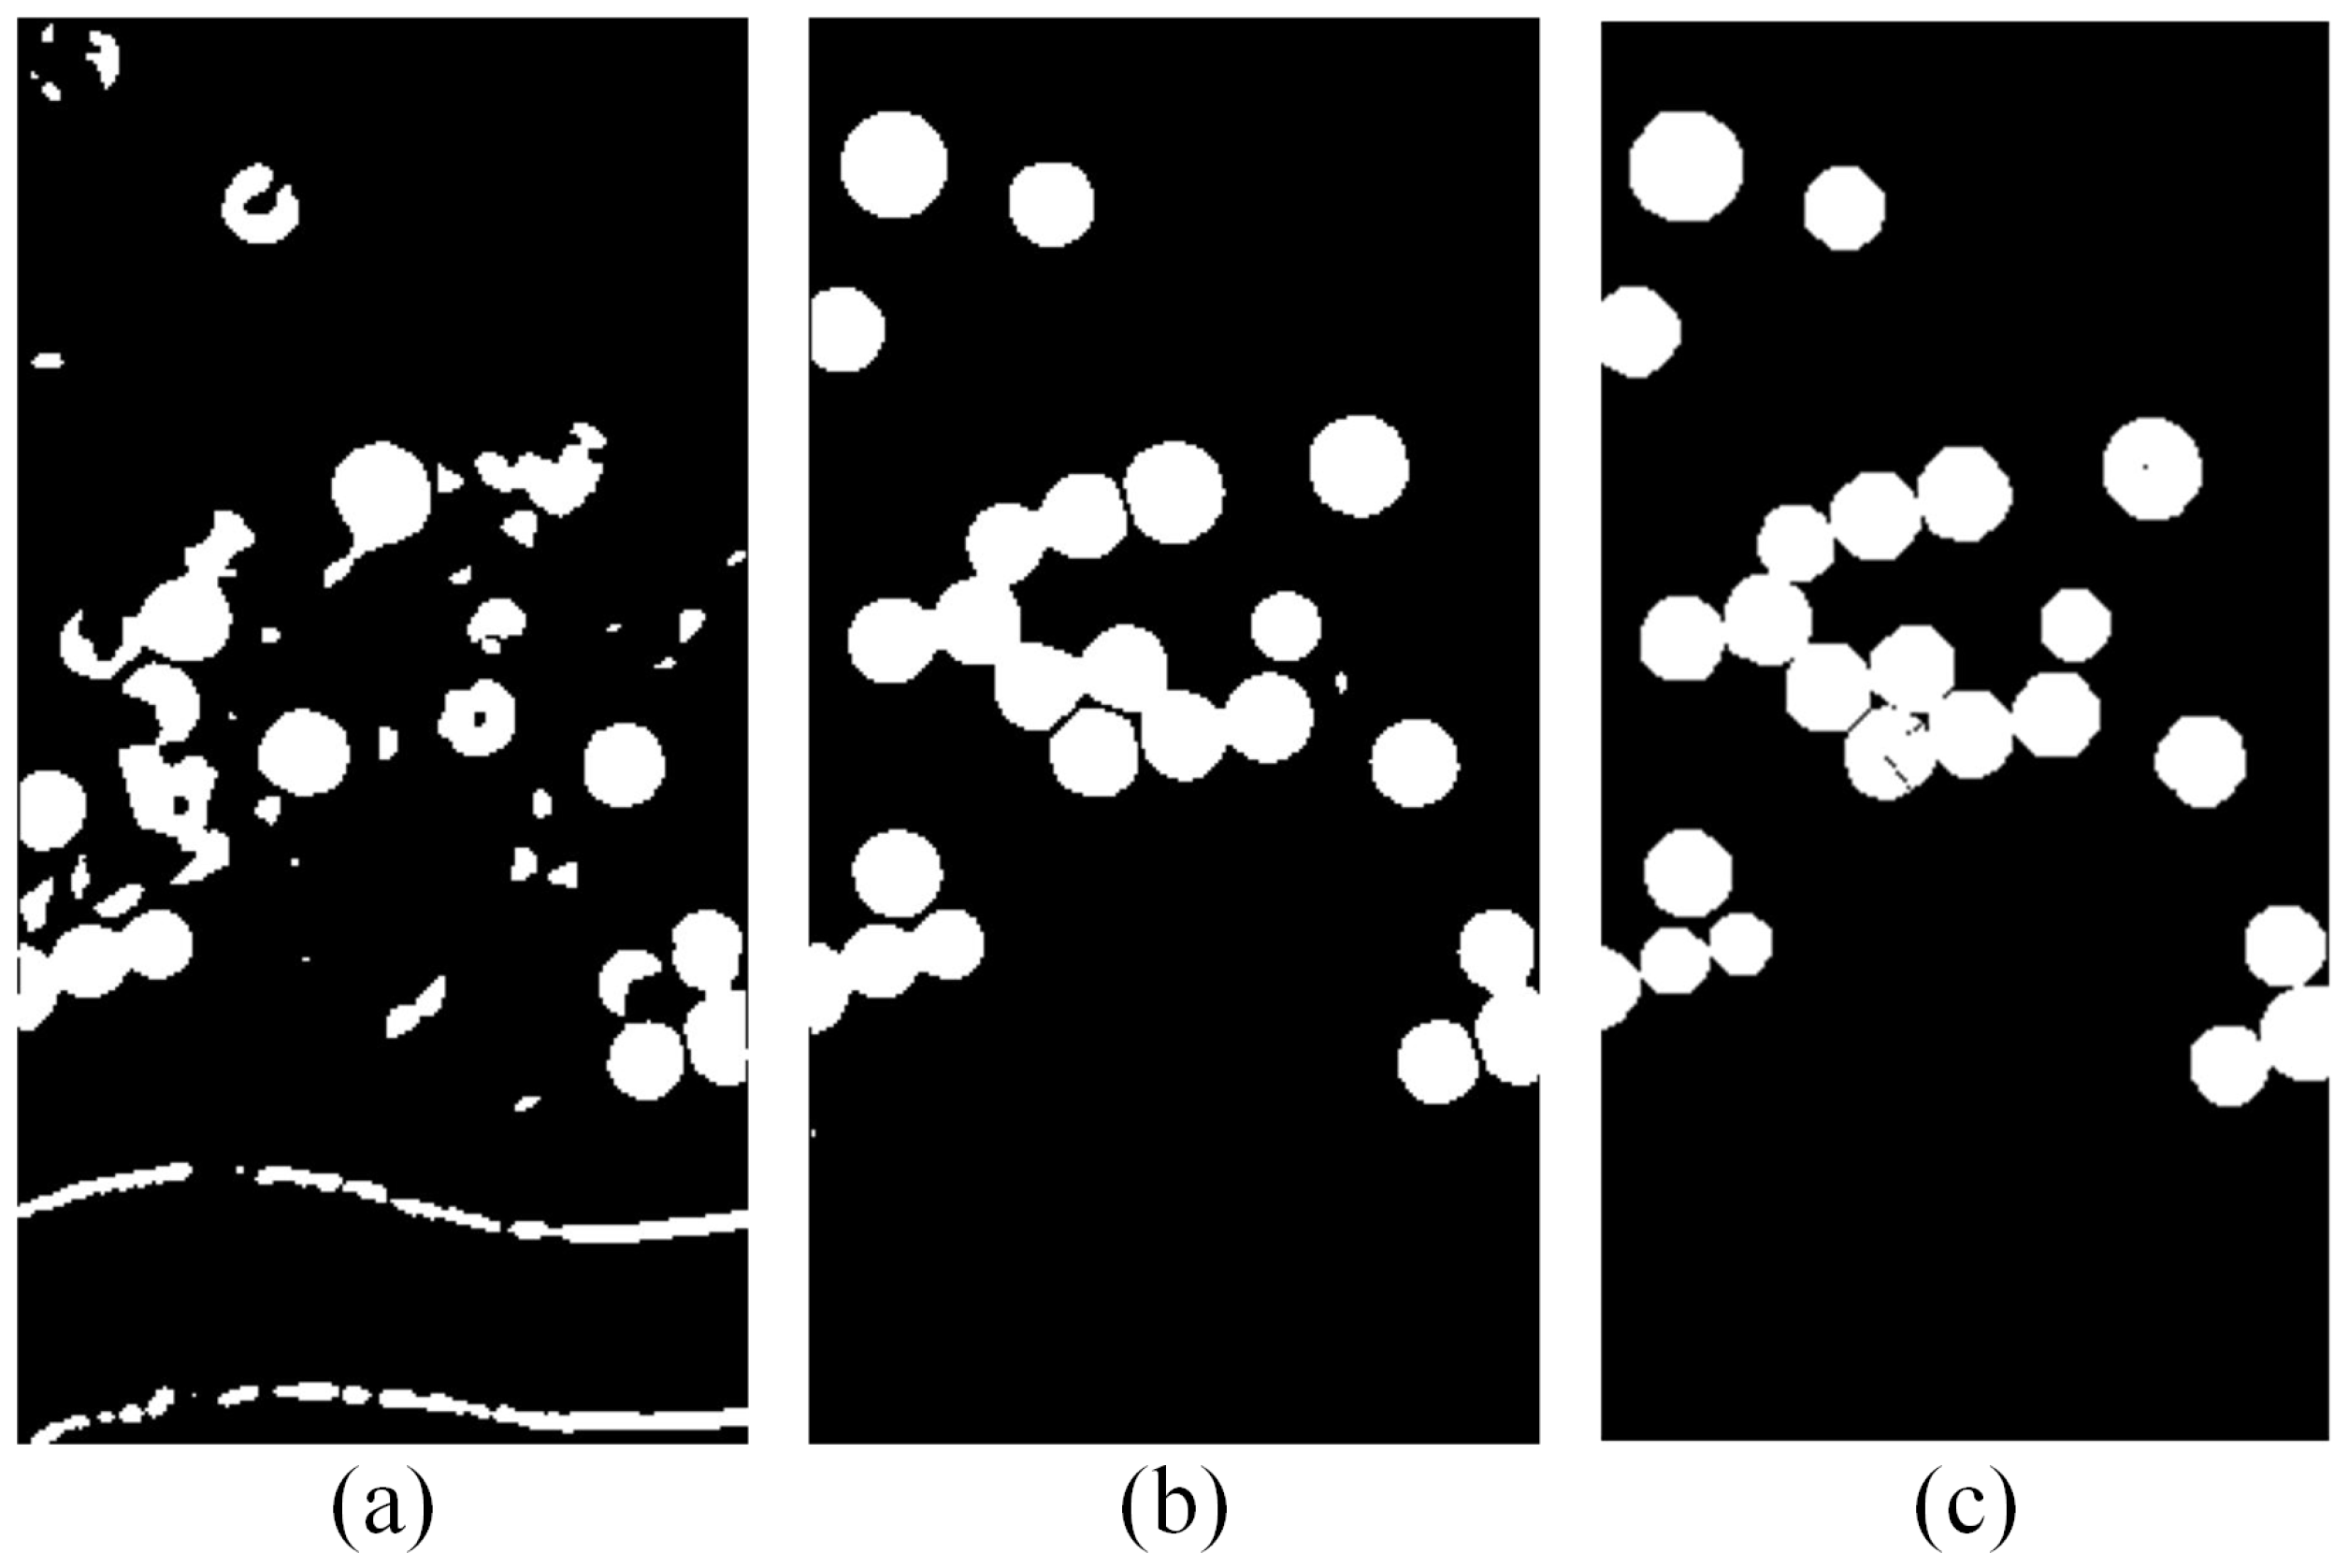
Figure 15.
Contribution of BD on Hermiston dataset. (a) Net without BD. (b) UTBANet. (c) Ground truth.
Figure 15.
Contribution of BD on Hermiston dataset. (a) Net without BD. (b) UTBANet. (c) Ground truth.

Table 1.
OA of UTBANet with different kernel numbers for the three datasets.
| Dataset | Kernel Number | |||
|---|---|---|---|---|
| 32 | 64 | 128 | 256 | |
| Farmland | 0.9611 | 0.9663 | 0.9624 | 0.8228 |
| Hermiston | 0.9724 | 0.7355 | 0.8549 | 0.9858 |
| River | 0.8929 | 0.9492 | 0.8899 | 0.8263 |
Table 2.
OA of UTBANet with different batch sizes for the three datasets.
| Dataset | Batch Size | ||
|---|---|---|---|
| 32 | 64 | 128 | |
| Farmland | 0.9617 | 0.9572 | 0.9663 |
| Hermiston | 0.9858 | 0.8082 | 0.8282 |
| River | 0.8495 | 0.9492 | 0.8759 |
Table 3.
OA of UTBANet with different for the three datasets.
| Dataset | ||||||
|---|---|---|---|---|---|---|
| 0.1 | 0.5 | 1 | 2 | 5 | 10 | |
| Farmland | 0.7075 | 0.8469 | 0.9645 | 0.8593 | 0.9663 | 0.9186 |
| Hermiston | 0.8288 | 0.8307 | 0.9769 | 0.8171 | 0.9858 | 0.9776 |
| River | 0.9018 | 0.8697 | 0.7979 | 0.9492 | 0.8603 | 0.7943 |
Table 4.
OA of UTBANet with different operators for the three datasets.
| Dataset | Edge Detection Operator | |
|---|---|---|
| Sobel | Canny | |
| Farmland | 0.9663 | 9578 |
| Hermiston | 0.858 | 0.9856 |
| River | 0.9492 | 0.8541 |
Table 5.
Change detection results of the Farmland dataset.
| Method | Metrics | ||
|---|---|---|---|
| OA | KC | IoU | |
| CVA | 0.9615 | 0.9073 | 0.9427 |
| PCA-CVA | 0.7318 | 0.2767 | 0.8233 |
| IR-MAD | 0.7273 | 0.2969 | 0.8154 |
| DCVA | 0.8690 | 0.7152 | 0.8114 |
| CAMF | 0.8006 | 0.5804 | 0.7273 |
| UTBANet | 0.9663 | 0.9195 | 0.9434 |
Table 6.
Change detection results of the Hermiston dataset.
| Method | Metrics | ||
|---|---|---|---|
| OA | KC | IoU | |
| CVA | 0.9734 | 0.8849 | 0.9347 |
| PCA-CVA | 0.7655 | 0.2996 | 0.8529 |
| IR-MAD | 0.7810 | 0.4079 | 0.8584 |
| DCVA | 0.8965 | 0.6394 | 0.6976 |
| CAMF | 0.7416 | 0.2456 | 0.3791 |
| UTBANet | 0.9858 | 0.9362 | 0.9443 |
Table 7.
Change detection results of the River dataset.
| Method | Metrics | ||
|---|---|---|---|
| OA | KC | IoU | |
| CVA | 0.9398 | 0.7020 | 0.9661 |
| PCA-CVA | 0.3310 | 0.0102 | 0.4425 |
| IR-MAD | 0.8654 | 0.0849 | 0.9269 |
| DCVA | 0.5936 | 0.0109 | 0.1517 |
| CAMF | 0.7725 | 0.2769 | 0.8610 |
| UTBANet | 0.9492 | 0.7225 | 0.9501 |
Table 8.
OA of the different networks.
| Network | Farmland | Hermiston | River |
|---|---|---|---|
| Net without BD | 0.9345 | 0.8870 | 0.8585 |
| Net without SE | 0.9491 | 0.8284 | 0.8325 |
| UTBANet | 0.9663 | 0.9858 | 0.9492 |
Disclaimer/Publisher’s Note: The statements, opinions and data contained in all publications are solely those of the individual author(s) and contributor(s) and not of MDPI and/or the editor(s). MDPI and/or the editor(s) disclaim responsibility for any injury to people or property resulting from any ideas, methods, instructions or products referred to in the content. |
© 2023 by the authors. Licensee MDPI, Basel, Switzerland. This article is an open access article distributed under the terms and conditions of the Creative Commons Attribution (CC BY) license (https://creativecommons.org/licenses/by/4.0/).
Share and Cite
MDPI and ACS Style
Liu, S.; Li, H.; Wang, F.; Chen, J.; Zhang, G.; Song, L.; Hu, B. Unsupervised Transformer Boundary Autoencoder Network for Hyperspectral Image Change Detection. Remote Sens. 2023, 15, 1868. https://doi.org/10.3390/rs15071868
AMA Style
Liu S, Li H, Wang F, Chen J, Zhang G, Song L, Hu B. Unsupervised Transformer Boundary Autoencoder Network for Hyperspectral Image Change Detection. Remote Sensing. 2023; 15(7):1868. https://doi.org/10.3390/rs15071868
Chicago/Turabian StyleLiu, Song, Haiwei Li, Feifei Wang, Junyu Chen, Geng Zhang, Liyao Song, and Bingliang Hu. 2023. "Unsupervised Transformer Boundary Autoencoder Network for Hyperspectral Image Change Detection" Remote Sensing 15, no. 7: 1868. https://doi.org/10.3390/rs15071868
Note that from the first issue of 2016, this journal uses article numbers instead of page numbers. See further details here.