
A Semantic View on Planetary Mapping—Investigating Limitations and Knowledge Modeling through Contextualization and Composition

1
Geomatics Group, Department of Land Economics, National Chengchi University, Taipei 11605, Taiwan
2
Department of Planetary Geology, Institute of Planetary Research, German Aerospace Centre (DLR), 12489 Berlin, Germany
*
Author to whom correspondence should be addressed.
Remote Sens. 2023, 15(6), 1616; https://doi.org/10.3390/rs15061616
Submission received: 12 December 2022
/
Revised: 12 March 2023
/
Accepted: 14 March 2023
/
Published: 16 March 2023
(This article belongs to the Special Issue Cartography of the Solar System: Remote Sensing beyond Earth)
Abstract
:The concept of planetary mapping constitutes different activities within different contexts. Much like the field of cartography, it is an amalgamation of science, techniques, and artistic disciplines. It has undergone considerable changes over the last decades to cope with increasing demands related to data management, analysis, and visualization. Planetary mapping employs abstraction, which involves simplifications and generalizations. It aims to produce accessible visualization of planetary surfaces to gain insights and knowledge. Here, we show that different manifestations of this concept are interdependent and we discuss how different mapping concepts relate to each other semantically. We reason that knowledge gain can only be achieved through thematic mapping. The reasoning for systematic mapping and exploration is an intellectual product of thematic mapping. In order to highlight these relationships, we (a) develop in-depth definitions for different types of planetary mapping, (b) discuss data and knowledge flow across different mapping concepts, and (c) highlight systemic limitations related to data that we acquire and attempt to abstract through models. We finally develop a semantic proto-model that focuses on the transformation of information and knowledge between mapping domains. We furthermore argue that due to compositionality, map products suffer not only from abstraction but also from limitations related to uncertainties during data processing. We conclude that a complete database is needed for mapping in order to establish contextualization and extract knowledge. That knowledge is needed for reasoning for planning and operational decision making. This work furthermore aims to motivate future community-based discussions on functional semantic models and ontologies for the future development of knowledge extraction from thematic maps.

1. Introduction
1.1. Motivation
One possible concept of cartographic mapping encompasses the exploration of the unknown through the systematic acquisition of spatial information and its contextualization. In this context, the unknown might refer to a place never visited before, a place observed at higher resolution for the first time, or a place observed at a different point in time. Planetary exploration relies on mapping and may be understood in the sense of discovering uncharted regions mapped at a yet unprecedented spatial, temporal, or spectral resolution. If understood as a single concept, mapping can qualify as a cartographic technique to transform quantitative spatial information into a simplified and projected representation of the real world. However, it can also be seen as a term that encompasses different contexts. Mapping also establishes and implements a conceptual model allowing to abstract a complex reality for the purpose of storing data and extracting scientific knowledge. In return, this derived knowledge provides the reasoning and arguments for exploration and discovery that allow charting less-known areas to identify future scientific or economic exploitation targets. With that in mind, one could argue that mapping does not require further justification, as the discipline itself is self-sufficient and fed by data that have been collected as a consequence of mapping. A large amount of accumulating planetary data on the one hand and the comparably small number of systematic scientific maps on the other, however, raise the question of how and in what way modern cartographic products (1) play a crucial role in the development of knowledge and how they (2) constitute efficient tools for exploration.
This investigation builds upon the initial argument that thematic mapping is the underlying discipline and tool to allow knowledge to be derived through contextualization. All other representations lead to spatially dissociated—or noncontextualized—pieces of information. It provides the necessary reasoning to continue mapping and exploration until potential scientific, economic, or strategic goals are met. The value of planetary cartography and the need for mapping have been re-emphasized over the last decades in a number of contributions [1,2,3,4,5,6,7]. These have implicitly shown that purposeful mapping forms a foundation of future exploration and potential exploitation.
At this point, we have no way to verify or falsify our claim other than by highlighting the relevance and discussing the interdependencies between different mapping concepts. Despite its seemingly simple concept, the term mapping must be treated as a metaconcept as it needs to be defined and represented through its different interdependent contexts. Furthermore, the concept requires further elucidation as its meaning seems more confined in the planetary community than in the terrestrial domain [3]. Apart from these ongoing discussions about the larger cartographic context, we first want to approach the concept of mapping and the mutual dependence of its contexts from a practical point of view. We here distinguish three such contexts: (1) systematic, or reconnaissance, mapping when it comes to data acquisition, (2) reference mapping when it comes to compiling reference maps, and (3) thematic mapping when it comes to abstracting pieces of information to build complex analytical thematic maps, such as geological maps. Of these three mapping contexts, the latter two are traditional cartographic contexts.
Mapping as a wider concept is about data on different levels of abstraction, more particularly: data acquisition, data transformation, and data abstraction. For conventional planetary cartographic mapping, the most important data assets are images and topographic data. Despite the importance of data and the availability of numerous data sources, thematic mapping builds largely on (1) precompiled image mosaics and (2) a heavily reduced sub-selection of data which mostly builds on visual aesthetics and homogeneity rather than depth of information. Today’s challenge is that systematic processing and sub-selection of data have become too inefficient due to large volumes of data and demanding data-processing and screening requirements. If thematic mapping qualifies as a provider of knowledge and for facilitating informed decision making [8] due to the compilation and integration of different pieces of information, one should aim to review and integrate as much data as possible in order to generate the best information possible.
The under-representation of institutions participating in coordinated thematic mapping in the planetary domain and the lack of systematic cartographic output contrast with the hypothesis that thematic mapping is a foundational building block in knowledge generation and a requirement for generating valid justification for exploration. This is one of the core questions that we aim to discuss in this contribution. In order to understand the role and importance of mapping, we develop the following aims and arguments:
- We aim to develop an understanding of different mapping contexts embedded into the concept of planetary mapping by developing higher-level definitions;
- This is accomplished in order to provide a framework to abstract and understand the flow and transformation of data between each mapping domain and across these domains which are interdependent on each other;
- We do this in order to develop an understanding of how much abstraction and interpretation thematic data will undergo. With that in mind, we can identify the degree of simplification of data before they are abstracted and integrated into a map;
- This allows us to gain insights into the contribution of data and their transition towards information and eventual knowledge collection;
- This will help determine recommendations on how much data is ultimately needed to conduct mapping without sacrificing integrity and keeping the demand for resources within feasible limits.
Observation data accumulate over time, and each new mission adds to the already-existing database of planetary raw data. With new data, new types of information awaiting contextualization arrive. Until the early 2000s, optical image-based mapping dominated. Soon, consistent topographic data were added to the growing database in the late 1990s and have become an indispensable asset for conducting optical analyses and thematic mapping. These data, along with geodetic models, are considered foundational products [9]. Spectral information covering the electromagnetic wavelength range from the gamma and X-ray to the infrared and microwave domains were added in the early 2000s, with missions such as the Mars Global Surveyor and Mars Odyssey probably playing the most important roles during that phase. An example shall help illustrate the actual situation: the Geologic Investigation Map I-355 Kepler of the Moon, published by the USGS in 1962, spans an area of 20° in longitude and 16° in latitude. The total mapping area has a size of approximately 294,000 km2, comparable to the total land area of Italy. At the time of mapping in 1962, observatory images were used, which then allowed the production of a quadrangle map with a map scale of 1:1,000,000. The basis was provided by the United States Air Force (USAF) lunar reference mosaic (LRM) published by the Aeronautical Chart and Information Center in the same year. Image data were thus highly limited and without alternatives. Topographic information was modeled based on observations from Earth and they carried considerable uncertainties. Other complementary information was nonexistent at that time. If the same area were to be mapped again today, mappers would have the possibility to extract their data from a far larger database, incorporating approximately 46,500 datasets according to the Lunar Orbital Data Explorer (ODE) database (https://ode.rsl.wustl.edu/moon/productsearch, accessed on 1 December 2022). Over 10,000 products could be provided by the US Clementine investigation from the mid-1990s, and over 14,000 products could be added from the US Lunar Reconnaissance Orbiter mission. Such a database would be by no means complete, as it would not include any data from the Chinese Chang’e missions.
Not all mappers will deal with that volume of data, as thematic mapping is usually conducted on preprocessed image mosaics. This, however, requires further justification as to how the image data are selected and why; for example, only certain observation geometries are chosen. After all, we have to assume that all data with all their spatial, temporal, and spectral variation carry a high intrinsic value and each sub-selection of data is also an exclusion of other available data, thus leading to considerable bias. Additionally, with an increasing level of cartographic abstraction, the need grows to objectively judge the value and selection of all input data, as well as their subsequent generalization and simplification steps, as each step adds more uncertainty to the process.
In order to investigate how and to what extent available data contribute to the scientific discourse, we first need to develop a more detailed understanding of mapping concepts. This is also needed in order to not only describe their individual nature (as summarized above) but to also highlight the exchange of information between these concepts. This can only be accomplished by understanding input, i.e., raw data and context, and output, i.e., a map with a specific focus and intention. Once established, we can discuss how far a sub-selection (filtering) of data to reduce the overall complexity might constitute a practical solution in the extraction of knowledge.
1.2. Objectives
The primary objective of this investigation targets understanding the role of data in planetary cartography and mapping, and their limitations and uncertainties when it comes to extracting information and developing knowledge. This role is highlighted and discussed by investigating data and knowledge flows as well as a domain-specific knowledge model. For this contribution, we specifically aim at the following objectives:
- Definitions. We establish the context for this investigation through the development of working definitions in order to conceptualize individual mapping contexts.
- Interdependencies. We aim to elaborate on the interdependence between different mapping contexts by extracting and discussing data flow and data transformation between individual activities. This data perspective traces the path of data from raw data to a unit of mappable information.
- Knowledge. We investigate the role of interpretation and modeling along the data-flow path in order to understand the level of abstraction by highlighting transformative processes which might cause potential information loss.
- Recommendations. We discuss the need for the inclusion of richer databases in the thematic mapping process and the role each mapping context plays in order to develop recommendations. We introduce the concepts of compositionality and contextualization which will play an important role when it comes to knowledge extraction and when reinserting data into a research data cycle.
The secondary group of objectives is related to the intended impact of this investigation. With this work, we hope to be able to
- Stress the importance of thematic mapping as a vehicle for knowledge development and transfer. The reasoning for the importance and the revitalization of mapping programs have been put forward in the past but we feel the value of mapping needs to be highlighted from the data and knowledge perspectives as well. We hope to be able to contribute to a critical discussion on the fundamentally positivistic nature of mapping and knowledge extraction;
- Highlight the importance of coordinated spatial data infrastructures and research data management allowing forward and backward access to data repositories and facilitating the seamless reuse of an existing knowledge base;
- Provide a foundation for future ontological modeling driven bottom-up by the community which may help make maps computer-readable, and facilitating improved knowledge extraction.
A number of topics interweave closely with the topic of data flows, in particular, research data management (RDM) and spatial data infrastructures (SDI) in a broader sense. In this contribution, we will discuss certain aspects and provide an outlook related to these topics. However, this work will not discuss planetary data infrastructures and the need for establishing them, as they have been covered in great detail in the research literature recently [9,10,11]. While this becomes important for a more overarching view on the topic of data in the planetary sciences, this topic is not of primary relevance in this contribution, as we focus on the value of data.
Finally, this work will establish a precursory semantic model, but it will not qualify to provide an ontologic model of the domain of planetary mapping, as this can only be achieved by round-table discussions across different groups with their domain-specific understanding, vocabulary, and respective interests. We hope, however, the approach shown here might act as a precursory model for developing future ontological models.
1.3. Structure
After highlighting the motivation behind this research and its objectives in Section 1 (Introduction), we will cover the methodological background in Section 2 (Methodology). In Section 3 (Results), we present the results and attempt to establish a synthesized view combining the two components ‘data’ and ‘knowledge’ within mapping concepts by discussing implications in more detail. This is established by first presenting and discussing working definitions for mapping contexts in Section 3.1 (Concepts and Definitions). We then present the data workflow from a data-centric view and discuss transformation processes and limitations along with the transformation of knowledge in Section 3.2 (Data- and Knowledge Flow). In Section 3.3 (Semantic Model), we then discuss a precursory semantic model as derived from data and knowledge flows and highlight the interdependencies between mapping concepts, but also limitations. This model is a form of knowledge representation aiming to highlight connections between relevant entities (and activities) along with their properties and characteristics.
Finally, we summarize our findings and provide an outlook on future developments in Section 4 (Synthesis and Conclusions).
2. Methodology
Here, we present our approach to identifying data and knowledge processes in the planetary mapping domain. We first explain how we arrived at definitions for mapping contexts, and discuss data- and knowledge-flow models and their visualization in this investigation, as well as their underlying foundation and assumption. Lastly, we will outline how we arrived at a simple semantic model for different mapping contexts and discuss their interdependencies. When we refer to a concept, we refer to a conceptual idea or framework which may be abstract. When we refer to a model, we refer to an implementation as it is manifested as a logical model.
2.1. Definitions
For the definition of mapping contexts, we revisited the research and technical literature covering planetary mapping aspects in general, and topics of planetary cartography specifically. The foundation is laid by early contributions to the topic as presented by, e.g., [1,12,13], which then is expanded on or discussed in later volumes and contributions by, e.g., [6,7,14]. This is complemented by mapping reports and technical papers related to national and international mapping programs, e.g., [4,15,16,17], or debates on planetary data infrastructure and research data management [11,18,19,20,21,22,23,24] (and references cited therein).
When making use of published resources, it became evident that formal definitions were lacking or did not refer to established terrestrial definitions. Consequently, most informal definitions are kept vague to fit a certain purpose. Due to the lack of discussions on this specific topic in the literature, the definitions are based on the aforementioned resources, on practical experience in projects and discussions with peers, and on general approaches in the field of cartography [25,26]. Therefore, definitions provided here are as valid or as incomplete as any other definition, particularly as our focus is on data and knowledge gain, which is reflected in such a working definition. However, we feel that a common understanding is needed to further develop this presentation and find a basis for building a semantic model, even at a higher level.
2.2. Data Flow Model
The first element in this investigation was to identify the path and transformation of data in planetary mapping across its different contexts. This is needed as a foundation for modeling a knowledge path, and to help identify where data transformations cause a reduction in data integrity or data certainty (simplification), and where transformations cause an increase in complexity and information density by adding new information (expansion). If we assume that knowledge can only be as reliable and valid as its contributing components that are gathered to become knowledge, it is vital to gain an understanding of transformation processes and underlying assumptions.
Data transformation processes can be simple and can be represented by a single action, e.g., the binning of data in order to store data more efficiently. However, they can also be complex when it comes to integrating models which again rely on simplifications and expansions, e.g., atmospheric models. Transformative processes are discussed in Section 3, when it comes to the presentation of results.
A typical transformation process is classification which, e.g., transforms a higher-level ratio or interval-scale data into nominal or ordinal-scale data which are usually easier to comprehend and also to digitally process in situations where it may be needed. Along with classification, however, comes a loss of precision, and thus data are altered and simplified. Classification may occur with respect to data contents, i.e., the stored signal and spatial data geometry, as well as semantic content. Closely related to classification is generalization, which may be described as simplification on the one hand, but which also introduces another level of abstraction when it comes to semantics on the other. This ultimately means that generalization represents not only a data loss but also knowledge gain through abstraction.
The process of selection does not constitute a transformation in the same sense that it modifies data. The transformation selects a representative sample based on certain selection criteria. While generalization is usually a more complex transformation between many entities represented as one object, selection is a simplified process of picking one entity assuming its representative character. This far simpler process again introduces inaccuracies.
Another process related to expansion is extrapolation. It comprises data transformation beyond their original semantic contents and/or geometric extents. It may be introduced during upscaling when performing map projections or co-registrations between datasets with different geometries. Extrapolation might also occur when introducing physical models to embed a local observation into a larger model extent. Along with extrapolation comes an introduction of uncertainties and potential artifacts. Data and their transformation are represented in a slightly modified data-flow diagram (DFD) which is motivated by structured system analyses developed in the earlier years of process modeling [27,28,29], before object-oriented views gained traction. Conventional activity diagrams, as realized in the Unified Modeling Language (UML) [30], focus on processes with activities and data on the same level. We felt that a data-centric and information-transformative view is needed to highlight the process of data transformation between mapping contexts. Data transformation is then visualized by data storage with attached input and output activities as a required model component. Control flows with decision rules and loops are not implemented and are substituted by data flows. The ruleset for DFDs is more constrained than that for activity diagrams. Building blocks for DFDs are external entities as actors interacting with the system providing (source) and receiving (sink) information, which then enters a transformative activity (process). Here, processes are represented by transformation processes that simplify or expand the original input data through various data-manipulation and information-management techniques. Data storage and archival (data stores) are connected through entities or activities and cannot be linked directly. This way, we gain a better understanding of where and how the transformation of information takes place, and where data are deposited. The final components are data flows to indicate the direction and type of transformations between model entities. Further information on the model syntax, visualization, and constraints can be obtained from the original published sources [27,28].
2.3. Knowledge-Flow Model
The second element of this investigation deals with knowledge, and how knowledge is extracted from data and information. In order to highlight this process and to build a foundation for semantic modeling, we look at knowledge gains in relation to data processes as outlined in the previous section. Here, we introduce a knowledge-flow model which focuses on higher-level information and knowledge developed from data as represented earlier in the data-flow model. The knowledge-flow model thus represents an additional hierarchic level depicted as a superimposed layer on the data-flow model. As a higher level of development, it attempts to depict the result of the transformation of data, as well as their contributing processes, and tries to stay in the conceptual framework established within the knowledge-hierarchy concept [8,31]. It thus establishes a connection between data, information, and knowledge on the second-highest level. In addition to processes, as already introduced in the data-flow diagram, the knowledge-flow diagram introduces interfaces, where knowledge is gained from simplification or expansion, or by the recombination of data. When referring to discussions on knowledge hierarchies and their criticisms [8,31,32], it seems commonly agreed upon that information represents organized and structured data in general [8]. Knowledge, then, constitutes information that has been contextualized but also contains experience, values, and insights [33,34], and thus it contains a subjective component. Subjectivity makes the concept difficult to define. For the purpose of our investigation, we look at knowledge from a more objective point of view and assume that whenever data or information is complemented by other pieces of data or information, a necessary basis for knowledge extraction is laid out. This basis is necessary, as knowledge cannot be extracted without that basis, but it is also not sufficient, as other elements, such as the aforementioned subjective components, are required. We further define that contextualized spatial information can be vertically or laterally arranged. Vertical contextualization refers to a stack of data covering a single point in space or time by multiple sources of information, e.g., layers of data of a distinct location covered by optical, hyperspectral, and topographic information. Lateral contextualization then refers to the contextualization in extent, where, e.g., a single-image scene becomes contextualized through a mosaicking process. Both forms of contextualization provide a higher potential for knowledge extraction, while the value and variety of extractable knowledge are different.
Here, contextualization, either arranged in a vertical or horizontal direction, leads intuitively to the principle of compositionality and the gain of value through individual contributing sources of data and information. In this investigation, we will highlight and discuss the characteristics of knowledge potential in the knowledge-flow diagram and refer to contextualization, complementation (supplementation), and abstraction.
2.4. Semantic Model
There are various types of use cases for semantic modeling, and they are all distinct from classical data modeling for database designs [35]. Our semantic model comprises data and knowledge transformations as outlined above, and focuses on the compositional character of different mapping processes as well as the final data and map products and their constituents. This semantic model, thus, logically builds on top of data and knowledge flows and provides an additional layer of abstraction. With knowledge about transformations introduced during mapping, we gain a better understanding of the composition of transformative processes. Thus, we also gain a better understanding of data as well as data integrity and accuracy that lead to a certain piece of knowledge. The semantic composition represents the sum of these processes (cf. compositionality) and allows us to generate logical relationships using loose semantic triples. They are considered loose as they could be machine-readable, and they do not follow the convention to be addressable using Uniform Resource Identifier (URI). The connection between a semantic model and a cartographic map is established through the map being represented and implemented as a knowledge base (KB) itself [36]. With a semantic model about map development and compositional constituents in place, the next step allows us to represent each map entity, i.e., mappable feature, through formal semantics, which then allows us to access a larger pool of information and relationships, either by humans or machines [36].
3. Results and Discussion
3.1. Concepts and Definitions
In order to establish the foundation for our dataflow and knowledge model and to arrive at a consistent view in the second half of this contribution, here we define and discuss individual mapping contexts. We are aware that a number of different definitions exist or are commonly used across different disciplines. Even within the confined context of cartography, definitions undergo historic changes or are even different across national boundaries. These definitions are working definitions in order to establish the line of arguments for this contribution. We later emphasize that community work will be needed to establish definitions across boundaries.
3.1.1. Systematic Mapping
Here, systematic mapping is understood as a continuous and planned (systematic) collection of physical data, i.e., electromagnetic radiation, potentials, samples, or any other form of signal from either Earth-based locations, orbiting platforms, or local in situ platforms. The mapping concept for systematic mapping lies in reconnaissance rather than in the creation of cartographic maps and would qualify as a predecessor to potential cartographic mapping. Systematic mapping, thus, collects raw physical and compositional data that undergo further processing and filtering and which are motivated by scientific and technical reasoning. While systematic mapping may aim at large-area coverage over the duration of a mission, for example, the scientific context and technical requirements define primary targets either due to their scientific relevance or due to the lack of good-quality information about a given location. While commonly simplified due to its given storage data model, and through signal processing and binning, these raw data form the lowest level of abstraction. Instances of systematic mapping are essentially exploration missions with the aim of mapping an object’s surface either partially or globally, leading to raw data within its spatial context with various characteristics such as imaging and illumination properties, or spectral and temporal resolution.
3.1.2. Reference Mapping
Here, reference mapping refers to the cartographic process of turning image data and complementary products, such as topographic information, into cartographic products, i.e., digital or analog maps, which again serve as a reference or basis for further mapping. In this process, thematic abstraction plays a minor role as it focuses on the selection and filtering of data, as well as its geometric correction, radiometric calibration, and assembly into coherent map products. The main cartographic process might deal with the generalization of topographic information and the placement of labels and annotations according to standard procedures and best practices. With reference mapping comes the systematic production of maps to depict parts or the entirety of a planetary body. Examples of such reference maps are the photographic image series [37,38], the topographic map (series) of planetary bodies [39,40,41,42,43,44,45], or the map series for the outer satellites published over the last decade [46,47,48,49,50,51,52,53]. Additionally, atlases [54] and other individual reference mapping are part of this context [55,56].
3.1.3. Thematic Mapping
Thematic mapping may generally be understood as the transformation of raw data into a map context after the reduction in complexity through generalization and processes such as aggregation and simplification. The level of interpretation, and thus abstraction, is high in comparison to reference mapping due to its thematic content. Thematic mapping might refer to cartographically complex analytic products such as geologic maps, while other maps, such as landings-site maps or traverse maps, might not qualify as thematic maps in a broader sense due to their different purpose. The boundaries of different map types are diffuse, and various classifications based on purpose or product layout exist due to the possibility to overlay different types of statistical information. Classical examples of planetary thematic maps comprise the geologic mapping series published by the United States Geological Survey (USGS) at various scales [57,58,59,60,61], the modern mapping series [62,63,64,65,66], or individual thematic maps spread over the research literature [67,68,69], or in historic archives across the globe [70]. The reader may want to refer to [6,71,72,73] and references cited therein, as well as [74,75], for a more detailed treatment of planetary map types which reaches beyond the scope of this work. For thematic maps, image data are without a doubt the most important resource, with other data providing (1) complementary information, such as in situ sampling, terrain-model data, or even spectral data, or (2) supplementary data, such as any other type of information beyond these two domains.
To facilitate the development of a focused discussion, here we will remain in the domain of optical and spectral imaging data as well as terrain data. The concept can be extended at a later stage. We do this as the majority of mapping data are obtained by imaging instruments and spectrometers.
Despite its complementary relevance, spectral information only plays a minor role for cartographic mapping, at least when it comes to the integration of such data during the mapping process or as a piece of information on a cartographic map. Reasons might be related to the higher complexity of that data which does not allow to derive meaningful information without insights into the initial modeling and data reduction aspects. Topographic data, while being unarguably highly complementary, are integrated into the mapping process, but are under-represented on modern thematic maps.
When we refer to thematic mapping, we specifically focus on geologic (thematic) mapping, for the following reasons:
- First, the overwhelming majority of published planetary thematic maps are geologic maps with limited added information about other features to highlight certain aspects. These geologic maps describe geologic processes and ages, and relative and potentially absolute time. Based on these components, and based on a number of simplifying assumptions, the map reader can extract information about geologic characteristics and position in space [2,76,77].
- Secondly, planetary geologic maps represent the most complex type of thematic maps due to their purpose to highlight processes, ages, and sequences, thus examining three dimensions plus time. Geologic maps at small map scales are usually highly interpreted and not usable as working tools in the field, despite their high information density. The basic idea and motivation can be transferred to any sort of thematic mapping at a future point in time.
With this context in mind, we can summarize that systematic mapping aims to return raw experiment data that require processing and filtering before they can be utilized for reference mapping or thematic mapping. This also means that systematic mapping is a driver for thematic mapping, which again provides the reasoning for systematic mapping. Reference mapping, as discussed later, constitutes a link between both mapping concepts.
3.2. Data and Knowledge Flow
After having established foundational definitions, here we take a closer look at the role of data as they are transformed and passed through different stages and mapping contexts to generate new information through structure, and new knowledge through contextualization and composition. As depicted in Figure 1 and Figure 2, data– and knowledge-flow paths start from the point of data acquisition, i.e., the entry point where an external provider of data establishes an interface with the data flow. That provider is characterized by the acquisition of physical signals from an external source, i.e., the observation object. The receiving entity is labeled a Collection System (cf. Figure 1 (1.1)) and represents an in situ or remote-sensing platform.
3.2.1. Systematic Mapping
The systematic collection of signals and their onboard storage initiate the systematic mapping cycle (Figure 1 (1.1)). Physical signals are converted to data that are stored as digitally or charge patterns after simplification through binning and conversion based on specific data storage policies to balance space requirements and measured accuracy. From onboard storage, raw data along with implicitly generated metainformation are transmitted to the ground segment, where the reconstruction of data along their expansion with metadata is carried out (Figure 1 (1.2)). At this stage, original data have been expanded and thus represent a higher level of information through composition and context as well as new structure, as defined through, e.g., the raster data model. Depending on sensor specifics, reduced data enter a systematic processing pipeline for higher-level processing and derivation of additional products (Figure 1 (1.3)). With the storage of data in accessible archives (D1.3), systematic mapping is terminated, and data are made available publicly after review, thus entering the research data cycle. This systematically produced data can and will be updated depending on processing models and model improvements involving calibration or corrections. Systematically processed data have been altered and simplified through processes such as binning or aggregation and might have undergone various levels of modeling, i.e., correction and/or calibration. More advanced modeling needed for correction furthermore require assumptions of conditions extrapolated for a given location and time. The data have also been expanded by well-structured metadata, which allow at least horizontal contextualization (Figure 1 (1.2)).
When it comes to data lineage, entities and processes that modify data are known and are—at least partially—documented. What might be unknown, however, is why and how a specific parameterization has been chosen. This affects the reduction in spectral data and advanced atmospheric corrections, but also simplifications of geodetic definitions. The decisions behind these processes are made by operations and individual users. To a lower degree, they are based on explicit knowledge, and to a much higher degree, on experience and, thus, tacit knowledge. None of this information, however, is communicated in the final data product. Some information may be communicated in accompanying research papers, but it seems safe to say that this communication would not allow reconstructing the decision process and reasoning behind it. The “rigorous error assessment” of data needed to define foundational data [9,23] is, thus, likely merely a theoretical construct and would apply to systematic processing errors. However, the inherent uncertainty is neither quantified nor communicated in higher-level modeling during processing stages. It also becomes clear that abstraction is not only part of the actual cartographic mapping process much later in this process, but it already applies to basic tasks in the initial processing pipeline, and it is represented through data simplification or generalization. For both thematic and reference mapping, these primary data products become input data for a filtering process in which they are selected based on various user criteria (see filtering system in Figure 2 (3.1) and (2.1)).
3.2.2. Reference Mapping
Reference mapping refers to creating (cartographic) reference maps which might be analog and equipped with legends and keys on a map sheet, or which might come as a digital projected image or as terrain-model mosaics. These reference maps are commonly based on data that have been collected during different time periods over the course of a mission lifetime and, thus, might include data obtained from different seasons, under different illumination conditions, under different viewing geometries, or under different atmospheric conditions. While this is relevant for some planetary solid-surface objects, namely those with significant seasonal atmospheric or surface changes (e.g., the Earth, Mars, Venus, Io), this is of lesser relevance for bodies lacking an atmosphere, which, however, might still be affected by varying observation and illumination geometries. Except for very few products, such as the Mars Global Surveyor (MGS) Mars Orbiter Camera Wide-Angle (MOC-WA) data which were acquired during a short observation period, these products are an amalgamation of multitemporal and multispatial data products and individual event snapshots for which the mapper attempts to reduce heterogeneity by selecting data products showing similar illuminating conditions, map scales, and signal qualities. The selection of suitable image data is an abstraction that aims at simplification given a number of boundary conditions (see filtering system in Figure 2 (3.1) and (2.1)), and thus it has never represented an actual state of the planetary object. This simplification is valid, as surface processes are usually not significant over the lifetime of a mission. On top of filtering comes higher-level processing that involves adjustments of geometries and radiometric differences (Figure 2 (2.2) and (3.2)) until those products enter another data storage enriched with additional metadata information.
This overall process of developing higher-level products requires tacit knowledge, at least at an initial stage, before any automation can take over processing. Image filtering and selection thus require manual interaction, and so does further generalization when it comes to the cartographic representation of topographic information. The major challenge for subsequent mapping in this process is that the filtering, selection, and processing of higher-level data has been conducted from a point of view that is likely not congruent with the viewpoint of a thematic mapper. That means that the representation chosen by the reference mapper (see reasoning in Figure 2) incorporates knowledge and assumptions based on different objectives. Thus, the decision process based on that knowledge involves incompatible criteria when looking at the same database from a thematic mapper’s point of view. While feasible in terms of the investment of resources, any thematic mapping result is likely to become a far more limited representation of reality due to an additional level of abstraction superimposed through processing and decisions based on different objectives. Once completed, reference maps are provided to the public through institutional archives, or they might be uploaded to data archives such as the Planetary Data System (PDS) or Planetary Science Archives (PSA), e.g., [50,52,53] (see Figure 2).
3.2.3. Thematic Mapping
Thematic mapping, as defined in the previous section, is characterized by the highest degree of abstraction due to a considerable, yet likely unquantifiable, contribution of implicit and tacit knowledge needed to compile these maps. The basis for mapping, i.e., the primary data, is derived from the processing pipeline associated with systematic mapping. In order to arrive at thematic map compilation, lateral as well as vertical contextualization are needed, without which thematic mapping would occur in isolation. Both types of contextualization require data to be processed and aligned with each other. This can be accomplished in a static way by conventional mosaicking, or through a more dynamic method of displaying single frames or image strips. In both cases, the preselection of suitable frames is one of the crucial aspects, as this selection is commonly based on the convenience of access (Figure 2 (2.1) and (3.1)). Static image mosaics from reference mapping might be balanced in terms of observation and illumination geometries, but they also show just a single snapshot of single points in time. While this is aesthetically pleasing, and it might fulfill the requirement of a map reader or a mapper [16], it also only shows one vantage point at an instance in time and space, and it leaves other vantage points to the imagination, although actual data might be available. When the mapping process has been completed, data and map products are provided to either institutional or public archives (D3.2 in Figure 2), such as the USGS Warehouse, or they might be provided as products in the large data archives (PDS or PSA). Due to the lack of coordinated thematic mapping programs outside the USGS, thematic maps are, up to now, not found in these archives and are dispersed over local institutional archives and research supplements of publishing houses. They do not effectively take part in a research cycle.
Thematic mapping as the highest level of data interpretation and abstraction requires reasoning based on the reference-mapping process for filtering and for making decisions during the mapping process. In the same way, it is thematic mapping that provides reasoning and scientific context for decision making when it comes to reasoning, mission planning, and mission operation, i.e., systematic mapping (Figure 1 (1.1)).
3.3. Semantic Model
The final step in the modeling process is the introduction of a semantic model (see Figure 3). In this view, the focus is put on the contextualization and composition of individual data products, as they form the basis for knowledge. In contrast to data and knowledge flow, the semantic view highlights how individual products along with their creation process are composed of other products, which, again, are follow-up products from previous processing steps. Along with each step in the derivation of data products, not only is information about expected systematic errors and inaccuracies introduced, but so are uncertainties regarding previous choices and decisions that have been made. Following the principle of compositionality, it can be said that each product is a function of its contributing components, including its inherent information but also its uncertainties. In one example (see Figure 3), it can be seen that within the thematic mapping domain (the knowledge domain), the final geologic map is compositionally constructed from information about geologic units, their contacts, and their age relationships on relative (lithostratigraphic units) as well as absolute scales (chronostratigraphies). Both scales theoretically require input from chemical analyses and reference material or age modeling and impact crater studies, respectively. Both sources of information are again described by their individual model uncertainties. Additionally, both the unit definition and topographic information rely on previous processing with its inherent uncertainty. One could write that the information (I) of a thematic geologic map is a function (f):
I(geologicMap) → f(geologicUnit, geologicContact, process, absoluteAge, ...
Each independent variable represents a function depending on input variables:
I(geologicUnit) → f(geologicUnit, geologicContact, absoluteAge, ...)
A knowledge graph may be created with nodes representing entities of information and edges representing either compositional characteristics or dependencies, depending on the required context (see Figure 3).
While mapping itself might escape an easily accessible ontological view due to its abstract nature, mapping products and the mutual dependence can be defined. Despite the fact that these mapping approaches are different, they complement and build on top of each other. The connecting links (edges) between these concepts represent the data product, which is altered along its way through mapping stages. The interdependence of the aforementioned mapping concepts determine that the output is a high-quality product if all input data and qualities are equally outstanding. The different concepts of planetary mapping are reflected in the idea of the visualization pipeline, in which increasingly higher derivation levels of data visualizations are depicted [78]. While different types of applications exist, the basic concept remains identical and covers data acquisition during systematic mapping, data reduction and rendering towards reference mapping, and visibility transformation accompanied by rendering during thematic mapping. The process to accomplish this can generally be divided into four parts: (1) data preprocessing and transformation, (2) visual mapping, (3) generation of views, and (4) perception/cognition by the user [78,79] (cf. Figure 4).
4. Synthesis and Conclusions
4.1. Synthesis
Our investigation takes a closer look at the foundations of planetary mapping, in particular with respect to data transformation as well as information and knowledge. That information and knowledge are derived from data and from contextualizing data along their development flow. Planetary mapping refers to data that are either output products from systematic mapping or input products for reference and thematic mapping. Ultimately, data become inputs for reasoning for systematic mapping. This process is circular and self-referential, leading from raw signals to data and information and finally to the knowledge level. With higher levels of abstractions, data gain more value, which allows going back and deriving reasoning for the initial data-collection process (see Figure 4).
The two aforementioned mapping approaches, i.e., systematic and thematic mapping, center on the cartographic process, and with that comes filtering and abstraction in order to communicate knowledge efficiently. In this paper, we focused on the aspect of filtering, i.e., the selection of input data, as the scientific quality, and derived research values rely on this preselection of data, and we expanded that view by discussing abstraction as a fundamental element for mapping. We then integrated findings of data and knowledge transformations into a more synoptic workflow as described through semantic relationships. In this process, we tried to establish an initial semantic model focused on individual mapping components.
This process does, however, not lead to a single correct solution, neither subjectively nor objectively. Based on our investigation, we can summarize the following findings and conclusions.
4.1.1. Role of Mapping
The inherent relevance of systematic mapping for higher-abstracted thematic mapping and knowledge gain is evident, as without systematic mapping, i.e., the provision of data and structured information, there reference and thematic mapping are not possible. The relevance of pointing backward seems less obvious, but in order to plan and conduct meaningful systematic mapping, thematic, i.e., scientifically compiled and contextualized mapping, is required. It is necessary because it allows producing knowledge and scientific findings which then allow the identification of mission targets, and the conduction of meaningful experiments. This underlines the scientific need for mapping, as discussed in the research literature [4,15,18,19,80]. The value of thematic mapping appears to be still underrated, as financial support for operational thematic planetary mapping programs is, de facto, not available in wide parts of the world. This seems surprising, as these activities find significant resonance in the community over the last decades with the advent of European planetary missions and mapping initiatives, as well as advances in the field of conceptualizing planetary infrastructures. The roots of planetary mapping initiatives in Europe date back to the beginning of the 2000s, when infrastructures, processing pipelines, and the viability of planetary geologic mapping programs were discussed. These activities were frozen due to a lack of funding and due to a lack of converging perceptions regarding organizational responsibilities and commitment. This development also means that much of the research outcome is centered on limited snapshots in time and spatial dimension, while more synoptic views and in-depth contextualization are impossible to create by individual mappers due to the resources needed to generate meaningful research.
4.1.2. Research Data Management and Data Lineage
Our findings emphasize that research data need to be organized, structured, and better contextualized to be ready for integration into targeted thematic mapping. This organization is conceptualized in the field of research-data management (RDM), which has received significant attention over the last decades. RDM does not only provide a framework or container for how to collect data in an archive, but it also allows data to be reintegrated into a research-data cycle. Along with that comes the maintenance of rich and useful metadata for data products, their development, and their transformation [81,82,83,84,85]. In that connection, frameworks related to data lineage became of major importance to trace the source (provenance) and transformation, including validity, of data within research domains [86,87,88,89].
4.1.3. Infrastructures
Research data management requires management concepts and distributed systems that are accessible for in- and output. Spatial data infrastructures (SDI) provide the foundation for managing and accessing synchronized data along with their metadata. A number of initiatives have emphasized these needs and are currently working on conceptualizations and the physical implementation of prototypes [10,23,90,91]. Planetary cartographic mapping still plays a subordinate role in these developments, as the focus is on data. Given the role of data in mapping and the role of mapping during the acquisition of meaningful research data, it might be worthwhile to integrate maps as higher-level data products and consider these products when assessing infrastructure needs. For terrestrial infrastructures such as the Infrastructure for Spatial Information in Europe (INSPIRE), or the European Marine Observation and Data Network (EMODnet) of the European Commission, maps have always played an integral part [11,23,24] (and references cited therein).
4.1.4. The Role of Reference Mapping
Reference mapping as a purpose in itself has limited use and applications nowadays. Reference mapping, including image and topographic mapping, becomes valuable when the presentation form is adjusted to the needs of mappers and data analysts these days. Otherwise, they can be considered merely a cartographic exercise that might produce beautiful results but offer limited use. In particular, when the motivation behind the creation of such maps lies in the data product itself but not its application for further thematic mapping and extraction of knowledge, a reference map might involuntarily limit further knowledge development due to its limited view of a more complex database. Such products are in use for mapping due to their convenience, and we imagine that a thorough review of the database and the creation of additional products might elevate the value of subsequent analyses. The JAXA/Kaguya mission team, for example, has produced maps under different illumination conditions which then provide a much richer basis for mapping (KAGUYA (SELENE) TC Derived Data).
4.1.5. Data Integration
Meaningful mapping and exploitation of data would strongly benefit from the complete integration of available data into the abstraction process, in particular, if image data were processed and selected at a time when not all data were available. This also applies if data are selected based on criteria that are not congruent with needs from a thematic mapper’s point of view. In order to accomplish this efficiently and within feasible boundaries, data selection would benefit from improved metadata complementation, which would allow to more efficiently search for and select candidate data. While technical data-catalog metadata are useful, the lack of qualitative descriptions or statistics and review notes force the mapper to still reprocess data to make a better judgment about data value.
4.1.6. Requirement Analyses
Targeted requirement analyses specifically focusing on data needs of the mappers’ community, i.e., specific expectations about data characteristics and coverage, are likely to become more important with an increasing volume and variety of data. While reports have been published recently which collect mapper requirements [4,5,16], there is little focus on data expectations. Such a data-centric requirement analysis would translate to an identification of stakeholder/end-user requirements and evolve around (a) data filtering and processing, (b) data-integration aspects, and (c) data review.
4.1.7. Machine Learning and the Semantic Web
Today, attempts are being made to automatize mapping, which mostly leads to the delineation of features but fails in providing semantic depth. This is mostly due to a lack of context information which, again, is needed for attaching a semantic value to a purely geometric feature. This context, however, is required not only to map but also to facilitate understanding and knowledge gain through contextual mapping. The advent of the semantic web along with its associated algorithms and in combination with sophisticated methods for feature extraction and object classification through machine- and deep learning will change that view in the future. While automatic mapping might not be around the corner due to the lack of context, automatic map interpretation through the provision of map semantics is. This, again, will become relevant for autonomous navigation and hazard mapping.
4.2. Conclusions and Recommendation
The challenge of managing and evaluating data becomes increasingly complex as the database grows in volume and variety. As long as planetary data is of research interest rather than economic or even strategic interest, this challenge seems to be of minor relevance. As economic developments and interests change, so does the relevance associated with every single bit of data. Establishing a framework to not only store, manage, and eventually reinsert data into a research cycle, but also to trace its lineage and its transformation will become crucial in a data lifecycle. A final data product can only be as good as its contributing components (principles of compositionality and contextuality). In the planetary (surface) sciences, there are cases where the derivation path of products remains diffuse, in particular when institutionally maintained, and if modeling plays a role that remains inaccessible to the outside world. This problem is not only related to data accuracy but it is an uncertainty that influences the quality of any follow-up product. Thus, the abstraction in mapping as we observe it in cartographic mapping occurs much earlier in the data pipeline.
- Traceability of Knowledge Extraction. We believe there will be a strong need to develop strategies to not only maintain and contextualize data but also to allow the traceability of data transformations and abstractions. This will provide transparency and a better understanding of knowledge extraction. Contextualization and knowledge extraction might hopefully become focus topics for data groups and infrastructure debates in the planetary community.
- Funding Support. With further capitalization of data due to its research value and institutional heritage, researchers’ incentives to return and reinsert data, models, and methods into a research-data cycle might remain at a low level. This, again, results in a lack of transparency and completeness as defined through complementary metadata information. Along with this, the uncertainty grows and foundational data will likely not become completely traceable anymore. Without either external control or targeted provision of stable funding, this situation is not likely to improve.
- Complete Mapping using Artificial Intelligence. It could be shown that thematic (geologic) mapping requires a broader data inclusion by balancing feasibility and expected outcome. The current snapshot-based thematic mapping limits our perspective significantly, as we create views from only a single perspective. Automatized mapping in the future based on machine or deep learning should target what we cannot do as humans, which is to put as many data sources into a single mapping view as available to form a more complete thematic picture. This, however, also requires the development of efficient methods to co-register large volumes of data across different sensor and scale domains [92,93,94,95].
- Vertical Contextualization. Thematic (geologic) maps develop their extraordinary value through horizontal and vertical contextualization, which allows the map reader to derive target properties and temporal and three-dimensional information. Despite having a large volume of high-resolution topographic data available, absolute topographic information is not included on most published planetary geologic maps anymore. Those data, however, have been commonly included in historic maps despite the systematic lack of accurate information. We consider this vertical contextualization through topographic information as an example where significant knowledge gain could be achieved if these data were included again in geologic maps.
- Domain-Specific Ontologies. We furthermore encourage the development of community-driven and domain-specific ontological models for different mapping contexts as semantic web technologies grow in relevance. The automatized and contextualized extraction of knowledge will become relevant not only for machine reading but also for real-time navigation at one point in time.
Author Contributions
Conceptualization, S.v.G. and A.N.; methodology, S.v.G. and A.N.; writing—original draft preparation, S.v.G.; writing—review and editing, S.v.G. and A.N.; visualization, S.v.G. and A.N. All authors have read and agreed to the published version of the manuscript.
Funding
This research received no external funding.
Data Availability Statement
No new data were created or analyzed in this study. Data sharing is not applicable to this article.
Acknowledgments
The authors greatly acknowledge comments and suggestions from two anonymous reviewers who helped improve the clarity and presentation of this manuscript.
Conflicts of Interest
The authors declare no conflict of interest.
References
- Greeley, R.; Batson, R.M. (Eds.) Planetary Mapping; Cambridge University Press: Cambridge, UK, 1990; p. 297. [Google Scholar]
- Greeley, R.; Batson, R.M. (Eds.) Introduction. In Planetary Mapping; Cambridge University Press: Cambridge, UK, 1990; pp. 1–11. [Google Scholar]
- Kirk, R.L. Planetary Cartography: What, How, and Why Begin with Where. In Proceedings of the 47th Annual Lunar and Planetary Science Conference, The Woodlands, TX, USA, 21–25 March 2016; p. 2151. [Google Scholar]
- Skinner, J.A.; Fortezzo, C.M.; Gaither, T.A.; Hare, T.M.; Huff, A.E.; Hunter, M.A. The USGS-NASA Planetary Geologic Mapping Program: Status, Process, and Future Plans. In Proceedings of the 49th Annual Lunar and Planetary Science Conference, The Woodlands, TX, USA, 19–23 March 2018; p. 2906. [Google Scholar]
- Nass, A.; Di, K.; Elgner, S.; van Gasselt, S.; Hare, T.; Hargitai, H.; Karachevtseva, I.; Kereszturi, A.; Kersten, E.; Kokhanov, A.; et al. Planetary Cartography—Activities and Current Challenges. Proc. ICA 2018, 1, 81. [Google Scholar] [CrossRef] [Green Version]
- Nass, A.; Hargitai, H.; Buchroithner, M. Cartography: Its Role and Interdisciplinary Character in Planetary Science. In Planetary Cartography in GIS; Springer: Berlin/Heidelberg, Germany, 2019; pp. 3–26. [Google Scholar]
- Hargitai, H. (Ed.) Planetary Cartography and GIS; Springer: Berlin/Heidelberg, Germany, 2019; p. 374. [Google Scholar]
- Rowley, J. The wisdom hierarchy: Representations of the DIKW hierarchy. J. Inf. Sci. 2007, 33, 163–180. [Google Scholar] [CrossRef] [Green Version]
- Laura, J.; Beyer, R. Knowledge Inventory of Foundational Data Products in Planetary Science. Planet. Sci. J. 2021, 2, 18. [Google Scholar] [CrossRef]
- Lawrence, S.J.; Hagerty, J.; Gaddis, L.R.; Archinal, B.A.; Radebaugh, J.; Byrne, S.; Sutton, S.; DellaGiustina, D.; Thomson, B.; Mazarico, E.; et al. The Mapping and Planetary Spatial Infrastructure Team (MAPSIT): Addressing Strategic Planning Needs for Planetary Cartography. In Proceedings of the 47th Annual Lunar and Planetary Science Conference, The Woodlands, TX, USA, 21–25 March 2016; p. 1710. [Google Scholar]
- Laura, J.R.; Bland, M.T.; Fergason, R.L.; Hare, T.M.; Archinal, B.A. Framework for the Development of Planetary Spatial Data Infrastructures: A Europa Case Study. Earth Space Sci. 2018, 5, 486–502. [Google Scholar] [CrossRef]
- Batson, R.M.; Whitaker, E.A.; Wilhelms, D.E. History of Planetary Cartography. In Planetary Mapping; Greeley, R., Batson, R.M., Eds.; Cambridge University Press: Cambridge, UK, 1990; pp. 12–59. [Google Scholar]
- Greeley, R.; Batson, R.M. (Eds.) Cartography. In Planetary Mapping; Cambridge University Press: Cambridge, UK, 1990; pp. 60–95. [Google Scholar]
- Pondrelli, M.; Baker, V.R.; Hauber, E. Geologic Tools. In Planetary Geology; Springer: Cham, Germany, 2018; Chapter 2; pp. 15–31. [Google Scholar] [CrossRef]
- Skinner, J.A. The Challenges of Standardized Planetary Geologic Mapping. In Second Planetary Data Workshop; LPI Editorial Board, Ed.; LPI Contributions: Houston, TX, USA, 2015; Volume 1846, p. 7071. [Google Scholar]
- Skinner, J.J.; Huff, A.; Fortezzo, C.; Gaither, T.; Hare, T.; Hunter, M.; Buban, H. Planetary Geologic Mapping—Program Status and Future Needs: Open-File Report 2019–1012; U.S. Geological Survey: Reston, VA, USA, 2019; p. 40. [CrossRef] [Green Version]
- Skinner, J.A.; Huff, A.E.; Black, S.R.; Buban, H.C.; Fortezzo, C.M.; Gaither, T.A.; Hare, T.M.; Hunter, M.A. Planetary Geologic Mapping Protocol—2022; USGS Numbered Series: Techniques and Methods, 11-B13; USGS Astrogeology Science Center: Flagstaff, AZ, USA, 2022. [CrossRef]
- Williams, D.A. Cartographic Needs for Geologic Mapping During Active Orbital Planetary Mission. In Proceedings of the 47th Annual Lunar and Planetary Science Conference, The Woodlands, TX, USA, 21–25 March 2016; p. 1588. [Google Scholar]
- Williams, D.A. NASA’s Planetary Geologic Mapping Program: Overview. ISPRS Int. Arch. Photogramm. Remote Sens. Spat. Inf. Sci. 2016, 41, 519–520. [Google Scholar] [CrossRef] [Green Version]
- Stickle, A.; Stopar, J.; Archinal, B.; Banks, M.; Beyer, R.; Gaddis, L.; Hare, T.; Hurtado, J.; Lawrence, S.; Lemelin, M.; et al. Final Report of the Lunar Critical Data Products Specific Action Team; A Joint Lunar Exploration Analysis Group (LEAG)—Mapping and Planetary Spatial Infrastructure Team (MAPSIT) Specific Action Team; Cambridge University Press: Cambridge, UK, 2021; p. 36. [Google Scholar] [CrossRef]
- Zuo, W.; Li, C.; Zhang, Z. Scientific data and their release of Chang’E-1 and Chang’E-2. Chin. J. Geochem. 2014, 33, 24–44. [Google Scholar] [CrossRef]
- Hare, T.M.; Thomson, B.J.; Gaddis, L.R.; Stopar, J.; Archinal, B.A.; Laura, J.R.; The MAPSIT Steering Committee. Building a Lunar Spatial Data Infrastructure (SDI). In Proceedings of the 5th Planetary Data Workshop & Planetary Science Informatics & Analytics, Virtual, 28 June–2 July 2021; Lunar and Planetary Institute: Houston, TX, USA, 2021. [Google Scholar]
- Laura, J.R.; Hare, T.M.; Gaddis, L.R.; Fergason, R.L.; Skinner, J.A.; Hagerty, J.J.; Archinal, B.A. Towards a Planetary Spatial Data Infrastructure. ISPRS Int. J. Geo Inf. 2017, 6, 181. [Google Scholar] [CrossRef] [Green Version]
- Nass, A.; Asch, K.; van Gasselt, S.; Rossi, A.P.; Besse, S.; Cecconi, B.; Frigeri, A.; Hare, T.; Hargitai, H.; Manaud, N. Facilitating reuse of planetary spatial research data—Conceptualizing an open map repository as part of a Planetary Research Data Infrastructure. Planet. Space Sci. 2021, 204, 105269. [Google Scholar] [CrossRef]
- Hake, G.; Grünreich, D.; Meng, L. Kartographie, 8th ed.; de Gruyter: Berlin, Germany, 2001; p. 620. (In German) [Google Scholar]
- Robinson, A.H.; Morrison, J.L.; Muehrcke, P.C.; Kimerling, A.J.; Guptil, S.C. Elements of Cartography, 6th ed.; John Wiley & Sons: New York, NY, USA, 1995; p. 674. [Google Scholar]
- Yourdon, E. Structured Design: Fundamentals of a Discipline of Computer Program and Systems Design; Yourdon Press: New York, NY, USA, 1979; p. 473. [Google Scholar]
- Demarco, T. Structured Analysis and System Specification; Yourdon Press: New York, NY, USA, 1979; p. 352. [Google Scholar]
- Yourdon, E. Modern Structured Analysis; Yourdon Press: New York, NY, USA, 1988; p. 688. [Google Scholar]
- Object Management Group (OMG). Unified Modeling Language (OMG UML); Version 2.5.1, Version Formal/2017-12-05; Object Management Group (OMG): Needham, MA, USA, 2017. [Google Scholar]
- Ackoff, R. From data to wisdom. J. Appl. Syst. Anal. 1989, 16, 3–9. [Google Scholar]
- Zins, C. Conceptual approaches for defining data, information, and knowledge. J. Am. Soc. Inf. Sci. Technol. 2007, 58, 479–493. [Google Scholar] [CrossRef]
- Wallace, D. Knowledge Management: Historical and Cross-Disciplinary Themes; Libraries Unlimited: Westport, CT, USA, 2007. [Google Scholar]
- Davenport, T.; Prusak, L. Working Knowledge: How Organizations Manage What They Know; Harvard Business Review Press: Boston, MA, USA, 1998. [Google Scholar]
- Luisi, J.V. (Ed.) Information Architecture. In Pragmatic Enterprise Architecture; Morgan Kaufmann: Boston, MA, USA, 2014; pp. 189–261. [Google Scholar] [CrossRef]
- Varanka, D.E.; Usery, E.L. The map as knowledge base. Int. J. Cartogr. 2018, 4, 201–223. [Google Scholar] [CrossRef]
- Kuiper, G.P.; Whitaker, E.A.; Strom, R.G.; Fountain, J.W.; Larson, S.M. Consolidated Lunar Atlas; Lunar and Planetary Laboratory, University of Arizona: Tucson, AZ, USA, 1967; p. 26. [Google Scholar]
- Bowker, D.E.; Hughes, J.K. Lunar Orbiter Photographic Atlas of the Moon (NASA SP-206); National Aeronautics and Space Administration: Washington, DC, USA, 1971; p. 41.
- Schimerman, L.A. Lunar Cartographic Dossier; Defense Mapping Agency Aerospace Center: St. Louis, MI, USA, 1975; p. 359. [Google Scholar]
- Agency, D.M. Beer Quadrangle LTO-41A4, 1:250,000; Lunar Topographic Orthophotomap (LTO) Series; National Aeronautics and Space Administration: Washington, DC, USA, 1974.
- Shingareva, K.B.; Krasnopevtseva, B.V.; Buchroithner, M.F. Moon map. A new map out of the series of multilingual relief maps of terrestrial planets and their moons. In Proceedings InterCarto 8; Intercarto: St. Petersburg, FA, USA, 2002; pp. 392–395. [Google Scholar]
- Li, C.; Liu, K.J.; Mu, L.L.; Ren, X.; Zuo, W. The Chang’E-1 Topographich Atlas of the Moon, 2nd ed.; Springer: Berlin/Heidelberg, Germany, 2016. [Google Scholar]
- Hare, T.; Hayward, R.; Blue, J.; Archinal, B.; Robinson, M.; Speyerer, E.; Wagner, R.; Smith, D.; Zuber, M.; Neumann, G.; et al. Image Mosaic and Topographic Map of the Moon; Scientific Investigations Map Series; U.S. Geological Survey: Flagstaff, AZ, USA, 2015. [CrossRef] [Green Version]
- Lehmann, H.; Scholten, F.; Albertz, J.; Wählisch, M.; Neukum, G. Mapping a whole planet—The new topographic image map series 1:200,000 for Planet Mars. In Proceedings of the 18th International Cartographic Conference (ICC), Stockholm, Sweden, 23–27 June 1997; International Cartographic Association (ICA): Stockholm, Sweden, 1997. [Google Scholar]
- Shingareva, K.B.; Krasnopevtseva, B.V.; Leonenko, S.M.; Buchroithner, M.F.; Waelder, O. Mercury—A new map in the series of multilingual relief maps of terrestrial planets and their moons. In Proceedings of the 21st International Cartographic Conference (ICC), Durban, South Africa, 10–16 August 2003; International Cartographic Associations: Durban, South Africa, 2003; pp. 1551–1555. [Google Scholar]
- Roatsch, T.; Kersten, E.; Matz, K.D.; Preusker, F.; Scholten, F.; Jaumann, R.; Raymond, C.A.; Russell, C.T. High resolution Vesta High Altitude Mapping Orbit (HAMO) Atlas derived from Dawn framing camera images. Planet. Space Sci. 2012, 73, 283–286. [Google Scholar] [CrossRef]
- Roatsch, T.; Kersten, E.; Matz, K.D.; Preusker, F.; Scholten, F.; Elgner, S.; Jaumann, R.; Raymond, C.A.; Russell, C.T. High-resolution Vesta Low Altitude Mapping Orbit Atlas derived from Dawn Framing Camera images. Planet. Space Sci. 2013, 85, 293–298. [Google Scholar] [CrossRef]
- Roatsch, T.; Kersten, E.; Hoffmeister, A.; Wählisch, M.; Matz, K.D.; Porco, C.C. Recent improvements of the Saturnian satellites atlases: Mimas, Enceladus, and Dione. Planet. Space Sci. 2013, 77, 118–125. [Google Scholar] [CrossRef]
- Yingst, R.A.; Mest, S.C.; Berman, D.C.; Garry, W.B.; Williams, D.A.; Buczkowski, D.; Jaumann, R.; Pieters, C.M.; De Sanctis, M.C.; Frigeri, A.; et al. Geologic mapping of Vesta. Planet. Space Sci. 2014, 103, 2–23. [Google Scholar] [CrossRef]
- Roatsch, T.; Kersten, E.; Matz, K.D.; Preusker, F.; Scholten, F.; Jaumann, R.; Raymond, C.A.; Russell, C.T. High-resolution Ceres High Altitude Mapping Orbit atlas derived from Dawn Framing Camera images. Planet. Space Sci. 2016, 129, 103–107. [Google Scholar] [CrossRef]
- Roatsch, T.; Kersten, E.; Matz, K.D.; Preusker, F.; Scholten, F.; Jaumann, R.; Raymond, C.A.; Russell, C.T. Ceres Survey Atlas derived from Dawn Framing Camera images. Planet. Space Sci. 2016, 121, 115–120. [Google Scholar] [CrossRef]
- Roatsch, T.; Kersten, E.; Matz, K.D.; Preusker, F.; Scholten, F.; Jaumann, R.; Raymond, C.A.; Russell, C.T. High-resolution Ceres Low Altitude Mapping Orbit Atlas derived from Dawn Framing Camera images. Planet. Space Sci. 2017, 140, 74–79. [Google Scholar] [CrossRef]
- Roatsch, T.; Kersten, E.; Matz, K.D.; Bland, M.T.; Becker, T.L.; Patterson, G.W.; Porco, C.C. Final Mimas and Enceladus atlases derived from Cassini-ISS images. Planet. Space Sci. 2018, 164, 13–18. [Google Scholar] [CrossRef]
- Coles, K.S.; Tanaka, K.L.; Christensen, P.R. The Atlas of Mars—Mapping Its Geography and Geology; Cambridge University Press: Cambridge, UK, 2019; p. 290. [Google Scholar] [CrossRef] [Green Version]
- Buchroithner, M.F. Mars map: The first of the series of multilingual relief maps of terrestrial planets and their moons. In Proceedings of the 19th International Cartographic Conference (ICC), Ottawa, ON, Canada, 14–21 August 1999; International Cartographic Association (ICA): Ottawa, ON, Canada, 1999. [Google Scholar]
- Karachevtseva, I.P.; Kokhanov, A.A.; Rodionova, Z. Atlas Planetary Mapping: Phobos Case. In Planetary Cartography and GIS; Springer: Berlin/Heidelberg, Germany, 2019; pp. 235–251. [Google Scholar]
- McCauley, J.F. Geologic Map of the Alphonsus GA Region of the Moon (RLC 15), 1:50,000, I-586, Geologic Atlas of the Moon; Department of the Interior, United States Geological Survey: Flagstaff, AZ, USA, 1969.
- Pohn, H.A. Geologic Map of the Lansberg P Region of the Moon, 1:100,000 (ORB III-9 (100))—Lunar Orbiter Site III P-9, Oceanus Procellarum, including Apollo Landing Site 7 (Apollo 12), I-627; Geologic Atlas of the Moon, Department of the Interior, United States Geological Survey: Flagstaff, AZ, USA, 1971.
- Howard, K.A.; Masursky, H. Geologic Map of the Ptolomaeus Quadrangle, 1:1,000,000, I-566; Geologic Atlas of the Moon, Department of the Interior, United States Geological Survey: Flagstaff, AZ, USA, 1968.
- Howard, K.A. Geologic Map of the Crater Copernicus, 1:250,000, I-840; Geologic Atlas of the Moon, Department of the Interior, United States Geological Survey: Flagstaff, AZ, USA, 1975.
- Scott, D.H.; McCauley, J.F.; West, M.N. Geologic Map of the West Side of the Moon, 1:5,000,000, I-1034; Geologic Atlas of the Moon, Department of the Interior, United States Geological Survey: Flagstaff, AZ, USA, 1977.
- Tanaka, K.L.; Fortezzo, C.M. Geologic Map of the North Polar Region of Mars; U.S. Geological Survey: Reston, VA, USA, 2012; p. 3177. [CrossRef] [Green Version]
- Tanaka, K.L.; Skinner, J.A.; Dohm, J.M.; Irwin, R.P.; Kolb, E.J.; Fortezzo, C.M.; Platz, T.; Michael, G.G.; Hare, T.M. Geologic Map of Mars; U.S. Geological Survey: Reston, VA, USA, 2014; p. 3292. [CrossRef] [Green Version]
- Tanaka, K.L. The New Geologic Map of Mars: Guiding Research and Education. EOS Trans. 2014, 95, 341–342. [Google Scholar] [CrossRef]
- Bannister, R.A.; Hansen, V.L. Geologic Map of the Artemis Chasma Quadrangle (V-48), Venus; Scientific Investigations Maps; U.S. Geological Survey: Flagstaff, AZ, USA, 2010.
- Williams, D.; Keszthelyi, L.; Crown, D.; Yff, J.; Jaeger, W.; Schenk, P.; Geissler, P.; Becker, T. Geologic Map of Io:15,000,000, I-3168; Scientific Investigations Map Series; U.S. Geological Survey: Flagstaff, AZ, USA, 2011; p. 25.
- Pondrelli, M.; Rossi, A.P.; Marinangeli, L.; Hauber, E.; Ori, G.G.; Neukum, G. Geological map of the Holden and Eberswalde Craters area. In Proceedings of the 28th Lunar and Planetary Science Conference, Houston, TX, USA, 17–21 March 1997; Lunar and Planetary Institute: Houston, TX, USA; p. 1254. [Google Scholar]
- Bernhardt, H.; Hiesinger, H.; Ivanov, M.A.; Ruesch, O.; Erkeling, G.; Reiss, D. Photogeologic mapping and the geologic history of the Hellas basin floor, Mars. Icarus 2016, 264, 407–442. [Google Scholar] [CrossRef]
- Fortezzo, C.; Spudis, P.D.; Harrel, S.L. Release of the Digital Unified Global Geologic Map of the Moon at 1:5,000,000 Scale. In Proceedings of the 51st Lunar and Planetary Science Conference, The Woodlands, TX, USA, 16–20 March 2020; Lunar and Planetary Institute: Houston, TX, USA, 2020. [Google Scholar]
- Grishakina, E.A.; Lazarev, E.N.; Rodionova, J.F.; Shevchenko, V.V. Hypsometric Map of the Moon (Gipsometritseskaya Karta Luny), 1:13,000,000; Sternberg Astronomical Institute and the Moscow State University of Geodesy and Cartography (MIIGAiK): Moscow, Russia, 2014. [Google Scholar]
- Hargitai, H.; Pitura, M. International Catalog of Planetary Maps 1600-2017. In Proceedings of the 49th Lunar and Planetary Science Conference (LPSC), The Woodlands, TX, USA, 19–23 March 2018; Lunar and Planetary Institute: Houston, TX, USA; p. 2083. [Google Scholar]
- Hargitai, H.; Nass, A. Planetary Mapping: A Historical Overview. In Planetary Cartography and GIS; Springer: Berlin/Heidelberg, Germany, 2019; pp. 27–64. [Google Scholar]
- Hargitai, H.; Nass, A. Planetary mapping: A historical overview. In Planetary Cartography—Concepts, Tools, and Methods; Lecture Notes in Geoinformation and Cartography; Springer: Berlin/Heidelberg, Germany, 2019; pp. 27–64. [Google Scholar]
- Hargitai, H. Planetary maps: Visualization and nomenclature. Cartographica 2006, 41, 149–167. [Google Scholar] [CrossRef] [Green Version]
- Shevchenko, V.; Rodionova, Z.; Michael, G. Lunar and Planetary Cartography in Russia; Springer: Berlin/Heidelberg, Germany, 2016. [Google Scholar] [CrossRef]
- Wilhelms, D.E. The Geologic History of the Moon; USGS Professional Paper 1348; United States Geological Survey: Washington, DC, USA, 1987; p. 302. [CrossRef] [Green Version]
- Wilhelms, D.E. Geologic Mapping. In Planetary Mapping; Greeley, R., Batson, R.M., Eds.; Cambridge University Press: Cambridge, UK, 1990; pp. 208–260. [Google Scholar]
- Haber, R.B.; McNabb, D.A. Visualization idioms: A conceptual model for scientific visualization systems. In Visualization in Scientific Computing; Nielson, G.M., Shriver, B., Rosenblum, L., Eds.; IEEE Computer Society: Washington, DC, USA, 1990. [Google Scholar]
- Carpendale, M.S.T. Considering Visual Variables as a Basis for Information Visualization; Technical Report 2001-693-16; Department of Computer Science, University of Calgary: Calgary, AB, USA, 2003. [Google Scholar]
- Tanaka, K.; Skinner, J.; Hare, T. Planetary Geologic Mapping Handbook—2011; Technical Report; U.S. Geological Survey: Reston, VA, USA, 2011.
- McMahon, S.K. Overview of the Planetary Data System. Planet. Space Sci. 1996, 44, 3–12. [Google Scholar] [CrossRef]
- Besse, S.; Vallat, C.; Barthelemy, M.; Coia, D.; Costa, M.; De Marchi, G.; Fraga, D.; Grotheer, E.; Heather, D.; Lim, T.; et al. ESA’s Planetary Science Archive: Preserve and present reliable scientific data sets. Planet. Space Sci. 2018, 150, 131–140. [Google Scholar] [CrossRef]
- Yamamoto, Y.; Ishikawa, H. Data Management in Japanese Planetary Explorations for Big Data Era. In Proceedings of the 10th International Conference on Web Intelligence, Mining and Semantics, Biarritz, France, 30 June–3 July 2020; Association for Computing Machinery: New York, NY, USA, 2020; pp. 88–90. [Google Scholar] [CrossRef]
- Bristow, T.; Lafuente, B.; Stone, N.; Parenteau, M.; Wolfe, S.R.; Rojo, S.P.; Boydstun, K.; Downs, R.; Blake, D.; Jahnke, L.; et al. A Strategy for Managing NASA’s Long Tail of Planetary Research Data. In Proceedings of the 5th Planetary Data Workshop & Planetary Science Informatics & Analytics, Virtual, 28 June–2 July 2021; p. 53. [Google Scholar]
- Nass, A.; Mühlbauer, M.; Heinen, T.; Böck, M.; Munteanu, R.; D’Amore, M.; Riedlinger, T.; Roatsch, T.; Strunz, G.; Helbert, J. Approach towards a Holistic Management of Research Data in Planetary Science—Use Case Study Based on Remote Sensing Data. Remote Sens. 2022, 14, 1598. [Google Scholar] [CrossRef]
- Barkstrom, B.R. A mathematical framework for Earth science data provenance tracing. Earth Sci. Inform. 2010, 3, 167–196. [Google Scholar] [CrossRef]
- Bose, R. A conceptual framework for composing and managing scientific data lineage. In Proceedings of the 14th International Conference on Scientific and Statistical Database Management, Edinburgh, UK, 24–26 July 2002; pp. 15–19. [Google Scholar] [CrossRef]
- Heinis, T.; Alonso, G. Efficient Lineage Tracking for Scientific Workflows. In Proceedings of the 2008 ACM SIGMOD International Conference on Management of Data, Portland, OR, USA, 14–19 June 2020; Association for Computing Machinery: New York, NY, USA, 2008; pp. 1007–1018. [Google Scholar] [CrossRef]
- Ikeda, R.; Widom, J. Data Lineage: A Survey; Technical Report; Stanford University: Stanford, CA, USA, 2009. [Google Scholar]
- Radebaugh, J.; Thomson, B.J.; Archinal, B.; Beyer, R.; DellaGiustina, D.; Fassett, C.; Gaddis, L.; Goossens, S.; Hare, T.; Laura, J.; et al. Maximizing the value of Solar System data through Planetary Spatial Data Infrastructures. arXiv 2020, arXiv:2008.06171. [Google Scholar]
- Lawrence, S.J.; Archinal, B.A.; Gaddis, L.R. Addressing Strategic Planning Needs for Planetary Cartography. In Proceedings of the Second Planetary Data Workshop, Flagstaff, AZ, USA, 8–11 June 2015; Volume 1846, p. 7068. [Google Scholar]
- Tao, Y.; Muller, J.P.; Poole, W. Automated localisation of Mars rovers using co-registered HiRISE-CTX-HRSC orthorectified images and wide baseline Navcam orthorectified mosaics. Icarus 2016, 280, 139–157. [Google Scholar] [CrossRef] [Green Version]
- Sidiropoulos, P.; Muller, J.P.; Watson, G.; Michael, G.; Walter, S. Automatic Coregistration and orthorectification (ACRO) and subsequent mosaicing of NASA high-resolution imagery over the Mars MC11 quadrangle, using HRSC as a baseline. Planet. Space Sci. 2018, 151, 33–42. [Google Scholar] [CrossRef]
- Sidiropoulos, P.; Muller, J.P. A Systematic Solution to Multi-Instrument Coregistration of High-Resolution Planetary Images to an Orthorectified Baseline. IEEE Trans. Geosci. Remote Sens. 2018, 56, 78–92. [Google Scholar] [CrossRef]
- Kerner, H.R.; Wagstaff, K.L.; Bue, B.D.; Gray, P.C.; Bell, J.F.; Ben Amor, H. Toward Generalized Change Detection on Planetary Surfaces with Convolutional Autoencoders and Transfer Learning. IEEE J. Sel. Top. Appl. Earth Obs. Remote Sens. 2019, 12, 3900–3918. [Google Scholar] [CrossRef]
Figure 1.
Data flow and data transformation between entities, processes, and storage spaces as observed in systematic mapping, reference mapping, and thematic mapping. Potential resource redundancies are highlighted in boxes. The depiction is an abstract representation of common data transformations. Not all transformation and control processes are representative of each data product as different processing and control tasks exist for each sensor type.
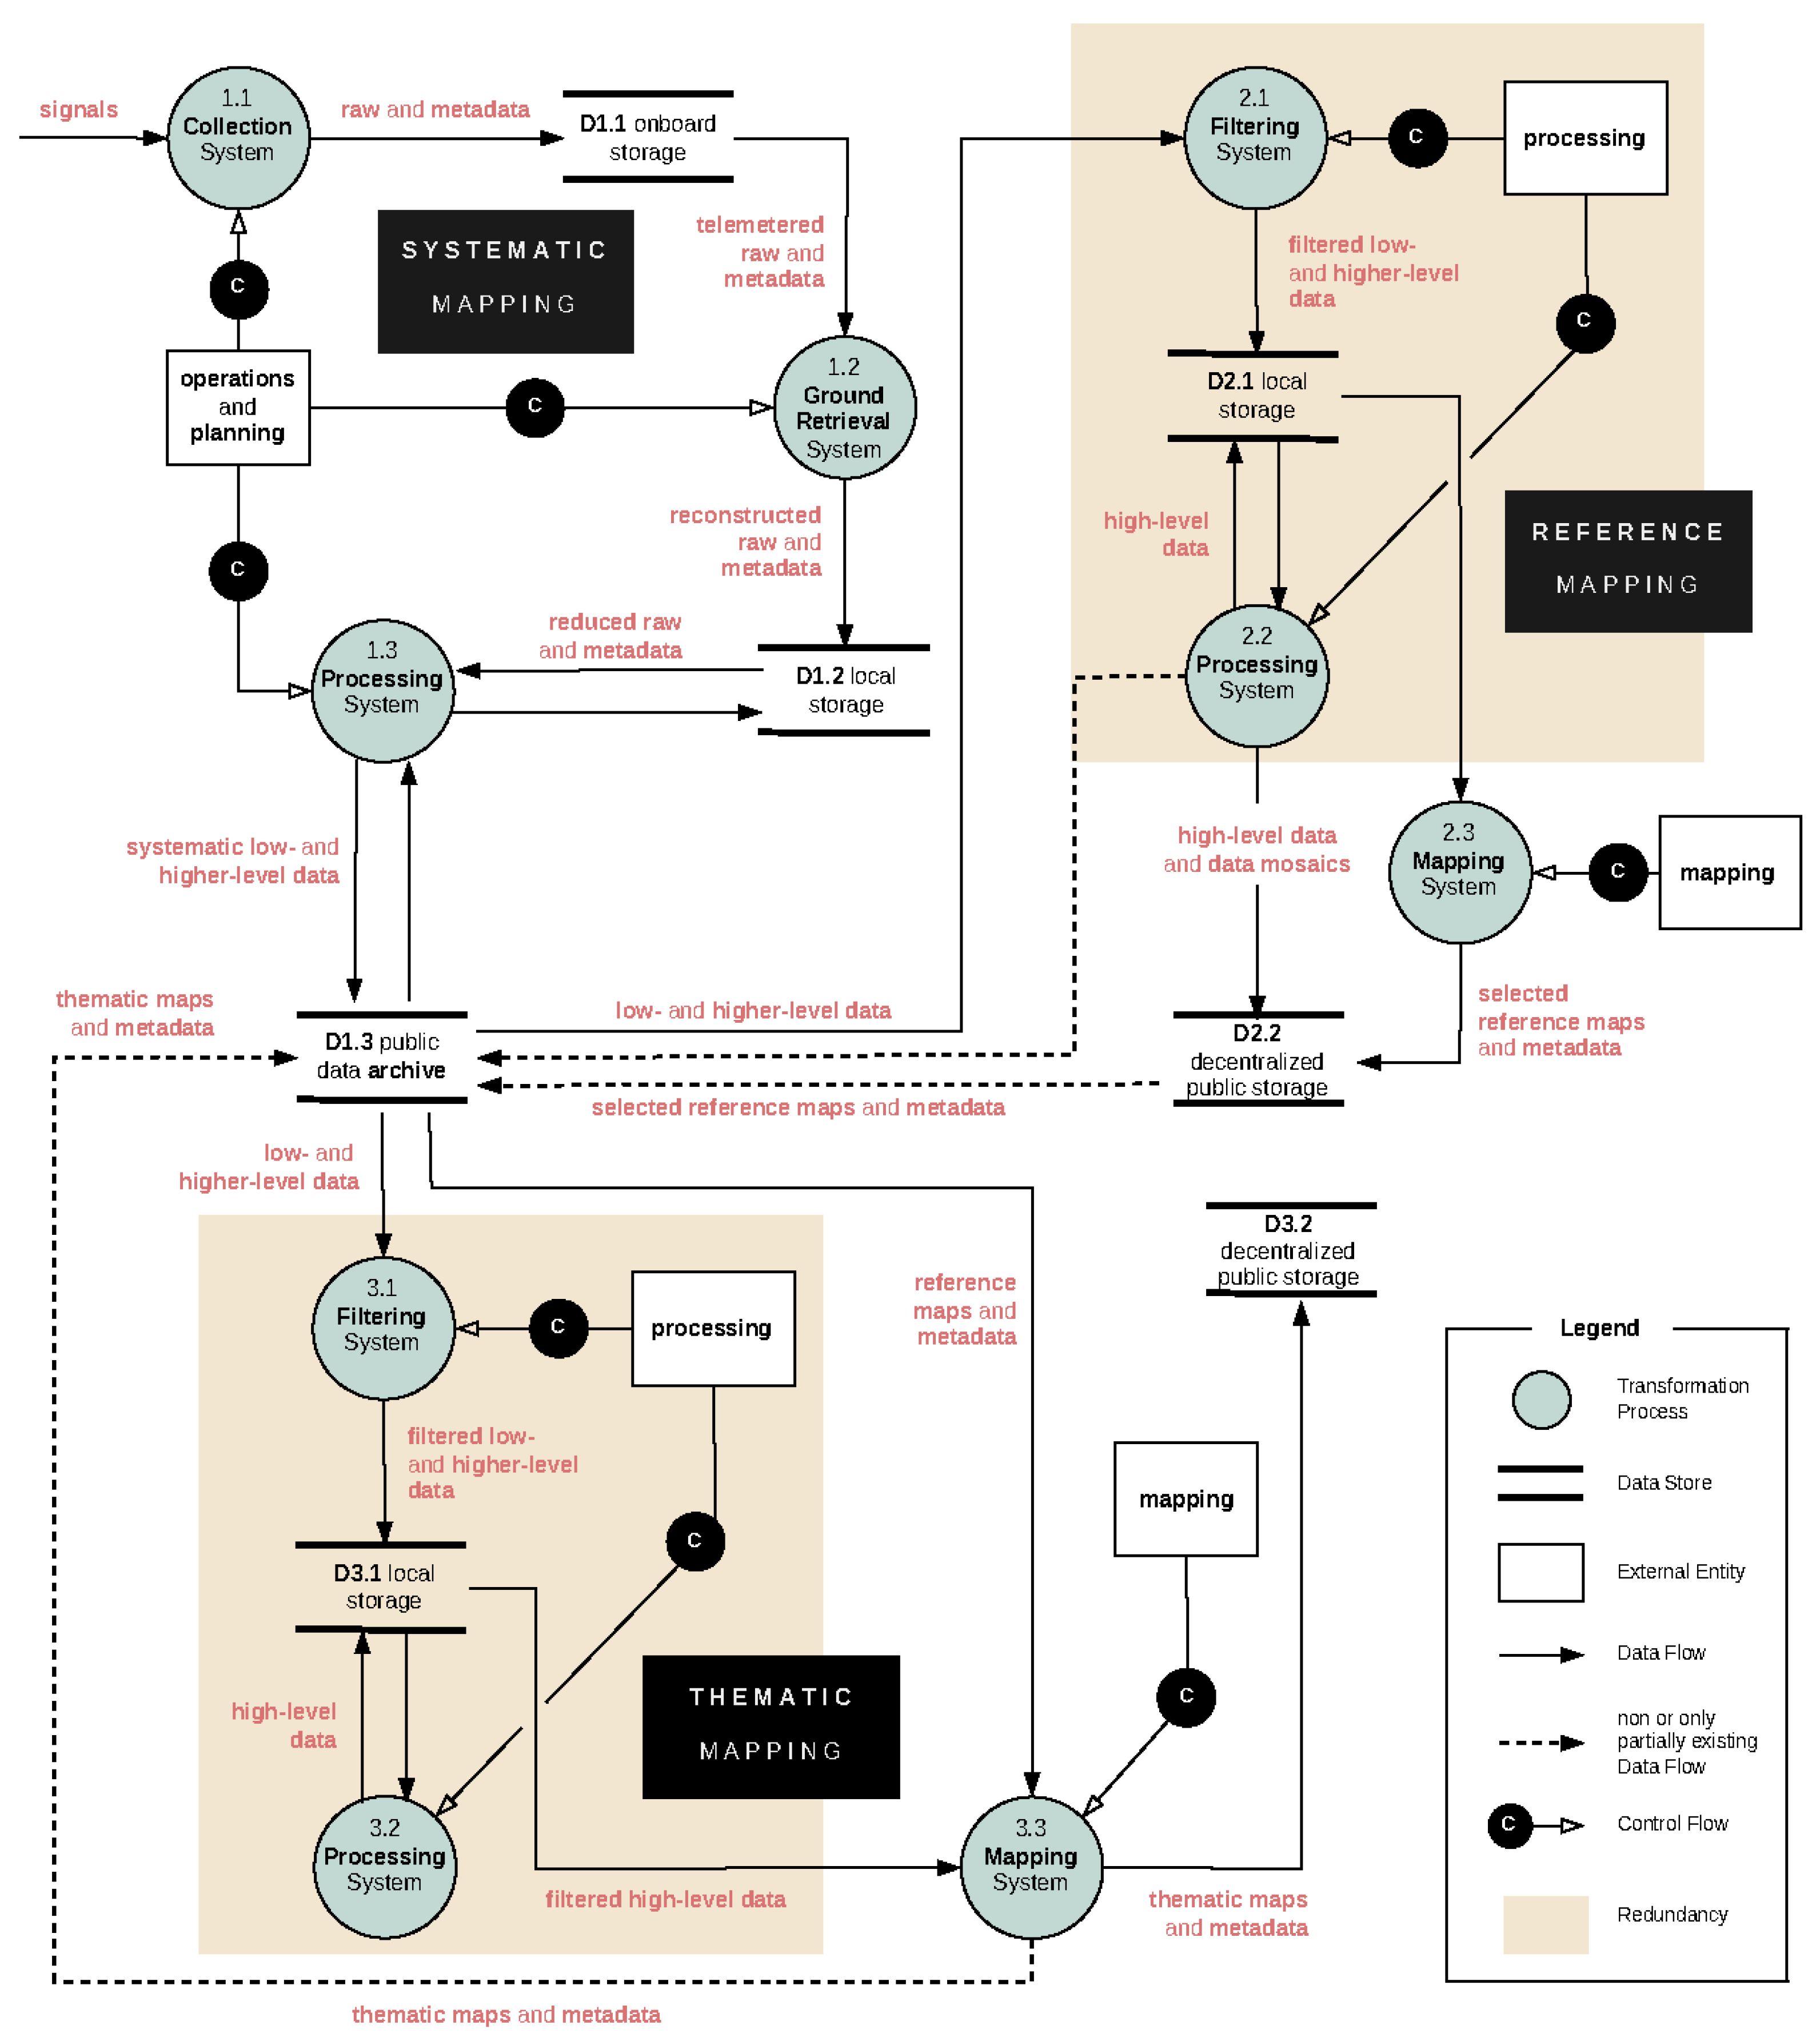
Figure 2.
Information exchange and development of knowledge across different mapping contexts as framed through transformative processes in the flow of data as shown in Figure 1.
Figure 2.
Information exchange and development of knowledge across different mapping contexts as framed through transformative processes in the flow of data as shown in Figure 1.
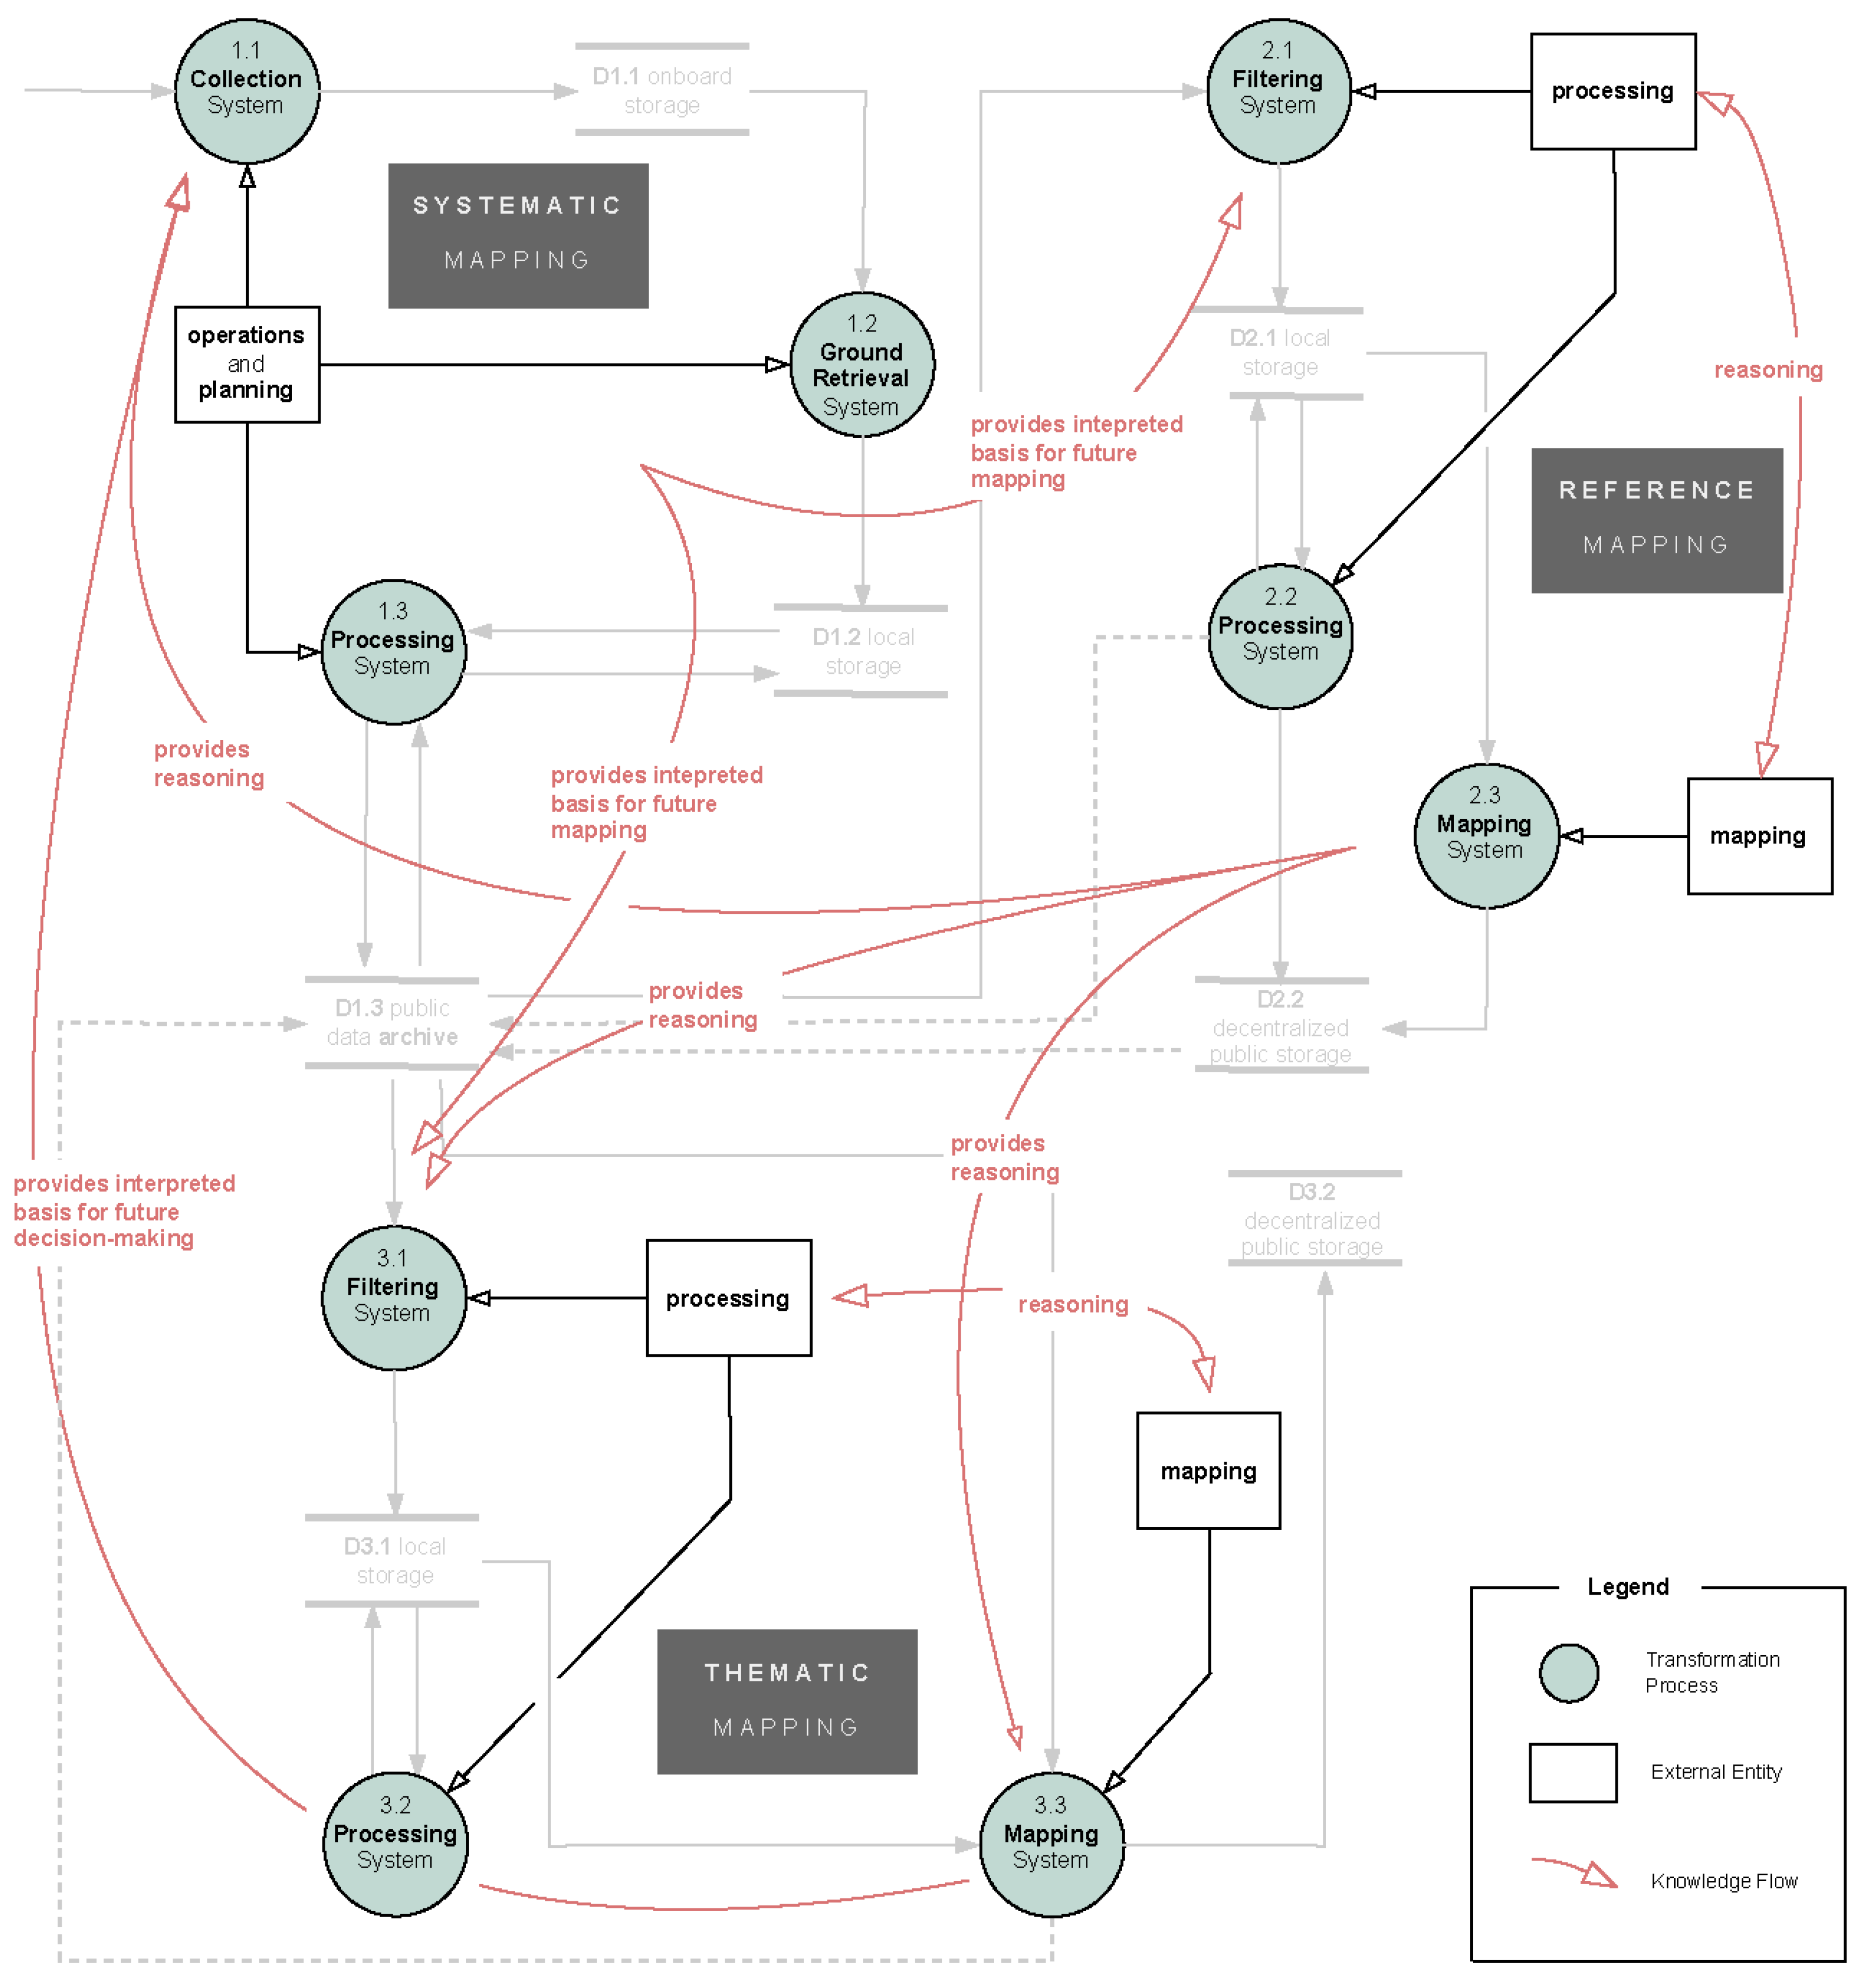
Figure 3.
A semantic working model describing vocabulary, process dependencies, and compositional entities between different mapping concepts.
Figure 3.
A semantic working model describing vocabulary, process dependencies, and compositional entities between different mapping concepts.

Figure 4.
Higher-level view of planetary mapping concepts and the roles of data and information (here: reference) for the development of knowledge through the processes of contextualization and abstraction across mapping contexts.
Figure 4.
Higher-level view of planetary mapping concepts and the roles of data and information (here: reference) for the development of knowledge through the processes of contextualization and abstraction across mapping contexts.

Disclaimer/Publisher’s Note: The statements, opinions and data contained in all publications are solely those of the individual author(s) and contributor(s) and not of MDPI and/or the editor(s). MDPI and/or the editor(s) disclaim responsibility for any injury to people or property resulting from any ideas, methods, instructions or products referred to in the content. |
© 2023 by the authors. Licensee MDPI, Basel, Switzerland. This article is an open access article distributed under the terms and conditions of the Creative Commons Attribution (CC BY) license (https://creativecommons.org/licenses/by/4.0/).
Share and Cite
MDPI and ACS Style
van Gasselt, S.; Nass, A. A Semantic View on Planetary Mapping—Investigating Limitations and Knowledge Modeling through Contextualization and Composition. Remote Sens. 2023, 15, 1616. https://doi.org/10.3390/rs15061616
AMA Style
van Gasselt S, Nass A. A Semantic View on Planetary Mapping—Investigating Limitations and Knowledge Modeling through Contextualization and Composition. Remote Sensing. 2023; 15(6):1616. https://doi.org/10.3390/rs15061616
Chicago/Turabian Stylevan Gasselt, Stephan, and Andrea Nass. 2023. "A Semantic View on Planetary Mapping—Investigating Limitations and Knowledge Modeling through Contextualization and Composition" Remote Sensing 15, no. 6: 1616. https://doi.org/10.3390/rs15061616
Note that from the first issue of 2016, this journal uses article numbers instead of page numbers. See further details here.