Article

Satellite SAR Interferometry and On-Site Traditional SHM to Monitor the Post-Earthquake Behavior of the Civic Tower in L’Aquila (Abruzzo Region, Italy)

Department of Geosciences, University of Padova, via Gradenigo 6, 35131 Padova, Italy
*
Author to whom correspondence should be addressed.
Remote Sens. 2023, 15(6), 1587; https://doi.org/10.3390/rs15061587
Submission received: 15 January 2023 / Revised: 6 March 2023 / Accepted: 8 March 2023 / Published: 14 March 2023

Abstract

:
Structural Health Monitoring (SHM) represents a very powerful tool to assess the health condition of buildings. In recent years, the growing availability of high-resolution SAR satellite images has made possible the application of multi-temporal Interferometric Synthetic Aperture Radar (MT-InSAR) techniques for structural monitoring purposes, with high precision, low costs, timesaving, and the possibility to investigate wide areas. However, a comprehensive validation of the effectiveness of MT-InSAR in this application field has not been achieved yet. For this reason, in this paper a comparison between interferometric data and on-site measurement of displacements is proposed. The application case study is the Civic Tower of the city of L’Aquila (Abruzzo Region, Italy). After the seismic events that affected the area in 2009, an on-site monitoring system was installed on the tower to detect any changes in the damage pattern in the period 2010–2013. Furthermore, images acquired by COSMO-SkyMed constellation in Stripmap mode (~3 m resolution) during the same period were processed by the Permanent Scatterer-InSAR (PSI) technique to estimate the deformation of the structure and the surrounding area. The obtained results indicate that both methods are consistent in the measurement of displacement trends of the building and a slight rotation/displacement of the tower was detected. Such evidence highlights both the huge potential and the limitations of using InSAR techniques for SHM.

1. Introduction

Deterioration and aging of structures have highlighted the importance of developing structural monitoring systems to safeguard our built environment. Moreover, in case of exceptional events (such as earthquakes, flooding and landslides), a detailed knowledge of the health conditions of the structure provides useful information in order to prioritize and design provisional interventions [1]. Monitoring can also be effective when implemented on damaged structures, evaluating the evolution of on-going damage processes [2]. Traditional Structural Health Monitoring (SHM) methods require the installation of a high number of sensors (e.g., accelerometers, displacement transducers and thermocouples) depending on the parameter of interest. Nowadays, numerous applications of traditional SHM are available in the scientific literature [3,4,5,6,7], so it is recognized as a well-known and validated technique which includes several advantages, such as the high accuracy of the measures, easily understandable output data and the presence of protocols and guidelines [8,9,10]. On the other hand, some drawbacks are present, mostly concerning the high cost of the equipment and the continuous need for maintenance. Moreover, it is useful to underline that most of the data recorded by the sensors are to be considered as local, and a full knowledge of the global behavior of the structure is possible only implementing an extensive layout of sensors.
In recent years, the increasing availability of Synthetic Aperture Radar (SAR) satellite images allows the investigation of widespread areas in all-weather conditions during both day and night. In particular, the processing of high-resolution satellite images (e.g., TerraSAR-X and COSMO-SkyMed) through Multi-Temporal SAR interferometry (MT-InSAR) methods enables the collection of non-invasive, periodic and widespread data that can be used to detect vulnerabilities of built-up areas, both at large (territorial) and at local (single structure) scales [11,12,13,14,15,16,17,18,19,20]. Among the different algorithms, PS-InSAR [21] has proven to be very effective in recognizing building displacements, identifying a high density of measurement points (MP) and providing displacement velocity along the satellite Line Of Sight (LOS). In addition, accurate time series with the deformation history over the observing period are produced, which are fundamental to evaluating the evolution of a given phenomenon over time [22].
Despite its diffusion, the use of MT-InSAR for structural monitoring purposes has yet to be completely validated and is thus still under investigation. Many case studies have been carried out with field surveys validation. For instance, in Infante et al. [23] C- and X-band SAR data are applied for the study of the effects of a slow-moving landslide on buildings in a town in Salerno province (Italy). The InSAR results are then integrated with field surveys for structural damage characterization. In Del Soldato et al. [24], MT-InSAR analysis is combined with field survey for damage probability estimation in buildings located in an area in the Tuscany region (Italy) affected by several landslides. In Bianchini et al. [25], the SqueeSAR technique is used to investigate the impacts of a landslide on a town in Messina province (Italy) and compared with in situ observation for the identification of ground surface and building cracks. Peduto et al. [26] combine PSI analysis with field surveys, which are carried out in a few buildings in El Papiol town (Spain) for the characterization of fractures and damage severity classification induced by a slow-moving landslide.
A few case studies have integrated MT-InSAR with on-site measurements through the employment of specific devices. In Chen et al. [27], a combined InSAR and GNSS (Global Navigation Satellite System) approach is presented, allowing to overcome the disadvantages of each technique in Rovegliana area (Italy) which is affected by a landslide; terrestrial laser scanning acquisition and terrestrial structure from motion photogrammetry were applied to further investigate structural damages. In Selvakumaran et al. [28], the InSAR processing outputs are combined and compared with the recordings of a total station for monitoring the Waterloo Bridge in London, highlighting how the two approaches are comparable in the identification of the thermal deformation of the bridge. In Heleno et al. [29], PSI analysis is carried out to detect ground subsidence in Lisbon (Portugal) and the results are confirmed by comparing them with leveling and continuous GPS data. In Cavalagli et al. [30], InSAR processing results are compared with data of displacement transducers (LVDT crack meters) for monitoring the Consoli Palace and the town walls in Gubbio (Italy). The two approaches are consistent in identifying seasonal deformation trends due to the thermal expansion of masonry, as well as possible permanent deformations caused by the seismic sequence that occurred near Gubbio in 2013. In Caprino et al. [31], InSAR time series are compared with on-site environmental sensors for the monitoring of the Scrovegni Chapel (Padova, Italy), aiming at finding any possible correlation between displacement and environmental parameters such as the temperature and humidity. The outcomes clearly identify a seasonal trend in the behavior.
Notwithstanding the few above-mentioned case studies, the validation of the results of MT-InSAR monitoring by other well-established approaches is a research topic yet to be examined in detail. Moreover, the application of MT-InSAR for monitoring structures with reduced dimensions in plan, such as a tower, has not been fully explored and the literature in this field is still lacking.
In this context, this article proposes the combination of MT-InSAR and on-site monitoring for the evaluation of the ongoing displacement phenomena of the Civic Tower in L’Aquila city (Abruzzo Region, Italy). The PS algorithm is used for processing a dataset of COSMO-SkyMed images from September 2010 to February 2013. During the same period, a physical monitoring system was installed to assess the health condition of the structure after the earthquake that struck the area in April 2009. First, the results of both methods are presented separately. Then, in the discussion chapter, the results are compared and integrated, underlining similarities and differences. The article emphasizes the potential of MT-InSAR for structural monitoring of single buildings or portions of buildings, but several drawbacks related to this technology were confirmed during the work and should be addressed in the future.

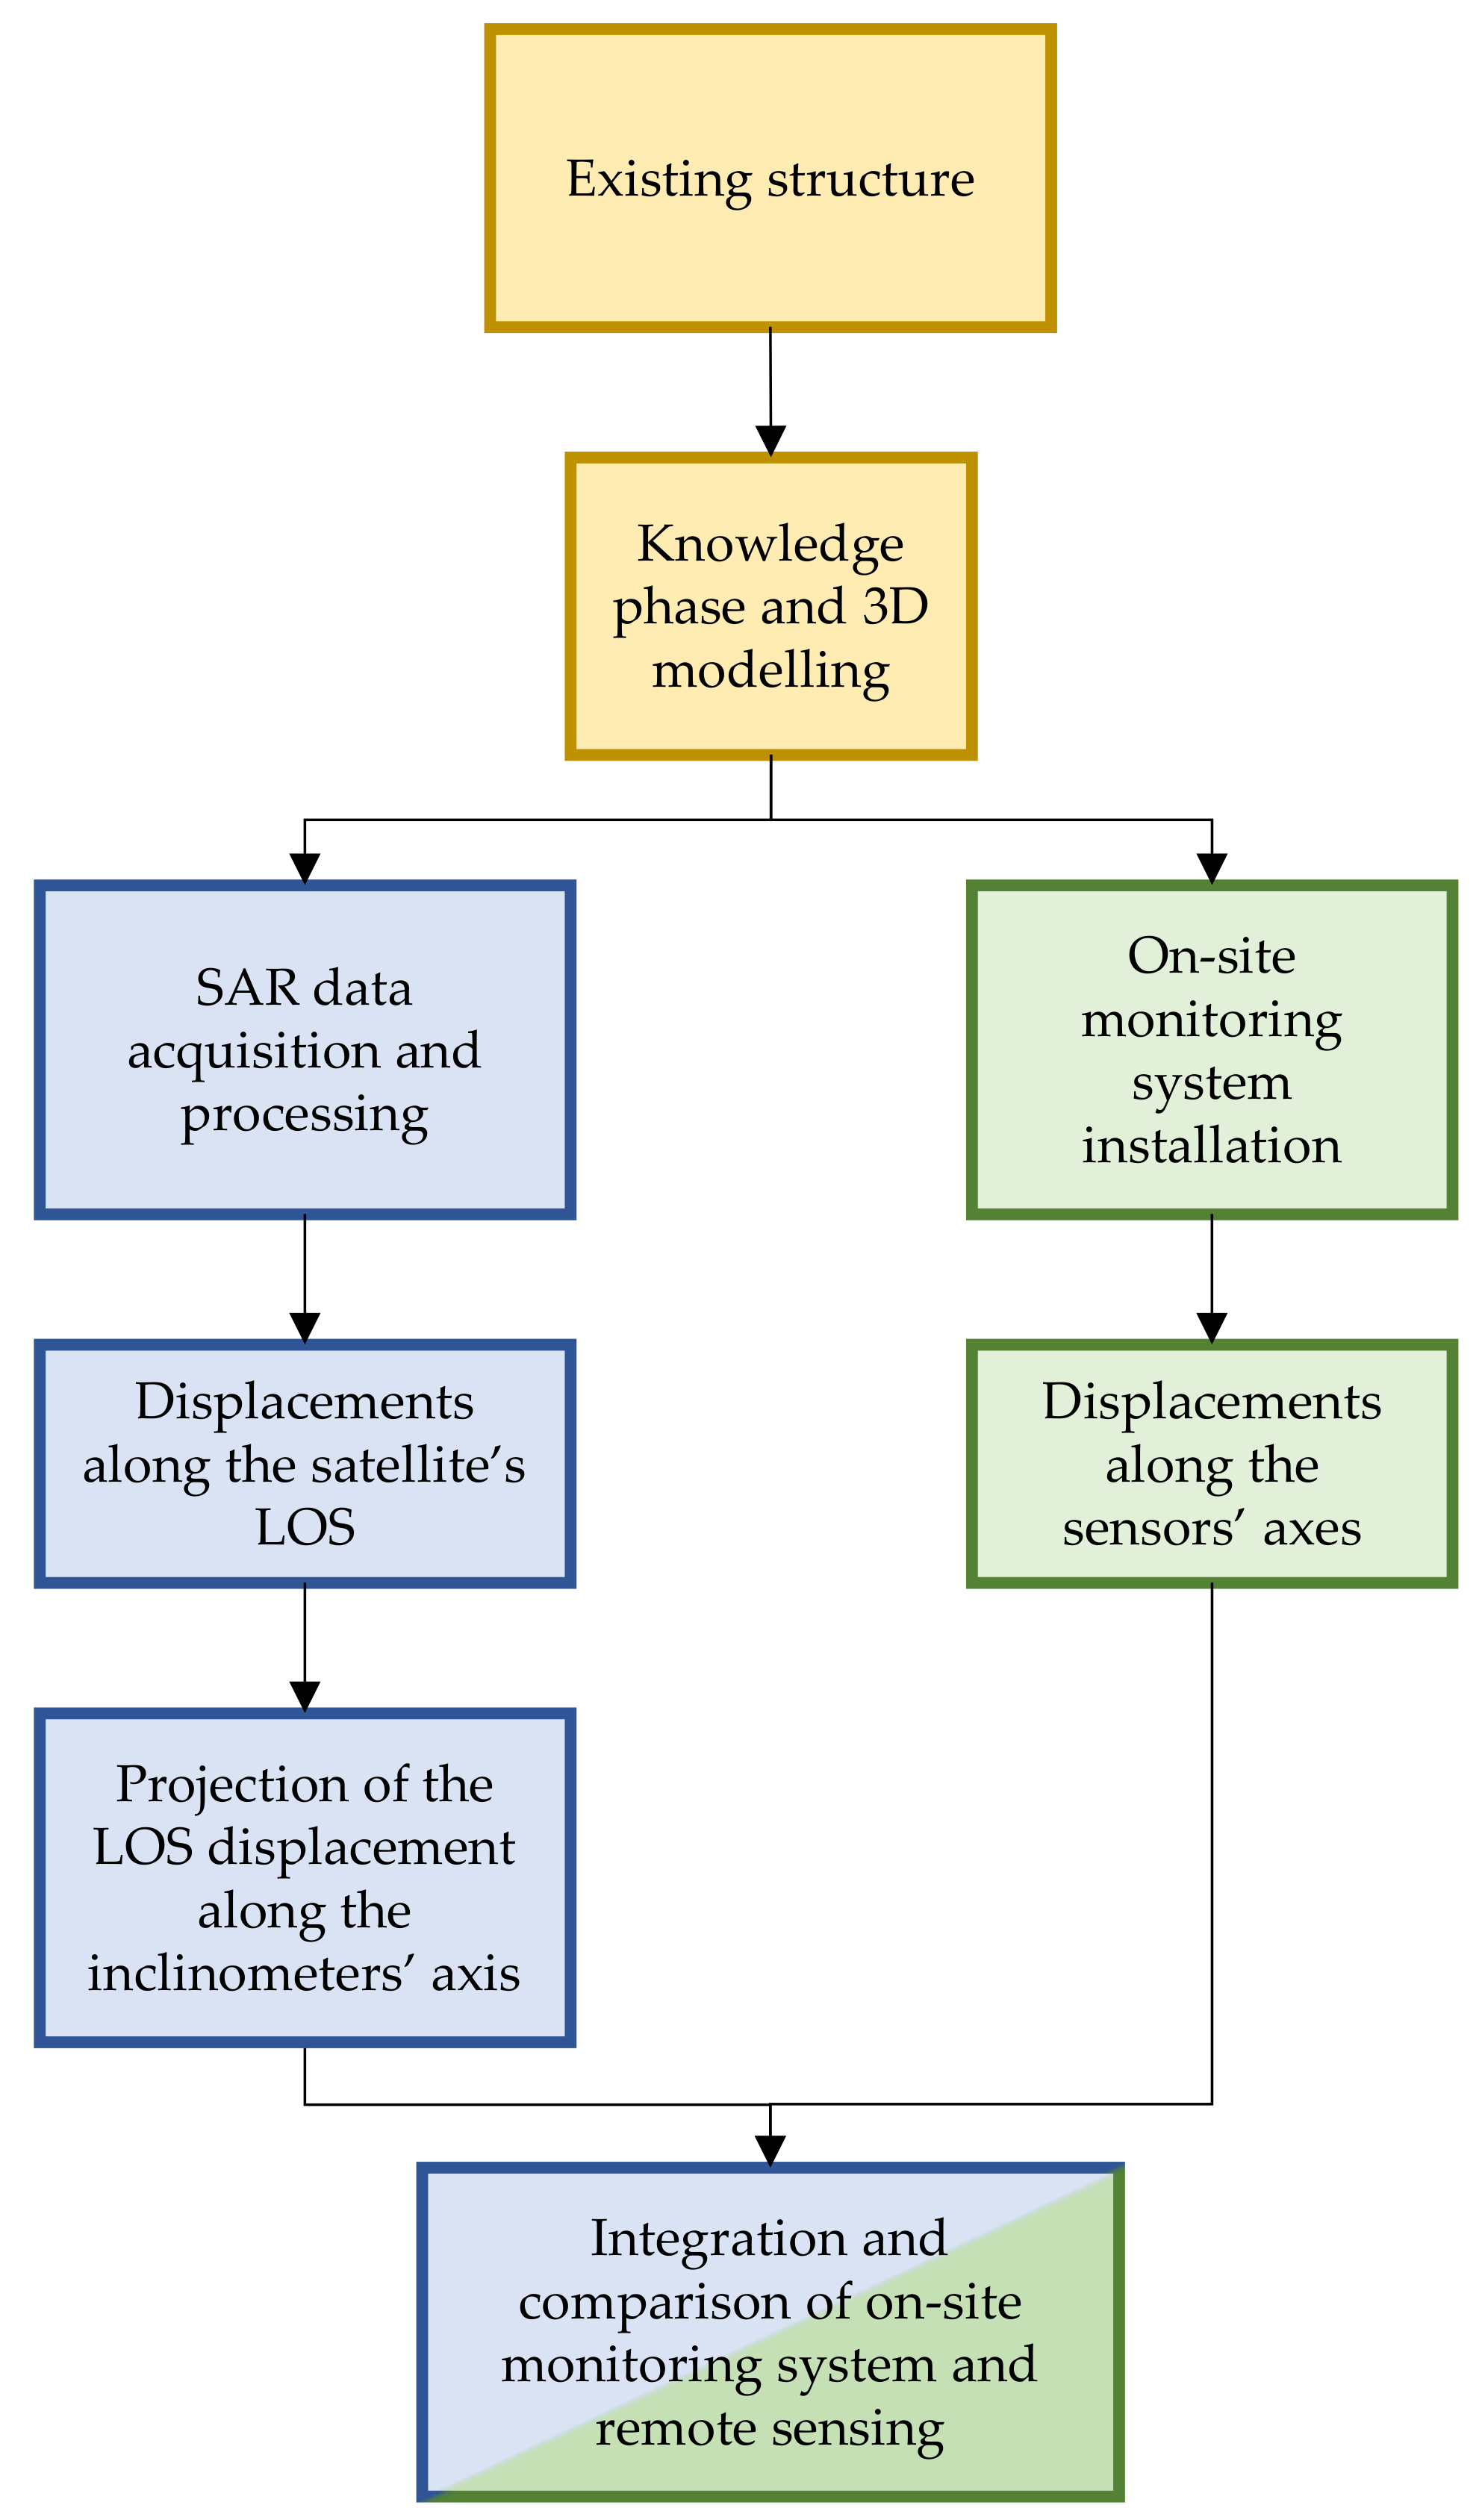
2. Materials and Methods

This section describes the procedure followed for monitoring the structure under investigation. Firstly, a geometrical reconstruction was exploited to obtain a 3D model of the building. Then, data deriving both from on-site monitoring system and remote sensing tools were investigated separately to detect the main displacement phenomena. Lastly, a comparison between the on-site results and the remote sensing results was carried out to find any difference or correspondence between the two methodologies. Each step of the procedure, presented in Figure 1, is detailed below.

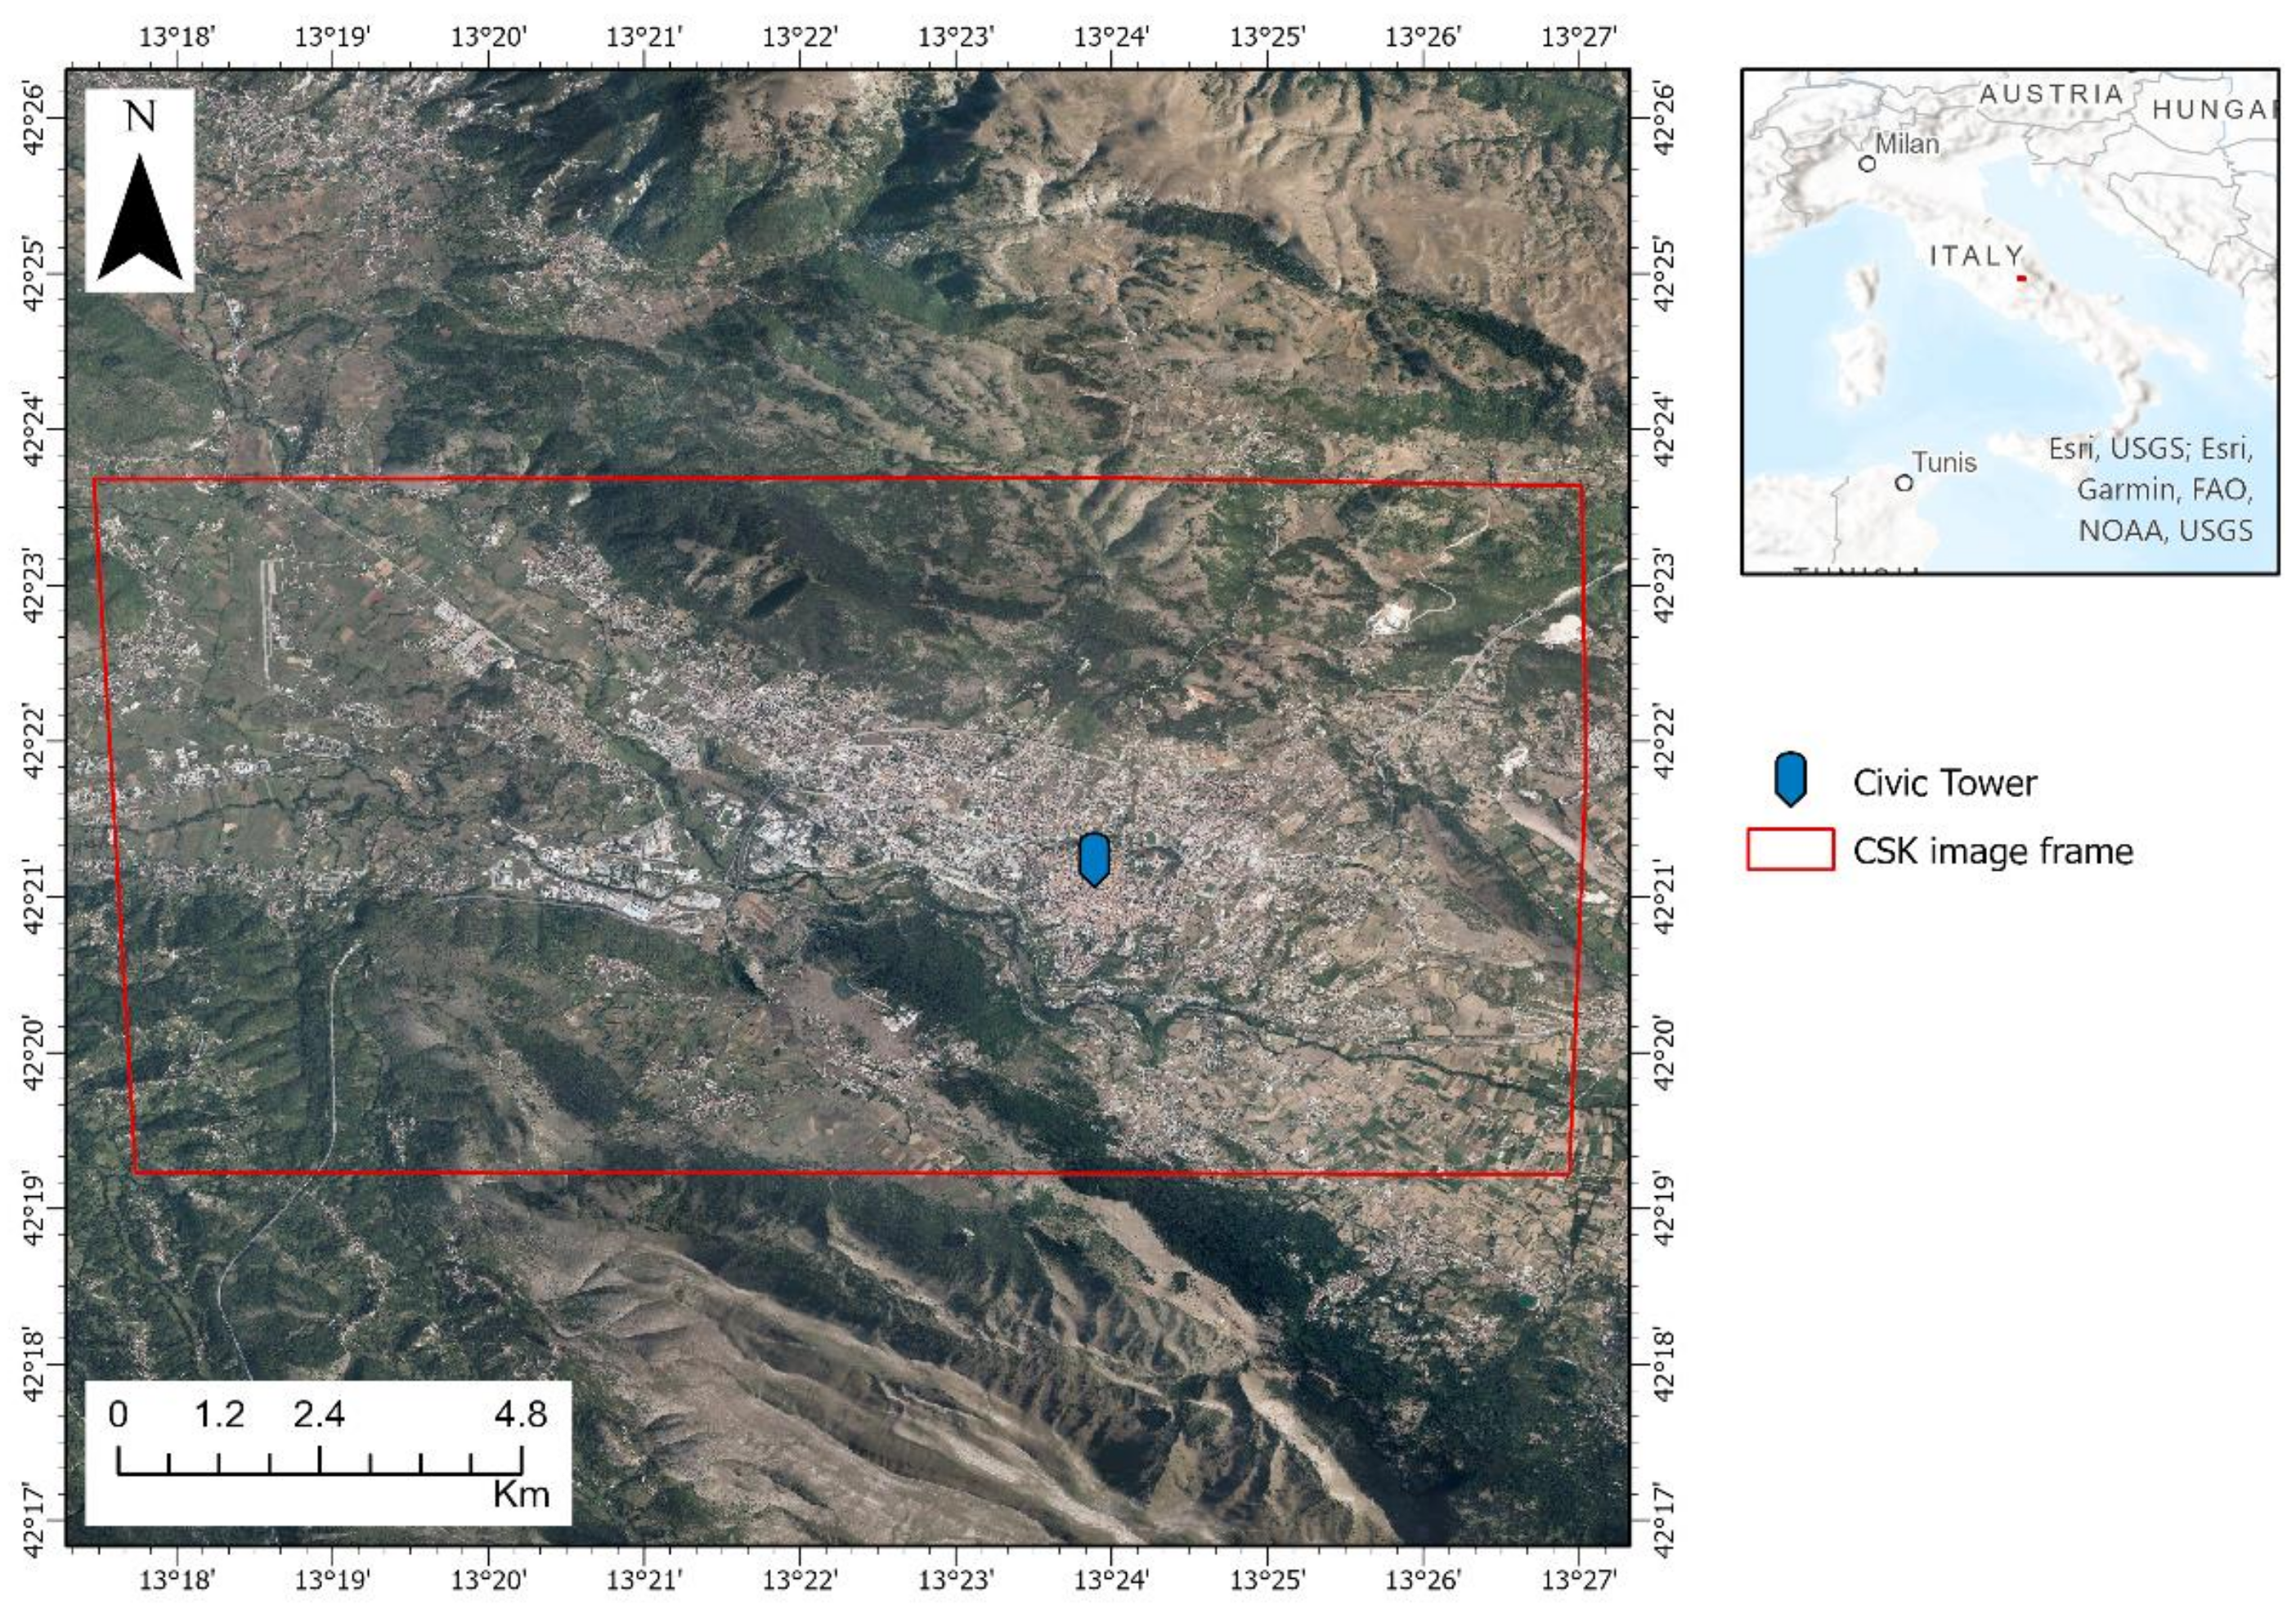
2.1. Case Study: The Civic Tower, L’Aquila

On 6 April 2009, an intense Mw 6.3 earthquake struck the city of L’Aquila (Figure 2), which is located in the western part of the Abruzzo Region (central Italy). The earthquake caused over 300 casualties, about 1600 injured and left over 60,000 people without shelter [32]. According to the National Institute of Geophysics and Volcanology (INGV) in Italy, the hypocenter is located about 2 km from the city at a depth of 9 km. Numerous historic and highly vulnerable buildings were strongly damaged by the earthquake [33,34], including Palazzo Margherita and the Civic Tower in the medieval city center.
The Civic Tower is part of the “Palazzo Margherita” at L’Aquila City Hall (Figure 3a,b). The tower, with its 6.5 × 7 m base and 43 m height, is particularly vulnerable due to its height and slenderness. The main damage mechanisms induced by the earthquake to the palace and the tower detected during visual inspection activities are briefly reported. The masonry walls of the palace were subjected to out-of-plane overturning mechanisms, caused by seismic forces applied perpendicularly to the wall plane, as well as shear mechanisms, resulting in the typical diagonal cracks caused by seismic forces applied in the plane of the wall. Other localized damages were documented, including roof damage, shear cracks in the vaults and stairs, and complete or partial collapses of the floor slabs at the second floor. Because of its tall and slender shape, the tower was particularly vulnerable to base settlements and movements caused by ground shaking. Furthermore, the slenderness and cantilever-beam-type boundary conditions of the tower make it unsuitable for stress redistribution and energy dissipation. As a result, there was a concentration of stresses at the basement, which was worsened by the brittleness of deteriorated masonry. A thorough visual inspection and crack survey revealed the presence of diffused and severe crack patterns on the outer surface, as well as crack patterns in the inner walls. Relevant cracks were observed at the tower’s base, on both the south (Figure 3c) and east sides (Figure 3d), with the most severe damage detected at the interface between the tower and the palace (Figure 3e,f). Some of these cracks existed prior to the 1703 earthquake and reopened, while others formed because of the 2009 earthquake. Visual inspections inside the tower revealed new cracks with amplitudes of up to 2 cm in some places. The unsafe structural conditions of the tower recommended implementing some provisional emergency interventions, that consisted in a confining system composed by steel beams and ties at different heights along the tower, in order to stabilize the element and improve the connection between the tower and the palace (Figure 3g,h). A propping system for the wings of the palace was also implemented, by means of steel beams, plates and ties, in order to avoid out-of-plane overturning collapses.

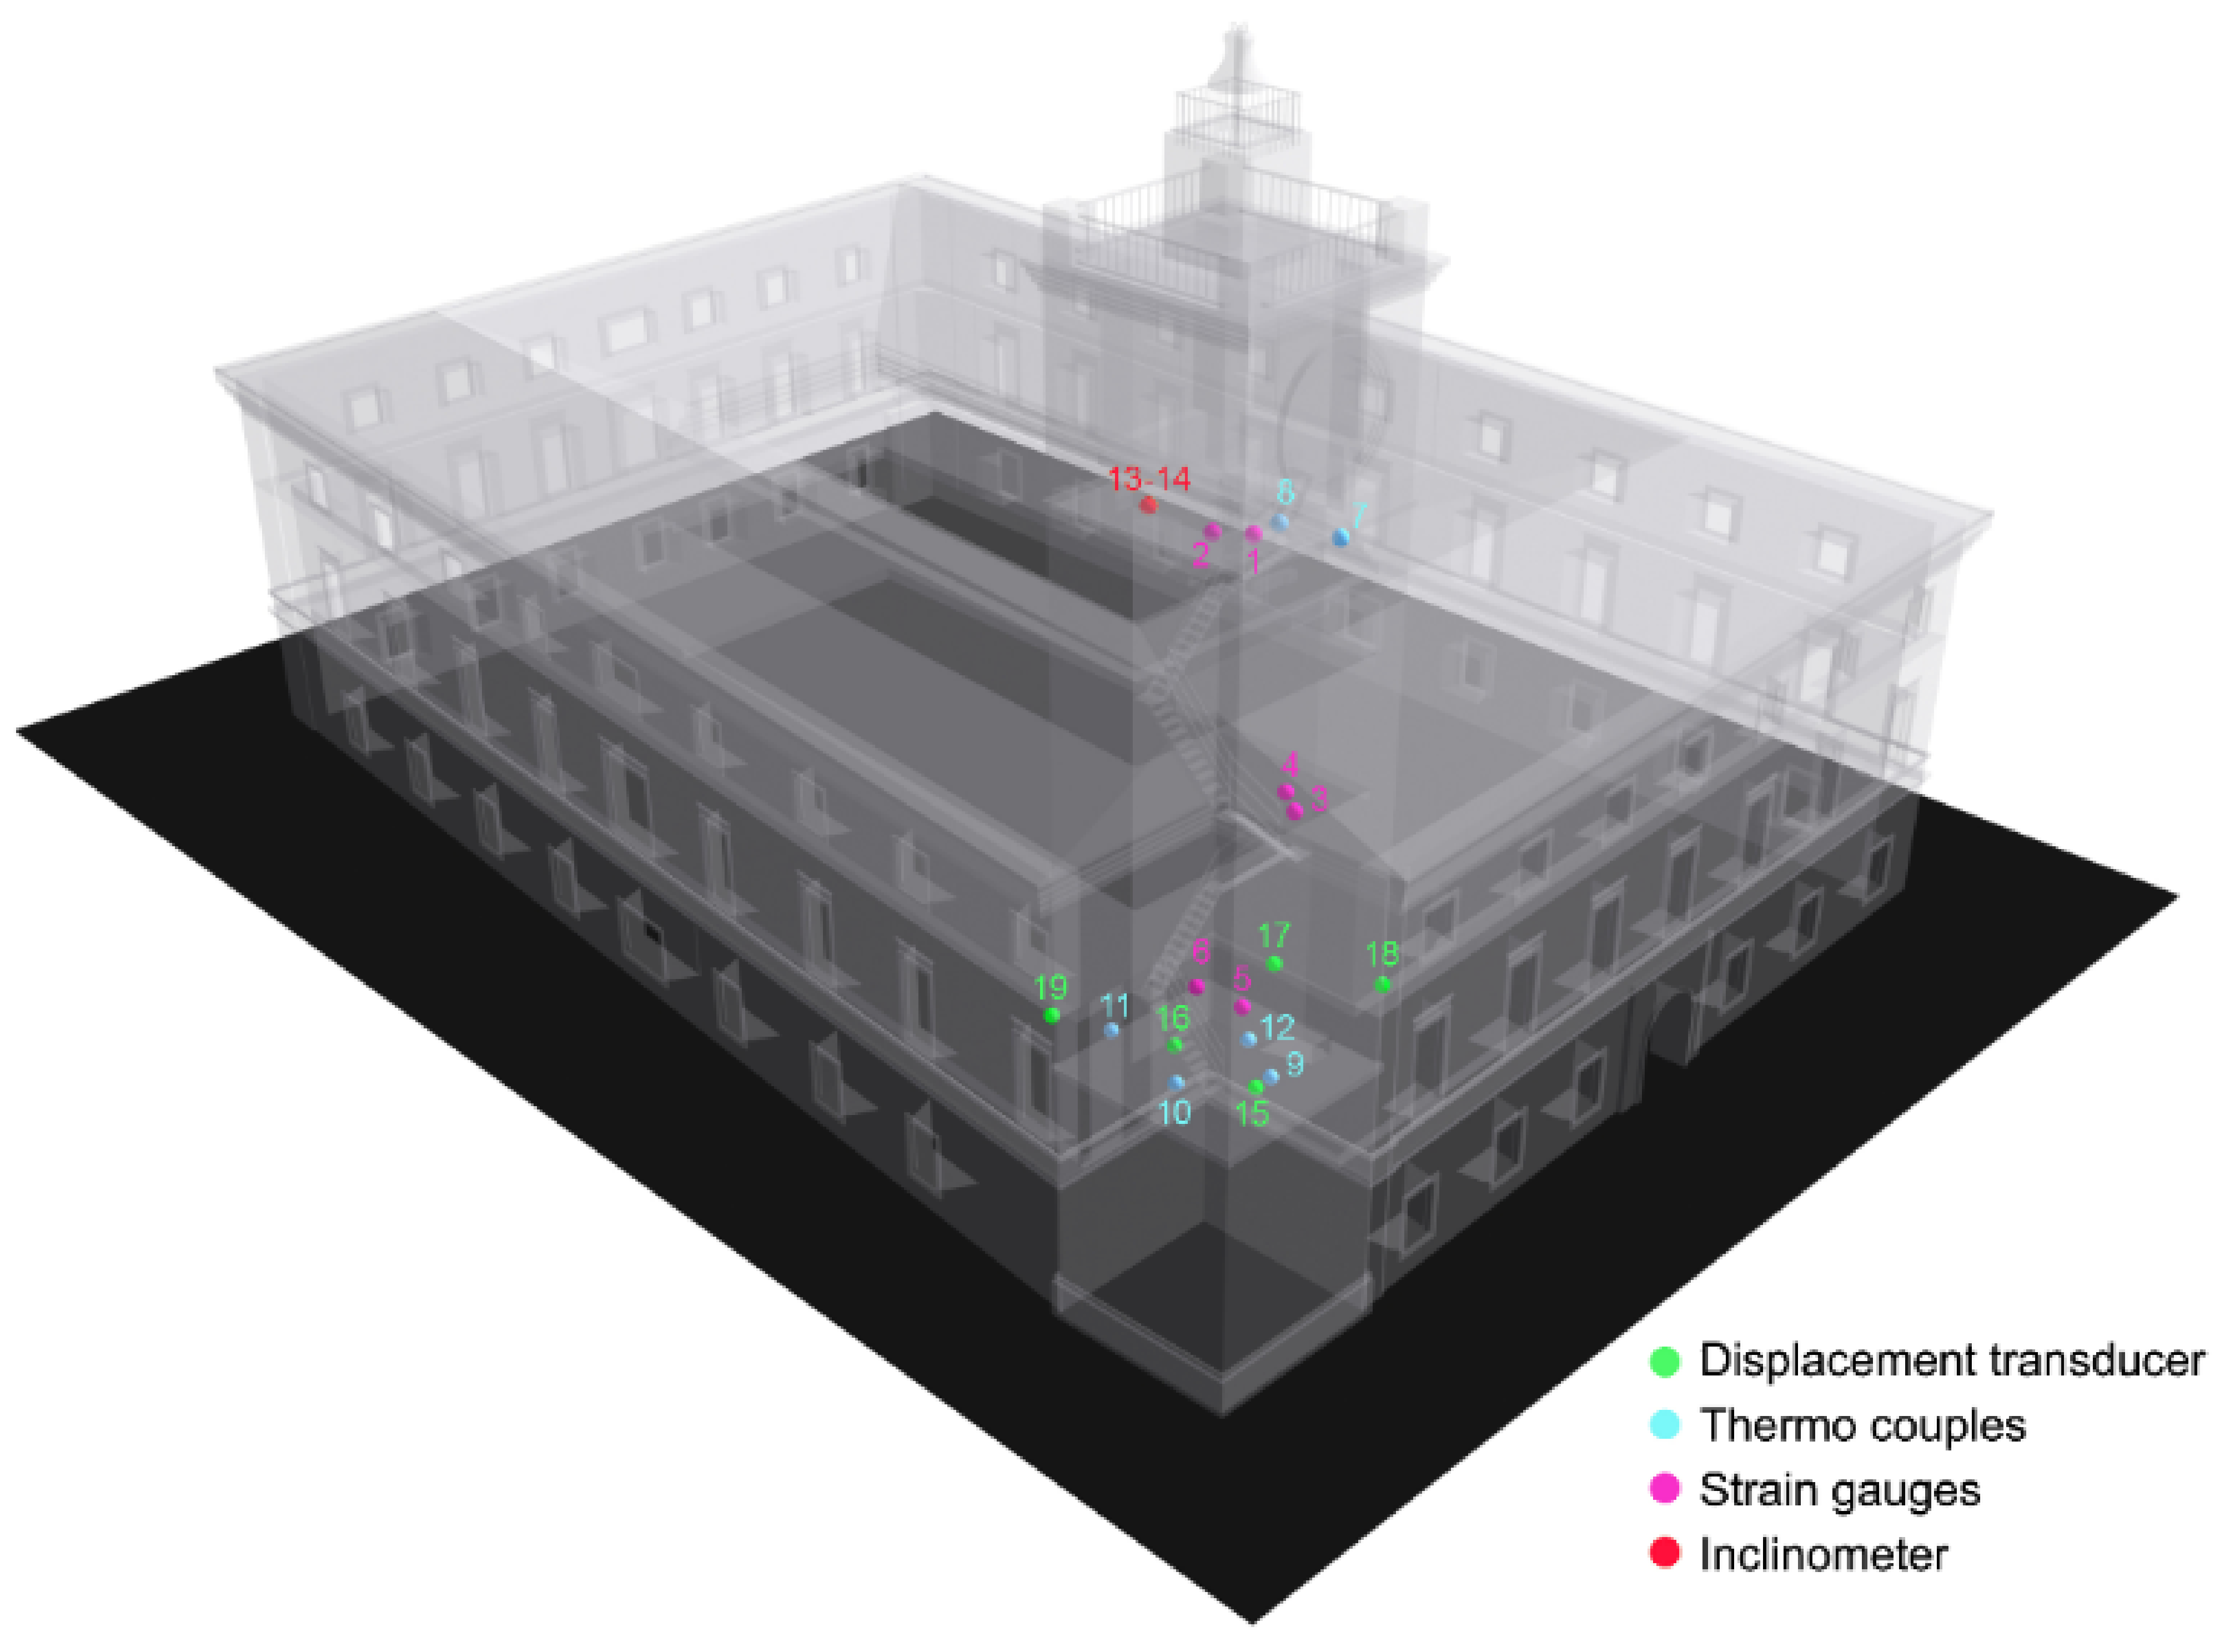
2.2. On-Site Monitoring System

In combination with the emergency interventions, a permanent structural health monitoring system (SHM) was installed to evaluate the progression of the damage pattern and to control the effectiveness of the implemented provisional measures. The monitoring system was composed of static sensors to control the damage and crack pattern of the structure and accelerometers to measure ambient vibrations. The static system (Figure 4) included devices to measure displacements and strains at critical points of the building. It is composed of:
  • Three displacement transducers installed on representative cracks in the lower part of the tower.
  • Two displacement transducers installed on the crack between the tower and the palace to control the relative displacements of the two structures.
  • One biaxial inclinometer to control the displacement of the tower top along the two main directions.
  • Six strain gauges on the existing metal ties of the tower to control the strain variation.
  • Six thermocouples to control both air and wall temperatures in different points of the structure.
Since the purpose of this study is to evaluate the displacement of the Civic Tower over time, SAR analysis will only be compared and discussed with static sensors, specifically inclinometers, which quantify the degree of rotation and the relative displacement between the palace and the tower. For more detailed information about the SHM system, please refer to [35].
Figure 4. Layout of the static monitoring systems.
Remotesensing 15 01587 g004

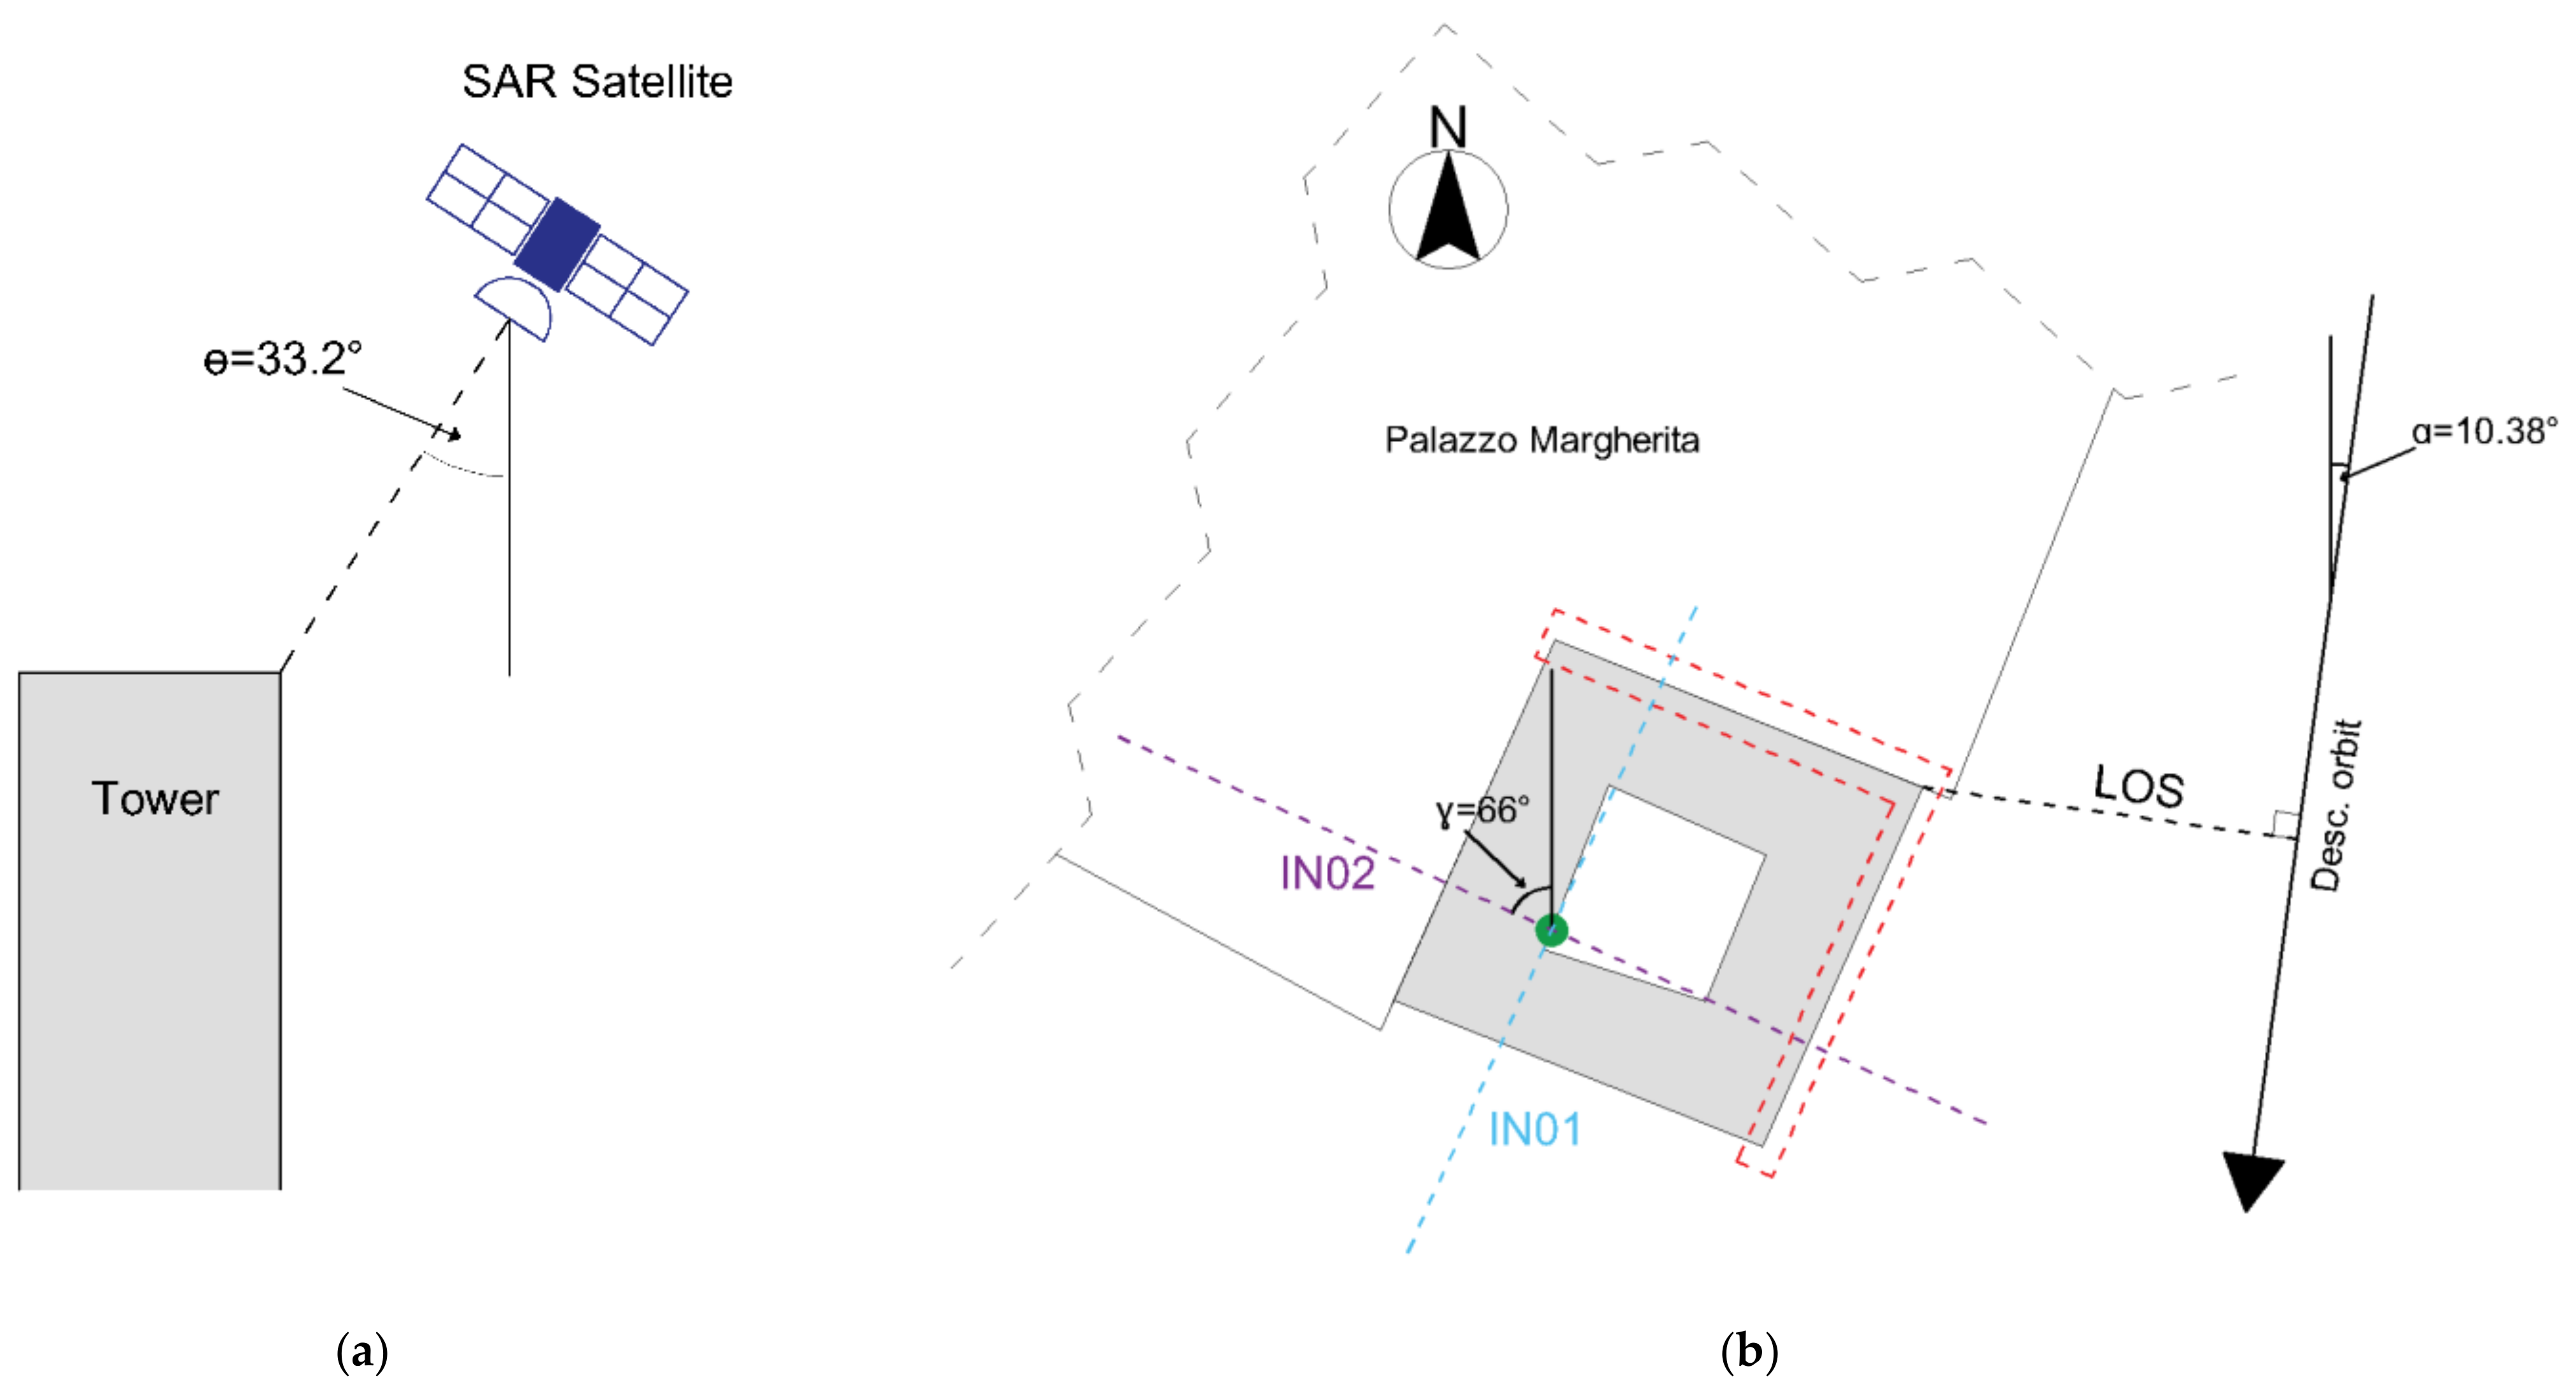
2.3. Satellite SAR Data and Processing

In this study, 34 COSMO-SkyMed (CSK) images from 5 September 2010 to 1 February 2013 were processed. COSMO-SkyMed is a constellation of four X-band satellites developed and funded by the Italian Space Agency (ASI) and the Italian Ministry of Defense, for both civilian and defense uses [36]. Because of a lack of images for ascending orbit in the time of interest, only Level 1A Single-look Complex Slant (SCS) products acquired along the descending orbit in Stripmap HIMAGE mode and HH polarization were evaluated. The spatial resolution of the images is of 2.14 m along the range and 2.07 along the azimuth. The main characteristics of the dataset are presented in Table 1.
The COSMO-SkyMed images were processed in SARscape software using the PS-InSAR method. This multi-temporal SAR technique is based on the identification of Permanent Scatterers (PS), which are defined as coherent radar signal reflectors, such as buildings, monuments, infrastructures, antennas, rocky outcrops, etc., and reduce atmospheric effects while increasing displacement accuracy.
The interferometric process was carried out performing the series of actions described below. The first step includes the connection graph, in which a master image was connected to all the images (slaves) to create the pairs (Figure 5). The slaves were then co-registered to the master for the interferogram generation. In this step, an oversampling of a factor 4 in range direction was applied to all the images and the topographic contribution of each interferogram was removed by using the 30 m ALOS-DEM provided by the Japanese Aerospace Exploration Agency (JAXA). The PSs identification was carried out in the first inversion by considering the Amplitude Dispersion Index (ADI), which is defined as the ratio between the standard deviation and the mean of the amplitude values of a pixel [21]. Moreover, during the first inversion, a linear velocity model was applied to estimate residual height and displacement velocity. In the second inversion, the atmospheric phase component was estimated and filtered by using both high-pass and low-pass filters. The last step is the geocoding, in which the PSs with coherence below 0.70 were discarded and the interferometric products were geocoded in WGS 84 coordinate system.

3. Results

3.1. Results of Onsite Monitoring System

As previously described, the static system of the tower, active for 2.5 years between 2010 and 2013, is composed of three displacements transducers (PZ1 to PZ6) installed on representative cracks in the lower part of the tower; one inclinometer to control the displacement of the tower’s top in two in-plane orthogonal directions (IN1 and IN2); strain gauges (ST1 to ST6) on the existing metal ties; and six thermocouples (T1 to T6). In the scope of this paper, only the inclinometers are considered for further discussions. The structural conditions of the tower remained relatively stable during the first 1.5 years of monitoring, partly thanks to the provisional interventions implemented immediately after the earthquake. As showed in Figure 6, until the first few months of 2012 a cyclic behavior could be recognized, which was strictly correlated to the change of environmental factors (temperature, relative humidity), but accumulation of damage was apparently not detected. The equilibrium conditions of the tower changed significantly in February–March 2012 due to a rotation/displacement of the tower toward the palace, as measured by the inclinometer. After the peak event, displacements tended to slow down and then continued with a smaller magnitude. At the end of the monitoring period, the south–north translation of the top of the tower (IN01—cyan) was quantified in about 15 mm, whereas the east–west translation recorded (IN02—violet) was about 8 mm. Both displacements corresponded to a narrowing of the crack between the tower and the palace.
The reason for this rapid change in the equilibrium condition, likely resulting from a worsening of the damage pattern, is not easy to assess considering the numerous factors affecting the structural behavior, e.g., wind load, restoration works and human activities, including an intensification of the seismic activity affecting the area, which during the reference period (i.e., February–March 2012) had a significant number of events (http://cnt.rm.ingv.it/, last access on 10 February 2023), although characterized by a low magnitude, where all these factors acted on a previously heavily damaged structure.

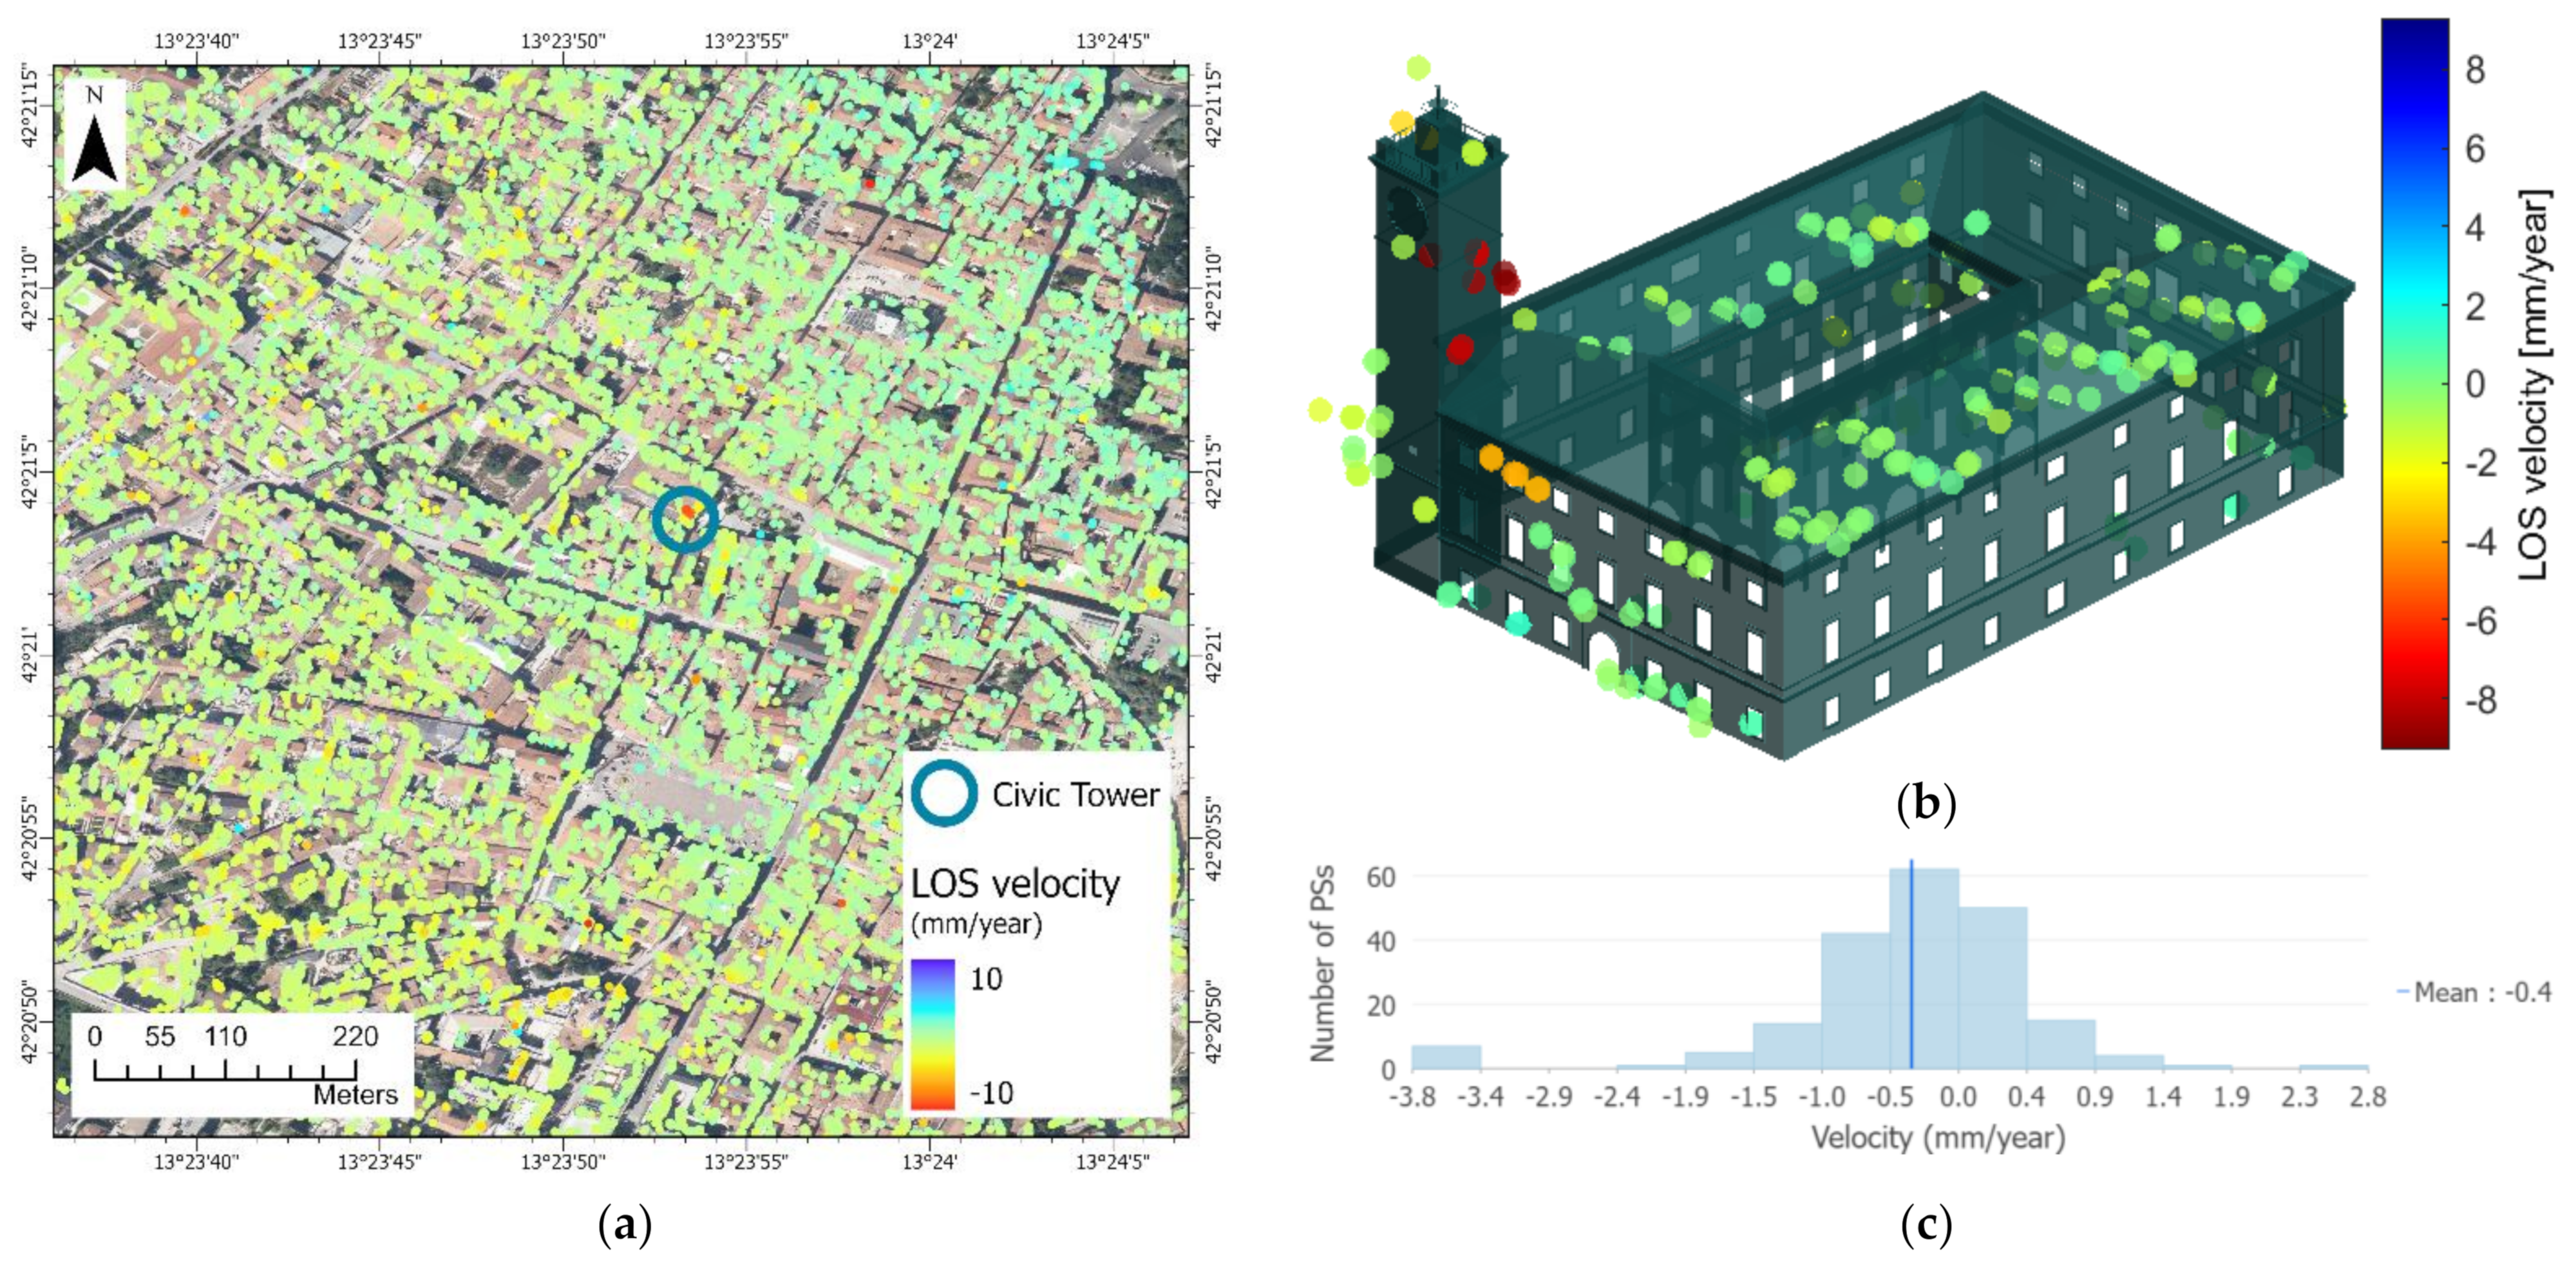
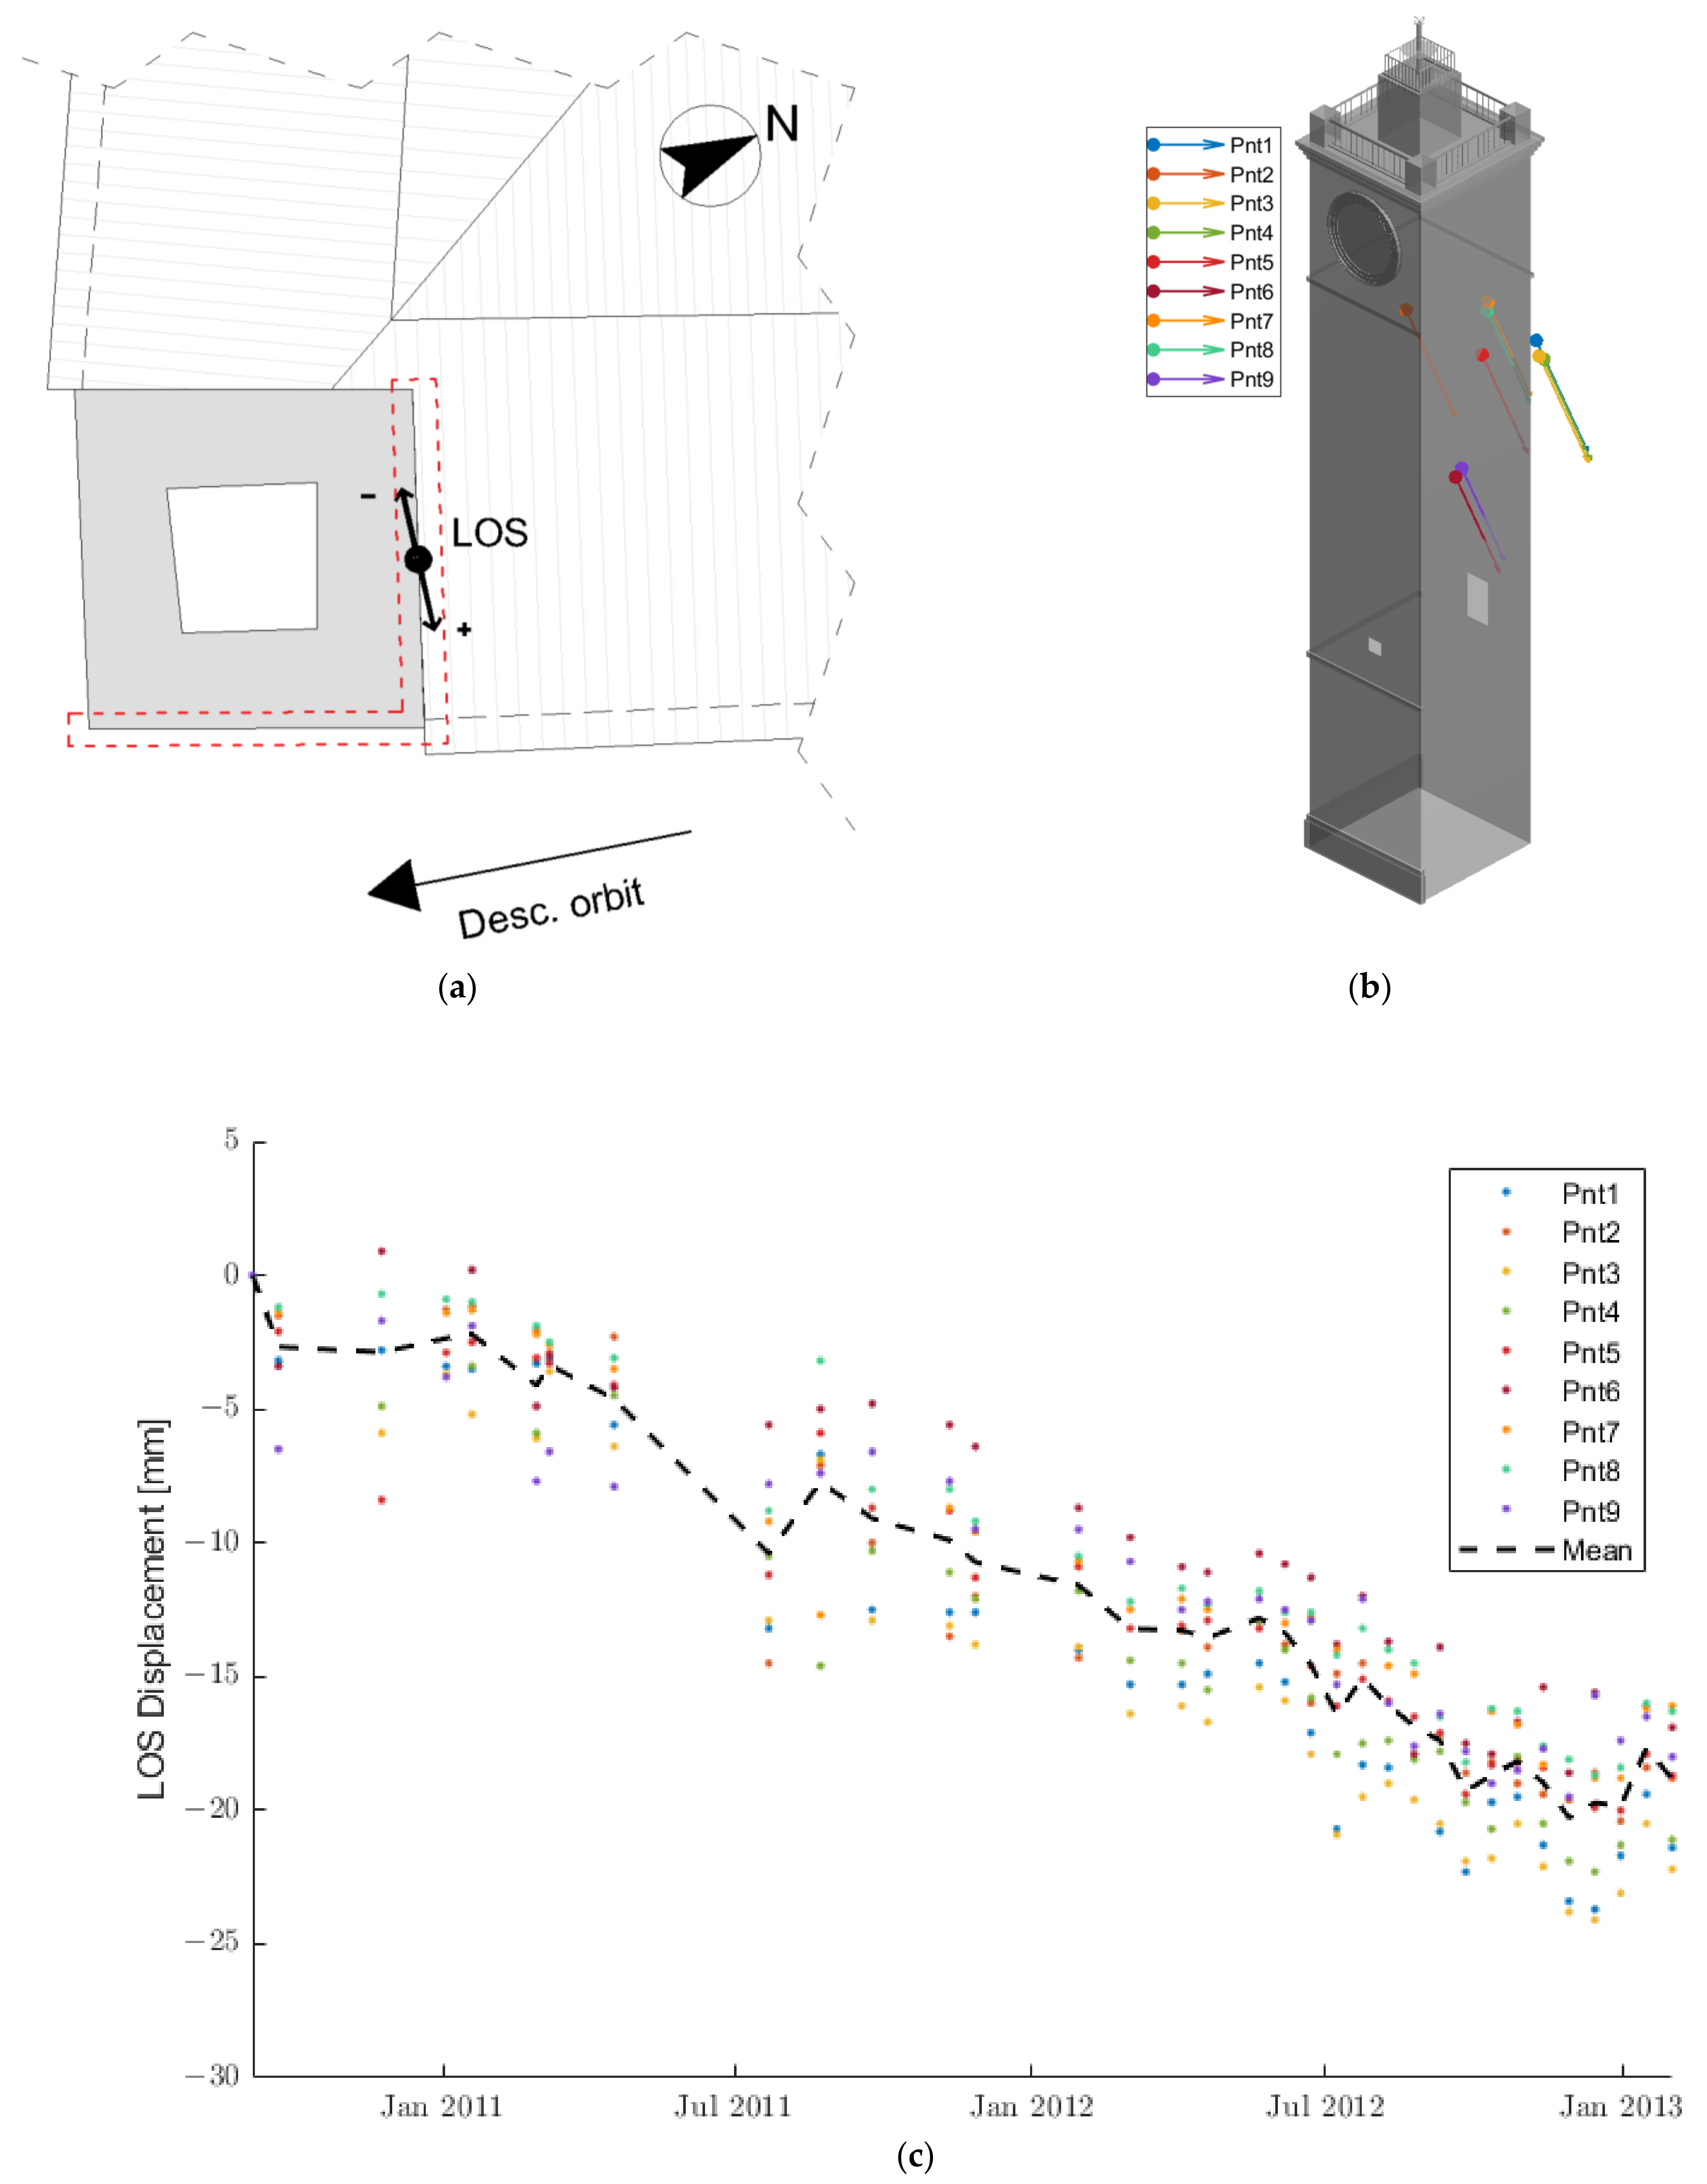
3.2. Results of MT-InSAR
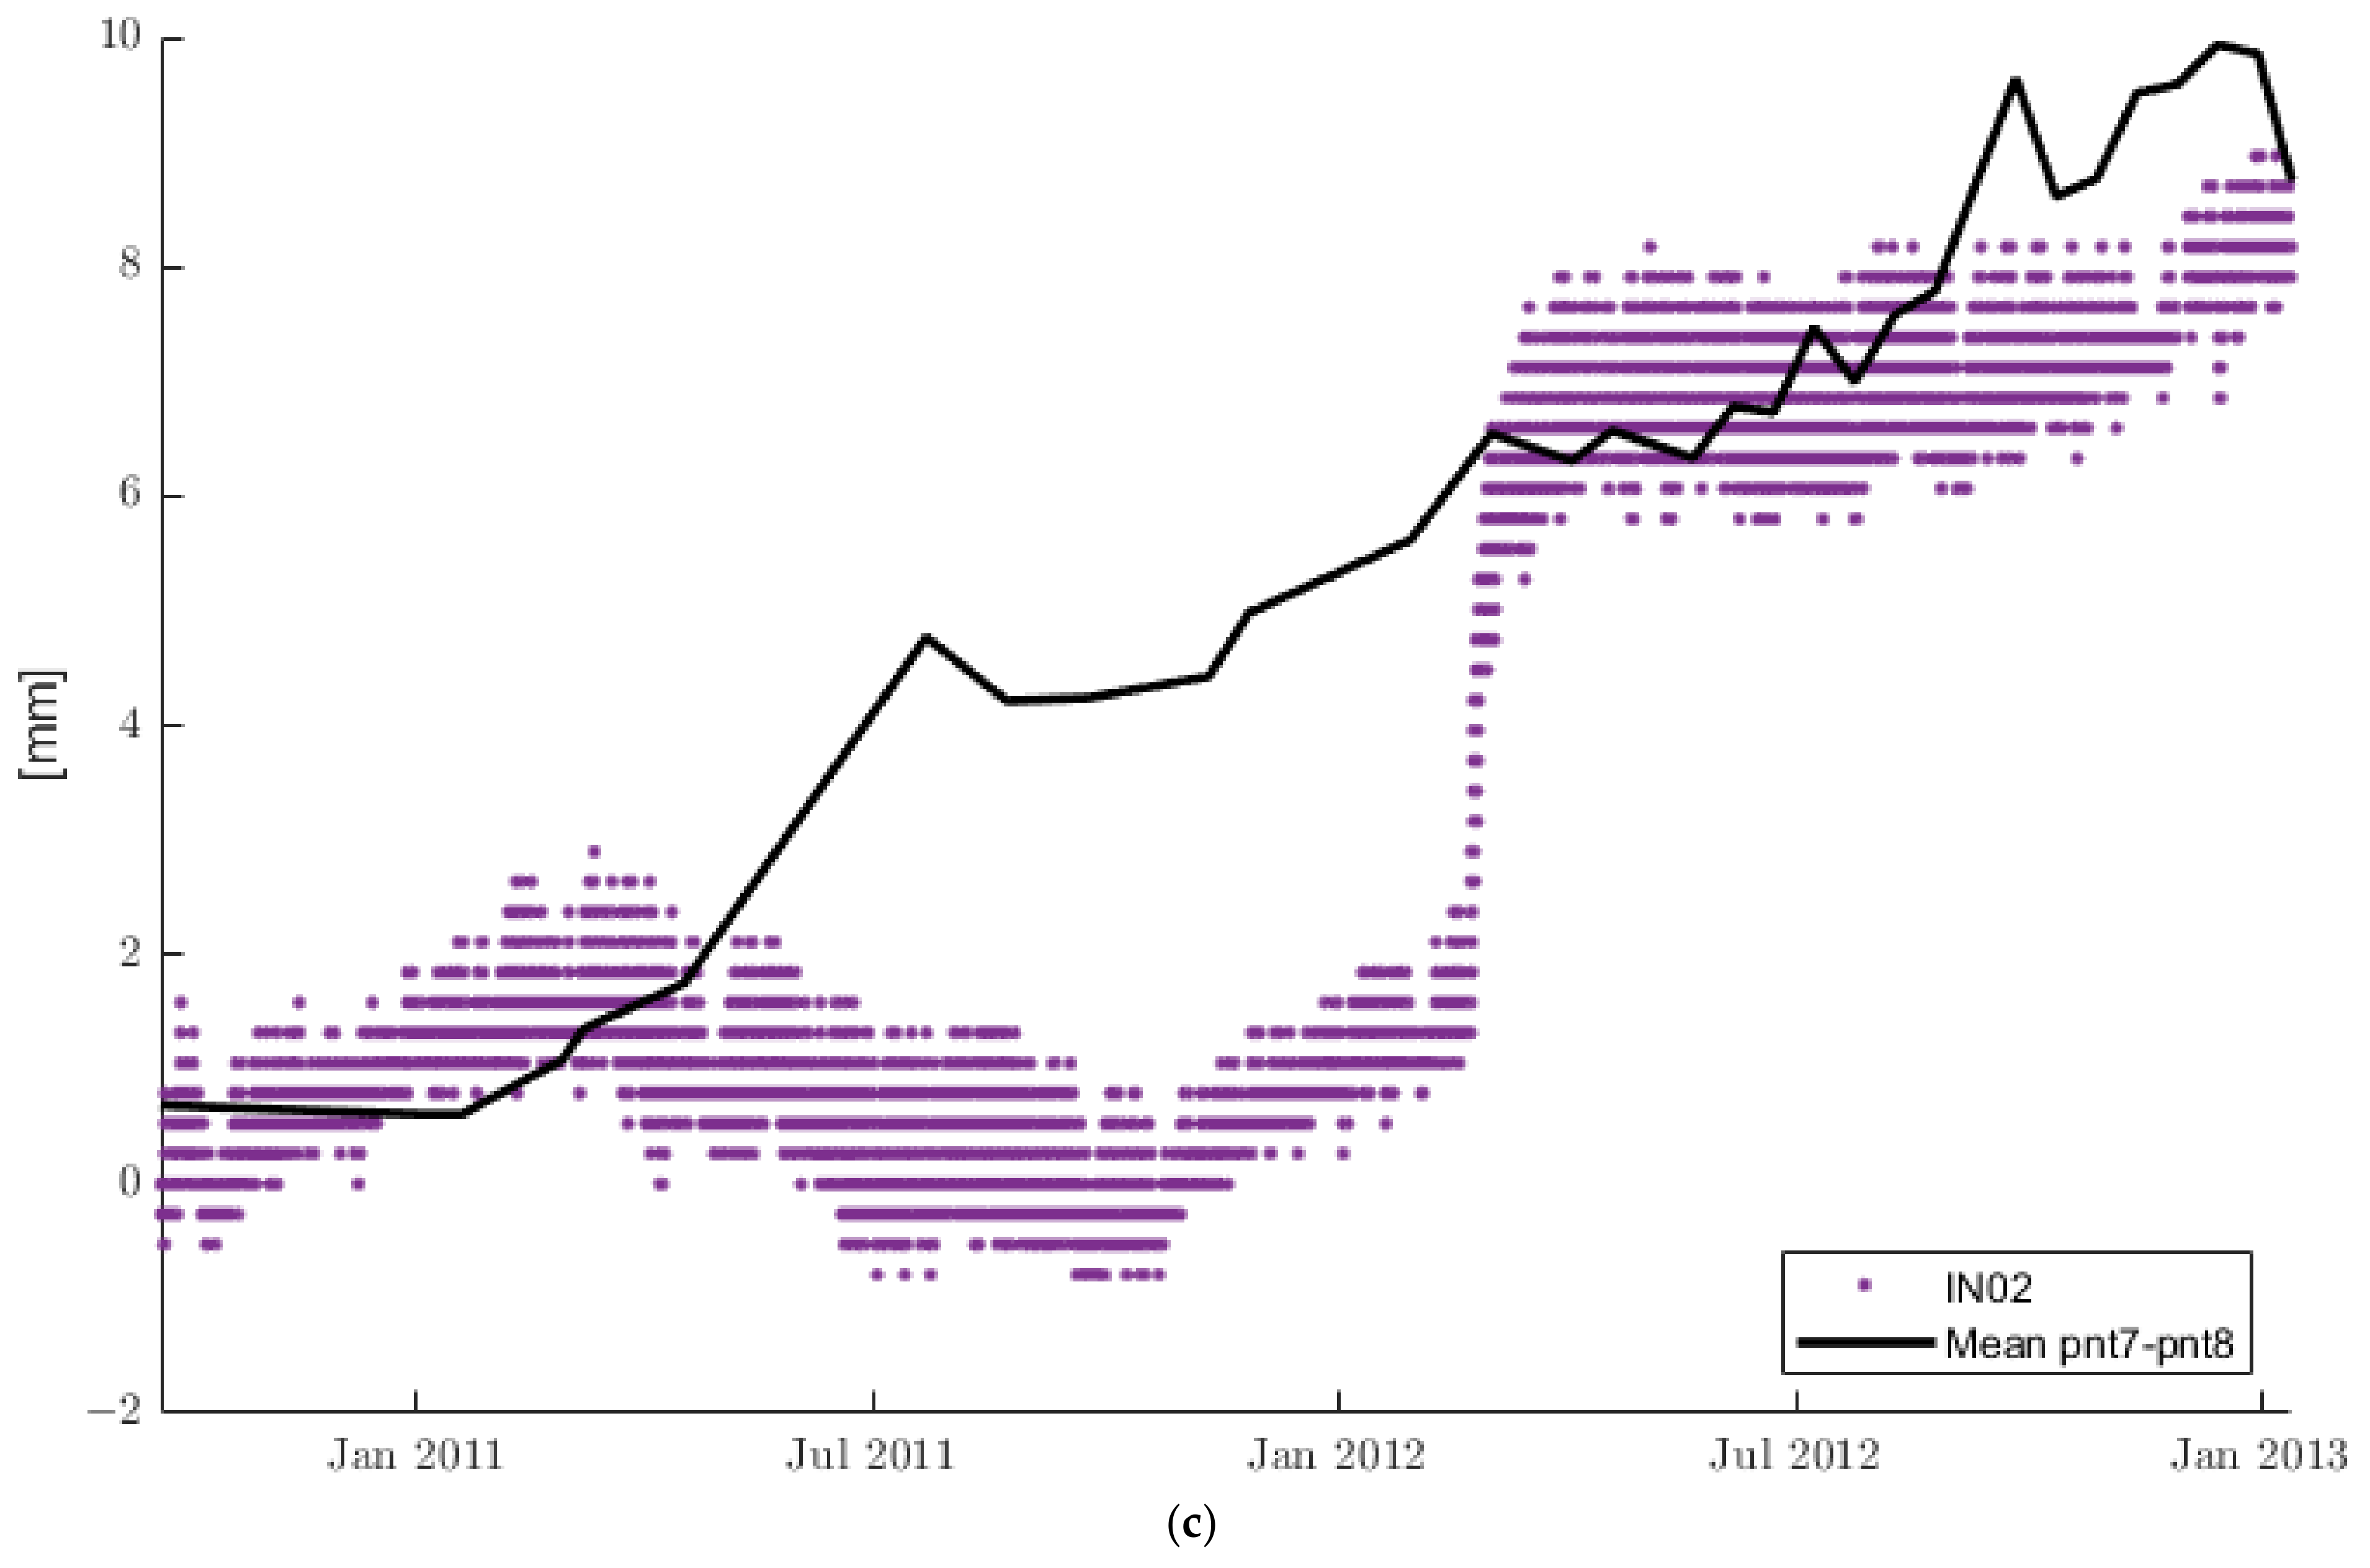
Considering the urban environment in which the study is conducted, the main scattering mechanism is expected to be the double-bounce [37]. This effect, due to the viewing geometry of the sensor, i.e., look angle and the high density of vertical structures [38], increases the intensity of the back-scattered signal and, thus, increases the availability of stable pixels and the detection of PSs also along vertical walls.
A density of about 45,000 PSs/km2 is detected in the city center. The spatial distribution of the PSs is constant along the azimuth direction, with a mean distance between the PSs equal to the pixel dimension, whereas the distribution of PSs along the range direction, due to the above-mentioned oversampling applied during the interferometric process, varies, with a maximum distance equal to two times the pixel dimension.
Figure 7a depicts the velocity map of L’Aquila’s city center, which is derived from the MT-InSAR analysis of the COSMO-SkyMed descending orbit. The displacement rate along the satellite LOS ranged between −10 and 10 mm/yr. Negative values (yellow to red) indicate targets moving away from the satellite, whereas positive values (cyan to blue) show points moving towards the satellite; stable points are marked in green. A preliminary interpretation of the velocity highlights that the city center seemed to remain generally steady except for a few small clusters, including one in proximity of the Civic Tower. Considering that the dataset analyzed in this work examines the post-earthquake period, it is possible to affirm that most of the detected clusters could involve structures damaged during the event that are subsequently undergoing further deterioration. The PS candidates superimposed over the render model clearly reveal that Palazzo Margherita was stable (green color) (Figure 7b). This is supported by the frequency distribution of the PSs in Figure 7c, in which the points along the Civic Tower are not included; indeed, most of the points were in the range −1.5/+1.5 mm/yr, which is considered as the relatively stable range. A cluster of nine red PSs in the upper part of the tower points out a velocity displacement between −9.3 and −7.7 mm/yr (Figure 7b). Four stable points are detected on the top of the tower. However, their behavior is considered anomalous, since they are isolated and they are likely referred to as non-structural elements installed on the last level; thus, they are labelled as outliers and are not included in the following discussion.
The main walls that backscattered the signal along the LOS are highlighted by the red dashed line in Figure 8a. Figure 8b shows that eight of the nine points were located along the northern side of the tower and one along the eastern side. Moreover, in Figure 8b, the displacement rate and direction of each point are displayed. The sizes of the arrows, propoportional to the entity of the phenomenon, are similar, indicating that the behaviour of the analysed points was consistent. Indeed, all the PSs points had a negative value, which demonstrates a movement of the target away from the satellite. The displacement time series for each point are plotted in Figure 8c, which highlights the negative trend over the time. At the end of the monitoring period, a mean displacement of about −19 mm was cumulated (black dashed line).

4. Discussion

The obtained results show that the PSI technique may be an effective tool for the monitoring of displacement/rotation of slender structures. However, some technical issues should be pointed out. First, particular attention should be paid to the location of the measurement points and the direction in which the measures are recorded. In the case of physical sensors, such as inclinometers, measures are acquired only along the main axes of the instrument and refer to the exact location in which the sensor is installed. In MT-InSAR, the measurement points detected have a higher density, but a positioning error along the three spatial coordinates (east–west, south–north and vertical height) must be taken into account (e.g., for PSI processing with CSK acquisitions, the positioning error is about 1–3 m [39]), which could be reduced introducing a well-known reference point on the ground (e.g., GPS or corner reflector), whereas the direction of the measurement is along the satellite LOS (e.g., for CSK, the LOS incidence angle is about 79 degrees counterclockwise on the azimuth direction and 33 degrees on the vertical direction). Furthermore, various criteria influence the location of the measurement spots (i.e., the reflectivity of the object, the orbital geometry and the properties of the radar sensors). As a result, the location of MPs cannot be predicted in advance, unlike on-site monitoring in which sensors are set at relevant positions.
Due to the nearly polar orbit of satellites and to the perpendicular direction of the LOS, the MT-InSAR technique is not suitable in the case of south–north movements. Any component of deformation oriented along the satellite path will not produce motion towards or away from the satellite LOS, and thus, as the angle between the satellite path and the IN01 axes tends to zero, the sensitivity of the InSAR measurement to movement in this direction is hardly quantifiable.
In terms of precision, measures acquired by physical sensors can reach a submillimeter precision, whereas MT-InSAR can achieve an accuracy of 5 mm for the single measurement and 1 mm/year for the average displacement velocity [39,40,41].
Another issue is related to the sampling frequency; physical sensors have a very high rate of acquisition (up to one sample per second for static sensors and several samples per second for dynamic sensors), whereas the SAR sampling frequency is strictly related to the satellite revisit time, which in the case of the COSMO-SkyMed satellite is usually quantifiable around 16 days, but it is often not constant over time. For this reason, rapid deformation trends could not be easily detected with MT-InSAR. The main properties of both acquisition systems are presented in Table 2.
To better clarify the aforementioned issues, Figure 9a shows the vertical SAR acquisition geometry, while in Figure 9b the location and the direction of measures for both the physical sensor and InSAR in the horizontal plane are presented. The green dot indicates the location in which the physical sensor is installed and measures are recorded. The direction of the acquisition is delineated by the axes of the instruments (cyan for IN01 and violet for IN02). The red dashed line shows the main sides in which the MPs are detected by the MT-InSAR technique, and the black dashed line indicates the projection of the LOS in the horizontal plane. It is possible to notice that IN01 refers to a nearly south–north direction that cannot be detected by the SAR, while the IN02 axis and LOS projection have a difference in the orientation of 13.62 degrees. Since the deformation along IN01 is hardly measurable by the SAR sensor due the almost polar direction, only IN02 has been used for a direct comparison with the InSAR recorded measurement. Thus, it is possible to estimate the LOS displacement component along the IN02 direction as Equation (1):
d projected = d LOS sin θ cos 90 γ α
where d projected is the projection of LOS displacement along the IN02 axes, d LOS is the recorded displacement along the LOS, θ is the angle between the LOS and the vertical direction, γ , is the angle between the IN02 axis and the north direction and α is the angle between the orbit path and the north direction. Equation (1) was used to obtain the projected time series of the mean displacement recorded for measurement points 7 and 8, located at the same level of the inclinometers (Figure 9c). The figure shows that the trends are well correlated in the initial and final part of the observation period, whereas a deviation can be detected in the middle part (from March 2011 to April 2012). The reason for this discrepancy is not easy to assess and it could be affected by several factors. First it should be considered that during the InSAR analysis a linear model has been adopted, thus highly non-linear behaviors like the one present in this case study are hardly detected. In fact, most PS algorithms presented in the literature implement only the linear model behavior. Moreover, the discrepancy is heightened by the low satellite revisit time, since in the case of images being too far apart in time, sudden changes in the behavior are underestimated. Indeed, during the diverging period, in addition to the rapid change in behavior already reported, the available images are sparse as the satellite revisit time increases to an average of 49 days.
Finally, the absolute value of the correlation coefficient is calculated as in Equation (2), where PR LOS is the time series LOS displacement projected along the INC02 axes, D IN 02 is the displacement time series recorded by the inclinometers, cov is the covariance between the two time series and σ is the standard deviation. Considering the entire monitoring period, the correlation coefficient value is 0.86, underling a strong degree of correlation although the low amount of data available may negatively affect the reliability of this value.
R PR LOS , D IN 02 = cov ( PR LOS , D IN 02 ) σ PR LOS σ D IN 02
The outcomes presented in this work enrich the knowledge of the potential of MT-InSAR for structural purposes. The application of MT-InSAR at regional and urban scale is nowadays a well-established technique, as presented in several recent works [42,43,44,45], whereas little research has been conducted in this field aiming to exploit the huge potential of these techniques at single-building scale. The proper combination of on-site monitoring of local and single-building scale and high-resolution SAR sensors, such as COSMO-SkyMed, might help in refining MT-InSAR analyses. For instance in [46], the installation of on-site monitoring system may support the results obtain with MT-InSAR analyses in the detection of building instabilities and anomalous deformations for the definition of the potential risks; whereas in [47], on-site measurement may strengthen the clustering process implemented to increase the reliability and the quality of the geopositioning of the MPs, obtaining a more reliable correspondence between MPs and the structural element which they refer to, for an easier interpretation of the results and the integration with other tools, such as Building Information Model (BIM).

5. Conclusions

In this paper, MT-InSAR outcomes have been compared/calibrated with on-site measurements acquired for the structural health monitoring of the Civic Tower in L’Aquila after the earthquake that occurred in 2009. In particular, the time period 2010–2013 has been investigated, integrating high-resolution COSMO-SkyMed images, which were processed by PS-InSAR algorithm, with displacement information provided by the inclinometers installed in the upper part of the tower in the post-earthquake phase.
MT-InSAR analysis allows the portion of the tower affected by displacement/rotation to be deteced, the direction of the movement to be extracted and the displacement rate along the LOS to be quantified with a high point density. On the other hand, physical sensors identify direction and rate of displacement along the axes with better accuracy, high sampling frequency and a reduced positioning error of the PSs. The obtained results show that displacement detected by MT-InSAR, despite the limitations listed in the discussion section (i.e., acquisition of the movement direction, the sampling frequency and limits to the SAR technique, such as orbits availability), was consistent with the measurement recorded by on-site inclinometers, providing a successful achievement of the analysis of slender buildings; in fact, the value of the correlation coefficient between the time series is 0.86. In conclusion, deformative trends detected by InSAR still need on-site validation because of sensors’ technical limitations that do not allow results to be obtained that are qualitatively and quantitatively fully reliable. On the other hand, the usefulness of MT-InSAR as a preliminary monitoring tool is undoubted.
In the future, this methodology will be applied for monitoring the deformations of similar structures. However, in order to properly characterize the typical behavior of buildings (e.g., non-linear movement), a higher and more constant revisit time is required. This work also demonstrated, as in the case of relevant displacements that might characterize single structures undergoing significant deterioration processes, that the MT-InSAR technology can also successfully detect those cases from a preliminary and not detailed analysis of the displacement rate along the satellite LOS of an entire urban center. This was clearly shown by the velocity map of L’Aquila city center, where clusters of unstable points were correctly detected in the framework of many steady points. This process of identifying unstable structures within a complex urban environment could be more difficult in ordinary conditions, where damage processes in structures are generally characterized by slow increasing trends, but could be very effective in the case of post-earthquake scenarios, such as that of L’Aquila, where buildings are already severely damaged and they can more easily undergo faster or even sudden worsening. This conclusion suggests that the use of high-resolution SAR satellite images could be very successful during post-earthquake emergency phases to monitor large built areas, with a reduced effort, in order to detect anomalous trends and unstable conditions where prompt response, i.e., installation of more detailed measurement systems and/or timely intervention, is needed. This would greatly help a more feasible and effective management of the post-earthquake phases by the authorities in charge of it.
Considering the quite high correlation pointed out during the analysis, further developments of this study may involve the monitoring of the tower by means of MT-InSAR in the subsequent period (i.e., 2013–2022), and also the use of InSAR algorithms specific for the detection of non-linear behaviors.

Author Contributions

Conceptualization, A.C. and S.P.; methodology, A.C. and S.P.; validation, F.L., M.F. and F.d.P.; formal analysis, A.C. and S.P.; writing—original draft preparation, A.C. and S.P.; writing—review and editing, F.L., M.F. and F.d.P.; supervision, M.F. and F.d.P. All authors have read and agreed to the published version of the manuscript.

Funding

This research was carried out and partially funded in the framework of the research project DPC-RELUIS 2022–2024 WP6 “Structural Health Monitoring and Satellite Data”. This work was also partially funded by the University of Padova under the World Class Research Infrastructures (WCRI) program—SYCURY “SYnergic strategies for CUltural Heritage at RIsk”.

Data Availability Statement

All the resulting data are contained in this article.

Acknowledgments

Project was carried out using COSMO-SkyMed Products, © of the Italian Space Agency (ASI), delivered under a license to use by ASI. We also acknowledge Sarmap sa team for their support during the analysis.

Conflicts of Interest

The authors declare no conflict of interest.

References

  1. Saisi, A.; Gentile, C.; Guidobaldi, M. Post-Earthquake Continuous Dynamic Monitoring of the Gabbia Tower in Mantua, Italy. Constr. Build. Mater. 2015, 81, 101–112. [Google Scholar] [CrossRef]
  2. Farrar, C.R.; Worden, K. An Introduction to Structural Health Monitoring. Philos. Trans. R. Soc. A Math. Phys. Eng. Sci. 2007, 365, 303–315. [Google Scholar] [CrossRef] [PubMed]
  3. De Stefano, A.; Matta, E.; Clemente, P. Structural Health Monitoring of Historical Heritage in Italy: Some Relevant Experiences. J. Civ. Struct. Health Monit. 2016, 6, 83–106. [Google Scholar] [CrossRef]
  4. Lorenzoni, F.; Casarin, F.; Caldon, M.; Islami, K.; Modena, C. Uncertainty Quantification in Structural Health Monitoring: Applications on Cultural Heritage Buildings. Mech. Syst. Signal Process. 2016, 66–67, 268–281. [Google Scholar] [CrossRef]
  5. Lorenzoni, F.; Casarin, F.; Modena, C.; Caldon, M.; Islami, K.; da Porto, F. Structural Health Monitoring of the Roman Arena of Verona, Italy. J. Civ. Struct. Health Monit. 2013, 3, 227–246. [Google Scholar] [CrossRef]
  6. Potenza, F.; Federici, F.; Lepidi, M.; Gattulli, V.; Graziosi, F.; Colarieti, A. Long-Term Structural Monitoring of the Damaged Basilica S. Maria Di Collemaggio through a Low-Cost Wireless Sensor Network. J. Civ. Struct. Health Monit. 2015, 5, 655–676. [Google Scholar] [CrossRef]
  7. Ramos, L.F.; Marques, L.; Lourenço, P.B.; De Roeck, G.; Campos-Costa, A.; Roque, J. Monitoring Historical Masonry Structures with Operational Modal Analysis: Two Case Studies. Mech. Syst. Signal Process. 2010, 24, 1291–1305. [Google Scholar] [CrossRef] [Green Version]
  8. Ostachowicz, W.; Soman, R.; Malinowski, P. Optimization of Sensor Placement for Structural Health Monitoring: A Review. Struct. Health Monit. 2019, 18, 963–988. [Google Scholar] [CrossRef]
  9. UNI Ente Italiano di Normazione. UNI/TR 11634: Linee Guida per il Monitoraggio Strutturale; UNI Ente Italiano di Normazione: Milano, Italy, 2016. [Google Scholar]
  10. Yi, T.-H.; Li, H.-N.; Gu, M. Optimal Sensor Placement for Structural Health Monitoring Based on Multiple Optimization Strategies. Struct. Des. Tall Spec. Build. 2011, 20, 881–900. [Google Scholar] [CrossRef]
  11. Cigna, F.; Lasaponara, R.; Masini, N.; Milillo, P.; Tapete, D. Persistent Scatterer Interferometry Processing of COSMO-SkyMed StripMap HIMAGE Time Series to Depict Deformation of the Historic Centre of Rome, Italy. Remote Sens. 2014, 6, 12593–12618. [Google Scholar] [CrossRef] [Green Version]
  12. Selvakumaran, S.; Plank, S.; Geiß, C.; Rossi, C.; Middleton, C. Remote Monitoring to Predict Bridge Scour Failure Using Interferometric Synthetic Aperture Radar (InSAR) Stacking Techniques. Int. J. Appl. Earth Obs. Geoinf. 2018, 73, 463–470. [Google Scholar] [CrossRef]
  13. Floris, M.; Fontana, A.; Tessari, G.; Mulè, M. Subsidence Zonation Through Satellite Interferometry in Coastal Plain Environments of NE Italy: A Possible Tool for Geological and Geomorphological Mapping in Urban Areas. Remote Sens. 2019, 11, 165. [Google Scholar] [CrossRef] [Green Version]
  14. Xiong, S.; Wang, C.; Qin, X.; Zhang, B.; Li, Q. Time-Series Analysis on Persistent Scatter-Interferometric Synthetic Aperture Radar (PS-InSAR) Derived Displacements of the Hong Kong–Zhuhai–Macao Bridge (HZMB) from Sentinel-1A Observations. Remote Sens. 2021, 13, 546. [Google Scholar] [CrossRef]
  15. Zeni, G.; Bonano, M.; Casu, F.; Manunta, M.; Manzo, M.; Marsella, M.; Pepe, A.; Lanari, R. Long-Term Deformation Analysis of Historical Buildings through the Advanced SBAS-DInSAR Technique: The Case Study of the City of Rome, Italy. J. Geophys. Eng. 2011, 8, S1–S12. [Google Scholar] [CrossRef]
  16. Tapete, D.; Cigna, F. Rapid Mapping and Deformation Analysis over Cultural Heritage and Rural Sites Based on Persistent Scatterer Interferometry. Int. J. Geophys. 2012, 2012, 618609. [Google Scholar] [CrossRef] [Green Version]
  17. Tang, P.; Chen, F.; Zhu, X.; Zhou, W. Monitoring Cultural Heritage Sites with Advanced Multi-Temporal InSAR Technique: The Case Study of the Summer Palace. Remote Sens. 2016, 8, 432. [Google Scholar] [CrossRef] [Green Version]
  18. Macchiarulo, V.; Giardina, G.; Milillo, P.; González Martí, J.; Sánchez, J.; DeJong, M.J. Settlement-Induced Building Damage Assessment Using MT-Insar Data for the Crossrail Case Study in London. In Proceedings of the International Conference on Smart Infrastructure and Construction 2019 (ICSIC), Cambridge, UK, 8–10 July 2019; ICE Publishing: Cambridge, UK, January 2019; pp. 721–727. [Google Scholar]
  19. Luo, L.; Wang, X.; Guo, H.; Lasaponara, R.; Zong, X.; Masini, N.; Wang, G.; Shi, P.; Khatteli, H.; Chen, F.; et al. Airborne and Spaceborne Remote Sensing for Archaeological and Cultural Heritage Applications: A Review of the Century (1907–2017). Remote Sens. Environ. 2019, 232, 111280. [Google Scholar] [CrossRef]
  20. Necula, N.; Niculiță, M.; Fiaschi, S.; Genevois, R.; Riccardi, P.; Floris, M. Assessing Urban Landslide Dynamics through Multi-Temporal InSAR Techniques and Slope Numerical Modeling. Remote Sens. 2021, 13, 3862. [Google Scholar] [CrossRef]
  21. Ferretti, A.; Prati, C.; Rocca, F. Permanent Scatters in SAR Interferometry. IEEE Trans. Geosci. Remote Sens. 2001, 39, 8–20. [Google Scholar] [CrossRef]
  22. Crosetto, M.; Monserrat, O.; Cuevas-González, M.; Devanthéry, N.; Crippa, B. Persistent Scatterer Interferometry: A Review. ISPRS J. Photogramm. Remote Sens. 2016, 115, 78–89. [Google Scholar] [CrossRef] [Green Version]
  23. Infante, D.; Martire, D.D.; Confuorto, P.; Ramondini, M.; Calcaterra, D.; Tomàs, R.; Duro, J.; Centolanza, G. Multi-Temporal Assessment of Building Damage on a Landslide-Affected Area by Interferometric Data. In Proceedings of the 2017 IEEE 3rd International Forum on Research and Technologies for Society and Industry (RTSI), Modena, Italy, 11–13 September 2017; pp. 1–6. [Google Scholar]
  24. Del Soldato, M.; Solari, L.; Poggi, F.; Raspini, F.; Tomás, R.; Fanti, R.; Casagli, N. Landslide-Induced Damage Probability Estimation Coupling InSAR and Field Survey Data by Fragility Curves. Remote Sens. 2019, 11, 1486. [Google Scholar] [CrossRef] [Green Version]
  25. Bianchini, S.; Ciampalini, A.; Raspini, F.; Bardi, F.; Di Traglia, F.; Moretti, S.; Casagli, N. Multi-Temporal Evaluation of Landslide Movements and Impacts on Buildings in San Fratello (Italy) By Means of C-Band and X-Band PSI Data. Pure Appl. Geophys. 2015, 172, 3043–3065. [Google Scholar] [CrossRef] [Green Version]
  26. Peduto, D.; Nicodemo, G.; Cuevas-Gonzáles, M.; Crosetto, M. Analysis of Damage to Buildings in Urban Centers on Unstable Slopes via TerraSAR-X PSI Data: The Case Study of El Papiol Town (Spain). IEEE Geosci. Remote Sens. Lett. 2019, 16, 1706–1710. [Google Scholar] [CrossRef]
  27. Fabris, M.; Battaglia, M.; Chen, X.; Menin, A.; Monego, M.; Floris, M. An Integrated InSAR and GNSS Approach to Monitor Land Subsidence in the Po River Delta (Italy). Remote Sens. 2022, 14, 5578. [Google Scholar] [CrossRef]
  28. Selvakumaran, S.; Rossi, C.; Marinoni, A.; Webb, G.; Bennetts, J.; Barton, E.; Plank, S.; Middleton, C. Combined InSAR and Terrestrial Structural Monitoring of Bridges. IEEE Trans. Geosci. Remote Sens. 2020, 58, 7141–7153. [Google Scholar] [CrossRef]
  29. Heleno, S.I.N.; Oliveira, L.G.S.; Henriques, M.J.; Falcão, A.P.; Lima, J.N.P.; Cooksley, G.; Ferretti, A.; Fonseca, A.M.; Lobo-Ferreira, J.P.; Fonseca, J.F.B.D. Persistent Scatterers Interferometry Detects and Measures Ground Subsidence in Lisbon. Remote Sens. Environ. 2011, 115, 2152–2167. [Google Scholar] [CrossRef] [Green Version]
  30. Cavalagli, N.; Kita, A.; Falco, S.; Trillo, F.; Costantini, M.; Ubertini, F. Satellite Radar Interferometry and In-Situ Measurements for Static Monitoring of Historical Monuments: The Case of Gubbio, Italy. Remote Sens. Environ. 2019, 235, 111453. [Google Scholar] [CrossRef]
  31. Caprino, A.; Bonaldo, G.; Lorenzoni, F.; da Porto, F. Application of Multi-Temporal InSAR (MT-InSAR) for Structural Monitoring: The Case Study of Scrovegni Chapel in Padova. Procedia Struct. Integr. 2023, 44, 1578–1585. [Google Scholar] [CrossRef]
  32. Masi, A. Prime Riflessioni Sull’Esperienza Del Terremoto in Abruzzo; Consiglio Nazionale del Ingegneri: Rome, Italy, 2009. [Google Scholar]
  33. Modena, C.; Casarin, F.; da Porto, F.; Munari, M. L’Aquila 6th April 2009 Earthquake: Emergency and Post-Emergency Activities on Cultural Heritage Buildings. In Earthquake Engineering in Europe; Garevski, M., Ansal, A., Eds.; Springer: Dordrecht, The Netherlands, 2010; pp. 495–521. ISBN 978-90-481-9544-2. [Google Scholar]
  34. D’Ayala, D.F.; Paganoni, S. Assessment and Analysis of Damage in L’Aquila Historic City Centre after 6th April 2009. Bull. Earthq. Eng. 2011, 9, 81–104. [Google Scholar] [CrossRef]
  35. Lorenzoni, F.; Caldon, M.; da Porto, F.; Modena, C.; Aoki, T. Post-Earthquake Controls and Damage Detection through Structural Health Monitoring: Applications in l’Aquila. J. Civ. Struct. Health Monit. 2018, 8, 217–236. [Google Scholar] [CrossRef]
  36. Covello, F.; Battazza, F.; Coletta, A.; Lopinto, E.; Fiorentino, C.; Pietranera, L.; Valentini, G.; Zoffoli, S. COSMO-SkyMed an Existing Opportunity for Observing the Earth. J. Geodyn. 2010, 49, 171–180. [Google Scholar] [CrossRef] [Green Version]
  37. Delgado Blasco, J.M.; Fitrzyk, M.; Patruno, J.; Ruiz-Armenteros, A.M.; Marconcini, M. Effects on the Double Bounce Detection in Urban Areas Based on SAR Polarimetric Characteristics. Remote Sens. 2020, 12, 1187. [Google Scholar] [CrossRef] [Green Version]
  38. Franceschetti, G.; Iodice, A.; Riccio, D. A Canonical Problem in Electromagnetic Backscattering from Buildings. IEEE Trans. Geosci. Remote Sens. 2002, 40, 1787–1801. [Google Scholar] [CrossRef]
  39. Wasowski, J.; Bovenga, F. Investigating Landslides and Unstable Slopes with Satellite Multi Temporal Interferometry: Current Issues and Future Perspectives. Eng. Geol. 2014, 174, 103–138. [Google Scholar] [CrossRef]
  40. Ferretti, A.; Savio, G.; Barzaghi, R.; Borghi, A.; Musazzi, S.; Novali, F.; Prati, C.; Rocca, F. Submillimeter Accuracy of InSAR Time Series: Experimental Validation. IEEE Trans. Geosci. Remote Sens. 2007, 45, 1142–1153. [Google Scholar] [CrossRef]
  41. Bovenga, F.; Nitti, D.O.; Fornaro, G.; Radicioni, F.; Stoppini, A.; Brigante, R. Using C/X-Band SAR Interferometry and GNSS Measurements for the Assisi Landslide Analysis. Int. J. Remote Sens. 2013, 34, 4083–4104. [Google Scholar] [CrossRef]
  42. Cigna, F.; Tapete, D. Present-Day Land Subsidence Rates, Surface Faulting Hazard and Risk in Mexico City with 2014–2020 Sentinel-1 IW InSAR. Remote Sens. Environ. 2021, 253, 112161. [Google Scholar] [CrossRef]
  43. Confuorto, P.; Del Soldato, M.; Solari, L.; Festa, D.; Bianchini, S.; Raspini, F.; Casagli, N. Sentinel-1-Based Monitoring Services at Regional Scale in Italy: State of the Art and Main Findings. Int. J. Appl. Earth Obs. Geoinf. 2021, 102, 102448. [Google Scholar] [CrossRef]
  44. Crosetto, M.; Solari, L.; Balasis-Levinsen, J.; Bateson, L.; Casagli, N.; Frei, M.; Oyen, A.; Moldestad, D.A.; Mróz, M. Deformation monitoring at european scale: The copernicus ground motion service. Int. Arch. Photogramm. Remote Sens. Spat. Inf. Sci. 2021, XLIII-B3-2021, 141–146. [Google Scholar] [CrossRef]
  45. Barra, A.; Reyes-Carmona, C.; Herrera, G.; Galve, J.P.; Solari, L.; Mateos, R.M.; Azañón, J.M.; Béjar-Pizarro, M.; López-Vinielles, J.; Palamà, R.; et al. From Satellite Interferometry Displacements to Potential Damage Maps: A Tool for Risk Reduction and Urban Planning. Remote Sens. Environ. 2022, 282, 113294. [Google Scholar] [CrossRef]
  46. Zhu, M.; Wan, X.; Fei, B.; Qiao, Z.; Ge, C.; Minati, F.; Vecchioli, F.; Li, J.; Costantini, M. Detection of Building and Infrastructure Instabilities by Automatic Spatiotemporal Analysis of Satellite SAR Interferometry Measurements. Remote Sens. 2018, 10, 1816. [Google Scholar] [CrossRef] [Green Version]
  47. Schneider, P.J.; Soergel, U. Matching persistent scatterer clusters to building elements in mesh representation. ISPRS Ann. Photogramm. Remote Sens. Spat. Inf. Sci. 2022, 3, 123–130. [Google Scholar] [CrossRef]
Figure 1. Workflow of the followed procedure.
Remotesensing 15 01587 g001
Figure 2. Location of the study area.
Remotesensing 15 01587 g002
Figure 3. The structure of Palazzo Margherita (a) and the Civic Tower; 3D model (b). Crack pattern survey on the south (c) and east (d) side. Crack detected at the interface between the tower and the palace (e,f). Provisional interventions after the earthquake on the tower (g) and the palace (h).
Remotesensing 15 01587 g003
Figure 5. Connection graph of the descending orbit. The yellow dot identifies the master image, the green dots represent the slave images.
Remotesensing 15 01587 g005
Figure 6. Layout of the inclinometers (a). Displacement recorded by the inclinometers at the top of the tower (b).
Remotesensing 15 01587 g006
Figure 7. Overview of the LOS velocity (mm/year) derived from the PS-InSAR analysis for the city center of L’Aquila (a) and both Palazzo Margherita and the Civic Tower (b). Negative values range from yellow to red color, positive values from cyan to blue. The frequency distribution of the PSs over Palazzo Margherita, excluding the Civic Tower, is shown in (c).
Remotesensing 15 01587 g007
Figure 8. Sketch of the Civic Tower’s walls backscattering the radar signal to the satellite (a), distribution of the PSs along the tower’s height (b), displacement time series of each point (c).
Remotesensing 15 01587 g008
Figure 9. (a) Vertical SAR acquisition geometry, (b) in-plane acquisition geometry of both SAR and inclinometers, (c) mean time series of point 7 and point 8 projected along the IN02 axes.
Remotesensing 15 01587 g009aRemotesensing 15 01587 g009b
Table 1. Characteristics of the dataset.
COSMO-SkyMed (CSK)
No. of
Images
Data
Product
PolarizationAcquisition
Mode
OrbitStart DateEnd DateRevisit Time
34SCS_B
(L1A)
HHStripmapDescending5 September 20101 February 2013Min. 16 days
Table 2. Errors and characteristics of both acquisition systems in this case study.
InclinometersMT-InSAR
Number of MPs19
Error in the location of MPs0 m1–3 m
Direction of acquisitionsSensors’ axisLOS
Accuracy of measures<1 mm5 mm for single measurement, 1 mm/year for average displacement velocity
Sampling frequency30 minMinimum 16 days, average 26 days
Disclaimer/Publisher’s Note: The statements, opinions and data contained in all publications are solely those of the individual author(s) and contributor(s) and not of MDPI and/or the editor(s). MDPI and/or the editor(s) disclaim responsibility for any injury to people or property resulting from any ideas, methods, instructions or products referred to in the content.

