Article

Extraction and Analysis of Radar Scatterer Attributes for PAZ SAR by Combining Time Series InSAR, PolSAR, and Land Use Measurements

Faculty of Geo-Information Science and Earth Observation, University of Twente, 7511 AE Enschede, The Netherlands
*
Author to whom correspondence should be addressed.
Remote Sens. 2023, 15(6), 1571; https://doi.org/10.3390/rs15061571
Submission received: 1 January 2023 / Revised: 3 March 2023 / Accepted: 9 March 2023 / Published: 13 March 2023
(This article belongs to the Special Issue Advances in SAR: Sensors, Methodologies, and Applications II)

Abstract

:
Extracting meaningful attributes of radar scatterers from SAR images, PAZ in our case, facilitates a better understanding of SAR data and physical interpretation of deformation processes. The attribute categories and attribute extraction method are not yet thoroughly investigated. Therefore, this study recognizes three attribute categories: geometric, physical, and land-use attributes, and aims to design a new scheme to extract these attributes of every coherent radar scatterer. Specifically, we propose to obtain geometric information and its dynamics over time of the radar scatterers using time series InSAR (interferometric SAR) techniques, with SAR images in HH and VV separately. As all InSAR observations are relative in time and space, we convert the radar scatterers in HH and VV to a common reference system by applying a spatial reference alignment method. Regarding the physical attributes of the radar scatterers, we first employ a Random Forest classification method to categorize scatterers in terms of scattering mechanisms (including surface, low-, high-volume, and double bounce scattering), and then assign the scattering mechanism to every radar scatterer. We propose using a land-use product (i.e., TOP10NL data for our case) to create reliable labeled samples for training and validation. In addition, the radar scatterers can inherit land-use attributes from the TOP10NL data. We demonstrate this new scheme with 30 Spanish PAZ SAR images in HH and VV acquired between 2019 and 2021, covering an area in the province of Friesland, the Netherlands, and analyze the extracted attributes for data and deformation interpretation.

1. Introduction

Synthetic Aperture Radar (SAR) transmits its electromagnetic wave and then records the echo signal reflected back after interacting with the earth’s surface [1]. As the electromagnetic wave is synthetic, the orientation, particularly of the electric field vector, namely polarization, is predefined. For linear polarization, VV and VH polarization measure the proportion of vertically transmitted waves that return vertically and horizontally to the sensor, respectively. HH and HV polarization measure the proportion of horizontally transmitted waves that return horizontally and vertically. Using single-polarization SAR data, detecting, mapping, and monitoring surface movements with Interferometric SAR (InSAR) [2] and Time Series InSAR (TSInSAR) [3] can be realized [4,5,6,7,8,9]. Several SAR satellite missions possess multi-polarization channels. For instance, the PAZ X-band satellite operates in both co-polarimetric channels HH and VV [10,11], the Sentinel-1 C-band mission has either HH and HV or VV and VH [12], and the Radarsat-2 C-band and ALOS-1 and 2 L-band satellites have all four polarimetric channels [13,14]. When dual-polarimetric (HH and VV, VV and VH, or HH and HV), or quad-polarimetric (VV, VH, HH, and HV) data are available, land use and land cover (LULC) classification, and scatterers’ characterization using Polarimetric SAR (PolSAR) [15], and InSAR measurement augmentation [16] can be accomplished [17,18,19]. It is evident that both TSInSAR and PolSAR techniques have the unique merit of delivering useful information on surface targets from different perspectives. Note that surface targets are observed as radar scatterers in SAR imagery. Yet, the study on combining all information from TSInSAR and PolSAR to extract meaningful attributes of radar scatterers, to obtain a better insight into SAR data and geo-processes such as surface movements, when having dual- or quad-pol SAR data, is still limited.
Theoretically, TSInSAR can circumvent spatial and temporal decorrelation and atmospheric heterogeneity, and primarily deliver the geometric measurements, i.e., position and deformation of constantly and temporarily coherent radar scatterers [9,20,21,22,23,24]. An issue in the TSInSAR post processing, when integrating the deformations from SAR data with different polarizations, is the spatial reference misalignment. Usually the spatial reference point or area can be selected based on its (amplitude) stability over time [25] or ground truth data [26], then all InSAR measurements are with respect to this selected reference. In the case that the external measurements and ground truth data are unavailable, the reference error is introduced to all the InSAR measurements if this selected reference point or area is unstable in reality. Therefore, a robust spatial reference selection method that can be well suited for error mitigation at a global scale, should be developed.
The radar scatterer classification in terms of scattering mechanisms is one of the standard outputs of PolSAR data analysis. The scattering mechanisms, such as surface, volume, and double bounce scattering, represent the physical attributes of radar scatterers. The polarimetric SAR decomposition [27] and machine/deep learning [28,29] are the methods for PolSAR image classification. The importance of the polarimetric features that are used in machine/deep learning differs, and the step of creating labeled samples (i.e., a group of radar scatterers) for training and validation is vital [30]. Manually annotating the reference data mainly based on visual interpretation of SAR images is time-consuming and inaccurate sometimes. To improve the quality and efficiency of adding labels to data, particularly when having an external land-use data source, the methods for incorporating such data into labeled sample creation and assigning land-use attributes to radar scatterers need to be designed.
This paper is dedicated to addressing the issues raised above. In a nutshell, we propose and demonstrate appropriate methods and schemes by combining TSInSAR and PolSAR and land-use observations in order to extract meaningful attributes (i.e., geometric, physical, and land-use attributes) of radar scatterers in multi-pol SAR images, HH and VV PAZ SAR images for our case. This paper is organized as follows. Section 2 presents the methods of coherent radar scatterer selection, spatial reference selection, and radar scatterer classification in terms of scattering mechanisms, and land use attribute extraction based on a land use product (i.e., TOP10NL for our study), to extract radar scatterer attributes. Section 3 presents all data used and geographic information of the test site. The results of the test site are presented in Section 4, followed by discussion and conclusions in Section 5 and Section 6, respectively.

2. Methods

This section presents the methods to extract radar scatterer attributes. These attributes can be described from the geometric, physical, and land-use aspects. In other words, radar scatterer attributes can be categorized into geometric, physical, and land-use attributes. The flowchart for using co-polarimetric SAR data processing to extract these attributes is depicted in Figure 1, and detailed in the following subsections.

2.1. Geometric Attribute Extraction

The geometric attributes of radar scatterers contain the information of radar scatterers’ position and position change over time (i.e., deformation time series), which can be obtained from TSInSAR. The processing procedure is shown by the red arrows in Figure 1. Since TSInSAR provides this information merely for coherent radar scatterers, recognizing coherent radar scatterers is the first step of radar scatterers’ geometric attribute extraction.

2.1.1. Coherent Radar Scatterer Selection in Time Series InSAR

A standard hybrid time series InSAR (TSInSAR) approach provides the temporal measurements of InSAR measurement points (IMPs), i.e., constantly coherent radar scatterers (CCSs) and temporarily coherent radar scatterers (TCSs), embracing both pointwise and distributed scatterers, abbreviated to PSs and DSs. In practice, it can first parallelly run two TSInSAR processing schemes, the single-master single-look (i.e., PSI, persistent scatterer interferometry [3]) and equivalent single-master small-baseline with an adaptive filter, and then integrate all measurements from both schemes. Here, master and slave are two SAR images used for interferogram generation. The slave is co-registered to the master reference grid. A widely used method to select CCS and TCS candidates is defined as [3,21]
D A = σ A μ a , A [ a , Δ a ] ,
where D A is referred to as amplitude dispersion when A = a for pointwise CCS selection and amplitude difference dispersion when A = Δ a for TCS selection. a , μ a , σ a , Δ a , σ Δ a separately represent the SLC amplitude, mean value of amplitude time series, standard deviation of amplitude time series, amplitude difference between masters and slaves, and standard deviation of amplitude difference. After the pointwise CCS selection, the equivalent small-baseline phases for these pointwise CCSs are extracted from single-master single-look interferograms. Then, the small-baseline phases for CCSs and TCSs are aggregated and unwrapped using a conventional SBAS (small baseline subset) algorithm [31,32,33].

2.1.2. Spatial Reference Selection

InSAR measurements, i.e., deformations, are usually relative w.r.t. predefined spatial reference (point). Only when the spatial reference is aligned to an absolute geographic coordinate system using ground truth data such as GPS and leveling, can we obtain absolute InSAR measurements. The spatial reference can be either a single point or an area. A radar scatterer can be considered as a spatial reference point only when it is a constantly coherent radar scatterer with extremely low variation in phase and amplitude time series, implicitly meaning a zero-deformation time series, cf. DePSI [34] and SARScape [35]. To determine a spatial reference area, we opt for a locally stable region or entire study site, in which case average deformation time series within this reference area is considered as the zero-deformation reference, cf. StaMPS [21]. The deformations of the spatial reference area can be calculated by
y ^ ref k = 1 N q = 1 N y ^ q k ,
where y ^ ref k is the average deformation at kth acquisition, N is the total number of InSAR measurement points (IMPs, CCSs, and TCSs ∈ IMPs), and y ^ q k is the measurement of point q within the selected reference area, at kth acquisition.
Considering the difference in scattering mechanisms, spatial density, and distribution of IMPs for HH and VV, neither of these two ways to determine a common reference is optimal. Therefore, we propose to take the average deformation time series of a group of nearly stable InSAR measurement siblings for HH and VV. Specifically, when having N 1 and N 2 IMPs, respectively, for HH and VV, the size of such a group of siblings is N s min [ N 1 , N 2 ] . Every sibling pair is recognized based on the geometric and geophysical matching criteria as follows:
  • Spatial closeness and akin scattering mechanism [25];
  • Nuance in deformation time series;
  • Nearly stable temporal behavior.
Then, the common reference for HH and VV has y ^ ref k = 1 N s j = 1 N s y ^ j k , ( k ) deformation over time, which is subtracted from all IMP deformations. In doing so, the IMP temporal measurements in HH and VV can be blended. The advantage of combining and aligning IMPs in both HH and VV is that we can increase the IMP spatial density, and use the blended deformation time series of IMPs in HH and VV to better describe the geometric dynamics over time of any detected ground targets. Note that we identify and exclude IMPs with potential phase unwrapping errors by setting the threshold of the deformation gradient.

2.2. Physical and Land-Use Attribute Extraction

Physical attributes are described by scattering mechanisms mainly covering surface, volume, and double bounce scattering. Benefiting from distinct polarimetric features in co-polarimetric SAR (HH and VV), we can classify IMPs in terms of different scattering mechanisms and then assign the scattering mechanism to every IMP. The land-use attributes of IMPs can be inherited from land-use products. The procedure for obtaining physical and land-use attributes is shown by the blue and green arrows separately in Figure 1.

2.2.1. Speckle Noise Removal

To improve the quality of the polarimetric features, a spatio-temporal filter method is recommended to mitigate speckle noise in SAR images. The filter method we employ is customized upon a multi-temporal speckle filter [36]. In the case of applying this filter on SAR amplitude, for a pixel at position ( r g , a z ), with the amplitude value A k ( r g , a z ) , at the kth acquisition, its resultant amplitude value after the filter, denoted by A ˜ k ( r g , a z ) , can be expressed as
A ˜ k ( r g , a z ) = [ [ A k ( r g , a z ) ] filter _ space ] filter _ time = S k ( r g , a z ) T ( r g , a z ) ,
where the spatial filter output is S k ( r g , a z ) = [ A k ( r g , a z ) ] filter _ space . The Boxcar filter, Lee-sigma filter [37], and IDAN (Intensity Driven Adaptive Neighborhood) filter [38] are examples of spatial filter methods. The subscript filter _ space and filter _ time indicate the spatial and temporal filter processes, respectively. The temporal filter output T ( r g , a z ) is defined as
T ( r g , a z ) = 1 m + 1 i = 1 m + 1 A i ( r g , a z ) [ A i ( r g , a z ) ] filter _ space ,
where m + 1 is the total number of SAR image acquisitions, A i ( r g , a z ) represents SAR amplitude at position ( r g , a z ) of ith acquisition, i [ 1 , m + 1 ] . Having the spatial filter output as a divisor in Equation (4), we can normalize the amplitude values. As an example, ref. [39] used this filter to generate the filtered normalized radar cross-section maps prior to the Cloude–Pottier polarimetric decomposition for Sentinel-1 SAR datasets.

2.2.2. Polarimetric Features

The representative (incoherent) polarimetric features, i.e., real and imaginary parts of the co-polarization cross product, summation, difference, and ratio of the co-polarization intensities, sigma naughts in HH and VV, and entropy, can be employed for IMP physical characterization.
The co-polarization cross product is the complex multiplication of two SAR images in HH and VV ( S H H and S V V ), expressed as
S c = S H H · S V V * = ( S H H · S V V * ) + j ( S H H · S V V * ) ,
where S H H and S V V represent the complex number of SAR data in HH and VV. The superscript * is the complex conjugate operator, and j is the imaginary unit, ( . ) and ( . ) are the operators to separately compute the real and imaginary parts of a complex number. The real and imaginary parts of S c separately reflects the difference between even and odd bounce scattering, and the inter-channel correlation.
The intensity of SAR in HH and VV can be computed by | S H H | 2 and | S V V | 2 , respectively. The co-polarization summation, intensity difference, and intensity ratio are separately defined as | S H H | 2 + | S V V | 2 , | S H H | 2 | S V V | 2 and | S H H | 2 / | S V V | 2 , which shows the relation of the dipoles in HH and VV orientation.
The sigma naughts in HH and VV, σ H H ° , σ V V ° , are the normalized radar cross section, which are directly related to the power of the ground targets returned to SAR satellite antenna [40]. σ H H ° and σ V V ° can be theoretically defined as
σ H H ° = ( k s | S H H | 2 NEBN ) sin θ loc ,
σ V V ° = ( k s | S V V | 2 NEBN ) sin θ loc ,
where k s is the calibration and processor scaling factor. NEBN is short for Noise Equivalent Beta Naught, and it represents the influence of different noise contributions to the signal. θ loc is the local incidence angle.
The entropy is derived from a Cloude–Pottier eigenvalue/eigenvector decomposition [41,42], which presents the proportional importance of the dominant scattering type. It is defined as
H = i = 1 I p i log I p i ,
where p i = λ i i = 1 I λ i , i [ 1 , I ] . λ i ( i ) are the real eigenvalues of the I × I coherency matrix. It is worth noting that besides the entropy, the Cloude–Pottier eigenvalue/eigenvector decomposition has two other parameters: anisotropy and mean scattering angle α . For dual polarized data, anisotropy cannot be estimated, as the depolarization information is contained in the two minor eigenvalues in the quad-polarized scheme, but merely one minor eigenvalue can be obtained. Furthermore, the estimation of α is inferior due to the lack of the third eigenvalue. Details refer to [41,42]. Hence, when having HH and VV, I equals 2, and anisotropy and α are not included in the analysis of radar scatterer classification.

2.2.3. IMP Classification in Terms of Scattering Mechanisms

By aggregating the aforementioned polarimetric features, the IMP classification in terms of scattering mechanisms can be carried out with a machine learning method such as Random Forest [43]. Here, the scattering mechanisms include surface, low-volume (e.g., grass and farmlands), high-volume (e.g., tall (canopy) trees), and double bounce scattering. Such a classification process can be applied to every SAR acquisition and their temporally averaged SAR image. Samples for the double bounce (especially dihedral) and surface scattering classes are chosen using an external topographic base map with land use information, and TOP10NL data for our study. In doing so, we are able to improve the quality and quantity of training samples for double bounce and surface scattering classes, since TOP10NL offers four main land use classes: road, building, water body, and railway class, and roads and water bodies, are examples of surface scatterers, and buildings and railway tracks are examples of dihedral scatterers. Based on the visual interpretation of SAR amplitude maps and auxiliary optical images, the samples for the volume scattering classes are drawn. The volume scattering class can be divided into two sub-classes, i.e., low- and high-volume scattering class, mainly based on the basis of the SAR intensity in VV and HH, cf. [44]. For instance, a meadow is the sample for the low-volume scattering class, and the areas with tall trees are the samples for the high-volume scattering class. These samples with reliable labels are used to create the training samples.
It is worth noting that the use of TOP10NL for labeled sample creation in radar coordinates is not straightforward, as TOP10NL is stored as points, lines, and polygons in a local coordinate reference, i.e., RD (Rijksdriehoekscoordinaten) coordinates. Hence, the TOP10NL data have to be first rasterized, then converted into radar coordinates. As the elevation information is missing in TOP10NL, the projection error from the cross-range to the azimuth-range plane is inevitable, and should be taken into account when manually selecting and labeling data. Note that associating TOP10NL information with individual radar scatterers is resolution-cell-wise.
In principle, when running Random Forest, an ensemble of decision trees is used for IMP classification [45,46,47,48]. Each tree in the forest is trained with a subset of the total training samples. These subsets are extracted from the training samples using a bagging approach where samples are drawn with replacement [49]. Due to the ’with-replacement’ criteria, some samples are left ’out of the bag’ (OOB). During the training phase, the decision trees are grown by thresholding a feature value. This feature and its threshold value are chosen at each node using the Gini criteria [48]. At the post-training step, the OOB samples act as test data and facilitate an unbiased estimation of the classification accuracy of each decision tree, as well as for the whole forest. The classification accuracy can be measured using the OOB error, as well as Cohen’s kappa coefficient [50] and F 1 -score [51]. To assess the feature importance, mean decrease accuracy (MDA) [52,53] can be employed. The final Random Forest-based IMP classification results suggest the proper physical attribute for every IMP. Furthermore, using the TOP10NL-derived land use information, land-use attributes can be readily associated with IMP.

3. Data and Test Site Description

We used 30 PAZ SAR images in HH and VV acquired between September 2019 and October 2021, at 5:18 PM. PAZ is the Spanish SAR satellite mission that was launched by Hisdesat in February 2018 [54]. It offers X-band SAR images in co-polarimetric modes, nominally on a weekly basis. In our case, most of the time interval between adjacent acquisitions is 22 days. The maximum time interval is 66 days and occurs between 1 August 2020 and 6 October 2020. We selected the SAR image acquired on 28 October 2020 as the master, indicated by the star in Figure 2a, because there was no rain (see Figure 2c) in blue) and its SAR stack coherence using Equation (A1) [34] is the highest. The perpendicular baseline of all 29 slave acquisitions shown in the black circle w.r.t. the master ranges [ 173 , 203 ] m. TOP10NL, with a scale of 1:5000 (equivalently 0.5 m spatial resolution) in 2017, was collected. Figure 3 shows the TOP10NL-based classification map over the test site. The classification categories include buildings in yellow, roads in grey, water bodies in cyan, and main tracks of the railway in blue. The hourly air temperature and cumulative precipitation data from weather station 270 were obtained from https://www.knmi.nl/home (accessed on 14 January 2022). Note that the temperature in black and precipitation data in blue were downsampled in order to associate with the 30 PAZ SAR acquisitions; see Figure 2c). It means that we only used the temperature recorded at 5 PM and cumulative precipitation between 1 AM and 5 PM at every SAR acquisition date.
As the test site is rather flat, covers coastal regions, and has complex and dynamic weather situations [55], the traditional linear tropospheric correction does not suffice. Then, to properly estimate the atmospheric phase delay and eliminate it from all interferograms, the GACOS (Generic Atmospheric Correction Online Service) product was collected and utilized. This product is generated by using numerical weather modeling based on the data combination of the high-resolution ECMWF weather model at 0.1 ° and 6 hr resolutions [56], SRTM DEM (90 m) [57] and ASTER GDEM (90 m) [58]. This product offers zenith total delay maps, and stratified and turbulent mixing information using the Iterative Tropospheric Decomposition (ITD) model [59]. In addition, assuming a linear relation between interferometric phase and elevation over non-deforming area, the linear tropospheric model can be applied independent of external weather data [60].
The test site covers the parts of Leeuwarden and Sneek, their outskirts and villages, in the province of Friesland, the Netherlands, as shown in red in Figure 3. The spatial extent of the test site is about 12 × 37 km 2 . The soil over this site mainly consists of loam, clay, and peat [61]. Due to, e.g., soil shrinkage, consolidation, peat oxidation, and water extraction, continuous land subsidence is recorded (1 to 5 mm y 1 between 2015 and 2020, cf. https://bodemdalingskaart.nl/, accessed on 5 May 2022).

4. Results

4.1. IMP Geometric Attribute Extraction and Analysis

4.1.1. Coherence Scatterer Selection and Deformation Time Series Generation

We separately generated 29 interferograms in HH and VV for PSI processing. We set the maximum temporal baseline, C r i t i c a l ( B T ) , as 500 days, the maximum perpendicular baseline, C r i t i c a l ( B ) , as 300 m, and the minimum coherence ( 1 B / C r i t i c a l ( B ) ) ( 1 B T / C r i t i c a l ( B T ) ) as 0.35 , to form small baseline subsets. Here B T and B represent the temporal baseline and perpendicular baseline of the interferograms. The value of 0.35 was determined based on the experimental analysis, during which we tested the coherence values ranging between 0.25 and 0.55 . Consequently, 181 interferograms in HH and VV were created, respectively, for SBAS; see Figure 2b). The acquisition information of these 181 interferograms is listed in Table A1. We realized the interferogram stack generation by using Doris [62], and we applied the standard PSI and SBAS using StaMPS [63]. D a was defined as 0.3 for pointwise CCS selection, and D Δ a 0.55 for TCS selection (using Equation (1)). The GACOS data were used to estimate the atmospheric phase delay in all interferograms and eliminate it from deformation estimation. The GACOS-based atmospheric phase values were assigned to all CCSs and TCSs, and assisted in phase unwrapping and parameter estimation. Figure 4a,b show the GACOS-based atmospheric phase distribution of all 181 interferograms for IMPs in HH and VV, respectively. Every column in Figure 4a,b shows the IMP atmospheric phase distribution (normally distributed) in the designated interferogram, albeit showing the difference in the IMP registry in HH and VV, the expectation of the GACOS-based atmospheric phase in HH and VV both ranges between 13 and 6 radians, and the dispersion limits’ [ 0.2 , 6 ] radians. It means that the atmospheric phase delay is at the level of a few centimeters, i.e., 32 mm at most, and varies in space with the maximum atmospheric phase difference of 14 mm. As a result, 43 , 551 pointwise CCSs and 494 , 435 TCSs in HH ( 537 , 986 IMPs in total), and 36 , 287 pointwise CCSs and 449 , 387 TCSs in VV ( 485 , 674 IMPs in total) were finally obtained. There are 160 , 635 IMPs in HH and VV sharing the same locations, among which there are 16 , 079 CCSs.

4.1.2. Spatial Reference Selection and Alignment

According to the criteria of selecting the spatial reference (see Section 2.1.2), we defined that every IMP sibling pair is selected from the CCS registry, situated at the same location, having 0 mm y 1 linear deformation velocity with a 0.1 mm y 1 tolerance (provided that InSAR deformation measurements (X-band) empirically have σ y = 3 mm uncertainty cf. [64]), less than 7 mm deformation gradient (approx. 31/4 mm, to exclude the temporal unwrapping errors), less than 2 σ y = 6 mm deformation difference between HH and VV. Then, 16 sibling pairs were identified and indicated by the blue pentagram in Figure 5a. As the identified 16 reference sibling pairs were stable over time and dispersedly distributed over the whole test site, by averaging their deformation time series and subtracting these values from all IMPs in HH and VV, we mitigated the reference error at a global scale. Figure 6a,b separately show the cumulative deformation time series of these pairs in HH and VV. Here, each row depicts the deformation time series of the reference point from the pairs. The average deformation time series of the reference points in HH (indicated by the square) and VV (circle) are similar, all having less than 1 mm difference; see Figure 6c). As proposed in Section 2.1.2, the deformation time series of the common reference is the mean value of the average deformation time series shown in the dot line, which was used to align all IMPs in HH and VV into a common coordinate reference system by subtracting these mean values from all IMP deformation time series.
The deformation time series of IMPs in HH and VV w.r.t. the common reference are part of IMP geometric attributes. The linear deformation velocity in the line-of-sight direction of IMPs in HH and VV is separately shown in Figure 5a,b. The deformation time series of the IMPs in HH and VV at the same spots were averaged between HH and VV, and the corresponding deformation velocities were re-calculated as well. We found that 75 % and 80 % of IMPs in HH and VV are nearly stable, with the linear deformation velocity [ 2 , 2 ] mm y 1 . A total of 2 % and 1 % of IMPs in HH and VV present the pronounced subsiding trend, having more than 5 mm y 1 linear deformation velocity, and are mainly observed on the outskirts of the cities, coastal line, and some transport corridors.

4.2. IMP Physical Attribute Extraction and Analysis

4.2.1. Scattering Mechanism Classification and Accuracy Analysis

As stated in Section 2.2.3, the IMPs can be classified in terms of scattering mechanisms, and categorized into surface, low- and high-volume, and double bounce scattering mechanism classes. We first removed the speckle noise using the multi-temporal speckle filter method (Equation (3)), the step in which the Boxcar filter with the 3 × 3 window size in space and temporal filter using Equation (4) were applied. Then, we applied the scattering mechanism classification to the temporally average SAR images in HH and VV. The Random Forest method was trained using 1074 samples with eight representative features mentioned in Section 2.2.2. These samples, covering four types, surface, low- and high-volume, and double bounce scattering, were crafted using the assistance of the TOP10NL data and visual interpretation of SAR amplitude and optical images. Acknowledging the classification accuracy can be biased when dealing with data whose classes are unbalanced [65], we used 320 surface, 320 low-volume and 272 high-volume, and 162 double bounce scattering samples. Here, we assumed that the double bounce scattering samples are highly separable thanks to their high signal-to-noise ratio. The samples that can cause errors are surface scattering and low- and high-volume scattering, which were equally and substantially represented in the training samples. In addition, this Random Forest classifier was tested with the samples over the test set that were not taken from the training dataset; see Figure A1. The number of samples in the test set was kept at around 650 per class; see Table A2. We found that the classifier performs well throughout the test set, as the kappa value equals 0.96 and the weighted F 1 -score is 0.97 .
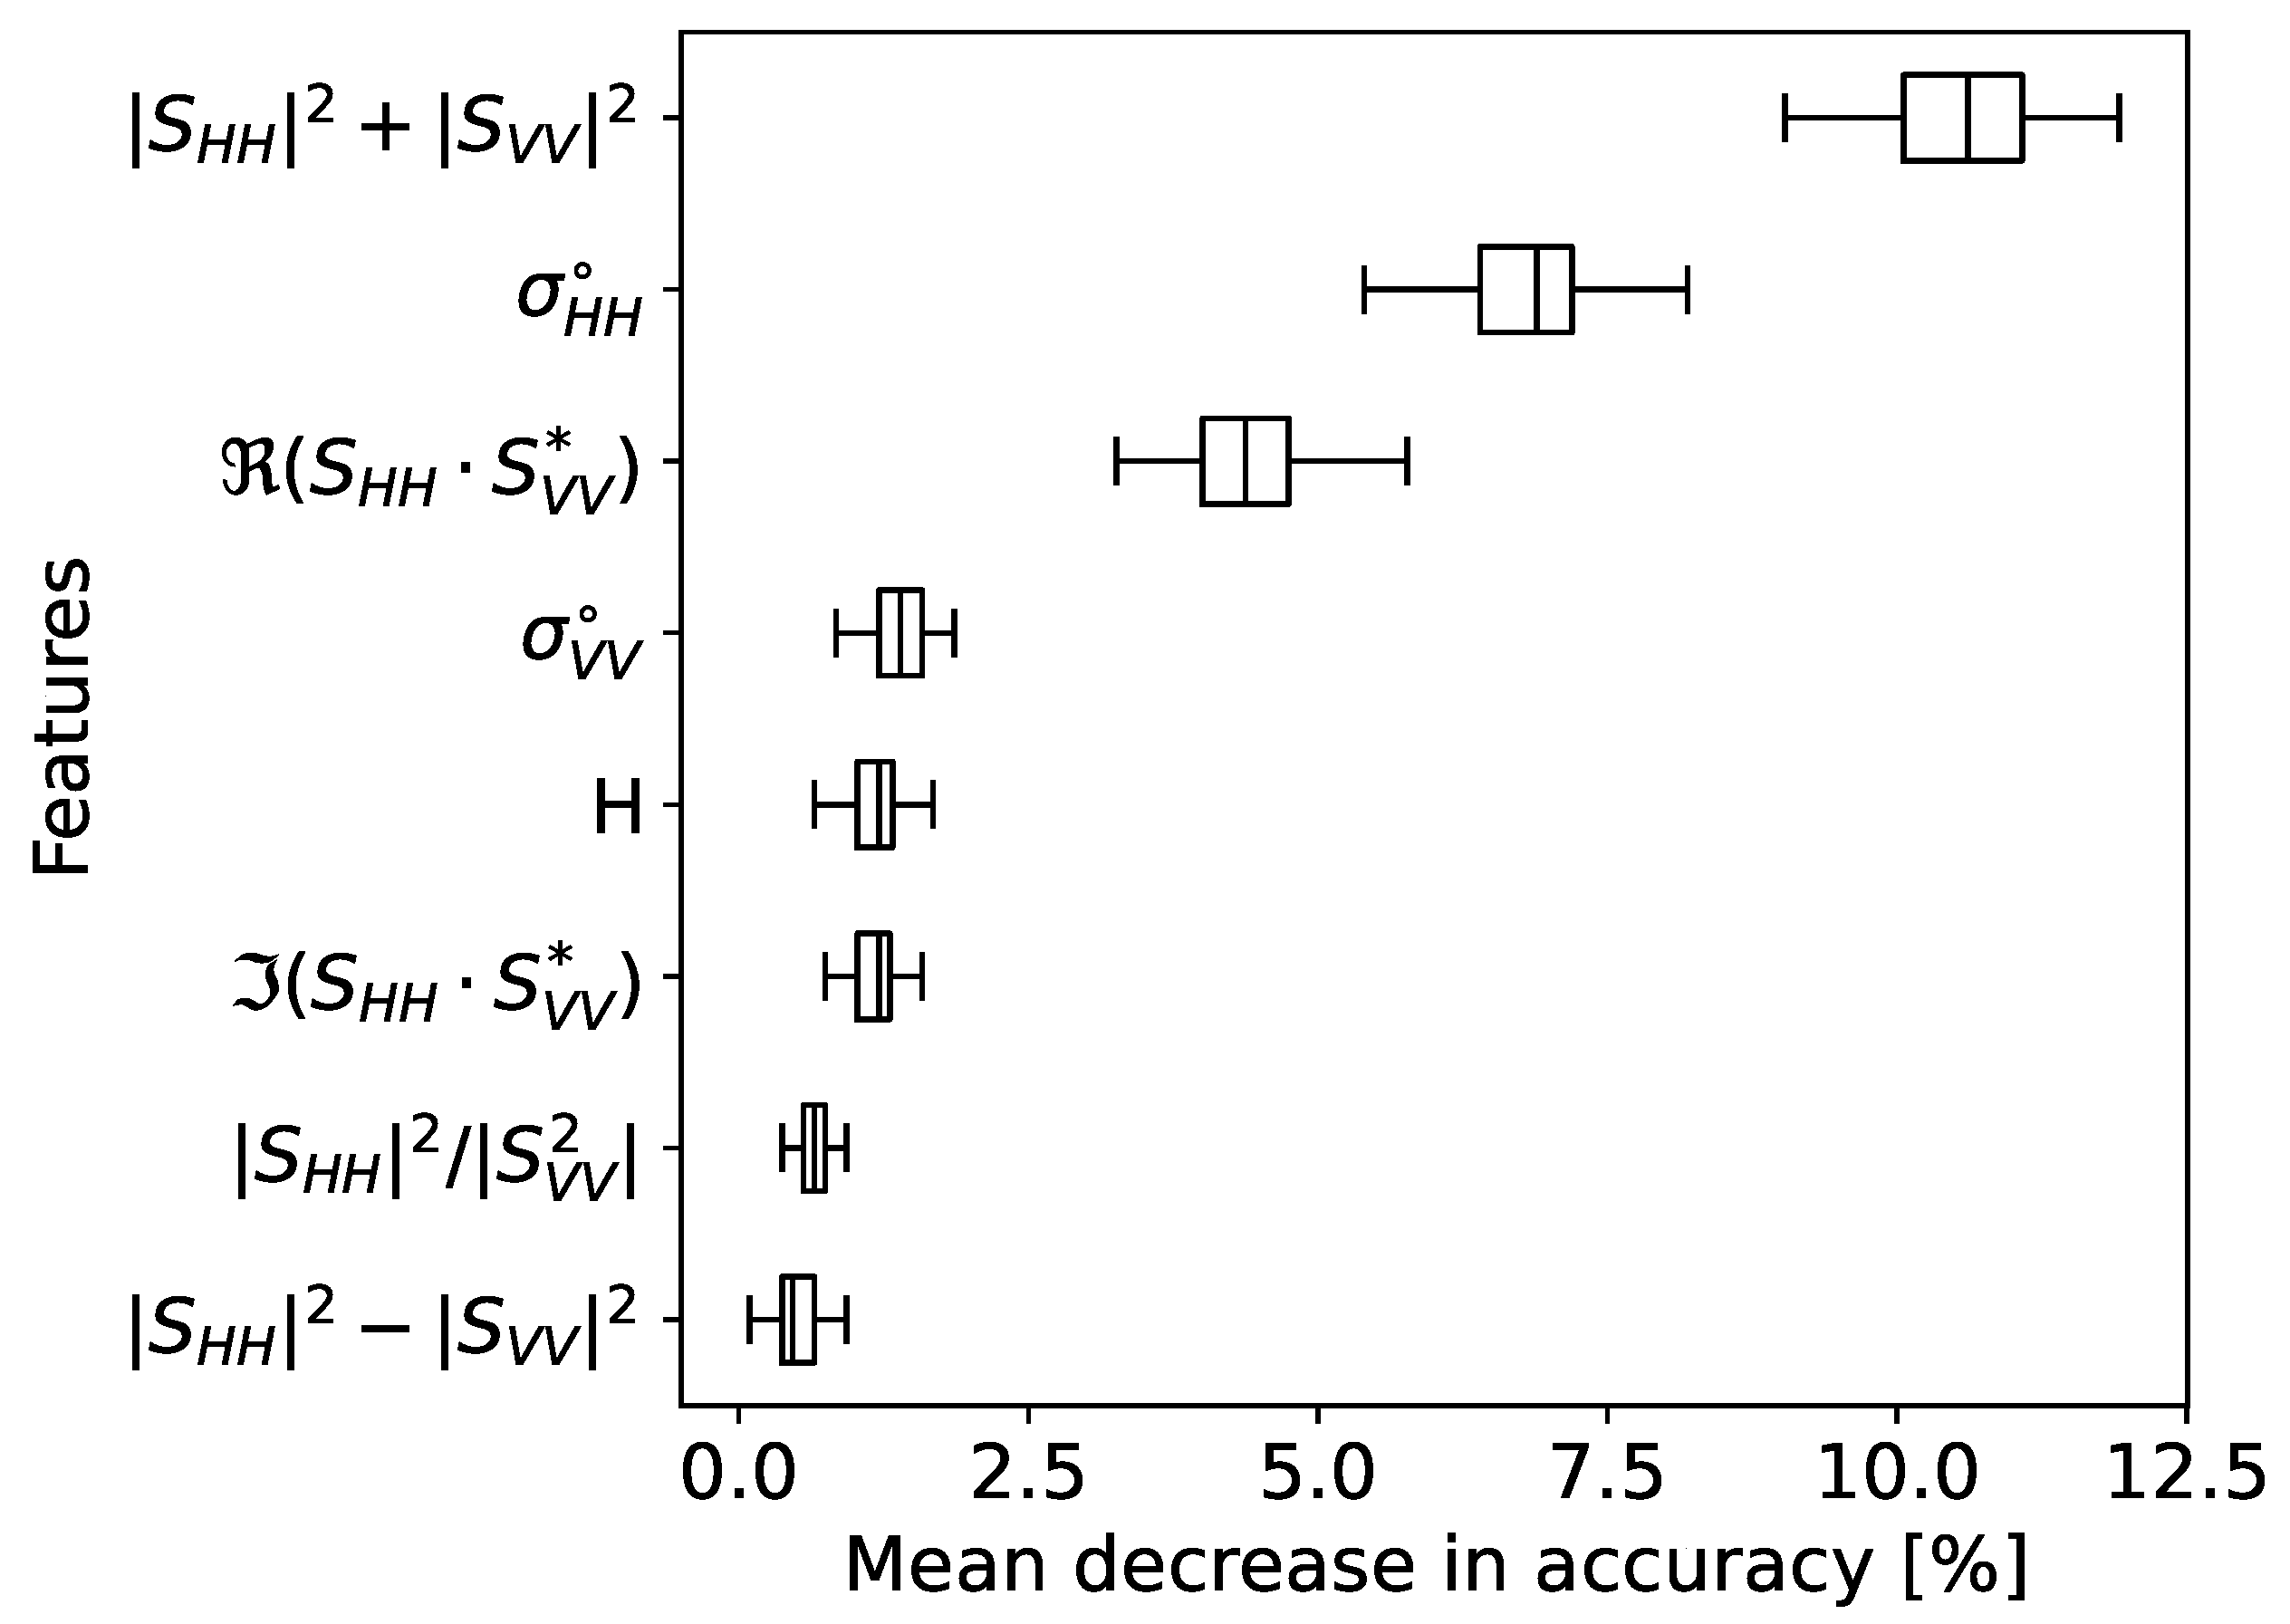
The accuracy in the classification calculated using the unbiased OOB error is 0.96 . Out of all the features, we found that the summation of co-polarization intensities, | S H H | 2 + | S V V | 2 , is the most important feature. This can be seen in the feature importance plot shown in Figure 7, with an average decrease of 11 % when randomly permuted. This is likely due to the increased dynamic range of the feature values, which would assist in the classification. Furthermore, σ H H ° turned out to be the second most important feature, with an average decrease of 7 % , probably because of the higher sensitivity of this polarization mode to surface and volume scatterers. The real part of the co-polarization cross product, ( S H H · S V V * ) , also shows significant values of mean decrease in accuracy of 4 % . The entropy H feature and the imaginary part of the co-polarization cross product, ( S H H · S V V * ) , seem less important. The least important features are the ratio and difference of the co-pol intensities, | S H H | 2 / | S V V | 2 and | S H H | 2 | S V V | 2 . This could be caused by the reduced dynamic range between the values, and lead to more mixing of classes, thereby reducing classification accuracy.
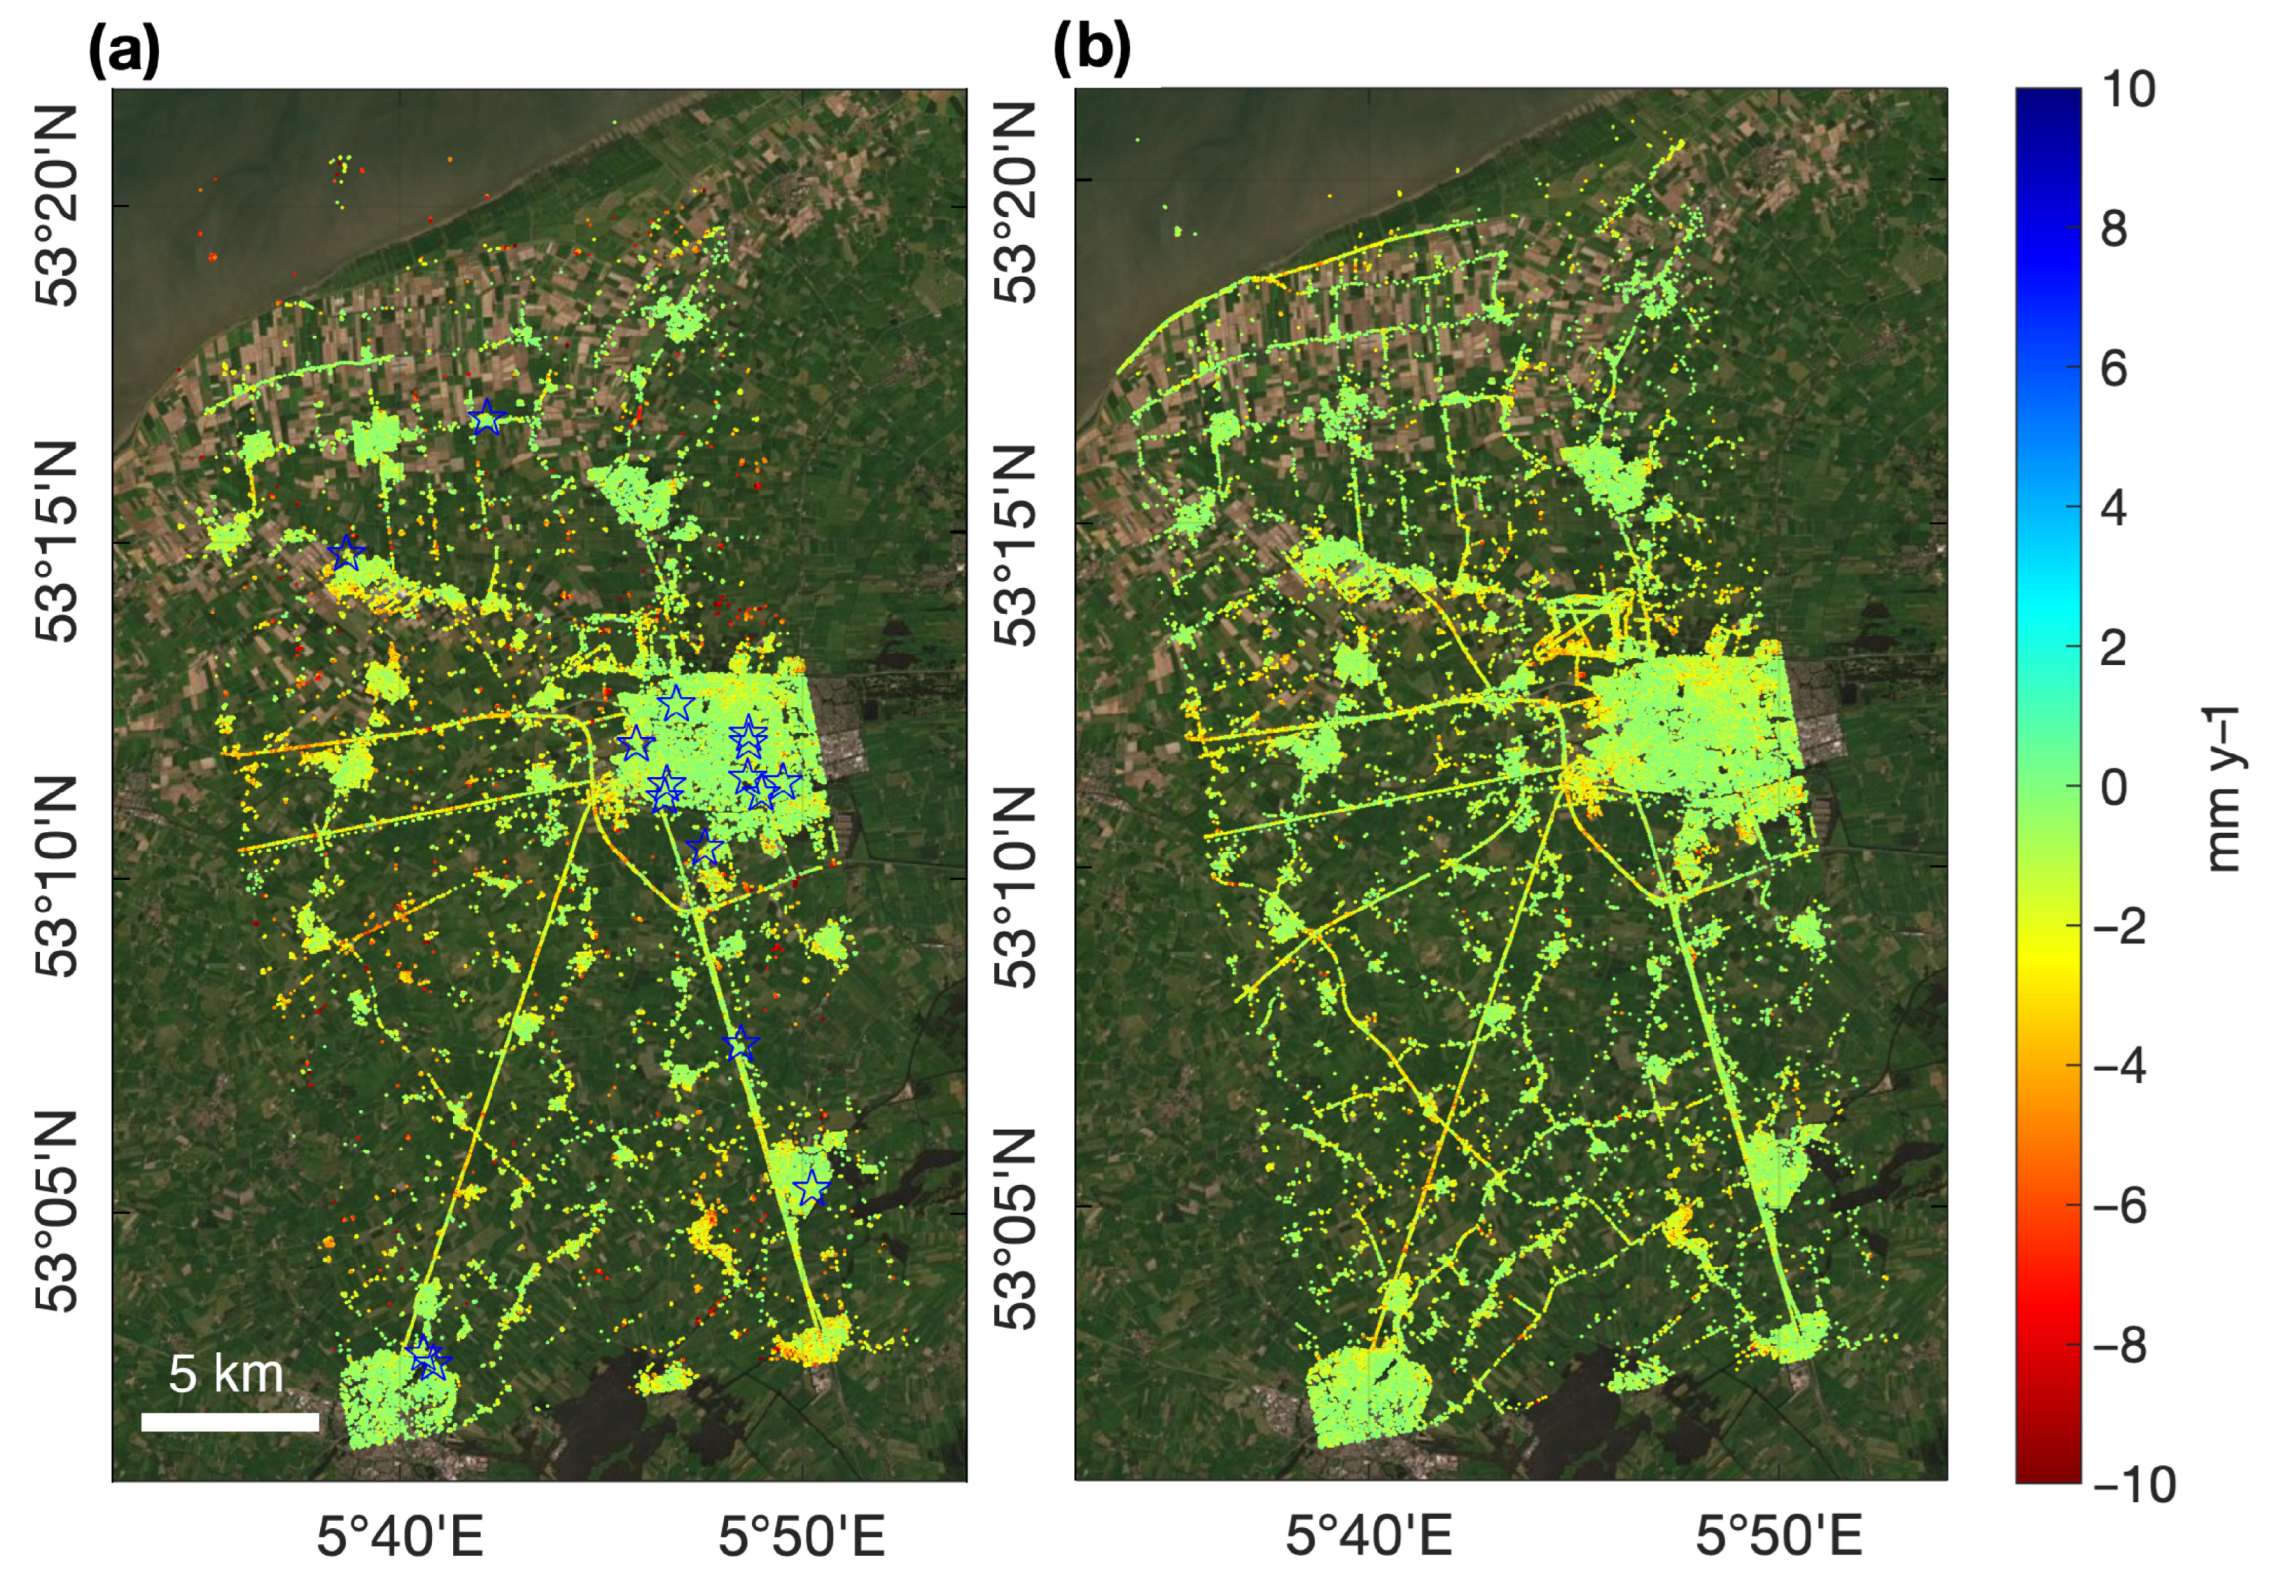
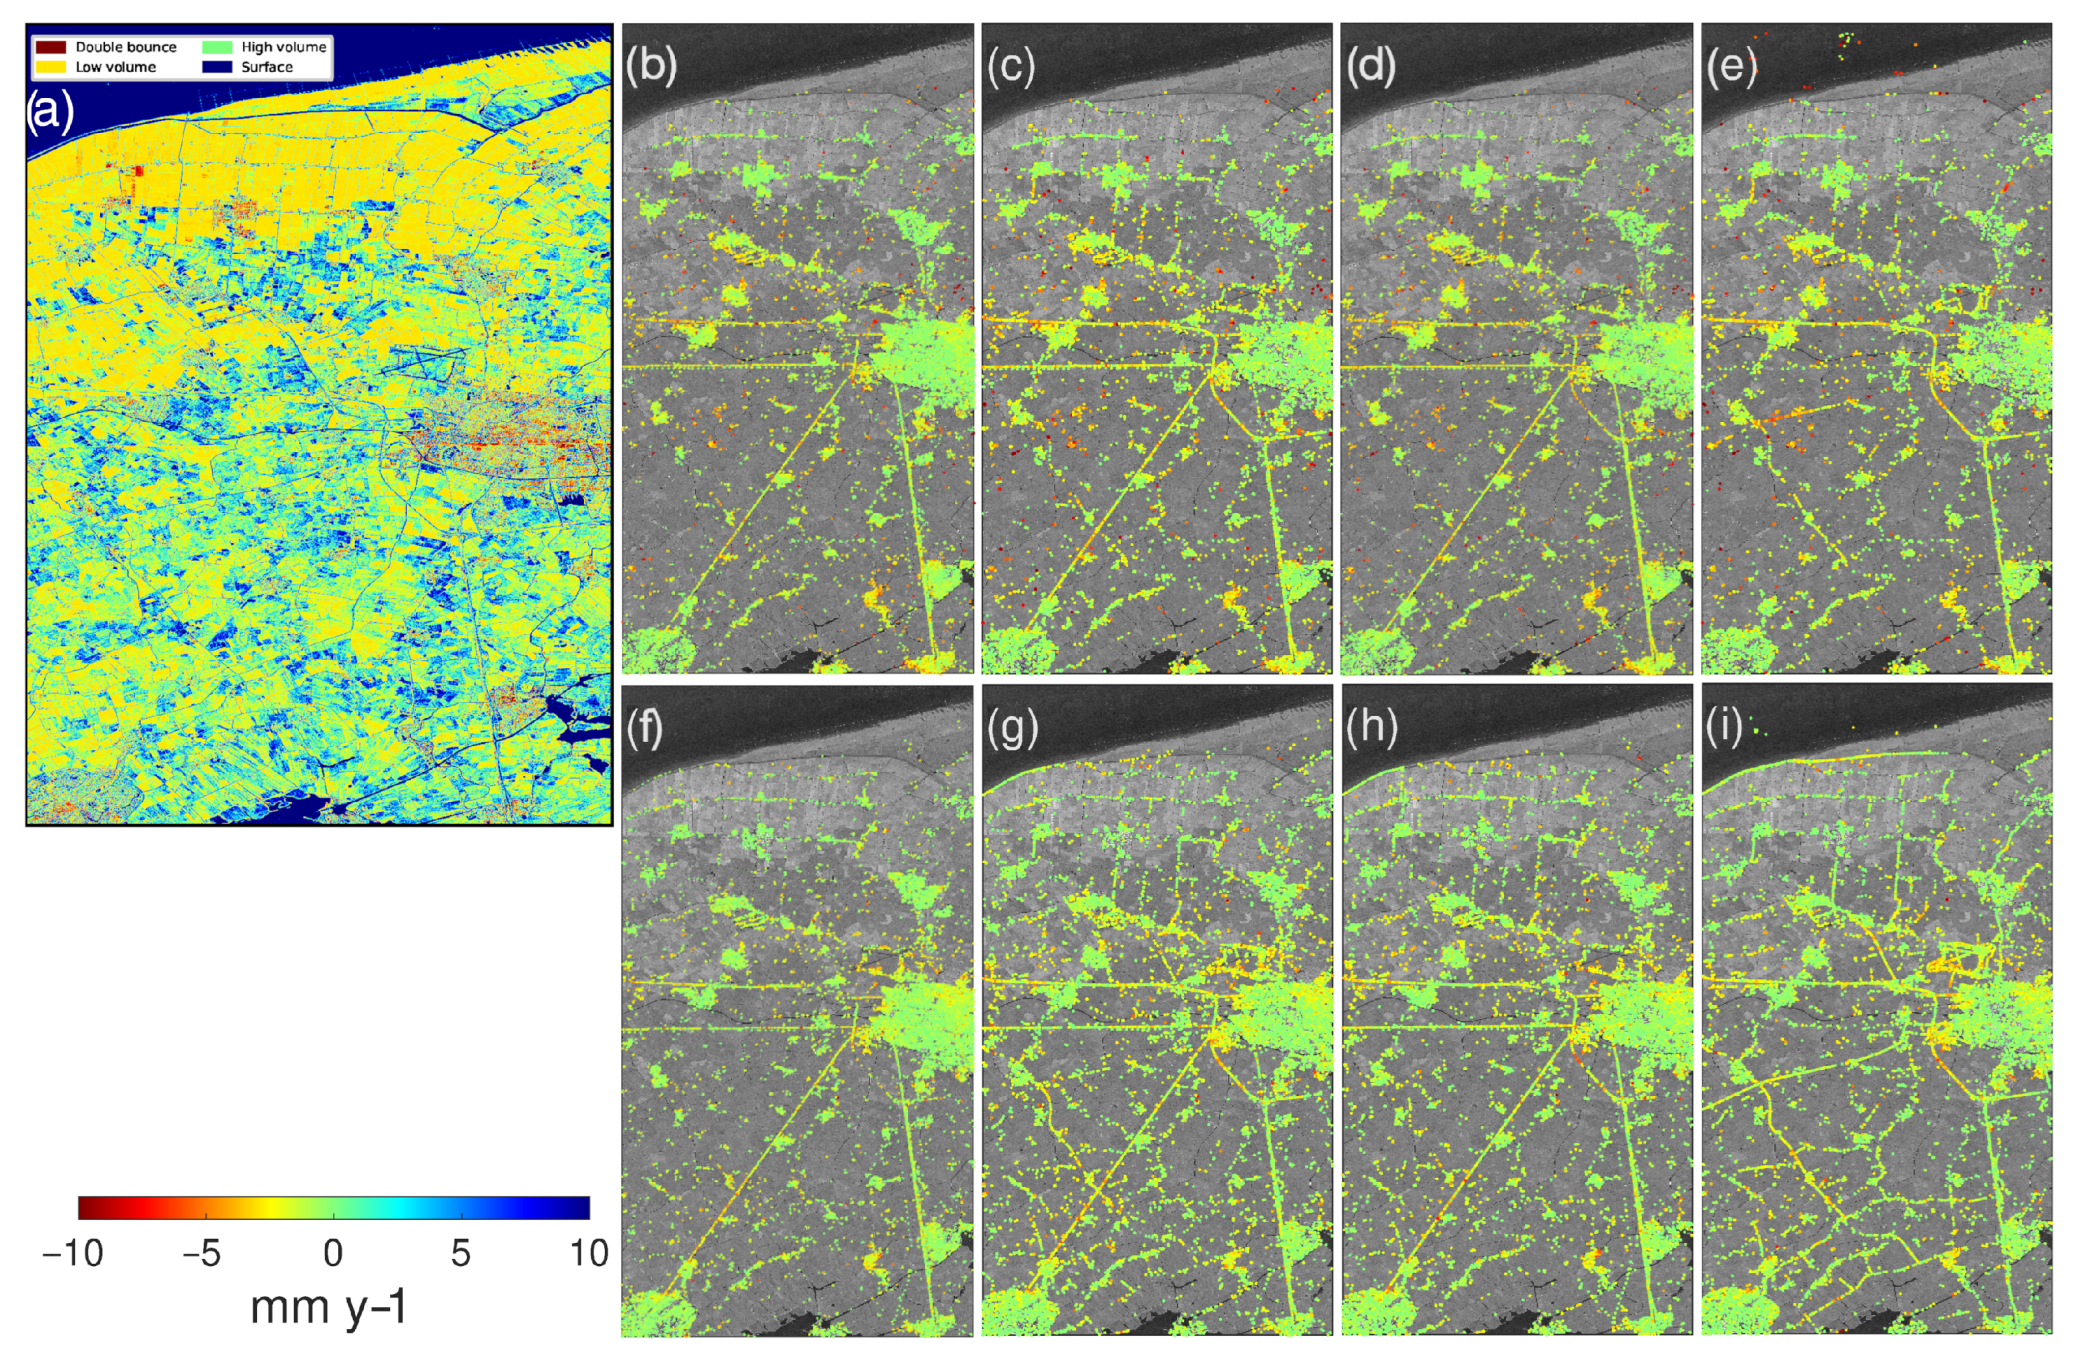
Figure 8a shows the scattering mechanism map over the entire test site. The scattering mechanisms of all pixels, irrespective of coherent or non-coherent scatterers, are categorized into double bounce (in red), low-volume (in yellow), high-volume (in green), and surface scattering (in blue). As IMPs’ geometric attributes (IMP positions) were obtained, we extracted the physical attributes (i.e., scattering mechanisms) for all IMPs based on their positions. Figure 8b–e show the spatial distribution of 537,986 IMPs in HH categorized as double bounce, low- and high-volume, and surface scattering class, respectively, along with the corresponding linear deformation velocity estimations, while Figure 8f–i show the counterpart of 485,674 IMPs in VV. The results show that per class, the spatial distribution and temporal behavior of IMPs in HH and VV were distinct. The HH channel observed a bit more IMPs with large subsiding rates (e.g., [ 10 , 5 ] mm y 1 ) shown in the orange and red color in Figure 8b–e. Note that water bodies were also labeled as surface scatterers. Theoretically, no IMPs can be observed over (calm) water areas. However, for instance a handful of IMPs in the Wadden sea conservation area were observed; see Figure 8e,i, which are probably reflected by the sandbanks. IMPs detected on the canals could be reflected by human-made structures, such as bridges, river banks and stakes, over the canal areas. Limited by the scale of Figure 8b–i and high spatial density of IMPs with the four different classes in HH and VV separately, the subtle difference in IMP spatial distribution is hard to be recognized using Figure 8b–i; therefore, in the following, we illustrate three small areas in Figure 9 and further investigate the two most important polarimetric features over time of five IMPs from these areas; see Figure 10. Table 1 lists the total number of IMPs in HH and VV with these four scattering mechanisms. Most IMPs have double bounce scattering characteristics; 56 % for HH, and 50 % for VV. Remarkably, the number of IMPs in HH with double bounce and high-volume scattering is separately more than the one in VV, while the number of IMPs in HH with low-volume and surface scattering is 7 % and 35 % less than the number in VV. It implies SAR in the VV channel is more sensitive to detect low-volume and surface scatterers as IMPs. It is counterintuitive that the low- and high-volume scatterers were recognized as IMPs, as such scatterers rarely (constantly) keep temporal coherence. We infer this is attributed to (1) double bounce at stems or trunks of low- and high-volume scatterers, (2) invariance of certain low- and high-volume targets, and/or (3) scattering mechanism mislabeling. As radar signal usually has specular reflection over smooth surfaces and diffusion over rough surfaces, it implies IMPs with surface scattering do not directly represent a smooth surface itself, but may represent natural reflectors, such as bare rocks, rough roads, and spatially homogenous fields.

4.2.2. IMP Land-Use Attribute Extraction and Association with Physical Attributes

Using the TOP10NL data, we categorized all IMPs in HH and VV in accordance with land use types, encompassing building, road, water, railway, and uncharted classes, and assigned these land-use attributes to the corresponding IMPs. Table 2 lists the total amount of IMPs in HH and VV per class. For building, water, and railway classes, the number of IMPs in HH is 26 % , 3.7 % , and 2 % more than the counterpart in VV. For road class, SAR in the VV channel was observed more by 35 % , compared with the observed 81,701 IMPs in HH. As IMPs in HH and VV over water account for 0.2 % of all IMPs, the inaccuracy of this land-use attribute extraction result is allowable. As TOP10NL data were observed and sorted in 2017 and the SAR images were acquired between 2019 and 2021, such a time difference, as well as the class absence of the agricultural fields, leads to the uncharted class. The uncharted class includes the IMPs that reflect the new targets that appeared after 2017 and targets in agricultural fields.
By comparing the physical and land-use attributes of IMPs, we recognized that 64 % of IMPs from buildings in both HH and VV are double bounce scatterers. IMPs on roads have 37 % and 23 % double bounce scatterers (for instance, from lamp posts and embankments), about 20 % low-volume scatterers, 18 % and 11 % high-volume scatterers, and 25 % and 44 % of surface scatterers in HH and VV. For railways, 55 % and 52 % double bounce scatterers, 35 % and 34 % high-volume scatterers, 9 % and 13 % low-volume scatterers, and both 1 % surface scatterers in HH and VV were labeled for IMPs on railways. Table 3 lists this information. As IMPs over water may not be reliable and there is no further analysis on IMPs in the uncharted class, the scattering mechanism class percentage is not discussed for the water and uncharted class.
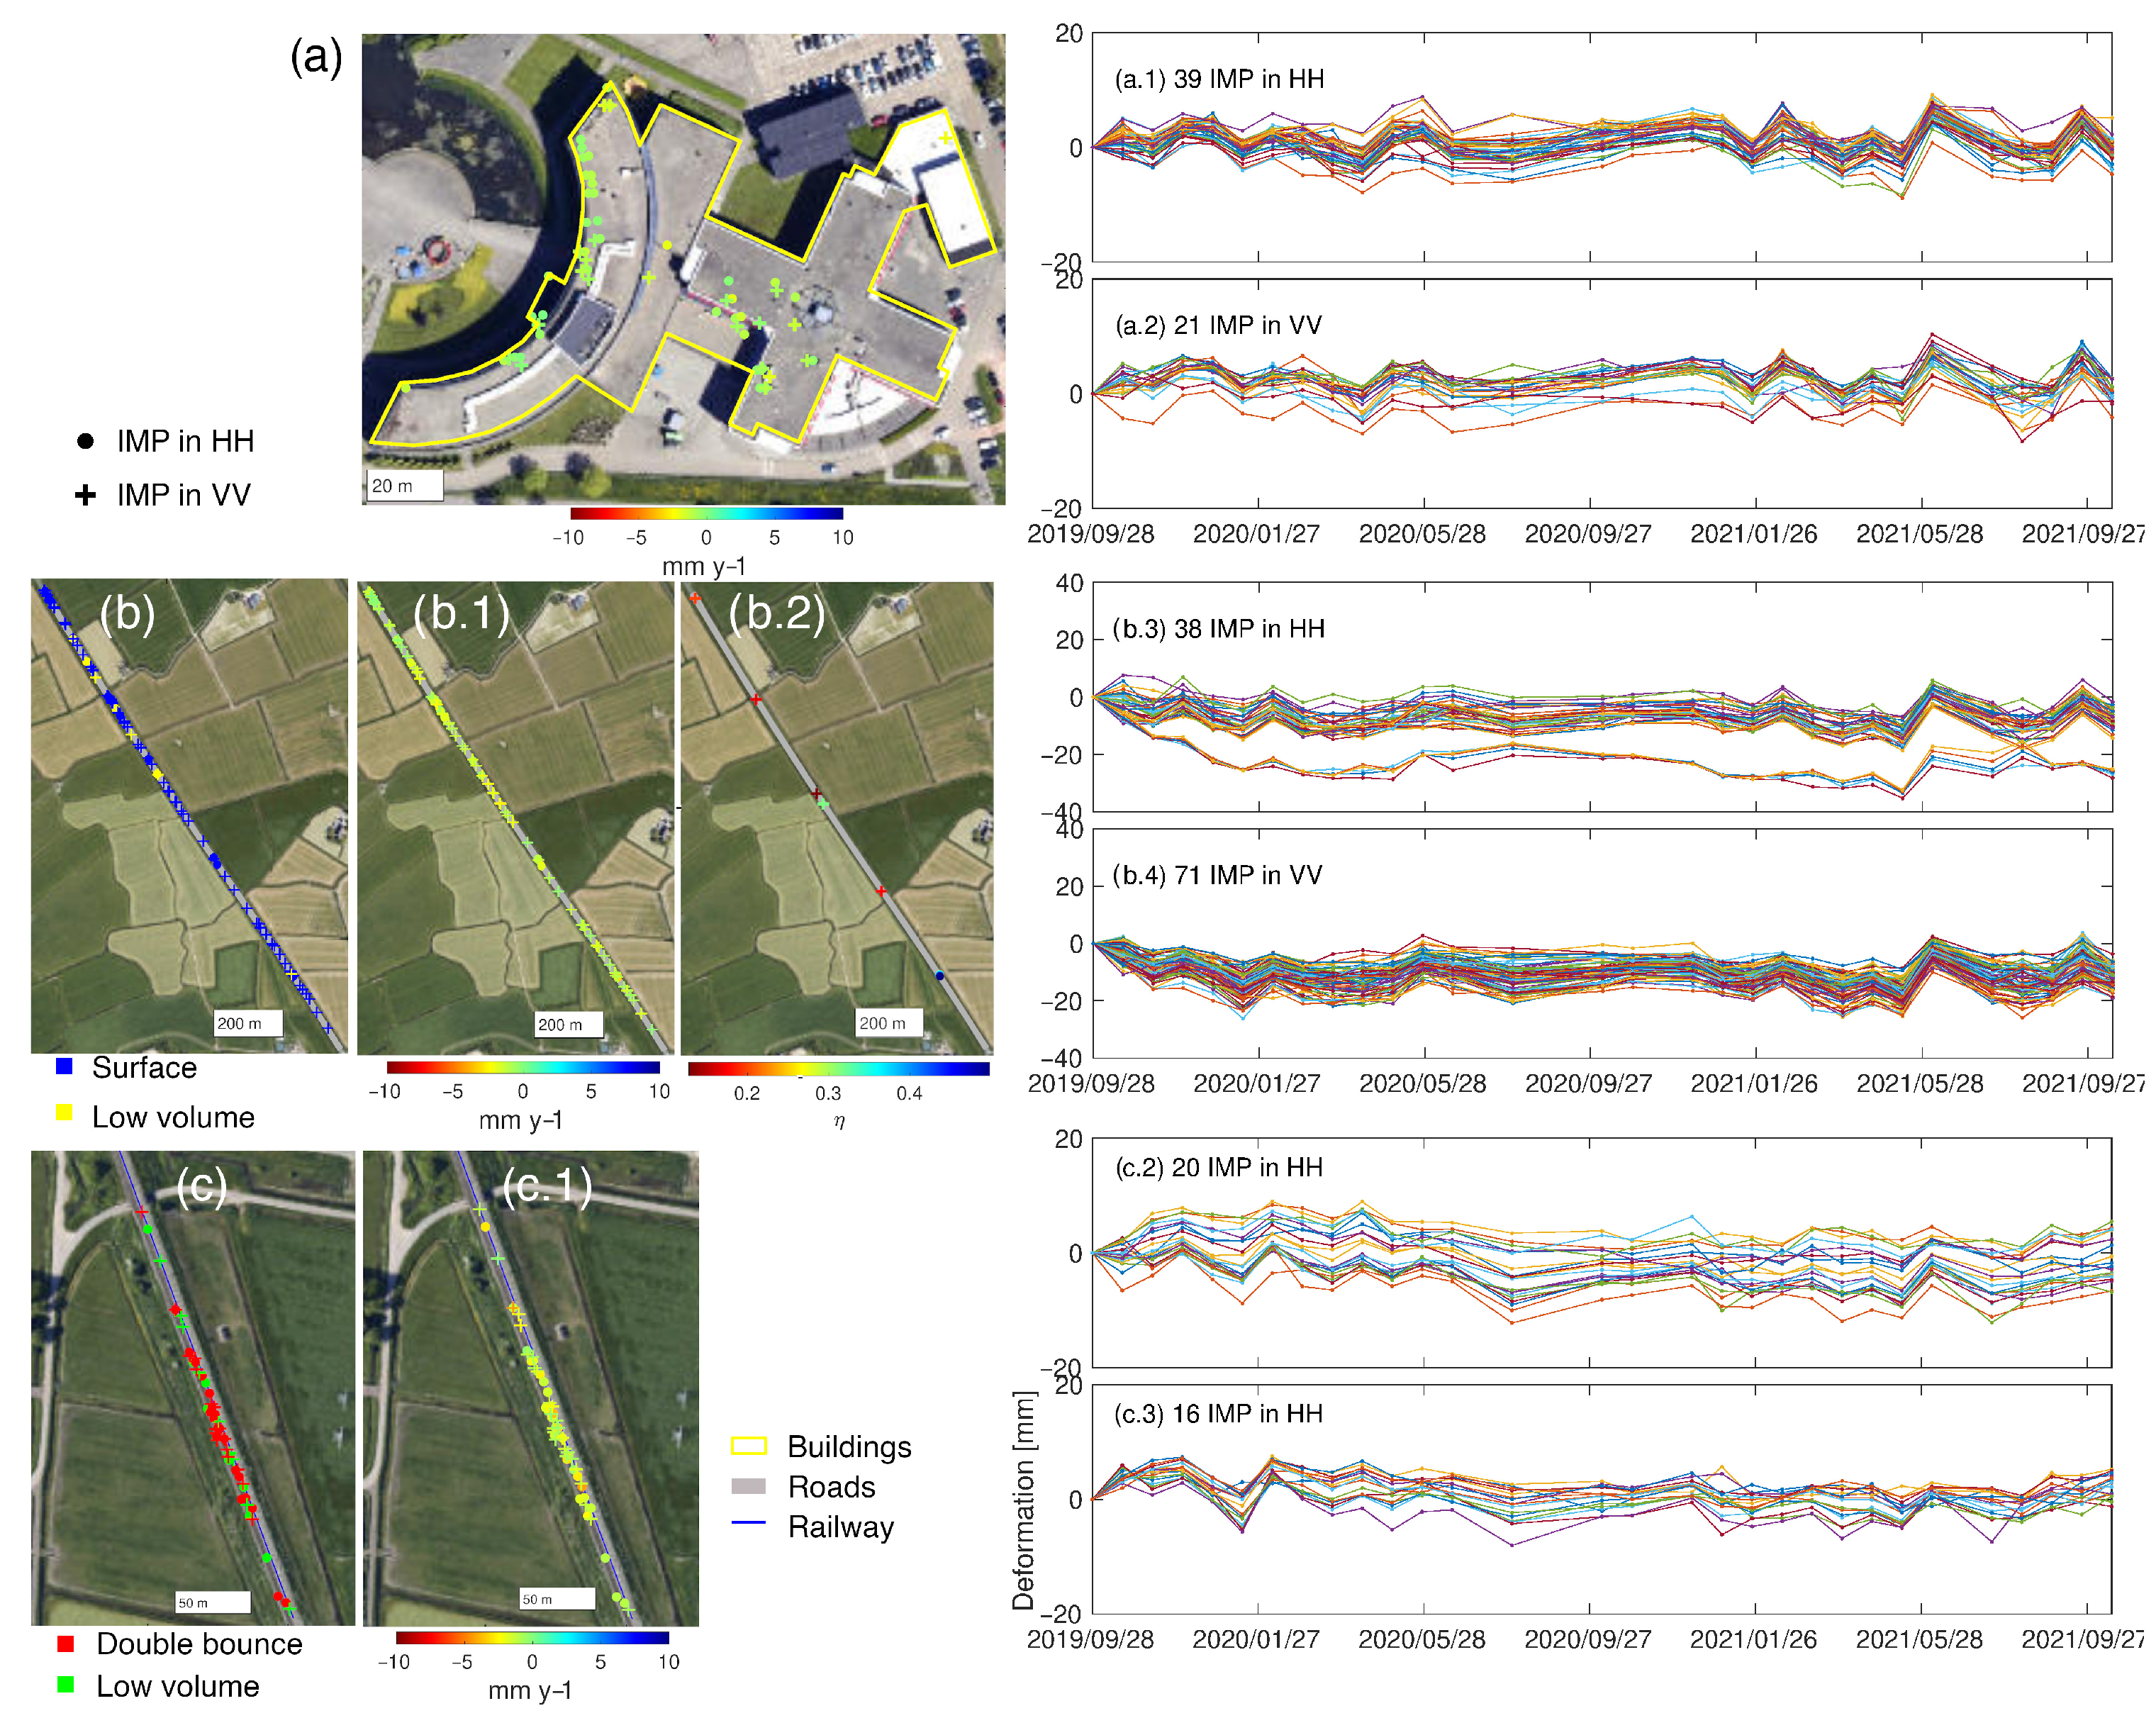
Taking a building located at 53.2036 ° N, 5.8335 ° E, namely ROC Friese Poort Leeuwarden (with four stories), as an example, we found 39 and 21 IMPs with double bounce scattering feature separately in HH and VV reflected from the building roof. Figure 9a presents the line-of-sight deformation map over this building outlined in yellow. The IMPs in HH and VV are indicated by the dot and cross, respectively. The corresponding deformation time series is shown in Figure 9(a.1) for IMPs in HH and Figure 9(a.2) for IMPs in VV. The result shows four pairs of IMPs in HH and VV are located at the same places and possess almost the same temporal behavior, with a 0.2 mm y 1 average difference. The mean deformation rate of all IMPs is 0.8 mm y 1 , and the temporal behavior of all IMPs can be well interpreted by a linear function of time, according to deformation modeling with multiple hypothesis testing [64]. Here, we assumed 3 mm observation error from the X-band PAZ data to initiate the multiple hypothesis testing analysis.
We took a ∼1.5 km segment of highway N383, at 53.2160 ° N, 5.7087 ° E, as a representative of the IMPs from the road class. A total of 38 and 71 IMPs in HH and VV were observed over this road segment. A total of 31 out of 38 IMPs in HH and 67 out of 71 IMPs in VV were labeled as surface scatterers; see Figure 9b, shown in blue. Seven and four IMPs in HH and VV were determined as low-volume scatterers, shown in yellow. The deformation map and deformation time series of all IMPs are shown in Figure 9(b.1,b.3,b.4). The mean deformation velocity is 1.3 mm y 1 , and the maximum subsidence rate is 4.7 mm y 1 . Only one pair of surface scattering IMPs in HH and VV appeared at the same location ( 53.2117 ° N, 5.7138 ° E), performing linearly over time with 1.1 mm y 1 . Five IMPs with surface scattering features in HH and VV had temperature-related movement over time (using Equation (A3)), and the temperature-related parameter η [mm / ° C ] ranges between 0.12 and 0.49 ; see Figure 9(b.2). As the η values are all positive, this implies, in addition to the linear temporal behavior, that those surface scatterers expanded when temperature increased and vice versa.
We also selected a 400 m railway segment, located at 53.1828 ° N, 5.7756 ° E, as the third example. A total of 29 and 27 IMPs in HH and VV were detected, among which there are 20 and 16 double bounce scatterers in HH and VV separately; see Figure 9c in red. The remaining IMPs were labeled as high-volume scatterers in green. Three pairs of double bounce IMPs in HH and VV were observed at the same spots, with an average subsiding rate of 2.2 mm y 1 . The deformation map of all IMPs is shown in Figure 9(c.1), with a mean deformation rate of 1.7 mm y 1 and a maximum subsidence rate of 4.3 mm y 1 . Assuming all double bounce scatterers are reflected from railway infrastructure such as rail tracks, we show the deformation time series of the double bounce IMPs in HH and VV in Figure 9(c.2,c.3). We found that all IMPs in HH and VV follow the linear deformation model, and the deformation trends of them in HH and VV are almost in concert. It implies that irregular settlement over this railway segment is less likely.

4.2.3. Temporal Behavior of IMP Physical Attributes

The physical attribute of every IMP may vary over time; therefore, this section illustrates the scattering mechanism dynamics of five IMPs, with surface, low- and high-volume, and double bounce scattering from the building, road, and railway examples shown in Figure 9. These are one IMP in HH over the building at 53.2034 ° N, 5.8325 ° E, two IMPs over the road segment at 53.2204 ° N, 5.7043 ° E in HH and at 53.2215 ° N, 5.7032 ° E in VV, and two IMPs in HH over the railway segment at 53.1837 ° N, 5.7749 ° E and at 53.1834 ° N, 5.7751 ° E. As every single SAR acquisition is smeared by speckle noise and merely spatial filtering failed to dramatically reduce the noise impact on scattering mechanism classification per acquisition, we then focused on analyzing the temporal evolution and relation of the first two most important features | S H H | 2 + | S V V | 2 and σ H H ° in dB for performing the classification using the Random Forest classification method (see Figure 7). 
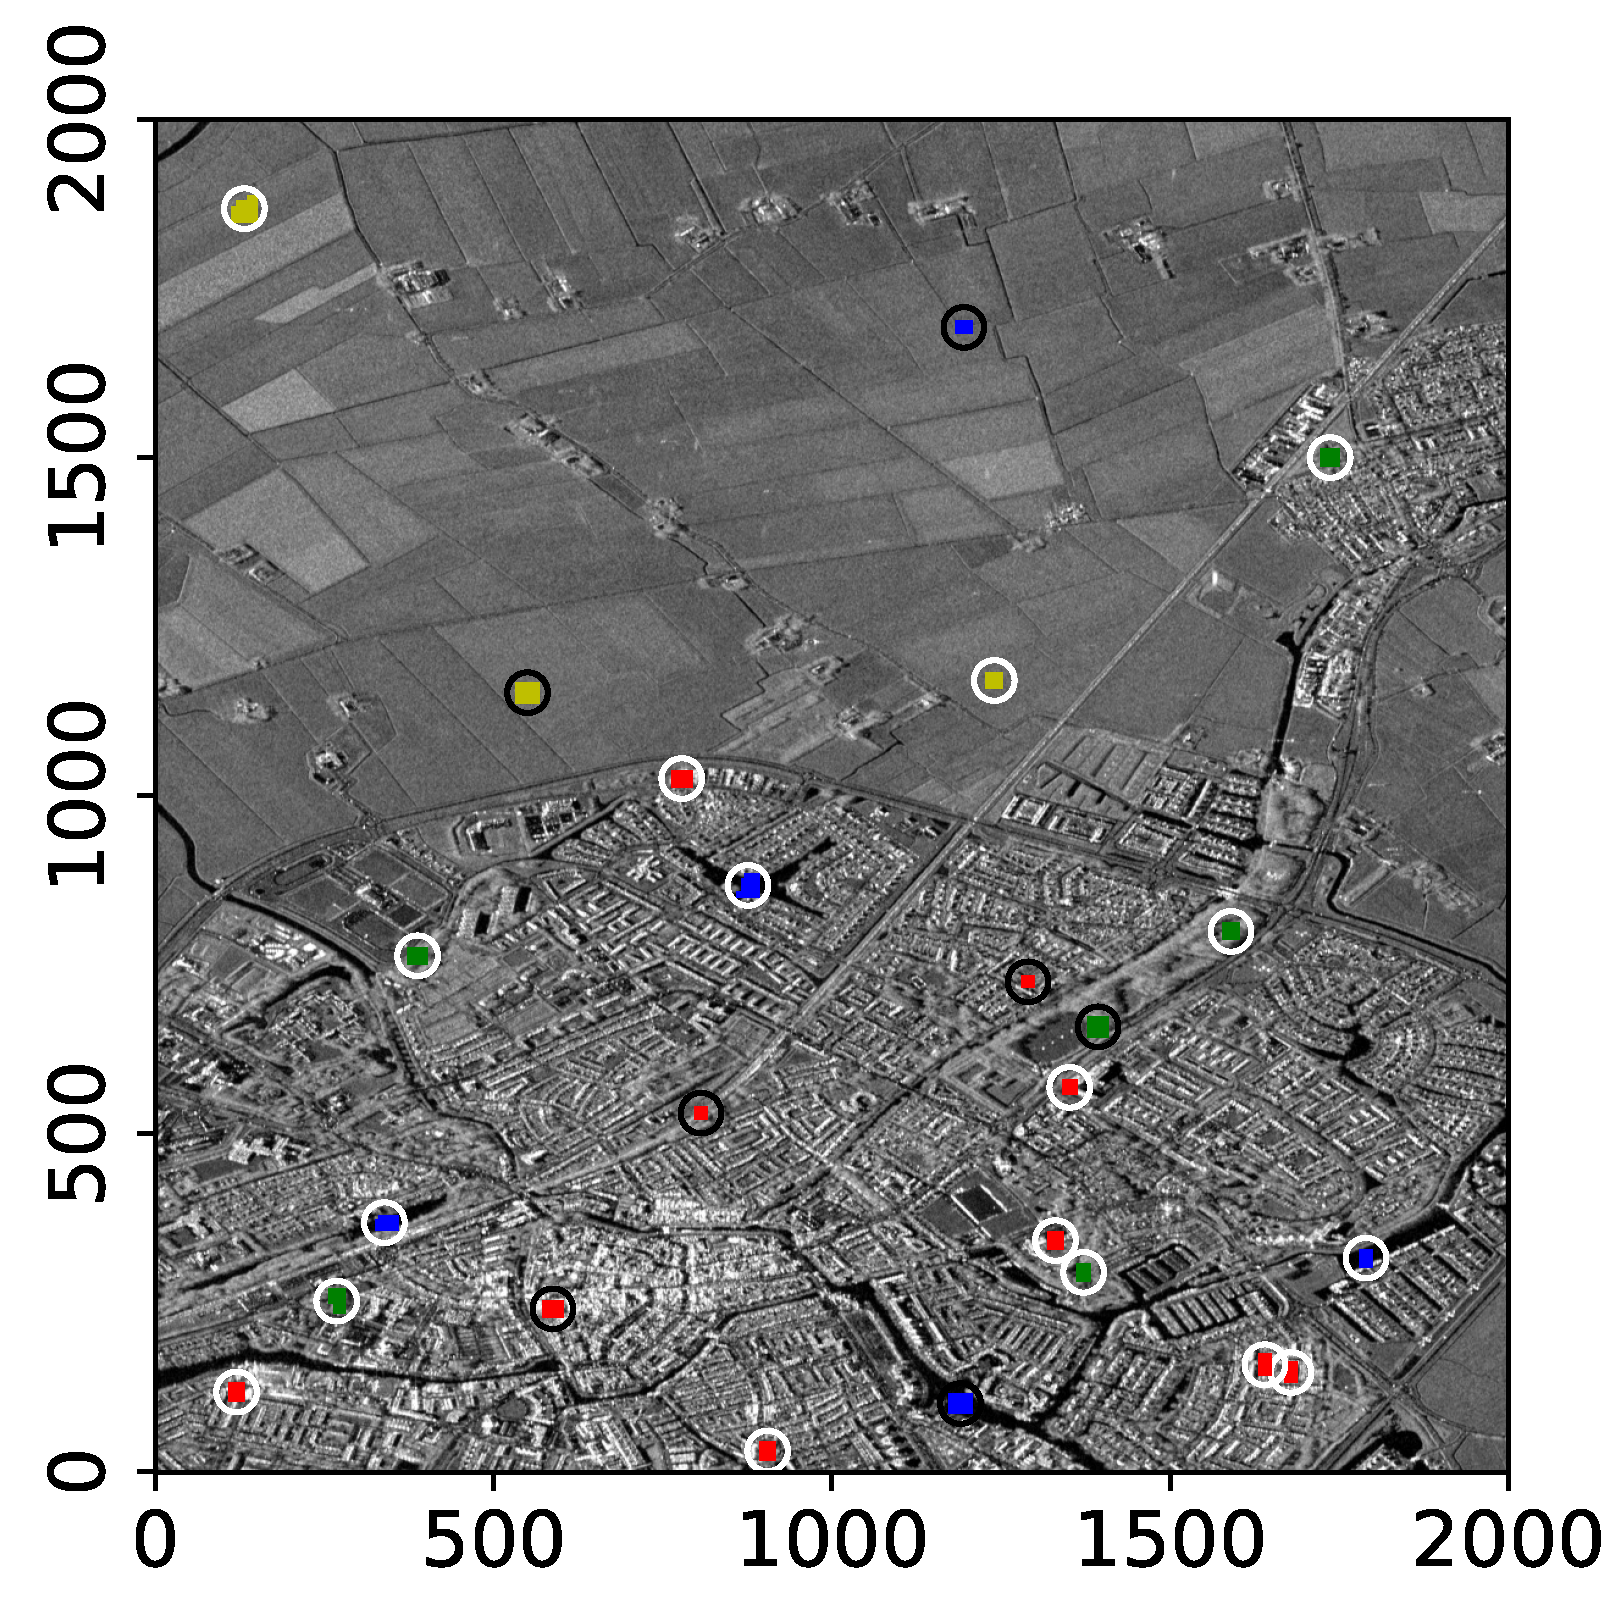
Figure 10a–c show the feature spaces plotted between | S H H | 2 + | S V V | 2 and σ H H ° . The 2D feature spaces were partitioned using the first 50 trees of the trained Random Forest classification method. The bottom-left area of these three subfigures is classified as surface scattering in blue, and the top-right area is classified as double bounce scattering in red. The space in between is classified as low-volume in yellow and high-volume scattering in green. There are also a few instances of double bounce and surface scattering near the boundaries of volume scattering classes. These instances result in overlapping multi-colored lines in the middle of the figures that are due to diversity in the classification prediction results from 50 successive trees. The black outlined colored dots in Figure 10a–c show the temporal evolution of feature values for these five IMPs. Here, the evolution is represented using size and transparency. Specifically, as the epochs increase, both the size and transparency of IMPs increases. The temporally average SAR values that were used for the IMP scattering mechanism classification (see Section 4.2) are shown as the largest dots with the same class color but with a white border. We found that the range of values for both features decrease as IMPs move from double bounce to volume then to surface scattering class. The dispersion of the feature values increases if IMPs follow the same class sequence. The temporally average IMP values separately fall in their respective class partition in the feature space. Moreover, the temporal variation of these two feature values seldom takes the feature values to the the partition of other classes, which can be seen in Figure 10d,e as well. For these instances, we also found that as the precipitation dramatically increased to 42.4 mm on 5 June 2021 from 0 mm on 14 May 2021, pointed out by the black arrow in Figure 2c, the values of these two features for IMPs with surface scattering character indicated by the blue square-line rose accordingly, by 16.6 dB for | S H H | 2 + | S V V | 2 and 9.6 dB for σ H H ° indicated by the black arrow in Figure 10d,e. We suspect that surface soil reflection of such surface IMPs is enhanced, possibly related to the increase in soil moisture, and temporal evolution of (some) surface IMPs resonates with the changes in precipitation cf. [66].

5. Discussion

This study used the GACOS weather model to remove the atmospheric phase, which is at the level of a few centimeters for our case (see Figure 4 in Section 4.1.1). Due to the lack of ground truth data, it is not practically feasible to assess the accuracy of the GACOS-based atmospheric phase result. As for the precision evaluation, we found that the atmospheric phase residuals in all interferograms were well eliminated, and the spatial and temporal deformation smoothness of the IMPs was improved after the GACOS-based atmospheric phase removal. It implies that GACOS is able to denoise the unwrapping phase estimation and improve the deformation estimation of IMPs. In the case of having ground truth data from, e.g., GPS stations, the difference in the double-difference measurements between IMPs and ground truth counterparts is indicative of the performance of the GACOS-based atmospheric phase removal cf. [67].
Regarding the use of the spatial reference selection criteria (Equation (2)) for our case, we implicitly assumed that the TSInSAR-derived deformation estimations have the same uncertainty in HH and VV, resulting in an equal weight of all deformation estimations. If we have the complete stochastic structure of deformation estimations in HH and VV, we can define the appropriate weight values. In this scenario, we can introduce the weight parameters into Equation (2), namely y ^ ref k = q = 1 N y ^ q k ω q k q = 1 N ω q k ( ω q k is the weight of the point q’s deformation, at k t h acquisition). In short, we believe that our spatial reference selection criteria are useful when aligning multi-polarimetric SAR observations.
As for the scattering mechanism classification, we crafted eight incoherent polarimetric features for the Random Forest classifier (Section 4.2.1). The accuracy of the scattering mechanism classification using the Random Forest method and eight representative features was convincing, up to 0.96 (using the OOB error) and 0.91 for the kappa coefficient (see Section 4.2.1). As refs. [25,68] showed, there are coherent polarimetric features such as co-polarimetric phase difference (CPD) that are promising for classification; the coherent polarimetric features will be investigated for future work.
As the result shows that more than half of IMPs in HH and half of IMPs in VV are double bounce scatterers (Table 1), we think it resonates with the nature of constantly/temporarily coherent radar scatterers. By visually comparing IMP spatial distribution (see Figure 8) with the corresponding Landsat-8 optical image acquired in 2021 and TOP10NL, we found that double bounce scatterers mainly reflected from, e.g., buildings and lamp posts along, e.g., roads and railway tracks. Hence, the deformation time series analysis of the double bounce IMPs can be contributed to structural health monitoring and infrastructure damage and risk assessment. The result also shows that some IMPs were labeled as low-volume and high-volume scatterers, and almost all of them kept a linear deformation trend over time. Especially over the railways, the high-volume IMPs account for more than 30 % in HH and VV, which is quite significant. This could be led by the not-high-enough spatial resolution of PAZ SAR data, and relatively small dimension of the railways (with 1.235 m track gauge). To improve this, we recommend using higher resolution SAR data in multi-polarimetric channels including dual- and/or quad- polarization, and other geospatial data for data labeling, training, and testing, or investigating many more features for the scattering mechanism classification.
As we found, some surface scatterers have temperature-related behavior over time, which suggests that these surface scatterers are more susceptible to the variation in temperature than low/high-volume and double bounce scatterers. In addition, significant change in precipitation could lead to a pronounced change in | S H H | 2 + | S V V | 2 and σ H H ° feature time series for the surface IMPs, as we illustrated in Section 4.2.3. We therefore suggest considering the precipitation measures as contextual information when analyzing and modeling the temporal behavior of surface scatterers.

6. Conclusions

In this study, we presented and demonstrated a new scheme to extract meaningful radar scatterer attributes from co-polarimetric SAR images by synthesizing co-polarimetric SAR output, i.e., radar scatterers’ position, deformation, and scattering mechanisms, and assimilating topographic base map information. The analysis of these attributes encompassing geometric, physical, and land-use aspects of radar scatterers contributes to significant improvements in multi-polarimetric SAR data and geo-process interpretation. Radar scatterers’ deformation time series interpretation can now be performed more in-depth for individual ground targets by having physical and land-use attributes. In addition, our scheme can be straightforwardly applied to other dual-pol (with both co- and cross-pol information) and quad-pol SAR data. According to the results showing that more double bounce scatterers can be captured by SAR in HH, and more surface scatterers by SAR in VV, we can maximize the information for land surface mapping and monitoring by integrating the radar scatterers from SAR in HH and VV. Particularly, for monitoring infrastructure such as buildings, SAR in HH is preferred, while for monitoring roads such as runways and highways, SAR in VV is recommended.

Author Contributions

L.C. designed this study and wrote the manuscript; A.K. designed and performed the classification in terms of scattering mechanisms and interpreted the corresponding result; B.Z. carried out time series InSAR analysis; X.Z. joined the discussion and supported data analysis. All authors provided comments and approved the final manuscript.

Funding

This work was supported by the University of Twente.

Data Availability Statement

The data that support the findings of this study are available from the corresponding author, L.C., upon reasonable request.

Acknowledgments

The authors would like to thank the Instituto Nacional De Técnica Aeroespacial (INTA), Publieke Dienstverlening Op de Kaart (PDOK), for providing PAZ SAR data under the project AO-001-030, TOP10NL topographic map, respectively.

Conflicts of Interest

The authors declare no conflict of interest.

Abbreviations

The following abbreviations are used in this manuscript:
SARSynthetic Aperture Radar
InSARInterferometric SAR
TOP10NLdigital topographical base map of the Netherlands
PolSARPolarimetric SAR
TSInSARTime series InSAR
PSIPersistent scatterer interferometry
GNSSGlobal Navigation Satellite System
LULCLand use and land cover
GACOSGeneric Atmospheric Correction Online Service for InSAR
ERA5European Centre for Medium-Range Weather Forecasts Reanalysis v5
ERA-IERA-Interim
MERRA2Modern-Era Retrospective analysis for Research and Applications v2
IMPInSAR measurement point
CCSConstantly coherent radar scatterer
TCSTemporarily coherent radar scatterer
PSPersistent scatterer
DSDistributed scatterer
SLCSingle Look Complex
SBASSmall baseline subset
GPSGlobal Positioning System
NEBNNoise Equivalent Beta Naught
RDRijksdriehoekscoordinaten
OOBOut of the bag
MDAMean Decrease Accuracy
ECMWFEuropean Centre for Medium-Range Weather Forecasts
SRTMShuttle Radar Topography Mission
DEMDigital Elevation Model
ASTERAdvanced Spaceborne Thermal Emission and Reflection Radiometer
GDEMGlobal Digital Elevation Model
ITDIterative Tropospheric Decomposition
CPDCo-polarimetric phase difference

Appendix A. SAR Master Image Selection Criterion

Ref. [34] developed the stack coherence γ M for the optimal master image selection, which is defined as
γ M = 1 m i = 0 m g ( B M , i , B c r i t i c a l ) × g ( B T M , i , B T c r i t i c a l ) ) × g ( f d c M , i , f d c c r i t i c a l ) ,
where
g ( x , c ) = 1 | x | / c if | x | < c 0 otherwise .
Here, the superscript M indicates the SAR master image, B M , i is the perpendicular baseline between SAR images M and i, B T M , i is the temporal baseline, and f d c M , i is the Doppler baseline. B c r i t i c a l , B T c r i t i c a l , f d c c r i t i c a l are the critical baseline values at which the interferogram is totally decorrelated, and all of them are the representation of c in Equation (A2). Note that the setup and use of B c r i t i c a l and B T c r i t i c a l are different from C r i t i c a l ( B ) and C r i t i c a l ( B T ) in Section 4.1.1. The former ones are used for the super single master selection, while the latter ones for the SBAS interferogram pair selection. B c r i t i c a l equals to λ w B r g R tan ( θ i n c ζ ) c ( λ w is the wavelength, B r g is the range bandwidth, R is the slant distance, θ i n c is the incidence angle, ζ is the topographic slope, and c is the speed of the light) [69].

Appendix B. Information on SAR Acquisitions for Interferogram Generation

Here, we list the SAR pairs (including the master and slave acquisition) to generate 181 interferograms in Table A1.
Table A1. Acquisition information for 181 interferogram generation. ID indicates the interferogram index, and the format of the master and slave acquisition date is yyyymmdd.
IDMaster, Slave DateIDMaster, Slave DateIDMaster, Slave DateIDMaster, Slave Date
120190928, 201911114720200116, 202006189220200618, 2021012413720210215, 20210422
220190928, 201912034820200116, 202008019320200618, 2021021513820210215, 20210514
320190928, 201912254920200116, 202010289420200618, 2021030913920210215, 20210605
420190928, 202001165020200207, 202002299520200618, 2021042214020210215, 20210719
520190928, 202002075120200207, 202004139620200801, 2020102814120210215, 20210810
620190928, 202005275220200207, 202005059720200801, 2020121114220210215, 20210923
720191020, 201911115320200207, 202005279820200801, 2021010214320210309, 20210331
820191020, 201912035420200207, 202006189920200801, 2021012414420210309, 20210422
920191020, 202001165520200207, 2020080110020200801, 2021021514520210309, 20210514
1020191020, 202002295620200207, 2020121110120200801, 2021030914620210309, 20210605
1120191020, 202003225720200229, 2020032210220200801, 2021042214720210309, 20210719
1220191020, 202004135820200229, 2020041310320201006, 2020102814820210309, 20210810
1320191111, 201912035920200229, 2020050510420201006, 2021012414920210309, 20210901
1420191111, 201912256020200229, 2020052710520201006, 2021033115020210309, 20210923
1520191111, 202001166120200229, 2020061810620201028, 2020121115120210309, 20211015
1620191111, 202002076220200229, 2020080110720201028, 2021012415220210331, 20210422
1720191111, 202002296320200229, 2020102810820201028, 2021021515320210331, 20210605
1820191111, 202003226420200322, 2020041310920201028, 2021030915420210331, 20210901
1920191111, 202004136520200322, 2020050511020201028, 2021033115520210331, 20211015
2020191111, 202005056620200322, 2020061811120201028, 2021042215620210422, 20210514
2120191111, 202005276720200322, 2020100611220201028, 2021060515720210422, 20210605
2220191111, 202006186820200322, 2020102811320201211, 2021010215820210422, 20210719
2320191111, 202008016920200413, 2020050511420201211, 2021012415920210422, 20210810
2420191203, 201912257020200413, 2020052711520201211, 2021021516020210422, 20210901
2520191203, 202001167120200413, 2020061811620201211, 2021030916120210422, 20210923
2620191203, 202002077220200413, 2020080111720201211, 2021042216220210422, 20211015
2720191203, 202002297320200413, 2020102811820201211, 2021051416320210514, 20210605
2820191203, 202003227420200413, 2021012411920201211, 2021060516420210514, 20210719
2920191203, 202004137520200505, 2020052712020201211, 2021071916520210514, 20210810
3020191203, 202005057620200505, 2020061812120201211, 2021081016620210514, 20210923
3120191203, 202005277720200505, 2020080112220210102, 2021021516720210605, 20210719
3220191203, 202006187820200505, 2020102812320210102, 2021030916820210605, 20210810
3320191203, 202008017920200505, 2020121112420210102, 2021042216920210605, 20210901
3420191225, 202001168020200505, 2021012412520210102, 2021051417020210605, 20210923
3520191225, 202002078120200505, 2021030912620210102, 2021071917120210605, 20211015
3620191225, 202002298220200527, 2020061812720210102, 2021081017220210719, 20210810
3720191225, 202005058320200527, 2020080112820210124, 2021021517320210719, 20210901
3820191225, 202005278420200527, 2020102812920210124, 2021030917420210719, 20210923
3920191225, 202006188520200527, 2020121113020210124, 2021033117520210719, 20211015
4020191225, 202008018620200527, 2021010213120210124, 2021042217620210810, 20210901
4120200116, 202002078720200527, 2021021513220210124, 2021060517720210810, 20210923
4220200116, 202002298820200618, 2020080113320210124, 2021090117820210810, 20211015
4320200116, 202003228920200618, 2020102813420210124, 2021092317920210901, 20210923
4420200116, 202004139020200618, 2020121113520210124, 2021101518020210901, 20211015
4520200116, 202005059120200618, 2021010213620210215, 2021030918120210923, 20211015
4620200116, 20200527

Appendix C. Random Forest Classifier Performance Assessment

We tested the Random Forest classifier over a test set indicated by the colored patches within the white circles; see Figure A1. The used training sample patches are circled in black. The patches in red, yellow, green, and blue separately represent the samples of double bounce, low- and high-volume, and surface scattering. The number of the test samples in this test set for double bounce, low- and high-volume, and surface scattering is 673 , 675 , 675 , and 649 , respectively. The corresponding confusion matrix cf. [70], after the Random Forest classification, was used to calculate the kappa coefficient and F 1 -score, and is shown in Table A2.
Figure A1. A test set located in the city of Sneek, covering 2000 × 2000 pixels. The test set is encircled by the white circle, and the training sample patches are encircled by the black circle. The patches in red, yellow, green, and blue separately represent the samples of double bounce, low- and high-volume, and surface scattering.
Remotesensing 15 01571 g0a1
Table A2. Confusion matrix of the samples.
Reference Data
Double BounceLow-VolumeHigh-VolumeSurface
Classified dataDouble bounce6518104
Low-volume06411519
High-volume4196520
Surface000649

Appendix D. Parametrization for the Temperature-Related Deformation

A change in temperature may result in a change in the volume of ground targets. Supposing such a change in volume is projected on the satellite line-of-sight direction, as the temperature-related deformation μ k ( η ) , ( k ) , we can parametrize it by [64]
μ k ( η ) = Δ T k · η ,
where Δ T k represents the temperature difference between the kth and the master acquisition, and η is the unknown temperature-related parameter.

References

  1. Curlander, J.C.; McDonough, R.N. Synthetic Aperture Radar; Wiley: New York, NY, USA, 1991; Volume 11. [Google Scholar]
  2. Bamler, R.; Hartl, P. Synthetic aperture radar interferometry. Inverse Probl. 1998, 14, R1. [Google Scholar] [CrossRef]
  3. Ferretti, A.; Prati, C.; Rocca, F. Permanent Scatterers in SAR Interferometry. IEEE Trans. Geosci. Remote Sens. 2001, 39, 8–20. [Google Scholar] [CrossRef]
  4. Amelung, F.; Galloway, D.L.; Bell, J.W.; Zebker, H.A.; Laczniak, R.J. Sensing the ups and downs of Las Vegas: InSAR reveals structural control of land subsidence and aquifer-system deformation. Geology 1999, 27, 483–486. [Google Scholar] [CrossRef]
  5. Motagh, M.; Djamour, Y.; Walter, T.R.; Wetzel, H.U.; Zschau, J.; Arabi, S. Land subsidence in Mashhad Valley, northeast Iran: Results from InSAR, levelling and GPS. Geophys. J. Int. 2007, 168, 518–526. [Google Scholar] [CrossRef]
  6. Chen, F.; Lin, H.; Yeung, K.; Cheng, S. Detection of slope instability in Hong Kong based on multi-baseline differential SAR interferometry using ALOS PALSAR data. GISci. Remote Sens. 2010, 47, 208–220. [Google Scholar] [CrossRef]
  7. Chaussard, E.; Wdowinski, S.; Cabral-Cano, E.; Amelung, F. Land subsidence in central Mexico detected by ALOS InSAR time-series. Remote Sens. Environ. 2014, 140, 94–106. [Google Scholar] [CrossRef]
  8. Malinowska, A.A.; Witkowski, W.T.; Hejmanowski, R.; Chang, L.; van Leijen, F.J.; Hanssen, R.F. Sinkhole occurrence monitoring over shallow abandoned coal mines with satellite-based persistent scatterer interferometry. Eng. Geol. 2019, 262, 105336. [Google Scholar] [CrossRef]
  9. Zhang, B.; Chang, L.; Stein, A. A model-backfeed deformation estimation method for revealing 20-year surface dynamics of the Groningen gas field using multi-platform SAR imagery. Int. J. Appl. Earth Obs. Geoinf. 2022, 111, 102847. [Google Scholar] [CrossRef]
  10. Palma, J.S.; Gonzalez, A.S.; Hervas, I.M.; Sanz, F.M.; Labriola, M.; Cengotitabengoa, J.M.; Molleda, F.G.; Aguado, S.M.; Perez, P.S.; Soteras, J.C.; et al. SAR panel design and performance for the PAZ mission. In Proceedings of the 8th European Conference on Synthetic Aperture Radar, Aachen, Germany, 7–10 June 2010; VDE Verlag: Berlin, Germany, 2010; pp. 1–4. [Google Scholar]
  11. Eoportal. PAZ SAR Satellite Mission of Spain. 2019. Available online: https://directory.eoportal.org/web/eoportal/satellite-missions/p/paz (accessed on 1 February 2020).
  12. Torres, R.; Snoeij, P.; Geudtner, D.; Bibby, D.; Davidson, M.; Attema, E.; Potin, P.; Rommen, B.; Floury, N.; Brown, M.; et al. GMES Sentinel-1 mission. Remote Sens. Environ. 2012, 120, 9–24. [Google Scholar] [CrossRef]
  13. Thompson, A.A. Overview of the RADARSAT constellation mission. Can. J. Remote Sens. 2015, 41, 401–407. [Google Scholar] [CrossRef]
  14. Rosenqvist, A.; Shimada, M.; Ito, N.; Watanabe, M. ALOS PALSAR: A pathfinder mission for global-scale monitoring of the environment. IEEE Trans. Geosci. Remote Sens. 2007, 45, 3307–3316. [Google Scholar] [CrossRef]
  15. Lee, J.S.; Pottier, E. Polarimetric Radar Imaging: From Basics to Applications; CRC Press: Boca Raton, FL, USA, 2017. [Google Scholar]
  16. Shamshiri, R.; Nahavandchi, H.; Motagh, M. Persistent scatterer analysis using dual-polarization Sentinel-1 data: Contribution from VH channel. IEEE J. Sel. Top. Appl. Earth Obs. Remote Sens. 2018, 11, 3105–3112. [Google Scholar] [CrossRef]
  17. Antropov, O.; Rauste, Y.; Hame, T. Volume scattering modeling in PolSAR decompositions: Study of ALOS PALSAR data over boreal forest. IEEE Trans. Geosci. Remote Sens. 2011, 49, 3838–3848. [Google Scholar] [CrossRef]
  18. Qi, Z.; Yeh, A.G.O.; Li, X.; Lin, Z. A novel algorithm for land use and land cover classification using RADARSAT-2 polarimetric SAR data. Remote Sens. Environ. 2012, 118, 21–39. [Google Scholar] [CrossRef]
  19. Jacob, A.W.; Vicente-Guijalba, F.; Lopez-Martinez, C.; Lopez-Sanchez, J.M.; Litzinger, M.; Kristen, H.; Mestre-Quereda, A.; Ziółkowski, D.; Lavalle, M.; Notarnicola, C.; et al. Sentinel-1 InSAR coherence for land cover mapping: A comparison of multiple feature-based classifiers. IEEE J. Sel. Top. Appl. Earth Obs. Remote Sens. 2020, 13, 535–552. [Google Scholar] [CrossRef] [Green Version]
  20. Hanssen, R.F. Radar Interferometry: Data Interpretation and Error Analysis; Kluwer Academic Publishers: Dordrecht, The Netherlands, 2001. [Google Scholar]
  21. Hooper, A.; Zebker, H.; Segall, P.; Kampes, B. A new method for measuring deformation on volcanoes and other non-urban areas using InSAR persistent scatterers. Geophys. Res. Lett. 2004, 31, L23611. [Google Scholar] [CrossRef]
  22. Lanari, R.; Mora, O.; Manunta, M.; Mallorquí, J.J.; Berardino, P.; Sansosti, E. A small-baseline approach for investigating deformations on full-resolution differential SAR interferograms. IEEE Trans. Geosci. Remote Sens. 2004, 42, 1377–1386. [Google Scholar] [CrossRef]
  23. Zhang, L.; Ding, X.; Lu, Z. Ground settlement monitoring based on temporarily coherent points between two SAR acquisitions. ISPRS J. Photogramm. Remote Sens. 2011, 66, 146–152. [Google Scholar] [CrossRef]
  24. Hu, F.; Leijen, F.J.v.; Chang, L.; Wu, J.; Hanssen, R.F. Monitoring deformation along railway systems combining multi-temporal InSAR and LiDAR data. Remote Sens. 2019, 11, 2298. [Google Scholar] [CrossRef] [Green Version]
  25. Chang, L.; Stein, A. Exploring PAZ co-polarimetric SAR data for surface movement mapping and scattering characterization. Int. J. Appl. Earth Obs. Geoinf. 2021, 96, 102280. [Google Scholar] [CrossRef]
  26. Chang, L.; Hanssen, R.F. Detection of cavity migration and sinkhole risk using radar interferometric time series. Remote Sens. Environ. 2014, 147, 56–64. [Google Scholar] [CrossRef]
  27. Lee, J.S.; Grunes, M.R.; Ainsworth, T.L.; Du, L.J.; Schuler, D.L.; Cloude, S.R. Unsupervised classification using polarimetric decomposition and the complex Wishart classifier. IEEE Trans. Geosci. Remote Sens. 1999, 37, 2249–2258. [Google Scholar]
  28. Bi, H.; Sun, J.; Xu, Z. A graph-based semisupervised deep learning model for PolSAR image classification. IEEE Trans. Geosci. Remote Sens. 2018, 57, 2116–2132. [Google Scholar] [CrossRef]
  29. Parikh, H.; Patel, S.; Patel, V. Classification of SAR and PolSAR images using deep learning: A review. Int. J. Image Data Fusion 2020, 11, 1–32. [Google Scholar] [CrossRef]
  30. Millard, K.; Richardson, M. On the importance of training data sample selection in random forest image classification: A case study in peatland ecosystem mapping. Remote Sens. 2015, 7, 8489–8515. [Google Scholar] [CrossRef] [Green Version]
  31. Berardino, P.; Fornaro, G.; Lanari, R.; Sansosti, E. A New Algorithm for Surface Deformation Monitoring Based on Small Baseline Differential SAR Interferograms. IEEE Trans. Geosci. Remote Sens. 2002, 40, 2375–2383. [Google Scholar] [CrossRef] [Green Version]
  32. Tizzani, P.; Berardino, P.; Casu, F.; Euillades, P.; Manzo, M.; Ricciardi, G.; Zeni, G.; Lanari, R. Surface deformation of Long Valley caldera and Mono Basin, California, investigated with the SBAS-InSAR approach. Remote Sens. Environ. 2007, 108, 277–289. [Google Scholar] [CrossRef]
  33. Lanari, R.; Berardino, P.; Bonano, M.; Casu, F.; Manconi, A.; Manunta, M.; Manzo, M.; Pepe, A.; Pepe, S.; Sansosti, E.; et al. Surface displacements associated with the L’Aquila 2009 Mw 6.3 earthquake (central Italy): New evidence from SBAS-DInSAR time series analysis. Geophys. Res. Lett. 2010, 37. [Google Scholar] [CrossRef]
  34. Kampes, B.M. Radar Interferometry; Springer: Dordrecht, The Netherlands, 2006; Volume 12. [Google Scholar]
  35. Simonetto, E.; Follin, J.M. An overview on interferometric SAR software and a comparison between DORIS and SARSCAPE packages. In Geospatial Free and Open Source Software in the 21st Century; Springer: Berlin/Heidelberg, Germany, 2012; pp. 107–122. [Google Scholar]
  36. Quegan, S.; Yu, J.J. Filtering of multichannel SAR images. IEEE Trans. Geosci. Remote Sens. 2001, 39, 2373–2379. [Google Scholar] [CrossRef]
  37. Lee, J.S.; Wen, J.H.; Ainsworth, T.L.; Chen, K.S.; Chen, A.J. Improved sigma filter for speckle filtering of SAR imagery. IEEE Trans. Geosci. Remote Sens. 2008, 47, 202–213. [Google Scholar]
  38. Vasile, G.; Trouvé, E.; Lee, J.S.; Buzuloiu, V. Intensity-driven adaptive-neighborhood technique for polarimetric and interferometric SAR parameters estimation. IEEE Trans. Geosci. Remote Sens. 2006, 44, 1609–1621. [Google Scholar] [CrossRef] [Green Version]
  39. Kulshrestha, A.; Chang, L.; Stein, A. Use of LSTM for Sinkhole-Related Anomaly Detection and Classification of InSAR Deformation Time Series. IEEE J. Sel. Top. Appl. Earth Obs. Remote Sens. 2022, 15, 4559–4570. [Google Scholar] [CrossRef]
  40. Small, D. Flattening gamma: Radiometric terrain correction for SAR imagery. IEEE Trans. Geosci. Remote Sens. 2011, 49, 3081–3093. [Google Scholar] [CrossRef]
  41. Cloude, S.R.; Pottier, E. A review of target decomposition theorems in radar polarimetry. IEEE Trans. Geosci. Remote Sens. 1996, 34, 498–518. [Google Scholar] [CrossRef]
  42. Cloude, S.R.; Pottier, E. An entropy based classification scheme for land applications of polarimetric SAR. IEEE Trans. Geosci. Remote Sens. 1997, 35, 68–78. [Google Scholar] [CrossRef]
  43. Breiman, L. Random forests. Mach. Learn. 2001, 45, 5–32. [Google Scholar] [CrossRef] [Green Version]
  44. Shafai, S.S.; Kumar, S. PolInSAR coherence and entropy-based hybrid decomposition model. Earth Space Sci. 2020, 7, e2020EA001279. [Google Scholar] [CrossRef]
  45. Pal, M. Random forest classifier for remote sensing classification. Int. J. Remote Sens. 2005, 26, 217–222. [Google Scholar] [CrossRef]
  46. Gislason, P.O.; Benediktsson, J.A.; Sveinsson, J.R. Random forests for land cover classification. Pattern Recognit. Lett. 2006, 27, 294–300. [Google Scholar] [CrossRef]
  47. Biau, G.; Scornet, E. A random forest guided tour. Test 2016, 25, 197–227. [Google Scholar] [CrossRef] [Green Version]
  48. Belgiu, M.; Drăguţ, L. Random forest in remote sensing: A review of applications and future directions. ISPRS J. Photogramm. Remote Sens. 2016, 114, 24–31. [Google Scholar] [CrossRef]
  49. Sutton, C.D. Classification and regression trees, bagging, and boosting. Handb. Stat. 2005, 24, 303–329. [Google Scholar]
  50. Cohen, J. A coefficient of agreement for nominal scales. Educ. Psychol. Meas. 1960, 20, 37–46. [Google Scholar] [CrossRef]
  51. Powers, D.M. Evaluation: From precision, recall and F-measure to ROC, informedness, markedness and correlation. arXiv 2020, arXiv:2010.16061. [Google Scholar]
  52. Archer, K.J.; Kimes, R.V. Empirical characterization of random forest variable importance measures. Comput. Stat. Data Anal. 2008, 52, 2249–2260. [Google Scholar] [CrossRef]
  53. Louppe, G.; Wehenkel, L.; Sutera, A.; Geurts, P. Understanding variable importances in forests of randomized trees. Adv. Neural Inf. Process. Syst. 2013, 26. [Google Scholar]
  54. Hisdesat. PAZ Image Product Guide, PAZ-HDS-GUI-001. 2019. Available online: https://www.hisdesat.es/wp-content/uploads/2019/10/PAZ-HDS-GUI-001-PAZ-Image-Product-Guide-issue-1.1-.pdf (accessed on 26 June 2019).
  55. Mulder, G.; Van Leijen, F.J.; Barkmeijer, J.; De Haan, S.; Hanssen, R.F. Estimating Single-Epoch Integrated Atmospheric Refractivity From InSAR for Assimilation in Numerical Weather Models. IEEE Trans. Geosci. Remote Sens. 2022, 60, 1–12. [Google Scholar] [CrossRef]
  56. Molteni, F.; Buizza, R.; Palmer, T.N.; Petroliagis, T. The ECMWF ensemble prediction system: Methodology and validation. Q. J. R. Meteorol. Soc. 1996, 122, 73–119. [Google Scholar] [CrossRef]
  57. van Zyl, J.J. The Shuttle Radar Topography Mission (SRTM): A breakthrough in remote sensing of topography. Acta Astronaut. 2001, 48, 559–565. [Google Scholar] [CrossRef]
  58. Tachikawa, T.; Hato, M.; Kaku, M.; Iwasaki, A. Characteristics of ASTER GDEM version 2. In Proceedings of the 2011 IEEE International Geoscience and Remote Sensing Symposium, Vancouver, BC, Canada, 24–29 July 2011; pp. 3657–3660. [Google Scholar]
  59. Yu, C.; Penna, N.T.; Li, Z. Generation of real-time mode high-resolution water vapor fields from GPS observations. J. Geophys. Res. Atmos. 2017, 122, 2008–2025. [Google Scholar] [CrossRef]
  60. Wicks, C.W., Jr.; Dzurisin, D.; Ingebritsen, S.; Thatcher, W.; Lu, Z.; Iverson, J. Magmatic activity beneath the quiescent Three Sisters volcanic center, central Oregon Cascade Range, USA. Geophys. Res. Lett. 2002, 29, 26-1–26-4. [Google Scholar] [CrossRef] [Green Version]
  61. Hartemink, A.E.; Sonneveld, M.P. Soil maps of the Netherlands. Geoderma 2013, 204, 1–9. [Google Scholar] [CrossRef]
  62. DEOS. Delft Object-Oriented Radar Interferometric Software: Unser’s Manual and Technical Documentation. 2012. Available online: http://doris.tudelft.nl (accessed on 1 February 2022).
  63. Hooper, A.; Bekaert, D.; Hussain, E.; Spaans, K. StaMPS/MTI Manual, Version 4.1b. 2018. Available online: https://homepages.see.leeds.ac.uk/~earahoo/stamps/ (accessed on 1 February 2022).
  64. Chang, L.; Hanssen, R.F. A probabilistic approach for InSAR time-series postprocessing. IEEE Trans. Geosci. Remote Sens. 2015, 54, 421–430. [Google Scholar] [CrossRef] [Green Version]
  65. Branco, P.; Torgo, L.; Ribeiro, R.P. A survey of predictive modeling on imbalanced domains. ACM Comput. Surv. (CSUR) 2016, 49, 1–50. [Google Scholar] [CrossRef] [Green Version]
  66. Pultz, T.; Leconte, R.; Brown, R.; Brisco, B. Quantitative soil moisture extraction from airborne SAR data. Can. J. Remote Sens. 1990, 16, 56–62. [Google Scholar] [CrossRef]
  67. Mahapatra, P.; der Marel, H.v.; van Leijen, F.; Samiei-Esfahany, S.; Klees, R.; Hanssen, R. InSAR datum connection using GNSS-augmented radar transponders. J. Geod. 2018, 92, 21–32. [Google Scholar] [CrossRef] [Green Version]
  68. Leinss, S.; Parrella, G.; Hajnsek, I. Snow height determination by polarimetric phase differences in X-band SAR data. IEEE J. Sel. Top. Appl. Earth Obs. Remote Sens. 2014, 7, 3794–3810. [Google Scholar] [CrossRef]
  69. Zebker, H.A.; Villasenor, J. Decorrelation in interferometric radar echoes. IEEE Trans. Geosci. Remote Sens. 1992, 30, 950–959. [Google Scholar] [CrossRef] [Green Version]
  70. Stehman, S.V. Selecting and interpreting measures of thematic classification accuracy. Remote Sens. Environ. 1997, 62, 77–89. [Google Scholar] [CrossRef]
Figure 1. Flowchart. It presents our proposed methods (in the rounded rectangle) and expected output (in the rectangle) when using a stack of co-polarimetric SAR data and external topographic measurements from TOP10NL (in the parallelogram). IMPs, CCSs, and TCSs are separately short for InSAR measurement points, constant coherent scatterers, and temporarily coherent scatterers. The red, blue, and green arrows show the procedure for extracting geometric, physical, and land-use attributes, respectively.
Remotesensing 15 01571 g001
Figure 2. (a) Single-master baseline network. The master SAR acquisition on 28 October 2020 and all slave acquisitions are indicated by the star and circle, respectively. (b) Multi-master baseline network, and (c) temperature in black and precipitation data in blue.
Remotesensing 15 01571 g002
Figure 3. Coverage of the test site shown in red, along with the TOP10NL-based land-use classification map. This test site is in the north part of the Netherlands, as presented in the inlet, outlined by the red rectangle.
Remotesensing 15 01571 g003
Figure 4. IMP GACOS-based atmospheric phase distribution of all 181 interferograms in (a) HH and (b) VV. Each colored column represents the IMP atmospheric phase distribution in the corresponding IDth interferogram (ID [ 1 , 181 ] ). Per column, the color depicts the area of the Normal distribution. The interferogram index ID information is listed in Table A1.
Remotesensing 15 01571 g004
Figure 5. Line-of-sight deformation map of IMPs in (a) HH and (b) VV. The blue pentagrams indicate the location of the 16 reference sibling pairs, shown in subfigure (a).
Remotesensing 15 01571 g005
Figure 6. Cumulative deformation time series of the 16 selected reference siblings in (a) HH and (b) VV. (c) Average deformation time series of the 16 reference points in HH (square) and in VV (circle), and the deformation time series of the common reference (dot line).
Remotesensing 15 01571 g006
Figure 7. Feature importance evaluation.
Remotesensing 15 01571 g007
Figure 8. (a) Scattering mechanism classification map. Spatial distribution of IMPs with double bounce scattering in (b) HH and (f) VV, low-volume scattering in (c) HH and (g) VV, high-volume scattering in (d) HH and (h) VV, and surface scattering in (e) HH and (i) VV. The color in subfigures (bi) depicts the IMP deformation velocity in line-of-sight direction, and the backdrop is the averaged amplitude over time.
Remotesensing 15 01571 g008
Figure 9. (a) Deformation map of a building, along with the line-of-sight deformation time series of IMPs in (a.1) HH and (a.2) VV over this building. (b) Scattering mechanism classification map of a road segment. (b.1) deformation map of this road segment, and (b.2) temperature-related deformation information, and deformation time series of IMPs in (b.3) HH and (b.4) VV. (c) Scattering mechanism classification map of a railway segment and (c.1) deformation map of this railway segment. The deformation time series of the double bounce IMPs in (c.2) HH and (c.3) VV over this railway segment.
Remotesensing 15 01571 g009
Figure 10. Relation of the first two most important features | S H H | 2 + | S V V | 2 and σ H H ° for five IMPs from (a) the building, (b) road, and (c) railway examples shown in Figure 9. (d) | S H H | 2 + | S V V | 2 and (e) σ H H ° temporal evolution of these five IMPs. All feature values are in dB.
Remotesensing 15 01571 g010
Table 1. Total number of IMPs in HH and VV with double bounce, low-volume, high-volume, and surface scattering mechanism (SM).
SMDouble BounceLow-VolumeHigh-VolumeSurface
HH302,58664,482120,11250,806
VV245,05671,50491,10278,012
Table 2. Total number of IMPs in HH and VV labeled as building, road, water, railway, and uncharted class.
BuildingsRoadsWaterRailwaysUncharted
HH343,96781,701113332,97578,210
VV273,612109,944109332,29168,734
Table 3. Scattering mechanism class percentage of IMPs in HH and VV from buildings, roads, and railways.
Double BounceLow-VolumeHigh-VolumeSurface
BuildingsHH64%9%21%6%
VV64%11%19%6%
RoadsHH37%20%18%25%
VV23%22%11%44%
RailwaysHH55%9%35%1%
VV52%13%34%1%
Disclaimer/Publisher’s Note: The statements, opinions and data contained in all publications are solely those of the individual author(s) and contributor(s) and not of MDPI and/or the editor(s). MDPI and/or the editor(s) disclaim responsibility for any injury to people or property resulting from any ideas, methods, instructions or products referred to in the content.

