1. Introduction
The maritime industry is currently playing an important role in the transportation of essential materials and goods as 71% of the Earth’s surface is covered by the maritime environment, and the ocean and sea areas are considered to be the foundation of global trade [
1]. According to the report published at the United Nations Conference on Trade and Development (UNCTAD), ocean shipping is responsible for transporting approximately 90% of global trade [
2,
3]. Furthermore, with the rapid development of the world economy, the volume of international maritime trade and global supply chains is projected to grow by 2.4% between 2022 and 2026 [
2].
Based on these facts, we must deal with a vast amount of data for marine map reading and surveillance, and, as a result, certain significant maritime events may be lost and concealed in routine traffic patterns.
Figure 1, which is extracted from our AIS dataset, shows that there are around 2000 ships sailing in the Baltic marine area every day. Although sophisticated and technological equipment in the shipping industry, such as Synthetic Aperture Radar (SAR), drones, and various blockchain applications have shown promising performances in detecting dark ships, detecting abnormal vessel behavior, which starts by turning off the AIS, is still a challenging task for most maritime agents, such as coastguards, border protection agents, shipping companies, and maritime authorities. Detecting dark ships is a vital task for the world as the number of instances of smuggling using dark ships is dramatically increasing day by day. According to the United Nations Office on Drugs and Crime (UNODC), most of the cocaine sold in Europe drug markets is smuggled into the continent via ocean shipments, especially dark ships [
4]. Moreover, it is forecasted that the COVID-19 measures’ reduction in aviation travel to Europe will probably result in an increased direct cocaine trafficking by sea from South America to Europe [
4].
Based on the survey study [
5] that we conducted as the first stage of our research plan, we have noticed that the vessel abnormal behavior detection methods are generally divided into three main categories: (1) fixed-size parametric methods, (2) non-parametric methods, and (3) clustering methods. The anomaly detection framework in [
6] uses the Support Vector Model (SVM), which is one of the parametric methods for the vessel movement classification task. They used vessel tracking information from Port Klang for a three-month period. They first separated the data into normal and pathological categories. Then, they developed two further categories: random abnormal and random normal tracks. After that, the random anomaly dataset was combined with the group of normal track data to train the model, and the random normal dataset was combined with the group of anomaly track data to test the SVMs classification model. Non-parametric methods are more flexible than parametric methods. In [
7], a multi-task deep learning approach is proposed to track ships and their activities using Recurrent Neural Networks (RNNs) with latent variables and an embedding of AIS data. This approach alleviated several problems with AIS communications, such as excessive noise and erroneous time sampling. The last category of vessel abnormal behavior methods is clustering algorithms, which are currently receiving much attention for complex problems in the marine domain. Clustering methods have been applied for different marine applications, such as maritime route detection, clustering vessel trajectories, and port recognition [
8].
The main purpose of this research study is to improve and enhance the level of situational awareness in the maritime environment by conducting a comprehensive study of well-known clustering methods for detecting abnormal vessel behavior, including “dark ships” and “spiral vessel movements”. Dark ships refer to vessels that intentionally turn off their identification systems, including the automatic identification system (AIS), to evade detection by authorities. Spiral vessel movements, on the other hand, refer to vessels that exhibit circular or spiral trajectories, which may indicate suspicious activities such as searching for objects or performing illegal activities. These vessel behaviors pose a significant threat to maritime security and require efficient and effective detection methods. For this purpose, we used the Baltic Sea AIS data, which have been collected through two open Application Programming Interfaces (APIs). The AIS is an automated tracking system used to identify and locate boats, and each ship exchanges its own AIS data with other ships, vessel traffic services, and satellite radars. The International Maritime Organization (IMO) states that the development of the AIS has three main objectives: to improve maritime traffic safety, facilitate target tracking, and facilitate smoother vessel traffic flow [
9]. Large ships (container, cargo, tanker, military, etc.) and passenger ships are required to have AIS equipment on board in accordance with the Safety of Life at Sea (SOLAS) treaty [
10]. As a result, AIS data are widely available, uniform, and reliable everywhere. Due to AIS system availability, AIS data may be used for the modeling and analysis of maritime transportation flow worldwide.
In this paper, we investigated the performance of four well-known clustering methods: K-means, Density-Based Spatial Clustering of Applications with Noise (DBSCAN), Affinity Propagation (AP), and the Gaussian Mixtures Model (GMM). As K-means and GMM are sensitive to the number of clusters when starting, we applied different statistical approaches, such as elbow, gap statistic, silhouette graphs, Akaike information criterion (AIC), and Bayesian information criterion (BIC), to find the ideal number of clusters based on the multi-dimensional inputs. In DBSCAN and AP clustering algorithms, the input parameters highly affect the performance. On the other hand, finding proper parameters for them is very challenging as there might be many possible parameters [
11]. Therefore, we proposed an algorithm in order to make the process of selecting parameters for the DBSCAN and AF algorithms automatic. Furthermore, we designed and developed a “noise filter” named the trajectory validation algorithm for the pre-processing AIS data stage in order to detect invalid trajectories and increase the accuracy of the clustering models. In general, this research work can provide possible techniques for analyzing, clustering, and modeling AIS messages to support maritime agents in creating sustainable, intelligent, and secure marine transportation environments. In addition, it can be a perfect guideline for everyone who is interested in clustering, extracting patterns, and modeling big data, such as AIS datasets.
This paper presents a comprehensive investigation of the effectiveness of four commonly used clustering methods for detecting dark ships and spiral movements in vessel trajectories. The main contribution of the paper lies in the comparison of these clustering methods, as well as the application of statistical methods and proposed algorithms for identifying the most suitable input parameters for these methods and detecting two dangerous vessels’ abnormal behavior simultaneously. The contributions of this research provide a more comprehensive understanding of the effectiveness of different clustering methods for detecting vessel abnormal behavior, which is crucial for ensuring maritime safety and security. Moreover, the study offers a practical tool for selecting optimal parameters for these clustering methods, which is of great practical importance. Overall, the findings of this research contribute to the development of more effective and efficient vessel abnormal behavior detection techniques, which can enhance the safety and security of maritime transportation.
The structure of the paper is as follows.
Section 2 reviews the related works that used clustering methods for vessel abnormal behavior detection.
Section 3 introduces the clustering methods used in this work. The methodology that we used for each clustering method to detect two vessel abnormal behaviors—dark ship and spiral movements—is discussed in the
Section 5.
Section 6 describes the details of AIS data collection and preparation stages. In
Section 7, we provide results of parameter selection methods used for the clustering parameters.
Section 8 shows the experiment results. Finally,
Section 9 highlights the main points and limitations, and then completes the paper with suggestions for future work.
2. Literature Review
The number of studies that employ AIS data to detect abnormal behavior has increased in the past few years as AIS messages have become available due to the mandatory use of AIS systems for all commercial ships in marine areas. However, AIS data are not the only data used to detect anomalies: other types of new surveillance technologies, such as modern Unmanned Aerial Vehicles (UAVs) and Synthetic Aperture Radar (SAR) satellite data, have been widely employed in the marine environment. The main disadvantage of the SAR and satellite images is that the data extracted from these sensors are not always available for a specific region since they are orbiting and recording data at different frequencies [
12]. Moreover, the speed of data acquisition is also limited [
12]. UAVs also cannot cover all marine areas at any time because of two reasons: weather conditions, which can affect the quality of the image, especially in a cloudy environment; and the cost of the operation and protection of UAVs, which is very high [
13,
14]. In order to investigate the current state of the studies conducted in this topic area and find a good understanding of the clustering methods used to detect vessel anomaly actions, a literature review, which is described in the following paragraphs, was carried out.
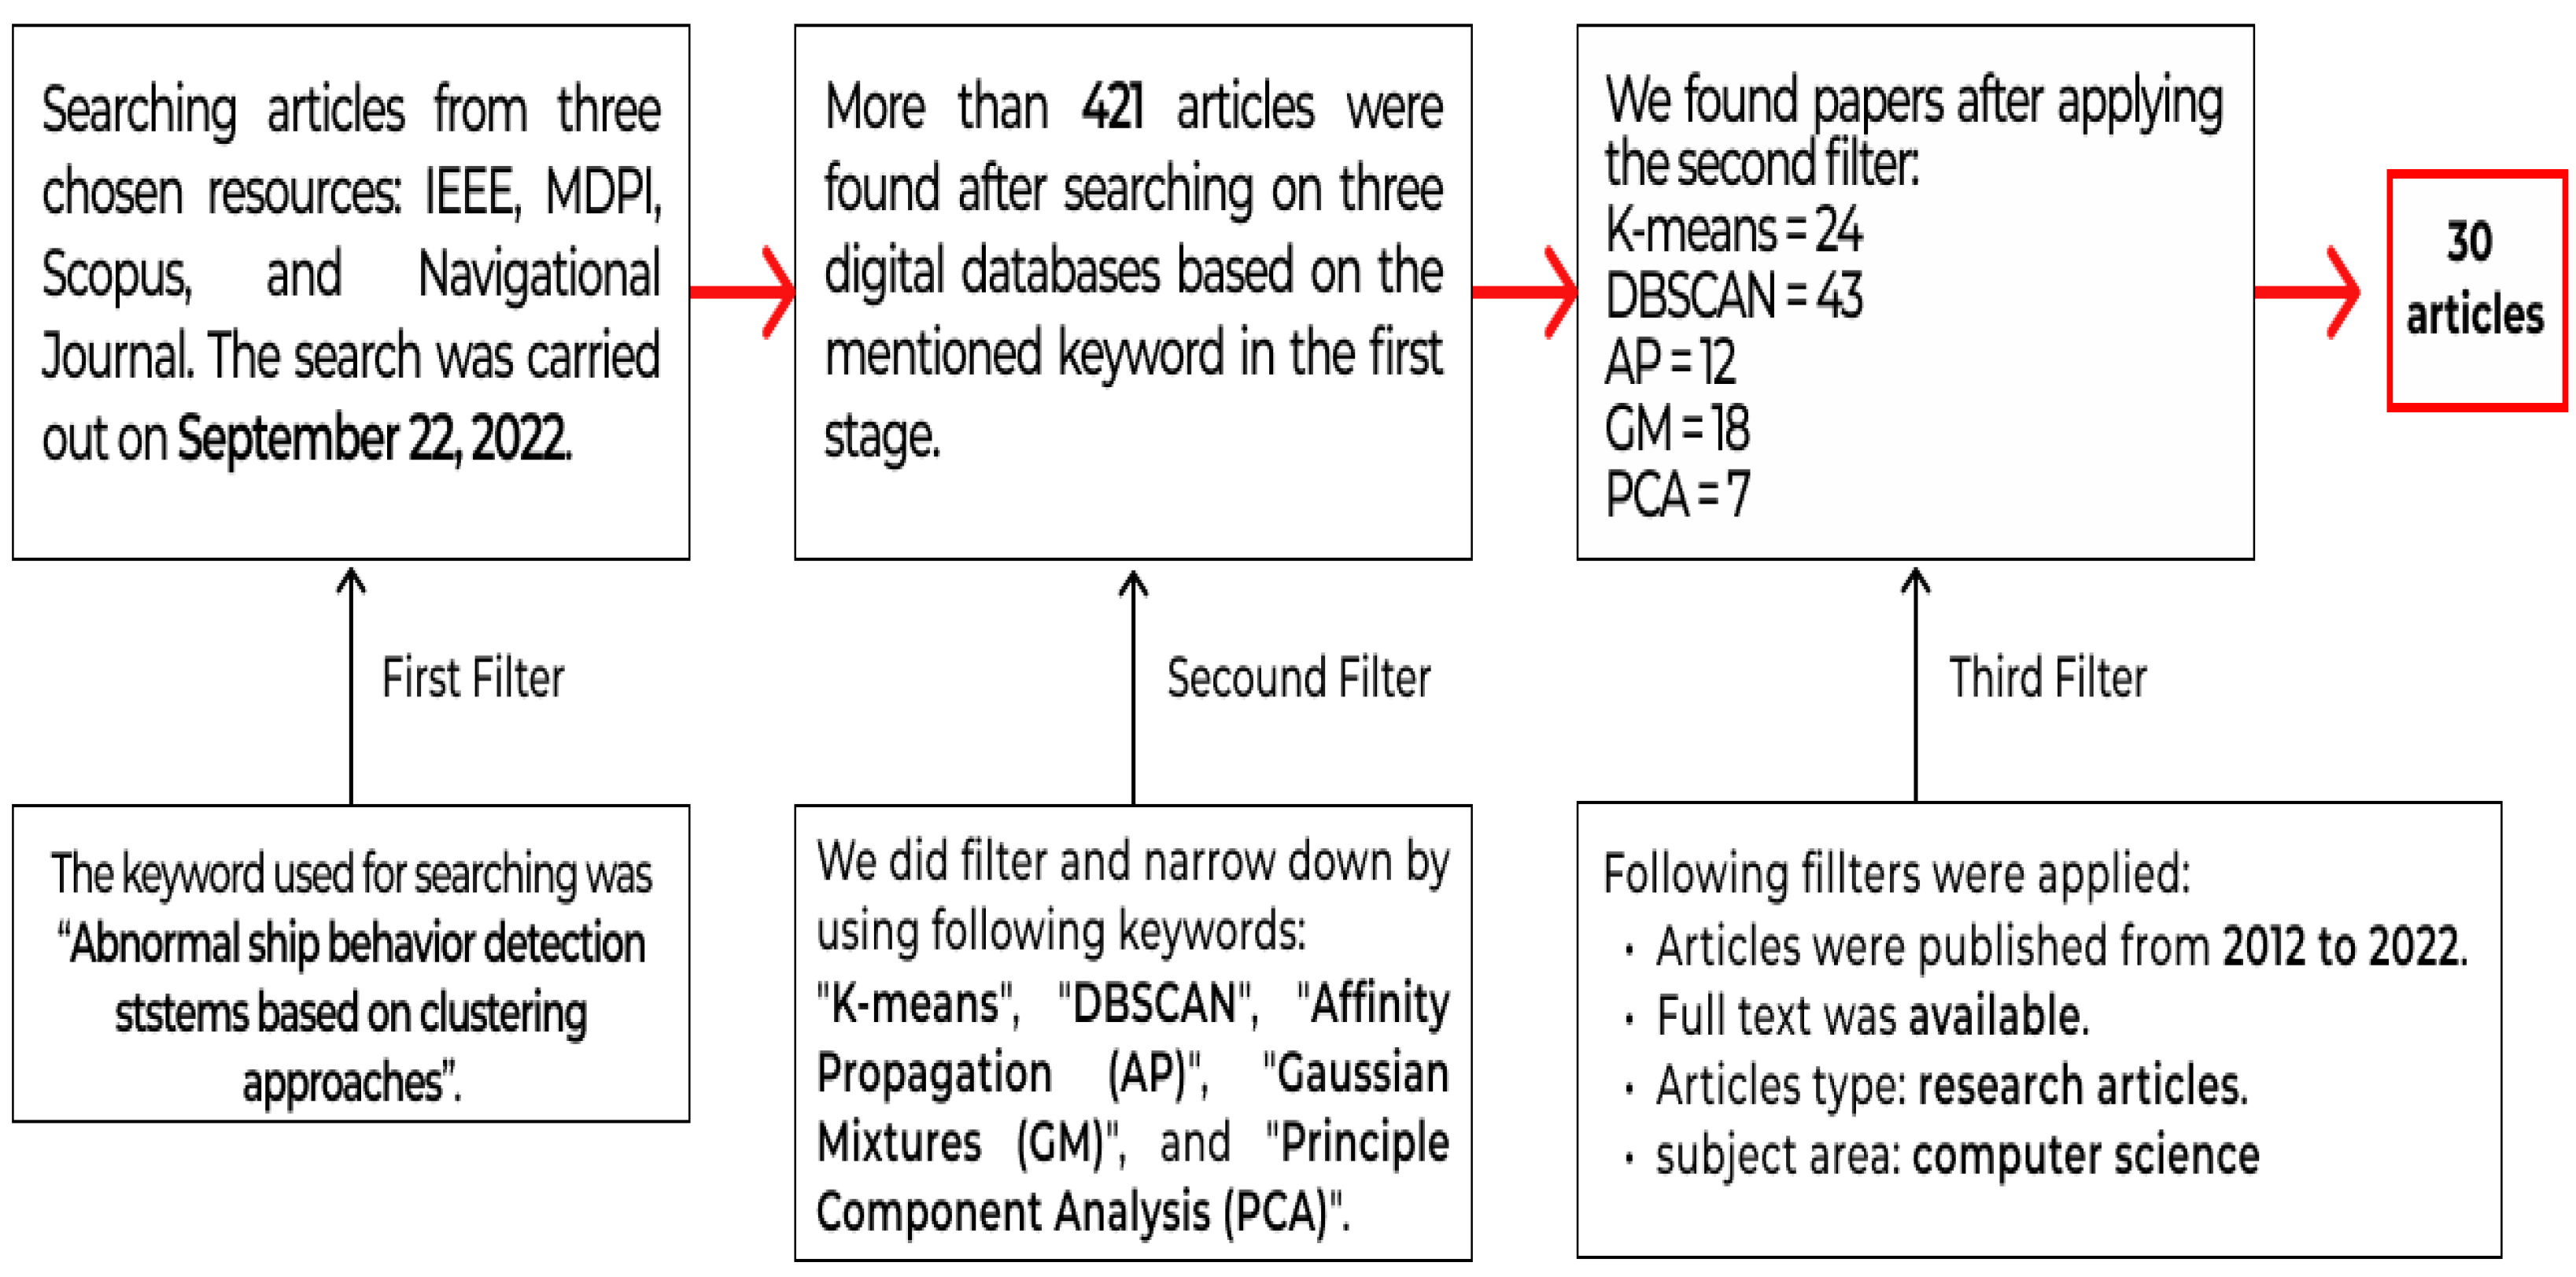
Figure 2 shows the process of the literature review part.
In the first stage of our literature review process, the four following search engines were used to find and collect relevant, reputable, and high-standard research studies:
Institute of Electrical and Electronics Engineers (IEEE);
Scopus (Elsevier’s abstract and citation database);
Multidisciplinary Digital Publishing Institute (MDPI);
Journal of Navigation published by Cambridge University Press.
In light of the absence of prior research aimed at identifying dark ships through AIS data and clustering techniques, an exhaustive review of relevant literature employing clustering techniques on AIS data was conducted. Additionally, studies utilizing Synthetic Aperture Radar (SAR) and satellite imagery for detecting anomalous vessel behavior were comprehensively surveyed and evaluated.
On 22 September 2022, a systematic search was conducted in four selected databases using the search term “abnormal ship behaviour detection system based on clustering approaches”. A total of 421 potentially relevant articles were retrieved from the databases. A subsequent search was then performed using the terms “abnormal behaviours detection” and either “K-means”, “DBSCAN”, “Affinity Propagation”, or “Gaussian Mixtures” to further refine the search results. To ensure the relevance of the articles, we applied filters based on publication date (2012–2022), article types (research articles), subject area (computer science), and access type. After applying these filters, 30 articles were identified for further review. We prioritized recent publications and focused on articles published within the past five years. Finally, irrelevant articles were excluded based on the specified filters, resulting in a final set of relevant articles for our review.
The selected studies that applied clustering techniques on AIS data can be generally classified into two groups. These categorizations are made based on the tasks that the proposed models perform. Most of the existing research works focus on three main tasks: (1) the maritime route detection task; (2) unusual changes in the course; (3) the speed of vessels detection task. In [
15], an improved DBSCAN technique was proposed to create a clustering model to detect anomalies in vessel trajectories, such as unexpected stops, deviations from prescribed routes, or an inconsistent speed. Moreover, they evaluated the framework on the historical Gulf of Mexico AIS dataset. To measure the distance between the data points (longitude and latitude), the Mahalanobis distance measure technique was used, which showed promising results [
16]. In another work [
17], the revised hierarchical density-based clustering algorithm was employed on real AIS data from the Port of Tianjin to automatically classify maritime routes based on the trajectory features. They applied the Hausdorff distance function [
18], which is a well-known spacial distance measurement as it does not need two trajectories with the same number of data points for calculating the distance between them. GMM is another popular clustering method that has been widely used to extract or identify maritime traffic routes. In [
19], a method in which AIS data are used to predict the short-term (5–30 min) future movement of vessels and GMM was utilized to classify the vessel trajectories based on their behavior.
Satellite and SAR images also play an important role in vessel abnormal behavior detection tasks, and they have proven to be one of the best data sources for enhancing maritime situational awareness [
20]. In [
21], the authors proposed a tool that is able to automatically identify SAR missions in the ocean by using AIS messages in order to assist maritime agents to prevent human trafficking. The Search and Rescue (SAR) mission, which encompasses a range of smaller operations, including patrolling, swiftly responding to the scene, retrieving individuals at sea directly or by means of floating devices and smaller boats, and safely transporting them back to the port, poses significant challenges. Nonetheless, the integration of SAR images and AIS messages was utilized to address this issue.
In another work, [
22], an intelligent surveillance system for marine settings using SAR images was presented. It comprises a number of approaches, including object detection, object tracking, and abnormal vessel behavior detection and categorization. To remove undesired items, the authors first applied a filter to the satellite photos. After that, an SVM model was trained on the images, which were divided into the categories of objects and non-objects in order to create a binary classifier and estimate the center of gravity and aspect ratio. The cam-shift approach [
23] was then used to track the moving objects. Finally, the system classified the obtained trajectory of the vessel from the tracking part into four types of anomaly behavior groups: stop, wandering, swapping, and gathering.
Before fusing the SAR imagery and AIS data, the authors needed to check whether both datasets belong to the same region or not. This process can be very challenging when the density of the marine environment is high, such as during rush hours in big ports. In [
24], the authors proposed a classification-aided framework that can classify ship types in SAR images based on a pre-trained classification model trained on AIS messages. These types of systems—the validation of SAR ship detection frameworks [
25] and ship classification models—can also be used for dark ship detection tasks as they have the potential to detect ships that turn off their AIS systems. In order to have quick access to other studies that we found in the literature review process, we created
Table 1, which shows a summarized version of these studies.
Despite the increasing attention on abnormal behavior detection in vessel traffic monitoring systems, there are still several research gaps that need to be addressed. Firstly, most of the existing studies have only focused on the detection of a specific type of abnormal behavior, such as piracy or smuggling, and have not considered the detection of a wide range of abnormal vessel behaviors or at least two types of anomalous behaviors. Secondly, there is a lack of consistency in the use of terminology and definitions, which makes it difficult to compare and replicate the results of different studies. Thirdly, the evaluation of abnormal behavior detection systems has been conducted on small and limited datasets, and the performance of these systems in large-scale and diverse datasets is still unknown. Therefore, the current study aims to address some of these research gaps by comprehensively evaluating the performance of different clustering algorithms in detecting two types of abnormal vessel behaviors in a large-scale and diverse dataset.
3. An Overview of Clustering Methods
In this section, we only present a brief overview of four well-known clustering methods that have been investigated in the context of detecting two anomalous vessel behaviors in this paper. However, we provide complete details on the application of the clustering techniques to the research problem: K-means, DBSCAN, AF, and GMM, including any pre-processing steps, the choice of parameters, and the evaluation metrics used in the subsections of
Section 5.
3.1. K-Means
K-means can group or partition similar data points and find the hidden patterns between them. It requires a fixed number (
k), which refers to the number of centroids (cluster). A centroid shows the location of the center of a cluster or partition. The main purpose of K-means is to minimize the following objective function.
where
k is the number of clusters,
n refers to the number of data points,
x is data point
i, and
c is a centroid for cluster
j.
The steps of the K-means algorithm are summarized as follows:
- 1.
Number of clusters (k) should first be selected by data scientists. For each cluster, a center point is randomly initialized.
- 2.
Each data point is grouped to its closest cluster center by calculating the distance between that point and the centroids point. Generally, Euclidean distance is used as the distance function.
- 3.
Steps 1 and 2 are repeated to optimize the location of centre points. This step repeats until the center pitons do not change too much compared to the last iterations.
K-means is extremely fast and efficient, and has been widely used for data cluster analysis. However, selecting the number of groups of clusters at the beginning can be challenging. In addition, it starts the process of partitioning the data points with random center points, which gives different results when we run the algorithm. Consequently, the results may not be consistent [
35].
3.2. Density-Based Spatial Clustering of Application with Noise (DBSCAN)
DBSCAN [
36] first clusters nearby points based on two parameters. (1) The minimum number of points (
), which specifies the minimum points that should exist. (2) Radius (
), which determines the minimum distance between points that must be present for them to be included in a cluster. This means that two locations are regarded as neighbors if their distances are less than or equal to this value (
). Then, it classifies the data points into three groups: core points, border points, and noise [
37]. In
Figure 3, green points are core points as the region surrounding these data points in a radius includes a minimum number of points. Two blue points are border points as they are only reachable by one core point. Red points are noise because they are not reachable by any core points.
3.3. Affinity Propagation
In the AP algorithm, clusters are formed by exchanging signals between data points until they converge. The most notable advantage of AF is that it is not necessary to determine or estimate the number of clusters before conducting the clustering process [
38]. This clustering algorithm works like a human’s behavior in society. First, a point in a dataset just knows itself and is only a representative of itself. After sending messages and knowing other data points, it realizes that there are two types of samples: (1) some points with similar features and (2) others that are difficult to obtain more interactions with [
39]. In fact, the algorithm uses the concept of “communication” in order to group similar data points into different clusters. Another advantage of the AP clustering method is that it can identify clusters automatically by feeding similarities between data points [
38]. To cluster data points with AP, the two following parameters need to be specified:
Preference, which is a negative integer that determines how many examples are used.
Damping, which is a factor in the range (0.5, 1.0) that avoids numerical oscillations while updating messages.
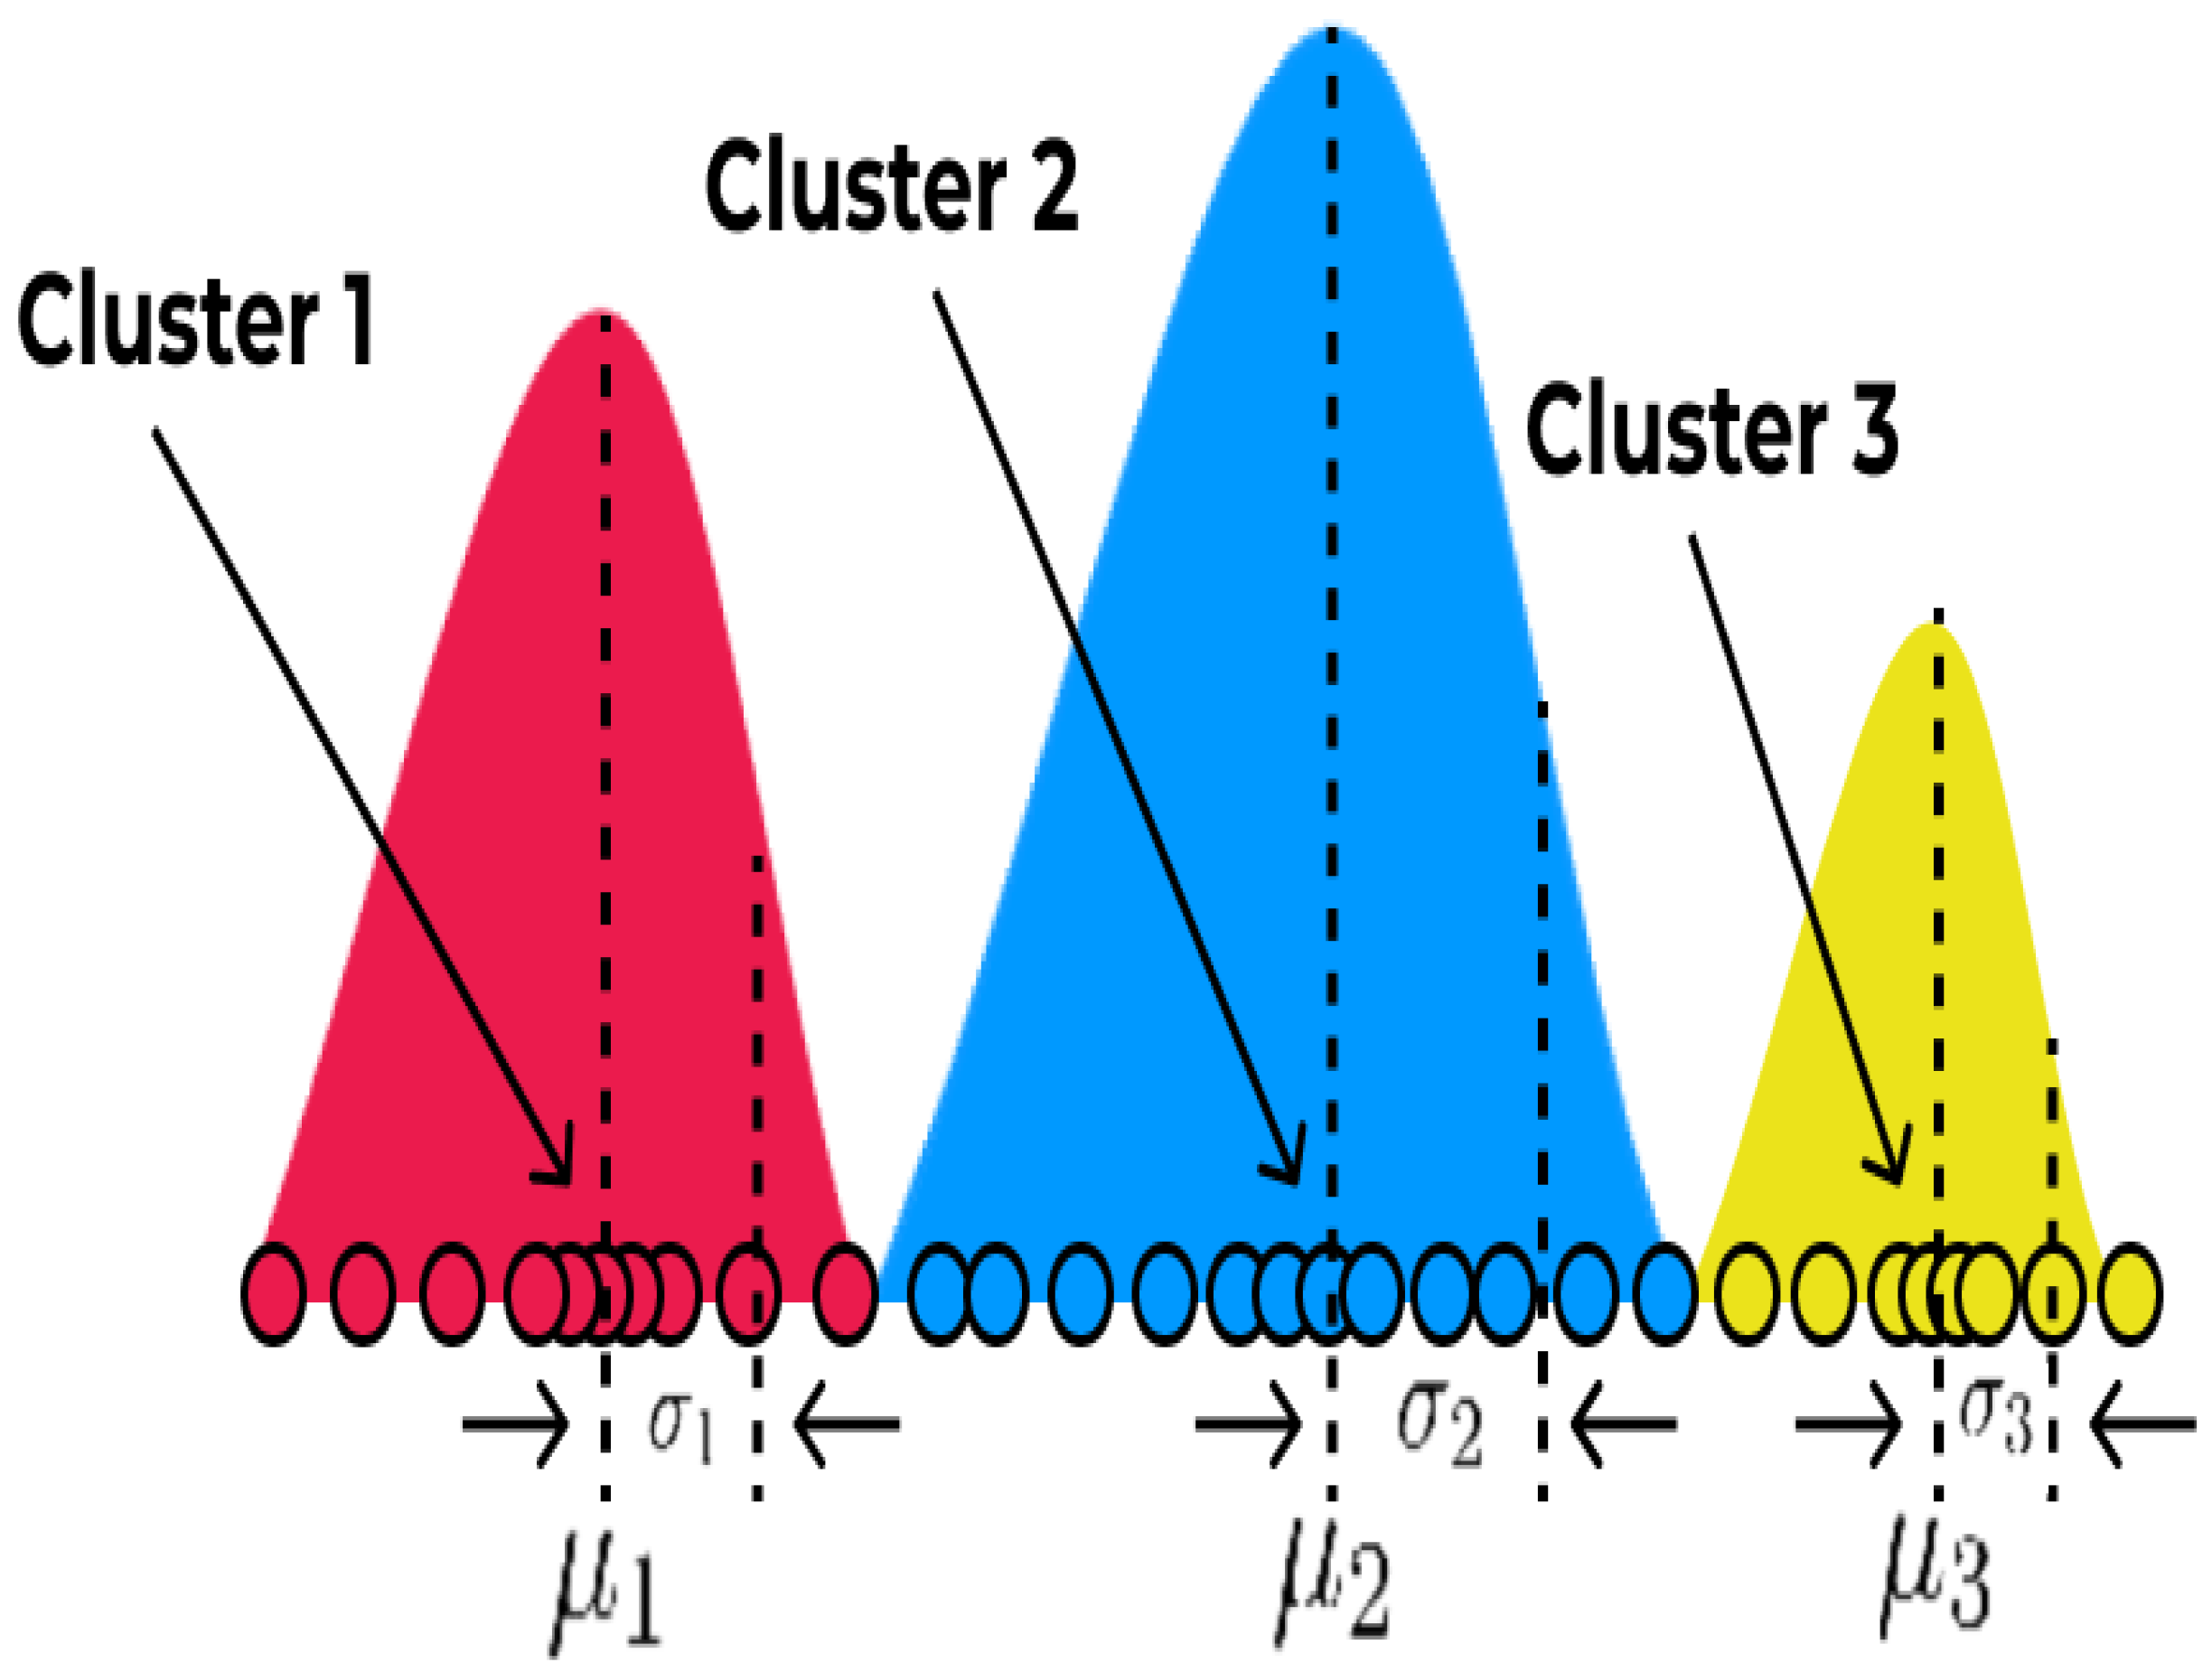
3.4. Gaussian Mixtures Model
The Gaussian Mixtures Model (GMM) is another clustering technique that is more flexible than other methods as it clusters data points into different groups based on probability distribution instead of mean values of data points [
40]. In other words, the GMM is a probabilistic model that considers that the data points are produced from a mix of Gaussian distributions. The function of the probability density of a Gaussian distribution in a one-dimensional area is as follows:
where
and
are the mean and variance of the distribution, respectively.
In data sets where the clusters may not be well defined, the GMM can be utilized to detect clusters. The GMM may also be used to calculate the likelihood that a new data point will belong to each group. Gaussian mixture models may still produce reliable findings even if some data points do not fit neatly into any clusters since they are generally resistant to outliers [
41]. However, the GMM does not cluster well when the dimensionality of data is high due to the initialization of clusters [
42]. The following steps represent the process of the GMM clustering approach:
- 1.
Select the number of clusters k that can minimize two estimators: AIC and BIC.
- 2.
Calculate the likelihood that shows the probability of each data point belongs to a certain cluster based on the Gaussian distribution. The likelihood that a point belongs to a cluster increases with the distance from the Gaussian center.
- 3.
Construct a new set of Gaussian distribution parameters based on the probabilities to optimize the odds of data points falling into clusters. Utilize a weighted sum of the data point positions.
- 4.
Perform steps 2 and 3 iteratively until convergence, where the distributions do not significantly change from one iteration to the next iteration, which can be seen in
Figure 4.
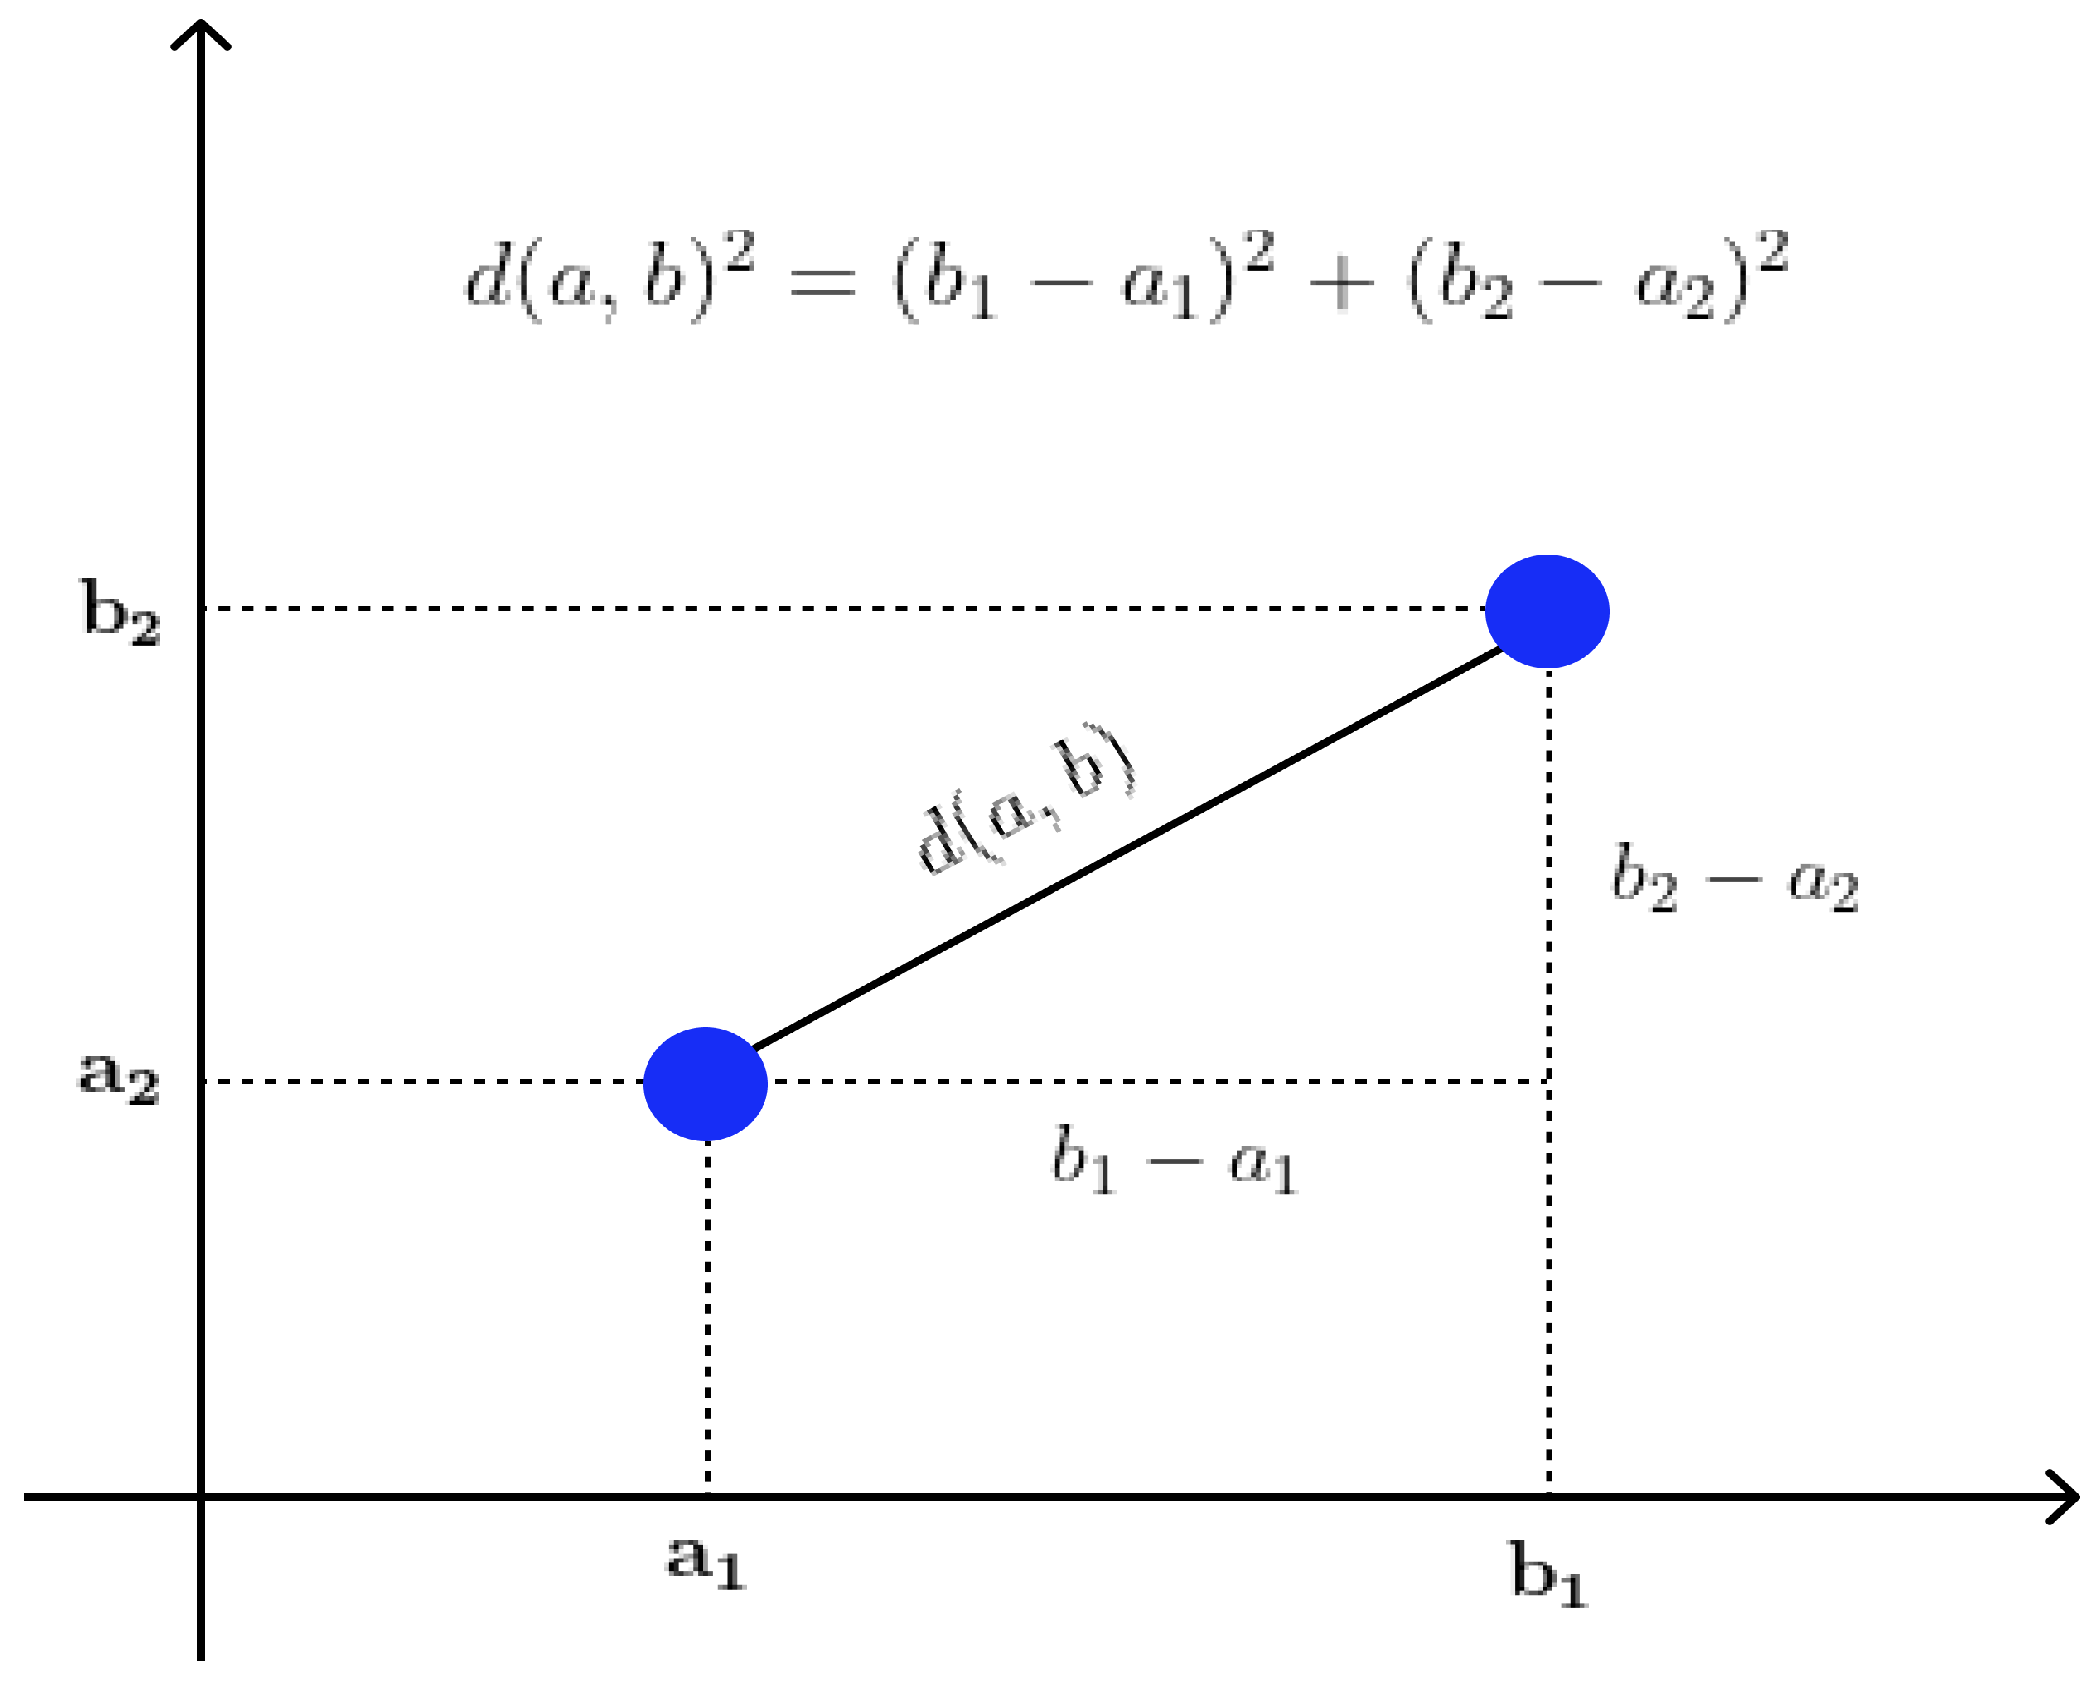
4. Distance Measurement for Clustering Algorithms
Clustering algorithms such as K-means and DBSCAN require a distance measure to group similar data points as a cluster. Euclidean distance is one of the most popular and widely used distance measurement methods in geographic applications (
Figure 5) and is the method used in this study. Euclidean distance measures the straight-line distance between two points in a multi-dimensional space, which is calculated as the square root of the sum of squared differences in each dimension [
43]. The use of Euclidean distance has been justified by its simplicity and intuitive interpretation. It is particularly useful in cases where the data points represent physical locations, such as the vessel positions in our study. Euclidean distance is calculated with the formula below:
where
a and
b are two points in Euclidean
n-space.
In our study, we utilized Euclidean distance to group similar vessel behaviors as clusters using the K-means and DBSCAN algorithms. The Euclidean distance measure was used to calculate the similarity between the vessel features, such as the latitude, longitude, speed over ground, and course over ground. By using Euclidean distance, we were able to identify clusters of vessels that exhibited similar behaviors and detect abnormal vessel behaviors such as dark ships and spiral movements.
5. Methodology
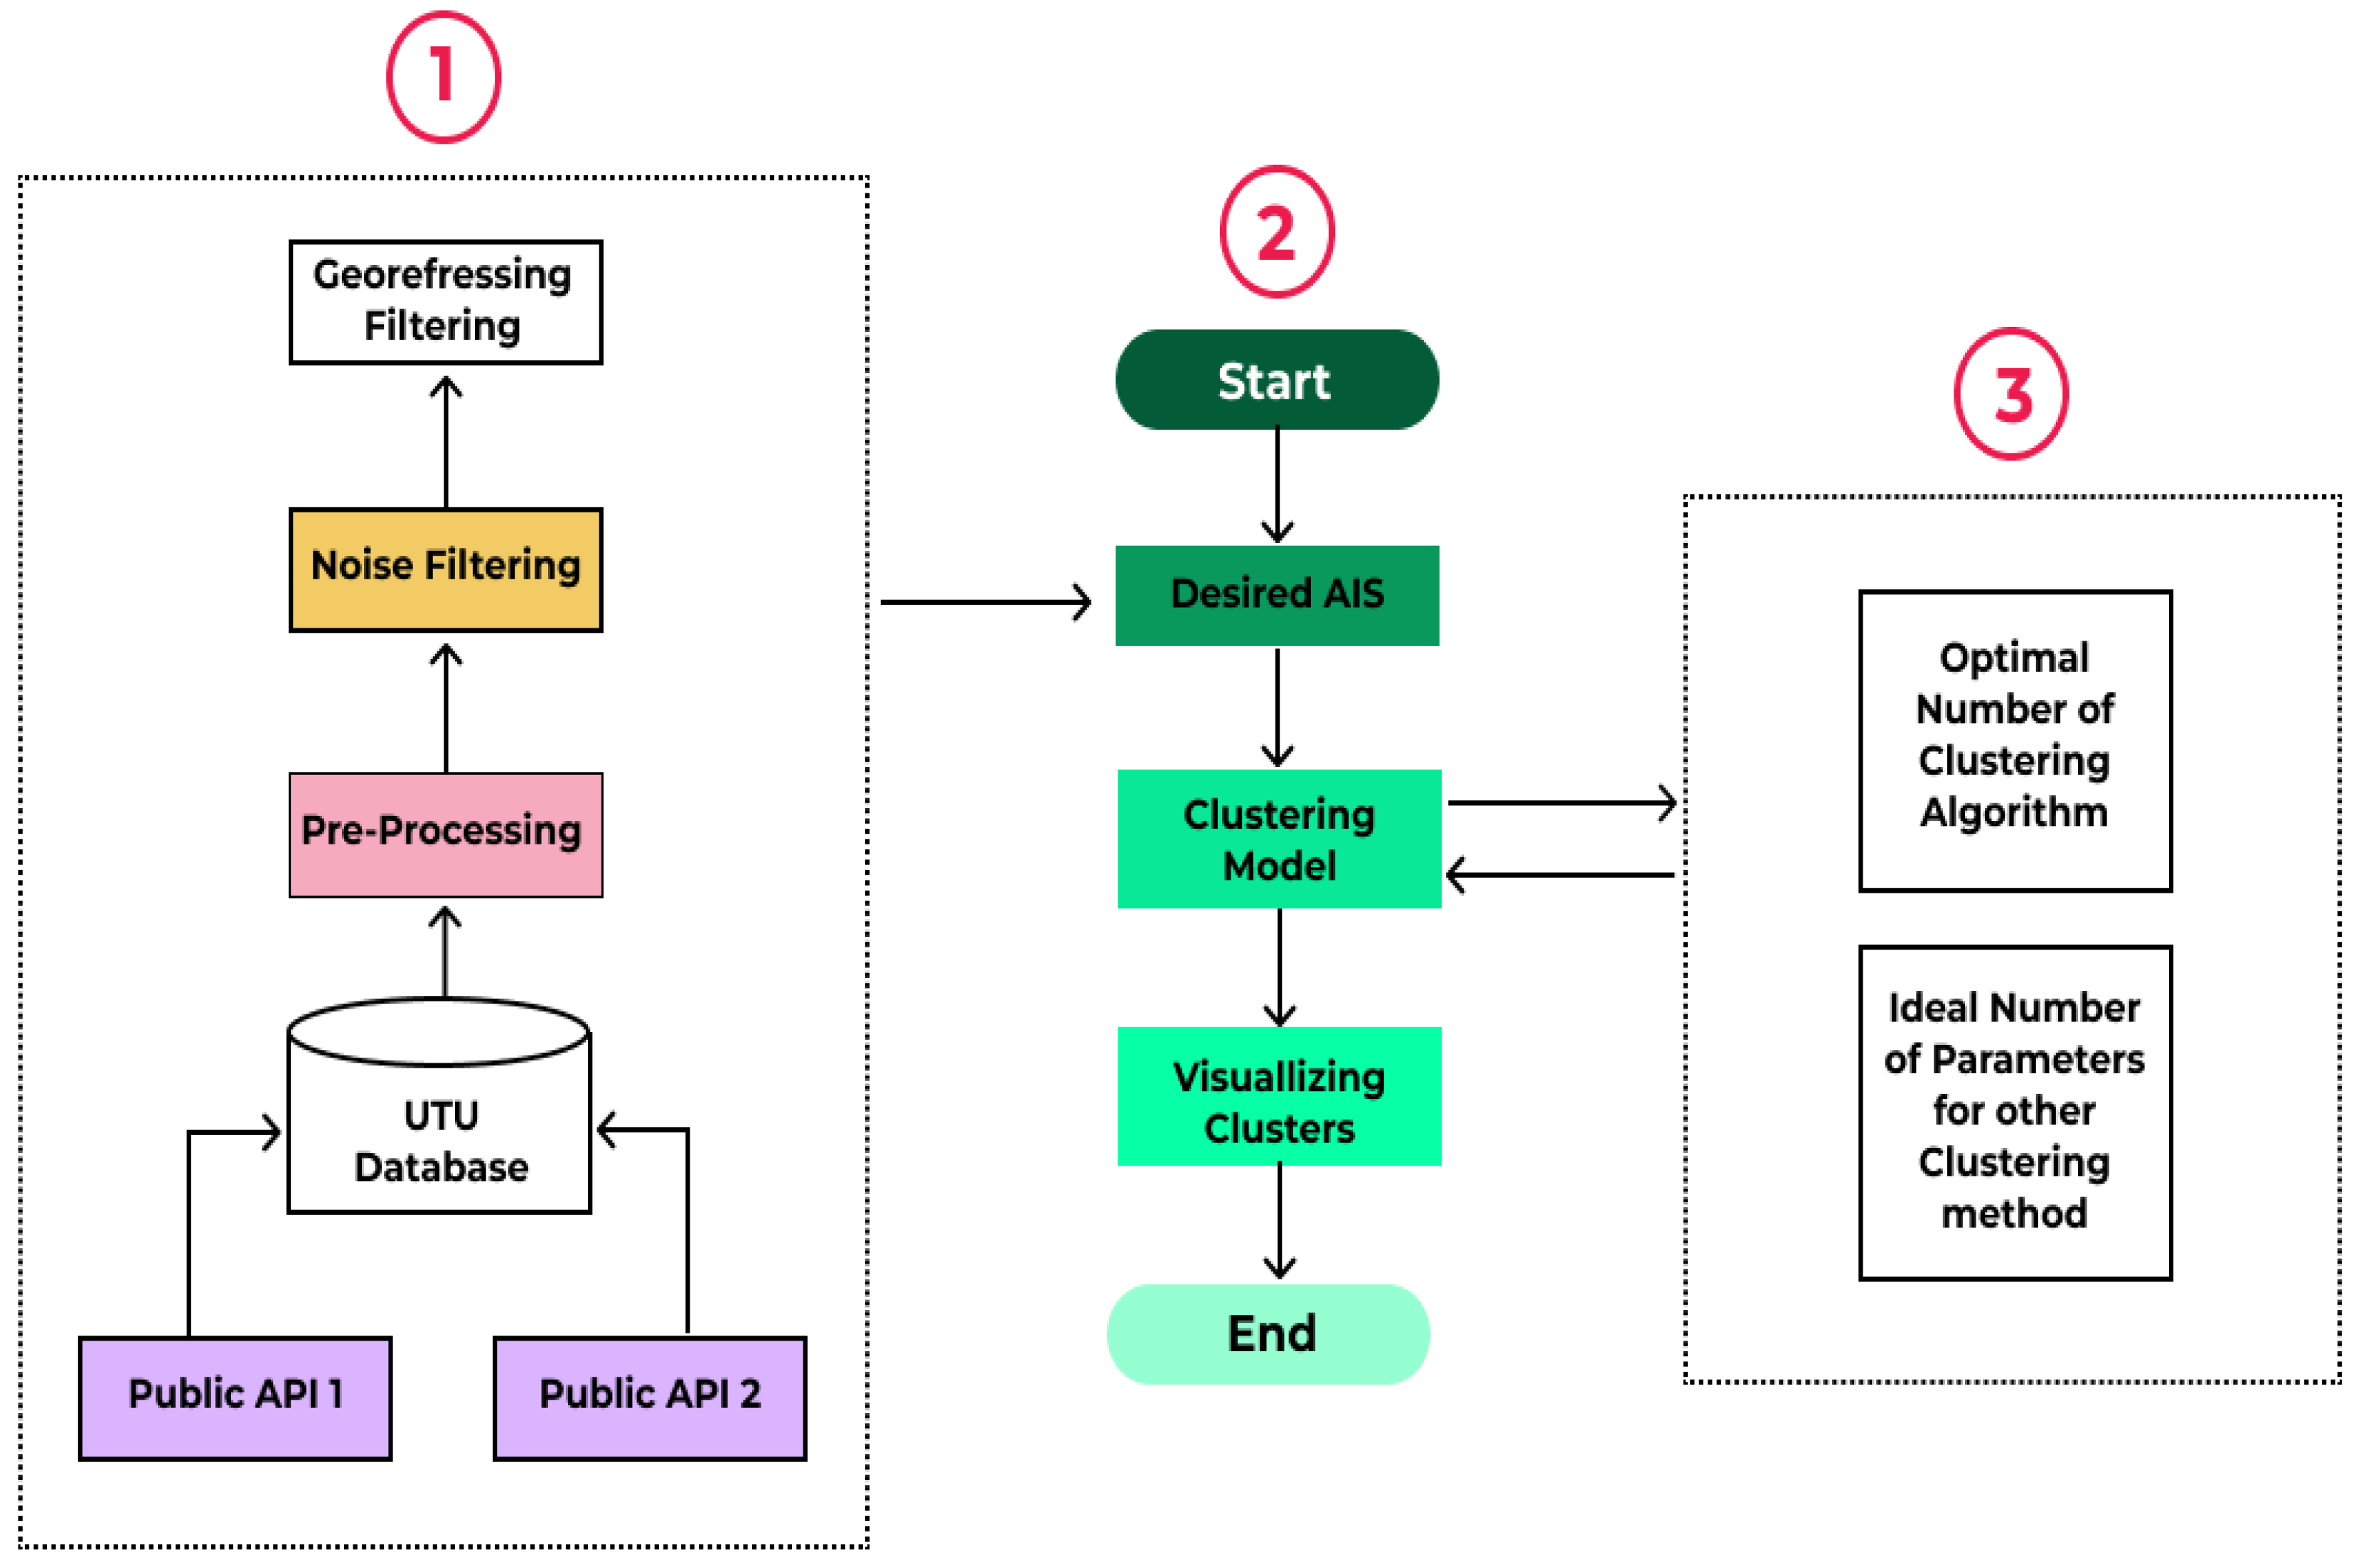
This paper proposes a framework that applies clustering methods to AIS messages of vessels to detect abnormal behaviors in real-world conditions. The AIS message contains three types of information as shown in
Table 2: fixed data (information related to vessel characteristics), dynamic data (information about the vessel’s positions and movements), and passage-related data (information on a present voyage).
Figure 6 shows the proposed clustering-based anomaly detection framework in the marine environment. Generally, our framework consists of three main components: (1) data collection and pre-processing, (2) clustering, and (3) parameter selection. Each component includes modules that are designed to enhance the efficiency, performance, and speed of the proposed framework to detect two dangerous abnormal behaviors: spiral movement and dark ships. The data collection and pre-processing part, which is perfectly explained in the next section, is responsible for extracting, storing, and cleaning AIS messages. The clustering component is the heart of our framework as it contains the clustering process and visualization modules. In part (3), the proposed algorithm generates the optimal number of clusters or ideal parameters (
,
for the DBSCAN algorithm, and damping for the AP algorithm). Then, the clustering model starts grouping the data points based on the numbers received from the algorithm.
, , , and are features that we decided to use for detecting dark ships and spiral movements as the selected features of vessel behavior, namely the position, speed over ground , and course over ground , provide crucial information for detecting abnormal vessel behaviors. Specifically, the positional data, represented by latitude and longitude, allow for the spatial identification of vessels, which is necessary for identifying vessels that may be engaging in anomalous behavior. The speed over the ground, which is a measure of the vessel’s speed relative to the ground, is an important feature for detecting vessels that may be attempting to avoid detection or evade tracking by changing their speed. The course over ground, which is a measure of the vessel’s direction of travel relative to the ground, is an important feature for detecting vessels that may be engaged in suspicious or evasive maneuvers, such as constantly turning in one direction. In addition, the correlation between these features, particularly between the and , provides valuable insight into the behavior of the vessel, such as whether it is travelling in a straight line or turning frequently. Overall, the selection of these features is based on their importance in identifying spatial and behavioral anomalies in vessel tracking data, making them well-suited for detecting spiral movements and dark ships.
Previous studies reviewed in the literature have utilized only two or four fixed parameters of AIS messages, such as the longitude, latitude, speed over ground (), and course over ground (), to detect anomalous activities in the maritime domain. However, detecting dark ships and spiral movements using clustering algorithms with fixed parameters is challenging, as hidden anomalies may not be discernible by solely considering 2D location parameters or all 4D parameters. To increase the reliability of the system and provide deeper insights for maritime stakeholders, we incorporated various combinations of 2D and 3D inputs into our clustering methods (K-means, DBSCAN, GMM, and AF), resulting in the eight following distinct input scenarios:
- 1.
, , and (3D);
- 2.
, , and (3D);
- 3.
, , and (3D);
- 4.
, , and (3D);
- 5.
and (2D);
- 6.
and (2D);
- 7.
and (2D);
- 8.
and (2D).
5.1. Streamlining Parameter Selection for Clustering Algorithms
In this section, we discuss the different statistical approaches that have been used to determine the ideal number of clusters for K-means and GMM, as well as the challenges of selecting input parameters for DBSCAN and AP clustering algorithms. Then, we describe in detail the algorithm that we propose to make the parameter selection process for DBSCAN and AP automatic, including its methodology and how it improves the performance of these algorithms.
Parameter Selection for K-Means and GMM
To find the appropriate number of clusters for K-means algorithms, we employed three methods: elbow, silhouette, and gap statistic. In addition, we have suggested two ways to find the optimal number of clusters for GMM: AIC and BIC. In the following, we provide more information about these methods.
Elbow—This is one of the most common heuristic methods for finding an optimal number of clusters. It first runs K-means for a range of values for
k. Then, a distortion score is calculated based on the average of the squared distances from the cluster centres for each value of
k. Generally, Euclidean is used as the distance function. As shown in
Figure 7, the output of this method is a line chart that looks like an arm and “elbow” of the curve. The point in the red circle is the place where the model fits best and shows the optimal number of clusters.
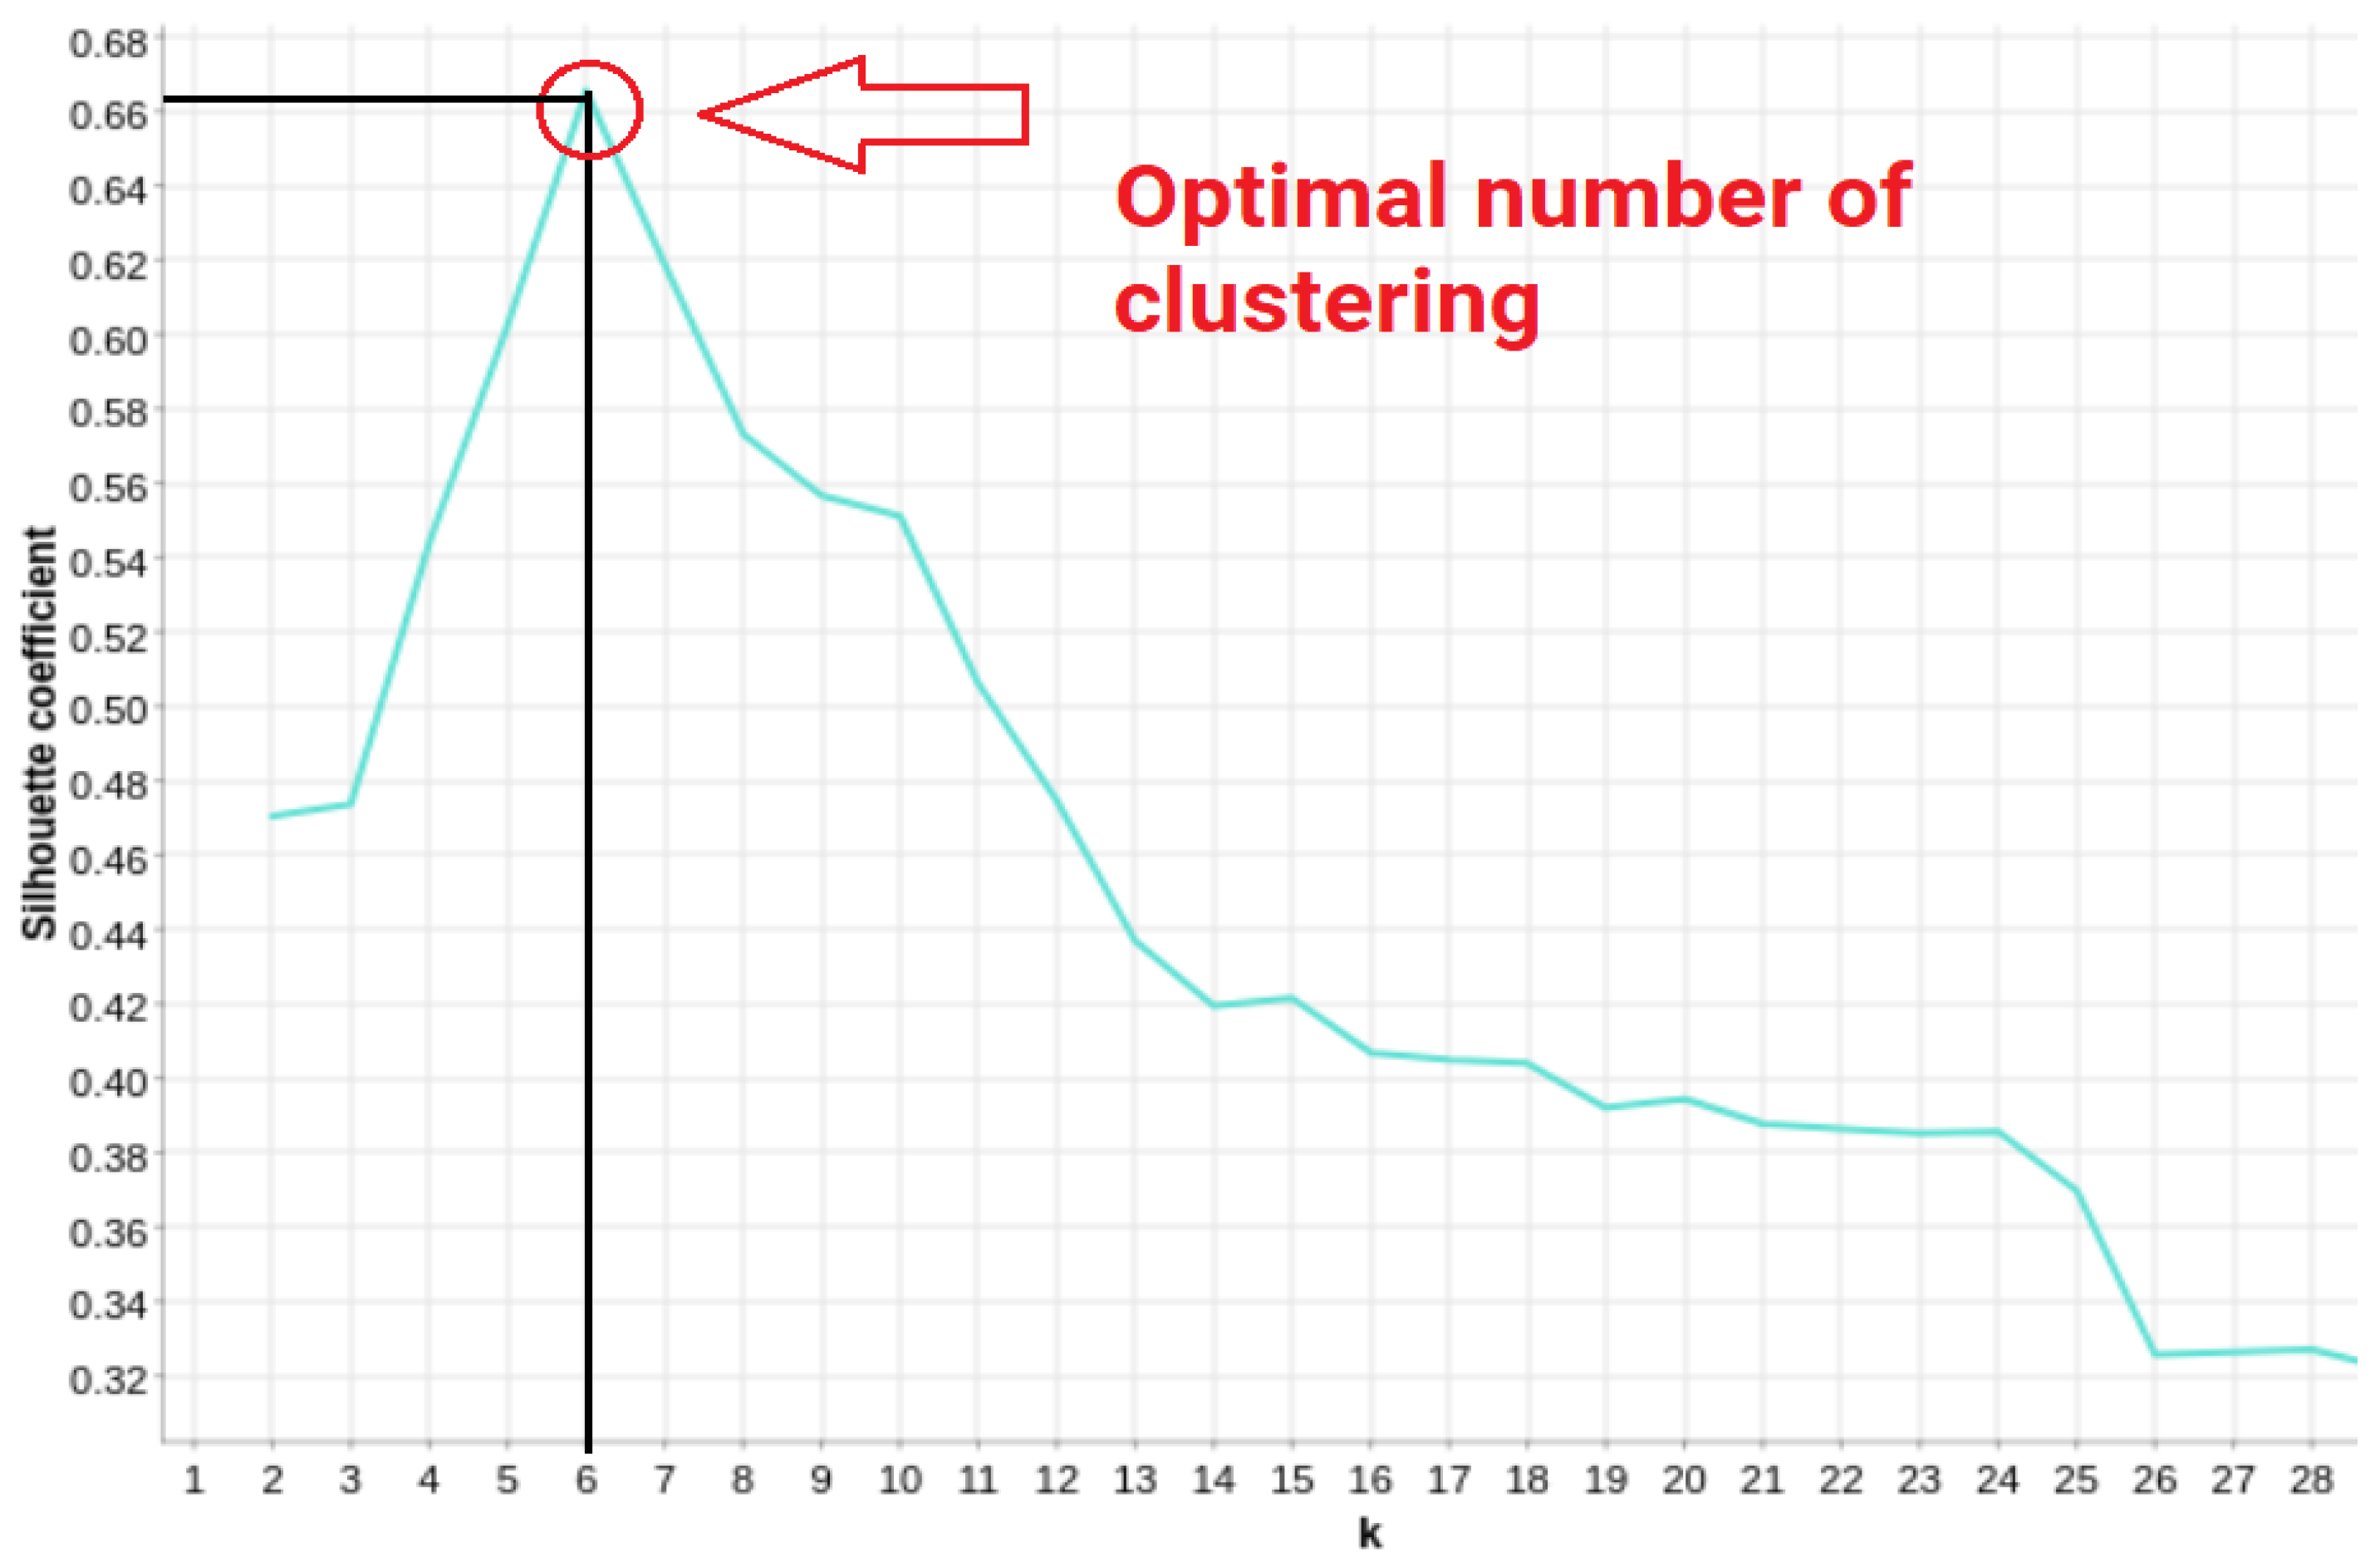
Silhouette—This first selects an appropriate number of clusters by computing the silhouette coefficient for a range of values of
k. To determine the silhouette coefficient of a point, the average distance between the point and all other points in the same clusters is calculated as
X(
i). Next, the average distance between the point and every other points in the closest cluster is measured as
Y(
i). Finally, the silhouette coefficient of a point is calculated with the following equation:
Figure 8 demonstrates an example of a silhouette coefficient plot in which
k = 6 is the ideal
k as the silhouette coefficient peaks at this value.
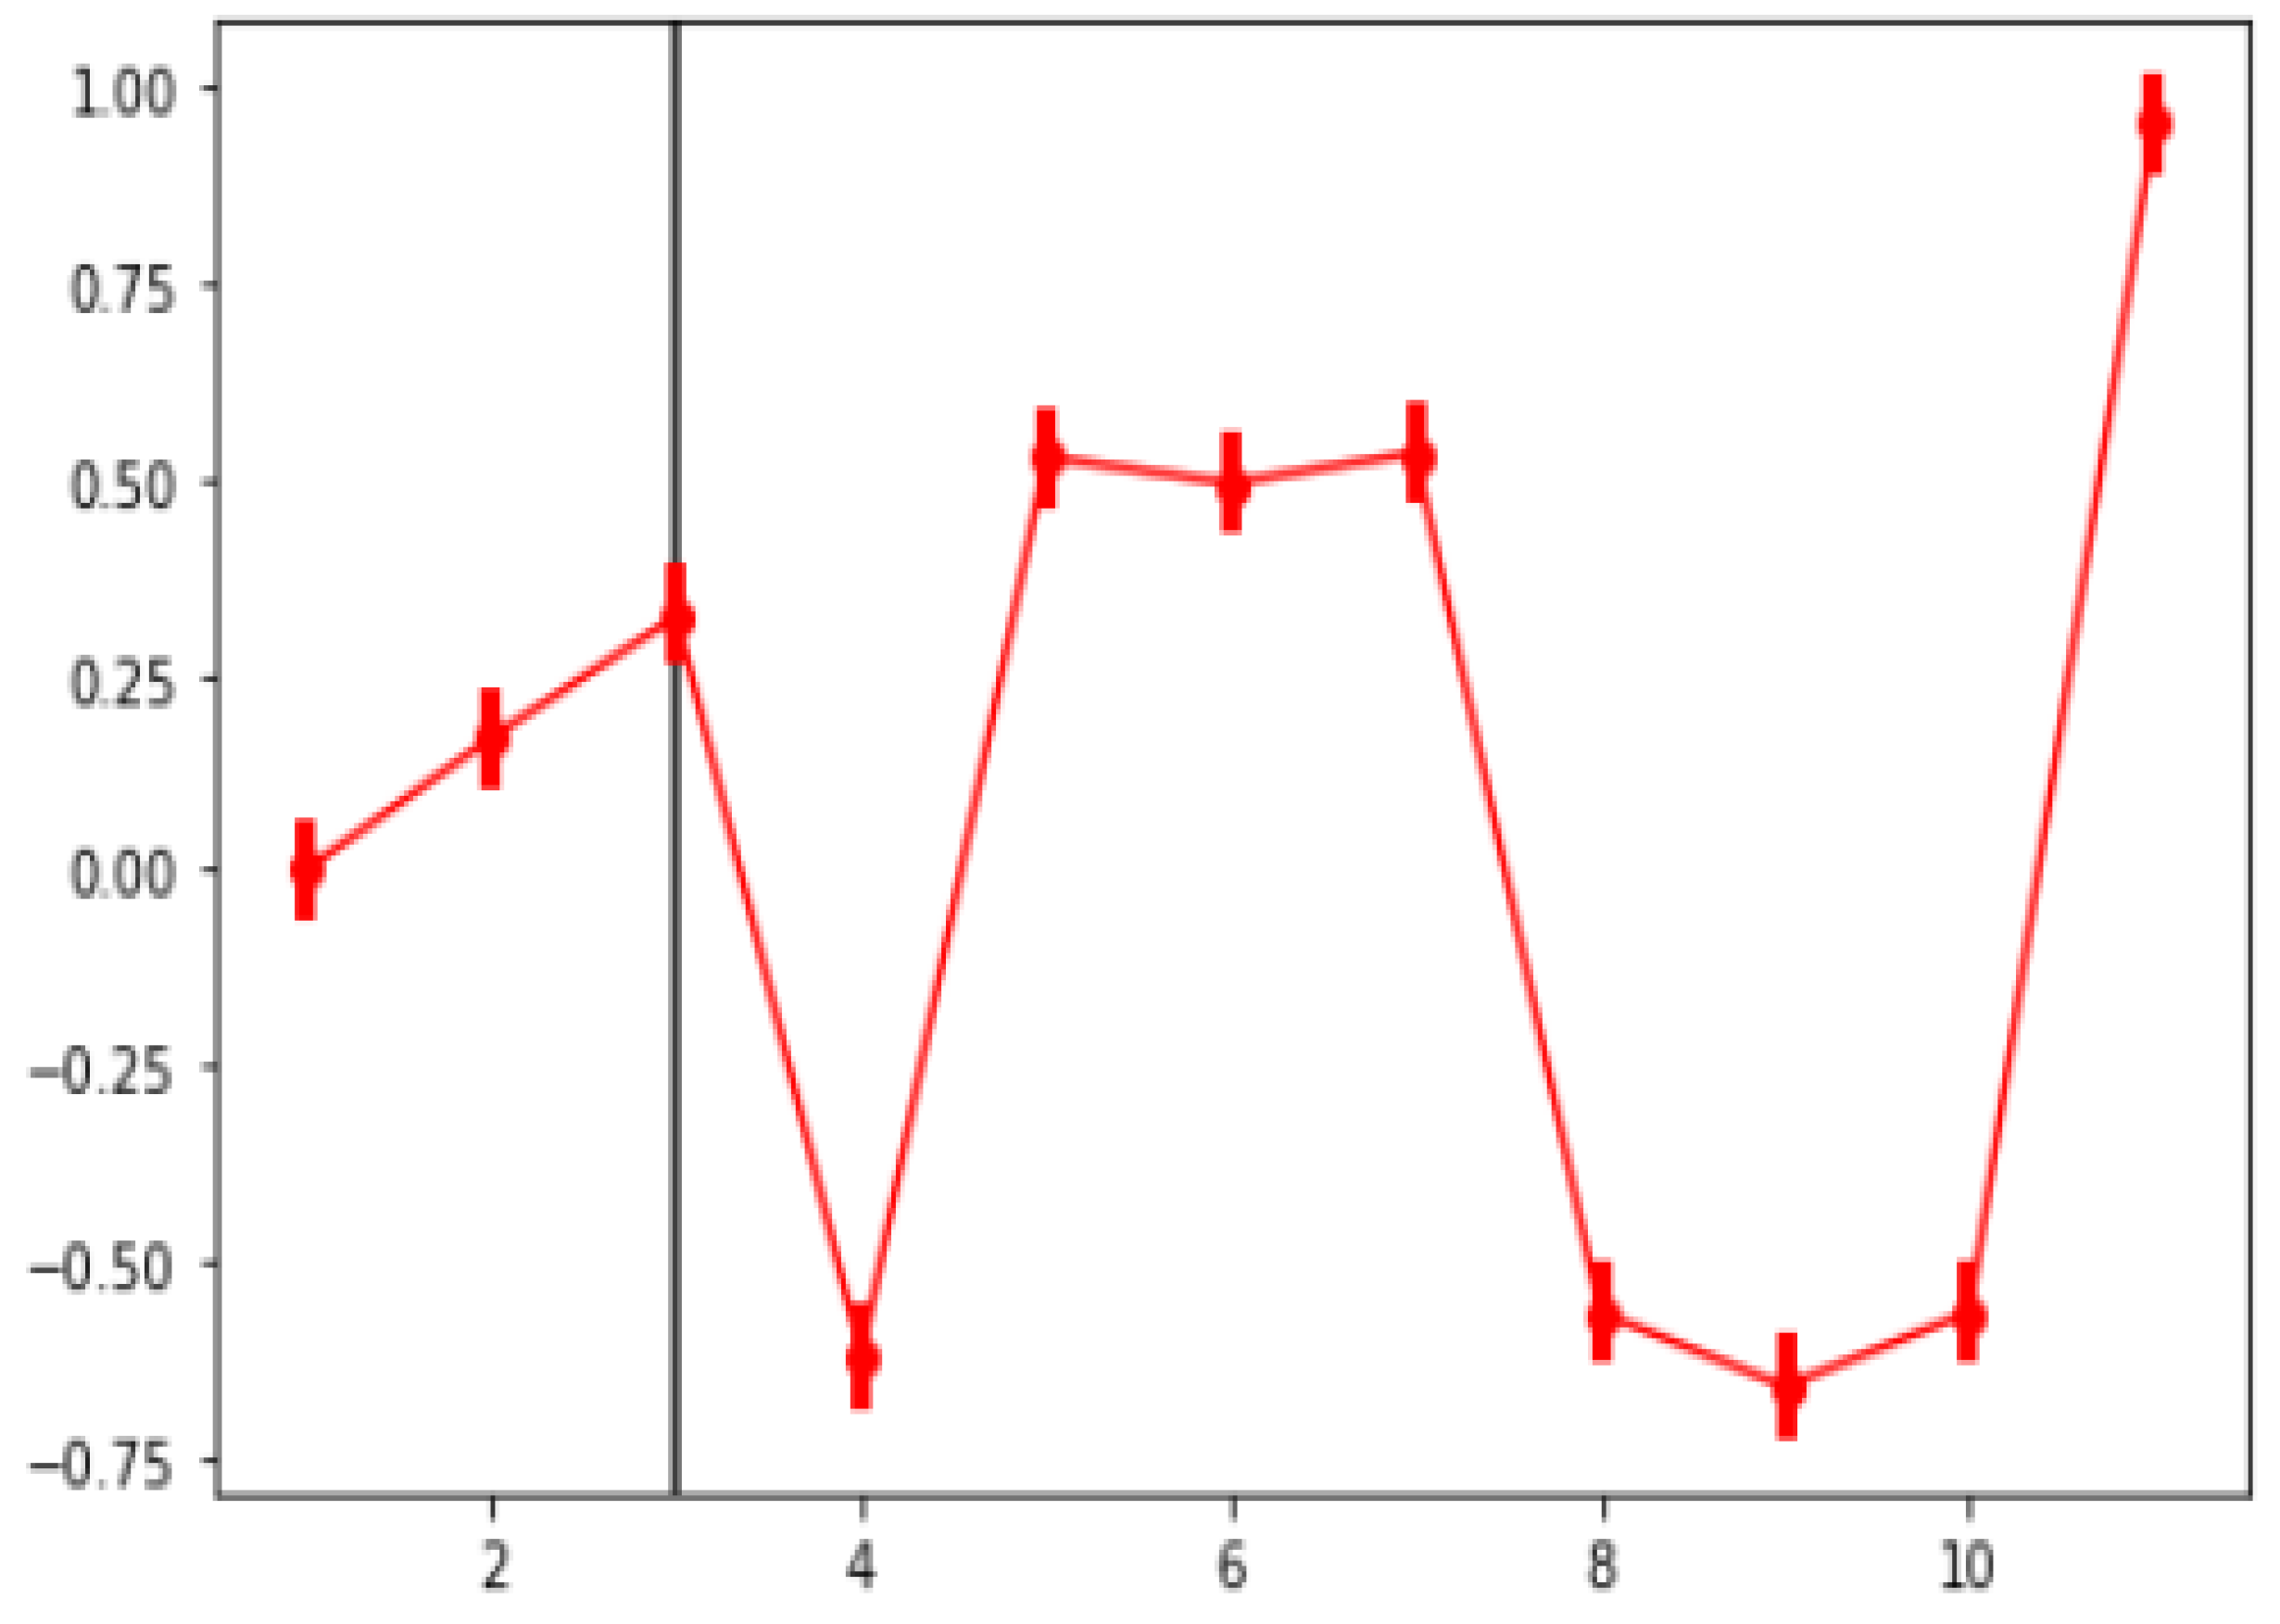
Gap Statistic—This compares the change in within-cluster dispersion with that anticipated under a suitable reference null distribution using the output of a clustering algorithm (for example, K-means or hierarchical). The actual calculation of a gap statistic involves creating a number of random samples, clustering them across a range of
k, and recording the resulting inertia. This gives random instances of a large amount of inertia. A series of inertia is produced by clustering the original data set across a range of
k. At
k clusters, the gap statistic is computed as follows:
where
denotes the inertia from the
i random sample (
i = 1, 2,...,
B) with
k clusters, while
denotes the inertia from the original data with
k clusters. The standard deviation is also calculated as follows:
The least number of clusters that meets the following requirement will be considered as the optimal number of clusters:
A simulation is used in the gap statistic computation. With some R scripting and a KNIME process, we called functions in R to calculate the gap statistic. The gap statistic is specifically calculated using the
function for various values of
k, and the
function then delivers the best K that satisfies the aforementioned requirement. Based on
B = 100 iterations for each
k,
Figure 9 displays the gap statistic plot for an example dataset, where the optimal
k that meets the aforementioned requirement is shown by the black line.
Akaike Information Criterion (AIC) and Bayesian Information Criterion (BIC)—They are both widely used metrics in GMM for determining the ideal number of components. Both the AIC and BIC balance the model’s fit to the data with its complexity. The goal is to identify the number of components that provides the optimal trade-off between a good fit to the data and a simple model. The AIC calculates the relative quality of a model by subtracting a penalty for the number of parameters in the model from the log-likelihood of the data presented in the model. A lower AIC value suggests a more effective model. The BIC is comparable to AIC, except it has a greater penalty for the number of parameters, favoring a simpler model. The AIC and BIC are calculated with the following equations:
where
N denotes the number of examples in the training dataset,
is the log-likelihood, and
k is the number of parameters in GMM.
Proposed Algorithm to Find Ideal DBSCAN and AF Parameters—The choice of parameters in the DBSCAN and Affinity Propagation (AP) clustering algorithms can have a significant impact on the results, and existing methods for selecting these parameters can be difficult to implement or require specialized subject expertise. Yan et al. [
44] used a heuristic method based on k-nearest neighbour distances to choose the DBSCAN algorithm’s parameters. This strategy, meanwhile, necessitates several human inputs. Entropy theory was employed by Pan et al. [
45] to calculate the DBSCAN algorithm’s parameters, although this method of computation is quite difficult. To address these challenges, we propose a novel algorithm for finding the optimal values of the Epsilon and
parameters in the DBSCAN algorithm and the damping factor in the AP algorithm.
First, we follow the general rules that exist for selecting
and
[
46].
must be bigger than the number of dimensions D (
≥
D × 2) in the AIS dataset; for instance, if we consider the longitude, latitude, SOG, and COG of each data point representing the moving object as the input of the cluster model,
should be equal to or more than 4. It should also be noted that selecting a low value for
does not make sense because each point becomes the core point based on the DBSCAN definition. Next, we used the K-distance graph to find the range of the
value that perfectly fits the model. As we need to determine the value of
k for the k-distance method, we used the
k =
− 1 rule, which is found in the study by Schubert et al. [
47]. The best range of
is located in the elbow part of the graph, which is very similar to the elbow method that is used to find the number of clusters (
k). Finally, we generated some random numbers between the ranges found by using the two mentioned methods, made a list of the combination of
and
, and fed the generated list and data points of the given dataset as the input of the algorithm. The proposed Algorithm 1 is as follows:
| Algorithm 1 Proposed algorithm for finding the best combination of DBSCAN parameters |
Require: Combination = list [, min points] and X = [Longitude, Latitude] Ensure: The best combination values for and min points scores = [] labels list = [] for in Combination do dbscan = DBSCAN(eps = , min samples = min points).fit(X) labels = dbscan.labels labels set = set(labels) num clusters = len(labels set) if -1 in labels set then num clusters = 1 end if if (num clusters < 2) or (num clusters > 50) then scores.append(-10) labels list.append(’bad’) c = (, num samples) print(“Combination c on iteration i + 1 of N has num clusters clusters. Moving on”) continue end if scores.append(silhouette score(X, labels)) labels list.append(labels) print(“Index: i, Score: scores[-1], Labels: labels list[-1], NumClusters: num clusters”) end for best index = np.argmax(scores) best parameters = combinations[best index] best labels = labels list[best index] best score = scores[best index] return ‘best epsilon’: best parameters[0], ’best min samples’: best parameters[1]
|
For the AP algorithm, we generated a list of damping factor values ranging from 0.5 to 0.9, and used this list as the input to the algorithm. The silhouette score for each value in the damping factor list was calculated, and the best damping factor was found by selecting the value with the highest silhouette score.
5.2. Evaluation Metrics and Clustering Pre-Processing Steps
In the study, an evaluation metric and a pre-processing step were used to assess the performance of the clustering methods and prepare the data for analysis, respectively.
5.2.1. Evaluation Metrics
In this study, the performance of clustering methods was evaluated by using the silhouette coefficient scores. It is one of the most common interval evaluation metrics for clustering algorithms. The silhouette coefficient calculates the mean intra-cluster distance, which represents similarities between clusters, and the mean nearest-cluster distance, which represents differences. The range of silhouette coefficient scores is between −1 and +1 [
37]. The silhouette score near +1 means that the clusters are grouped very well. However, a silhouette score near −1 implies that clusters are not recognizable as the distance between clusters is not substantial.
5.2.2. Clustering Pre-Processing Step
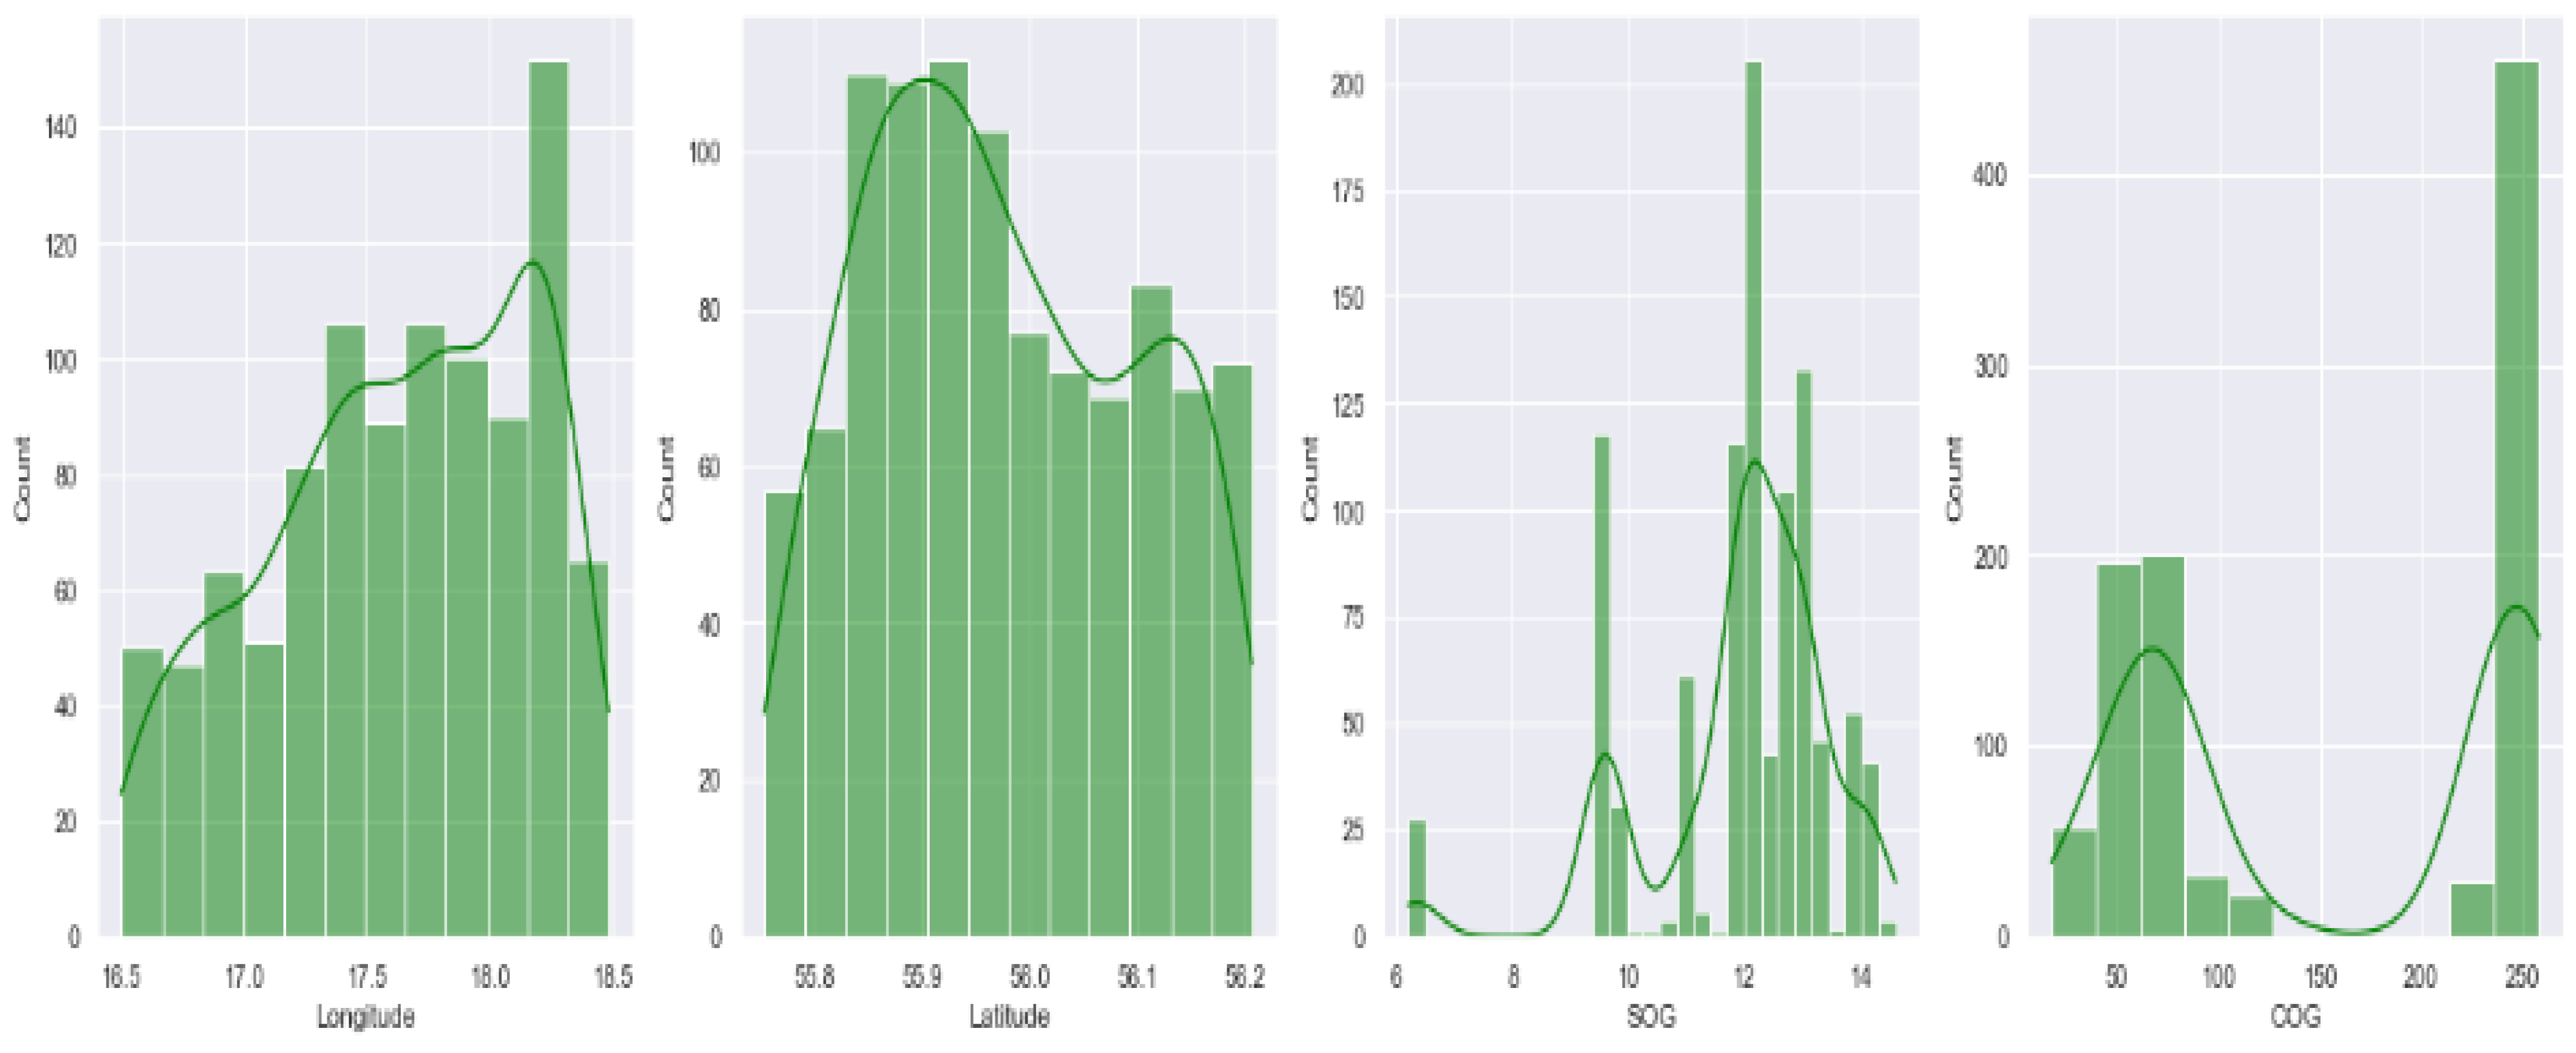
Figure 10 shows that the features have vastly different ranges, and normalizing the data helps to ensure that all features have comparable scales. Therefore, we normalized the data between (−1, 1) before feeding them to the clustering models in order to have a common scale and fixed ranges of values. However, it should be mentioned that no pre-processing was necessary for DBSCAN and AF clustering algorithms as these algorithms are not sensitive to the scale of the features.
6. Data Description
In this section, we walk through the AIS data-gathering stage, pre-processing part, and trajectory validation, and we finally present the research area that has been selected to be focused on and to apply our designed framework to.
AIS information (static and dynamic) was collected from two open APIs. The marine information published on the “digitraffic.fi” website was gathered by the Finnish Transport Infrastructure Agency. Currently, open data APIs provide the following information:
Marine warnings;
Harbor schedules;
Vessel location AIS.
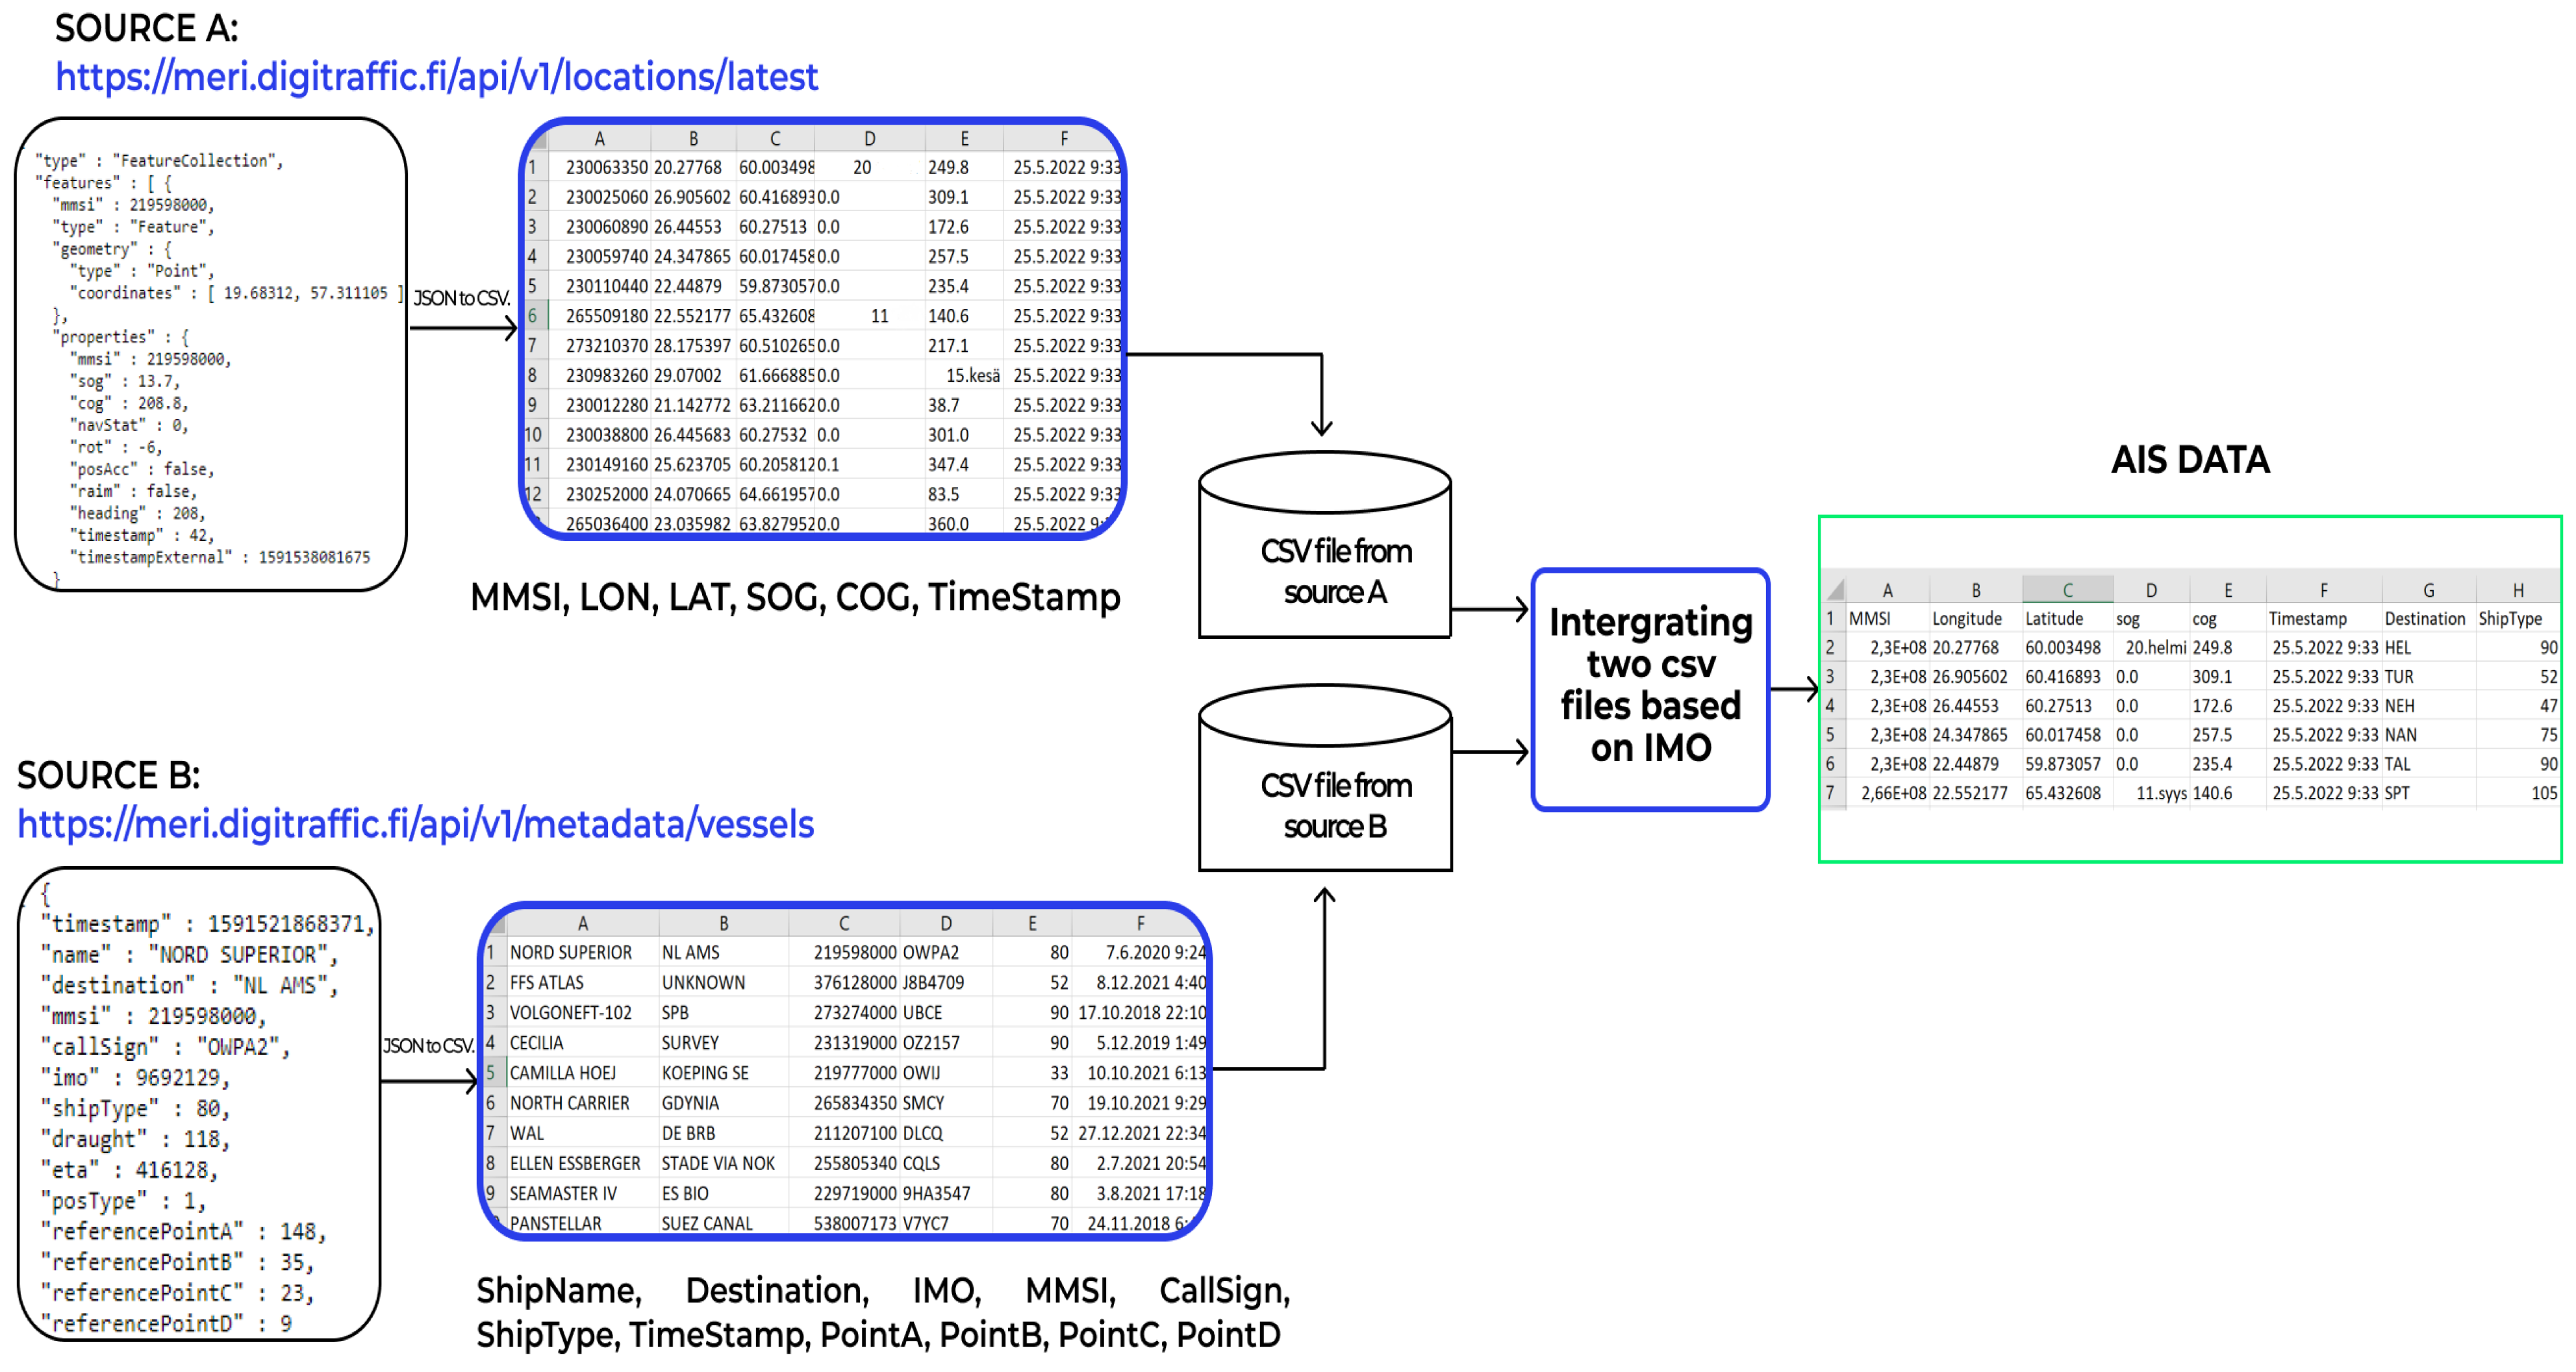
For this study, we started gathering the AIS data of all ships sailing in the Baltic Sea from 1 May 2022 to the end of July, and the collected information occupied approximately 30 GB of our database. As the static and dynamic vessel features are extracted from two separate APIs, we combined them in order to have an accurate interpretation. The International Maritime Organization (IMO) was used as the basis for combining the data. After the combination, the AIS data consisted of dynamic data, such as the timestamp (year–month–day-time), latitude, longitude, SOG, COG, ship’s heading, and COG, as well as static data, such as the MMSI, ship name or call sign, ship type, IMO number, drought, and physical characteristics (width and length). The collection process of the AIS dataset is shown in
Figure 11.
6.1. Data Pre-Processing
Data pre-processing is one of the most important initial steps in the data mining and data analysis process. Since AIS data, which are real-world data, frequently lack particular attribute values or trends and are frequently inconsistent, erroneous (contains mistakes or outliers), and incomplete, we applied some pre-processing methods to prepare the raw data for the next steps: developing clustering models and extracting abnormal patterns.
Our AIS dataset, which is gathered over three months, has 11,023,246 samples and 13 features. First, we divided the data based on the weekly data in order to reduce the time consumption for the computing part. Next, we checked the MMSI numbers, which should contain nine digits, and the rows with invalid MMSI were removed. Then, we removed some specific rows that had more than five missing values (almost 50% of the values). After that, we filtered some ship types (cargo, tanker, passenger, fishing, tug, and dredging) as we wanted to focus on only them for our research. Furthermore, the samples of the dataset whose values were more than 180 and lower than −180, and whose values were more than 90 and lower than −90, were removed. Finally, the COG value, which demonstrates the direction that the ship is moving in, was checked in order to remove rows with invalid (more than 360 and lower than 0). After performing pre-processing, the dataset has 10,261,712 samples and 13 features.
6.2. Trajectory Validation
Several trajectories with unusual forms were found during the visualization of the data. For instance, when the vessel was stationary, there may be significant gaps or oscillations in some areas of the trajectory. In order to avoid missing coverage in the AIS data, the trajectory should be omitted if the distance between two places is sufficiently high. As a result, a validation phase was added to the trip creation process. Another problem was found where some vessels appeared to follow a path that was cohesive except for a region when the longitude or latitude value varied greatly. This frequently occurred when a vessel was at rest or moving slowly and communicated information from many nearby places.
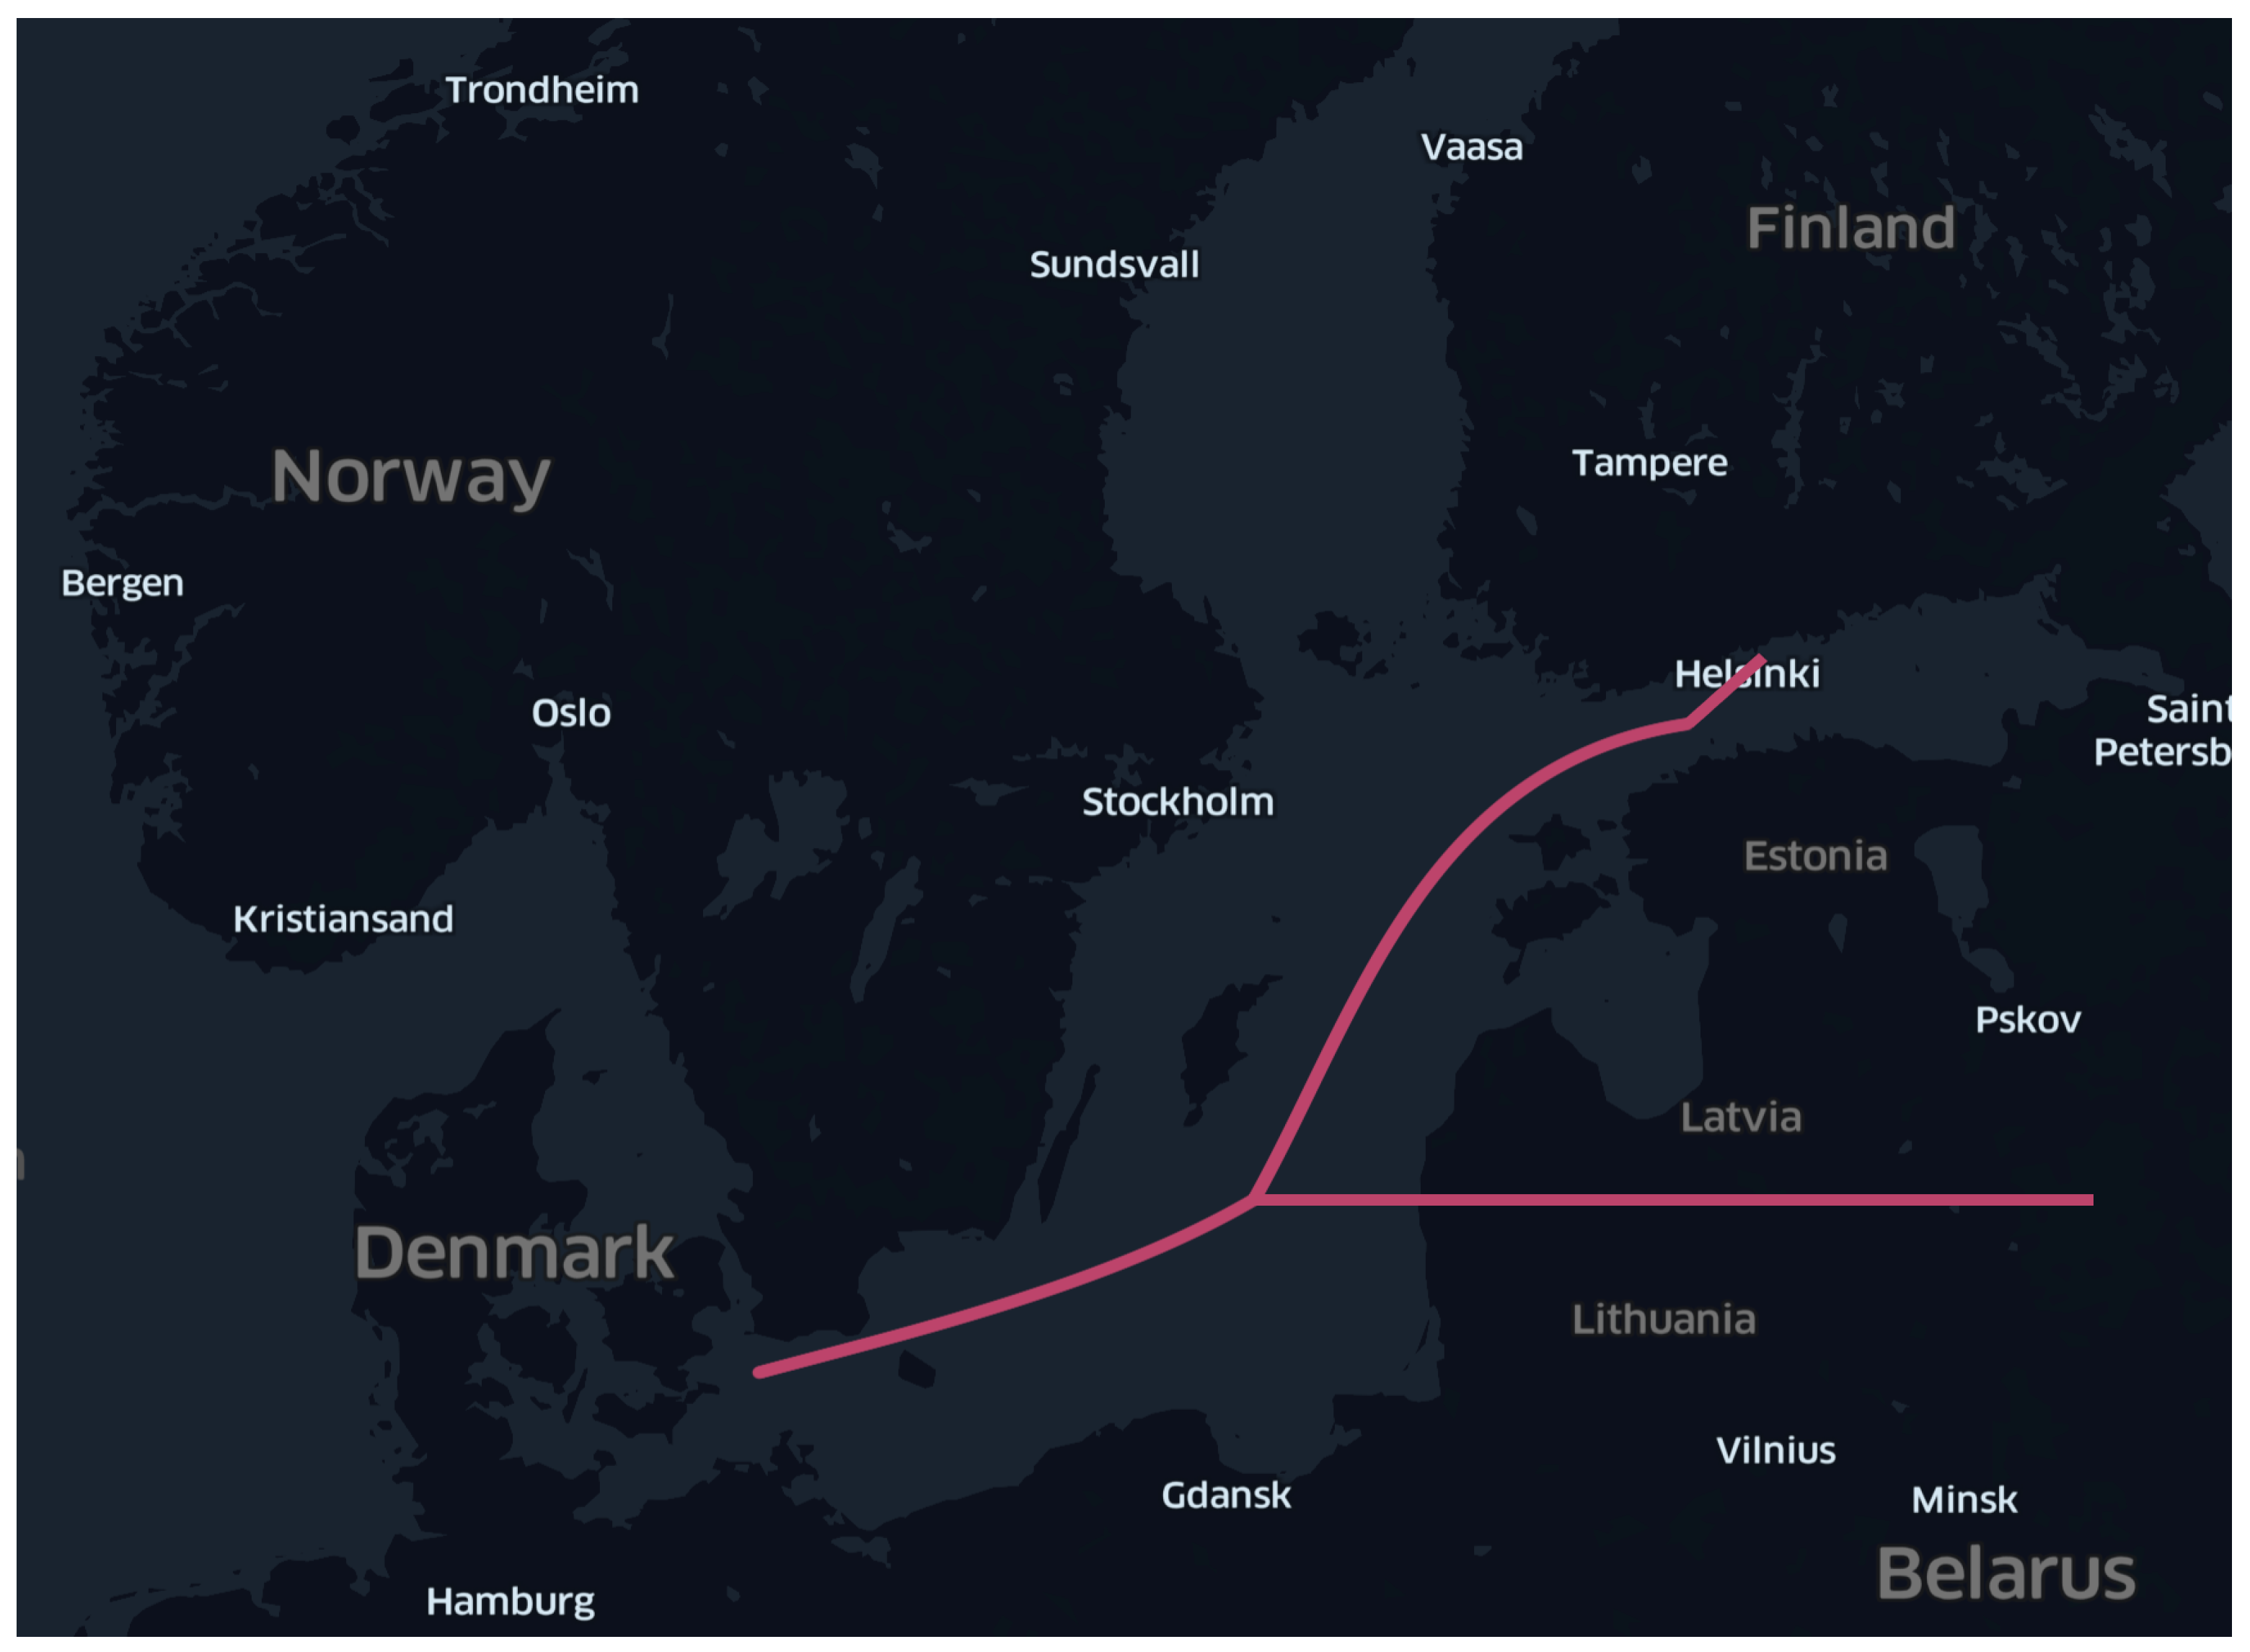
Figure 12 shows an illustration of this problem with a journey beginning in Denmark and concluding in Helsinki, Finland. The ship sent two longitudes during its journey near northern Poland, and located the ship near the Russian territory, before carrying it on to Helsinki. This problem is most often brought on by a malfunctioning piece of equipment or by problems with the GPS signals that the ship’s AIS transmitter sends out. If it is feasible to exclude the invalid portion of the trajectory, the remaining portion might then be utilized in the analysis. The trajectory is totally valid when the fluctuating piece is excluded; therefore, the analysis could continue using the remaining itinerary. Consequently, a ”noise filter” was designed to find and remove irregularities in otherwise valid trajectories.
The algorithm named trajectory validation was developed to detect these noises by checking every point in the trajectory. The proposed algorithm measures the distance of every point on the route at each point along the journey. It determines the speed that the vessel would need to move at from the first to the second location using the distances in space and time. When the needed speed exceeded 50 knots, the segment was not valid. The next point was then fed into the algorithm to be compared to the first point, and if there was a valid route to the third point, the second point was removed from the dataset.
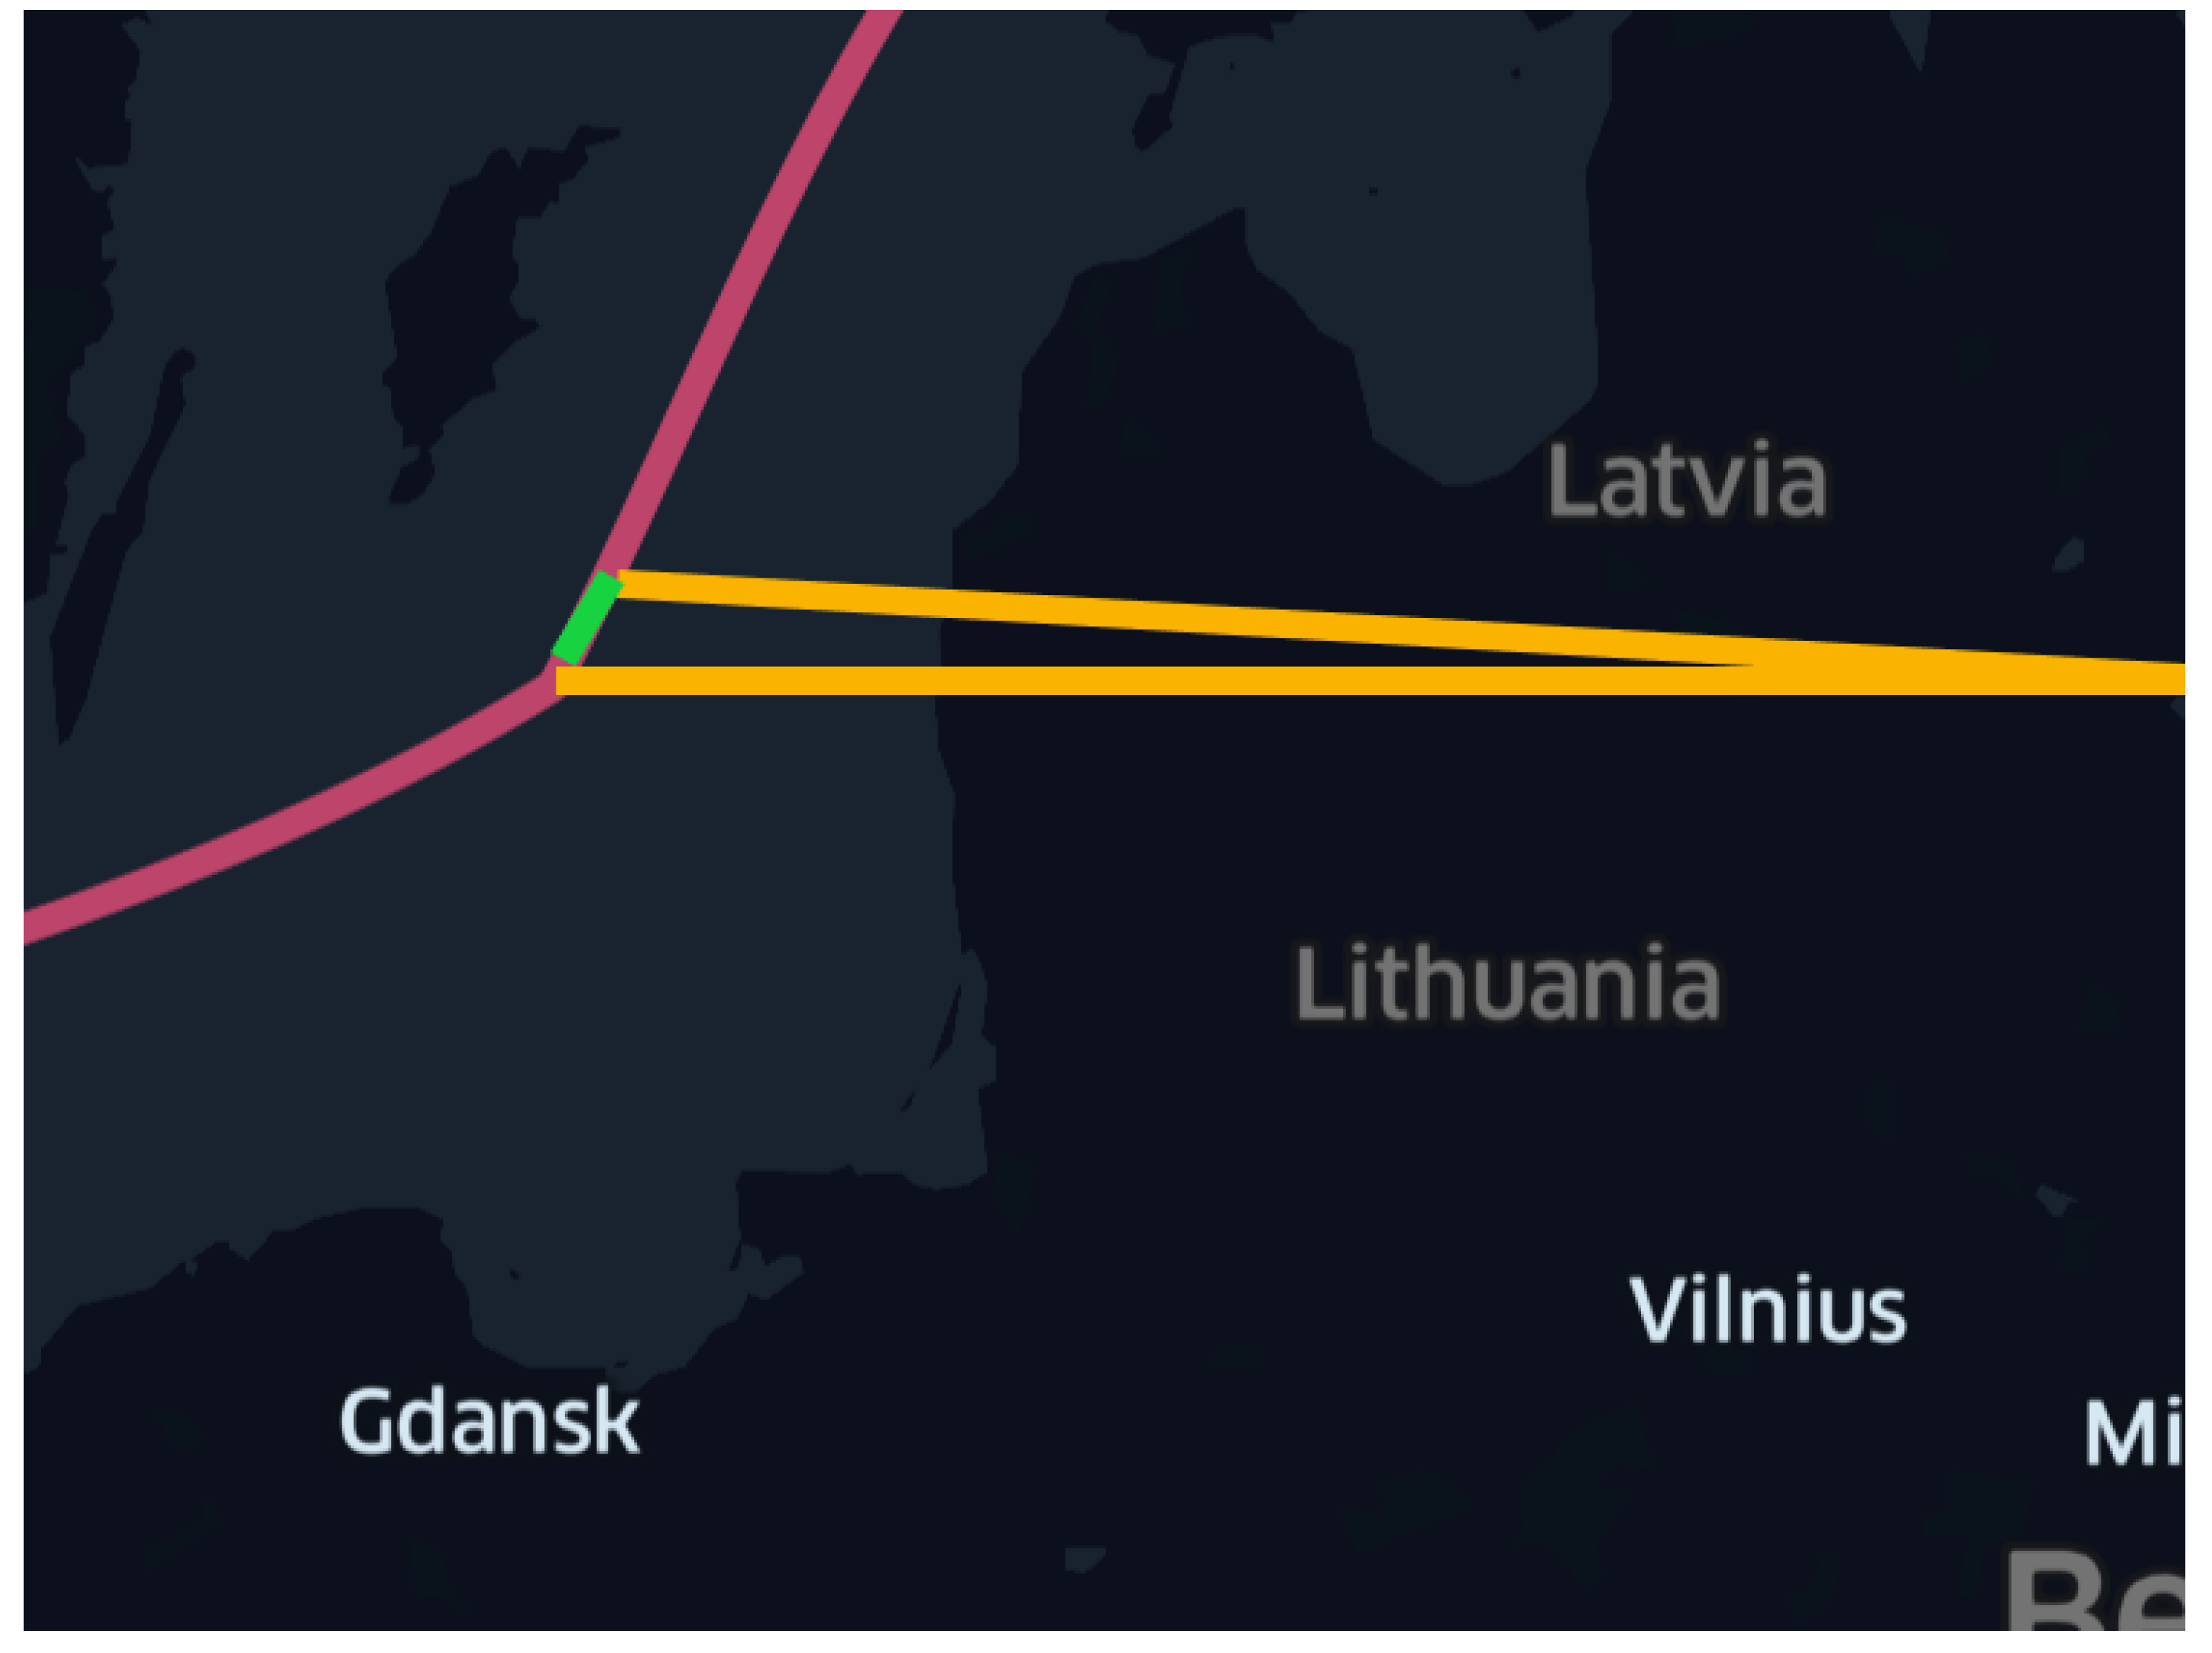
Figure 13 shows how the invalid trajectory (yellow color) has been replaced with the correct trajectory (green color).
6.3. Research Area
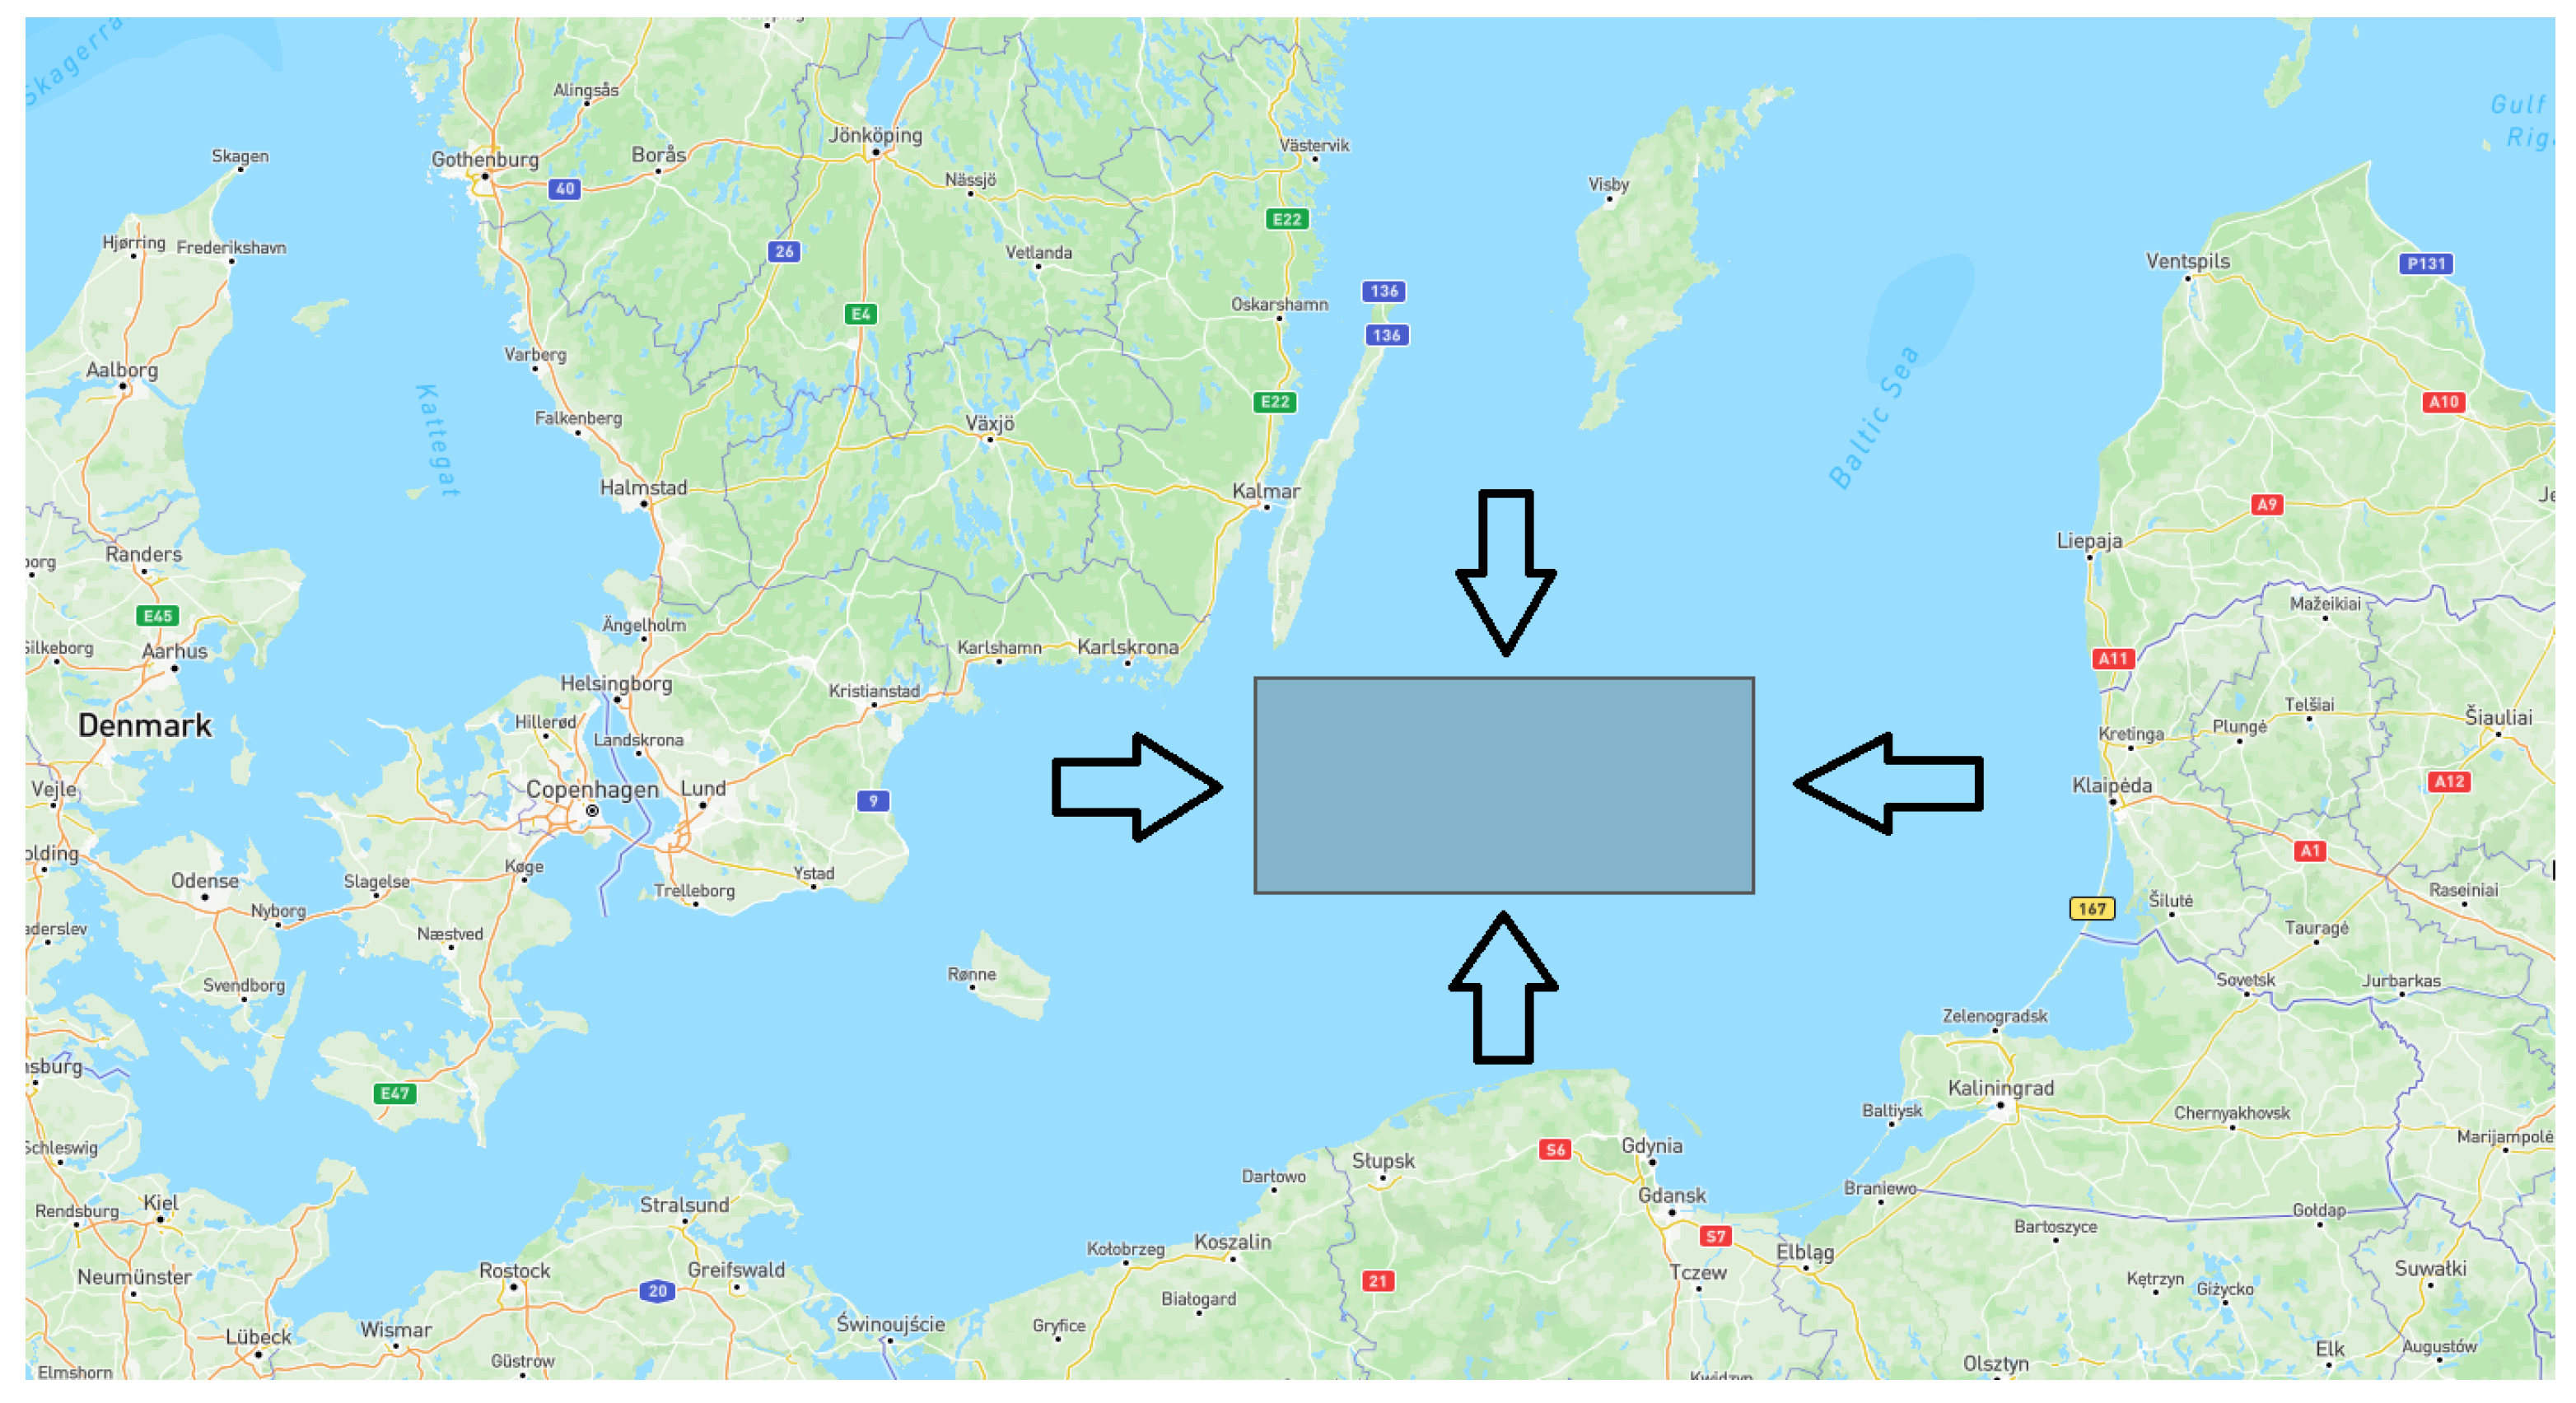
Applying clustering algorithms to the whole collected AIS dataset, which has more than 10 million samples, takes a large amount of time, and also requires very powerful hardware. Therefore, we decided to focus on a specific region illustrated in
Figure 14 to detect the abnormal behavior of vessels. Furthermore, we tried to select one of the main parts of marine transportation routes in the Baltic region, where many vessels that plan to transport their goods to some important ports, such as Karlskrona in Sweden, Gdansk in Poland, Klaipeda in Lithuania, Riga in Latvia, Tallinn in Estonia, and Helsinki in Finland, should sail through this area. The geographical characteristics of the desired research area are as follows:
After geo-referencing filtering was used to narrow down the analysis area, we also applied time filtering. The AIS between 12:00 AM and 12:00 PM on the 4 June 2022 was extracted from the dataset. Finally, the obtained dataset contains 2767 observations of 16 vessels. The types of vessels in the dataset are tanker, cargo, and tug.
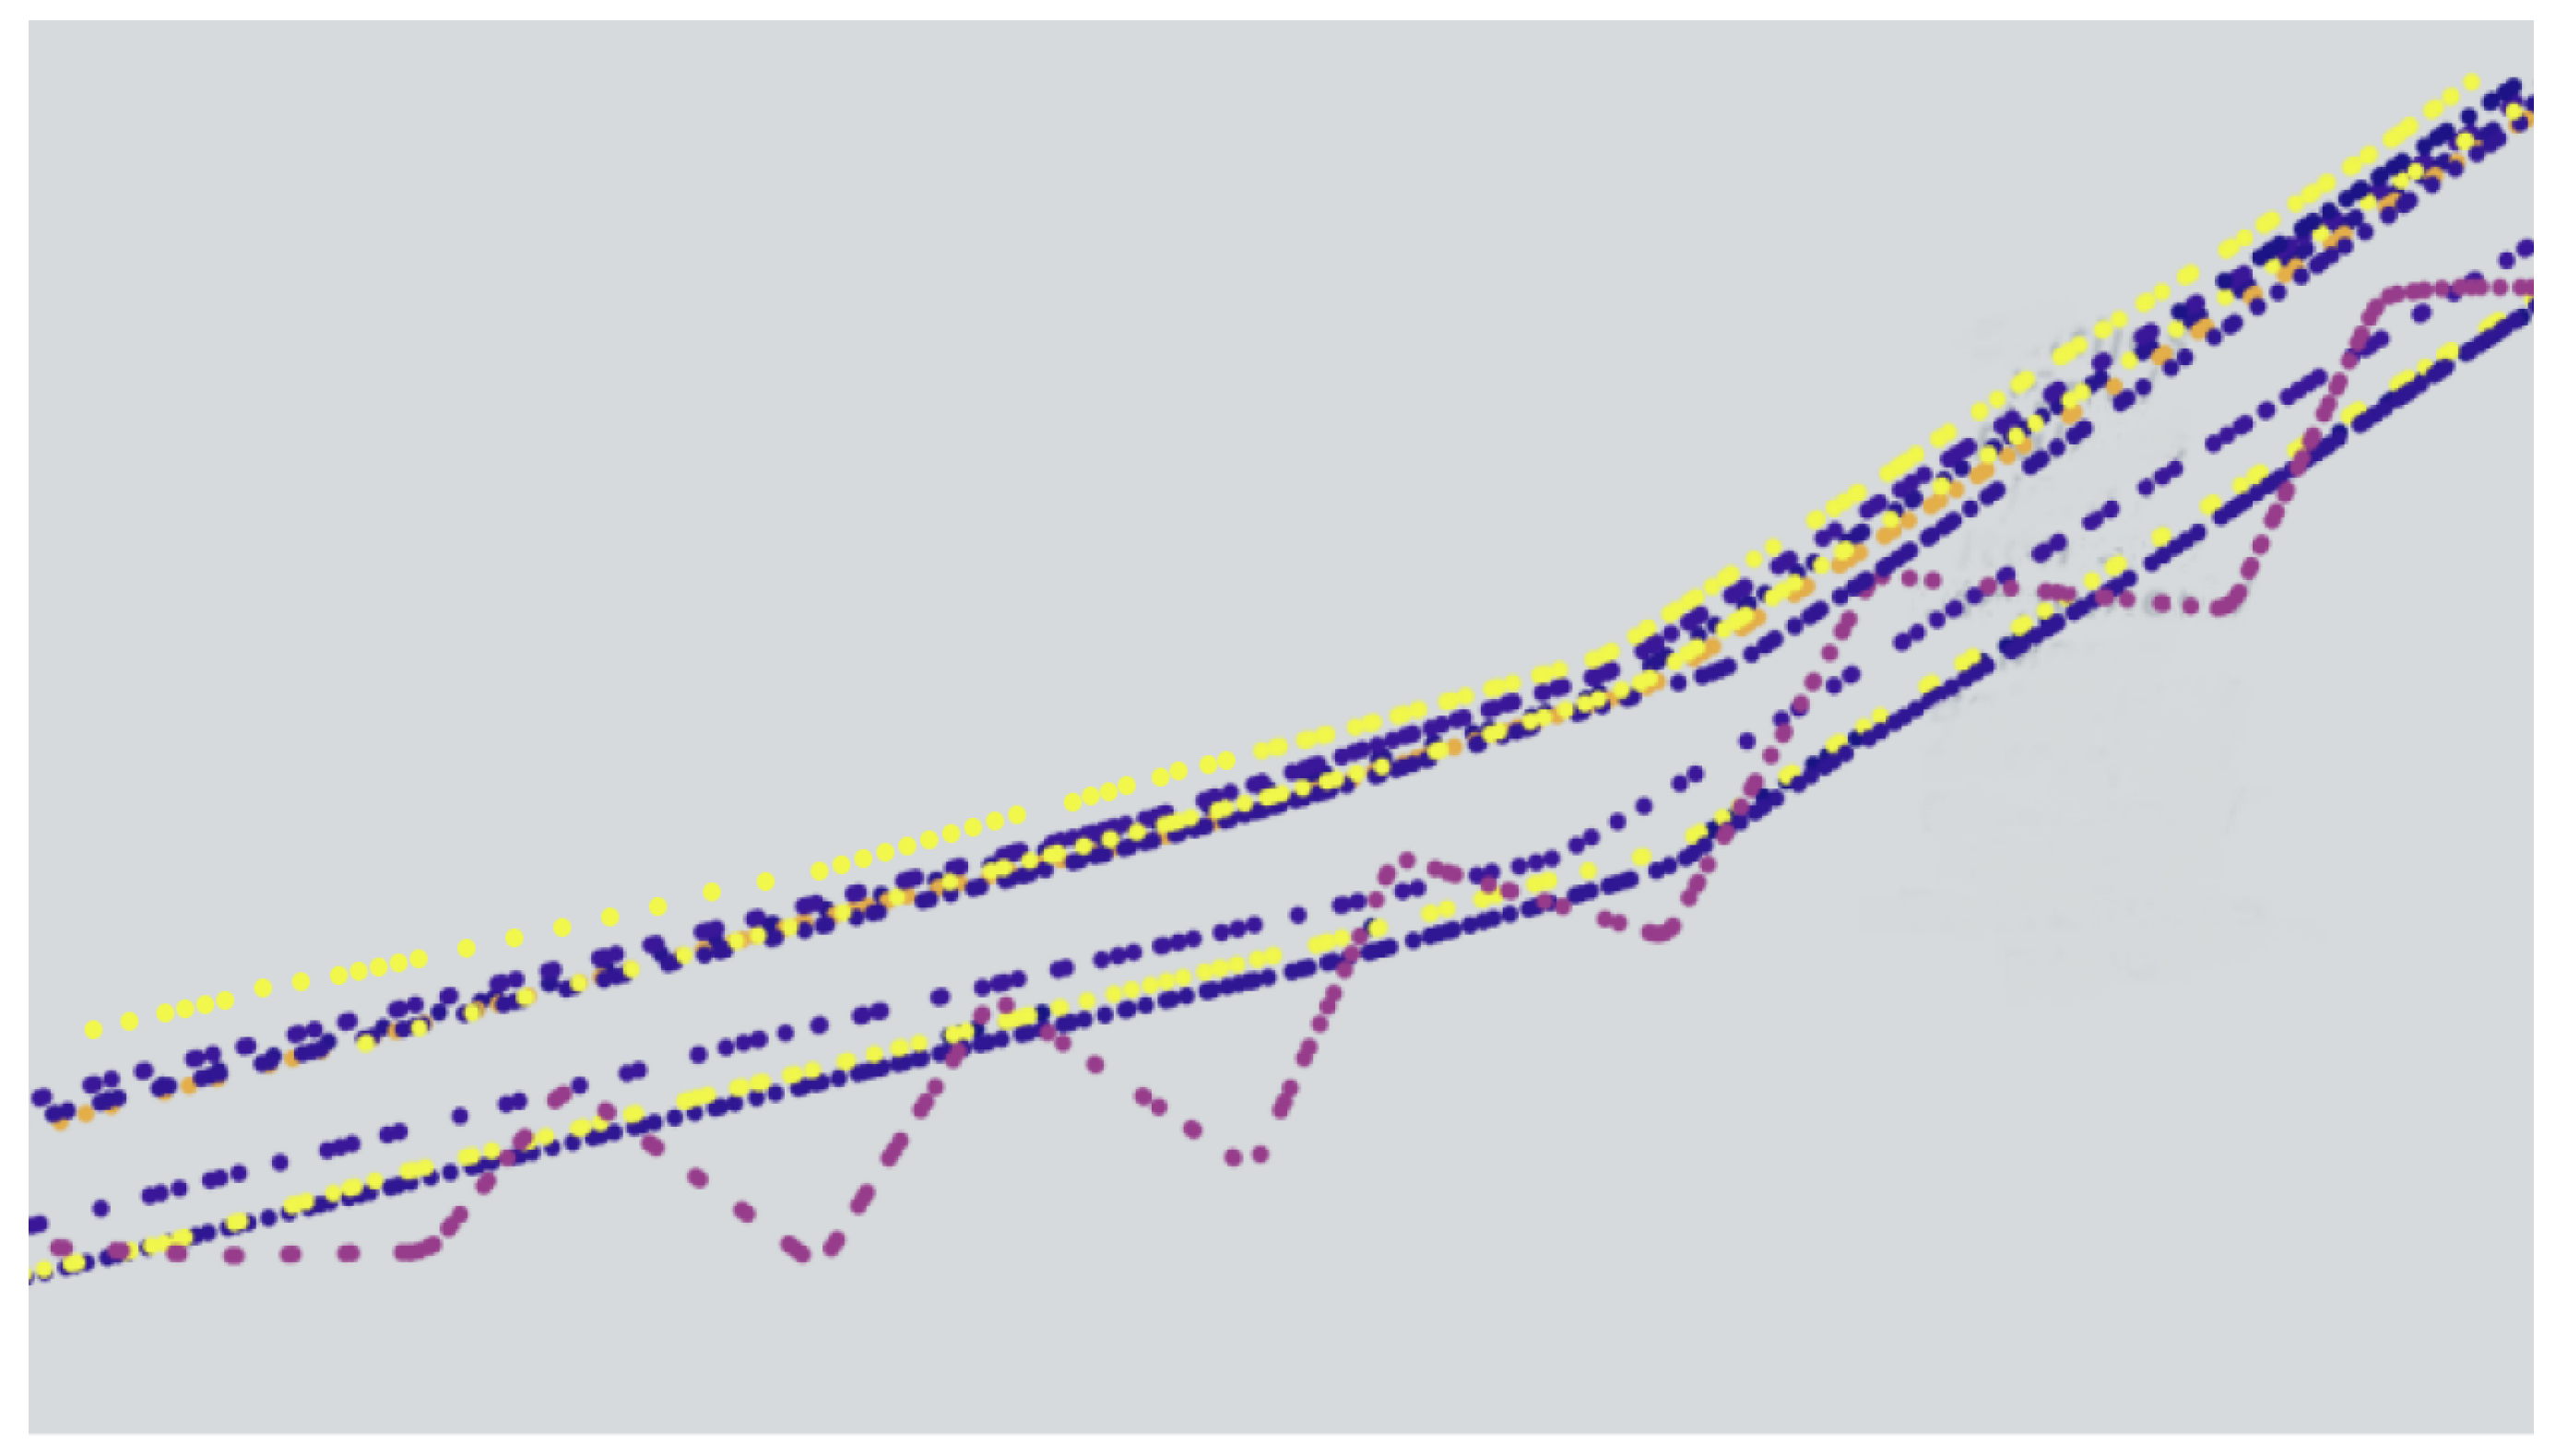
Figure 15 shows the real trajectories of those ships.
By applying both spatial and temporal filtering, the clustering algorithms used for the detection of dark ships and spiral movements can identify groups of vessels that exhibit similar behaviors over time, regardless of their location. This approach enables the detection of vessels with abnormal behavior, such as vessels with big variations in speed or constantly turning course over ground, by identifying groups of vessels that exhibit similar abnormal behaviors over time. The spatiotemporal filtering method takes into account the temporal evolution of vessel behavior and uses a sliding window approach to extract spatiotemporal features that describe the behavior of a vessel over time. As a result, vessels that exhibit abnormal behavior over time, such as sudden changes in speed or constant turning in one direction, can be detected by identifying groups of vessels that exhibit similar abnormal behaviors.
7. Experiment Setups
The input parameters play a significant role in clustering models and have a direct effect on the performance and accuracy of the clustering model. However, finding ideal parameters for clustering techniques is challenging as they are unsupervised learning models and there is no ground truth for the empirical evaluation of clustering approaches [
48]. In
Section 5, we introduce the approaches and proposed algorithm to find appropriate input parameters for each of the clustering methods separately.
Table 3 is also created to give a summary of them, and can be helpful as a reminder before showing the results obtained.
In our experimental setup, we applied the proposed algorithm to find the best clustering parameters for each of the input data sets described in the methodology section. The goal was to extract all hidden patterns and generate a deeper understanding of the data. We first applied the proposed algorithm to a three-dimensional input of (, , ) to identify the best parameters for the DBSCAN and affinity propagation algorithms. This process was then repeated for the other to-dimensional and three-dimensional inputs described in the methodology section.
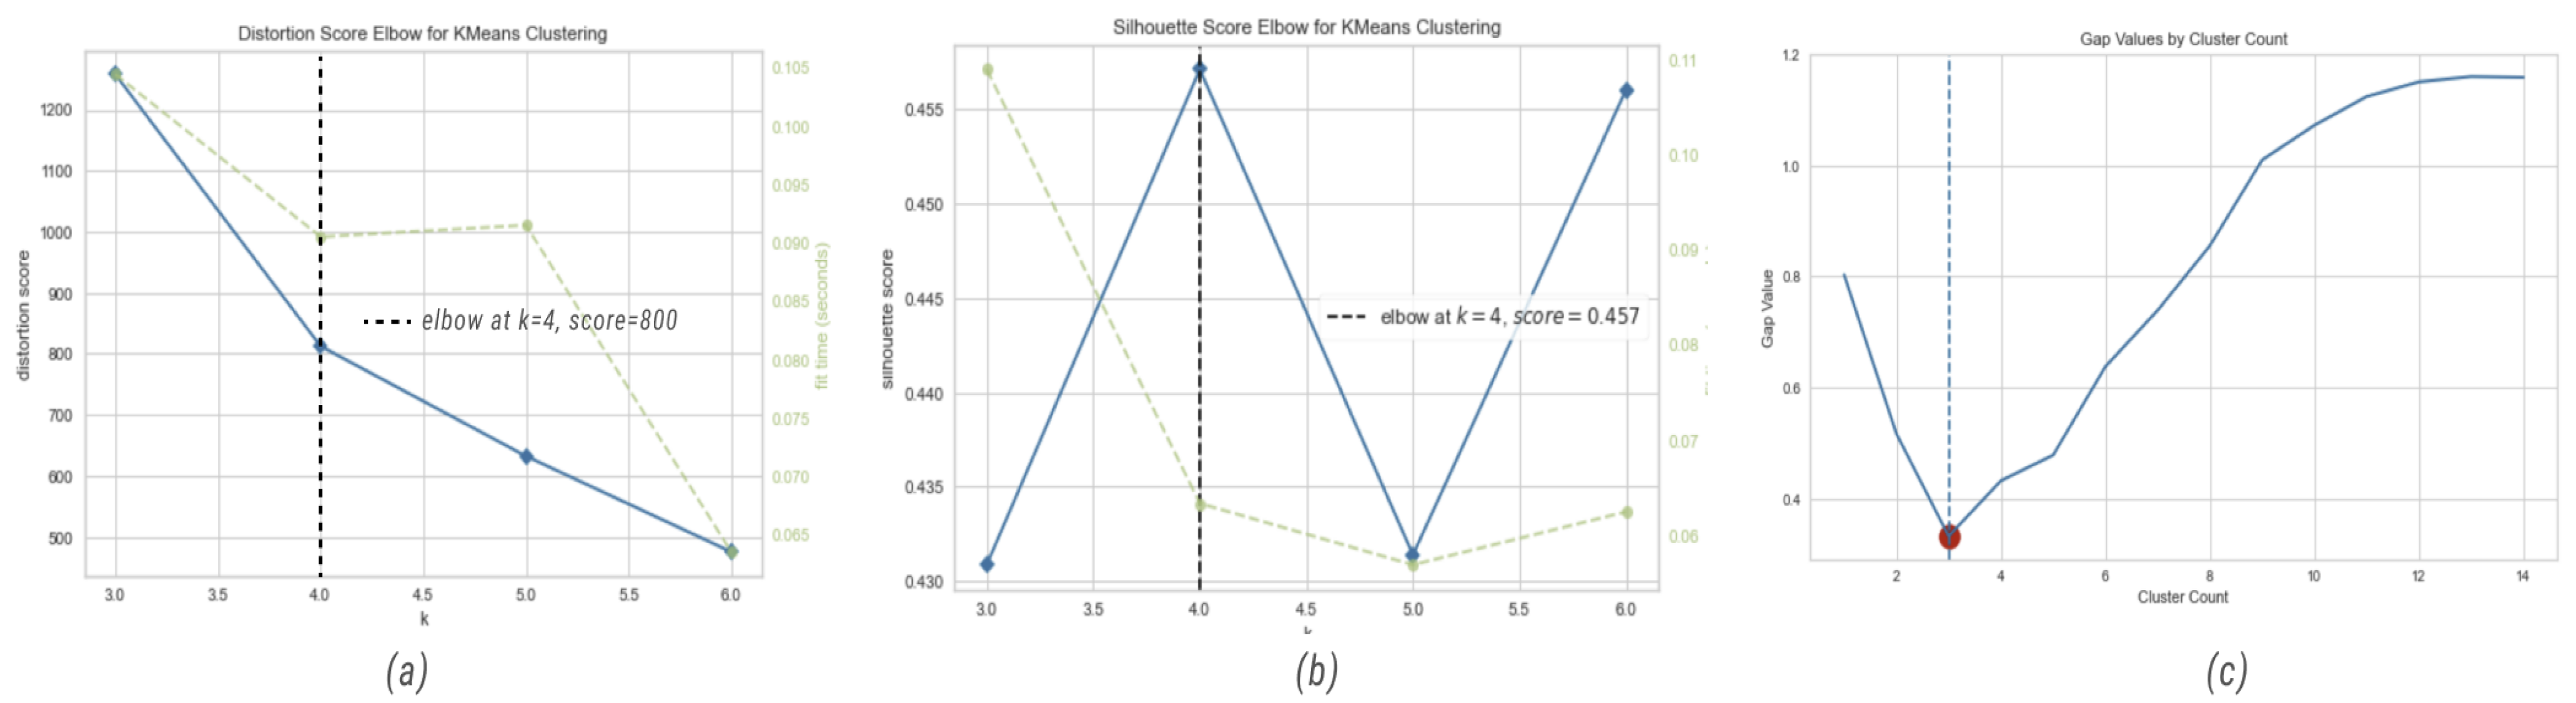
First, we used elbow, silhouette, and gap statistic methods in order to find the best number of clusters for K-means. The results (
Figure 16) that we received from each method for the three-dimensional input data (
,
,
) are as follows:
Elbow method suggested 4 for the number of clusters;
Silhouette method suggested 4 for the number of clusters;
Gap statistic method suggested 3 for the number of clusters.
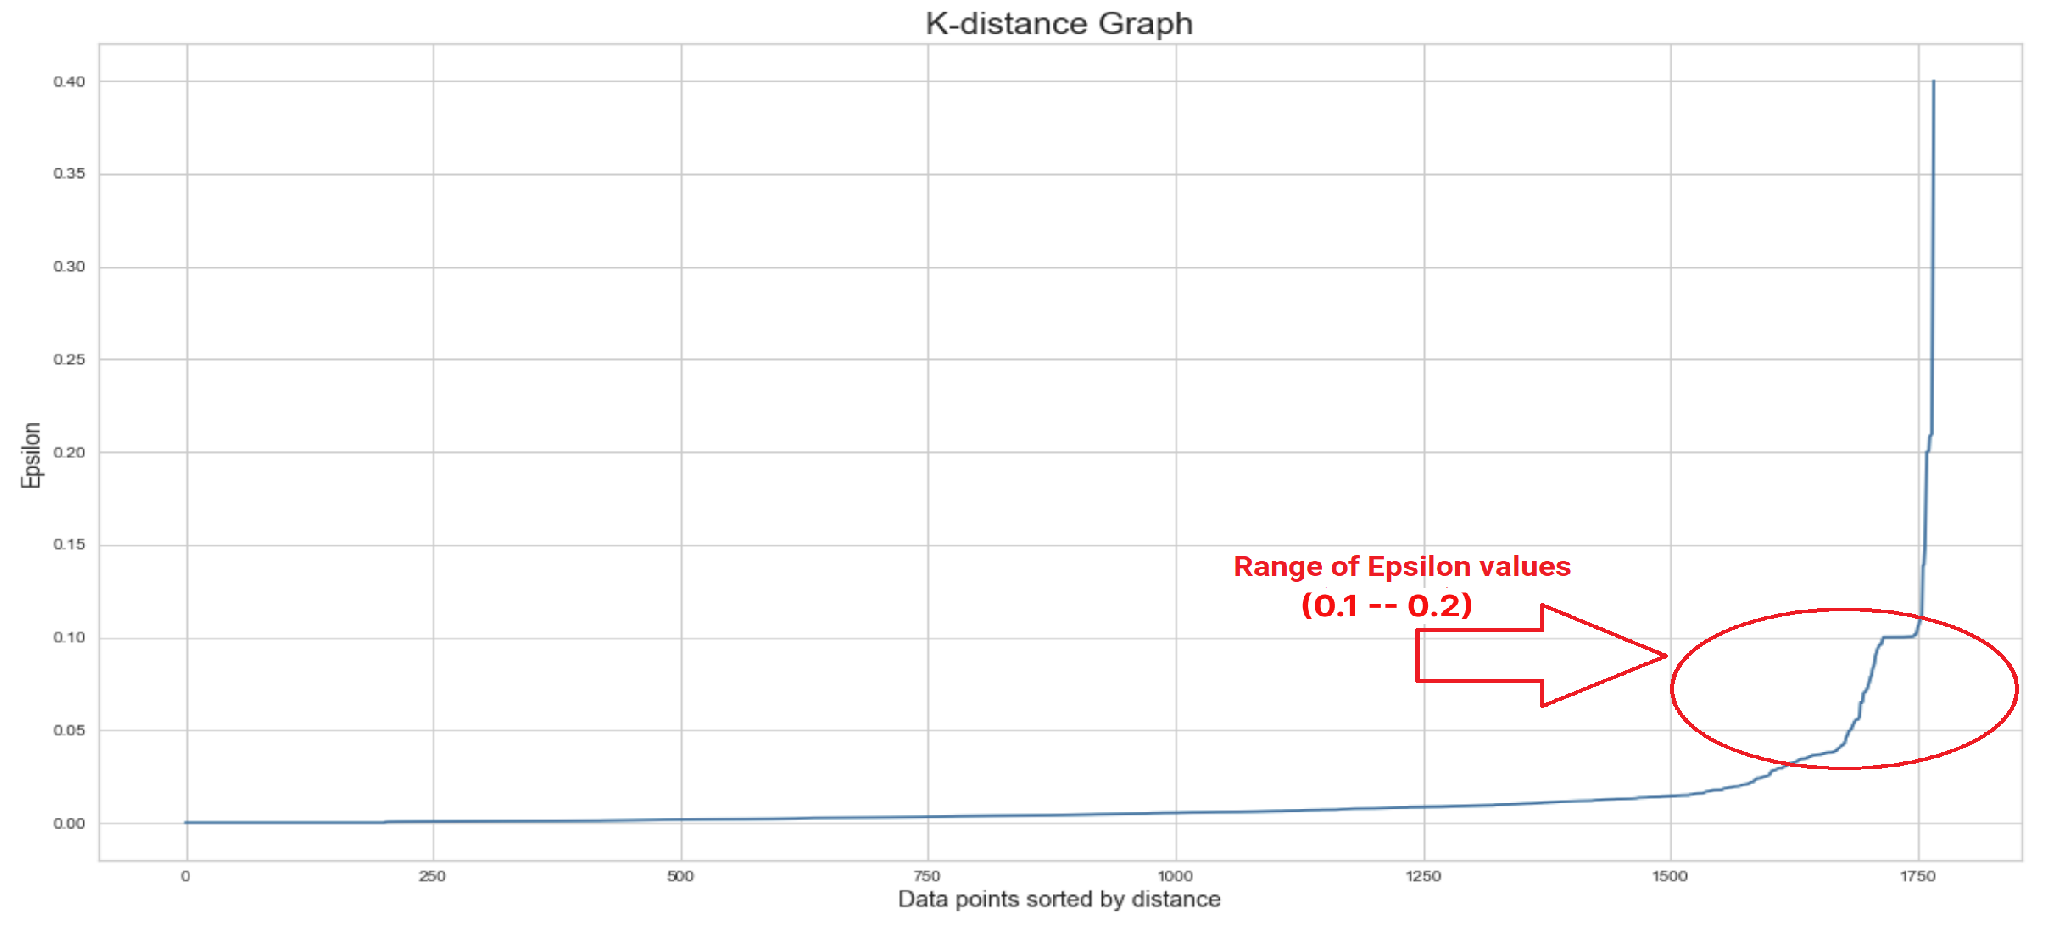
The second clustering method is DBSCAN, which requires
and
. To determine the range of
, we used a K-distance graph (
Figure 17), and the result shows that the range should be between 0.2 and 0.99. In addition, we calculated the number of
based on the following equations [
46]:
where dim is the dimensions of dataset.
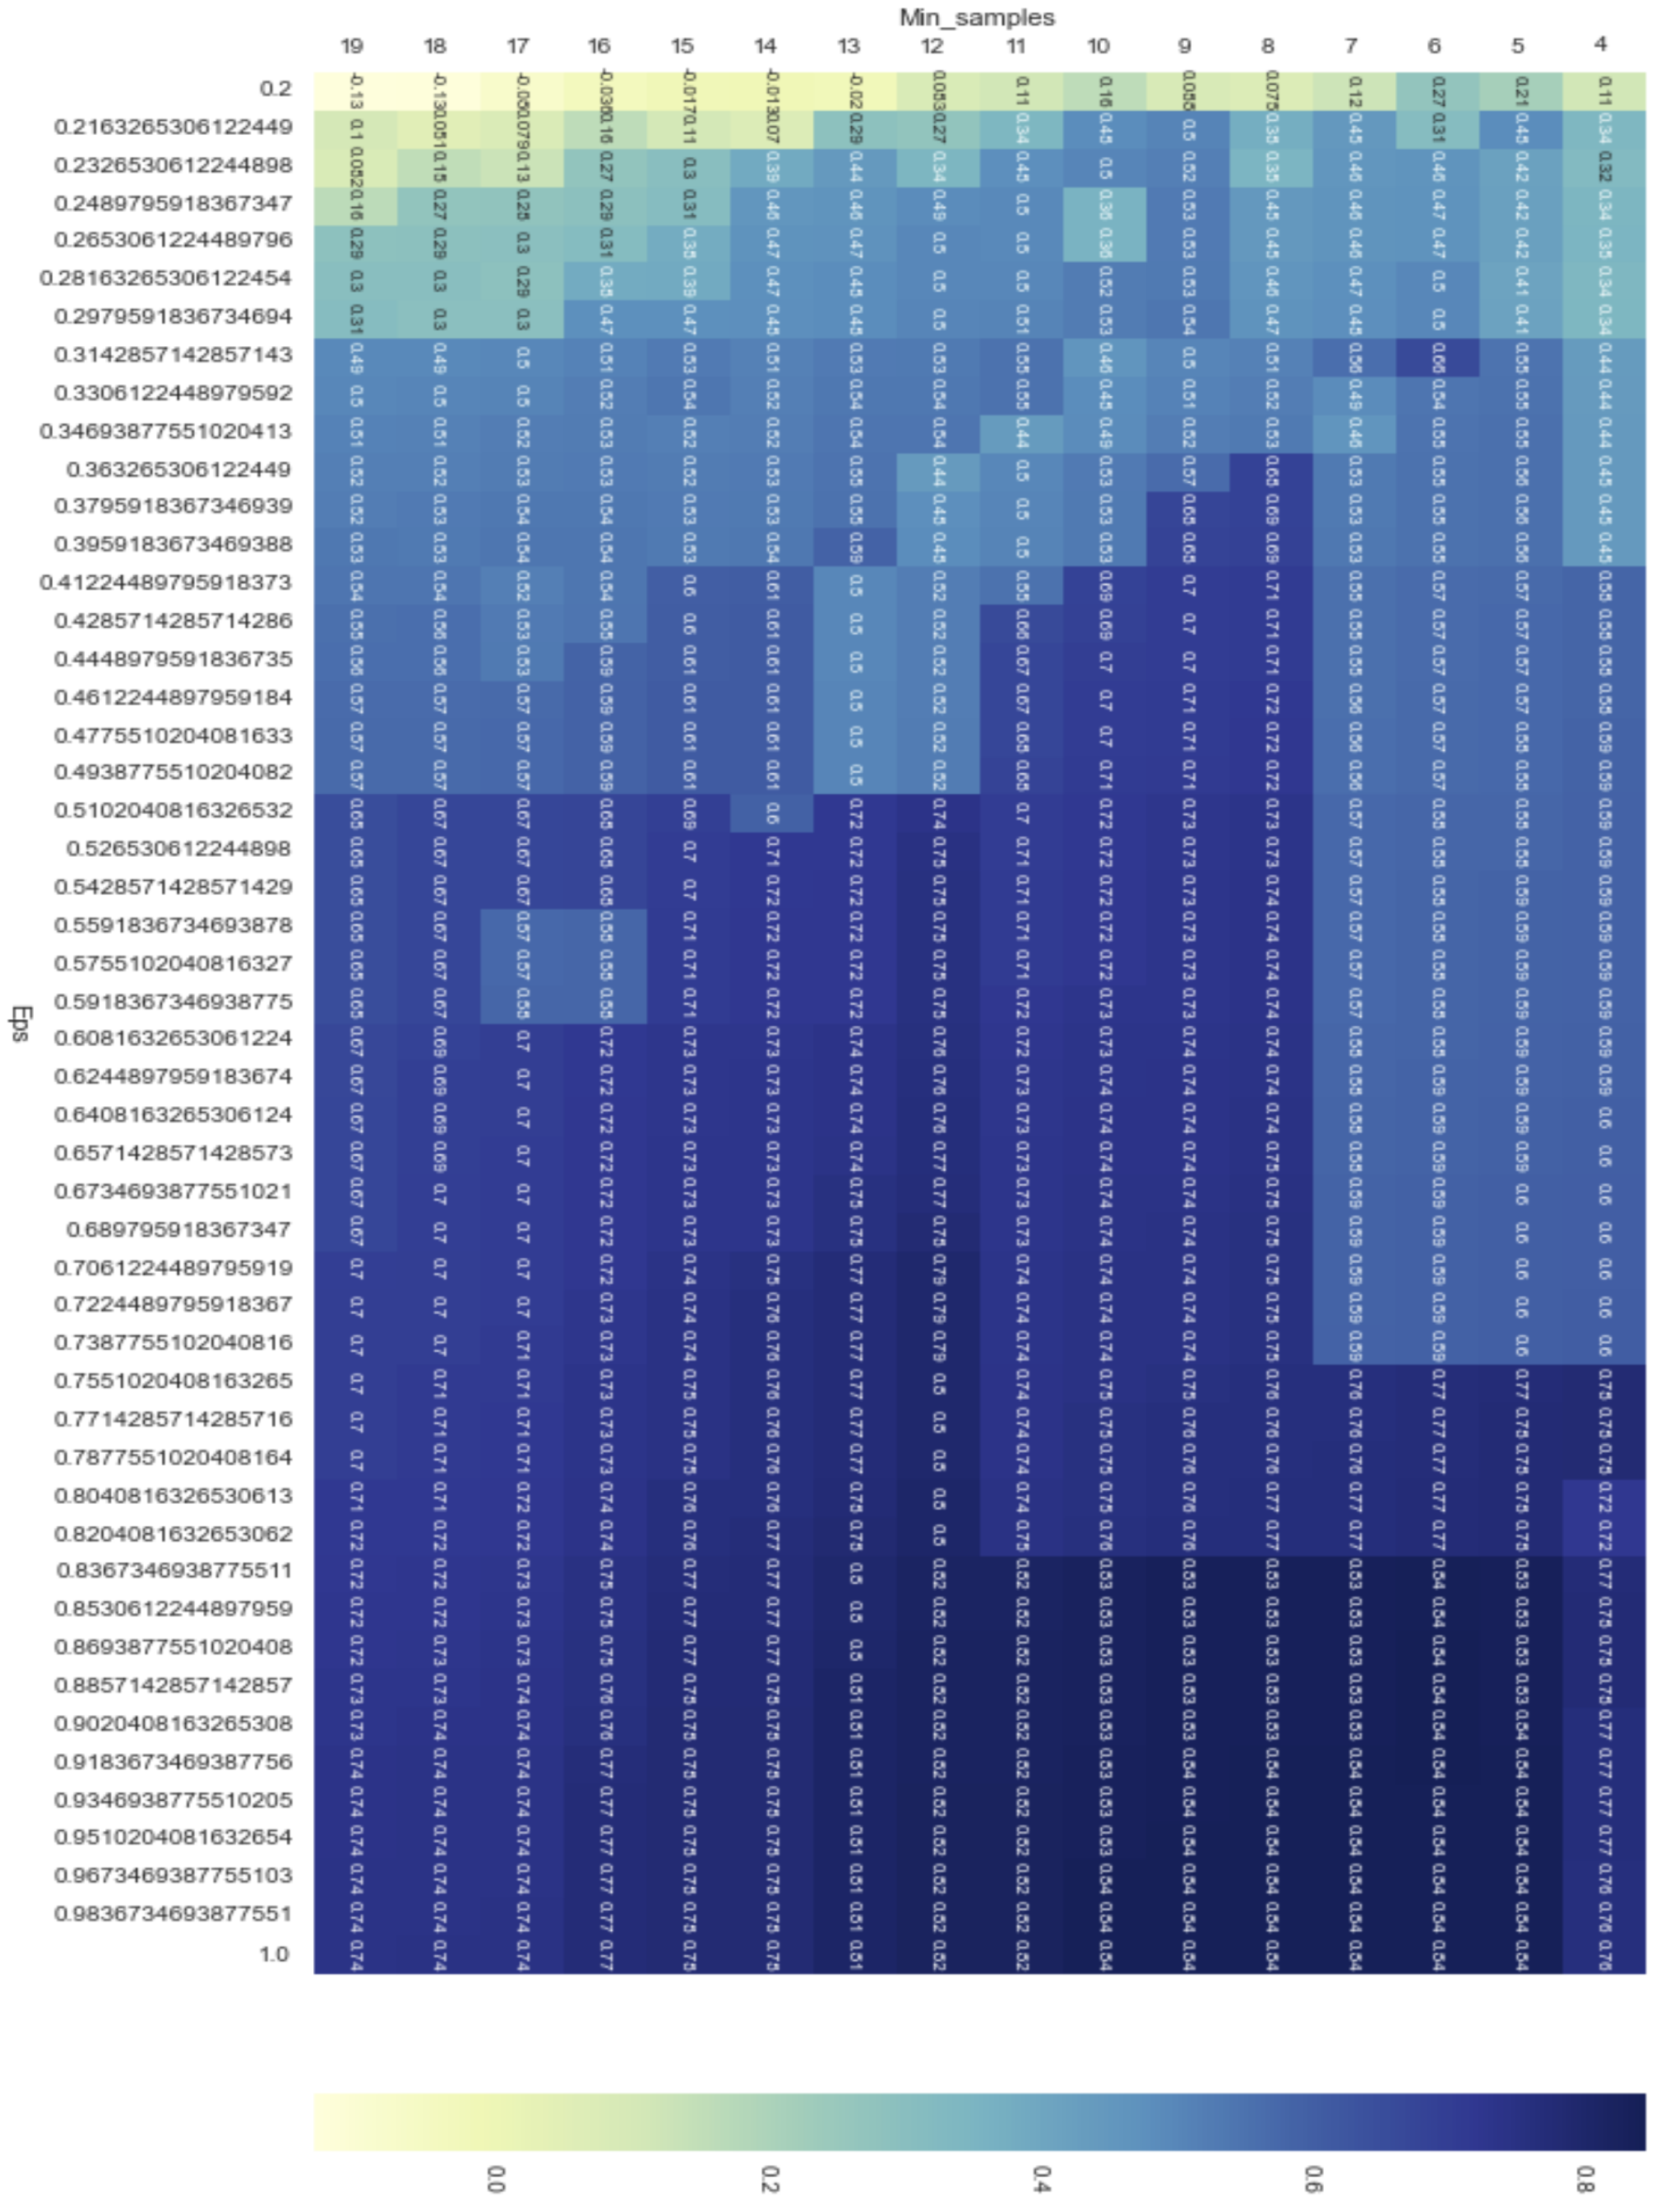
Therefore, we created a list that includes 50 numbers in that range and fed it to the proposed algorithm in order to find the optimal value of epsilon. Eventually, the best value for both parameters (
and
) were, respectively, 0.91836 and 6. The heatmap visualization of the proposed algorithm for the DBSCAN clustering method is demonstrated in
Figure 18.
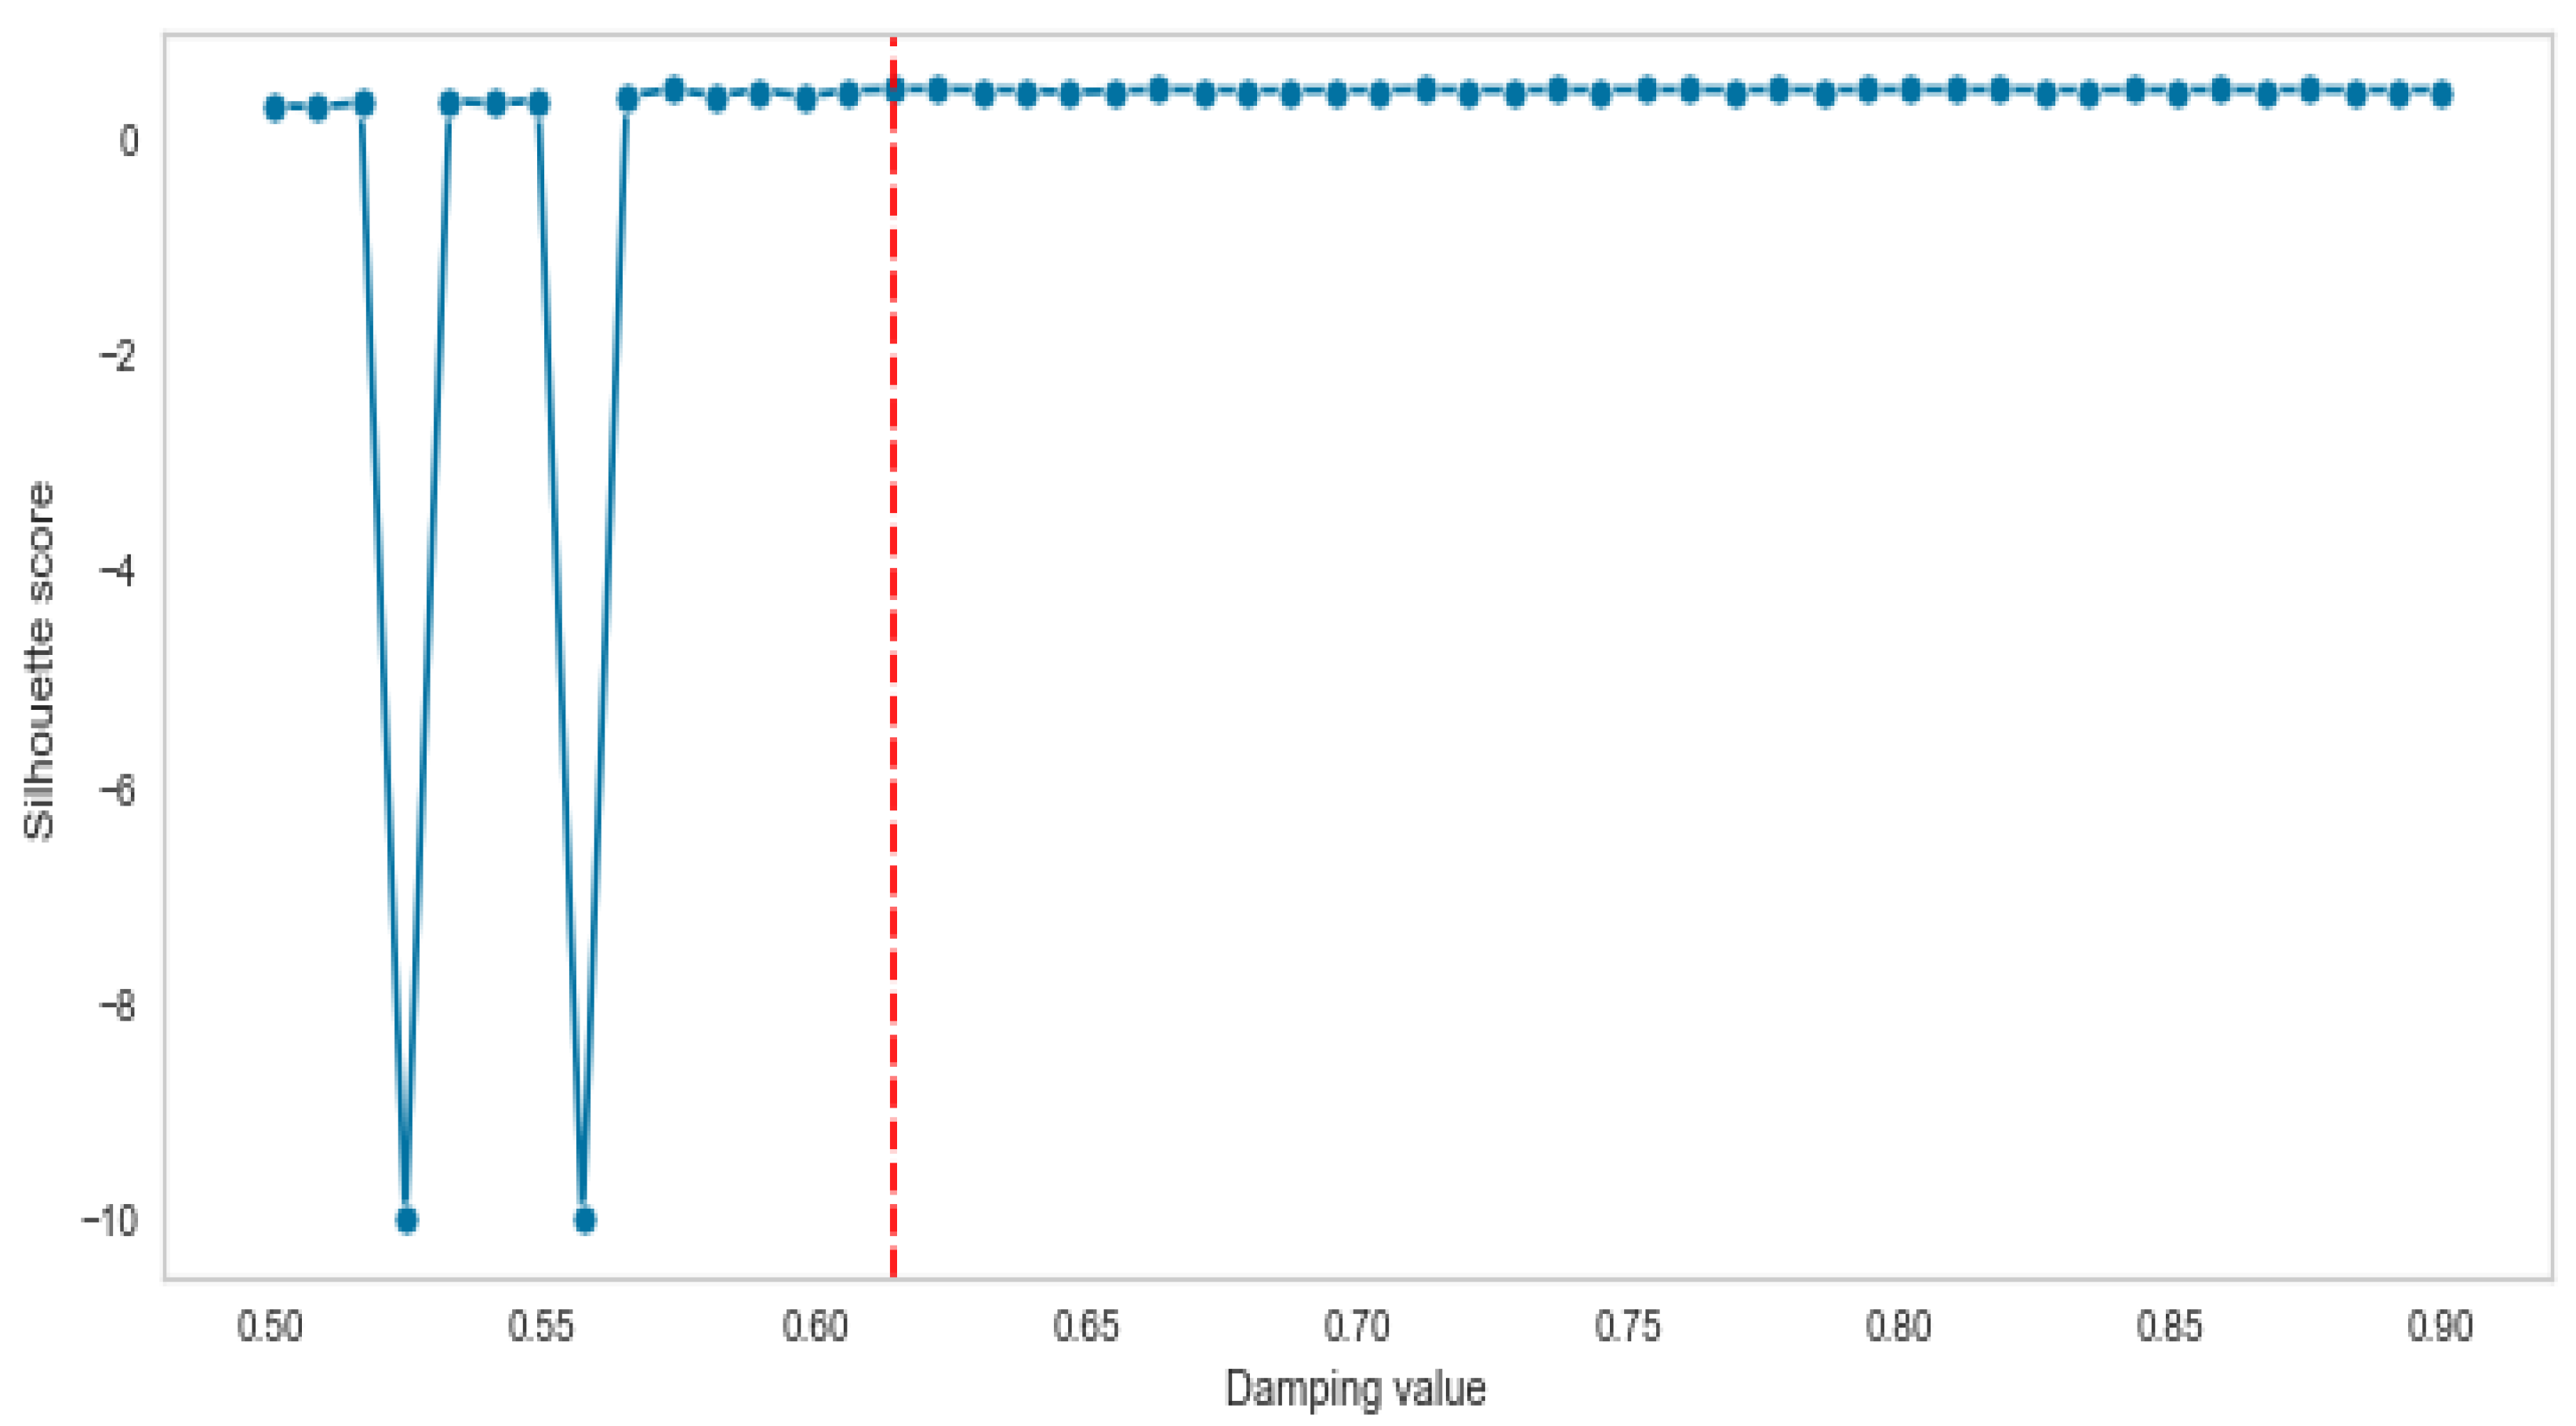
The third clustering method is AP, which has the best dumping value based on the proposed algorithm. We first created a list for dumping, which includes 50 numbers in the range of 0.5–0.9. Then, the list was fed into the proposed algorithm and the silhouette score for each number of lists was calculated.
Figure 19 shows that the optimal number of dumping is 0.622449.
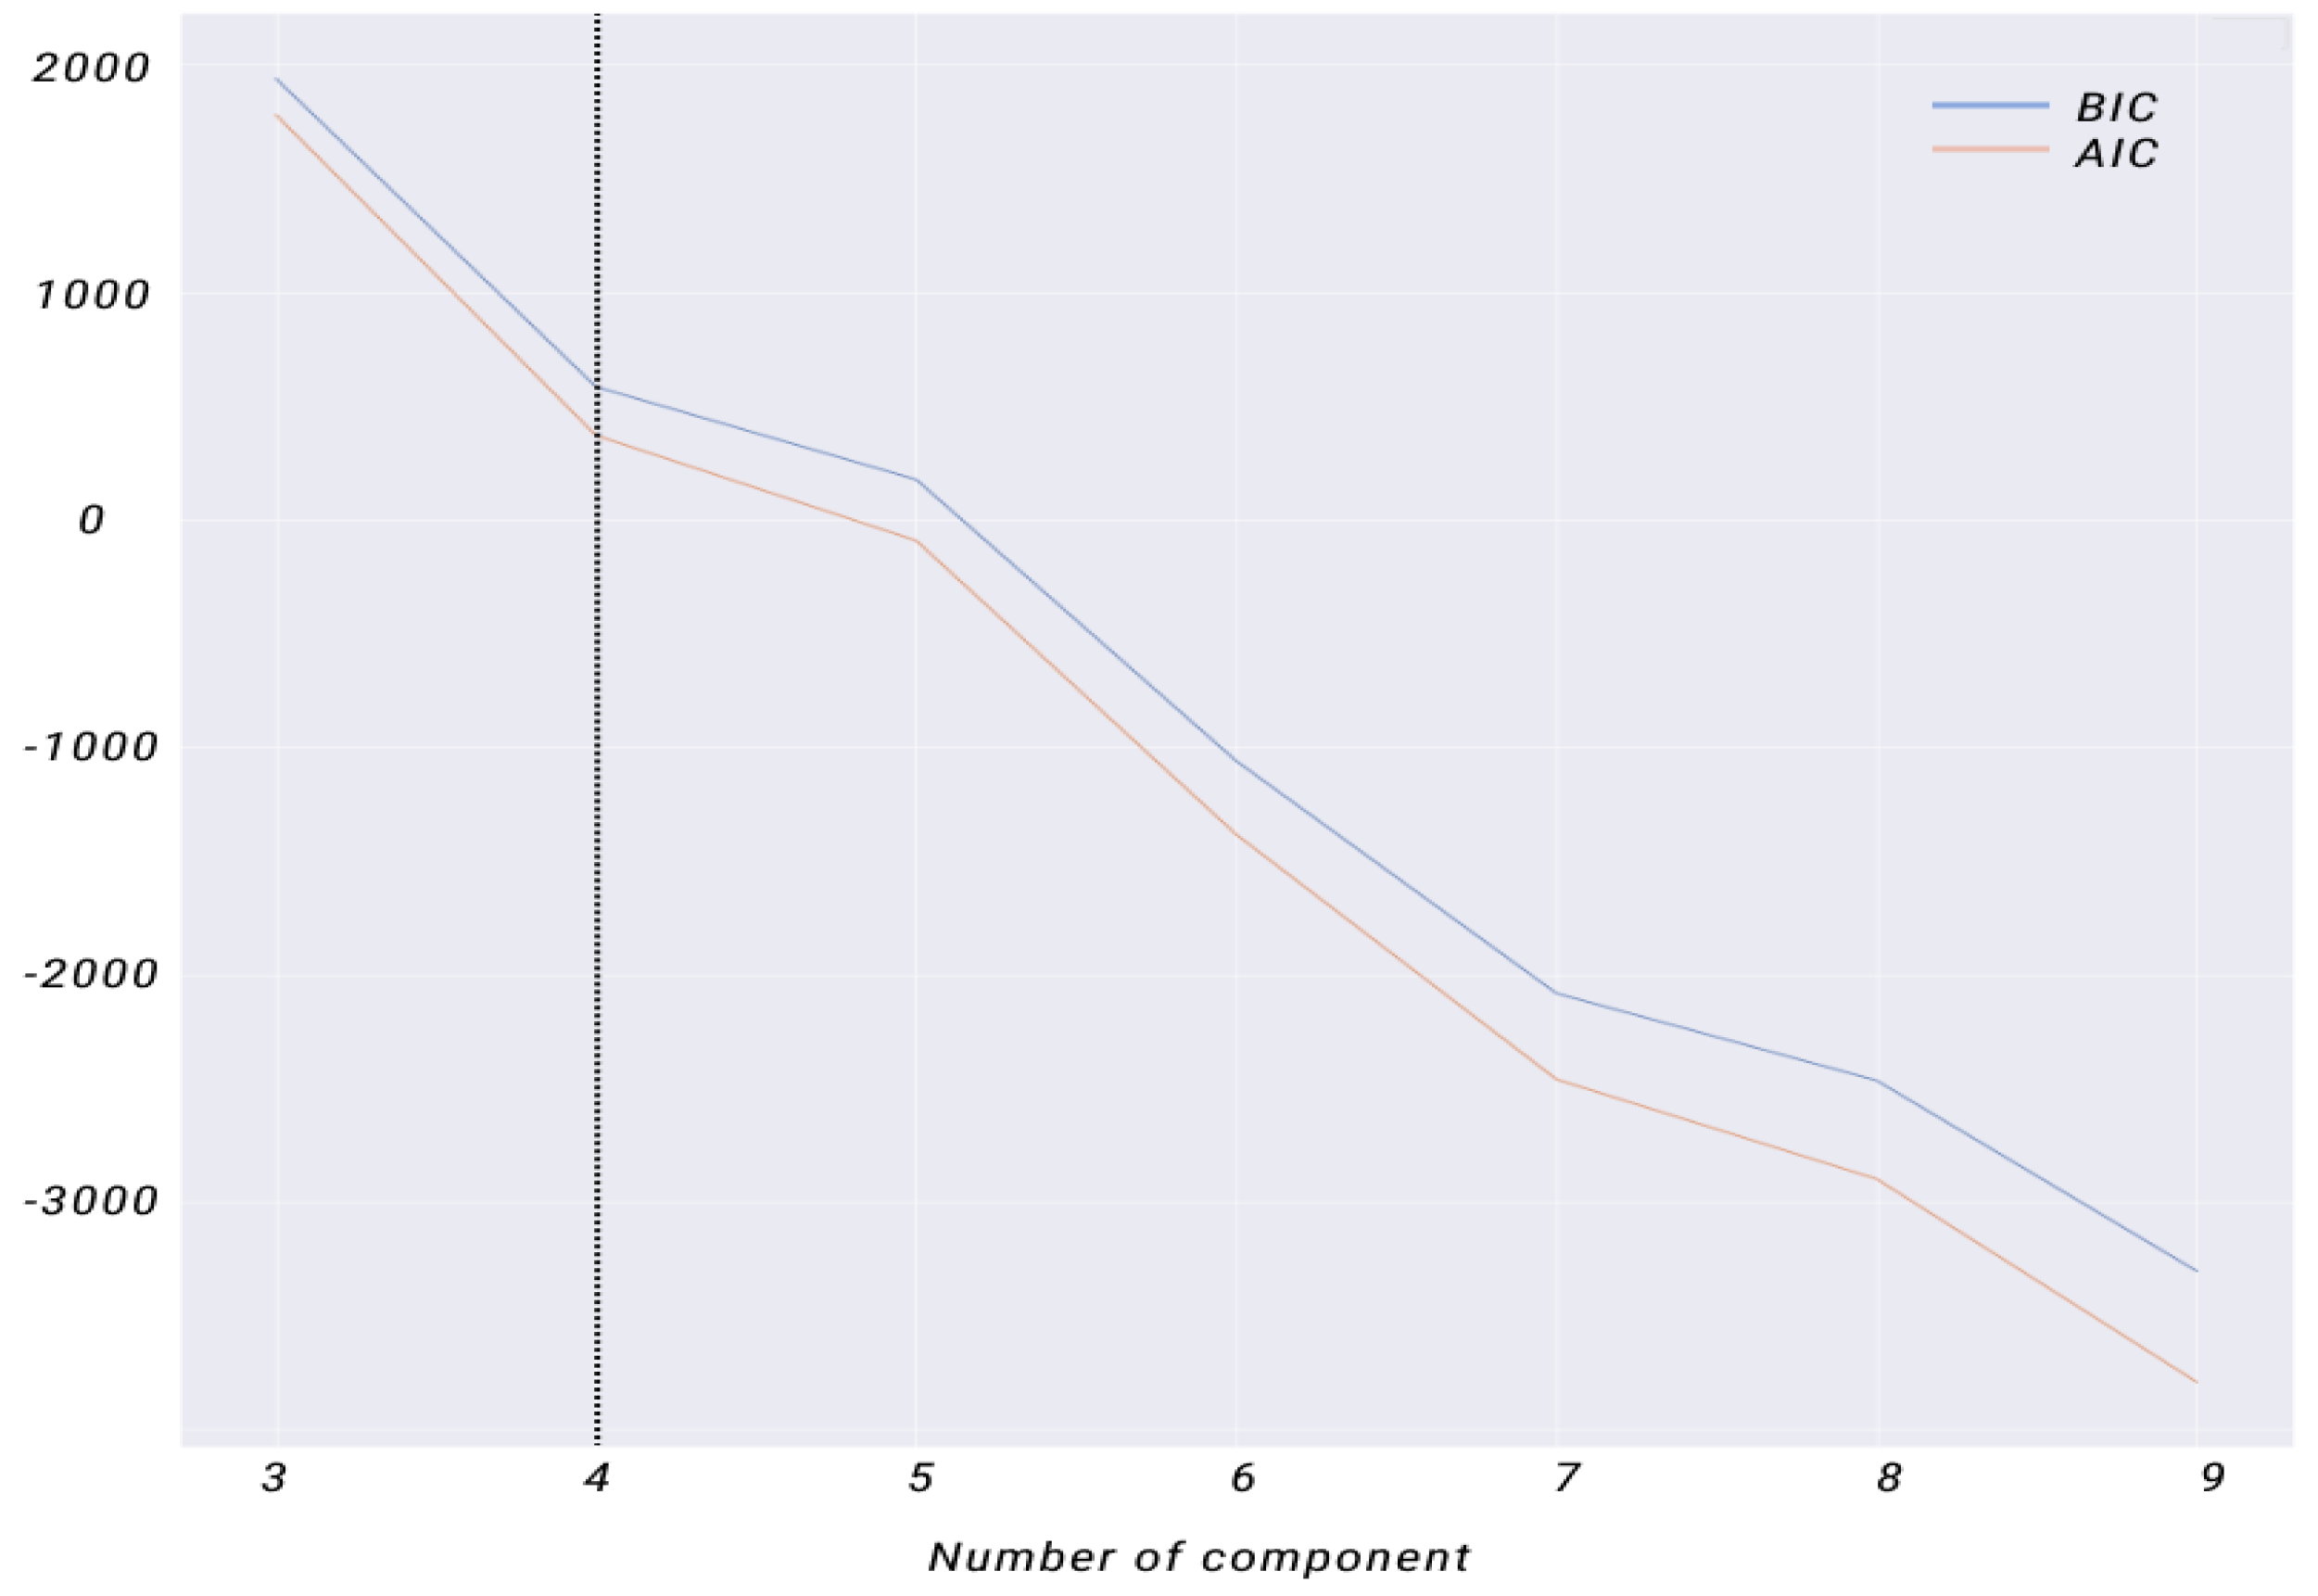
The last clustering algorithm in which we tried to find the required parameter (number of components) is the GMM. The AIC and BIC are two methods that have been suggested for finding the optimal number of clusters. To determine the optimal number of clusters from the AIC and BIC figures, we examined the curves and identified the point where the score begins to level off or show diminishing returns as the number of clusters increases. This indicates that adding more clusters does not improve the model fit significantly and may overfit the data.
Figure 20, which plots the AIC or BIC score against the number of clusters, shows a smooth and monotonic AIC/BIC curve with a clear elbow point at four clusters, suggesting that four clusters is a reasonable choice for the optimal number of clusters.
In our experimental setup, we aimed to comprehensively analyze the input data and extract all hidden patterns in order to generate a deeper understanding of the data. To achieve this goal, we considered all possible two-dimensional and three-dimensional inputs. This required repeating the process of finding the optimal hyper-parameters for the clustering algorithms for each input data set. The results of the experiments are presented in
Table 4, which provides a detailed comparison of the performance of each clustering method on each input data set. The results show the best hyper-parameters for each clustering method and the corresponding silhouette score, providing valuable information for selecting the most appropriate clustering method for a given data set.
8. Experiment Results
To show the efficiency and effectiveness of clustering methods and compare them, we conducted experiments on the dataset containing 2767 observations or AIS messages collected in June 2022. Furthermore, the dataset used for the experiment part was first filtered and pre-processed. The area selected for this study is located in the heart of the Baltic Sea and is one of the leading marine ways. Another reason for why we focused on the selected part of the data is that the entire collected dataset includes more than 10 million messages and requires powerful hardware to consider all of them. Furthermore, interpreting the results and extracting insights and patterns from real data can be very challenging. In this part, we show the results in four
Figure 21,
Figure 22,
Figure 23 and
Figure 24 based on the clustering algorithms in order to cover all results obtained from different high-dimensional clustering inputs. The abnormal behaviors are highlighted by red bounding boxes in each figure.
Before presenting the results, it should be noted that the clustering methods used the Euclidean distance measurement to calculate the distance between data points. The results obtained from the K-means clustering algorithm compared to other clustering methods can be more understandable and visible. Furthermore, K-means perfectly partitioned the selected AIS dataset into distinctive subsets, including similar data samples. However, other clustering methods are highly dependent on the parameters and the results are very different even if the parameters are fixed.
The results of the K-means algorithm are shown in
Figure 21a,f,g. It can be seen that the dark ship is easily distinguishable due to the inconsistent and widely varying speed over ground (SOG) feature, which sets it apart from other vessels. In
Figure 21b,e,h, the spiral movements of a particular vessel can be observed due to its frequently changing course over ground (COG) compared to other vessels. In
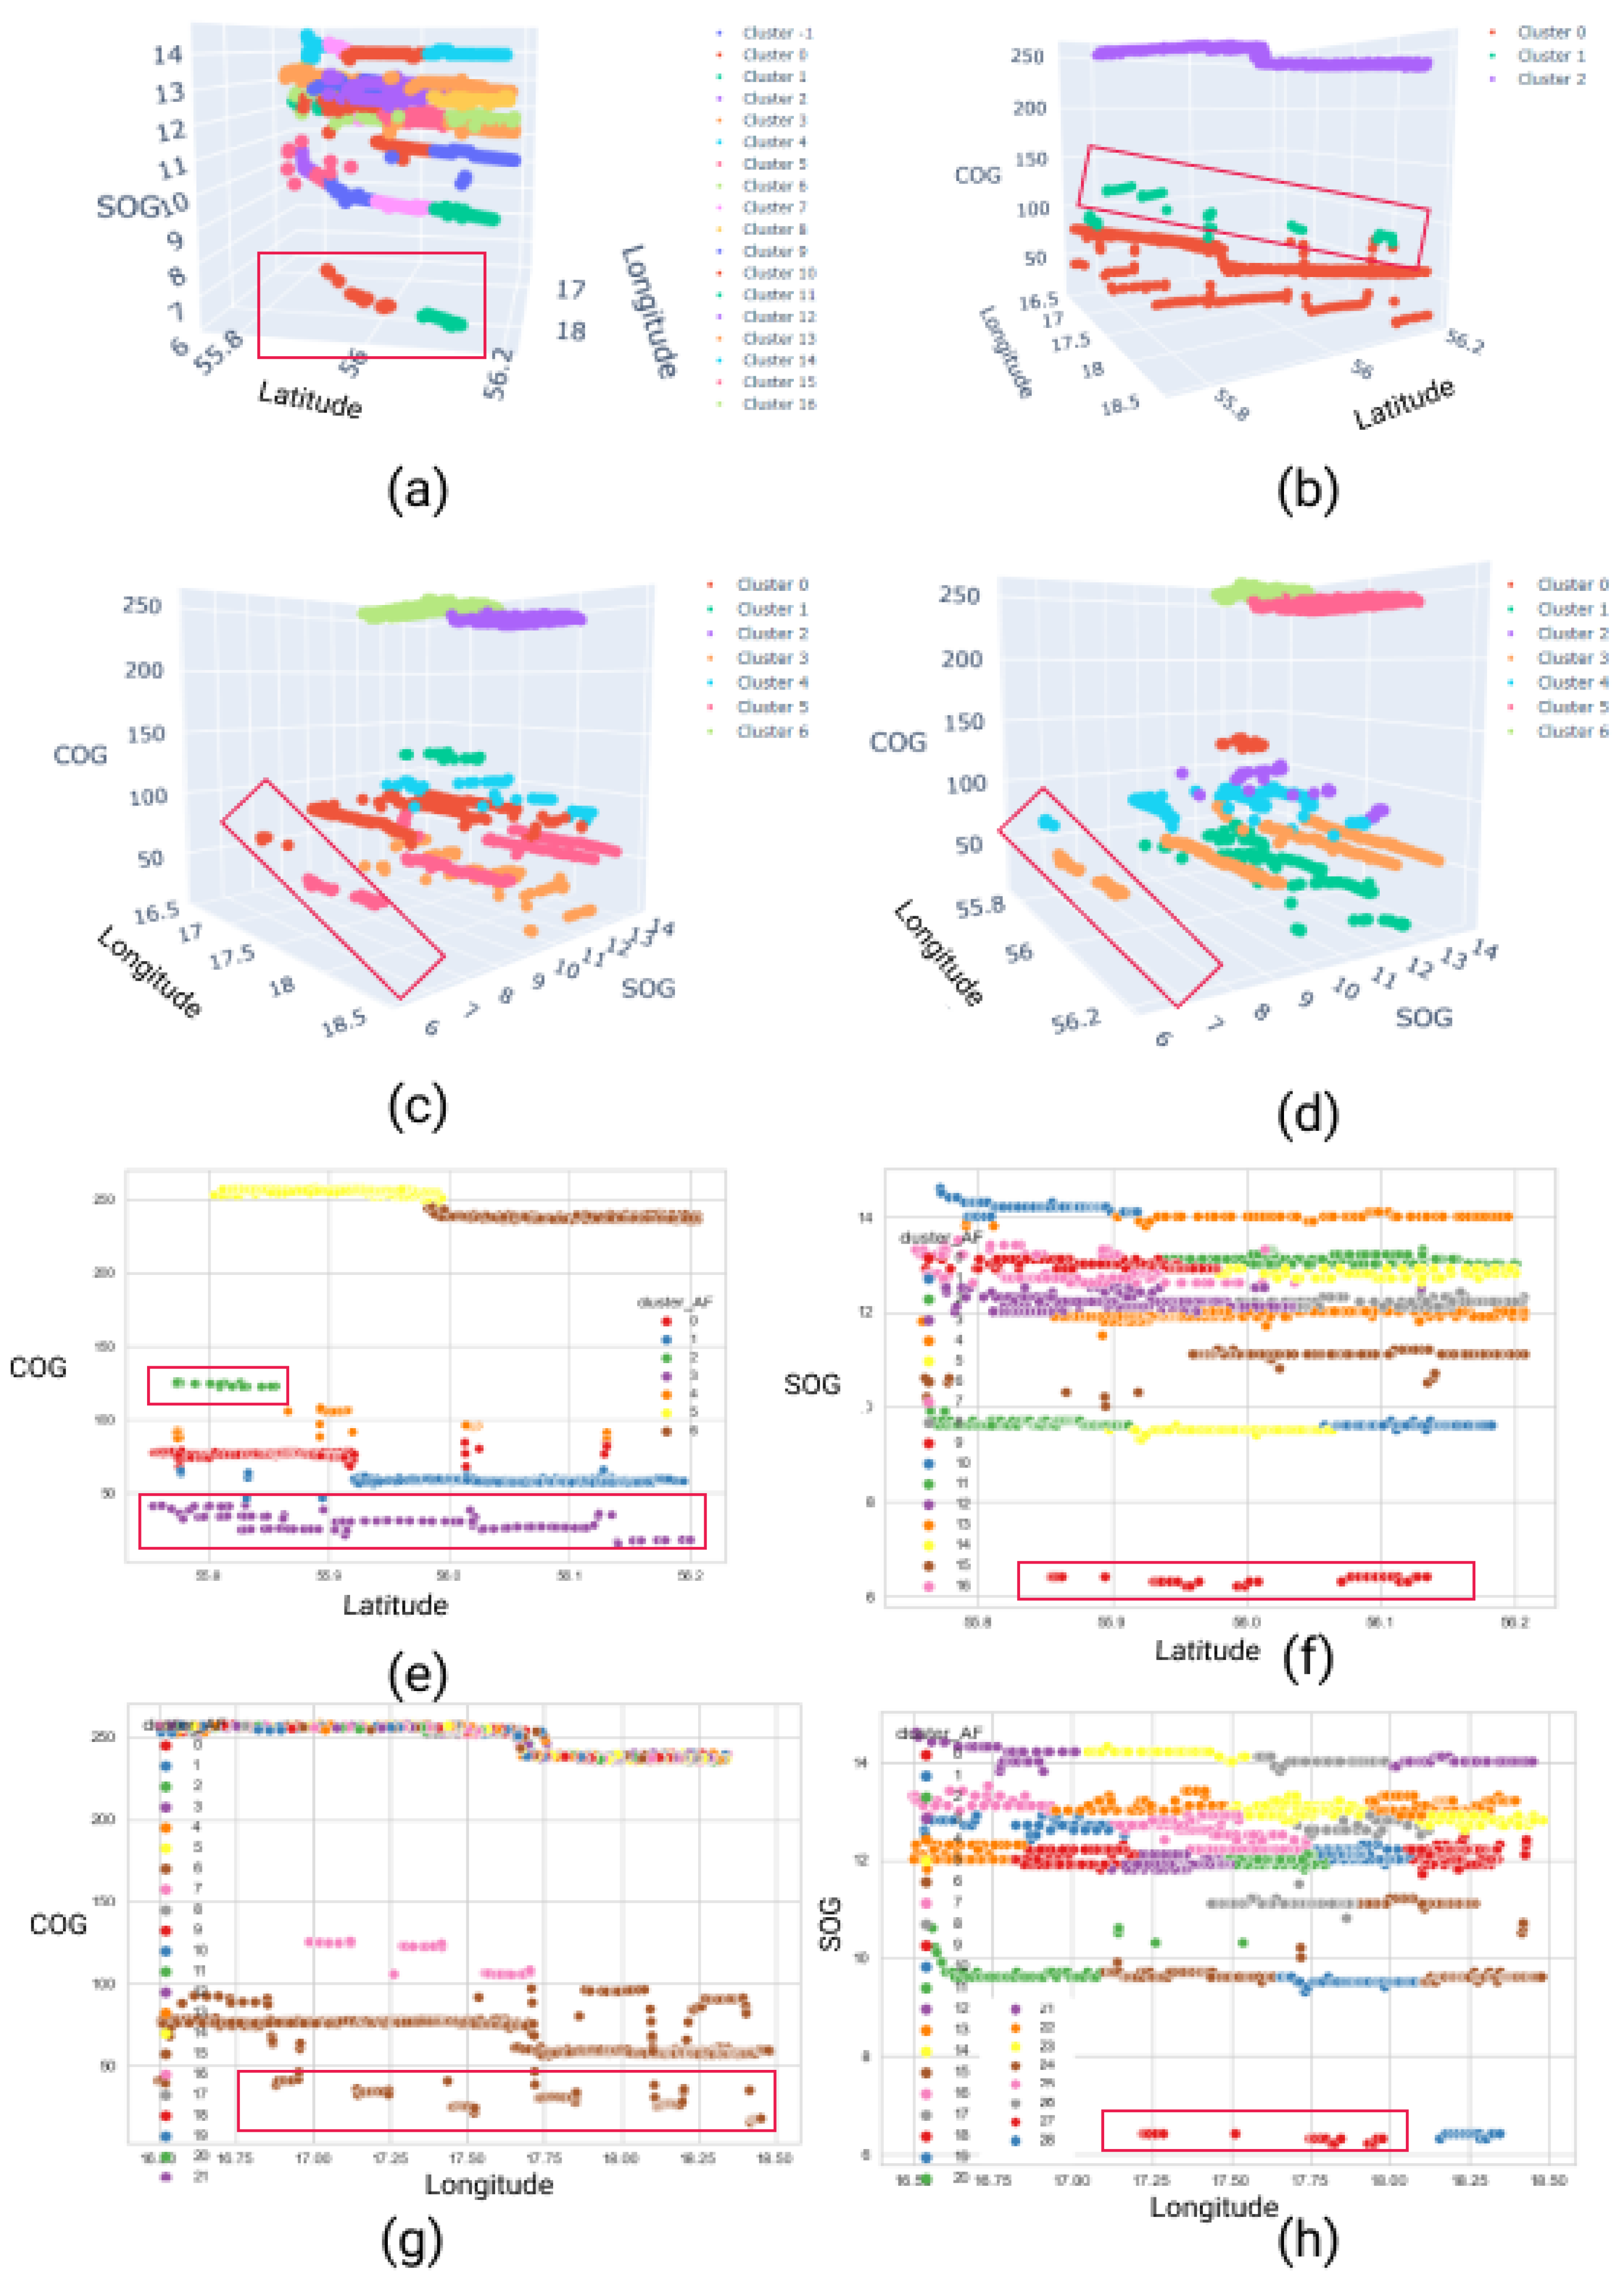
Figure 22, the outcomes of the DBSCAN clustering technique are illustrated, and it can be seen that this clustering technique works better for detecting dark ships than detecting spiral movements as it groups data points into many possible clusters. For instance, the algorithm for three-dimensional inputs such as (
,
,
) returned more than 16 clustering groups, which makes an analysis of the result very difficult.
The results obtained from the AF clustering method, presented in
Figure 23, indicate that this model performs well on three-dimensional input combinations, such as (
,
,
), (
,
,
), and (
,
,
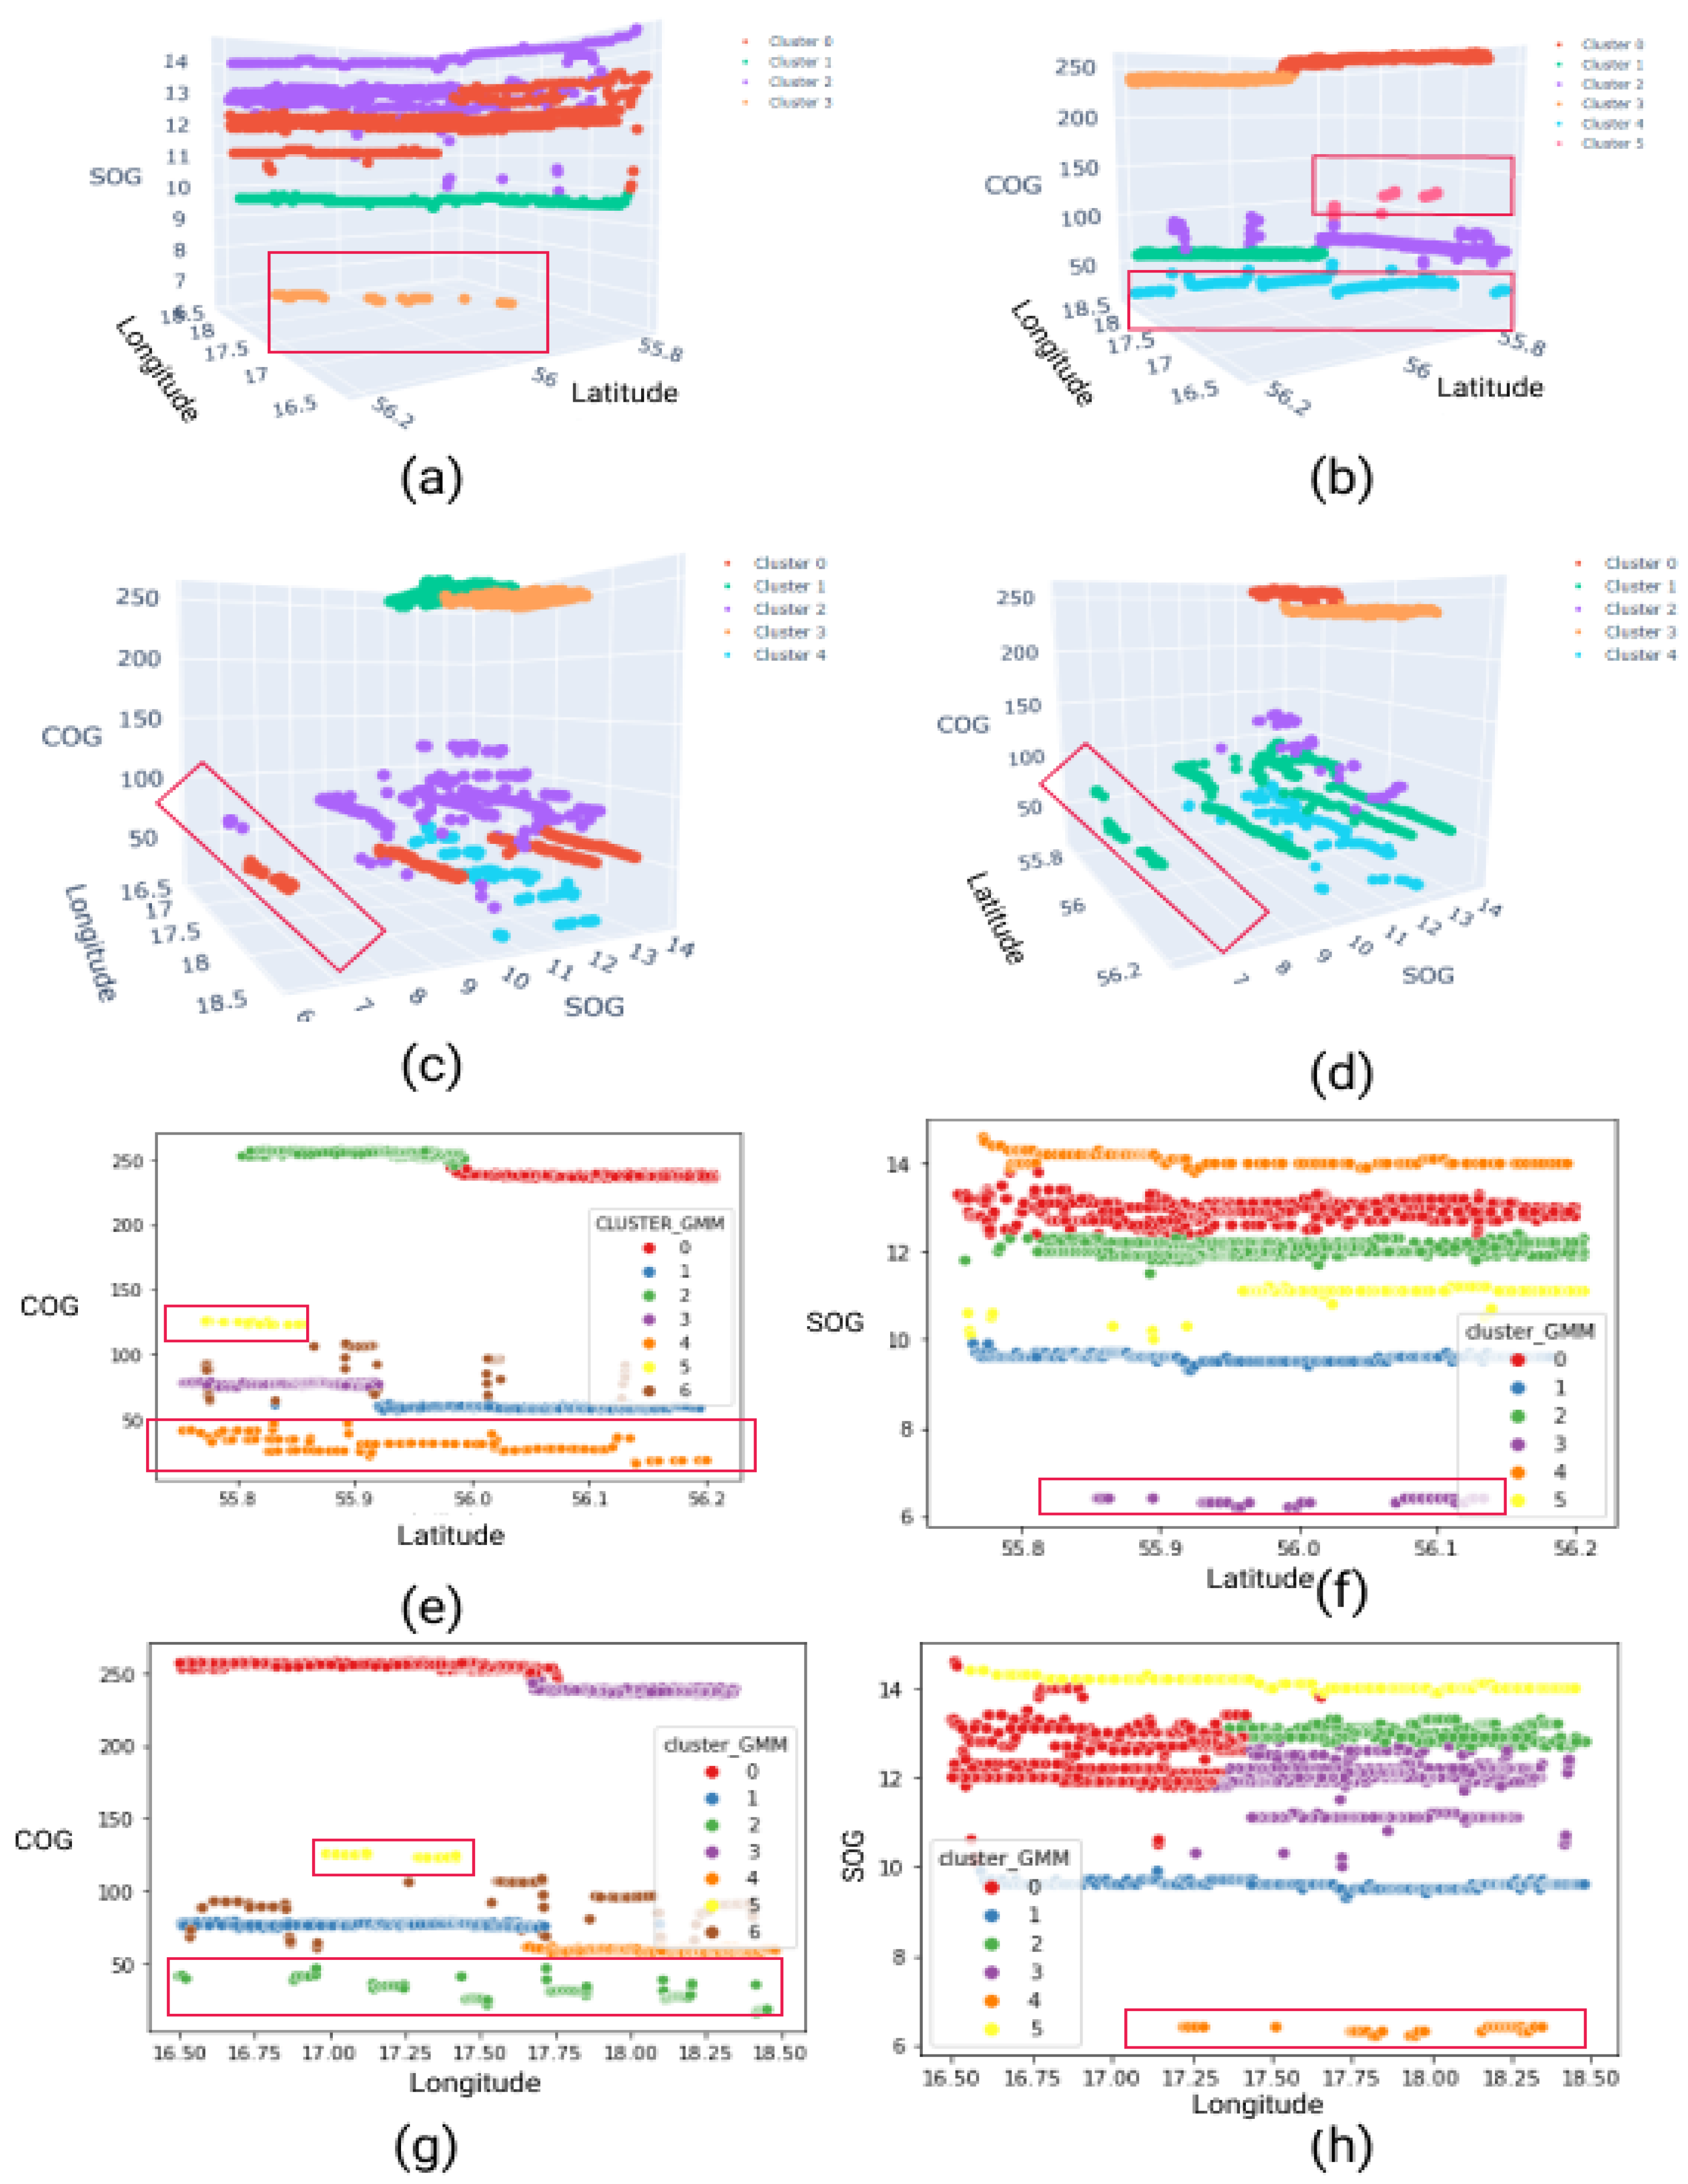
). The outputs clearly identify spiral movements and dark ships in these cases. In contrast, the GMM clustering method delivers good results on both two-dimensional and three-dimensional input combinations. The dark ship is clearly detected in
Figure 24e, and spiral movement is evident in
Figure 23b.
In this study, the performance of clustering methods was evaluated by using the silhouette coefficient scores. This is one of the most common interval evaluation metrics for clustering algorithms. The silhouette coefficient calculates the mean intra-cluster distance, which represents similarities between clusters, and the mean nearest-cluster distance, which represents differences. In
Figure 25, we demonstrate each cluster method’s silhouette value in order to compare all clustering algorithms used in our studies and address our research question, which was about which clustering methods can detect dark ships and spiral movement efficiently. Furthermore, we used different color codes to represent different clustering algorithms in order to better understand them.
As illustrated in
Figure 25, clustering algorithms exhibit a superior performance when applied to three-dimensional inputs, namely (Latitude, Longitude, COG), as well as the input combinations of (Latitude, COG), (Longitude, COG), and (Latitude, SOG). Specifically, K-means clustering demonstrates the best performance among the other clustering techniques, with an average silhouette coefficient value of 0.755. Despite the slight differences observed in the results among the clustering techniques in
Figure 25, which can be attributed to the various methods employed for finding the optimal number of clustering input parameters (AIC and BIC for GMM, and silhouette, gap statistic, and elbow for KNN), as well as the proposed algorithm (for DBSCAN and AF), all of the clustering algorithms show the potential to be utilized for detecting vessels’ abnormal behavior. Therefore, by employing these techniques, the misunderstanding regarding the efficiency of clustering algorithms can be resolved.
In order to visualize these abnormal behaviors on the map, we first added the clustering labels to the original data. Next, we filtered them based on clustering numbers. Finally, we illustrated them on the map. For instance, cluster number 0 is far from other ships’ speeds in
Figure 21a, and is abnormal. All vessels in this area have speeds between 10–14 knots, but this ship sailed with lower speeds than other ships (approximately 6). Furthermore, the speed of the vessel is not reported consistently. Another abnormality that is related to spiral vessel movement can be found in
Figure 21h (cluster number 4 and 5) as COG features in those clusters are changed anomalies based on the longitude values. Finally, two abnormal behaviors are visualized in
Figure 26.
Since it is important to report the time at which illegal activities take place for further investigation, we also found and extracted the time when the ship did not send any AIS messages, and
Table 5 shows the times and duration when the tug vessel avoided sending AIS messages. Furthermore, the table presented “stop time” and “start time” information.
9. Conclusions
Using ships to transport vital materials and goods is becoming more and more common among countries in the world. Because of this, maritime agents have faced a huge amount of information and traffic in the sea areas. Therefore, surveying the marine environments (seas and oceans) and enhancing the safety level are very crucial tasks for every government. On the other hand, sea monitoring systems are able to increase the level of awareness and help maritime agents to achieve a better understanding of conditions. One of the potential threats to the security of seas is abnormal vessel behaviors, and detecting these illegal actions is very necessary. Currently, applying unsupervised machine learning algorithms, especially clustering techniques, has received much attention in developing vessel abnormal behavior detection systems as they do not require labelled data. Therefore, establishing a machine-learning-based system process is cost-effective.
In this paper, we comprehensively investigated the performances of four popular clustering algorithms—K-means, DBSCAN, AF, and the GMM—in order to detect two dangerous abnormal behavior among vessels: dark ships and spiral vessel movements. Furthermore, we collected a reliable three-month AIS dataset that contains both static and dynamic features of vessels for the whole Baltic Sea in order to evaluate these clustering methods. K-means clustering achieved the best performance, with an average silhouette coefficient value of 0.755. While some variations in results were observed among the clustering techniques due to the diverse methods used for determining the optimal number of clustering input parameters, as well as the proposed algorithm for DBSCAN and AF, all of the clustering algorithms demonstrated potential for detecting abnormal vessel behavior. Employing these techniques can therefore help to address the perceived inefficiency of clustering algorithms.
Unlike the previous works in this area, we tried to consider and study both two-dimensional and three-dimensional inputs to cover all gaps and find every abnormality that happened on the dataset. Furthermore, it can be the most time-saving and economical way to detect dark ships as it does not require any SAR images. The last distinguishing feature of our paper that makes it different from other previous studies is that we proposed an algorithm and introduced statistical methods that can help machine learning scientists to find the optimal input parameters and number of clusters.
This paper also has some limitations that require acknowledgement. Firstly, the study only considered two specific abnormal vessel behaviors dark ships and spiral vessel movements—and did not investigate other potential abnormal behaviors. Therefore, the model may not be applicable to other types of vessel abnormality detection. Secondly, the proposed clustering algorithm for determining the optimal number of clusters may not be suitable for all datasets, as different datasets may require different algorithms to achieve optimal results. Finally, we also believe that the lack of weather conditions and sea state was another limitation of this work, and did not allow us to investigate the impact of environmental factors on the detection of abnormal vessel behaviors.
To conclude, the findings could be applied in a marine monitoring system to improve maritime environment security and safety, which is a prerequisite for the port’s steady and sustained development. In the future, we plan to propose a maritime traffic prediction system that is able to predict future vessel movements and vessel destinations. Moreover, we intend to employ the clustering model and knowledge obtained from this study to extract the abnormal behaviors and data points from the dataset of future studies. We believe that our vessel’s abnormal behavior detection model should increase the accuracy and efficiency of the upcoming maritime traffic prediction system. It is also worth mentioning that it is also necessary to research a maritime system that is capable of demonstrating the generated information in a user-friendly and attractive environment for marine industries in the future.

 ,
, 


