Article

Deep Learning Method Based on Spectral Characteristic Rein-Forcement for the Extraction of Winter Wheat Planting Area in Complex Agricultural Landscapes

1
School of Resources and Environmental Engineering, Anhui University, Hefei 230601, China
2
Anhui Engineering Research Center for Geographical Information Intelligent Technology, Hefei 230601, China
3
Engineering Center for Geographic Information of Anhui Province, Hefei 230601, China
4
School of Artificial Intelligence, Anhui University, Hefei 230601, China
5
Information Materials and Intelligent Sensing Laboratory of Anhui Province, Hefei 230601, China
6
Institutes of Physical Science and Information Technology, Anhui University, Hefei 230601, China
*
Author to whom correspondence should be addressed.
Remote Sens. 2023, 15(5), 1301; https://doi.org/10.3390/rs15051301
Submission received: 11 January 2023 / Revised: 12 February 2023 / Accepted: 25 February 2023 / Published: 26 February 2023
(This article belongs to the Section Remote Sensing in Agriculture and Vegetation)

Abstract

:
Winter wheat is one of the most important food crops in the world. Remote sensing technology can be used to obtain the spatial distribution and planting area of winter wheat in a timely and accurate manner, which is of great significance for agricultural management. Influenced by the growth conditions of winter wheat, the planting structures of the northern and southern regions differ significantly. Therefore, in this study, the spectral and phenological characteristics of winter wheat were analyzed in detail, and four red-edge vegetation indices (NDVI, NDRE, SRre, and CIred-edge) were included after band analysis to enhance the ability of the characteristics to extract winter wheat. These indices were combined with a deep convolutional neural network (CNN) model to achieve intelligent extraction of the winter wheat planting area in a countable number of complex agricultural landscapes. Using this method, GF-6 WFV and Sentinel-2A remote sensing data were used to obtain full coverage of the region to evaluate the geographical environment differences. This spectral characteristic enhancement method combined with a CNN could extract the winter wheat data well for both data sources, with average overall accuracies of 94.01 and 93.03%, respectively. This study proposes a method for fast and accurate extraction of winter wheat in complex agricultural landscapes that can provide decision support for national and local intelligent agricultural construction. Thus, our study has important application value and practical significance.

1. Introduction

Wheat is a grain grown worldwide and plays a vital role in the world trade market, as it is one of the most important grains of the 21st century [1]. China, as the world’s largest consumer of wheat [2], accounts for one-fifth of the total planting area of food crops and 11.3% of the world’s total wheat planting area [3], especially winter wheat, which dominates the agricultural products in China [4]. Therefore, a timely and accurate understanding of the acreage of winter wheat and its distribution is essential for planting structure adjustment and the formulation of appropriate grain trading strategies.
Remote sensing data can provide accurate and timely information on crop phenology and development on a regional to global scale, and is considered as one of the most accurate data sources for monitoring crop growth conditions and area estimation [5,6]. Spectral characteristics are the most critical and direct information of these images [7]. Remote sensing technology has the advantages of covering a wide area, having a long revisit cycle, having strong presentability, and having many access channels, which can cover all cycle conditions of crop growth and help to extract crop information of various scales quickly and accurately. Optical remote sensing data not only reflect the spectral characteristics of crops, but can also provide images at different resolutions [8]. They can be used to identify large areas of agricultural land [9] and extract crop-specific growing areas [10], such as wheat [11] and corn [12]. At present, when large-scale (e.g., provincial or national) crop mapping is carried out by remote sensing technology, its spectral characteristics in time and space are difficult to reconcile due to the return period of satellite sensors and the imaging mechanism; the higher the spatial resolution of the image, the longer the return period, and the selection of the image often limits the classification accuracy [13]. For example, Qiu et al. [14] extracted winter wheat planting area information by MODIS data and achieved an overall accuracy of 88.86% when evaluated with Landsat images. Dong et al. [15] based winter wheat mapping on Sentinel 2A/B data from the Yellow and Huaihe Plain of China and achieved an overall classification accuracy of 89.98% with a kappa coefficient of 0.7978. The large-scale range of the remote sensing identification of winter wheat is influenced by regional environmental-climatic differences, differences in winter wheat phenological changes, and various agricultural landscape profile factors such as farm management level and soil conditions. Meanwhile, in the same period, other crops with similar phenological characteristics and growth environments as winter wheat show similar common characteristics in remote sensing images. The selection of key phenological periods is vital for the effective differentiation between winter wheat and other crops. Within this period, the spectral characteristics presented by different feature types have strong variability, and obtaining remote sensing data to meet research requirements greatly affects the fine extraction of crops. Under this constraint, it is particularly important to acquire high-quality remote sensing images that can fully cover the study area during critical periods [16]. The red edge is the region where the spectral reflectance of green vegetation rises rapidly within a certain wavelength range and is closely related to the pigmentation status of the crop [17]. Numerous studies have shown that the use of the red-edge band to calculate spectral indices enhances the differentiability and the difference in spectral characteristics among different feature types, enriches the feature space for crop classification, and is vital for improving the accuracy of the remote sensing classification of crops [18,19,20].
However, the spectral properties of the target features vary significantly owing to different sensors, and the same method cannot be used to solve the spectral heterogeneity. For crop area extraction, some researchers have used support vector machines (SVMs) [21], random forests [22], and decision trees [23] in the field of shallow learning, but their performances depend on the accuracy of the input data based on human experience and cannot adapt to increasing levels of complexity. Due to the uncertainty of mixed pixels or heterogeneous landscape areas in different remote sensing data, it is difficult for traditional algorithms to achieve good performance in large-scale crop classification. The emergence of deep learning has provided new ideas for crop classification extraction, such as fully connected neural networks (FCNs) [24] and back propagation (BP) neural networks (BPNNs). Such networks can accept scenarios with smaller scales and less data volumes. If evaluating image information with wide coverage and large data volumes, it often leads to a slow or even incomplete training process; this problem can be effectively resolved by convolutional neural networks (CNNs). CNNs, a branch of deep learning, have been extensively developed for image classification [25] and agricultural information extraction [26,27]. For better and faster processing of massive amounts of data, a CNN comprises of multiple nonlinear mapping layers that can obtain higher dimensional features by mining the spatial correlation between target image elements and combining them for analysis [28,29]; this improves the classification accuracy [30] and has obvious advantages in 2D image processing [31]. CNNs have great advantages in extracting the correlation between pixels, and the spectral features can satisfactorily express the spatial relationship between pixels [32], the features of which are extracted by the convolutional layer. The previously extracted features are then integrated by a fully connected layer, which has strong learning and fault tolerance abilities, thereby making the CNN effective for crop classification extraction.
In this study, we conducted a spectral characteristic analysis on two selected remote sensing datasets (GF-6 WFV/16 m and Sentinel-2A/10 m), combined with a CNN for classification extraction and planting area calculation of winter wheat by enhancing the capability of spectral features for crop extraction. For regions with complex agricultural landscapes, the variability of the winter wheat growth state often results in different spectral information in the images. Therefore, this study simultaneously used field research to enhance the accuracy of visual interpretation of crops. The results show that this method of combining a CNN by reinforcing the spectral characteristics of target types is effective for the accurate extraction of winter wheat over a large area.

2. Study Area and Dataset

2.1. Study Area

The study area was located in Anhui Province in Southeast China (114°54′–119°37′E, 29°41′–34°38′N). The land area of the province is about 140,100 km2, of which 42.04% comprises arable land. The topography of the province is complex; it is located in the mid-latitude zone, a warm temperate and subtropical transition area. The northern and southern regions of the Huaihe River have a warm temperate semi-humid monsoon climate and a subtropical humid monsoon climate, respectively [33] (Figure 1). Anhui Province is the main grain-producing province in China, and the province has rich and diverse land surfaces and crop types. Owing to the handover of the monsoon, the precipitation undergoes evident seasonal changes, and the climate difference between the north and south is obvious, leading to huge changes in the planting structure. The arable land north of the Huaihe River accounts for about one-half of the province’s arable land area and mainly cultivates winter wheat. The arable land south of the Huaihe River mainly comprises paddy fields, and the main food crops are rice, winter wheat, and rape.

2.2. Phenology Calendar of Winter Wheat and Other Crops in the Study Area

Using multiple optical remote sensing datasets to distinguish crop types, the phenological information is considered an important reference factor [34]. The northern part of the study area has a single cropping structure, with winter wheat as the main crop and a large distribution of farmland; the southern part has diverse cropping patterns, different irrigation periods, and small patches including rice, winter wheat, rape, etc., and is a typical area of agricultural landscape fragmentation in southern China. Therefore, in this complex agricultural structure, the winter wheat plants span a large north-south area and show high variability, which makes extraction difficult.
The phenological periods of the two crops in the study area are presented in Table 1 and shown in Figure 2. The colors represent the average appearance time of the crop types in each stage of the growth cycle, and the increase in transparency at both ends indicates differences between the plots due to different farmer management, climate, and other reasons. The crops were sown in October of the previous year and harvested in June of the following year, with no significant differences in the image characteristics between the two for the majority of the period. After March of the second year, rape started to flower and appeared yellow, whereas winter wheat appeared green as it was mainly in the nodulation stage. The spectral characteristics of the two were different and easy to distinguish. At the late growth stage of both crops, rapeseed flowers wither and take on the state of rapeseed, and then were harvested in mid-to-late May. At the mature stage of winter wheat, other vegetation grows vigorously and various spring sowing crops are in the growth stage, so it is easy to confuse the extraction of winter wheat. Therefore, mid- to late March is the best time to distinguish winter wheat from rape.

2.3. Satellite Remote Sensing Data and Pre-Processing

Considering the spectral characteristics of crops such as winter wheat and the spatial resolution of the sensors, GF-6 WFV and Sentinel-2A were chosen as the most suitable remote sensing data. This study collected the GF-6 WFV and Sentinel-2A datasets with low cloudiness under clear sky conditions in the study area in March 2020.
This study used the GF-6 data from multispectral medium-resolution wide field of view (WFV) cameras, and the WFV cameras offer significant advantages in large-scale environmental monitoring [35]. In order to meet the application requirements of remote sensing crop classification, the GF-6 WFV data were pre-processed using ENVI5.3 software, and the images were then cropped and stitched according to the vector boundaries of the study area to obtain the required GF-6 WFV data. The satellite images (Level-1C) used in this study were downloaded from the European Space Agency (ESA) Sentinel Science Data Center. Sentinel-2A is a high-resolution multispectral imaging satellite that contains visible, near-infrared, and short-wave infrared data.
Table 2 presents the main information parameters of GF-6 WFV and Sentinel-2A data.

2.4. Field Sampling Data

Prior to the image classification and accuracy assessment, a field survey of crops including winter wheat was conducted on 18 April 2021. We obtained accurate identification classification and calculated the crop plot extent area for error analysis using the data obtained from the calculation of remote sensing images.
The field survey was assisted by high-resolution GF-2 data for analysis, and UAV technology (Figure 3) was used to confirm the crop types in the survey area. High-resolution images considerably helped in the classification and extraction of various types of feature information. The survey area spanned 13.50 km2.
To increase the reliability of the study results, the crop planting area was also measured during the field identification of crops. The RTK (Real-time kinematic) was manually carried out to verify and measure the typical crop growing area, and the error analysis was performed between the measured results and the area data calculated from the remote sensing images. Table 3 shows the error comparison analysis between the actual measured area in the field and the remotely sensed image area (numbers 1 and 2 in Figure 4 are rape planting sites, and 3 and 4 are winter wheat planting sites). As can be seen from the table, the area error is within a reasonable range, which indicates that the method used to count the acreage of crops in this study is relatively reliable.

3. Methodology

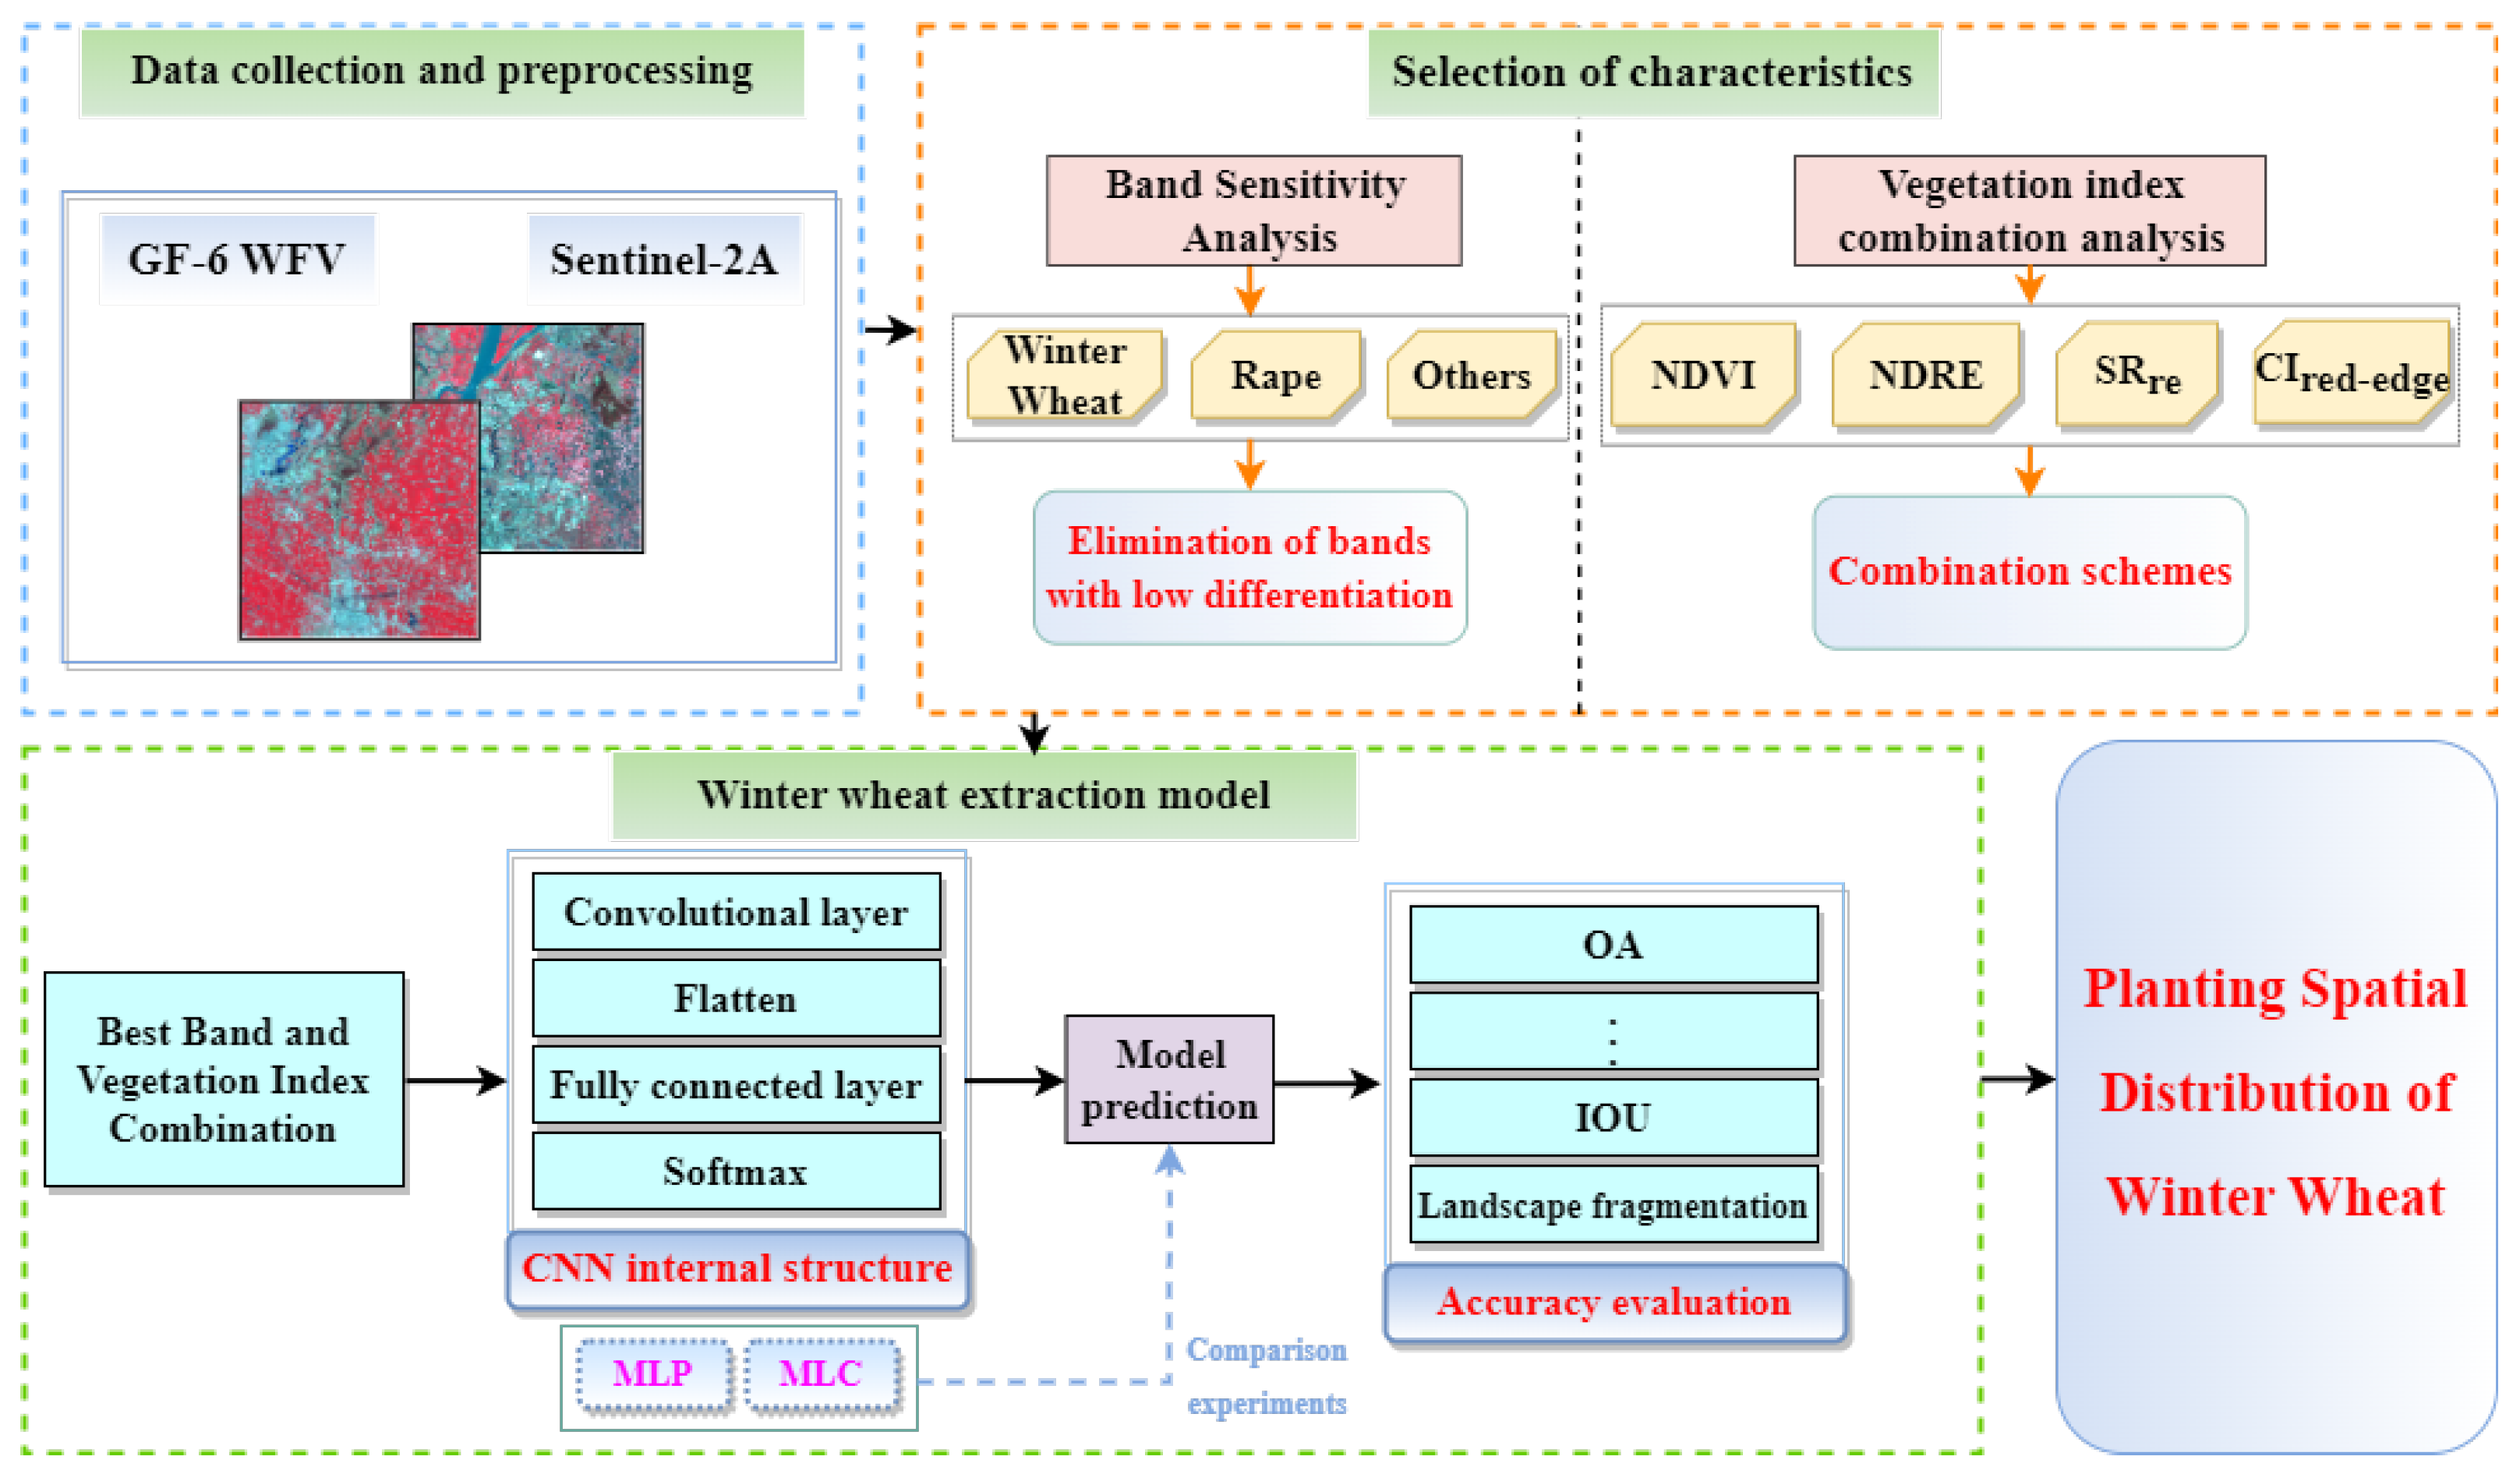
In this study, we applied CNNs—a deep learning methodology showing outstanding performance in image classification tasks—to extract spectral features by combining the wavelength reflectance and vegetation index information of multispectral remote sensing images. We also used CNNs to identify and classify features such as winter wheat in Anhui Province through the feature contribution of different spectral information. By ranking the feature contribution of different types of spectral information, the optimal set of spectral features is selected to complete the extraction of fine classification of winter wheat. A flowchart of the methods is shown in Figure 5.

3.1. The Creation of a Database and Its Rules

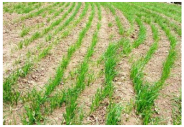
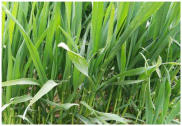
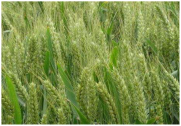
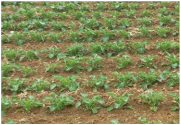
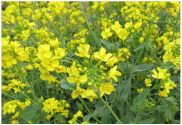
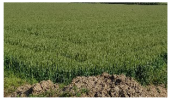
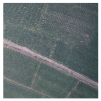
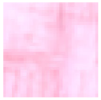
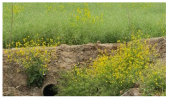
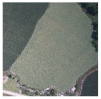
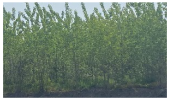
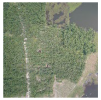
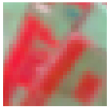
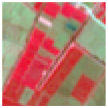
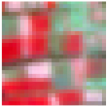
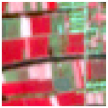
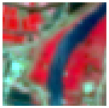
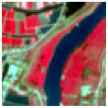
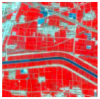
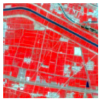
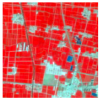
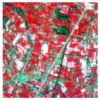
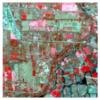
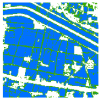
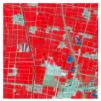
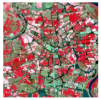
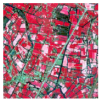
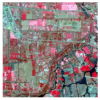
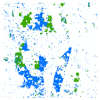
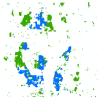
In the study area, fields are usually planted with winter wheat and interspersed with different proportions of other feature types (soil background, straw, and weeds) Other crops such as early rice and corn have not been transplanted during their growth. The unique phenological characteristics of winter wheat provide critical and effective information for its identification in multispectral remote sensing images. This study mainly used the standard false color images to extract the information of winter wheat (“Standard false color” means that the image RGB is displayed using the “NIR band, Red band, and Green band”). Corresponding to standard false color images, winter wheat and rape appeared bright red and pink in the images, respectively, while the other vegetation appeared dark red (
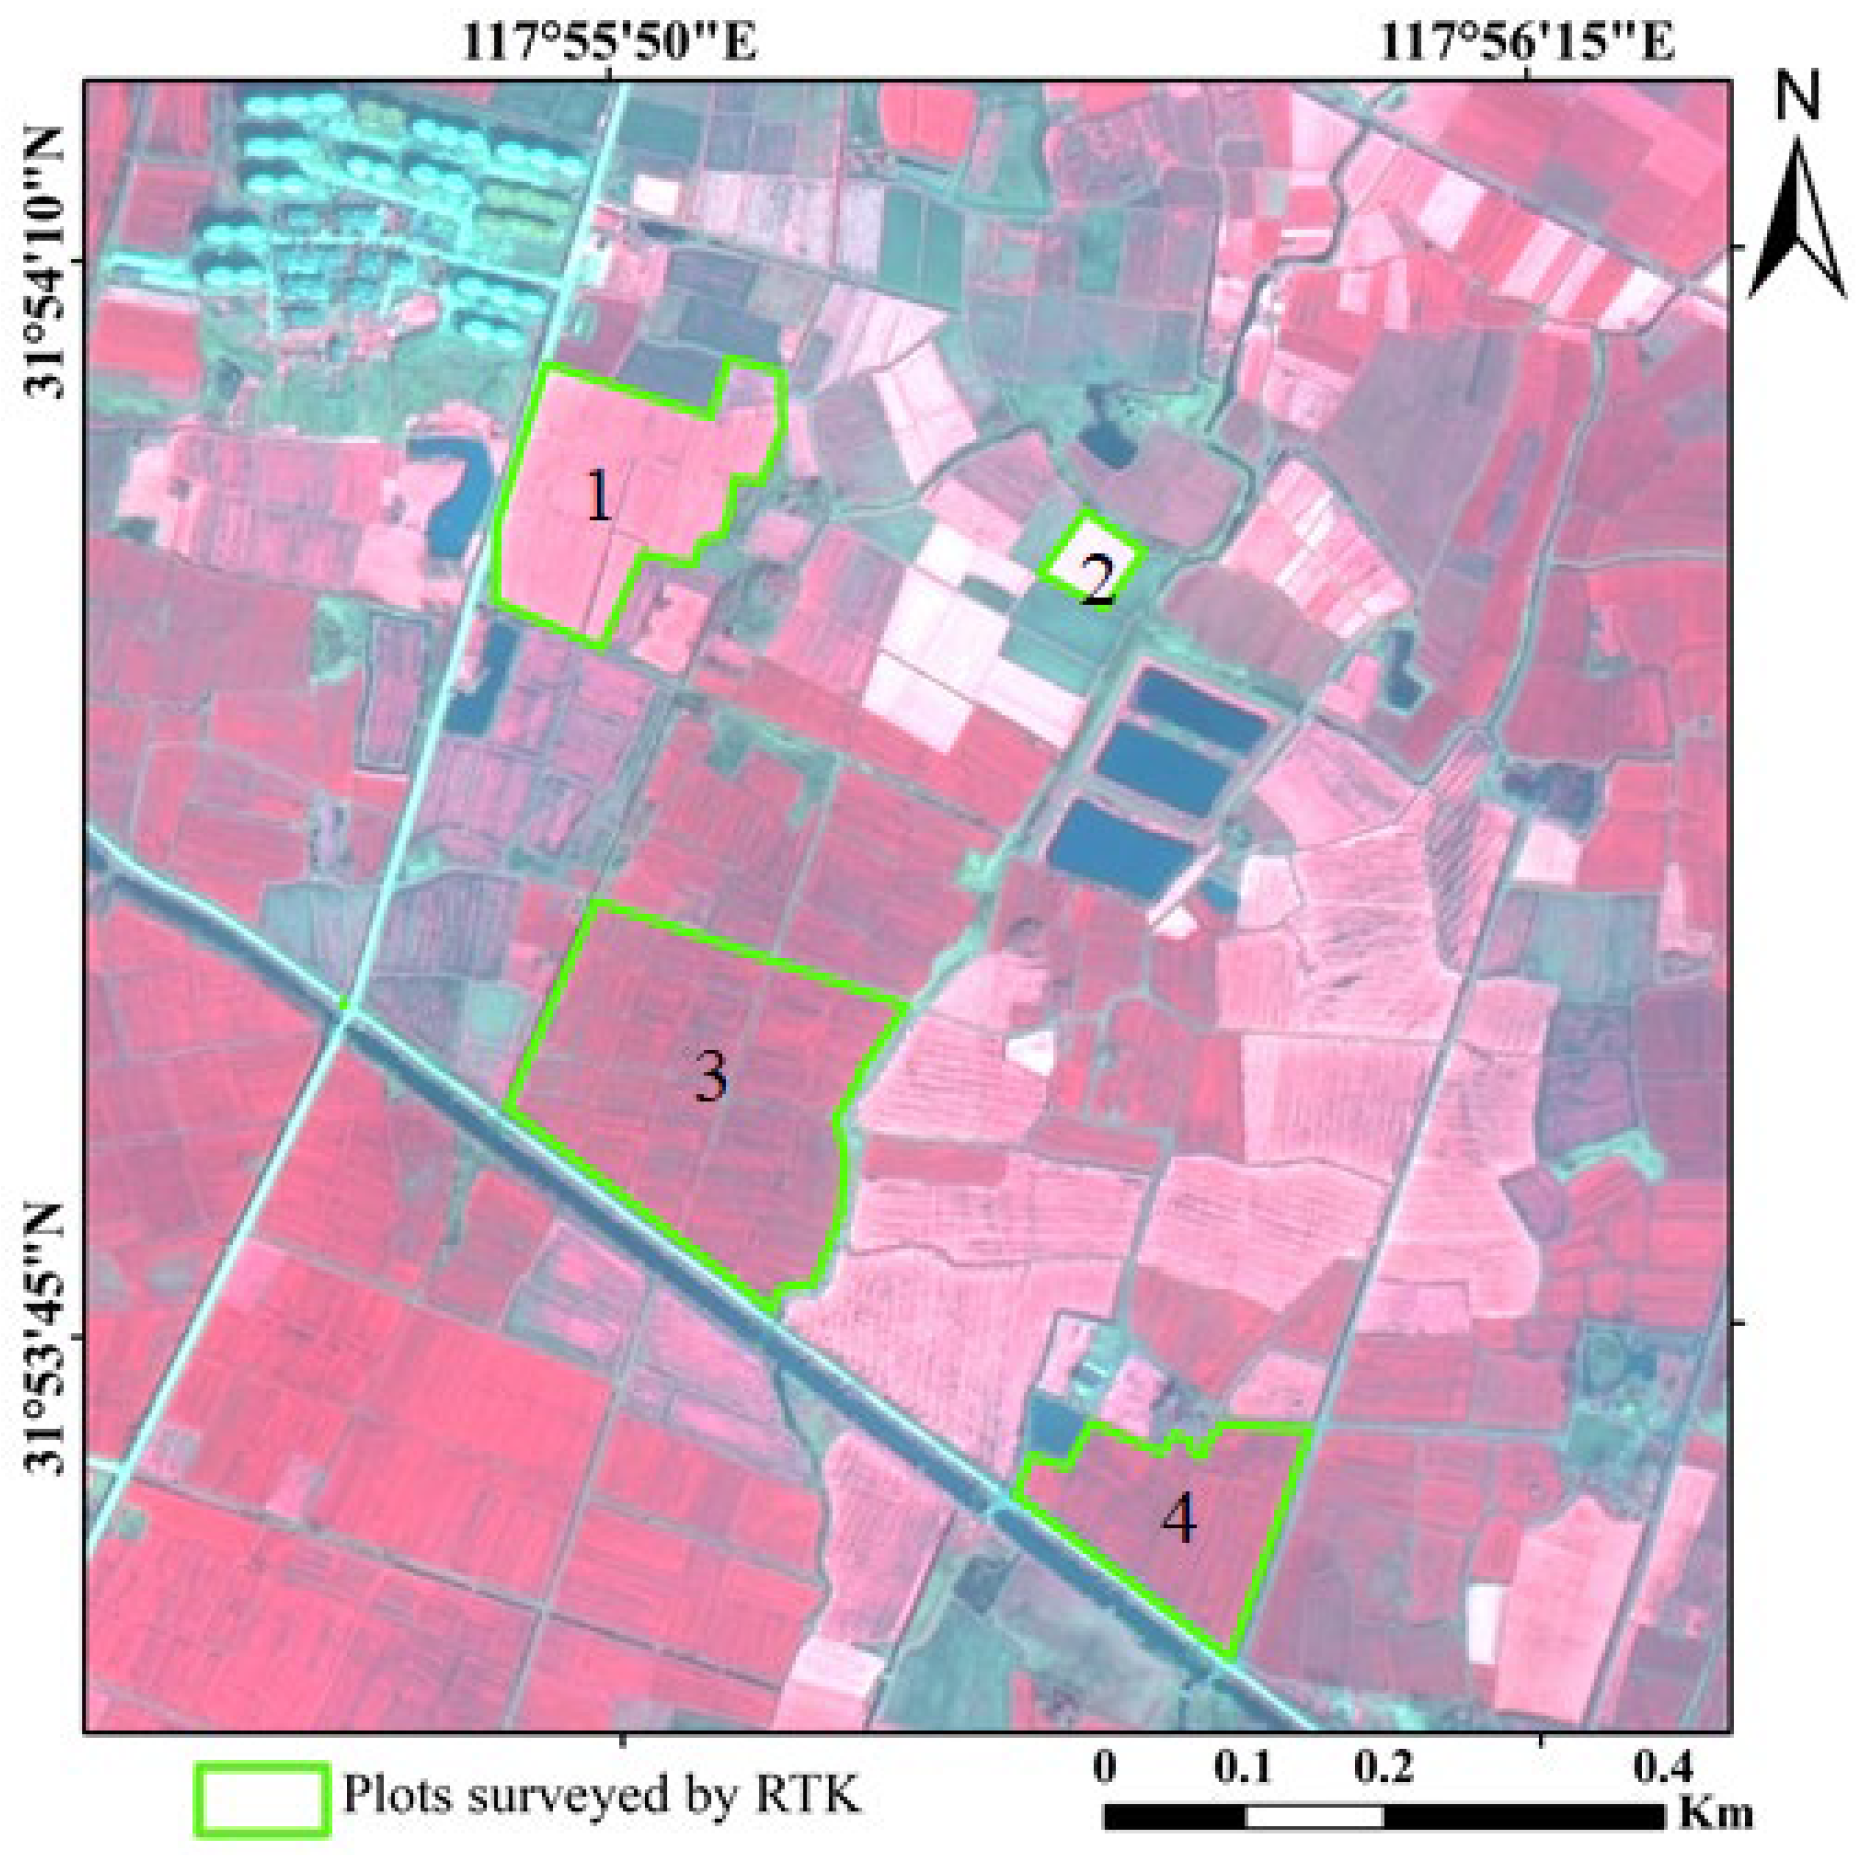
Figure 6). To accurately distinguish various feature types in the images, this study used GF2 images and UAV data for assistance, and manually photographed and recorded various types of plots (Table 4). This was used as the basis for constructing a sample library for winter wheat and other feature categories. The number of samples is presented in Table 5.

3.2. Analysis of Spectral Characteristics

3.2.1. Band Sensitivity Analysis

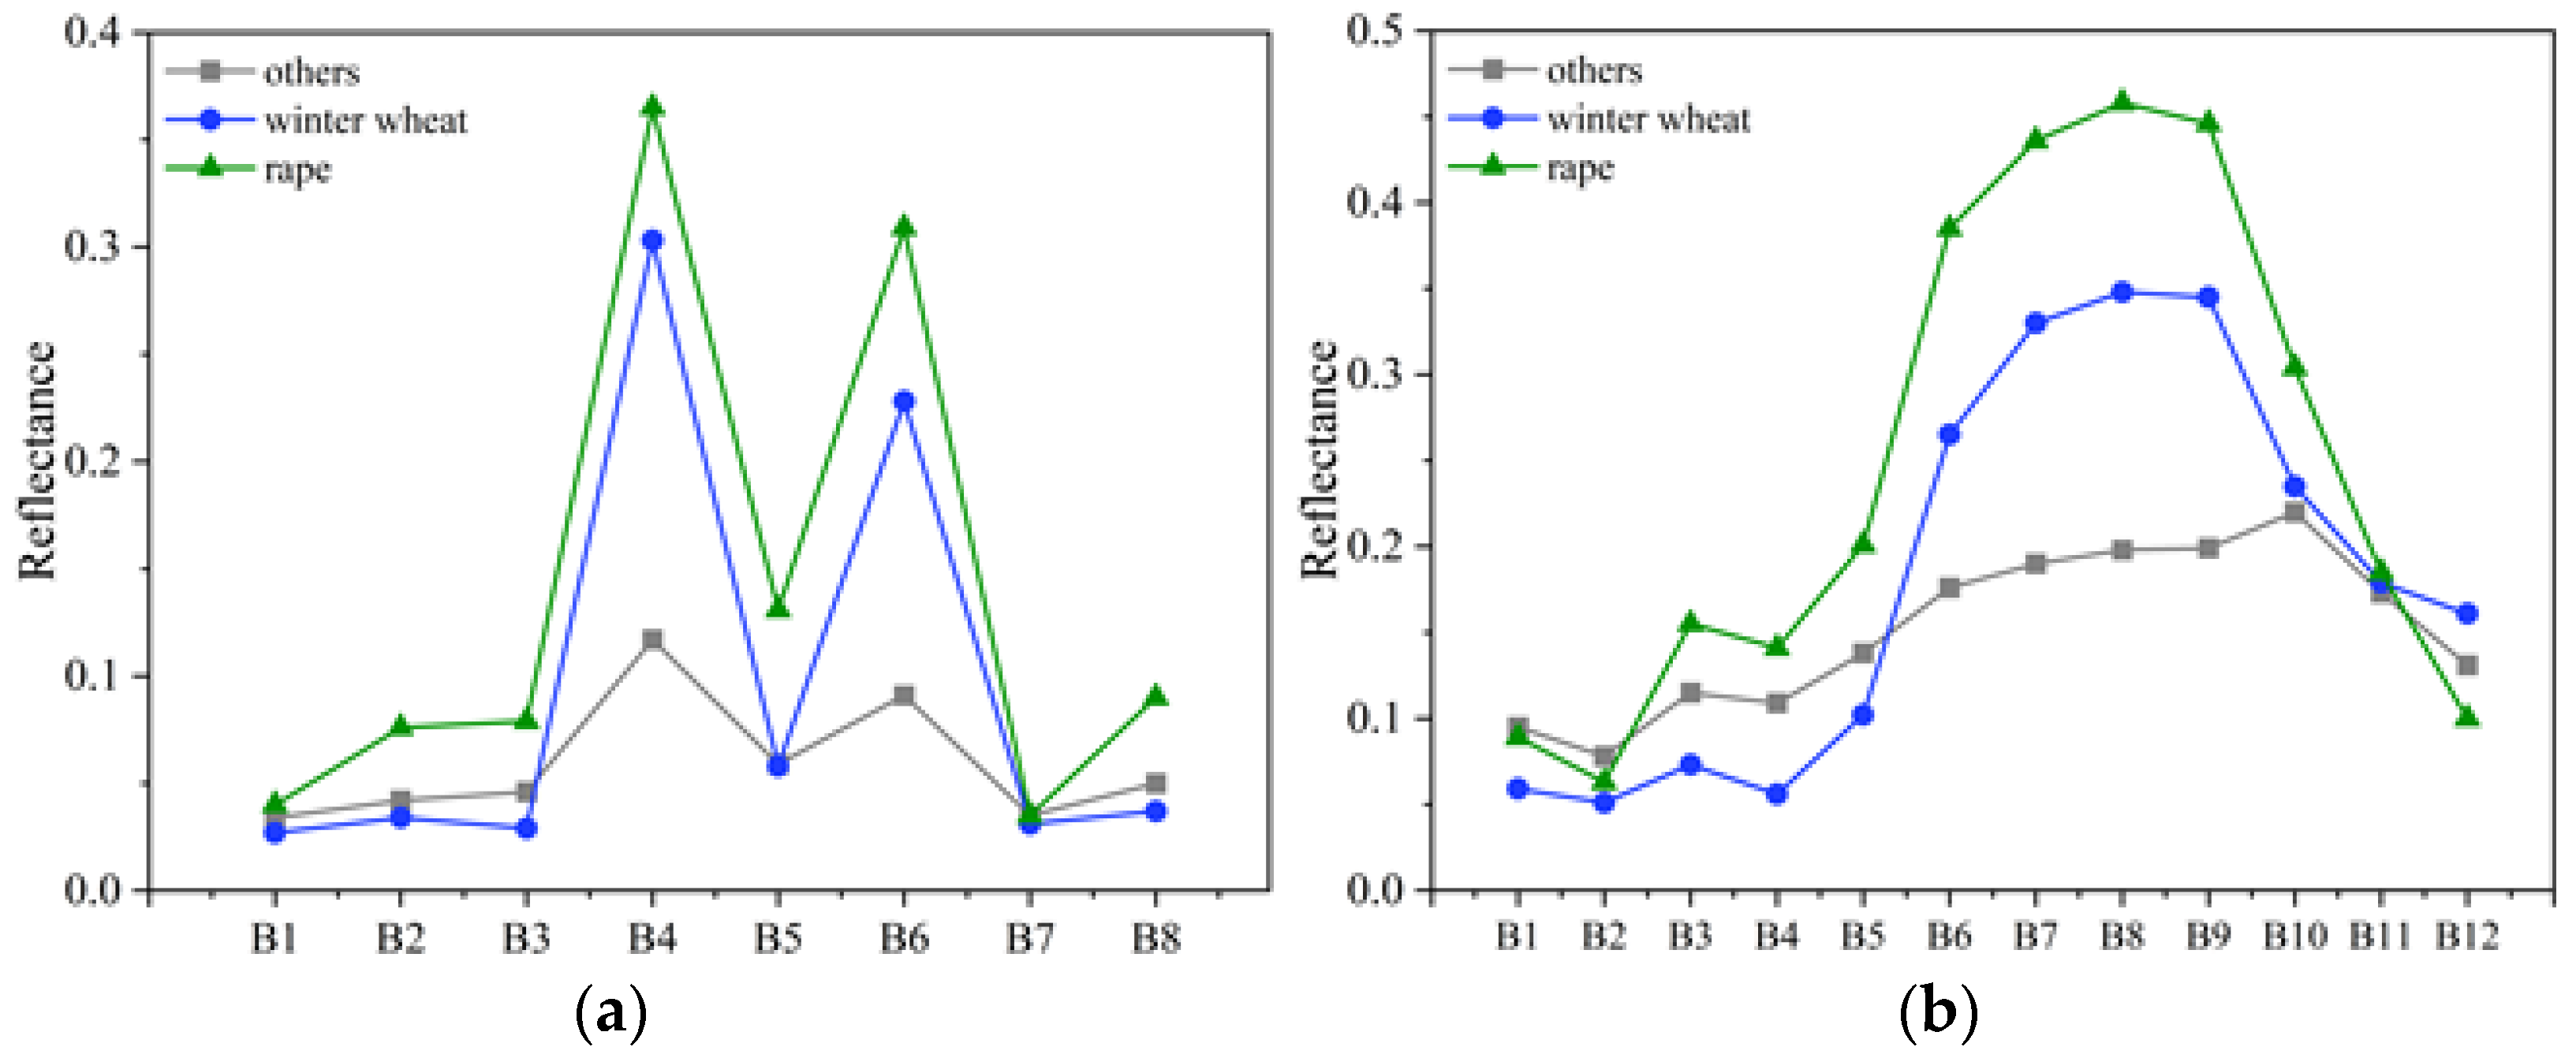
Using the full spectral information provided by the remote sensing data increases the computation time and does not improve the results. To determine the best band combination, this study analyzed the average values of the corresponding image element radiance values for the samples of winter wheat, rape, and other categories (including feature categories such as buildings, water bodies, mountains, and other vegetation) on two datasets (Figure 7). Notably, the spectral trends of the three categories are roughly similar. When the points overlap on the band or are too close to each other, they are considered to not be clearly distinguishable, while those with a large segmentation gap are considered to be clearly distinguishable. Thus, we drew the following conclusions:
(1)
GF-6 WFV data: the trend of the first three bands is relatively flat, with more obvious peaks in bands 4 and 6 and troughs in bands 5 and 6. The difference between the values of the three categories in bands 4 and 6 was obvious and highly differentiated, while the overlap between the points of the three categories in bands 1 and 7 was high; the differentiation between crops and other feature categories was low.
(2)
Sentinel-2A data: winter wheat and rape have a clear elevated trend on bands 6 to 8, presenting a high degree of differentiation from other feature types with relatively flat trends. We could not easily distinguish rape from other features on the band 1, and the reflectance of rape and winter wheat are similar to that on bands 2 and 11.
Figure 7. Analysis of spectral reflectance curves of various classes in (a) GF-6 WFV and (b) Sentinel-2A data.
Remotesensing 15 01301 g007
Therefore, the effective bands of GF-6 WFV capable of distinguishing winter wheat, rape, and other categories are initially filtered as B2, B3, B4, B5, B6, and B8. Similarly, the effective bands of Sentinel-2A are B3, B4, B5, B6, B7, B8, B9, and B12.

3.2.2. Vegetation Index Extraction Based on Sentinel-2A and GF-6 WFV Imagery

The vegetation index was obtained by combining different bands of satellite image data, thus compressing the spectral information into a single channel reflecting the growth status of surface vegetation [36]. The sensitivity of different vegetation indices varies among features, among which NDVI is widely used in crop extraction and monitoring. Considering the unique red-edge band of GF-6 and Sentinel-2A images is an important indicator band to describe vegetation pigmentation and health status [37]. Therefore, in this study, were used three red-edge indices, NDRE, SRre, and CIred-edge, as index features to investigate the potential of extracting information from winter wheat. The formulae for each vegetation index are listed in Table 6.
Figure 8 shows the overall numerical trends of the feature types, such as winter wheat, after adding the vegetation indices. Notably, the values of each index for winter wheat was higher those for the other two categories, among which three categories are most distinguished in the SRre and CIred-edge indices, which could increase the difference between winter wheat and other categories to some extent.

3.3. Winter Wheat Extraction Model Based on the Convolutional Neural Network

Considering the spectral variability between winter wheat and other classes, a CNN, which is often used for classification tasks, was used. The CNN is based on the original multilayer neural network, with the addition of partially connected convolutional and pooling layers, which are more effective feature-learning structures. The local perceptual field operation of CNNs can significantly reduce the computational complexity of the feature extraction process and thus improve computational efficiency. The CNN classifier architecture constructed in this study is illustrated in Figure 9.
The significant spectral characteristic information from the remote sensing images was inputted into the model, and the characteristic information was extracted by the convolutional layer. Each convolution comprises one layer of convolution, one layer of batchnormal, and one layer of activation function. Since convolutions are a linear operation, it is necessary to add nonlinear mapping. We chose the rectified linear unit (ReLU) function as the activation function in the convolution layer as it is an unsaturated nonlinear function with fast convergence and no gradient disappearance problem [42]. Adding a batchnormal slab combined with the ReLU function can speed up the training of the network, achieve efficient computation, and accelerate gradient diffusion for training [43]. The convolutional layer is computed from the convolutional kernel at the previous input layer by sliding the window one by one. Each parameter in the convolutional kernel is called a weight parameter and is connected with the corresponding pixel to obtain the result of the convolutional layer. In this study, a 1 × 1 size convolution kernel is used. The 1 × 1 convolution kernel can be downscaled or upscaled, which is achieved by controlling the number of convolution kernels (channels), this can help reduce the model parameters and also normalize the size of different features; it can also be used for the fusion of features on different channels, which is guaranteed to get certain results. The first layer of convolution may only be able to extract some low-level features such as lines and edges, while a multilayer network can improve this situation by further extracting more tedious features. Therefore, the model in this study was set up with four blocks of convolution, which can iteratively extract more complex features from the low-level features and compute the features, effectively reducing the problem of large computation or numerous parameters that cannot be solved by traditional neural networks.
To utilize the learned features in the winter wheat classification task and successfully map them to the target values, a fully connected (FC) layer is usually added after the convolutional layer. This layer fuses the resulting information, enhances the information representation, and reduces the loss of feature information. The dropout layer was set after each fully connected layer to improve the regression-fitting ability and network training efficiency. By adding the dropout layer, we only needed to randomly sample the parameters of the weight layer with a certain retaining probability, bring the sampled nodes to participate in the update, and use this sub-network as the target network for this update. The advantage of doing this is that, since some nodes are randomly excluded from the work, is that it avoids some features being effective only under fixed combinations, and consciously lets the network learn some general commonalities (instead of some characteristics of some training samples) so as to improve the robustness of the trained model. After the dropout layer, the number of neural nodes is 64, after the second FC layer, the number of neural nodes becomes 32, and then after the dropout layer, the number of neural nodes becomes 16, after which the number of points is gradually reduced to prepare for the final fit. Between the convolutional and FC layers, a “Flatten” layer was set to one-dimensionalize the multidimensional input. The Flatten layer is used to “flatten” the input data, that is, to compress the (height, width, channel) data into a one-dimensional array of length height × width × channel, making the multi-dimensional input one-dimensional. Subsequently, a softmax classifier is added at the end of the CNN model to ensure that the number of neurons was equal to that of categories needed for prediction. Finally, the classification result was output as an image.
In this paper, the network is optimized using an Adam optimizer and the parameters are updated with the initial learning rate set to 0.001. To better train the model, the learning rate is automatically adjusted as the training period increases, which combined with the optimization, speeds up the convergence of the network. In this paper, a multi-class cross-entropy loss function is used as the loss function. The training process has a total of 100 epochs with a batch size of 1024.

3.4. Evaluation Index

To verify the efficiency of the model in identifying winter wheat, the results were quantitatively evaluated. The main evaluation methods include: (1) overall accuracy (OA), the ratio of the number of correctly classified samples to the total number of samples; (2) precision, the ratio of the number of correctly extracted samples to that of all extracted samples; (3) recall, the ratio of the number of correctly extracted samples to that of true samples; and (4) F1, calculated using the precision and recall, and is the summed mean of the powerful precision and recall evaluation indices. We set ξ t p as the number of samples with correctly extracted targets, ξ f p as the number of samples with incorrectly extracted targets, ξ t n as the number of samples with correctly extracted negative targets, and ξ f n as the number of samples with unextracted targets. The equations for each evaluation method are as follows:
OA = ξ t p + ξ t n ξ t p + ξ f p + ξ t n + ξ f n
Precision = ξ t p ξ t p + ξ f p
Recall = ξ t p ξ t p + ξ f n
F 1 = 2 × precision × recall precision + recall
Additionally, another metric, intersection over union (IOU), was used to assess the shape and area of both winter wheat and rape. The IOU is the intersection of the predicted area and ground truth values over the union of the categories. It is calculated as follows:
IOU = ξ t p ξ f n + ξ t p + ξ f p

3.5. Landscape Fragmentation Analysis

For further precision analysis of the study results, the concept of landscape fragmentation was introduced to analyze the validation area. The landscape fragmentation degree characterizes the fragmentation degree of the landscape [44]. The larger this value, the higher the complexity of the landscape spatial structure. Its calculation formula is as follows:
C i = L i / A i
where C i is the fragmentation of i, L i is the number of patches in landscape i, and A i is the total area of landscape i.

4. Results and Discussion

4.1. Evaluation and Analysis of Winter Wheat Planting Area

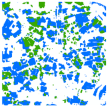
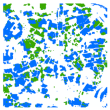
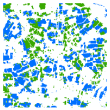
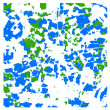
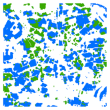
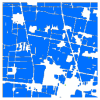
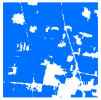
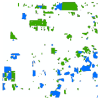
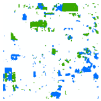
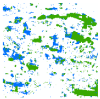
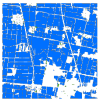
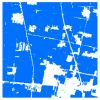
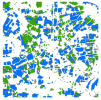
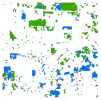
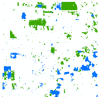
Figure 10 shows the extraction results of this method for winter wheat and rape in the study area and their spatial distributions. Table 7 presents the results of the remote sensing monitoring of winter wheat in each prefecture of the study area and their comparison with the statistical results.
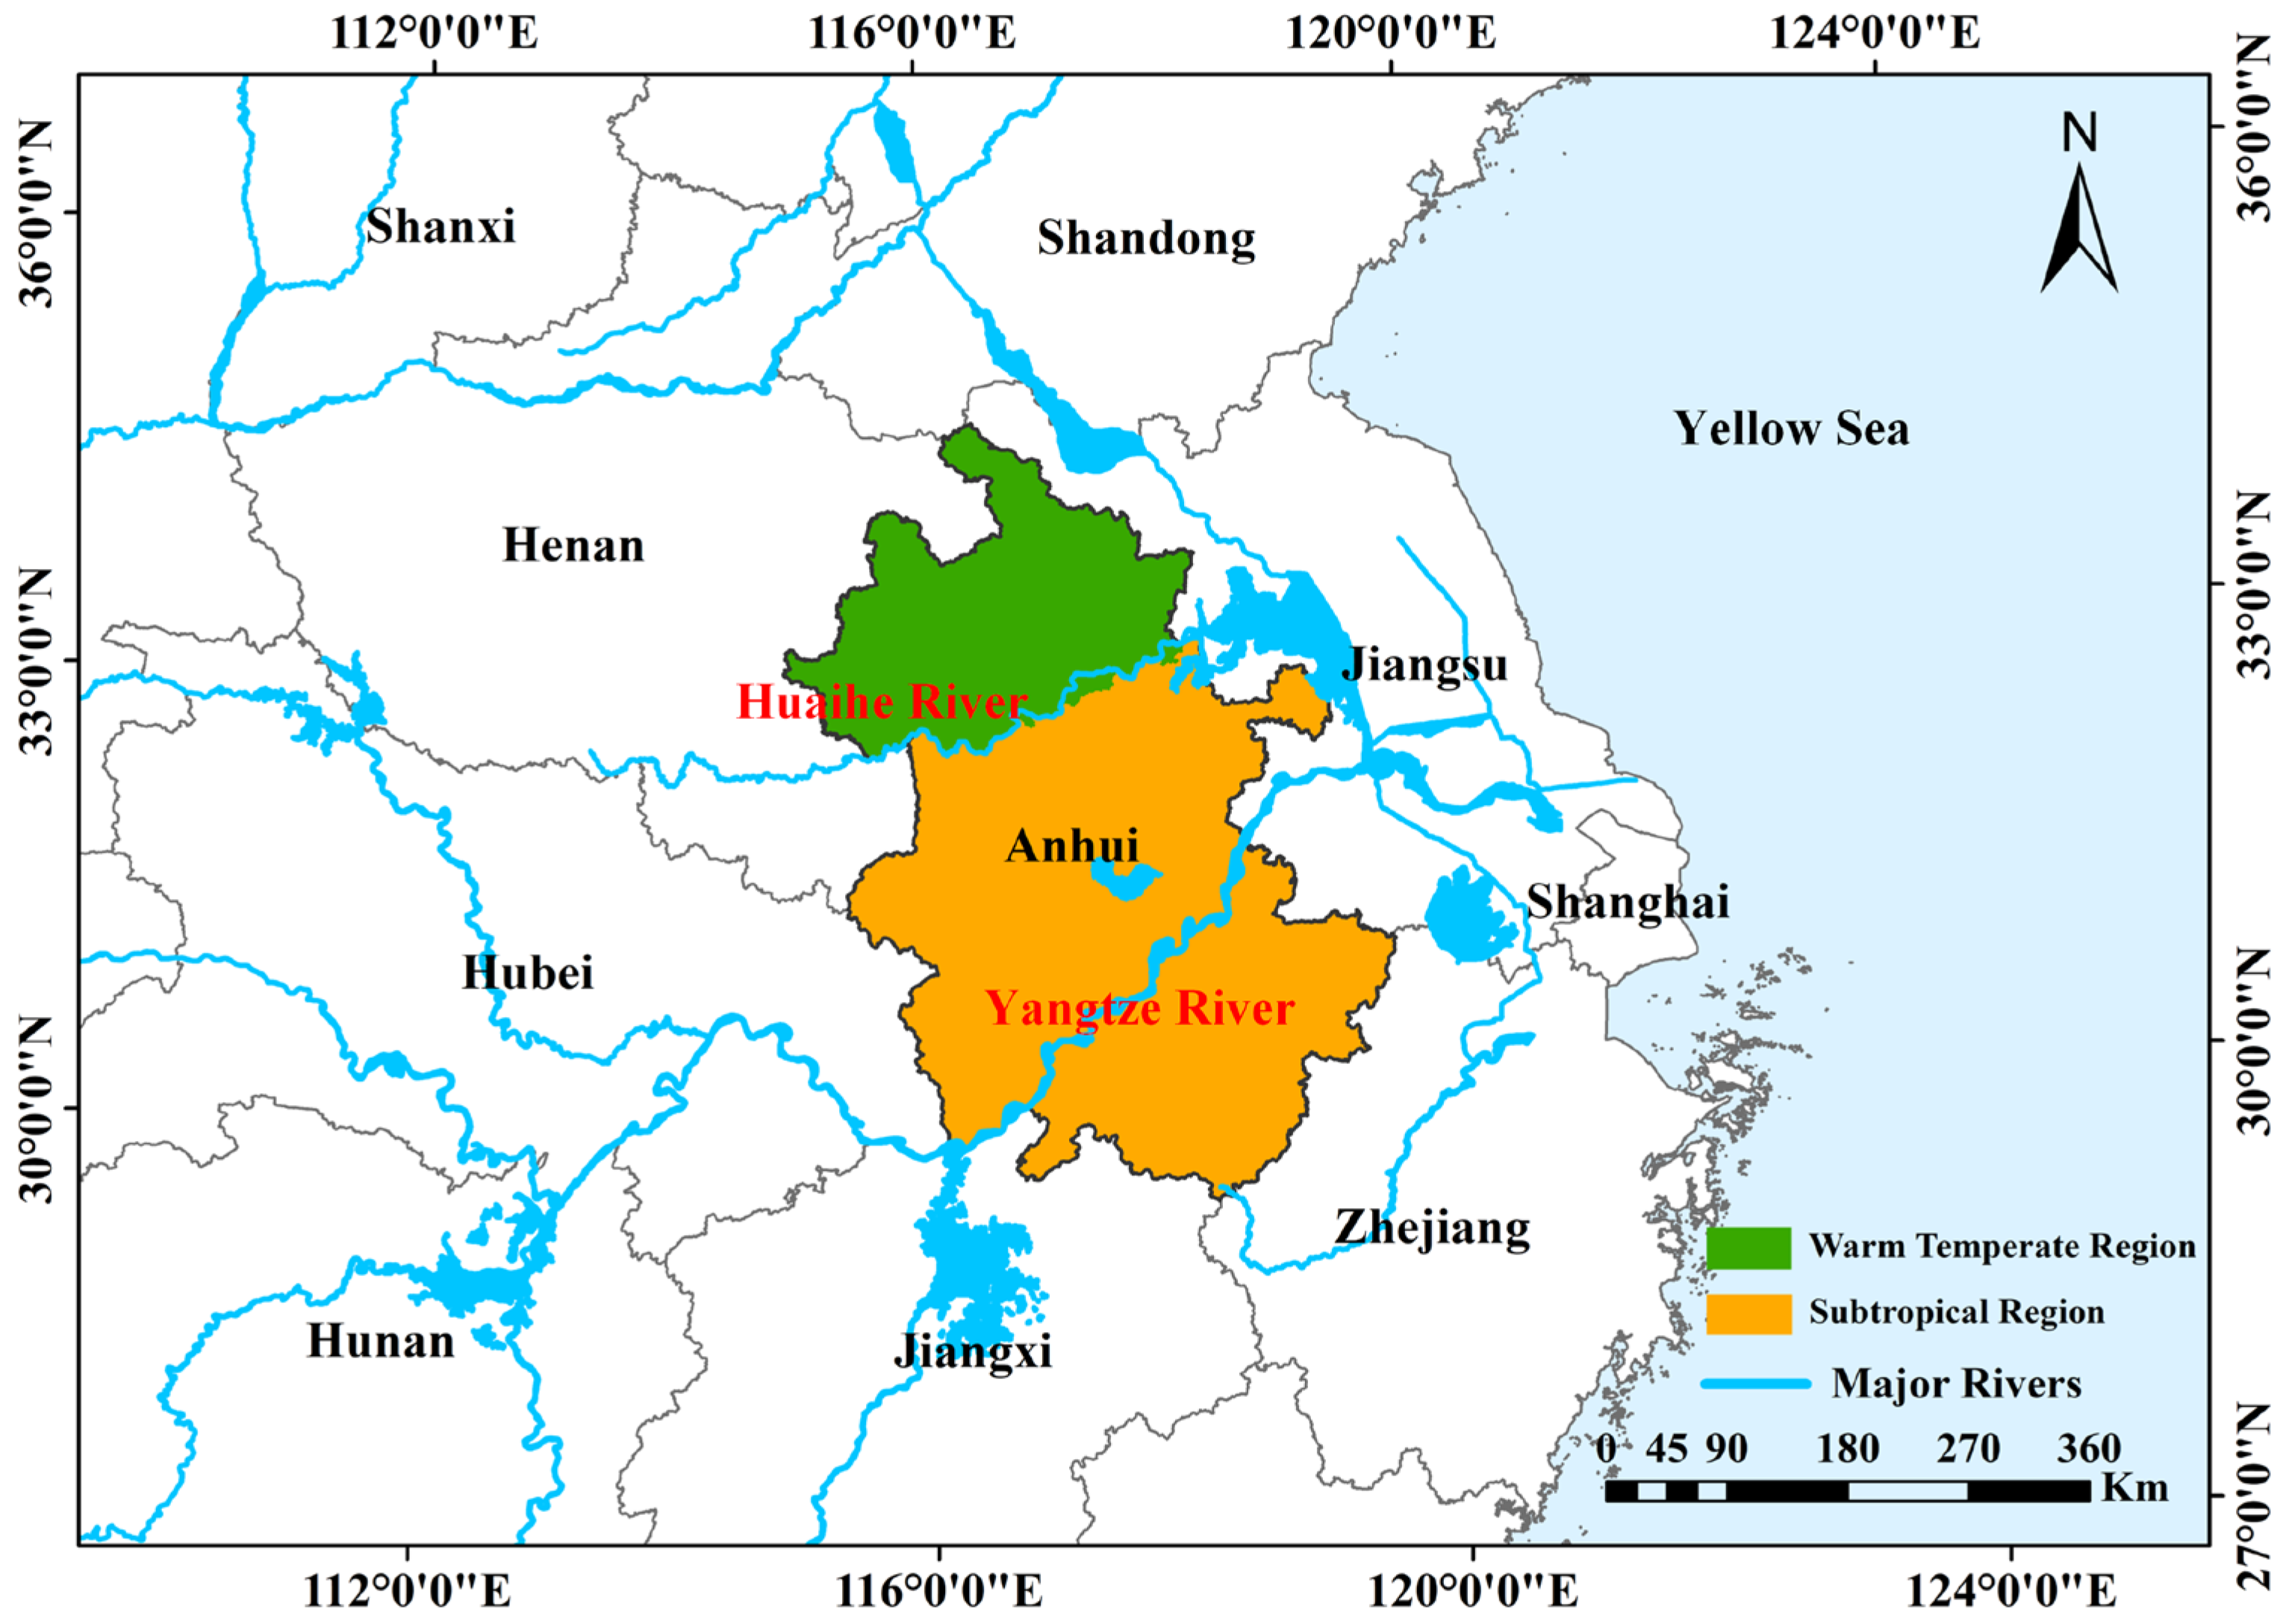
The evaluation results indicate that the area north of the Huaihe River and along Huaihua is the main planting area for winter wheat, which has a warm temperate semi-humid monsoon climate. The central and eastern parts of the country are hilly, while the southern part is mostly mountainous and hilly. Winter wheat is scattered between Jiang and Huai and along the Yangtze River area. The dense population in the northern part of the study area, the wide distribution of winter wheat cultivation, and the resolution of the sensors resulted in a ridge between cultivated fields, roads, and other non-winter wheat cultivation areas that were incorrectly classified as winter wheat cultivation areas due to mixed pixels. Consequently, the results of remote sensing were generally larger than the statistical results. The planting structure of wheat in the southern region showed that the planting area is generally small. The winter wheat planted in such areas often failed to achieve a finer extraction effect; consequently, the results of remote sensing were lower than the statistical results. The entire city of Huangshan City is dominated by mountains, and the planting area of winter wheat is almost zero. The misidentification of this study method is large for this area, which may be caused by vegetation on the mountains, resulting in a large error. The cities in the central region show a large deviation in the absolute error value, presumably because they are in the region where two remote sensing images are stitched together. This results in differences in the spectral features to some extent, thus reducing the overall classification accuracy.
Rape is mainly concentrated in the hills of Jianghuai and Huaihua, along the Yangtze River and southern Anhui, because the area south of the Huai River has a subtropical humid monsoon climate. Heat conditions, temperature, precipitation, and other climatic conditions meet the growth requirements of rapeseed. A small amount of rape is also distributed in the area north of the Huaihe River, but its climatic conditions make rape susceptible to autumn drought, which affects the normal sowing and emergence of rape. The area south of the Huai River was the main growing area for rape, and further south, the rape growing area was larger. Thus, most of the area predicted by the model was lower than the actual statistical area, thereby resulting in a low accuracy in the extraction of rape planting area.

4.2. Analysis of the Effectiveness of Spectral Characteristics Selection

To verify the effect of spectral characteristic on the extraction results of winter wheat, we conducted an experimental comparison on the remote sensing data of GF-6 WFV and Sentinel-2A. The details of the test results are presented in Table 8. The “boundary wrapping” phenomenon of image elements and the misrepresentation were improved after excluding the bands with poor distinguishing capacities. To quantify the results between the two methods, Table 9 presents the OA equivalence indices for each of the two categories of winter wheat and rape on the two remote sensing images. Notably, the OA improved after conducting band screening by approximately 0.5%, with recall and precision improving by 0.5% on average.
However, the extraction of winter wheat using band characteristics alone is far from highly accurate, based on which vegetation indices are added to enhance the characteristic variability of crops in this study. For this purpose, four vegetation indices, combined with the band filtering results as the overall features, were introduced into the CNN model, and the resulting crop classification results are presented in Table 10. To further illustrate the effect of vegetation index combinations, the values of OA and recall for various combination schemes are presented in Table 11. It is clear that the overall extraction accuracy for winter wheat increased after using the four vegetation index enhancement characteristics of NDVI, NDRE, SRre, and CIred-edge for both GF-6 WFV and Sentinel-2A data. The OA values of GF-6 WFV and Sentinel-2A images increased by 1.94 and 0.89%, respectively. After enhancing the image characteristics by adding the vegetation index, which is closely related to the red edge information after filtering the band features, the ability of the CNN model to distinguish winter wheat from other feature types (such as weeds, field ridges, and trees) enhanced, reducing the probability of misidentification and improving the extraction accuracy of winter wheat in the region. This facilitated the accurate calculation of the winter wheat planting area.

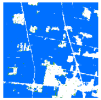
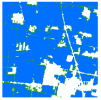
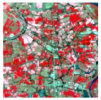
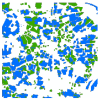
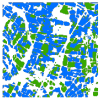
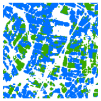
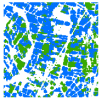
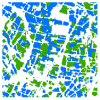
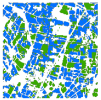
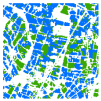
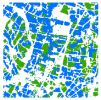
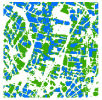
4.3. Comparison of Ablation Experiments with Related Networks

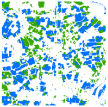
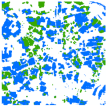
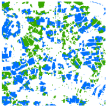
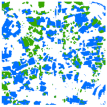
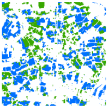
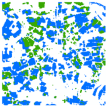
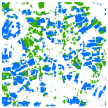
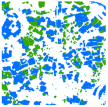
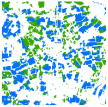
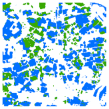
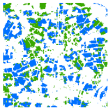
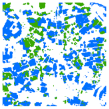
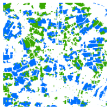
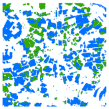
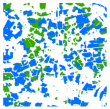
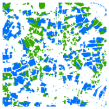
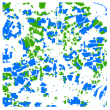
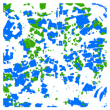
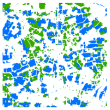
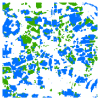
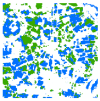
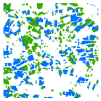
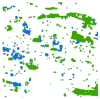
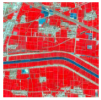
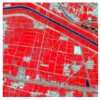
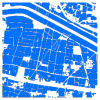
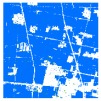
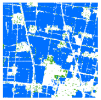
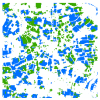
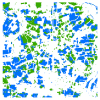
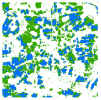
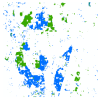
To verify the advantages of CNN with this spectral feature enhancement approach in extracting winter wheat acreage, a deep neural network (MLP) and maximum likelihood classification (MLC) methods were used for comparison. All the models were trained and tested using the same spectral feature data as the test set. We cropped the GF-6 WFV data to several scenic images of 256 size according to the overall planting structure characteristics of the study area, and used this to crop the Sentinel-2A data of the same range. The test area should be selected to include the structural characteristics of various types of typical terrain in the study area to ensure that the selected area is more intuitive in judging the accuracy of the results. Therefore, we selected the northern winter wheat plains with extensive cultivation, the central region with mixed cropping, and the southern region with more seriously scattered crops as the test areas to analyze and compare the accuracy of model recognition (Figure 11).
Table 12 presents a comparison of the test area on GF-6 WFV remote sensing images using several methods of spectral feature enhancement combined with CNN, MLP, and MLC. The qualitative analysis of the recognition results showed that the spectral feature enhancement combined with CNN was able to extract winter wheat accurately. To verify the accuracy of several methods for winter wheat identification, Table 13 presents the results of the quantitative analysis. In the northern region, winter wheat is grown on a large scale, while rape is grown sporadically, so the recall and precision of rape are relatively low in this region. Moreover, the spatial resolution of GF-6 WFV makes the ridge and road inconspicuous because of the large area covered by winter wheat planting, thereby offering difficultly in identifying roads with low widths, which reduces the extraction accuracy of winter wheat. The mixed planting phenomenon was obvious in the central test area, and winter wheat and rape were almost equally distributed in terms of the area, which ensured that the differences in the spectral features were more obvious. The CNN approach resulted in an OA of 94.71% on average.
The comparison results of the various methods used on Sentinel-2A remote sensing images are presented in Table 14. The qualitative analysis plots in the table indicate that the enhanced spectral features combined with the CNN model can more accurately extract the classification of winter wheat and rape, and more dimensional feature information can be obtained through convolution to maximize the role of spectral feature enhancement. Although MLPs are not sensitive to feature information, it is difficult to reflect the role of spectral feature enhancement. MLC is mainly based on manual experience and cannot easily distinguish the types of similar spectra presented on the image and requires extremely high manual visual interpretation requirements, which can result in incorrect winter wheat extraction results. Table 15 presents the recall, F1, and OA calculated for the quantitative analysis of the Sentinel-2A data extraction results. Table 16 presents the calculated IOUs of winter wheat and rape in the test area to further evaluate the extraction accuracy of the target crop’s planted area and shape. The results show that the combination of enhanced spectral features and CNN is better than the other two methods in terms of the evaluation indices, such as IOU and OA, for the recognition results of both winter wheat and rape. For the GF-6 WFV data, the average IOU of extracted winter wheat reached 77.70%, and that of winter wheat extracted from Sentinel-2A data reached 76.71%. This shows that the CNN method combined with spectral feature enhancement can successfully extract and calculate the winter wheat planting area in complex terrain.
Table 17 presents the results of the landscape fragmentation calculations for the two remote-sensing datasets. Notably, the differences between the two data in terms of the overall crop area are small. The Sentinel-2A data have higher spatial resolution and can better distinguish vegetation, weeds, and other types from winter wheat to a certain extent, making the overall crop area smaller than that of the GF-6 WFV data. The landscape fragmentation ( C i ) between 0 and 0.5000 on the GF-6 WFV data is the same as the areas with C i between 0 and 1.0000 on the Sentinel-2A data, which belong to areas with high landscape integrity. In the GF-6 WFV data, the C i was 0.5000 or more, whereas that in the Sentinel-2A data was 1.0000 or more. These areas mostly consist of sporadic crops and more serious mixed cropping, and their overall plot types are more fragmented. The results show that in areas with high landscape integrity, most plain areas showed extensive winter wheat cultivation, and the plots of crops were all relatively intact. However, the width of field ridges between cultivated fields and some roads is small, implying that the individual image elements on the image may contain some spectral features of crops, which reduces the extraction accuracy of the model. However, in areas with relatively high landscape fragmentation, where spectral differences between different crops are evident, or where background classes have larger proportions, the model classification is better. Consequently, the overall accuracy in these areas is somewhat improved compared to those with lesser landscape fragmentation.

5. Conclusions

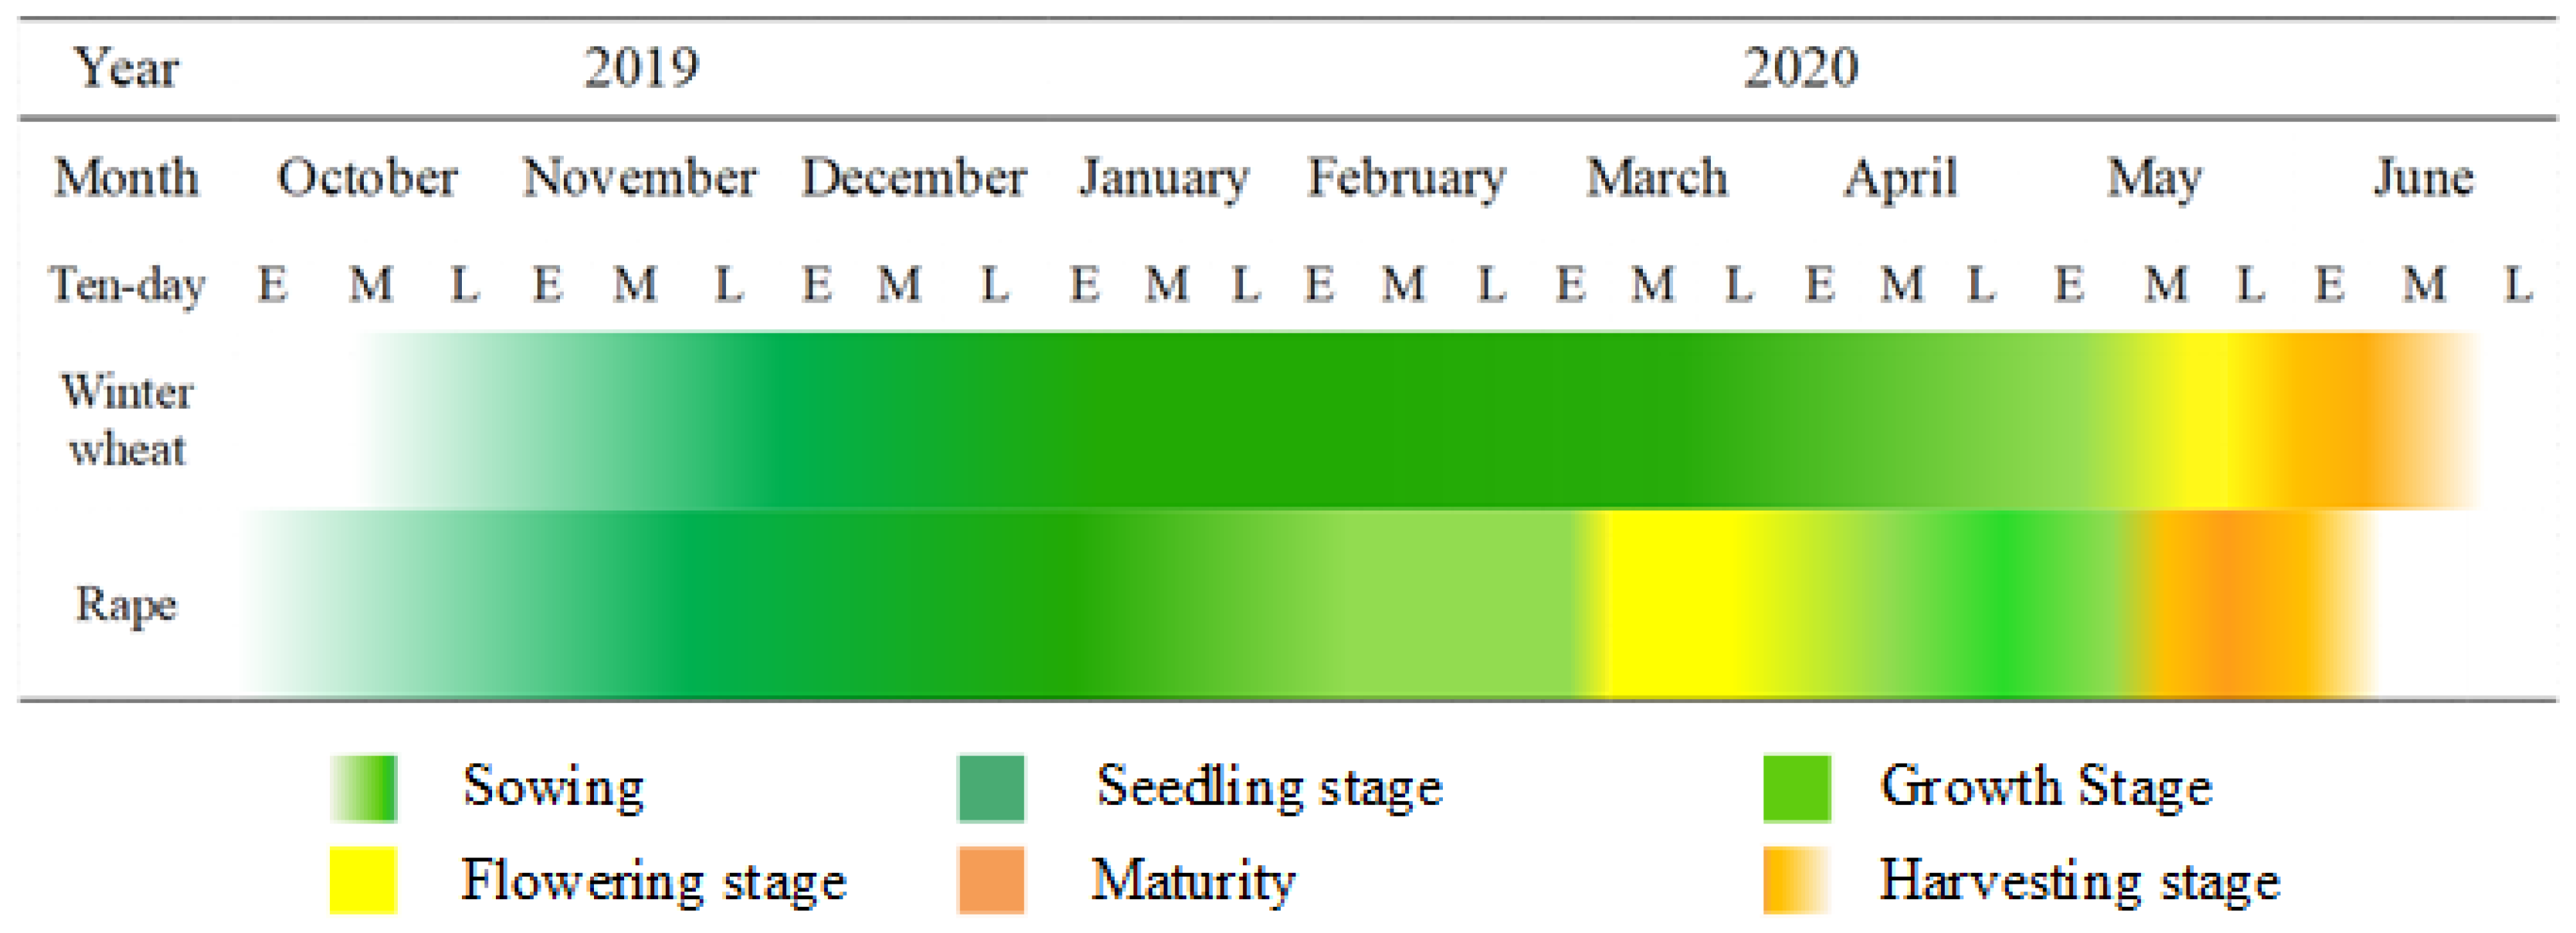
In this study, a method for large-scale extraction of winter wheat by spectral characteristic enhancement combined with convolutional neural network (CNN) is proposed. Firstly, due to the differences in harvesting time in different places, winter wheat cannot be identified very accurately at the time of maturity. Therefore, in this study, we analyzed the phenological characteristics of winter wheat, selected the best identification period for the experiment, and then selected two kinds of data, GF-6 WFV and Sentinel-2A, to meet the experimental requirements. Secondly, we selected Anhui province as the study area, which has a large north-south difference and a typical Chinese agricultural landscape fragmentation pattern. Therefore, in this study, we analyzed the effects of band and vegetation indexes on the extraction of winter wheat, and quoted the red-edge band-related features to further increase the differentiation between winter wheat and other feature classes, which can extract winter wheat information more accurately in the case of strong vegetation biodiversity in the study area. Then, the higher resolution GF2 and UAV data are cited for field sampling, and the samples are synthesized for forensics to ensure the accuracy of sample library establishment. The enhanced spectral characteristics are used as a dataset based on CNN to improve the extraction accuracy of winter wheat. The MLP and MLC methods are also used as a comparison to demonstrate that the CNN combined with spectral characteristic enhancement performs better than other model, and the average accuracy of winter wheat extraction reached 94.01 and 93.03% for GF-6 WFV and Sentinel-2A images, respectively. The average IOU of both images reached more than 85.00%; this fully demonstrates the effectiveness and universality of CNN for this method. In the future, we will study the extraction ability of other models for winter wheat and attempt to use higher resolution remote sensing images as data to explore the potential of deep learning for crop extraction.

Author Contributions

Conceptualization, H.S. and B.W.; methodology, B.W. and H.Y.; validation, H.S.; investigation, H.S. and B.W.; resources, Y.W. and B.W.; data curation, B.W.; writing—original draft preparation, H.S.; writing—review and editing, B.W., H.Y. and Y.W.; funding acquisition, Y.W., H.Y. and B.W. All authors have read and agreed to the published version of the manuscript.

Funding

This work was supported by the National Natural Science Foundation of China (grant numbers 41901282, 42101381 and 41971311), the National Natural Science Foundation of Anhui (grant number 2008085QD188), the Science and Technology Major Project of Anhui Province (grant No. 201903a07020014), and the International Science and Technology Cooperation Special (grant number 202104b11020022).

Data Availability Statement

The data presented in this study are available on request from the corresponding author. The data are not publicly available due to the permissions issues.

Conflicts of Interest

The authors declare no conflict of interest.

References

  1. Curtis, T.; Halford, N.G. Food security: The challenge of increasing wheat yield and the importance of not compromising food safety. Ann. Appl. Biol. 2014, 164, 354–372. [Google Scholar] [CrossRef] [PubMed] [Green Version]
  2. Fan, L.; Liang, S.; Chen, H.; Hu, Y.; Zhang, X.; Liu, Z.; Wu, W.; Yang, P. Spatio-temporal analysis of the geographical centroids for three major crops in China from 1949 to 2014. J. Geogr. Sci. 2018, 28, 1672–1684. [Google Scholar] [CrossRef] [Green Version]
  3. He, Z.; Xia, X.; Zhang, Y. Breeding Noodle Wheat in China; Hou, G.G., Hou, G.G., Eds.; John Wiley & Sons, Inc.: Hoboken, NJ, USA, 2010; pp. 1–23. [Google Scholar]
  4. Huang, J.; Tian, L.; Liang, S.; Ma, H.; Becker-Reshef, I.; Huang, Y.; Su, W.; Zhang, X.; Zhu, D.; Wu, W. Improving winter wheat yield estimation by assimilation of the leaf area index from Landsat TM and MODIS data into the WOFOST model. Agric. For. Meteorol. 2015, 204, 106–121. [Google Scholar] [CrossRef] [Green Version]
  5. Luo, Y.; Zhang, Z.; Cao, J.; Zhang, L.; Zhang, J.; Han, J.; Zhuang, H.; Cheng, F.; Tao, F. Accurately mapping global wheat production system using deep learning algorithms. Int. J. Appl. Earth Obs. Geoinf. 2022, 110, 102823. [Google Scholar] [CrossRef]
  6. Xiao, D.; Niu, H.; Guo, F.; Zhao, S.; Fan, L. Monitoring irrigation dynamics in paddy fields using spatiotemporal fusion of Sentinel-2 and MODIS. Agric. Water Manag. 2022, 263, 107409. [Google Scholar] [CrossRef]
  7. Lu, J.; Eitel, J.U.; Engels, M.; Zhu, J.; Ma, Y.; Liao, F.; Zheng, H.; Wang, X.; Yao, X.; Cheng, T.; et al. Improving Unmanned Aerial Vehicle (UAV) remote sensing of rice plant potassium accumulation by fusing spectral and textural information. Int. J. Appl. Earth Obs. Geoinf. 2021, 104, 102592. [Google Scholar] [CrossRef]
  8. Zhoumiqi, X.D.Z.J. Fusion of MODIS and Landsat 8 images to generate high spatial- temporal resolution data for mapping autumn crop distribution. J. Remote Sens. 2015, 19, 791–805. [Google Scholar]
  9. Yan, S.; Yao, X.; Zhu, D.; Liu, D.; Zhang, L.; Yu, G.; Gao, B.; Yang, J.; Yun, W. Large-scale crop mapping from multi-source optical satellite imageries using machine learning with discrete grids. Int. J. Appl. Earth Obs. Geoinf. 2021, 103, 102485. [Google Scholar] [CrossRef]
  10. Pittman, K.; Hansen, M.C.; Becker-Reshef, I.; Potapov, P.V.; Justice, C.O. Estimating Global Cropland Extent with Multi-year MODIS Data. Remote Sens. 2010, 2, 1844–1863. [Google Scholar] [CrossRef] [Green Version]
  11. Li, H.; Zhang, C.; Zhang, S.; Ding, X.; Atkinson, P.M. Iterative Deep Learning (IDL) for agricultural landscape classification using fine spatial resolution remotely sensed imagery. Int. J. Appl. Earth Obs. Geoinf. 2021, 102, 102437. [Google Scholar] [CrossRef]
  12. Li, J.; Shen, Y.; Yang, C. An Adversarial Generative Network for Crop Classification from Remote Sensing Timeseries Images. Remote Sens. 2020, 13, 65. [Google Scholar] [CrossRef]
  13. Chiu, T.; Sarabandi, K. Electromagnetic scattering from short branching vegetation. IEEE Trans. Geosci. Remote Sens. 2000, 38, 911–925. [Google Scholar] [CrossRef] [Green Version]
  14. Qiu, B.; Luo, Y.; Tang, Z.; Chen, C.; Lu, D.; Huang, H.; Chen, Y.; Chen, N.; Xu, W. Winter wheat mapping combining variations before and after estimated heading dates. ISPRS J. Photogramm. Remote Sens. 2017, 123, 35–46. [Google Scholar] [CrossRef]
  15. Dong, Q.; Chen, X.; Chen, J.; Zhang, C.; Liu, L.; Cao, X.; Zang, Y.; Zhu, X.; Cui, X. Mapping Winter Wheat in North China Using Sentinel 2A/B Data: A Method Based on Phenology-Time Weighted Dynamic Time Warping. Remote Sens. 2020, 12, 1274. [Google Scholar] [CrossRef] [Green Version]
  16. Xu, Q.; Liang, Y. Monte Carlo cross validation. Chemom. Intell. Lab. Syst. 2001, 56, 1–11. [Google Scholar] [CrossRef]
  17. Liu, J.; Wang, L.; Teng, F.; Yang, L.; Gao, J.; Yao, B.; Yang, F. Impact of red-edge waveband of RapidEye satellite on estimation accuracy of crop planting area. Trans. Chin. Soc. Agric. Eng. 2016, 32, 140–148. [Google Scholar]
  18. Fundisi, E.; Tesfamichael, S.G.; Ahmed, F. A combination of Sentinel-1 RADAR and Sentinel-2 multispectral data improves classification of morphologically similar savanna woody plants. Eur. J. Remote Sens. 2022, 55, 372–387. [Google Scholar] [CrossRef]
  19. Liu, J.; Fan, J.; Yang, C.; Xu, F.; Zhang, X. Novel vegetation indices for estimating photosynthetic and non-photosynthetic fractional vegetation cover from Sentinel data. Int. J. Appl. Earth Obs. Geoinf. 2022, 109, 102793. [Google Scholar] [CrossRef]
  20. Xia, T.; He, Z.; Cai, Z.; Wang, C.; Wang, W.; Wang, J.; Hu, Q.; Song, Q. Exploring the potential of Chinese GF-6 images for crop mapping in regions with complex agricultural landscapes. Int. J. Appl. Earth Obs. Geoinf. 2022, 107, 102702. [Google Scholar] [CrossRef]
  21. Löw, F.; Michel, U.; Dech, S.; Conrad, C. Impact of feature selection on the accuracy and spatial uncertainty of per-field crop classification using Support Vector Machines. ISPRS J. Photogramm. Remote Sens. 2013, 85, 102–119. [Google Scholar] [CrossRef]
  22. Liu, D.; Li, J. Data Field Modeling and Spectral-Spatial Feature Fusion for Hyperspectral Data Classification. Sensors 2016, 16, 2146. [Google Scholar] [CrossRef] [PubMed] [Green Version]
  23. Sang, X.; Guo, Q.; Wu, X.; Fu, Y.; Xie, T.; He, C.; Zang, J. Intensity and Stationarity Analysis of Land Use Change Based on CART Algorithm. Sci. Rep. 2019, 9, 12279. [Google Scholar] [CrossRef] [PubMed] [Green Version]
  24. Dolz, J.; Desrosiers, C.; Ben Ayed, I. 3D fully convolutional networks for subcortical segmentation in MRI: A large-scale study. NeuroImage 2018, 170, 456–470. [Google Scholar] [CrossRef] [PubMed] [Green Version]
  25. Guo, J.; Li, H.; Ning, J.; Han, W.; Zhang, W.; Zhou, Z.-S. Feature Dimension Reduction Using Stacked Sparse Auto-Encoders for Crop Classification with Multi-Temporal, Quad-Pol SAR Data. Remote Sens. 2020, 12, 321. [Google Scholar] [CrossRef] [Green Version]
  26. Fernandez-Beltran, R.; Baidar, T.; Kang, J.; Pla, F. Rice-Yield Prediction with Multi-Temporal Sentinel-2 Data and 3D CNN: A Case Study in Nepal. Remote Sens. 2021, 13, 1391. [Google Scholar] [CrossRef]
  27. Yang, S.; Gu, L.; Li, X.; Gao, F.; Jiang, T. Fully Automated Classification Method for Crops Based on Spatiotemporal Deep-Learning Fusion Technology. IEEE Trans. Geosci. Remote Sens. 2022, 60, 1–16. [Google Scholar] [CrossRef]
  28. Zhang, C.; Gao, S.; Yang, X.; Li, F.; Yue, M.; Han, Y.; Zhao, H.; Zhang, Y.; Fan, K. Convolutional Neural Network-Based Remote Sensing Images Segmentation Method for Extracting Winter Wheat Spatial Distribution. Appl. Sci. 2018, 8, 1981. [Google Scholar] [CrossRef] [Green Version]
  29. Liu, J.; Xu, Y.; Li, H.; Guo, J. Soil Moisture Retrieval in Farmland Areas with Sentinel Multi-Source Data Based on Regression Convolutional Neural Networks. Sensors 2021, 21, 877. [Google Scholar] [CrossRef]
  30. Zhao, W.; Du, S. Learning multiscale and deep representations for classifying remotely sensed imagery. ISPRS J. Photogramm. Remote Sens. 2016, 113, 155–165. [Google Scholar] [CrossRef]
  31. Simard, P.Y.; Steinkraus, D.; Platt, J.C. Best practices for convolutional neural networks applied to visual document analysis. In Proceedings of the 2003 Seventh International Conference on Document Analysis and Recognition, Edinburgh, UK, 6 August 2003. [Google Scholar]
  32. Chen, Y.; Zhang, C.; Wang, S.; Li, J.; Li, F.; Yang, X.; Wang, Y.; Yin, L. Extracting Crop Spatial Distribution from Gaofen 2 Imagery Using a Convolutional Neural Network. Appl. Sci. 2019, 9, 2917. [Google Scholar] [CrossRef] [Green Version]
  33. Zhang, Z.; Li, Z.; Chen, Y.; Zhang, L.; Tao, F. Improving regional wheat yields estimations by multi-step-assimilating of a crop model with multi-source data. Agric. For. Meteorol. 2020, 290, 107993. [Google Scholar] [CrossRef]
  34. Chen, B.; Zheng, H.; Wang, L.; Hellwich, O.; Chen, C.; Yang, L.; Liu, T.; Luo, G.; Bao, A.; Chen, X. A joint learning Im-BiLSTM model for incomplete time-series Sentinel-2A data imputation and crop classification. Int. J. Appl. Earth Obs. Geoinf. 2022, 108, 102762. [Google Scholar] [CrossRef]
  35. Wang, M.; Cheng, Y.; Guo, B.; Jin, S. Parameters determination and sensor correction method based on virtual CMOS with distortion for the GaoFen6 WFV camera. ISPRS J. Photogramm. Remote Sens. 2019, 156, 51–62. [Google Scholar] [CrossRef]
  36. Jarlan, L.; Mangiarotti, S.; Mougin, E.; Mazzega, P.; Hiernaux, P.; Le Dantec, V. Assimilation of SPOT/VEGETATION NDVI data into a sahelian vegetation dynamics model. Remote Sens. Environ. 2008, 112, 1381–1394. [Google Scholar] [CrossRef]
  37. Wang, Y.; Zhang, Z.; Feng, L.; Du, Q.; Runge, T. Combining Multi-Source Data and Machine Learning Approaches to Predict Winter Wheat Yield in the Conterminous United States. Remote Sens. 2020, 12, 1232. [Google Scholar] [CrossRef] [Green Version]
  38. Rouse, J.W.H.R. Monitoring vegetation systems in the great plains with ERTS. In Third ERTS Symposium; NASA SP-351; NASA: Washington, DC, USA, 1974; pp. 209–317. [Google Scholar]
  39. Fitzgerald, G.J.; Rodriguez, D.; Christensen, L.K.; Belford, R.; Sadras, V.O.; Clarke, T.R. Spectral and thermal sensing for nitrogen and water status in rainfed and irrigated wheat environments. Precis. Agric. 2006, 7, 233–248. [Google Scholar] [CrossRef]
  40. Jordan, C.F. Derivation of Leaf-Area Index from Quality of Light on the Forest Floor. Ecology 1969, 50, 663–666. [Google Scholar] [CrossRef]
  41. Gitelson, A.A.V.N. Remote estimation of canopy chlorophyll content in crops. Geophys. Res. Lett. 2015, 32, L08403. [Google Scholar] [CrossRef] [Green Version]
  42. Nair, V.; Hinton, G.E. Rectified Linear Units Improve Restricted Boltzmann Machines Vinod Nair. In Proceedings of the 27th International Conference on Machine Learning, Haifa, Israel, 21–24 June 2010. [Google Scholar]
  43. Ji, S.; Zhang, C.; Xu, A.; Shi, Y.; Duan, Y. 3D Convolutional Neural Networks for Crop Classification with Multi-Temporal Remote Sensing Images. Remote Sens. 2018, 10, 75. [Google Scholar] [CrossRef] [Green Version]
  44. Penghui, J.; Dengshuai, C.; Manchun, L. Farmland landscape fragmentation evolution and its driving mechanism from rural to urban: A case study of Changzhou City. J. Rural. Stud. 2021, 82, 1–18. [Google Scholar] [CrossRef]
Figure 1. Map of climate types covering the study area.
Remotesensing 15 01301 g001
Figure 2. Corresponding phenological calendars of winter wheat and rape.
Remotesensing 15 01301 g002
Figure 3. UAV survey area. (These data were not included in the experiment and were only used for fine confirmation of feature types and to enhance the reliability of sample establishment.).
Remotesensing 15 01301 g003
Figure 4. Manual carrying of RTK to measure the area of the plot (numbers 1 and 2 are rape planting sites, and 3 and 4 are winter wheat planting sites).
Remotesensing 15 01301 g004
Figure 5. Flowchart overview of winter wheat extraction method.
Remotesensing 15 01301 g005
Figure 6. Field survey area on GF-2 images.
Remotesensing 15 01301 g006
Figure 8. Analysis of various spectral vegetation index curves in (a) GF-6 WFV and (b) Sentinel-2A data.
Remotesensing 15 01301 g008
Figure 9. Overall architecture diagram of the CNN network.
Remotesensing 15 01301 g009
Figure 10. Spatial distribution of winter wheat and rape in Anhui Province.
Remotesensing 15 01301 g010
Figure 11. Specific distribution status of the test area (the red boxes are the test areas in the northern, central and southern parts of the study area selected for this study).
Remotesensing 15 01301 g011
Table 1. Actual conditions of winter wheat and rape growth cycles.
DateNovemberMarchMay
Winter wheatRemotesensing 15 01301 i001Remotesensing 15 01301 i002Remotesensing 15 01301 i003
RapeRemotesensing 15 01301 i004Remotesensing 15 01301 i005Remotesensing 15 01301 i006
Table 2. Main information parameters of GF-6 WFV and Sentinel-2A data.
DatasetBand
Number
Band NameWavelength Range (nm)Spatial Resolution (m)
GF-6 WFVB1Blue (B)450–52016
B2Green (G)520–590
B3Red (R)630–690
B4Near-infrared (NIR)770–890
B5Red edge1 (RE1)690–730
B6Red edge2 (RE2)730–770
B7Purple (P)400–450
B8Yellow (Y)590–630
Sentinel-2AB1Coastal aerosol44360
B2Blue (B)49010
B3Green (G)56010
B4Red (R)66510
B5Red edge1 (RE1)70520
B6Red edge2 (RE2)74020
B7Red edge3 (RE3)78320
B8Near-infrared (NIR)84210
B8ANarrow NIR86520
B9Water vapor94560
B10SWIR-Cirrus137560
B11SWIR1161020
B12SWIR2219020
Table 3. Error analysis of the actual measured plot area and remote sensing image area.
Parcel Serial NumberImage Area (m2)Area Measured by RTK (m2)Absolute Error (m2)Relative Error (m2)
125,226.8025,371.58144.780.0057
22627.832652.5224.690.0093
346,290.7046,422.12131.420.0028
418,679.0018,818.12139.120.0074
Table 4. Schematic diagram of the main types in the field survey area.
TypeData UsedArtificial PhotosUAV Photos
Winter wheatRemotesensing 15 01301 i007Remotesensing 15 01301 i008Remotesensing 15 01301 i009
RapeRemotesensing 15 01301 i010Remotesensing 15 01301 i011Remotesensing 15 01301 i012
VegetationRemotesensing 15 01301 i013Remotesensing 15 01301 i014Remotesensing 15 01301 i015
Table 5. Number of samples for different classes.
DataTypeTraining SamplesTotal Pixels
Number of Pixels
GF-6 WFVWinter wheat970234,651
Rape8796
Others16,153
Sentinel-2AWinter wheat980434,375
Rape9057
Others15,514
Table 6. Vegetation indices evaluated in this study.
IndexNameFormulationReference
NDVINormalized difference vegetation index ρ N I R ρ R E D ρ N I R + ρ R E D [38]
NDRENormalized difference red-edge index ρ 750 ρ 705 ρ 750 + ρ 705 [39]
SRreSimple ratio index ρ N I R ρ r e d e d g e [40]
CIred-edgeRed-edge chlorophyll index ρ 750 ρ 710 1 [41]
ρ λ refers to the reflectance factor at wavelength λ nm.
Table 7. Comparison of winter wheat planting area.
CityEstimated Area (km2)Statistical Area (km2)Errors (km2)
Huaibei1749.501366.26383.24
Bozhou5465.724366.181099.54
Suzhou5889.664756.361133.30
Fuyang5727.855000.52727.33
Bengbu3416.282520.87895.41
Huainan1519.722159.75−640.03
Chuzhou1774.543294.19−1519.65
Luan435.491583.20−1147.71
Hefei555.271221.97−666.70
Maanshan314.32487.78−173.46
Wuhu328.97430.27−101.30
Xuancheng247.95437.38−189.43
Tongling162.93125.6537.28
Chizhou115.25133.46−18.21
Anqing206.88472.18−265.30
Huangshan25.94025.94
Total27,936.2728,356.02−419.75
Table 8. Detailed comparison of GF-6 WFV and Sentinel-2A band sensitivities.
ImageryAll BandsMethodology of This Paper
GF-6 WFVRemotesensing 15 01301 i016Remotesensing 15 01301 i017Remotesensing 15 01301 i018
Sentinel-2ARemotesensing 15 01301 i019Remotesensing 15 01301 i020Remotesensing 15 01301 i021
GF-6 WFVRemotesensing 15 01301 i022Remotesensing 15 01301 i023Remotesensing 15 01301 i024
Sentinel-2ARemotesensing 15 01301 i025Remotesensing 15 01301 i026Remotesensing 15 01301 i027
GF-6 WFVRemotesensing 15 01301 i028Remotesensing 15 01301 i029Remotesensing 15 01301 i030
Sentinel-2ARemotesensing 15 01301 i031Remotesensing 15 01301 i032Remotesensing 15 01301 i033
Table 9. Quantitative comparison of GF-6 WFV and Sentinel-2A data band sensitivities.
ImageryBand CharacteristicsWinter WheatRapeOA
PrecisionRecallPrecisionRecall
GF-6 WFVAll bands98.0177.6884.9183.4590.78
Methodology of this paper98.1477.7387.5986.1291.14
Sentinel-2AAll bands92.1689.9185.4591.5493.71
Methodology of this paper93.3590.0887.6489.3793.99
Table 10. Sensitivity comparison of vegetation index combination schemes for GF-6 WFV and Sentinel-2A data.
SchemeCombination of CharacteristicsGF-6 WFVSentinel-2A
ANDVIRemotesensing 15 01301 i034Remotesensing 15 01301 i035
BNDRERemotesensing 15 01301 i036Remotesensing 15 01301 i037
CSRreRemotesensing 15 01301 i038Remotesensing 15 01301 i039
DCIred-edgeRemotesensing 15 01301 i040Remotesensing 15 01301 i041
ENDVI + NDRERemotesensing 15 01301 i042Remotesensing 15 01301 i043
FNDVI + SRreRemotesensing 15 01301 i044Remotesensing 15 01301 i045
GNDVI + CIred-edgeRemotesensing 15 01301 i046Remotesensing 15 01301 i047
HNDRE + SRreRemotesensing 15 01301 i048Remotesensing 15 01301 i049
INDRE + CIred-edgeRemotesensing 15 01301 i050Remotesensing 15 01301 i051
JCIred-edge + SRreRemotesensing 15 01301 i052Remotesensing 15 01301 i053
KNDRE + SRre + CIred-edgeRemotesensing 15 01301 i054Remotesensing 15 01301 i055
LNDVI + SRre + CIred-edgeRemotesensing 15 01301 i056Remotesensing 15 01301 i057
MNDVI + NDRE + SRre + CIred-edgeRemotesensing 15 01301 i058Remotesensing 15 01301 i059
Table 11. Results of accuracy evaluation of GF-6 WFV and Sentinel-2A data with different combinations of spectral features.
ImageryClassification SchemesWinter WheatRapeOA
PrecisionRecallPrecisionRecall
GF-6 WFVA87.6493.9794.0776.9492.68
B88.4193.7094.9575.3792.80
C90.5290.6293.1874.0192.38
D87.7994.1494.6276.2392.68
E88.6293.2394.0377.4892.91
F86.0595.1293.8379.3292.74
G87.3993.2993.9276.4292.39
H85.8891.0194.8573.4791.85
I89.5992.0894.5177.3492.83
J89.4190.9793.6377.8492.63
K85.5593.2494.8974.0192.19
L88.1793.6693.8577.0692.65
M89.4594.2794.5576.1993.08
Sentinel-2AA90.2492.9786.9088.7193.74
B88.8492.9592.3287.1493.69
C89.0893.1389.7589.1293.77
D89.0694.5490.4290.2794.26
E89.2594.2190.6888.3094.10
F89.5593.5490.0889.2593.86
G89.2793.7892.3988.5094.14
H90.1891.4290.6587.4193.63
I88.3893.7491.0889.1793.80
J89.9094.6091.6787.9994.21
K91.8192.6990.8789.6994.40
L90.7491.0089.8588.5593.52
M91.4793.9492.1991.6694.88
Table 12. Differences in the identification of winter wheat using different methods on GF-6 WFV.
Test AreaGF-6 WFV Data
ImageryManual Visual
Interpretation
Results
CNN ResultsMLP ResultsMLC Results
NorthernRemotesensing 15 01301 i060Remotesensing 15 01301 i061Remotesensing 15 01301 i062Remotesensing 15 01301 i063Remotesensing 15 01301 i064
Remotesensing 15 01301 i065Remotesensing 15 01301 i066Remotesensing 15 01301 i067Remotesensing 15 01301 i068Remotesensing 15 01301 i069
Remotesensing 15 01301 i070Remotesensing 15 01301 i071Remotesensing 15 01301 i072Remotesensing 15 01301 i073Remotesensing 15 01301 i074
CentralRemotesensing 15 01301 i075Remotesensing 15 01301 i076Remotesensing 15 01301 i077Remotesensing 15 01301 i078Remotesensing 15 01301 i079
Remotesensing 15 01301 i080Remotesensing 15 01301 i081Remotesensing 15 01301 i082Remotesensing 15 01301 i083Remotesensing 15 01301 i084
Remotesensing 15 01301 i085Remotesensing 15 01301 i086Remotesensing 15 01301 i087Remotesensing 15 01301 i088Remotesensing 15 01301 i089
SouthernRemotesensing 15 01301 i090Remotesensing 15 01301 i091Remotesensing 15 01301 i092Remotesensing 15 01301 i093Remotesensing 15 01301 i094
Remotesensing 15 01301 i095Remotesensing 15 01301 i096Remotesensing 15 01301 i097Remotesensing 15 01301 i098Remotesensing 15 01301 i099
Remotesensing 15 01301 i100Remotesensing 15 01301 i101Remotesensing 15 01301 i102Remotesensing 15 01301 i103Remotesensing 15 01301 i104
Table 13. Results of the correlation method to identify winter wheat on GF-6 WFV.
Test AreaModelsWinter WheatRapeOA
PrecisionRecallF1PrecisionRecallF1
NorthernCNN91.9999.2895.5020.0025.0022.2293.66
MLP93.1996.9595.031.3435.002.5891.99
MLC90.1187.8888.981.0077.501.9786.96
CNN93.5898.5496.0024.3952.6333.3394.07
MLP94.6996.7595.710.9947.371.9492.70
MLC91.8787.6489.710.4573.680.8987.28
CNN89.9299.7094.565.1129.178.7091.57
MLP88.8896.1192.351.5950.003.0889.75
MLC88.5290.2189.360.4887.500.9584.69
CentralCNN91.5692.5592.0592.5582.1887.0693.49
MLP91.8187.2189.4582.2589.7285.8291.92
MLC90.2356.3169.3476.1682.0979.0184.69
CNN91.9698.1694.9696.6285.9690.9894.66
MLP89.4391.1990.3085.8082.4084.0790.39
MLC89.6767.4977.0183.4487.3985.3784.03
CNN71.0487.5078.4294.1177.5785.0495.99
MLP64.7081.3972.0983.9680.8982.4094.80
MLC66.9537.0147.6787.0482.5884.7594.33
SouthernCNN54.2979.4064.4987.2681.3384.1994.28
MLP32.8486.6647.6376.0280.4178.1589.76
MLC27.6292.8742.5893.1871.6381.0089.27
CNN91.0179.0684.6284.7667.8675.3794.94
MLP75.5486.0680.4676.7373.3775.0193.82
MLC70.1471.9471.0375.8984.2279.8493.82
CNN87.0171.7778.6693.0252.3567.0093.45
MLP65.0776.5470.3484.0653.1565.1292.52
MLC44.3449.8146.9283.6862.4171.5091.40
Table 14. Differences in the identification of winter wheat by different methods used on Sentinel-2A.
Test AreaSentinel-2A Data
ImageryManual Visual
Interpretation
Results
CNN ResultsMLP ResultsMLC Results
NorthernRemotesensing 15 01301 i105Remotesensing 15 01301 i106Remotesensing 15 01301 i107Remotesensing 15 01301 i108Remotesensing 15 01301 i109
Remotesensing 15 01301 i110Remotesensing 15 01301 i111Remotesensing 15 01301 i112Remotesensing 15 01301 i113Remotesensing 15 01301 i114
Remotesensing 15 01301 i115Remotesensing 15 01301 i116Remotesensing 15 01301 i117Remotesensing 15 01301 i118Remotesensing 15 01301 i119
CentralRemotesensing 15 01301 i120Remotesensing 15 01301 i121Remotesensing 15 01301 i122Remotesensing 15 01301 i123Remotesensing 15 01301 i124
Remotesensing 15 01301 i125Remotesensing 15 01301 i126Remotesensing 15 01301 i127Remotesensing 15 01301 i128Remotesensing 15 01301 i129
Remotesensing 15 01301 i130Remotesensing 15 01301 i131Remotesensing 15 01301 i132Remotesensing 15 01301 i133Remotesensing 15 01301 i134
SouthernRemotesensing 15 01301 i135Remotesensing 15 01301 i136Remotesensing 15 01301 i137Remotesensing 15 01301 i138Remotesensing 15 01301 i139
Remotesensing 15 01301 i140Remotesensing 15 01301 i141Remotesensing 15 01301 i142Remotesensing 15 01301 i143Remotesensing 15 01301 i144
Remotesensing 15 01301 i145Remotesensing 15 01301 i146Remotesensing 15 01301 i147Remotesensing 15 01301 i148Remotesensing 15 01301 i149
Table 15. Results of the correlation method to identify winter wheat on Sentinel-2A.
Test AreaModelsWinter WheatRapeOA
PrecisionRecallF1PrecisionRecallF1
NorthernCNN88.3199.1793.435.0629.518.6490.85
MLP86.1695.5490.613.8031.976.7989.15
MLC79.9492.7776.620.5352.941.0582.22
CNN90.0998.6194.167.3435.9012.1991.38
MLP88.5796.0392.155.8535.9010.0690.16
MLC87.2473.4981.290.4679.100.9171.86
CNN89.3698.8793.8715.2235.9021.3890.17
MLP89.3598.1793.559.9524.1014.0889.96
MLC88.6781.6485.016.3546.4111.1781.81
CentralCNN93.9491.4792.6991.6692.1991.9294.88
MLP91.2488.9990.1087.8787.3987.6393.39
MLC86.4177.5681.7553.5197.4169.0886.28
CNN90.0191.3390.6789.9986.2788.0990.56
MLP88.2589.3488.7987.3882.8985.0889.44
MLC87.2163.4873.4857.6192.3170.9482.01
CNN95.2270.7881.2098.0181.1888.8096.12
MLP86.2966.6575.2196.0176.1584.9395.15
MLC49.2663.1555.3576.2869.4072.6889.26
SouthernCNN72.0677.3174.5994.9378.9186.1894.26
MLP51.4271.2959.7592.7477.6284.5191.83
MLC42.7886.5957.2792.3979.6285.5389.24
CNN80.9878.0779.5090.1470.5279.1394.20
MLP68.1276.8572.2287.7967.9076.5792.86
MLC79.5857.1866.5568.1581.6374.2893.07
CNN76.3077.0776.6892.3261.9674.1594.87
MLP61.6372.4266.5987.5457.9069.7093.36
MLC74.8365.7169.9763.7280.2271.0293.50
Table 16. IOU results of GF-6 WFV and Sentinel-2A data using different methods.
Test AreaImageryMethodIOU (%)
Winter WheatRape
NorthernGF-6 WFVCNN91.3812.5
MLP90.531.30
MLC89.540.10
CNN92.3020.00
MLP91.770.98
MLC84.940.45
CNN89.674.55
MLP88.141.56
MLC82.060.12
Sentinel-2ACNN87.664.52
MLP85.173.52
MLC73.500.53
CNN88.966.49
MLP87.205.30
MLC71.980.28
CNN88.4611.97
MLP87.897.58
MLC77.485.92
CentralGF-6 WFVCNN85.2877.08
MLP80.9275.16
MLC56.2665.31
CNN90.4183.45
MLP82.3272.51
MLC66.7374.47
CNN64.4973.98
MLP56.3670.07
MLC36.6573.53
Sentinel-2ACNN86.3785.06
MLP81.9977.98
MLC75.3852.76
CNN82.9278.71
MLP79.8474.03
MLC62.3454.97
CNN68.3579.86
MLP60.2773.81
MLC55.7467.30
SouthernGF-6 WFVCNN47.5872.70
MLP31.2664.14
MLC27.0468.07
CNN73.3360.48
MLP67.3060.01
MLC73.1166.44
CNN64.8350.37
MLP54.2548.28
MLC62.9055.64
Sentinel-2ACNN59.4875.72
MLP42.6073.17
MLC40.1274.72
CNN65.9765.47
MLP56.5262.04
MLC55.3659.09
CNN62.1858.92
MLP49.9153.49
MLC53.8255.06
Table 17. Landscape fragmentation statistics.
Test AreaGF-6 WFVSentinel-2A
L i (pcs) A i (ha) C i (pcs/ha) L i (pcs) A i (ha) C i (pcs/ha)
Northern1261216.100.10361261127.570.1117
831269.610.06542521119.340.2251
1071340.440.07983941169.140.3370
Central413685.750.6023737624.561.1813
3761021.720.3680711916.280.7760
174228.890.7602506263.861.9177
Southern234282.090.8295448295.091.5182
120230.680.5202351263.961.3297
222177.431.2512379143.522.6407
Disclaimer/Publisher’s Note: The statements, opinions and data contained in all publications are solely those of the individual author(s) and contributor(s) and not of MDPI and/or the editor(s). MDPI and/or the editor(s) disclaim responsibility for any injury to people or property resulting from any ideas, methods, instructions or products referred to in the content.

