
Using Artificial Neural Networks to Assess Earthquake Vulnerability in Urban Blocks of Tehran
 , and
, and 
Abstract
:
1. Introduction
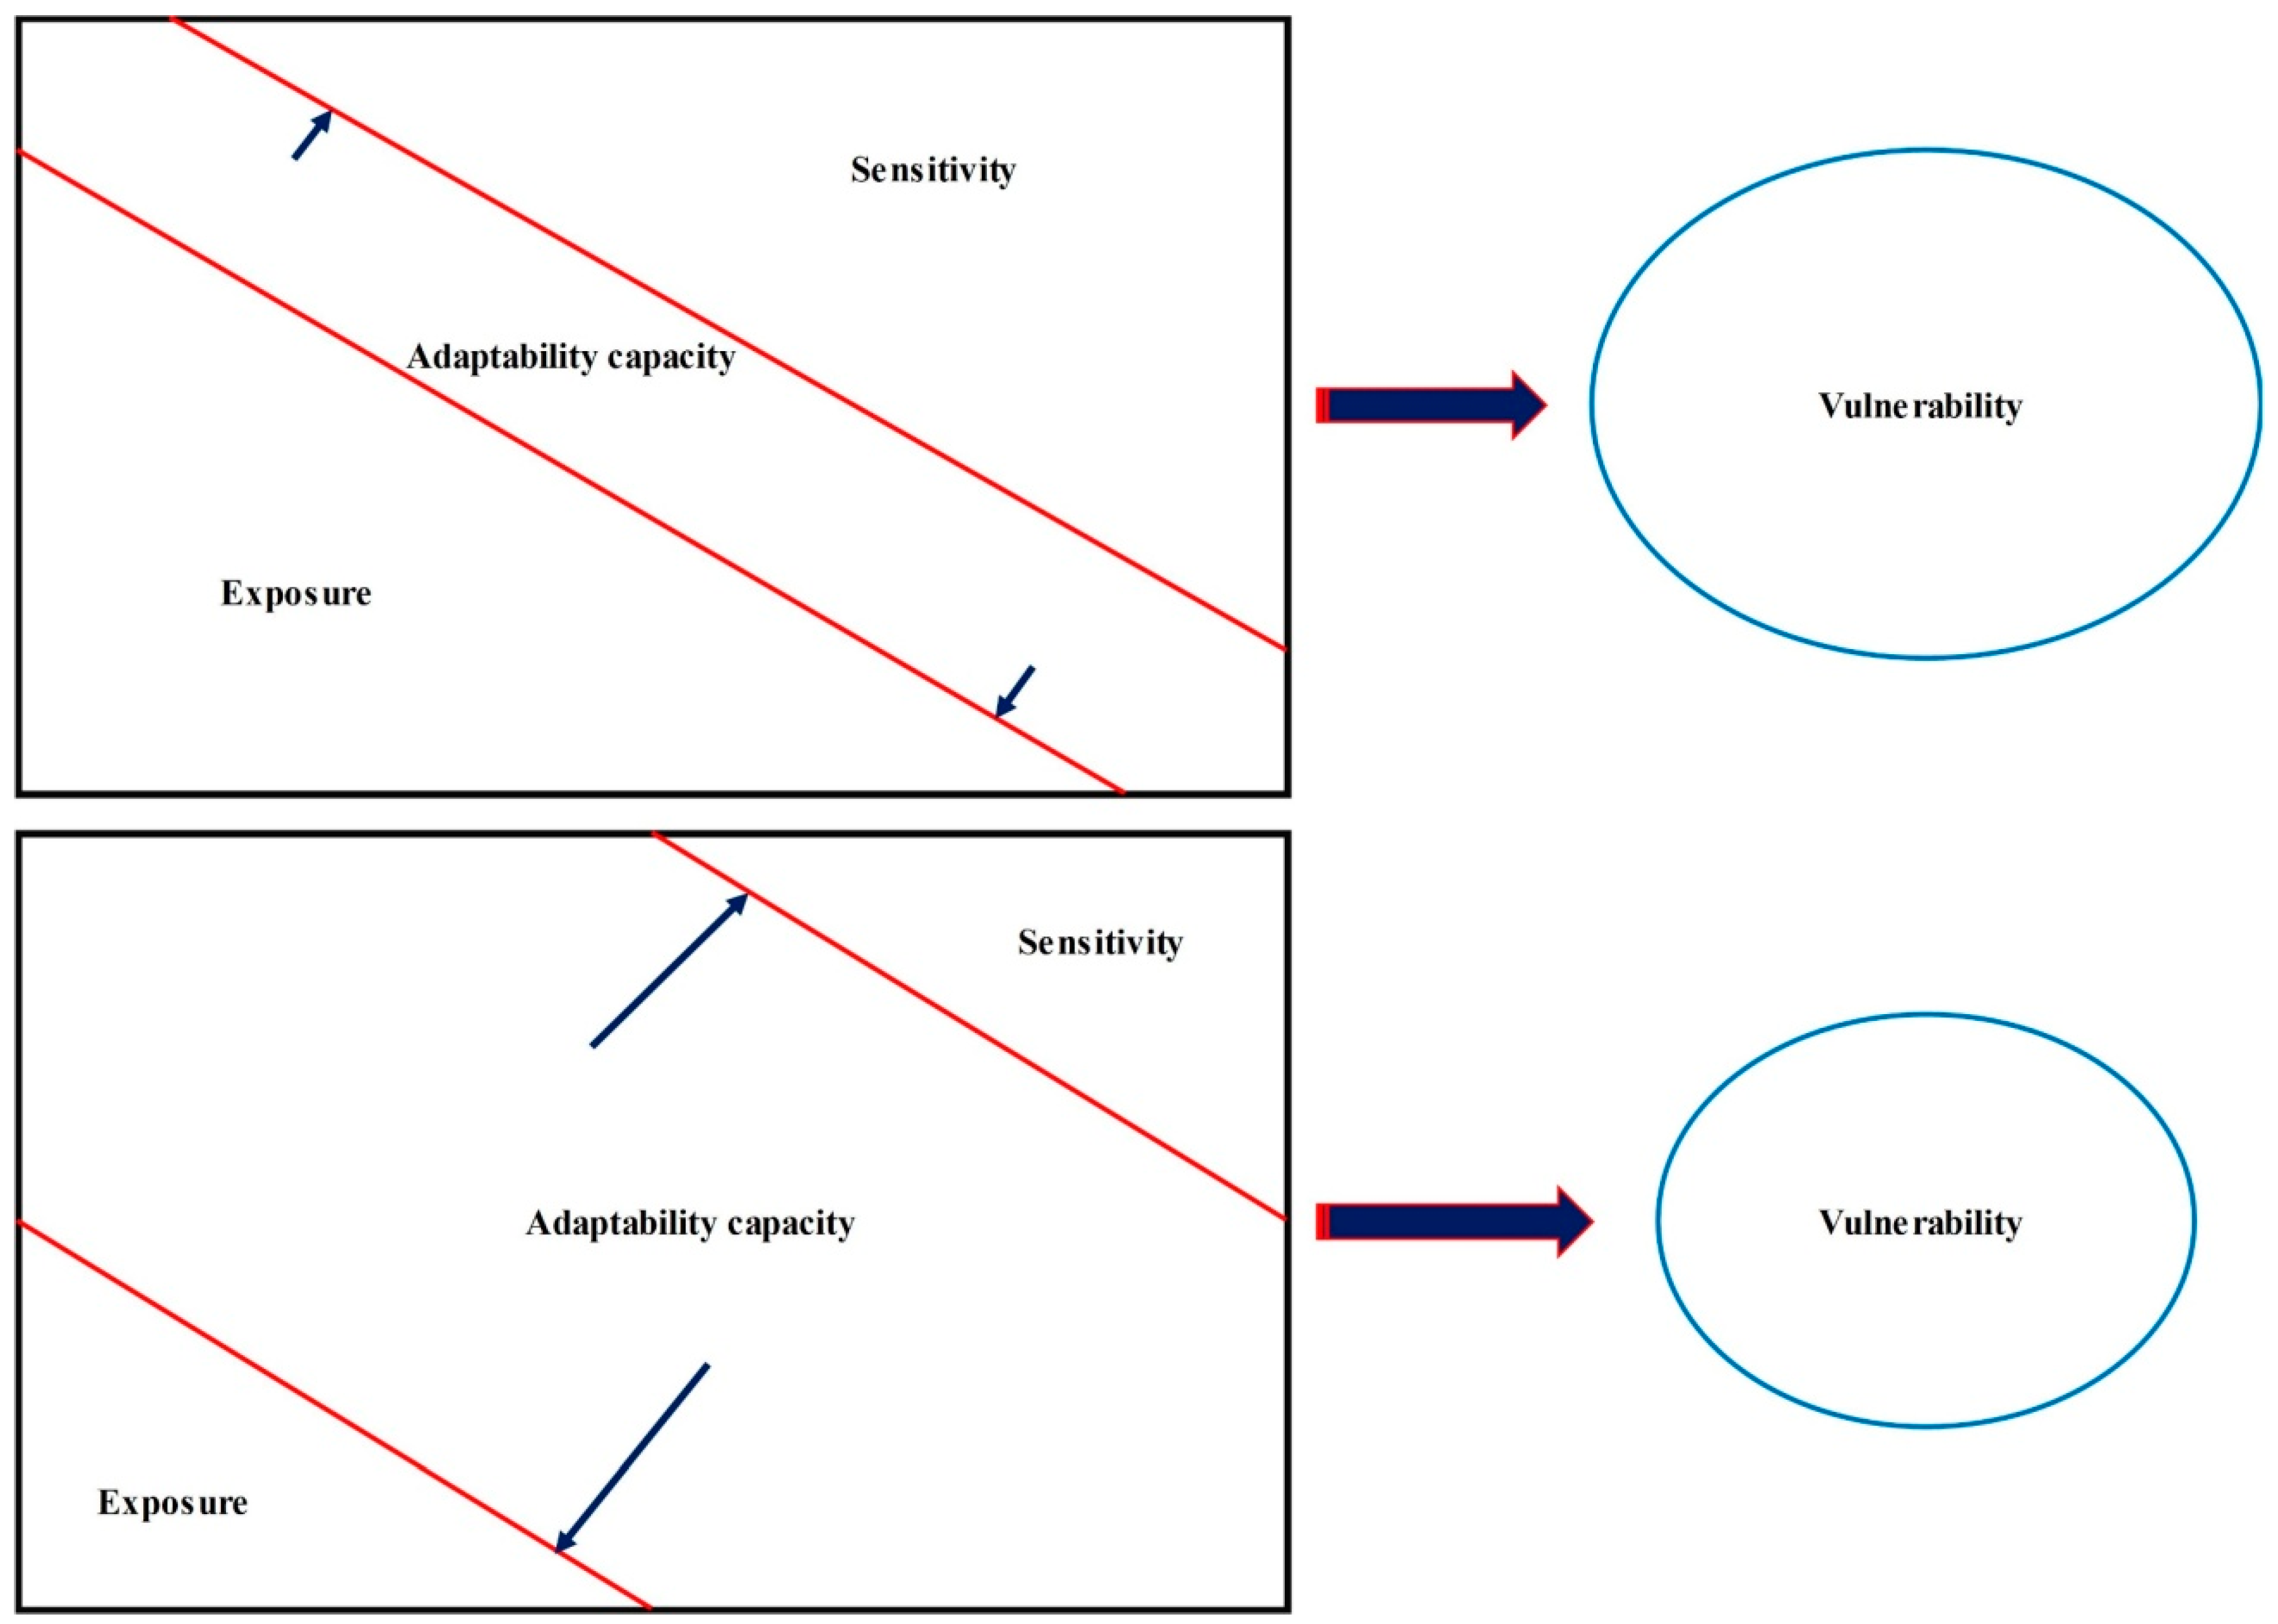
2. Vulnerability: Concept and Mapping
3. Materials and Methods
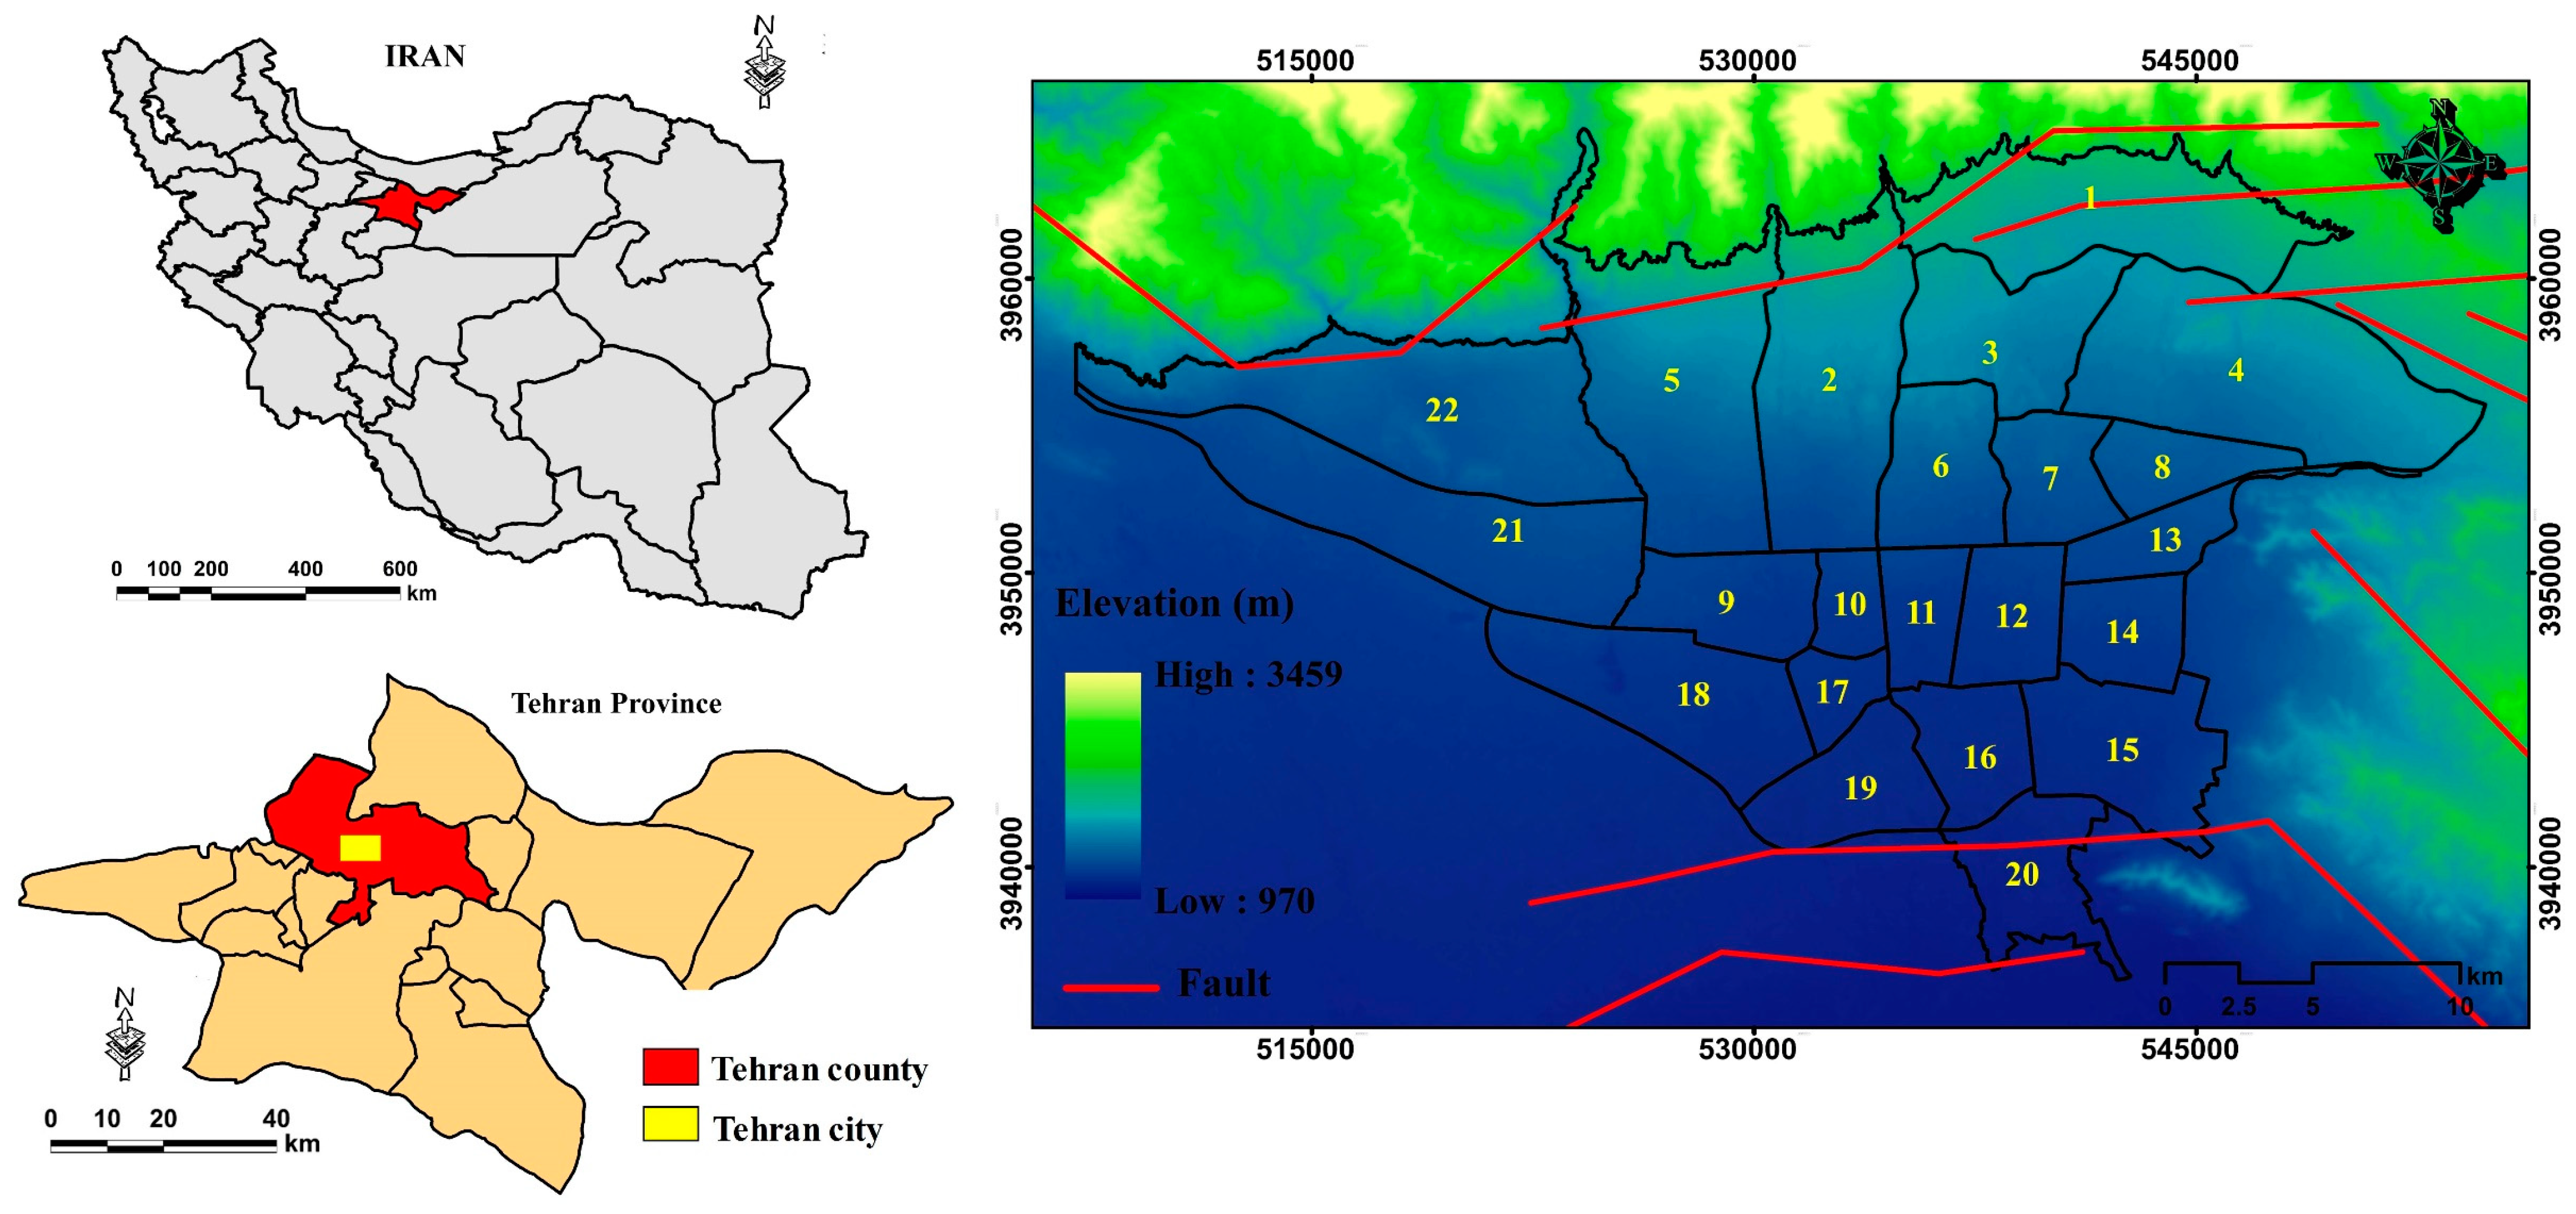
3.1. Study Area and Data
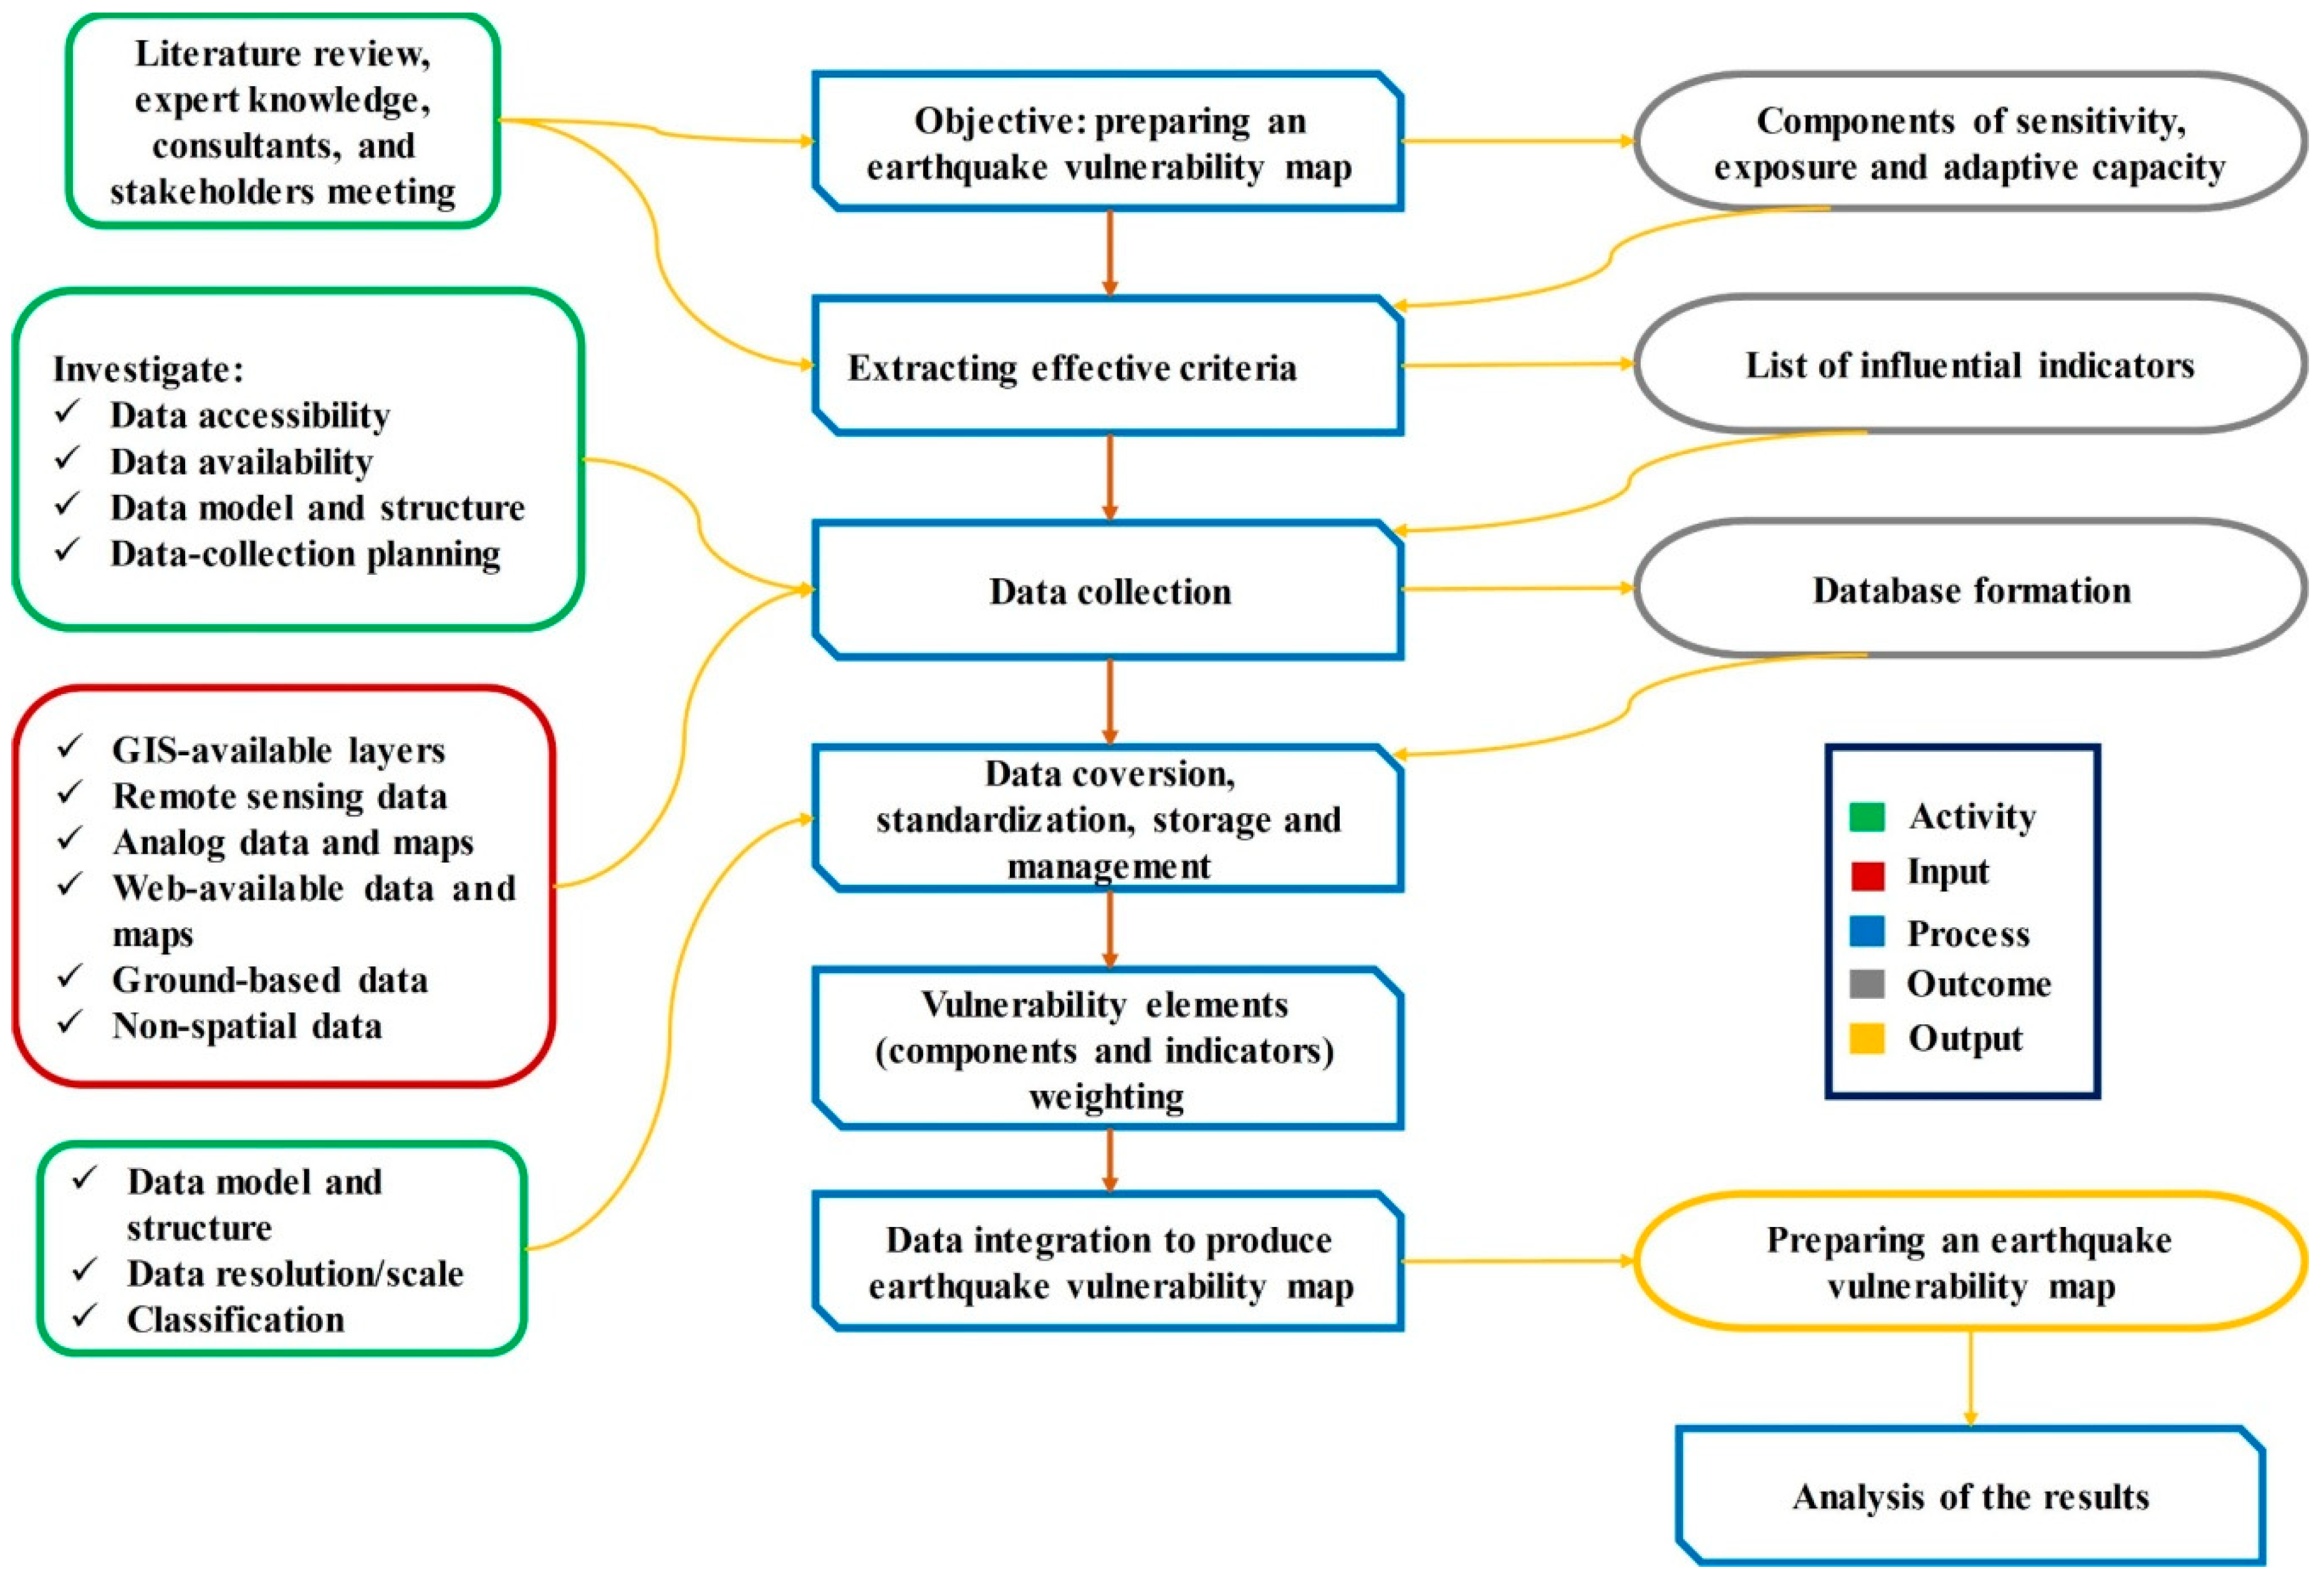
3.2. Methodology
3.2.1. ANP
- Making a research network diagram: In this step, the problem should be divided into criterion levels and sub-criteria and options, if any, and the relationships between them should be identified.
- Forming the matrix of paired comparisons: In this step, elements at each level are compared in a pairwise manner to other elements at a higher level, and matrices of paired comparisons are generated. Moreover, in the end, a pairwise comparison of internal relationships should be made.
- Calculating the inconsistency rate: In this step, we calculate the ANP inconsistency rate. If this rate is less than 0.1, the matrix appears consistent.
- Forming the initial super matrix: The initial super matrix is formed by using the weights of the pairwise comparisons obtained in step 2.
- Creation of a balanced super matrix: The balanced super matrix must be created after the initial matrix has been created.
- Creation of the limit super matrix: The balanced super matrix must be raised to the maximum power so that each row converges to a number, and that number is the weight of the criterion or option.
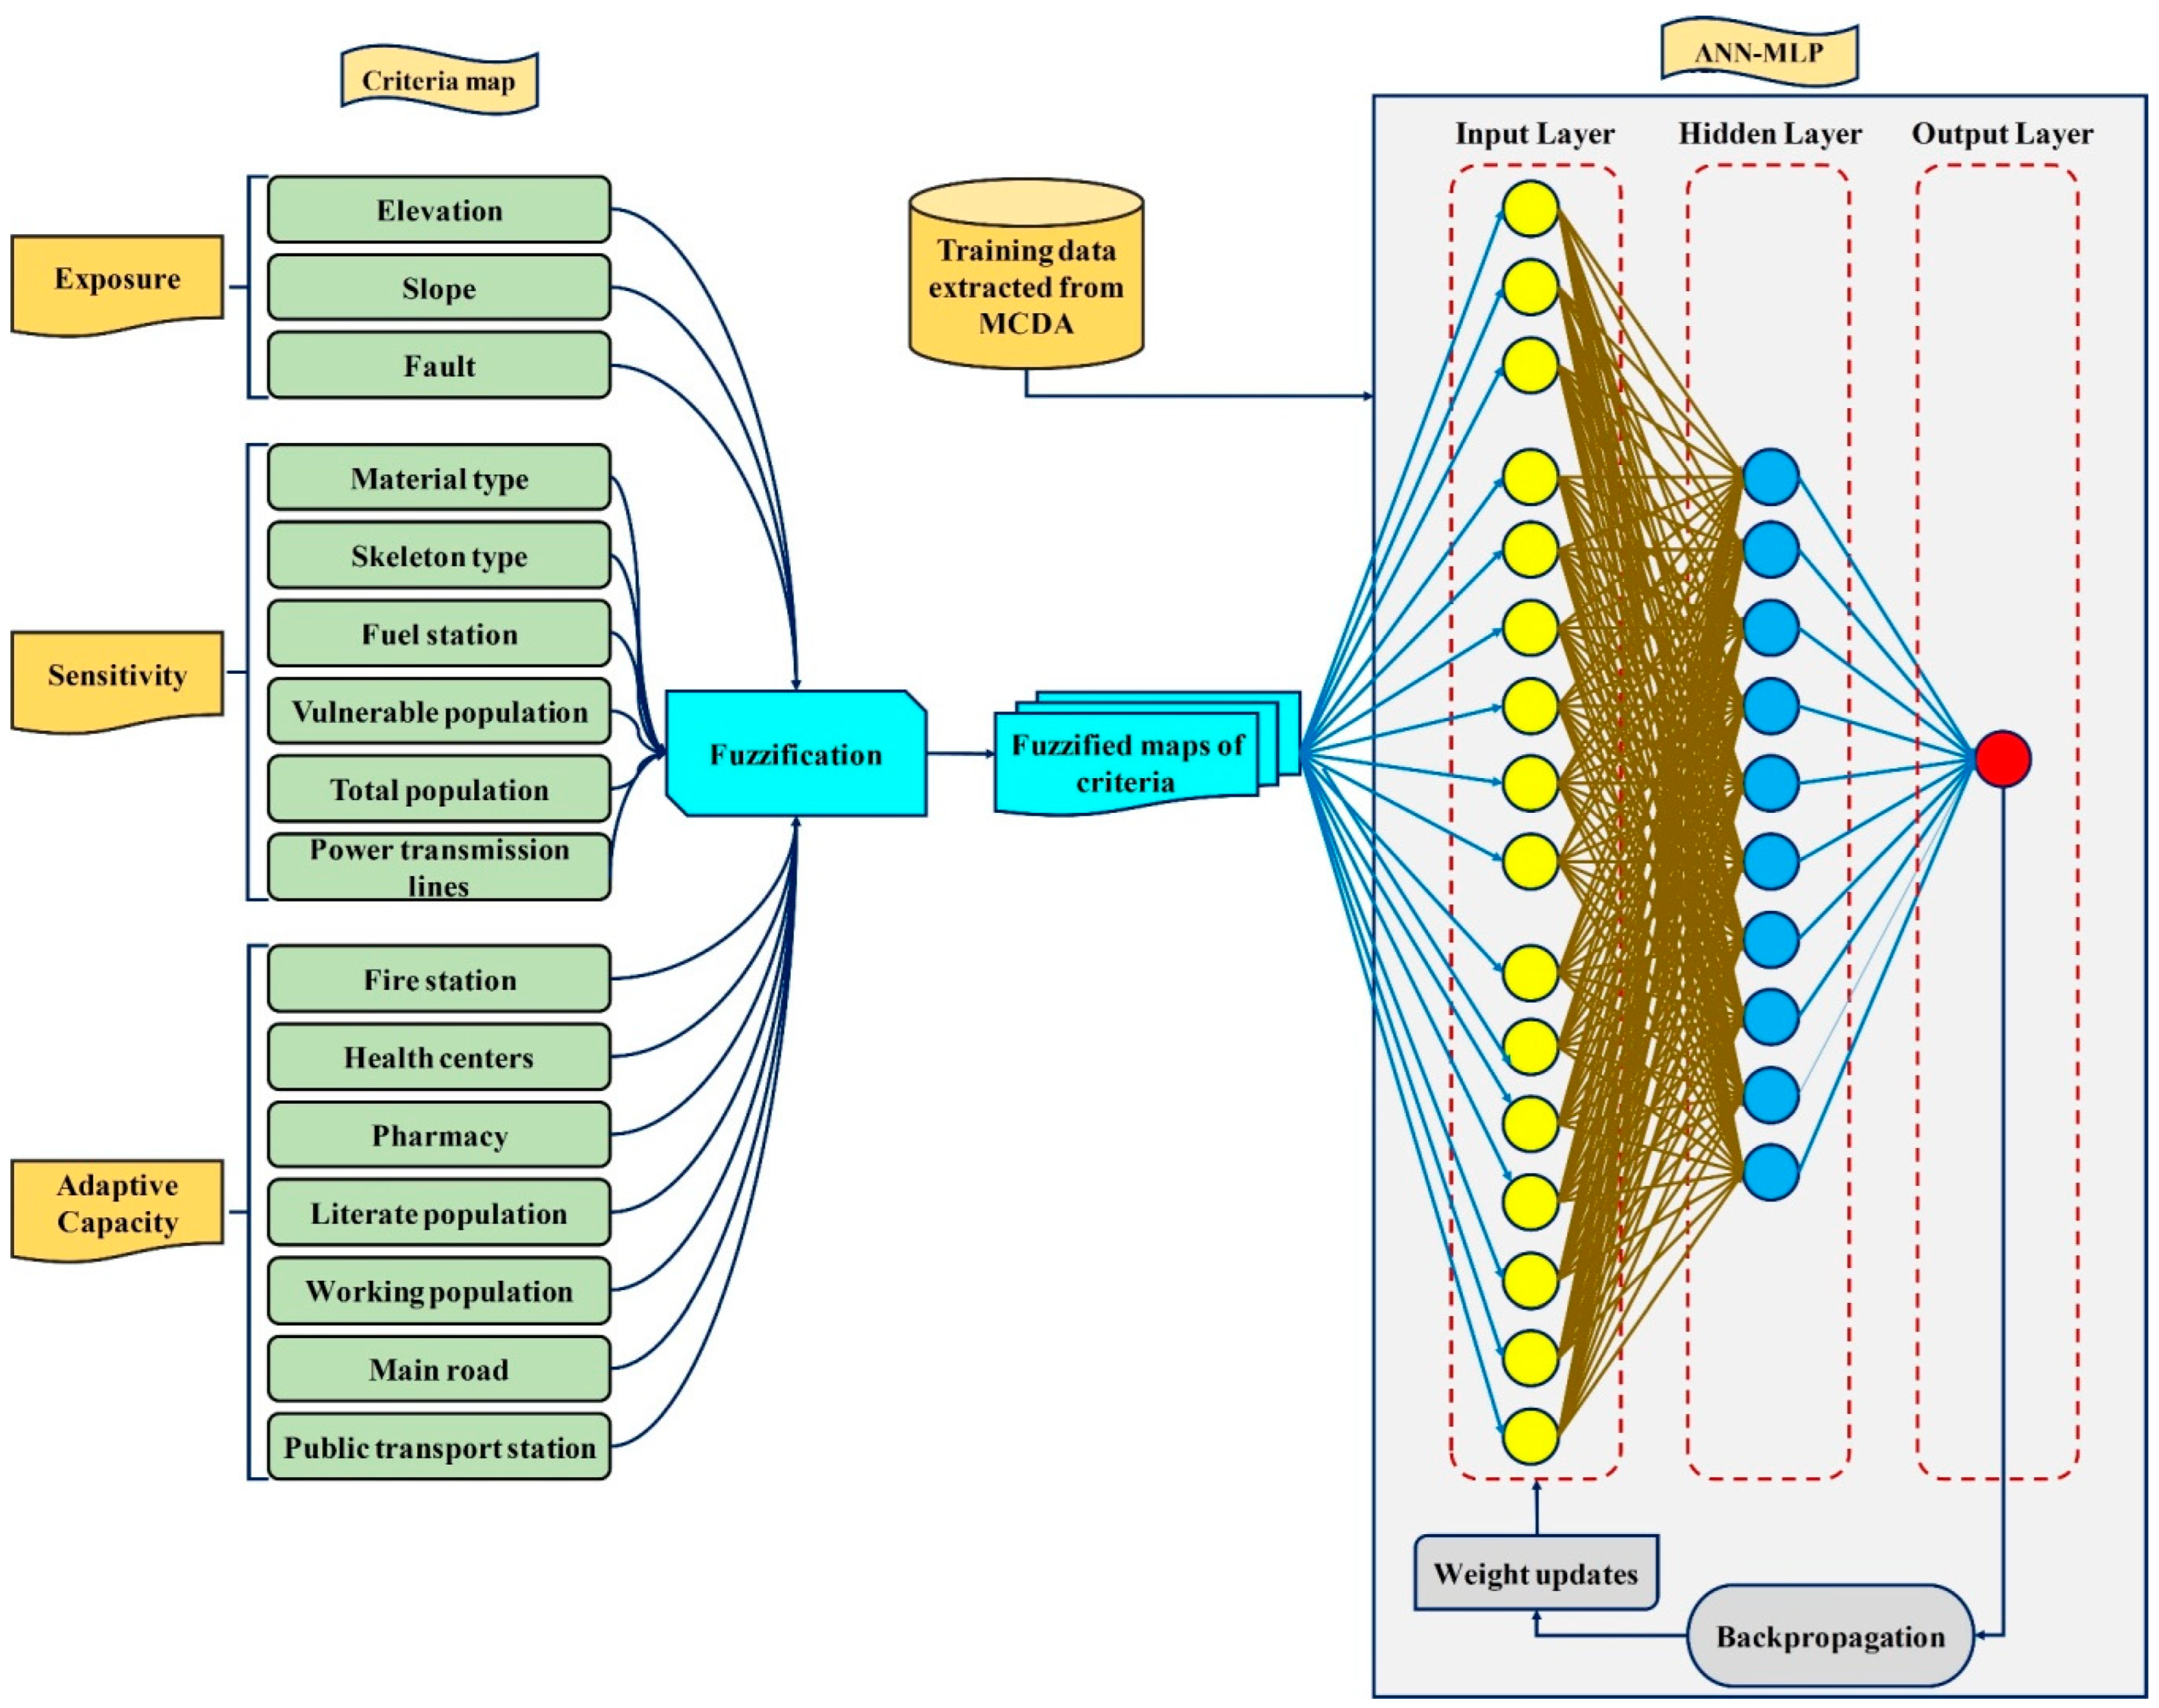
3.2.2. Fuzzification
3.2.3. ANN
3.2.4. Network Training and Hidden Layers
4. Results
5. Discussion
6. Conclusions
Author Contributions
Funding
Data Availability Statement
Acknowledgments
Conflicts of Interest
References
- Delavar, M.R.; Sadrykia, M. Assessment of enhanced Dempster-Shafer theory for uncertainty modeling in a GIS-based seismic vulnerability assessment model, case study—Tabriz city. ISPRS Int. J. Geo-Inf. 2020, 9, 195. [Google Scholar] [CrossRef] [Green Version]
- Yariyan, P.; Zabihi, H.; Wolf, I.D.; Karami, M.; Amiriyan, S. Earthquake risk assessment using an integrated Fuzzy Analytic Hierarchy Process with Artificial Neural Networks based on GIS: A case study of Sanandaj in Iran. Int. J. Disaster Risk Reduct. 2020, 50, 101705. [Google Scholar] [CrossRef]
- Cruz-Milán, O.; Simpson, J.J.; Simpson, P.M.; Choi, W. Reassurance or reason for concern: Security forces as a crisis management strategy. Tour. Manag. 2016, 56, 114–125. [Google Scholar] [CrossRef]
- Zhang, J.; Jia, Z. The study on assessment index of urban social vulnerability to earthquake disaster. Technol. Guide 2010, 36, 12–14. [Google Scholar]
- Leggieri, V.; Mastrodonato, G.; Uva, G. GIS Multisource Data for the Seismic Vulnerability Assessment of Buildings at the Urban Scale. Buildings 2022, 12, 523. [Google Scholar] [CrossRef]
- Zebardast, E. Constructing a social vulnerability index to earthquake hazards using a hybrid factor analysis and analytic network process (F’ANP) model. Nat. Hazards 2013, 65, 1331–1359. [Google Scholar] [CrossRef]
- Omidvar, B.; Gatmiri, B.; Derakhshan, S. Experimental vulnerability curves for the residential buildings of Iran. Nat. Hazards 2012, 60, 345–365. [Google Scholar] [CrossRef]
- Barbat, A.H.; Carreño, M.L.; Pujades, L.G.; Lantada, N.; Cardona, O.D.; Marulanda, M.C. Seismic vulnerability and risk evaluation methods for urban areas. A review with application to a pilot area. Struct. Infrastruct. Eng. 2010, 6, 17–38. [Google Scholar] [CrossRef]
- Karimzadeh, S.; Feizizadeh, B.; Matsuoka, M. From a GIS-based hybrid site condition map to an earthquake damage assessment in Iran: Methods and trends. Int. J. Disaster Risk Reduct. 2017, 22, 23–36. [Google Scholar] [CrossRef]
- Ghajari, Y.E.; Alesheikh, A.A.; Modiri, M.; Hosnavi, R.; Abbasi, M.; Sharifi, A. Urban vulnerability under various blast loading scenarios: Analysis using GIS-based multi-criteria decision analysis techniques. Cities 2018, 72, 102–114. [Google Scholar] [CrossRef]
- López, E.; Bocco, G.; Mendoza, M.; Duhau, E. Predicting land-cover and land-use change in the urban fringe: A case in Morelia city, Mexico. Landsc. Urban Plan. 2001, 55, 271–285. [Google Scholar] [CrossRef]
- Alizadeh, M.; Alizadeh, E.; Asadollahpour Kotenaee, S.; Shahabi, H.; Beiranvand Pour, A.; Panahi, M.; Bin Ahmad, B.; Saro, L. Social vulnerability assessment using artificial neural network (ANN) model for earthquake hazard in Tabriz city, Iran. Sustainability 2018, 10, 3376. [Google Scholar] [CrossRef] [Green Version]
- Shorabeh, S.N.; Firozjaei, M.K.; Nematollahi, O.; Firozjaei, H.K.; Jelokhani-Niaraki, M. A risk-based multi-criteria spatial decision analysis for solar power plant site selection in different climates: A case study in Iran. Renew. Energy 2019, 143, 958–973. [Google Scholar] [CrossRef]
- Afsari, R.; Nadizadeh Shorabeh, S.; Kouhnavard, M.; Homaee, M.; Arsanjani, J.J. A spatial decision support approach for flood vulnerability analysis in urban areas: A case study of Tehran. ISPRS Int. J. Geo-Inf. 2022, 11, 380. [Google Scholar] [CrossRef]
- Qureshi, S.; Shorabeh, S.N.; Samany, N.N.; Minaei, F.; Homaee, M.; Nickravesh, F.; Firozjaei, M.K.; Arsanjani, J.J. A new integrated approach for municipal landfill siting based on urban physical growth prediction: A case study mashhad metropolis in Iran. Remote Sens. 2021, 13, 949. [Google Scholar] [CrossRef]
- Shahpari Sani, D.; Heidari, M.T.; Tahmasebi Mogaddam, H.; Nadizadeh Shorabeh, S.; Yousefvand, S.; Karmpour, A.; Jokar Arsanjani, J. An Assessment of Social Resilience against Natural Hazards through Multi-Criteria Decision Making in Geographical Setting: A Case Study of Sarpol-e Zahab, Iran. Sustainability 2022, 14, 8304. [Google Scholar] [CrossRef]
- Firozjaei, M.K.; Nematollahi, O.; Mijani, N.; Shorabeh, S.N.; Firozjaei, H.K.; Toomanian, A. An integrated GIS-based Ordered Weighted Averaging analysis for solar energy evaluation in Iran: Current conditions and future planning. Renew. Energy 2019, 136, 1130–1146. [Google Scholar] [CrossRef]
- Shorabeh, S.N.; Varnaseri, A.; Firozjaei, M.K.; Nickravesh, F.; Samany, N.N. Spatial modeling of areas suitable for public libraries construction by integration of GIS and multi-attribute decision making: Case study Tehran, Iran. Libr. Inf. Sci. Res. 2020, 42, 101017. [Google Scholar] [CrossRef]
- Yeo, I.-A.; Yee, J.-J. A proposal for a site location planning model of environmentally friendly urban energy supply plants using an environment and energy geographical information system (E-GIS) database (DB) and an artificial neural network (ANN). Appl. Energy 2014, 119, 99–117. [Google Scholar] [CrossRef]
- Fu, H.-P.; Yeh, H.-P.; Chang, T.-H.; Teng, Y.-H.; Tsai, C.-C. Applying ANN and TM to build a prediction model for the site selection of a convenience store. Appl. Sci. 2022, 12, 3036. [Google Scholar] [CrossRef]
- Nadizadeh Shorabeh, S.; Hamzeh, S.; Zanganeh Shahraki, S.; Firozjaei, M.K.; Jokar Arsanjani, J. Modelling the intensity of surface urban heat island and predicting the emerging patterns: Landsat multi-temporal images and Tehran as case study. Int. J. Remote Sens. 2020, 41, 7400–7426. [Google Scholar] [CrossRef]
- Dianati Tilaki, G.A.; Ahmadi Jolandan, M.; Gholami, V. Rangelands production modeling using an artificial neural network (ANN) and geographic information system (GIS) in Baladeh rangelands, North Iran. Casp. J. Environ. Sci. 2020, 18, 277–290. [Google Scholar]
- Lee, S.; Hong, S.-M.; Jung, H.-S. GIS-based groundwater potential mapping using artificial neural network and support vector machine models: The case of Boryeong city in Korea. Geocarto Int. 2018, 33, 847–861. [Google Scholar] [CrossRef]
- Taormina, R.; Chau, K.-W.; Sivakumar, B. Neural network river forecasting through baseflow separation and binary-coded swarm optimization. J. Hydrol. 2015, 529, 1788–1797. [Google Scholar] [CrossRef]
- Aradag, S.; Genc, Y.; Turk, C. Comparative gasketed plate heat exchanger performance prediction with computations, experiments, correlations and artificial neural network estimations. Eng. Appl. Comput. Fluid Mech. 2017, 11, 467–482. [Google Scholar] [CrossRef] [Green Version]
- Islam, M.S.; Mohandes, M.; Rehman, S. Vertical extrapolation of wind speed using artificial neural network hybrid system. Neural Comput. Appl. 2017, 28, 2351–2361. [Google Scholar] [CrossRef]
- Liang, Z.; Shan, S.; Liu, X.; Wen, Y. Fuzzy prediction of AWJ turbulence characteristics by using typical multi-phase flow models. Eng. Appl. Comput. Fluid Mech. 2017, 11, 225–257. [Google Scholar] [CrossRef] [Green Version]
- Mokarram, M.; Pourghasemi, H.R.; Mokarram, M.J. A multi-criteria GIS-based model for wind farm site selection with the least impact on environmental pollution using the OWA-ANP method. Environ. Sci. Pollut. Res. 2022, 29, 43891–43912. [Google Scholar] [CrossRef]
- Nasehi, S.; Karimi, S.; Jafari, H. Application of fuzzy GIS and ANP for wind power plant site selection in East Azerbaijan Province of Iran. Comput. Res. Prog. Appl. Sci. Eng. 2016, 2, 116–124. [Google Scholar]
- Shorabeh, S.N.; Argany, M.; Rabiei, J.; Firozjaei, H.K.; Nematollahi, O. Potential assessment of multi-renewable energy farms establishment using spatial multi-criteria decision analysis: A case study and mapping in Iran. J. Clean. Prod. 2021, 295, 126318. [Google Scholar] [CrossRef]
- Lee, H.; Kim, M.-S.; Park, Y. An analytic network process approach to operationalization of five forces model. Appl. Math. Model. 2012, 36, 1783–1795. [Google Scholar] [CrossRef] [Green Version]
- Alam, M.S.; Haque, S.M. Multi-dimensional earthquake vulnerability assessment of residential neighborhoods of Mymensingh City, Bangladesh: A spatial multi-criteria analysis based approach. J. Urban Manag. 2022, 11, 37–58. [Google Scholar] [CrossRef]
- Yavuz Kumlu, K.B.; Tüdeş, Ş. Determination of earthquake-risky areas in Yalova City Center (Marmara region, Turkey) using GIS-based multicriteria decision-making techniques (analytical hierarchy process and technique for order preference by similarity to ideal solution). Nat. Hazards 2019, 96, 999–1018. [Google Scholar] [CrossRef]
- Khedmatzadeh, A.; Mousavi, M.; Yousefzadeh, A. Analysis of Urban Vulnerability Indexes with the Approach Seismic Disaster Management Using Fuzzy Network Analysis Process (FANP) (Case study: Urmia city). J. Stud. Hum. Settl. Plan. 2021, 16, 43–62. [Google Scholar]
- Heidarifar, M.R.; Mahmoudi, A. Analysis of Javanrud Urban land use vulnerability to earthquake, using network analysis (ANP) and geographic information system (GIS). Hum. Geogr. Res. 2021, 53, 119–137. [Google Scholar]
- Alizadeh, M.; Ngah, I.; Hashim, M.; Pradhan, B.; Pour, A.B. A hybrid analytic network process and artificial neural network (ANP-ANN) model for urban earthquake vulnerability assessment. Remote Sens. 2018, 10, 975. [Google Scholar] [CrossRef] [Green Version]
- Jena, R.; Pradhan, B. Integrated ANN-cross-validation and AHP-TOPSIS model to improve earthquake risk assessment. Int. J. Disaster Risk Reduct. 2020, 50, 101723. [Google Scholar] [CrossRef]
- Kalakonas, P.; Silva, V. Seismic vulnerability modelling of building portfolios using artificial neural networks. Earthq. Eng. Struct. Dyn. 2022, 51, 310–327. [Google Scholar] [CrossRef]
- Dow, K. Exploring differences in our common future(s): The meaning of vulnerability to global environmental change. Geoforum 1992, 23, 417–436. [Google Scholar] [CrossRef]
- Adger, W.N. Social vulnerability to climate change and extremes in coastal Vietnam. World Dev. 1999, 27, 249–269. [Google Scholar] [CrossRef]
- Kelly, P.M.; Adger, W.N. Theory and practice in assessing vulnerability to climate change andFacilitating adaptation. Clim. Change 2000, 47, 325–352. [Google Scholar] [CrossRef]
- Alwang, J.; Siegel, P.B.; Jorgensen, S.L. Vulnerability: A View from Different Disciplines; Social Protection Discussion Paper Series; The World Bank: Washington, DC, USA, 2001. [Google Scholar]
- Downing, T.E.; Patwardhan, A.; Klien, R.; Mukhala, E.; Stephen, L.; Winograd, M.; Ziervogel, G. Vulnerability assessment for climate adaptation. APF Tech. Pap. 2003, 3. [Google Scholar]
- Füssel, H.-M.; Klein, R.J. Climate change vulnerability assessments: An evolution of conceptual thinking. Clim. Change 2006, 75, 301–329. [Google Scholar] [CrossRef]
- Cutter, S.L.; Emrich, C.T.; Webb, J.J.; Morath, D. Social vulnerability to climate variability hazards: A review of the literature. Final Rep. Oxfam Am. 2009, 5, 1–44. [Google Scholar]
- Pearson, L.J.; Nelson, R.; Crimp, S.; Langridge, J. Interpretive review of conceptual frameworks and research models that inform Australia’s agricultural vulnerability to climate change. Environ. Model. Softw. 2011, 26, 113–123. [Google Scholar] [CrossRef]
- Fellmann, T. The assessment of climate change-related vulnerability in the agricultural sector: Reviewing conceptual frameworks. In Building Resilience for Adaptation to Climate Change in the Agriculture Sector, Proceedings of a Joint FAO/OECD Workshop, Rome, Italy, 23–24 April 2012; FAO: Rome, Italy, 2012; Volume 23, p. 37. [Google Scholar]
- Adger, W.N.; Kelly, P.M. Social vulnerability to climate change and the architecture of entitlements. Mitig. Adapt. Strateg. Glob. Change 1999, 4, 253–266. [Google Scholar] [CrossRef]
- Pritchett, L.; Suryahadi, A.; Sumarto, S. Quantifying Vulnerability to Poverty: A Proposed Measure, Applied to Indonesia; World Bank Publications: Washington, DC, USA, 2000. [Google Scholar]
- Turner, B.L.; Kasperson, R.E.; Matson, P.A.; McCarthy, J.J.; Corell, R.W.; Christensen, L.; Eckley, N.; Kasperson, J.X.; Luers, A.; Martello, M.L. A framework for vulnerability analysis in sustainability science. Proc. Natl. Acad. Sci. USA 2003, 100, 8074–8079. [Google Scholar] [CrossRef] [Green Version]
- Brooks, N. Vulnerability, Risk and Adaptation: A Conceptual Framework; Tyndall Centre for Climate Change Research Working Paper; Tyndall Centre for Climate Change Research: Norwich, UK, 2003; Volume 38, pp. 1–16. [Google Scholar]
- Cutter, S.L.; Boruff, B.J.; Shirley, W.L. Social vulnerability to environmental hazards. In Hazards Vulnerability and Environmental Justice; Routledge: London, UK, 2012; pp. 143–160. [Google Scholar]
- Schröter, D.; Polsky, C.; Patt, A.G. Assessing vulnerabilities to the effects of global change: An eight step approach. Mitig. Adapt. Strateg. Glob. Change 2005, 10, 573–595. [Google Scholar] [CrossRef]
- Füssel, H.-M. Vulnerability: A generally applicable conceptual framework for climate change research. Glob. Environ. Change 2007, 17, 155–167. [Google Scholar] [CrossRef]
- Polsky, C.; Neff, R.; Yarnal, B. Building comparable global change vulnerability assessments: The vulnerability scoping diagram. Glob. Environ. Change 2007, 17, 472–485. [Google Scholar] [CrossRef]
- Moreno, A.; Becken, S. A climate change vulnerability assessment methodology for coastal tourism. J. Sustain. Tour. 2009, 17, 473–488. [Google Scholar] [CrossRef]
- Cinner, J.E.; McClanahan, T.R.; Graham, N.A.; Daw, T.M.; Maina, J.; Stead, S.M.; Wamukota, A.; Brown, K.; Bodin, Ö. Vulnerability of coastal communities to key impacts of climate change on coral reef fisheries. Glob. Environ. Change 2012, 22, 12–20. [Google Scholar] [CrossRef]
- United Nation International Strategy for Disaster Reduction. Living with Risk; United Nation International Strategy for Disaster Risk Reduction: Geneva, Switzerland, 2004. [Google Scholar]
- United Nations Development Programme Bureau for Crisis Prevention and Recovery. Reducing Disaster Risk: A Challenge for Development—A Global Report; United Nations: New York, NY, USA, 2004. [Google Scholar]
- Muris, P.; Schmidt, H.; Lambrichs, R.; Meesters, C. Protective and vulnerability factors of depression in normal adolescents. Behav. Res. Ther. 2001, 39, 555–565. [Google Scholar] [CrossRef]
- Antypa, N.; Verkuil, B.; Molendijk, M.; Schoevers, R.; Penninx, B.W.; Van Der Does, W. Associations between chronotypes and psychological vulnerability factors of depression. Chronobiol. Int. 2017, 34, 1125–1135. [Google Scholar] [CrossRef] [PubMed] [Green Version]
- Smit, B.; Wandel, J. Adaptation, adaptive capacity and vulnerability. Glob. Environ. Change 2006, 16, 282–292. [Google Scholar] [CrossRef]
- Pearce, T.; Smit, B.; Duerden, F.; Ford, J.D.; Goose, A.; Kataoyak, F. Inuit vulnerability and adaptive capacity to climate change in Ulukhaktok, Northwest Territories, Canada. Polar Rec. 2010, 46, 157–177. [Google Scholar] [CrossRef] [Green Version]
- Lindner, M.; Maroschek, M.; Netherer, S.; Kremer, A.; Barbati, A.; Garcia-Gonzalo, J.; Seidl, R.; Delzon, S.; Corona, P.; Kolström, M. Climate change impacts, adaptive capacity, and vulnerability of European forest ecosystems. For. Ecol. Manag. 2010, 259, 698–709. [Google Scholar] [CrossRef]
- Engle, N.L. Adaptive capacity and its assessment. Glob. Environ. Change 2011, 21, 647–656. [Google Scholar] [CrossRef]
- Moradi, M.; Delavar, M.R.; Moshiri, B. A GIS-based multi-criteria analysis model for earthquake vulnerability assessment using Choquet integral and game theory. Nat. Hazards 2017, 87, 1377–1398. [Google Scholar] [CrossRef]
- Ashtari, M.; Hatzfeld, D.; Kamalian, N. Microseismicity in the region of Tehran. Tectonophysics 2005, 395, 193–208. [Google Scholar] [CrossRef]
- Talebian, M.; Copley, A.; Fattahi, M.; Ghorashi, M.; Jackson, J.; Nazari, H.; Sloan, R.; Walker, R. Active faulting within a megacity: The geometry and slip rate of the Pardisan thrust in central Tehran, Iran. Geophys. J. Int. 2016, 207, 1688–1699. [Google Scholar] [CrossRef] [Green Version]
- Hessami, K.; Jamali, F. Explanatory notes to the map of major active faults of Iran. J. Seismol. Earthq. Eng. 2006, 8, 1–11. [Google Scholar]
- Asgary, A.; Levy, J.K.; Mehregan, N. Estimating willingness to pay for a hypothetical earthquake early warning systems. Environ. Hazards 2007, 7, 312–320. [Google Scholar] [CrossRef]
- Duzgun, H.; Yucemen, M.; Kalaycioglu, H.; Çelik, K.; Kemec, S.; Ertugay, K.; Deniz, A. An integrated earthquake vulnerability assessment framework for urban areas. Nat. Hazards 2011, 59, 917–947. [Google Scholar] [CrossRef]
- Yariyan, P.; Avand, M.; Soltani, F.; Ghorbanzadeh, O.; Blaschke, T. Earthquake vulnerability mapping using different hybrid models. Symmetry 2020, 12, 405. [Google Scholar] [CrossRef] [Green Version]
- Karimzadeh, S.; Miyajima, M.; Hassanzadeh, R.; Amiraslanzadeh, R.; Kamel, B. A GIS-based seismic hazard, building vulnerability and human loss assessment for the earthquake scenario in Tabriz. Soil Dyn. Earthq. Eng. 2014, 66, 263–280. [Google Scholar] [CrossRef]
- Yaghfouri, H.; Fotouhi, S.; Beheshtifar, J. Application of GIS in The Analysis of The Spatial Distribution and Localization of Pharmacies (case study: Pharmacies of Jahrom city). Res. Urban Plan. 2013, 4, 1–20. [Google Scholar]
- King, D.; MacGregor, C. Using social indicators to measure community vulnerability to natural hazards. Aust. J. Emerg. Manag. 2000, 15, 52–57. [Google Scholar]
- Kamelifar, M.J.; Rustei, S.; Ahadnejad, M.; Kamelifar, Z. The Assessment of road network vulnerability in formal and informal (slum) urban tissues to earthquake hazards with crisis management approach (Case study: Zone 1 Tabriz). J. Civ. Eng. Urban. 2013, 3, 380–385. [Google Scholar]
- Yin, L.; Zhu, J.; Li, W.; Wang, J. Vulnerability Analysis of Geographical Railway Network under Geological Hazard in China. ISPRS Int. J. Geo-Inf. 2022, 11, 342. [Google Scholar] [CrossRef]
- Yariyan, P.; Karami, M.; Abbaspour, R.A. Exploitation of MCDA to Learn the Radial Base Neural Network (RBFNN) aim physical and social vulnerability analysis versus the earthquake (case study: Sanandaj City, Iran). Int. Arch. Photogramm. Remote Sens. Spat. Inf. Sci. 2019, 42, 1071–1078. [Google Scholar] [CrossRef] [Green Version]
- Pachauri, A.; Pant, M. Landslide hazard mapping based on geological attributes. Eng. Geol. 1992, 32, 81–100. [Google Scholar] [CrossRef]
- Toro, J.; Duarte, O.; Requena, I.; Zamorano, M. Determining vulnerability importance in environmental impact assessment: The case of Colombia. Environ. Impact Assess. Rev. 2012, 32, 107–117. [Google Scholar] [CrossRef]
- Alizadeh, M.; Hashim, M.; Alizadeh, E.; Shahabi, H.; Karami, M.R.; Beiranvand Pour, A.; Pradhan, B.; Zabihi, H. Multi-criteria decision making (MCDM) model for seismic vulnerability assessment (SVA) of urban residential buildings. ISPRS Int. J. Geo-Inf. 2018, 7, 444. [Google Scholar] [CrossRef] [Green Version]
- Cole, G.L.; Dhakal, R.P.; Turner, F.M. Building pounding damage observed in the 2011 Christchurch earthquake. Earthq. Eng. Struct. Dyn. 2012, 41, 893–913. [Google Scholar] [CrossRef]
- Armaş, I.; Toma-Danila, D.; Ionescu, R.; Gavriş, A. Vulnerability to earthquake hazard: Bucharest case study, Romania. Int. J. Disaster Risk Sci. 2017, 8, 182–195. [Google Scholar] [CrossRef]
- Rahman, N.; Ansary, M.A.; Islam, I. GIS based mapping of vulnerability to earthquake and fire hazard in Dhaka city, Bangladesh. Int. J. Disaster Risk Reduct. 2015, 13, 291–300. [Google Scholar] [CrossRef]
- Raschke, M.; Bilis, E.; Kröger, W. Vulnerability of the Swiss electric power transmission grid against natural hazards. Appl. Stat. Probab. Civ. Eng. 2011, 1407–1414. [Google Scholar]
- Saaty, T.L. Decision Making with Dependence and Feedback: The Analytic Network Process; RWS Publications: Pittsburgh, PA, USA, 1996; Volume 4922. [Google Scholar]
- Laribi, M.; Mlika, A.; Romdhane, L.; Zeghloul, S. A combined genetic algorithm–fuzzy logic method (GA–FL) in mechanisms synthesis. Mech. Mach. Theory 2004, 39, 717–735. [Google Scholar] [CrossRef]
- Kao, S.-L.; Lee, K.-T.; Chang, K.-Y.; Ko, M.-D. A fuzzy logic method for collision avoidance in vessel traffic service. J. Navig. 2007, 60, 17–31. [Google Scholar] [CrossRef]
- Wang, S.-C. Artificial neural network. In Interdisciplinary Computing in Java Programming; Springer: Berlin/Heidelberg, Germany, 2003; pp. 81–100. [Google Scholar]
- Wu, Y.-C.; Feng, J.-W. Development and application of artificial neural network. Wirel. Pers. Commun. 2018, 102, 1645–1656. [Google Scholar] [CrossRef]
- Aditian, A.; Kubota, T.; Shinohara, Y. Comparison of GIS-based landslide susceptibility models using frequency ratio, logistic regression, and artificial neural network in a tertiary region of Ambon, Indonesia. Geomorphology 2018, 318, 101–111. [Google Scholar] [CrossRef]
- Mollalo, A.; Mao, L.; Rashidi, P.; Glass, G.E. A GIS-based artificial neural network model for spatial distribution of tuberculosis across the continental United States. Int. J. Environ. Res. Public Health 2019, 16, 157. [Google Scholar] [CrossRef] [PubMed] [Green Version]
- Khoirunisa, N.; Ku, C.-Y.; Liu, C.-Y. A GIS-based artificial neural network model for flood susceptibility assessment. Int. J. Environ. Res. Public Health 2021, 18, 1072. [Google Scholar] [CrossRef] [PubMed]
- Anwar, K.; Deshmukh, S. Assessment and mapping of solar energy potential using artificial neural network and GIS technology in the southern part of India. Int. J. Renew. Energy Res. IJRER 2018, 8, 974–985. [Google Scholar]
- Al-Sammarraie, N.A.; Al-Mayali, Y.M.H.; El-Ebiary, Y.A.B. Classification and diagnosis using back propagation Artificial Neural Networks (ANN). In Proceedings of the 2018 International Conference on Smart Computing and Electronic Enterprise (ICSCEE), Shah Alam, Malaysia, 11–12 July 2018; pp. 1–5. [Google Scholar]
- Thekkuden, D.T.; Mourad, A.-H.I. Investigation of feed-forward back propagation ANN using voltage signals for the early prediction of the welding defect. SN Appl. Sci. 2019, 1, 1–17. [Google Scholar] [CrossRef] [Green Version]
- Shrestha, A.; Fang, H.; Wu, Q.; Qiu, Q. Approximating back-propagation for a biologically plausible local learning rule in spiking neural networks. In Proceedings of the International Conference on Neuromorphic Systems, Knoxville, TN, USA, 23–25 July 2019; pp. 1–8. [Google Scholar]
- Khan, I.; Raja, M.A.Z.; Shoaib, M.; Kumam, P.; Alrabaiah, H.; Shah, Z.; Islam, S. Design of neural network with Levenberg-Marquardt and Bayesian regularization backpropagation for solving pantograph delay differential equations. IEEE Access 2020, 8, 137918–137933. [Google Scholar] [CrossRef]
- Bui, X.-N.; Muazu, M.A.; Nguyen, H. Optimizing Levenberg–Marquardt backpropagation technique in predicting factor of safety of slopes after two-dimensional OptumG2 analysis. Eng. Comput. 2020, 36, 941–952. [Google Scholar] [CrossRef]
- Uzair, M.; Jamil, N. Effects of hidden layers on the efficiency of neural networks. In Proceedings of the 2020 IEEE 23rd international multitopic conference (INMIC), Bahawalpur, Pakistan, 5–7 November 2020; pp. 1–6. [Google Scholar]
- Chu, Y.; Fei, J.; Hou, S. Adaptive global sliding-mode control for dynamic systems using double hidden layer recurrent neural network structure. IEEE Trans. Neural Netw. Learn. Syst. 2019, 31, 1297–1309. [Google Scholar] [CrossRef]
- Boloorani, A.D.; Shorabeh, S.N.; Samany, N.N.; Mousivand, A.; Kazemi, Y.; Jaafarzadeh, N.; Zahedi, A.; Rabiei, J. Vulnerability mapping and risk analysis of sand and dust storms in Ahvaz, IRAN. Environ. Pollut. 2021, 279, 116859. [Google Scholar] [CrossRef]
- Koutsourelakis, P.-S. Assessing structural vulnerability against earthquakes using multi-dimensional fragility surfaces: A Bayesian framework. Probabilistic Eng. Mech. 2010, 25, 49–60. [Google Scholar] [CrossRef]
- Bessason, B.; Bjarnason, J.Ö. Seismic vulnerability of low-rise residential buildings based on damage data from three earthquakes (Mw6. 5, 6.5 and 6.3). Eng. Struct. 2016, 111, 64–79. [Google Scholar] [CrossRef]
- Hashemi, M.; Alesheikh, A.; Malek, M. Zoning earthquake vulnerability using GIS (Case study: Tehran city). J. Environ. Sci. Technol. 2014, 16, 349–359. [Google Scholar]
- Moradi, M.; Delavar, M.R.; Moshiri, B. A GIS-based multi-criteria decision-making approach for seismic vulnerability assessment using quantifier-guided OWA operator: A case study of Tehran, Iran. Ann. GIS 2015, 21, 209–222. [Google Scholar] [CrossRef]
- Kamranzad, F.; Memarian, H.; Zare, M. Earthquake risk assessment for Tehran, Iran. ISPRS Int. J. Geo-Inf. 2020, 9, 430. [Google Scholar] [CrossRef]
- Nazmfar, H.; Saredeh, A.; Eshgi, A.; Feizizadeh, B. Vulnerability evaluation of urban buildings to various earthquake intensities: A case study of the municipal zone 9 of Tehran. Hum. Ecol. Risk Assess. Int. J. 2019, 25, 455–474. [Google Scholar] [CrossRef]
- Hajibabaee, M.; Amini-Hosseini, K.; Ghayamghamian, M. Earthquake risk assessment in urban fabrics based on physical, socioeconomic and response capacity parameters (a case study: Tehran city). Nat. Hazards 2014, 74, 2229–2250. [Google Scholar] [CrossRef]
- Rezaie, F.; Panahi, M. GIS modeling of seismic vulnerability of residential fabrics considering geotechnical, structural, social and physical distance indicators in Tehran using multi-criteria decision-making techniques. Nat. Hazards Earth Syst. Sci. 2015, 15, 461–474. [Google Scholar] [CrossRef] [Green Version]
- Niño, M.; Jaimes, M.A.; Reinoso, E. Seismic-event-based methodology to obtain earthquake-induced translational landslide regional hazard maps. Nat. Hazards 2014, 73, 1697–1713. [Google Scholar] [CrossRef]
- Li, B.; Cai, Z.; Xie, W.-C.; Pandey, M. Probabilistic seismic hazard analysis considering site-specific soil effects. Soil Dyn. Earthq. Eng. 2018, 105, 103–113. [Google Scholar] [CrossRef]
- Yariyan, P.; Ali Abbaspour, R.; Chehreghan, A.; Karami, M.; Cerdà, A. GIS-based seismic vulnerability mapping: A comparison of artificial neural networks hybrid models. Geocarto Int. 2022, 37, 4312–4335. [Google Scholar] [CrossRef]

| Year (BC) | County | Fault | Ms | MMI |
|---|---|---|---|---|
| 300 | Ray | Parchin, Ray | 7.6 | X |
| 743 | Caspian Gate | Garmsar | 7.2 | V111+ |
| 855 | Ray | kahrizak | 7.1 | V111+ |
| 958 | Teleghan | Mosha | 7.7 | X |
| 1117 | Karaj | Tehran | 7.2 | VIII+ |
| 1665 | Damavand | Mosha | 6.5 | Vi11+ |
| 1815 | Damavand | Mosha | N/A | V+ |
| 1830 | Damavand | Mosha | 7.1 | VIII+ |
| Criterion | Description |
|---|---|
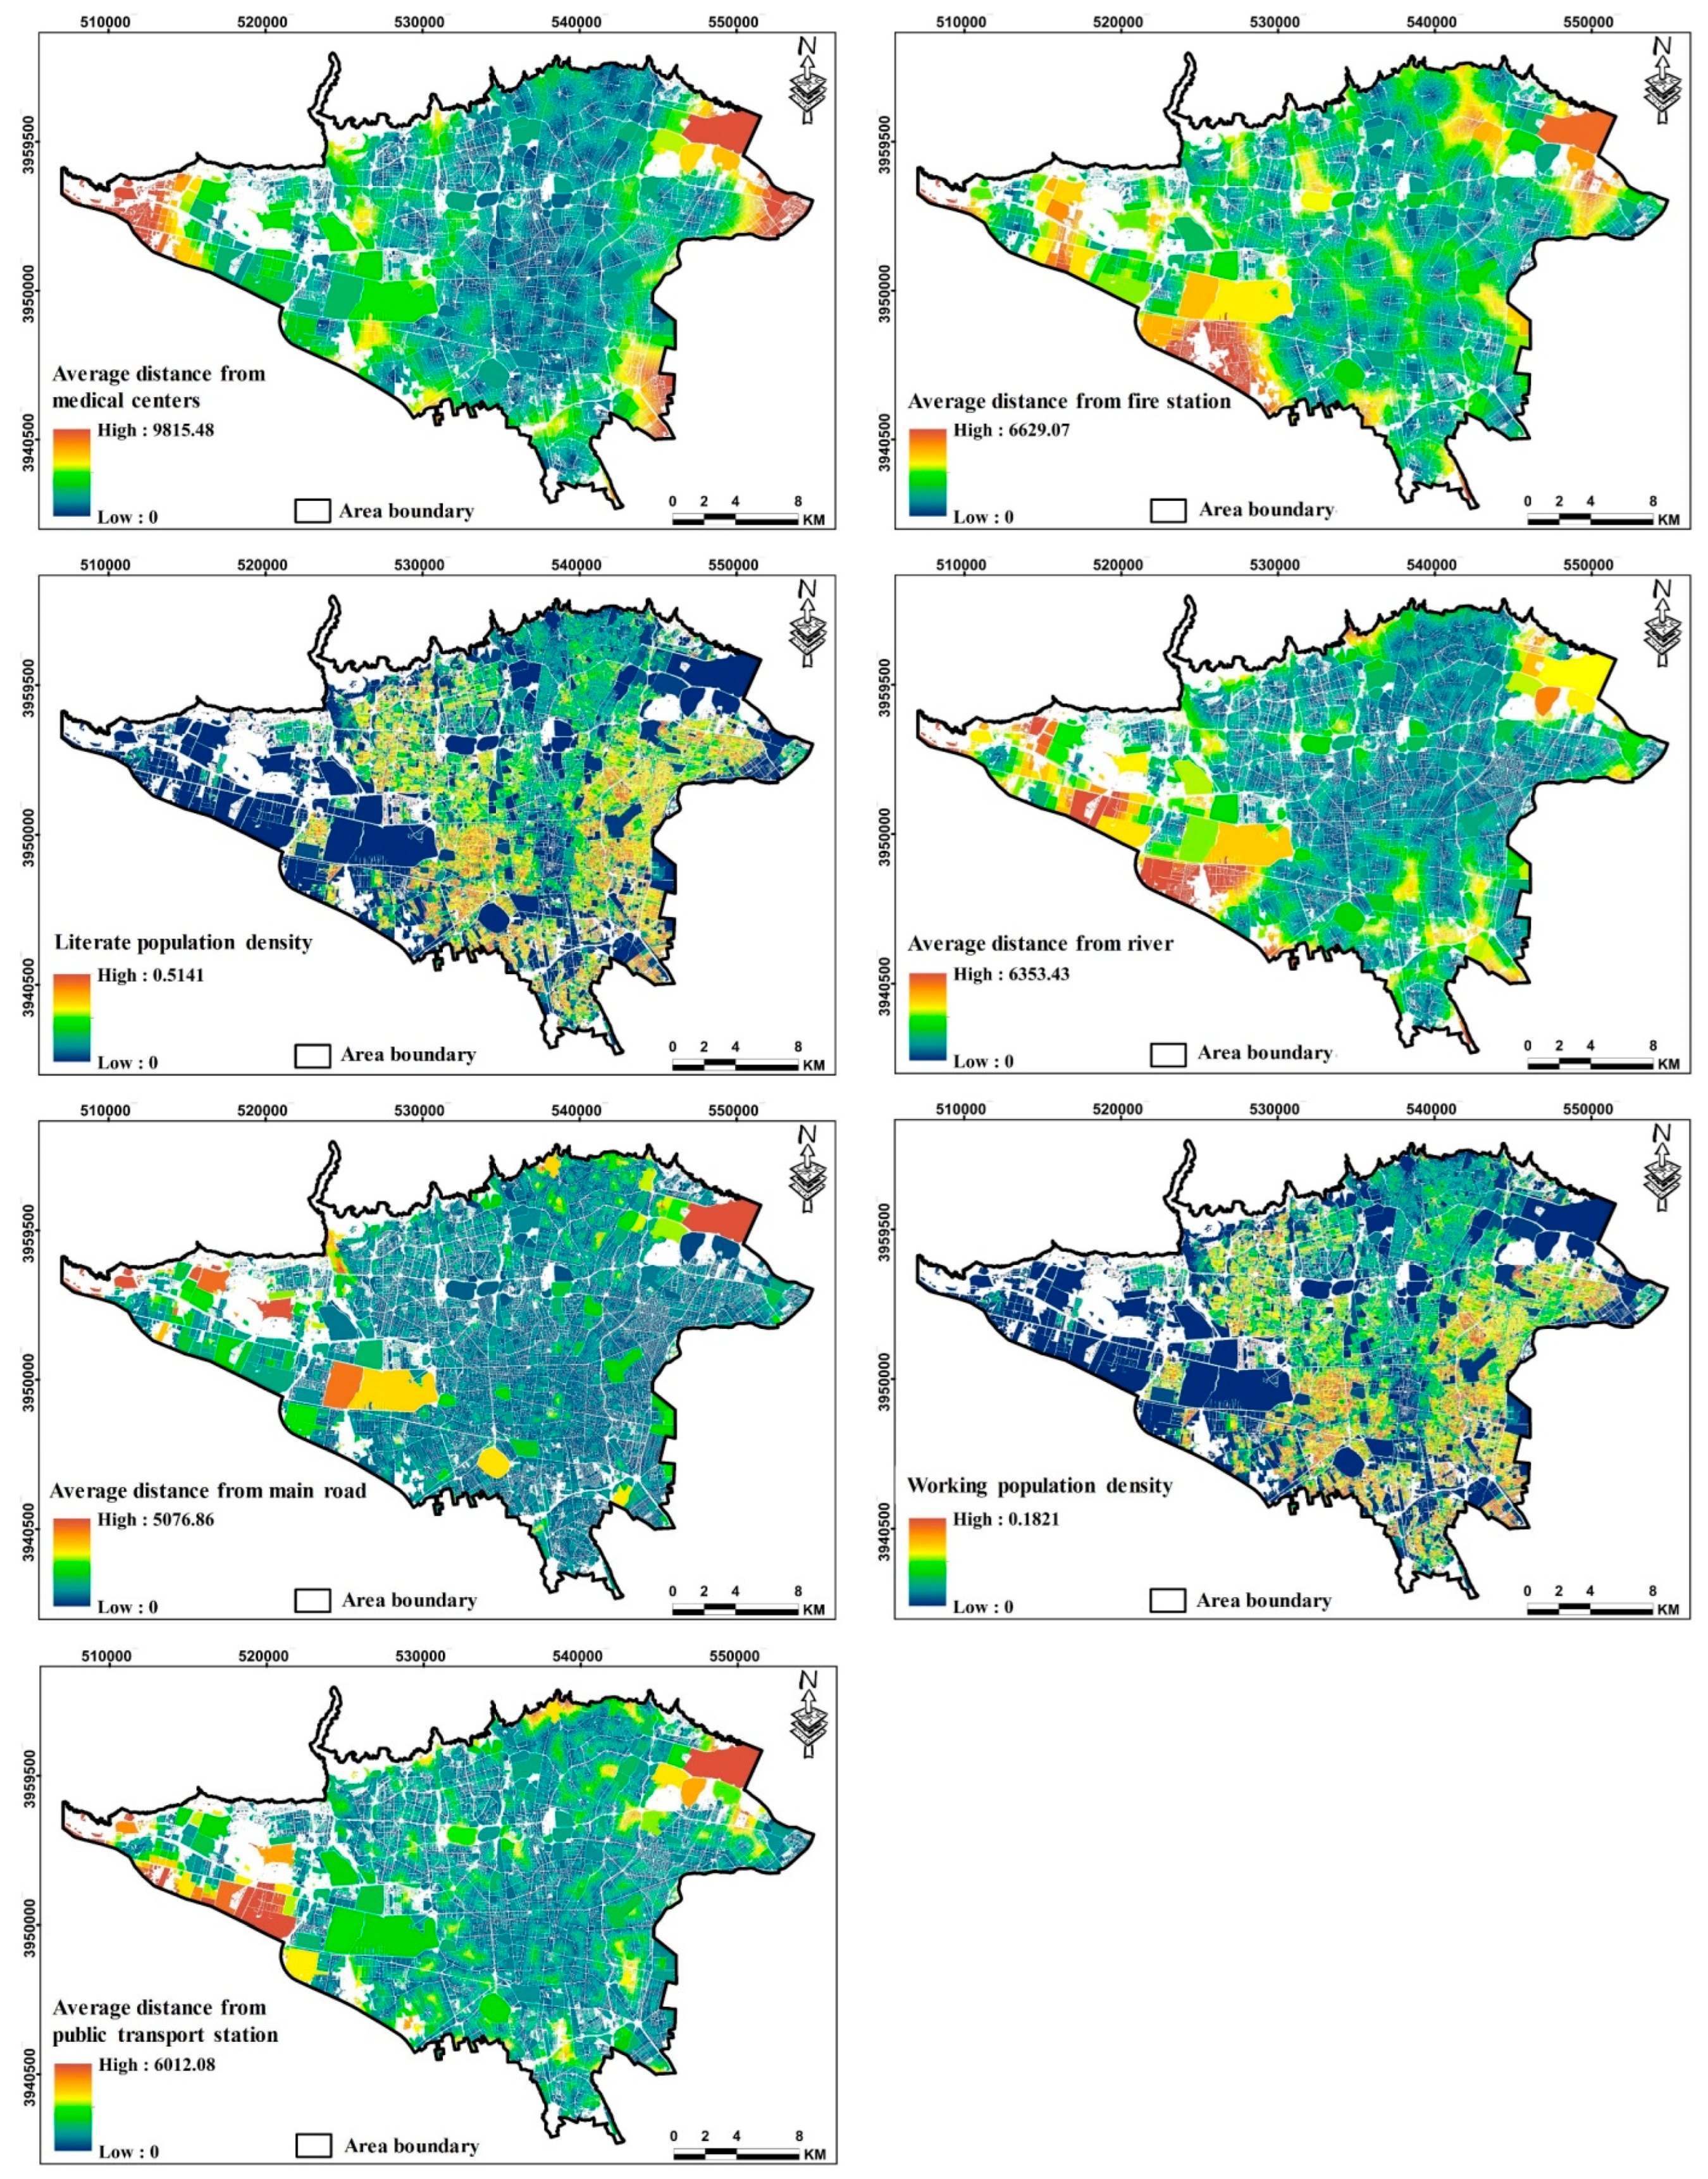
| Distance from fire station | Fire stations are important and vital service centers in cities that play an important role in ensuring the safety of citizens and infrastructure [71,72]. Therefore, proximity to them will increase the efficiency of fire station services during an earthquake. |
| Distance from medical centers | Access to medical facilities (such as health centers and hospitals) plays a key role in providing services and quickly addressing the condition of affected people during and after an earthquake [73]. Therefore, convenient and quick access to medical facilities will increase resilience against earthquakes. |
| Distance from pharmacy | Pharmacies are among the important service centers in the city, and quick and timely access to them is of great importance for reducing mortality and increasing the health of injured people during an earthquake [74]. Therefore, as the distance from pharmacies increases, vulnerability increases too. |
| Density of literate population | Educated individuals can adapt to disasters more effectively and have appropriate responses during disasters due to having the necessary information and awareness about risks [36]. Therefore, a higher education level may lead to less vulnerability. |
| Working population density | Households with low job-income status do not have the necessary ability to pay for retrofitting and access to the necessary services and equipment. Therefore, strengthening and reducing vulnerability depends significantly on the employment and income status of households [75]. |
| Distance from main road | The network of urban roads is considered to be one of the most important vital arteries of the cities, which, especially after the crisis, have a significant impact on rescue operations and the evacuation of the injured [76]. Therefore, with increasing distance from the road network, vulnerability increases. |
| Distance from public transport station | Convenient access to public transportation stations will reduce traffic and prevent street closures after an earthquake. As a result, the evacuation and relocation of the affected people and the transfer of rescuers to the accident site will be faster [77]. |
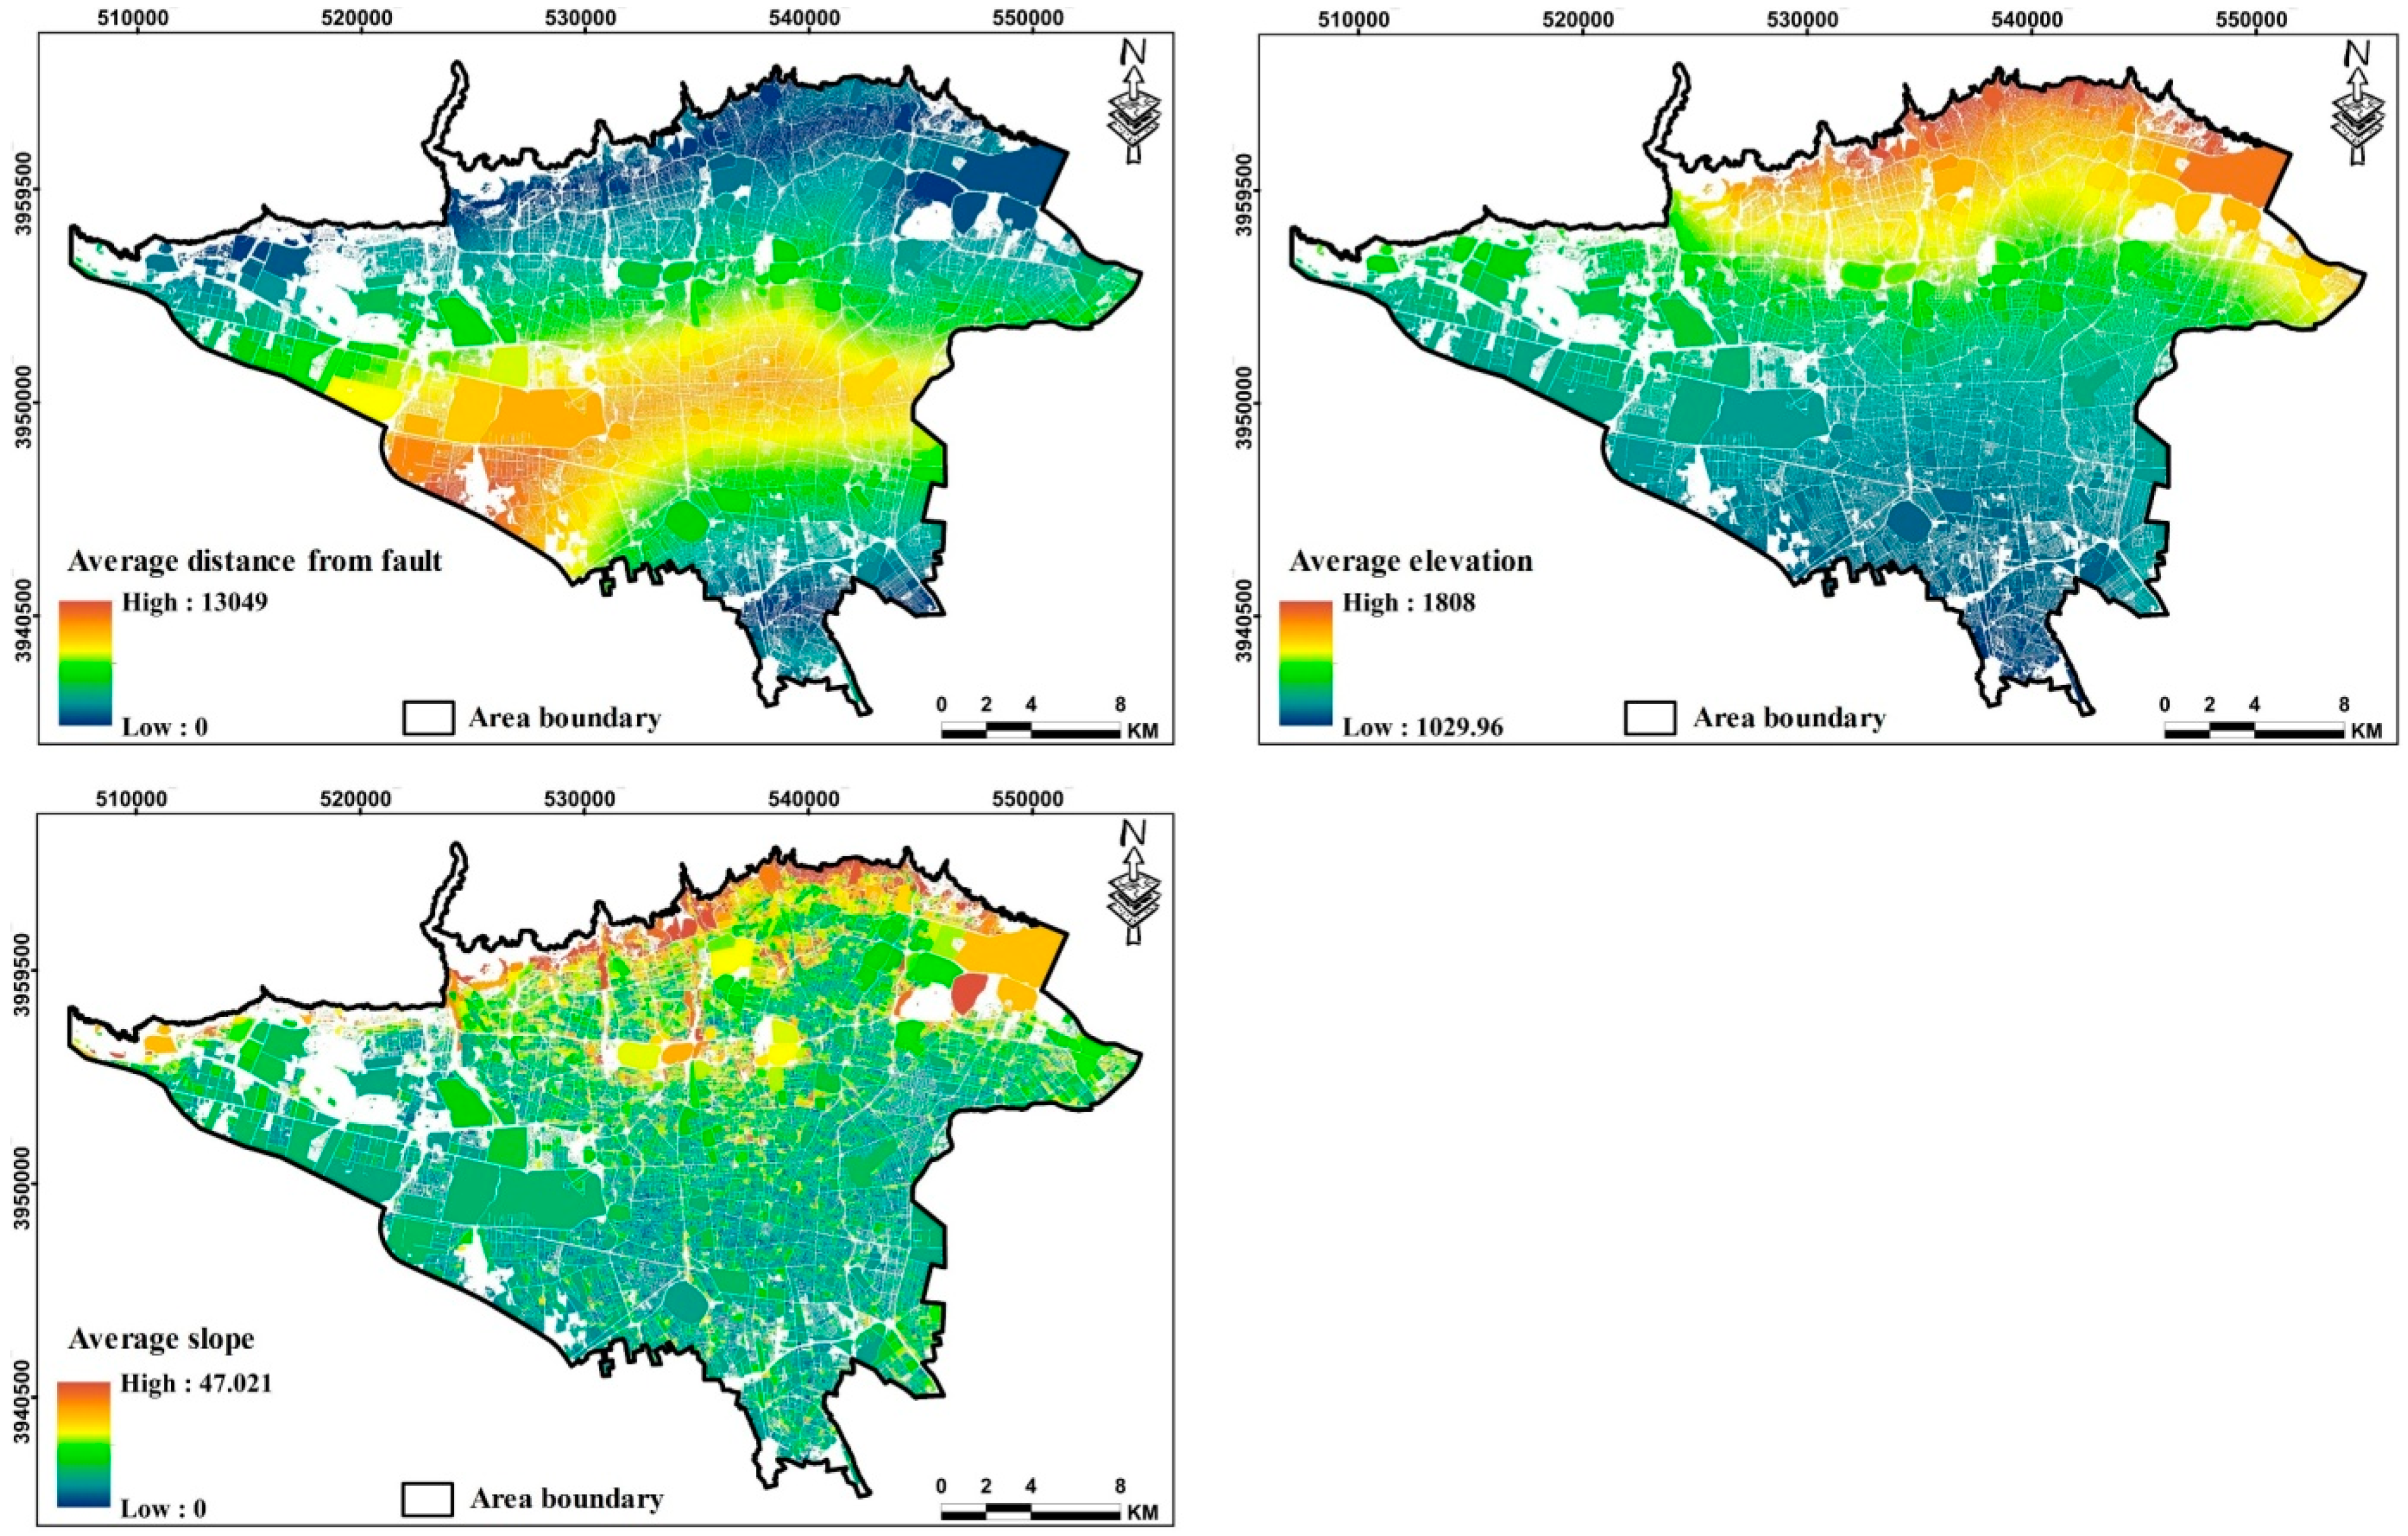
| Elevation and Slope | Elevation and slope are factors affecting earthquake vulnerability in urban environments. During an earthquake, the areas located on the slope and at higher altitudes are more vulnerable to damage [78]. Moreover, serving these areas will be associated with many problems [79]. Therefore, there is a direct relationship between elevation and slope with vulnerability. |
| Distance from fault | Proximity to geological faults is one of the most important criteria affecting the vulnerability caused by earthquakes. Because being close to it brings great damage and vulnerability, and distance from it reduces the risk and, as a result, more resilience [80]. |
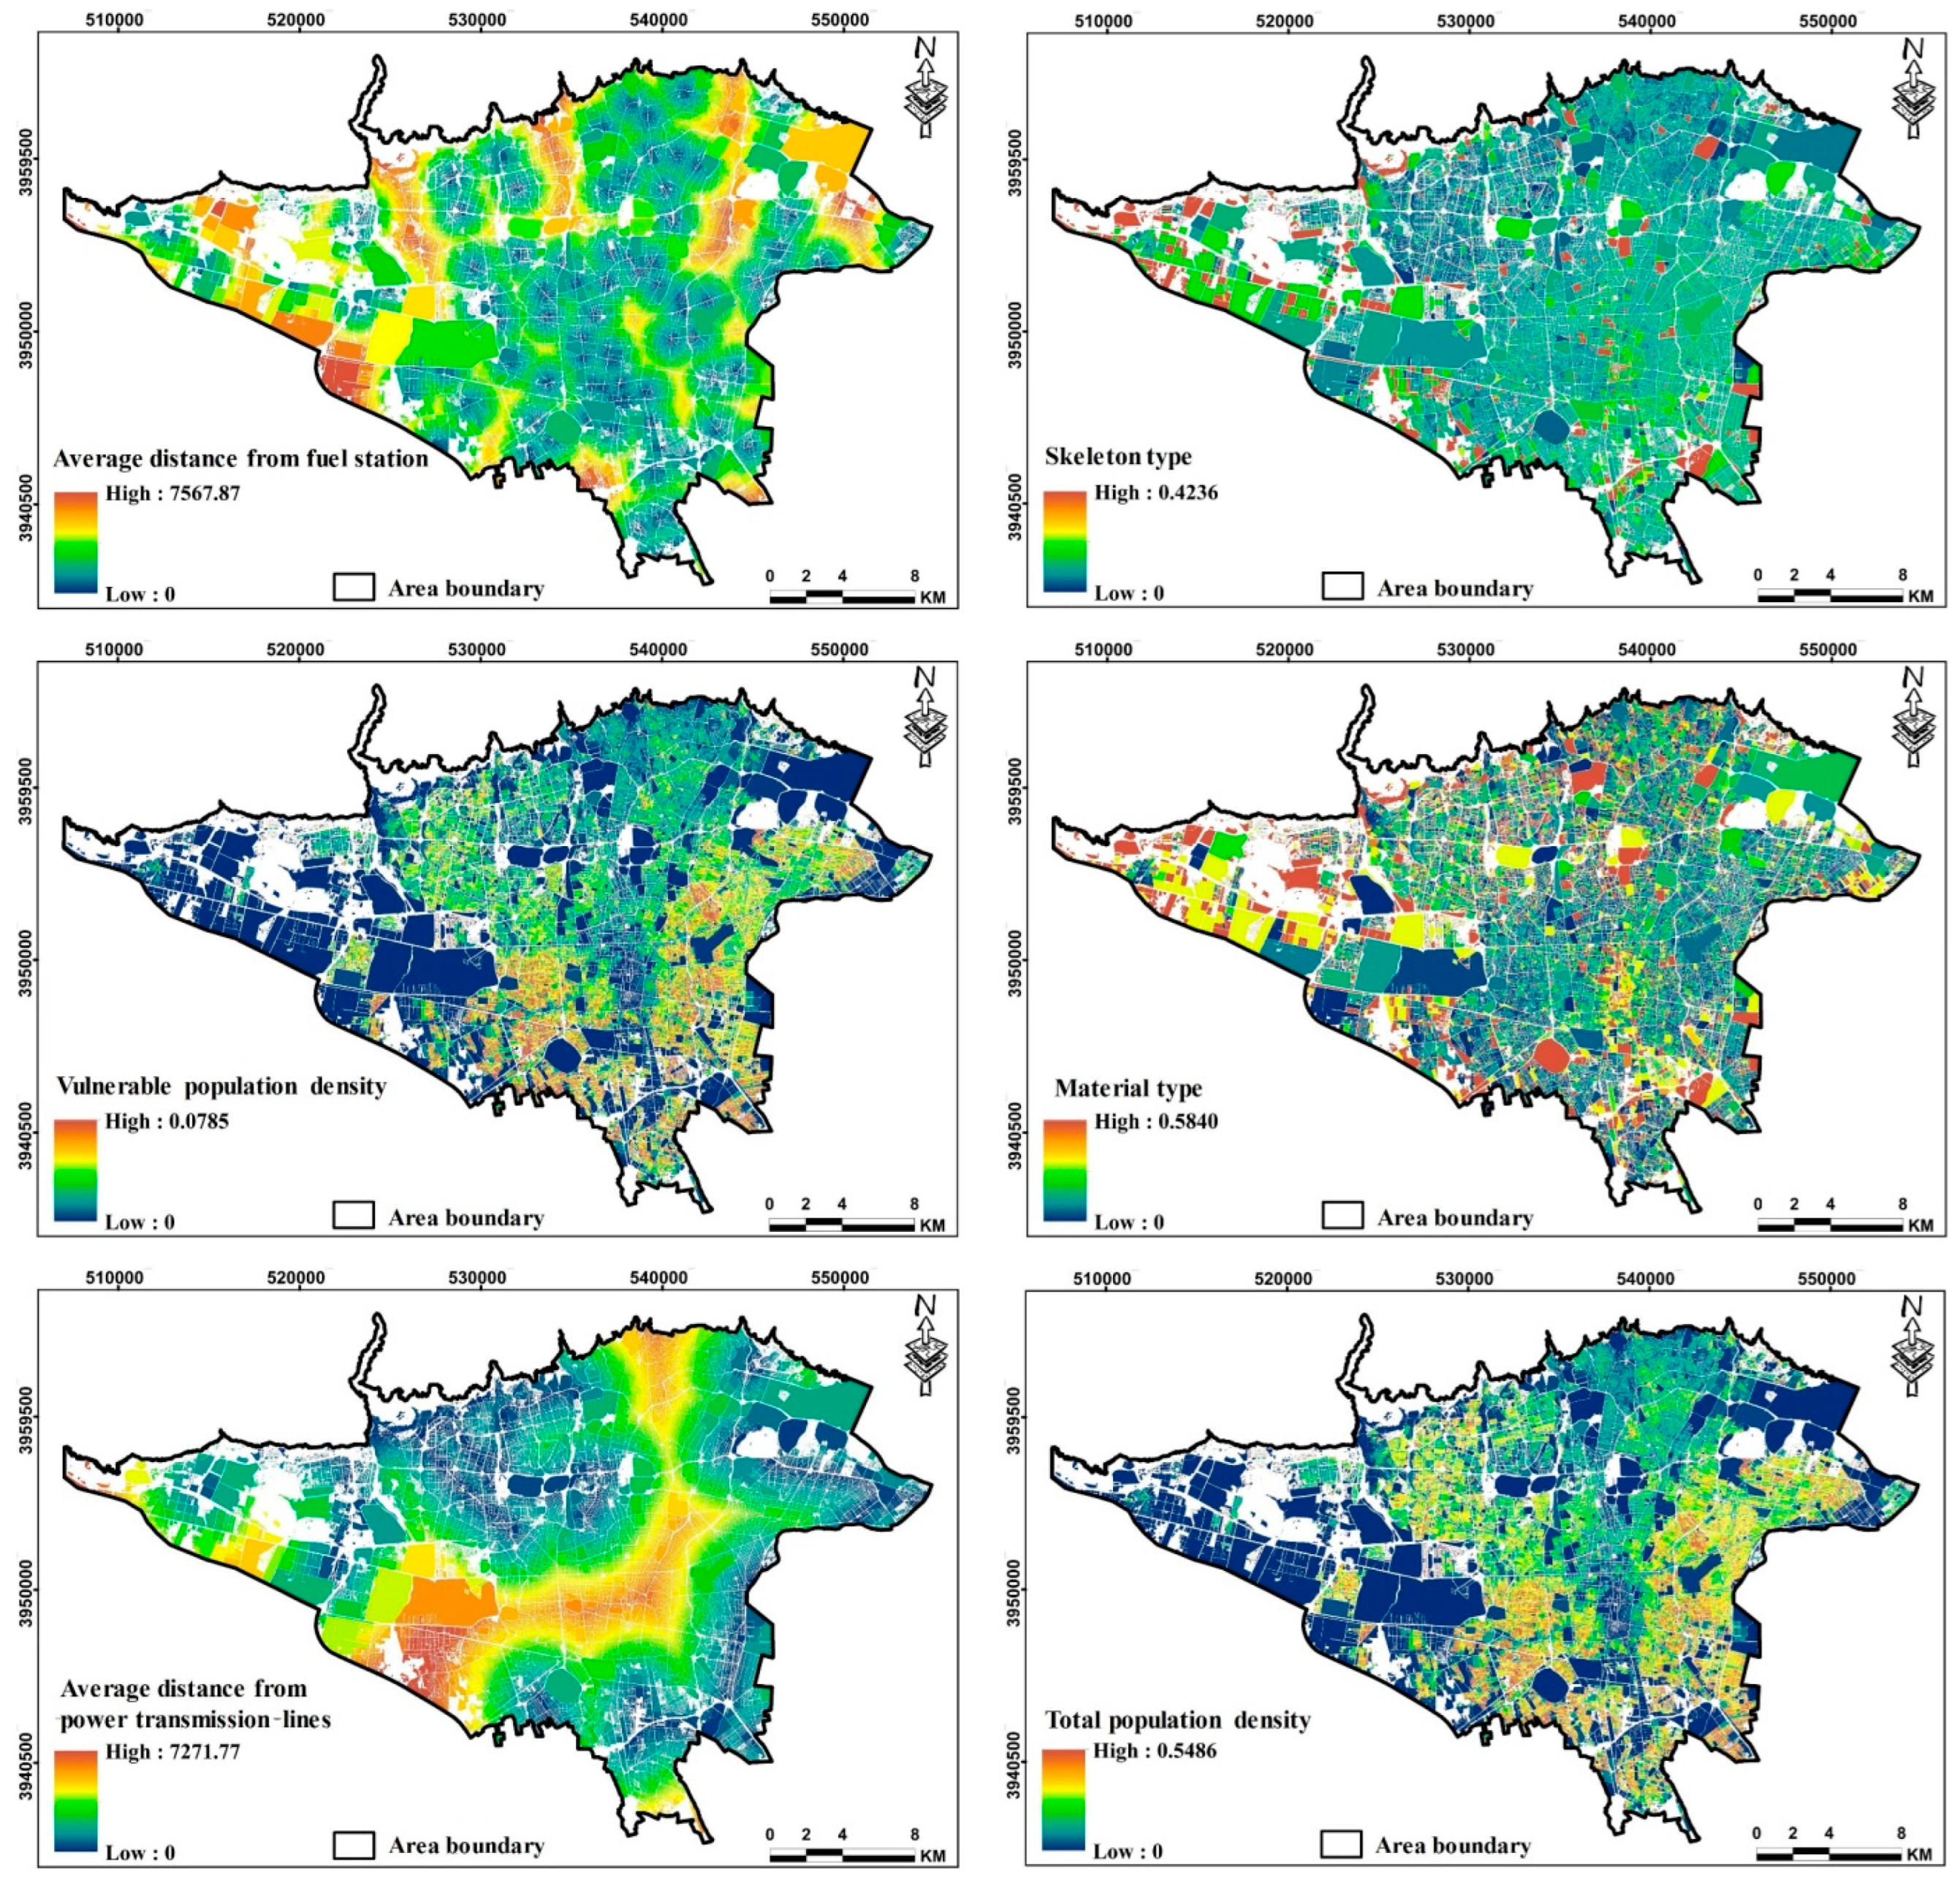
| Building quality (skeleton type and material type) | Buildings are the most important and main elements that are damaged during an earthquake [81]. Using resistant building materials and following standards in construction reduces vulnerability to earthquakes [82]. |
| Distance from fuel station | Fuel stations can create risks in the form of fire and explosion in the surrounding areas [36]; therefore, the greater the distance from them, the lower the vulnerability and vice versa. |
| Vulnerable population density | The vulnerable population includes people under 6 years old and over 60 years old. The higher the population density of vulnerable people in an area, the higher vulnerability [72,83]. |
| Total population density | In high-density areas of a city, a higher portion of the population is exposed to earthquakes, thus, higher vulnerability [84]. |
| Distance from power transmission lines | One of the important parts that are highly vulnerable due to an earthquake is the network of power transmission lines. For this reason, residential areas that are located near power transmission lines are more vulnerable than areas those farther away [85]. |
| Component | Criterion | Weight | Fuzzy Function | Type |
|---|---|---|---|---|
| Adaptability capacity | Distance from fire station | 0.03856 | MSLarge | Maximize |
| Distance from medical centers | 0.07338 | MSLarge | Maximize | |
| Distance from pharmacy | 0.05923 | MSLarge | Maximize | |
| Density of literate population | 0.03685 | MSSmall | Minimize | |
| Working population density | 0.03255 | MSSmall | Minimize | |
| Distance from main road | 0.04369 | MSLarge | Maximize | |
| Distance from public transport station | 0.02992 | MSLarge | Maximize | |
| Exposure | Elevation | 0.02555 | MSLarge | Maximize |
| Distance from fault | 0.10356 | MSSmall | Minimize | |
| Slope | 0.02136 | MSLarge | Maximize | |
| Sensitivity | Skeleton type | 0.09852 | MSLarge | Maximize |
| Material type | 0.09234 | MSLarge | Maximize | |
| Distance from fuel station | 0.04736 | MSSmall | Minimize | |
| Vulnerable population density | 0.12932 | MSLarge | Maximize | |
| Total population density | 0.11653 | MSLarge | Maximize | |
| Distance from power transmission lines | 0.05128 | MSSmall | Minimize |
| Parameter | Correlation Coefficient | Parameter | Correlation Coefficient |
|---|---|---|---|
| Distance from fire station | 0.55 | Distance from fault | −0.95 |
| Distance from medical centers | 0.65 | Slope | 0.46 |
| Distance from pharmacy | 0.63 | Skeleton type | 0.82 |
| Literate population density | −0.66 | Material type | 0.79 |
| Working population density | −0.69 | Distance from fuel station | −0.57 |
| Distance from main road | 0.50 | Vulnerable population density | 0.77 |
| Distance from public transport station | 0.53 | Total population density | 0.75 |
| Elevation | 0.49 | Distance from power transmission lines | −0.75 |
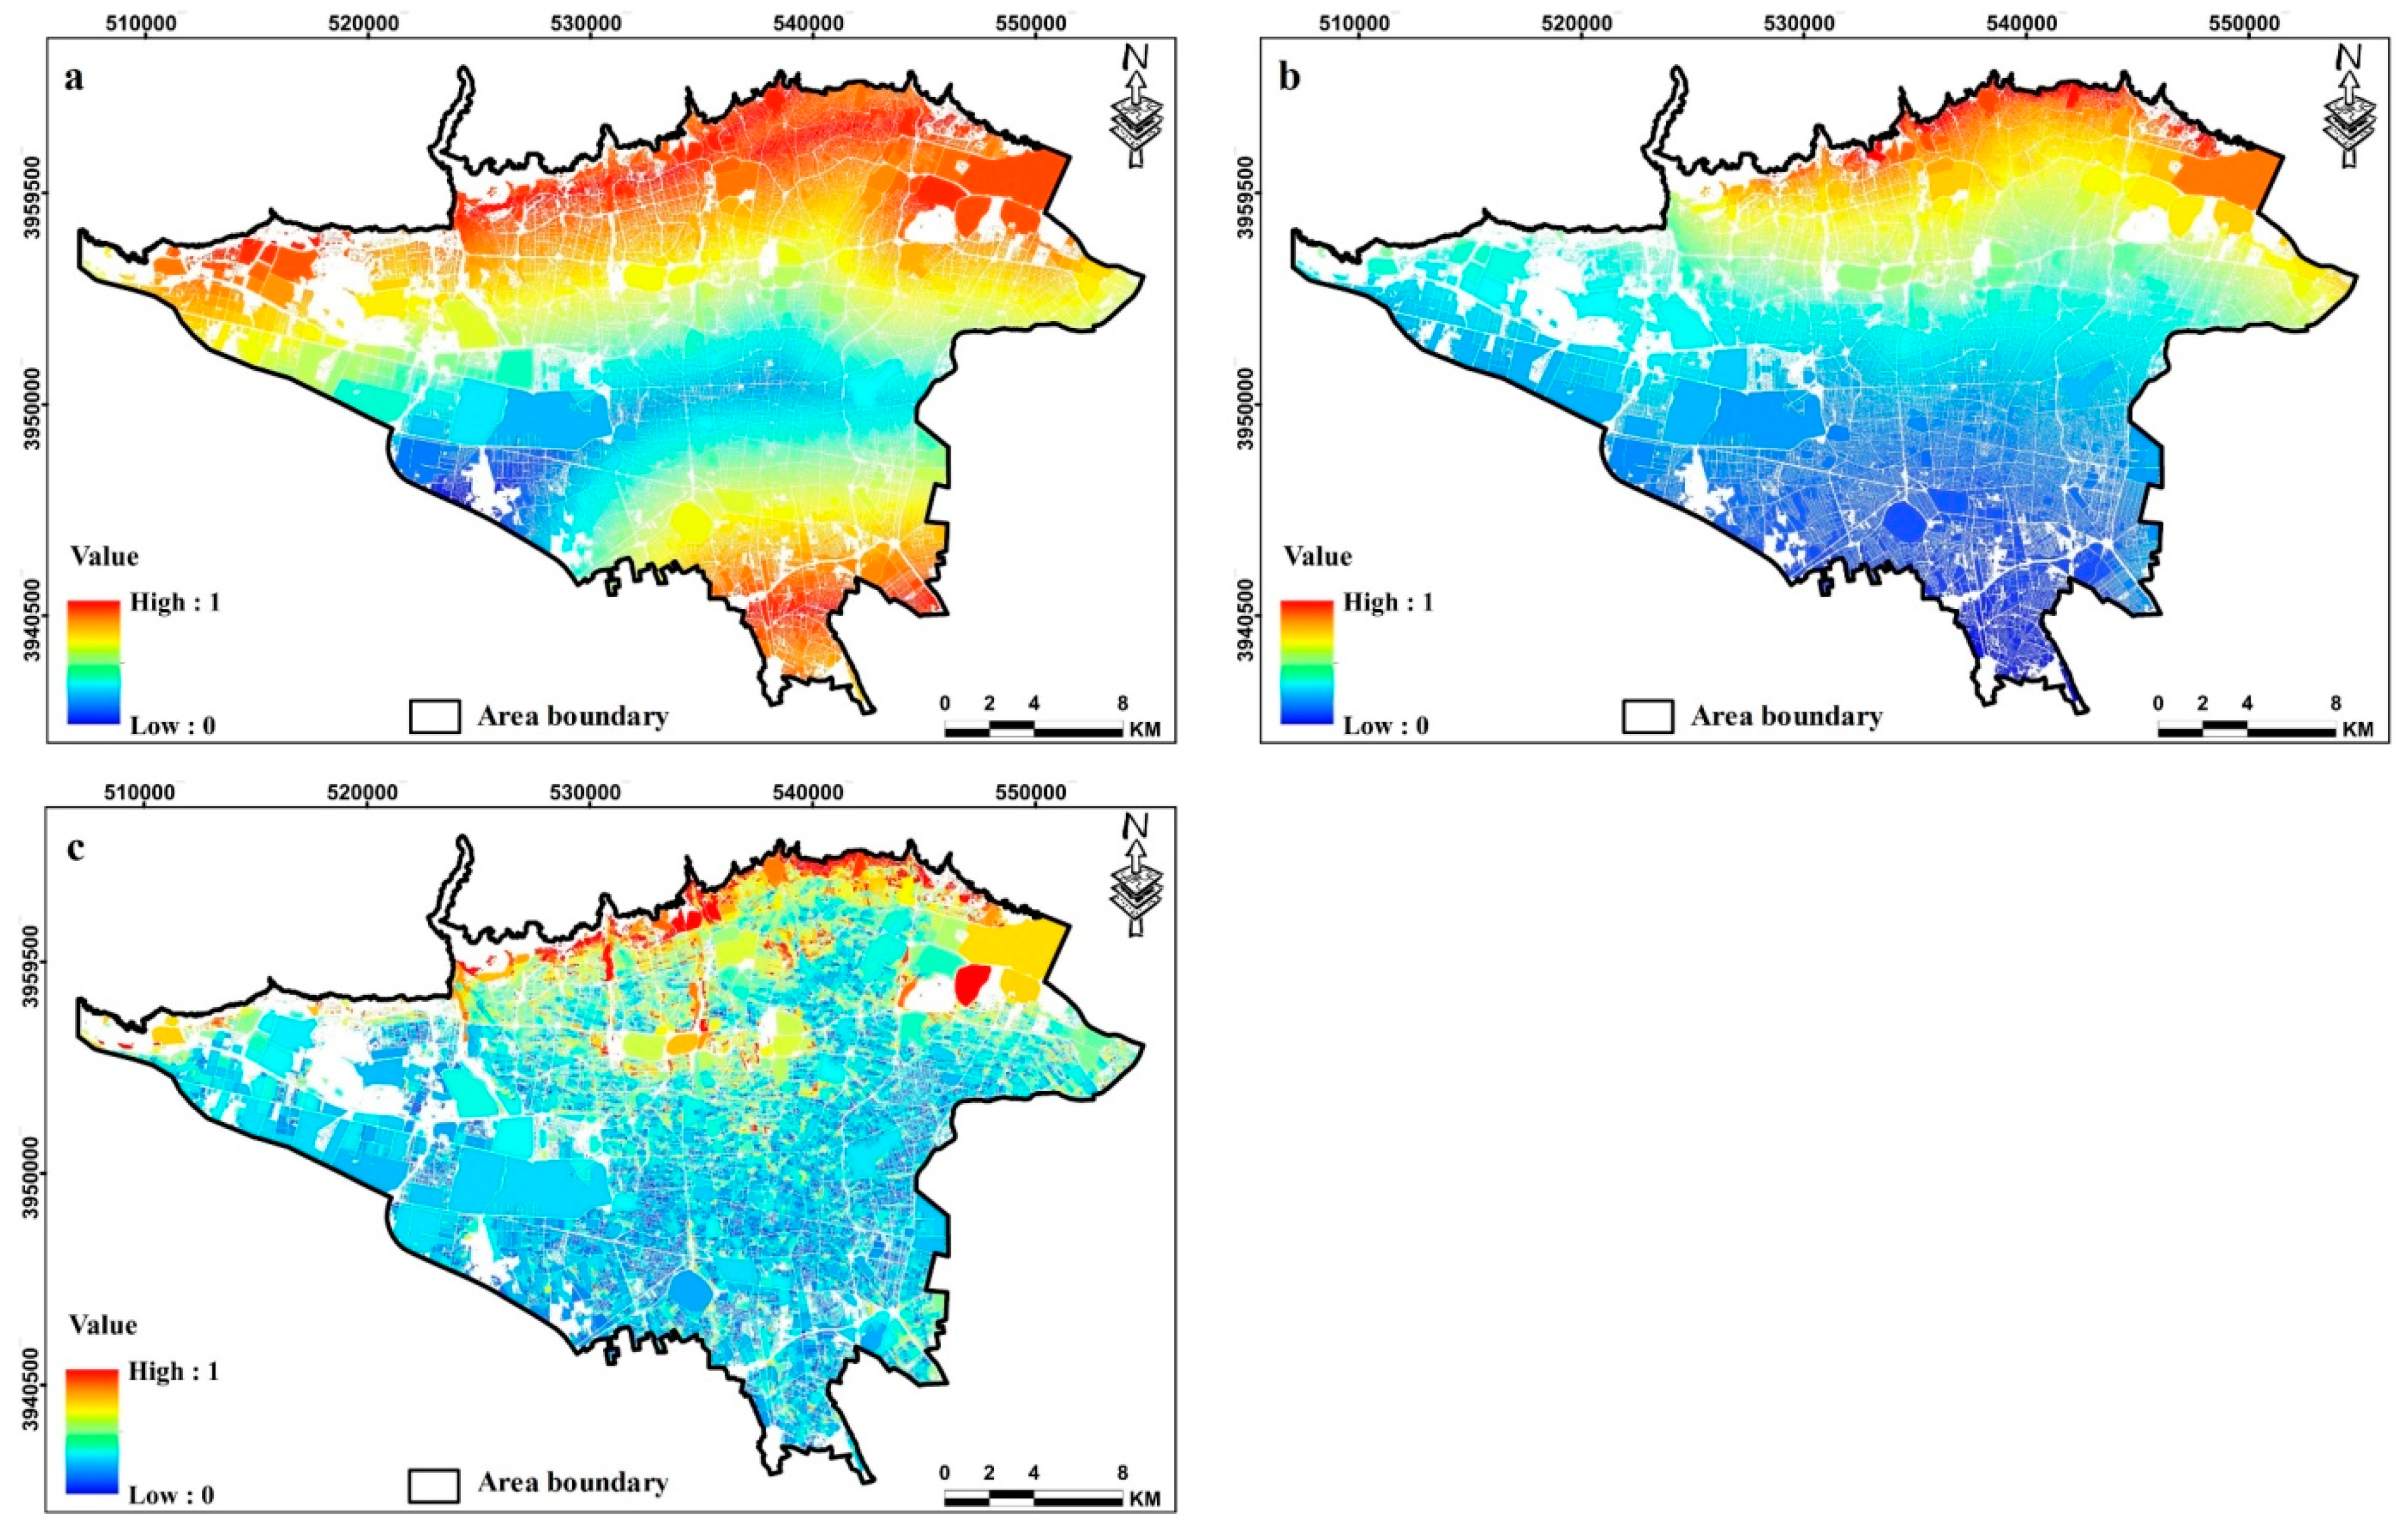
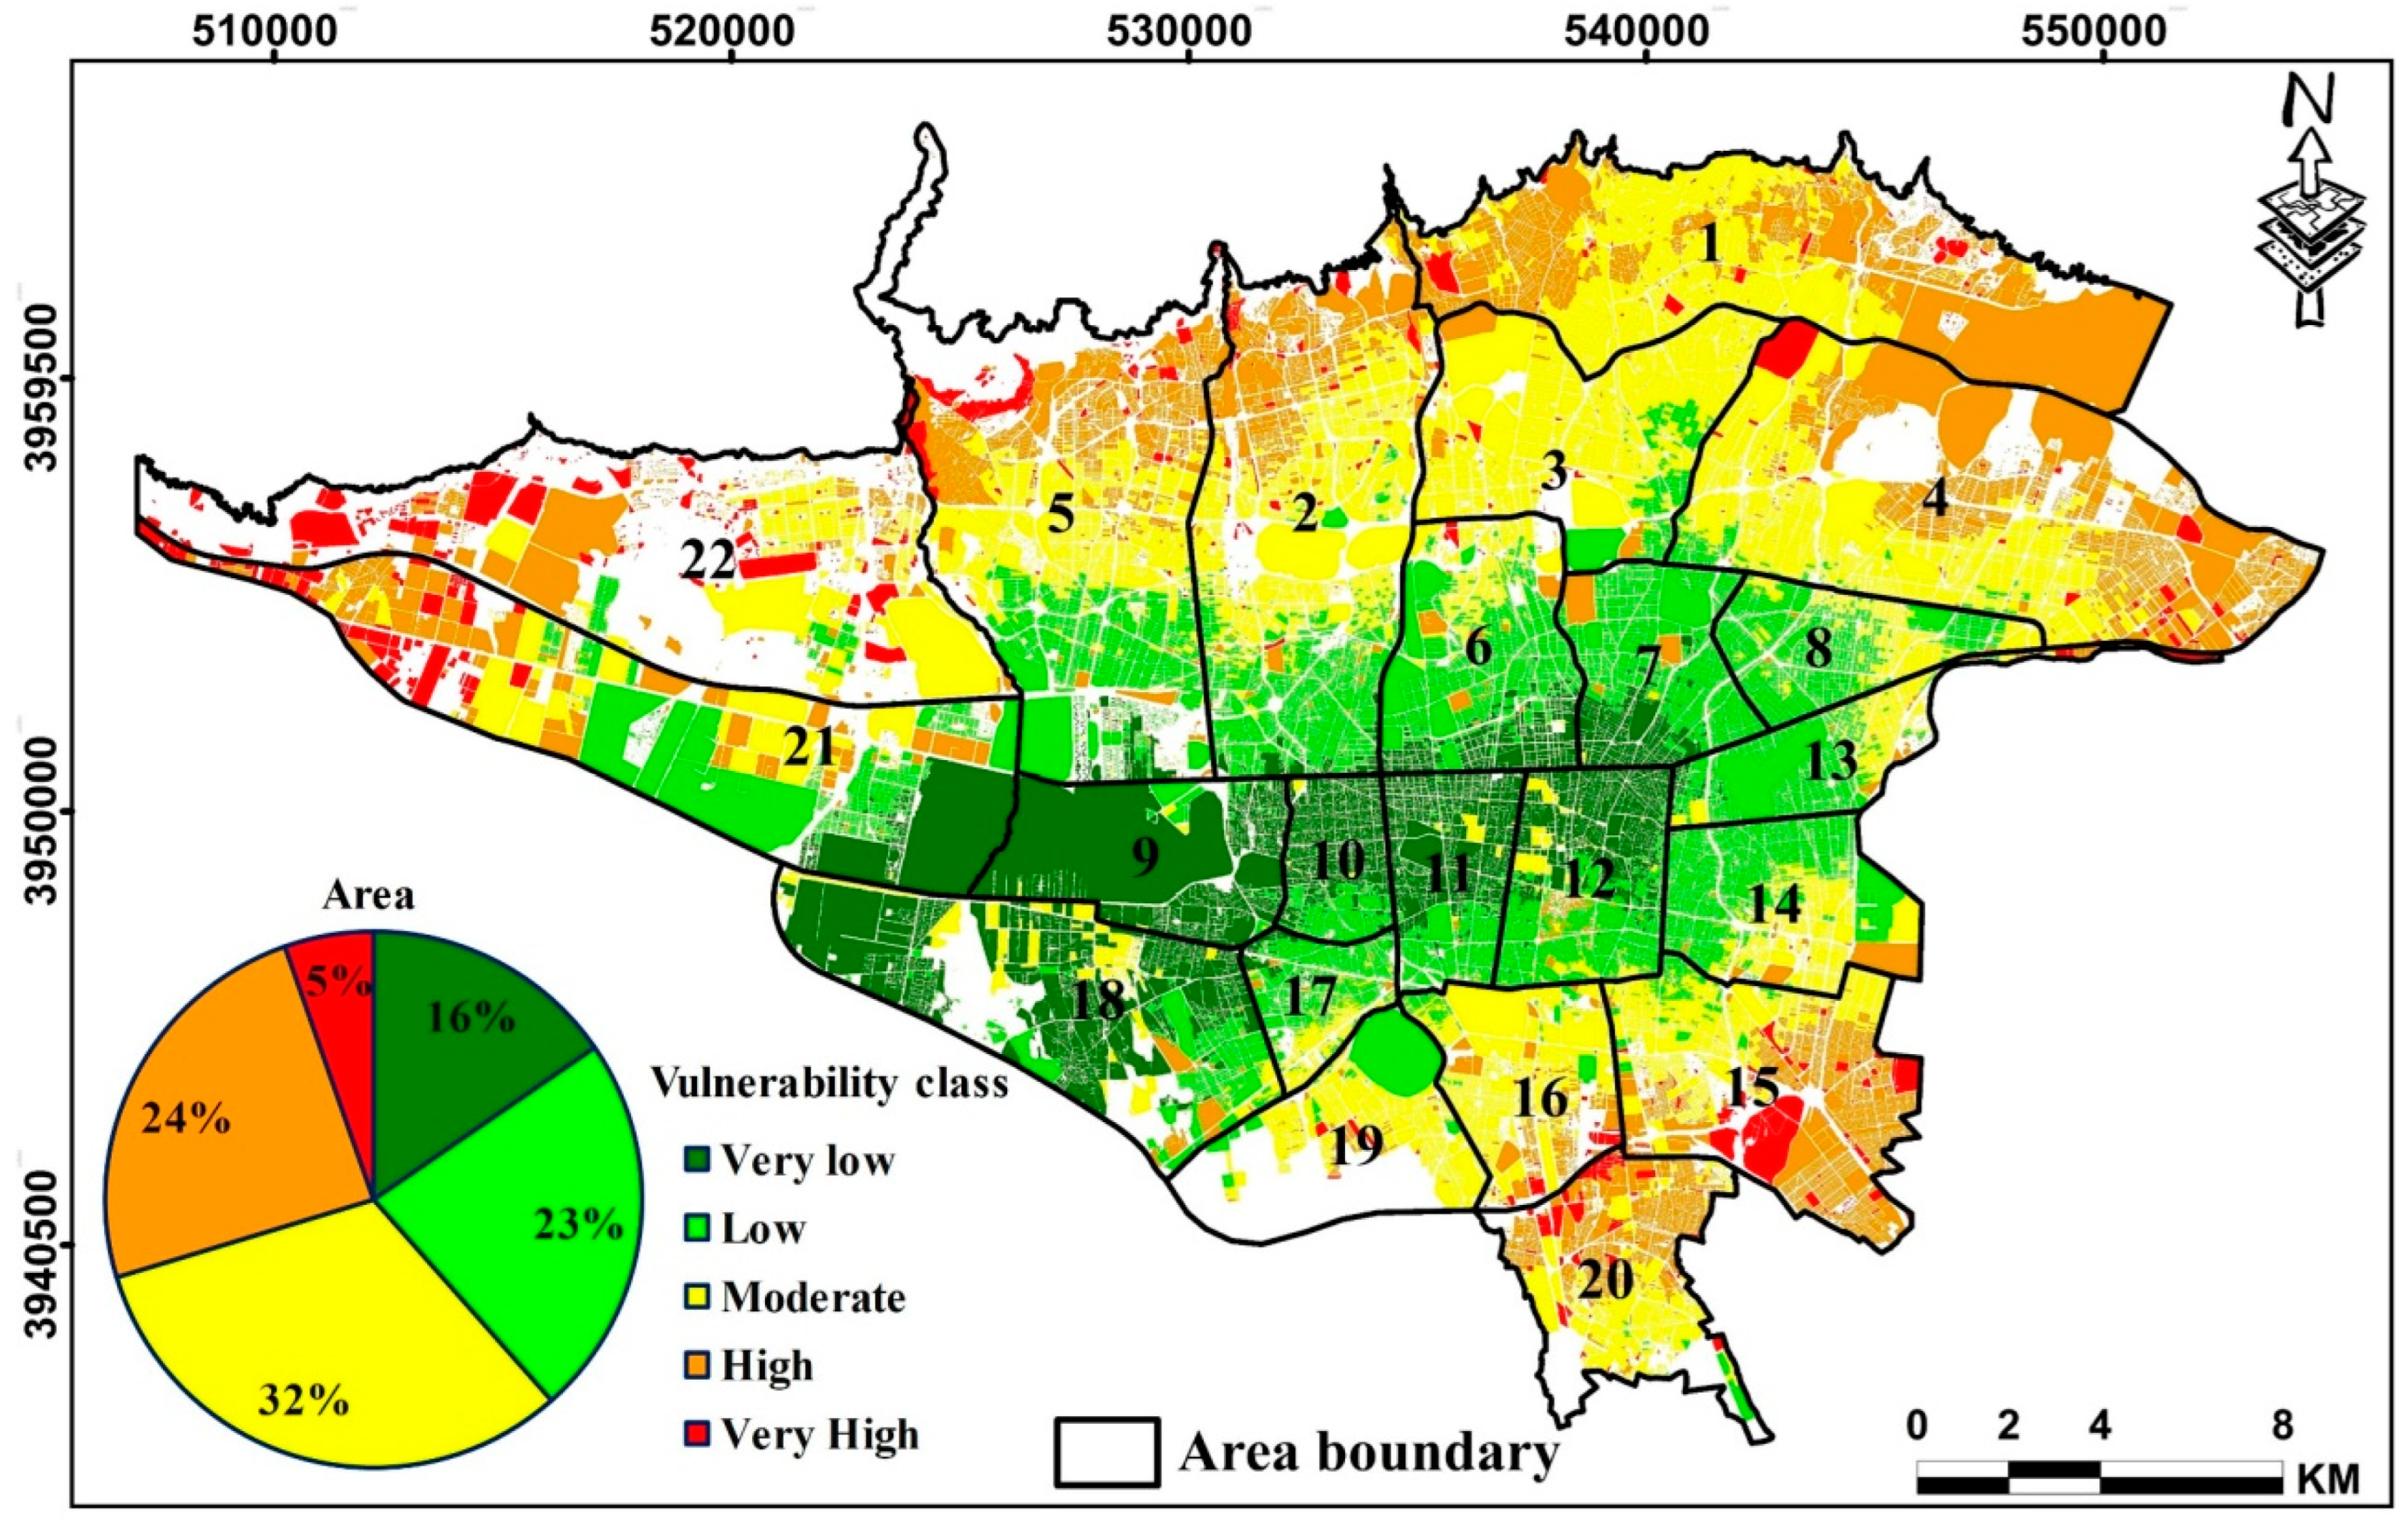
| Vulnerability Class | |||||
|---|---|---|---|---|---|
| Districts | Very Low | Low | Moderate | High | Very High |
| 1 | 0 | 0 | 37 | 60 | 3 |
| 2 | 2 | 24 | 44 | 26 | 3 |
| 3 | 0 | 13 | 80 | 6 | 1 |
| 4 | 0 | 3 | 43 | 49 | 5 |
| 5 | 3 | 30 | 29 | 31 | 7 |
| 6 | 19 | 59 | 16 | 5 | 1 |
| 7 | 23 | 68 | 1 | 9 | 0 |
| 8 | 0 | 73 | 26 | 1 | 0 |
| 9 | 94 | 5 | 1 | 0 | 0 |
| 10 | 70 | 28 | 2 | 0 | 0 |
| 11 | 68 | 29 | 3 | 0 | 0 |
| 12 | 46 | 42 | 9 | 3 | 0 |
| 13 | 3 | 67 | 22 | 4 | 3 |
| 14 | 0 | 60 | 29 | 11 | 0 |
| 15 | 0 | 6 | 33 | 45 | 17 |
| 16 | 0 | 7 | 71 | 18 | 4 |
| 17 | 9 | 67 | 22 | 3 | 0 |
| 18 | 66 | 17 | 13 | 4 | 0 |
| 19 | 0 | 38 | 56 | 4 | 2 |
| 20 | 0 | 3 | 41 | 45 | 11 |
| 21 | 19 | 32 | 19 | 22 | 9 |
| 22 | 0 | 4 | 42 | 28 | 27 |
Disclaimer/Publisher’s Note: The statements, opinions and data contained in all publications are solely those of the individual author(s) and contributor(s) and not of MDPI and/or the editor(s). MDPI and/or the editor(s) disclaim responsibility for any injury to people or property resulting from any ideas, methods, instructions or products referred to in the content. |
© 2023 by the authors. Licensee MDPI, Basel, Switzerland. This article is an open access article distributed under the terms and conditions of the Creative Commons Attribution (CC BY) license (https://creativecommons.org/licenses/by/4.0/).
Share and Cite
Afsari, R.; Nadizadeh Shorabeh, S.; Bakhshi Lomer, A.R.; Homaee, M.; Arsanjani, J.J. Using Artificial Neural Networks to Assess Earthquake Vulnerability in Urban Blocks of Tehran. Remote Sens. 2023, 15, 1248. https://doi.org/10.3390/rs15051248
Afsari R, Nadizadeh Shorabeh S, Bakhshi Lomer AR, Homaee M, Arsanjani JJ. Using Artificial Neural Networks to Assess Earthquake Vulnerability in Urban Blocks of Tehran. Remote Sensing. 2023; 15(5):1248. https://doi.org/10.3390/rs15051248
Chicago/Turabian StyleAfsari, Rasoul, Saman Nadizadeh Shorabeh, Amir Reza Bakhshi Lomer, Mehdi Homaee, and Jamal Jokar Arsanjani. 2023. "Using Artificial Neural Networks to Assess Earthquake Vulnerability in Urban Blocks of Tehran" Remote Sensing 15, no. 5: 1248. https://doi.org/10.3390/rs15051248