
Representing Spatial Data with Graph Contrastive Learning

1
School of Cyber Science and Engineering, Frontiers Science Center for Mobile Information Communication and Security, Southeast University, Nanjing 210096, China
2
Purple Mountain Laboratories, Nanjing 211111, China
*
Author to whom correspondence should be addressed.
Remote Sens. 2023, 15(4), 880; https://doi.org/10.3390/rs15040880
Submission received: 10 January 2023
/
Revised: 27 January 2023
/
Accepted: 2 February 2023
/
Published: 5 February 2023
(This article belongs to the Special Issue Big Data Analytics in Geospatial Artificial Intelligence)
Abstract
:Large-scale geospatial data pave the way for geospatial machine learning algorithms, and a good representation is related to whether the machine learning model is effective. Hence, it is a critical task to learn effective feature representation for geospatial data. In this paper, we construct a spatial graph from the locations and propose a geospatial graph contrastive learning method to learn the location representations. Firstly, we propose a skeleton graph in order to preserve the primary structure of the geospatial graph to solve the positioning bias problem of remote sensing. Then, we define a novel mixed node centrality measure and propose four data augmentation methods based on the measure. Finally, we propose a heterogeneous graph attention network to aggregate information from both the structural neighborhood and semantic neighborhood separately. Extensive experiments on both geospatial datasets and non-geospatial datasets are conducted to illustrate that the proposed method outperforms state-of-the-art baselines.
1. Introduction
The geospatial data play an important role in many real-world problems, such as population migration prediction, intelligent transportation systems and automated driving. Recently, machine learning algorithms [1,2,3,4,5] have been successfully used in various fields such as health, finance, travel, computer vision and natural language processing. Large-scale geospatial data pave the way for geospatial machine learning algorithms. Data representation engineering is the foundation of machine learning, and a good representation is the key to learning an effective machine learning model [6]. Therefore, it is critical to learn effective representation for geospatial data. A geospatial graph is usually adopted to capture the complex relationships between different geo-locations in real-world scenarios. Each node in the geospatial graph is further associated with node features or other types of attributes, which contain rich semantic information. In this paper, we focus on the representation of the nodes in geospatial graphs. Specifically, each node is represented by a low-dimensional vector with meaningful semantic and structural information. These potential geospatial representations could be used to improve the accuracy of machine learning models, and enable rich downstream activities.
Traditional unsupervised graph representation learning approaches such as Deep-Walk [7] and node2vec [8] excessively rely on the proximity information defined on the network structure. Recently, contrastive learning has seen a renewed surge of interest [9,10,11,12,13,14]. Contrastive learning aims to learn representations by maximizing feature consistency under differently augmented views. When combining with graph neural networks, contrastive learning can potentially overcome the aforementioned limitations of proximity-based approaches. Hence, we propose to learn geospatial graph representation based on contrastive learning.
However, the geospatial graph representation is a daunting task due to the following challenges: (1) Positioning devices are not accurate. Positioning bias from remote sensing can lead to deviation information in the geospatial data. As shown in Figure 1a, assuming shops A and B are located in the same building, very close to each other, remote sensing-based tools may incorrectly record a user’s visit to A as a visit to B. Some other factors such as human errors in data preparation may also cause errors in the geospatial data. (2) It is difficult to learn meaningful representation for the nodes that are sparsely connected. Most of the existing contrastive learning models directly aggregate structural neighborhood features. As shown in Figure 1b, a sparse connected node A can only aggregate information from one neighbor node. The performance of the contrastive learning models can be severely affected by such nodes. To solve this problem, Wang et al. [15] extract the embeddings from node features, topological structures and their combinations simultaneously. Then, they use the attention mechanism to aggregate the three embeddings. Wei et al. [16] construct a KNN graph by using the attribute features of nodes and use the KNN graph to enhance the node embeddings. However, these methods ignore the heterogeneity in the edges. (3) Traditional data augmentation techniques may break critical information in the geospatial graphs. The good performance of a contrastive learning method depends on a reasonable data augmentation technique. Most existing data augmentation techniques [9,10,12] increase the size of training data by randomly perturbing nodes and edges in the original graph, which is likely to break the connectivity and structural features of the original graph. As can be seen from Figure 1c,d, deleting important nodes may cause the graph to lose a large number of edges. Removing important edges may break the original graph into several independent sub-graphs.
In this paper, we propose a novel geospatial graph representation model, namely Semantic Enhanced-Graph Contrastive Learning (SE-GCL). In order to address the first challenge, we propose to generate a skeleton graph from the original graph. The skeleton focuses on the primary structure of the original geospatial graph and ignores the fine-grained details, such that the errors introduced by positioning devices are disregarded. In order to address the second challenge, we build a semantic geospatial graph by injecting semantic edges into the original geospatial graph. The semantic edge captures the similarity between the associated features or attributes of node pairs. With the injected semantic edges, the semantic geospatial graph is denser. We further propose a heterogeneous graph attention network (HGAT) that aggregates information from the original edges and the injected semantic edges. Finally, to address the last challenge, we define a novel mixed node centrality measure and propose four data augmentation methods based on the measure. The proposed data augmentation methods preserve important information in the geospatial graphs. The main contributions of this paper are summarized as follows:
- In order to solve the incorrect information caused by the positioning device, we propose to generate a skeleton graph from the original graph. The skeleton graph preserves the primary structure of the geospatial graph, while it ignores the fine-grained details, which disregards the errors introduced by positioning devices.
- We inject semantic edges to capture the similarity between the associated features and attributes of a pair of nodes. We propose the HGAT to aggregate information from both structural and semantic neighborhoods. The incorporated semantic information provides extensive information for the nodes that are sparsely connected to learn meaningful representation.
- We propose four novel data augmentation methods based on node centrality measures. Compared with the random perturbation methods, the proposed data augmentation methods can better preserve the important information in the geospatial graph.
- We conduct experiments on two real-world geospatial datasets. The experiments demonstrate that the proposed method significantly outperforms state-of-the-art methods in multiple downstream tasks. In addition, we conduct experiments on several non-geospatial datasets. The experimental results show that the model is effective in node classification and graph classification. These results show that the proposed method has good scalability and can be well extended to other applications.
2. Related Work
2.1. Geospatial Data Prediction
The statistical models used for geospatial data prediction include recursive decomposition [17] and naïve Bayes [18]. These approaches rely on several assumptions. However, nowadays spatial data have become much more complex, and they no longer satisfy those assumptions any more. Since deep learning has brought about breakthroughs in many domains, more and more researchers apply deep learning to geospatial data prediction. JLGE [19] combines the recommendation of places of interest with graph embedding. It jointly learns the embedding of six graphs, including two single-parts (user–user and POI–POI) and four two-parts (user–location, user–time, location–user and location–time). LBSNE [20] formalizes metapath-based random walks on LBSN to construct heterogeneous neighborhoods of nodes. Then, it uses the learned heterogeneous neighborhood sequence to build the heterogeneous hopper model for network embedding. SE-KGE [21] encodes the spatial information such as point coordinates or bounding boxes of geographic entities into knowledge graph embedding space for handling different types of spatial inference. Then, it constructs a geographic knowledge graph and a set of geographic query–answer pairs. VirHpoi [22] introduces hypergraphs into heterogeneous embeddings to achieve point-of-interest recommendation services.
2.2. Graph Representation
Graph representation models aim to convert the input graph data into low-dimensional vector representations. Those representations benefit downstream tasks such as node classification or graph classification, etc. Traditional representation models include GCN [23], GAT [24] and GraphSAGE [25]. GCN [23] transfers graph domain convolution into frequency domain for graph node embedding based on Laplace matrix and Fourier transform. GAT [24] introduces an attention mechanism to adaptively assign different weights to different nodes. GraphSAGE [25] conducts inductive graph node embedding based on a sub-graph sampling strategy. These models only focus on the node’s structural neighborhood and ignore the rich semantic information. In order to capture semantic information, UGCN [26] introduces multi-type convolution to jointly extract information from one-hop, two-hop and semantic neighbors of the target node. Similarly, SimP-GCN [16] constructs a KNN graph based on the similarity information between attributes, and fuses it with the adjacency matrix of the original graph. AM-GCN [15] extracts topological embedding, semantic feature embedding, topological and semantic common embedding based on GCNs, and combines them through an attention mechanism. However, the above methods only take semantic information as the supplement of structural information and ignore the heterogeneity of semantic information and structural information.
2.3. Graph Contrastive Learning
Graph contrastive learning is one of the most widely used the unsupervised graph representation learning methods. DGI [27] first introduces deep infomax into graph learning and achieve satisfying results by maximizing the mutual information between local structure and global context. InfoGraph [13] improves DGI by stitching the representations of different layers together. GRACE [10] proposes a node-level graph contrastive learning method. The same node representations are pulled closer in the two views, while the different node representations are pushed away. BGRL [12] adopts a no-negative example method to encode and maximize the mutual information between the online encoder and the target encoder. GBT [14] uses identity matrices to approximate cross-correlation matrices to decouple the eigenvectors and reduce redundant information.
Data augmentation is one of the most important components of graph contrastive learning. The purpose of data augmentation is to create novel and reasonable data through some transformation. Most of existing techniques [9,10] achieve data augmentation by randomly perturbing edges, nodes and attributes. These models ignore the differences between nodes’ and edges’ importance in the graph. In order to solve the above problems, GCA [11] proposes an adaptive data augmentation method. It identifies important nodes in the graph by calculating the centrality measure of nodes and edges. Then, it perturbs unimportant nodes and edges with a high probability based on this centrality measure information. GROC [28] proposes a rule-based method to modify the edges. LG2AR [29] proposes a data augmentation method based on the distribution of all nodes in the graph. Another group of methods proposes to augment data by sub-graph sampling. MH-Aug [30] studies the expansion of a graph based on Markov chain Monte Carlo sampling. MVGRL [28] generates augmented sub-graphs based on graph diffusion technology. However, these methods ignore semantic information when calculating the importance of nodes and edges in graphs.
3. Problem Formulation
In this section, we first present some basic definitions and then formulate the problem.
Definition 1
(Geospatial graph). A geospatial graph is denoted as , where each node is a geographical location, identified by the latitude and longitude tuple. Given the threshold ω, for nodes and , if the distance between and is smaller than ω, there will be an edge between and . Each geospatial graph is associated with a feature matrix , where M represents the feature dimension and represents the feature vector of .
In real-world applications, sometimes graphs are not associated with additional feature matrices. For those graphs, we define the feature vector of the node i as its coordinate vector .
Definition 2
(User Activities Set). A user activity is a tuple that means user o visited location v. A user activities set is a set of activity tuples associated with user o. Total activities set as include all users’ activity sets.
- Problem Statement. Given a geospatial graph and the users’ activities, our goal is to learn a representation matrix , whose i-th row is a d dimensional vector representing the location . The learned representation matrix W can be used as features for downstream tasks such as location classification.
Preliminary: Graph Contrastive Learning
In this subsection, we introduce more details about graph contrastive learning. The main idea behind contrastive learning is to generate two views, namely , from the input graph G by data augmentation functions and , and maximize the mutual information between encoded representations of and . The corresponding objective function can be defined as , where is a graph neural network that encodes graphs into nodal representations, represents the parameters of and is a function that calculates mutual information between and .
4. Semantic Enhance-Graph Contrastive Learning (SE-GCL)
In this section, we first present two novel definitions, namely semantic geospatial graph and skeleton graph. The semantic geospatial graph helps us to address the challenge of less connected nodes by injecting semantic edges. The skeleton graph enables us to overlook the errors introduced by the positioning devices and allow us to focus on the primary structure of the geospatial graph. Next, we propose a graph contrastive learning method that learns a representation for both the semantic geospatial graph and the skeleton graph. Finally, we aggregate the two representations to obtain the final representation.
4.1. Data Preparation
The geospatial graph does not utilize the rich semantic information in the features and in the user activity set. To incorporate such semantic information, we construct a semantic geospatial graph as follows.
Definition 3
(Semantic Relationship). Given two nodes and from the geospatial graph, we say is semantically related to if either (1) the similarity between their features is larger than a threshold, i.e., , where γ is the threshold, or (2) there exists a user o that has visited both and , i.e., .
With the semantic relationship defined, we are ready to introduce the semantic geospatial graph.
Definition 4
(Semantic Geospatial Graph). Given geospatial graph , a semantic geospatial graph is denoted as , where V and E are the same set of nodes and edges in G, and is the set of semantic edges, i.e., two nodes and are connected by an semantic edge, i.e., , if and are semantically related. We refer to E in as structural edges, and in as semantic edges.
Compared with a geospatial graph, a semantic geospatial graph is injected with many semantic edges. As a result, a less connected node in the geospatial graph is likely to be connected to other nodes through semantic edges, which addresses the challenge of sparse connection.
As positioning devices may introduce errors, we next propose the skeleton graph to only preserve the primary structure of the graph and disregard the fine-grained details.
Definition 5
(Skeleton graph). Given a semantic geospatial graph , a skeleton graph is denoted as , where each node corresponds to a cluster , in which the distance between each node pair and is less than a given threshold , is the set of structural edges and is the set of semantic edges. The two nodes and are connected by a structural/semantic edge if there exist and such that and are connected by a structural/semantic edge, i.e., /.
In order to construct the skeleton graph from the original geospatial graph efficiently, we adopt the following strategy: Firstly, we impose a grid on the space. The size of each cell is . This guarantees that the distance between any two nodes in a cell is no larger than . Secondly, for each cell, we merge the set of nodes inside as a new node in the skeleton graph. Finally, given two nodes and in the skeleton graph, let and be the corresponding node sets of and , respectively. If there exists and , such that is an edge in the original geospatial graph, we add an edge between and in the skeleton graph. Then, the skeleton graph is successfully constructed. Figure 2 shows an example of the semantic geospatial graph and the skeleton graph. Given a geospatial graph , we inject the semantic edges (red dashed lines) into G to generate a semantic geospatial graph (Figure 2a). To construct the skeleton graph, we classify the nodes in Figure 2a into four clusters based on the location distance. Each cluster correspond to a node in , i.e., , , , . Based on the definition of the skeleton graph, the node pairs (,), (, ), (, ) are connected by a structural edge, (,), (, ) and (, ) are connected by a semantic edge. Given a node v, we refer to the set of nodes connected to v via structural edges as structural neighbors, and the set of nodes connected to v via semantic edges as the semantic neighbors.
In summary, the semantic geospatial graph helps us to address the challenge of less connected nodes by injecting semantic relations. The skeleton graph enables us to overlook the errors introduced by the positioning devices and allows us to focus on the primary structure of the geospatial graph.
4.2. Solution Overview
The high-level idea of our solution is as follows: For a given geospatial graph, we construct a semantic geospatial graph and a skeleton graph . Then, we use a graph contrastive learning method named SE-GCL to learn the representation matrices and for and , respectively. Once we have learned the two representations, we aggregate them to obtain the final node representation.
The framework of the graph contrastive learning model SE-GCL is shown in Figure 3. For a given graph (either the semantic geospatial graph or the skeleton graph), SE-GCL generates two views by data augmentation functions. After the views are generated, we propose HGAT to capture their structural and semantic information. The outputs of HGAT will be passed to a multi-layer perceptron (MLP) network to generate node representations. We use to denote the representation of node in the semantic geospatial graph, and to denote the representation of node in the skeleton graph. For a node in the geospatial graph, its final representation is defined as
where is a node in the skeleton graph such that is the node in the node cluster that corresponds to .
The learning process is described on the right side of Figure 3. For each node in the views, SE-GCL aims to bring the positive samples closer and push the negative samples away. In this paper, we define the semantic neighbor nodes in the same view and the same node in different view as positive samples. The other nodes are regarded as negative samples.
In the remaining of this section, we introduce the graph contrastive learning method by elaborating on data augmentation (Section 4.3), HGAT (Section 4.4) and learning process (Section 4.5) in turn. As the learning processes of the semantic geospatial graph and the skeleton graph are independent, for the ease of illustration, we abuse the notation to denote both graphs, where V is the set of nodes, E is the set of structural edges and is the set of semantic edges.
4.3. Data Augmentation
Randomly perturbing nodes and edges in the graph may sabotage the critical information in the graph. Therefore, we propose to augment data by considering the importance of each node. A natural idea to measure a node’s importance is to calculate the centrality measure of the node [11,28,29]. However, most of the existing centrality measure methods focus on homogeneous graphs. Since there are two types of edges in the semantic geospatial graph, it is inappropriate to adopt existing centrality measures directly. To address this problem, we define a novel mixed node centrality measure and propose four data augmentation methods based on the measure.
4.3.1. Mixed Centrality Measure
To design a good mixed centrality measure, we propose three semantic-aware measures, namely D-ClusterRank, D-DIL and D-CC. We next elaborate these measures in turn.
- D-ClusterRank measure. ClusterRank [31] is a centrality measure based on the local aggregation coefficient:where represents the aggregation coefficient of the target node , represents the out degree of the node neighbor and represents the neighborhood of . is the nonlinear negative correlation function. Equation (3) depicts the computation of the aggregation coefficient for node , where represents the number of triangles formed with neighbors, represents the degree of and represents the total number of triangles that make up a complete graph.
ClusterRank uses the degree centrality to measure the influence of each node, which treats each neighbor node equally. However, different nodes in the graph have different significance. Moreover, we need to consider two types of edges. Hence, it is inappropriate to use ClusterRank directly. To tackle this problem, we propose to improve ClusterRank as follows:
Firstly, a well-known approach for capturing the significance of different nodes is PageRank [32]. PageRank measures the significance of the nodes in a graph. The rank of each node is the probability of random walk to the node. To distinguish the semantic and structural edges, we propose the following measure:
where represents the connect edge number between and , is the number of types of edges between and , d is the damping factor, N is the total number of nodes, represents the probability random walk to each node and is the degree of node .
Equation (4) evaluates the significance of nodes while taking into account the difference between semantic and structural edge. We next propose the improved D-ClusterRank. Specifically, we replace the node centrality measure in Equation (2) with the significance measure in Equation (4), as follows:
where represents the structural neighborhood.
- D-DIL measurement. DIL [33] suggests that nodes connected to important edges have a high probability of being important nodes. It computes the weighted sum of a node’s degree and the importance of all connected edges:where is the degree of node , is the weight of the edge importance and is the importance of edge . The importance is defined as follows:where p represents the number of triangles that the edge participates in, and represents the weight coefficient. reflects the connectivity of edge . The more triangles that forms, the less important is.
Similar to ClusterRank, DIL does not distinguish semantic and structural edges, which is inappropriate in handling the semantic geospatial graph and the skeleton graph. To tackle this problem, we propose the D-DIL by considering both types of edges:
where and are the numbers of structural and semantic edges that are connected to , represents the number of edges between and and is the number of triangles formed by the same type of edges as .
- D-CC measurement. Closeness Centrality (CC) [34] measures the average shortest distance from each node to each other node:where is the shortest distance between node and node . Note that to compute the shortest distance, each edge on the shortest path has unit weight. As we have discussed in the D-ClusterRank and D-DIL, the CC measure does not consider the types of edges or the importance of each edge, making it inappropriate for our problem. To address this problem, we assign each edge a weight , where is the total number of all types of edges between and . Intuitively, if two nodes are connected by both structural and semantic edges, they are more important for the shortest distance. Then, we can define the D-CC as follows:where w-dist is the weighted distance between and .
- Mixed centrality measure. Now, we are ready to present the mixed centrality measure.
- To guarantee that the value of falls into the range of , we normalize aswhere and are the minimum and maximum values, respectively. The mixed centrality measure of node is computed by:where is the sigmoid function and is the temperature parameter to adjust the distribution.
4.3.2. Augmentation Methods
The mixed centrality measure evaluates the significance of each node in the graph. Based on the mixed centrality measure, we next propose four data augmentation methods to preserve important information in the graph. We propose four augmentation methods, including Enhanced Ripple Random Walker (E-RRW), Centrality aware node perturbation (C-NP), Centrality aware Feature Masking (C-FM) and Centrality aware Edge Perturbation (C-EP). We next elaborate on the four methods in turn.
- Enhanced Ripple Random Walker (E-RRW). Ripple Random Walker (RRW) [35] is a sub-graph sampling method. It solves the problem of neighbor explosion and node dependence in random walk, and further reduces resource occupation and computing cost. Motivated by the above advantages, we propose a novel data augmentation method, namely E-RRW. Specifically, we select the initial starting node based on the mixed centrality measure. Then, we generate augmented views by constructing sub-graphs with RRW.
Figure 4 shows the procedure of the E-RRW method. E-RRW generates two augmented sub-graphs from the original graph as follows: First, E-RRW selects the node with the largest mixed centrality as the initial node in the first sub-graph, denoted by . After that, E-RRW collects ’s k-hop neighborhood and calculates a score for each node :
where is the mixed centrality of and b is a constant. We select the node with the largest score as the initial node in the second sub-graph,
Starting from , E-RRW randomly samples percentage of nodes from the unselected neighbors of the selected nodes, where the expansion ratio is the proportion of nodes sampled from the neighbors. When is close to 0, the ripple random walk acts like random sampling. When is close to 1, the ripple random walk acts like breadth-first search. We repeat the sampling process until the number of nodes in each sub-graph reaches a predefined threshold.
Figure 4.
E-RRW data augmentation method. The red nodes represent the initial nodes. The yellow nodes represent the first step. The green nodes represent the second step. The orange nodes represent the third step.
Figure 4.
E-RRW data augmentation method. The red nodes represent the initial nodes. The yellow nodes represent the first step. The green nodes represent the second step. The orange nodes represent the third step.

The detail process of E-RRW is shown in Algorithm 1. First, E-RRW selects the initial nodes for the two sub-graphs (lines 1–2). Starting from the initial nodes, E-RRW expand the node sets of the two sub-graphs by RRW sampling (lines 13–18) from the original graph G (lines 3–4 and 7–12). Finally, E-RRW constructs the sub-graphs based on the extracted nodes (lines 5–6).
| Algorithm 1: E-RRW |
 |
E-RRW has the following advantages: (1) It still preserves important nodes in the graph after sampling. (2) With a size constraint, E-RRW generates small-scale sub-graphs, which greatly reduces the burden of memory and computing resources in the training process. (3) E-RRW ensures that the two generated sub-graphs are very much alike, making the learning model easy to be optimized.
- Centrality aware node perturbation (C-NP). As shown in Figure 5a, the C-NP augmentation method deletes a fraction of nodes in the input graph based on the nodes’ mixed centrality measure. As the nodes with higher mixed centrality measure are more important, we retain such nodes with a higher probability. Formally, we define a perturbing vector that is subjected to the Bernoulli distribution , where the probability of is equal to , i.e., . Then, the C-NP augmentation method deletes the node with probability .
- Centrality-aware feature masking (C-FM). As shown in Figure 5b, the C-FM augmentation method masks a fraction of dimensions with zeros in node features. We assume that the features in the nodes with a large mixed centrality measure should be important, and define the masking probability of features based on the mixed centrality measure. Formally, we sample a random matrix , where M is the feature dimension and N is the number of nodes. Each element in is drawn from a Bernoulli distribution, i.e., . The C-FM augmentation method masks the feature matrix bywhere ∘ represents the dot product operation.
- Centrality-aware edge perturbation (C-EP). As shown in Figure 5c, C-EP augmentation adds or removes some edges in the graph. C-EP perturbs the edges in two steps: (1) For each edge , we delete it with probability proportional to Bernoulli distribution, i.e., , where and are the mixed centrality of and , respectively. (2) For each pair of unconnected nodes and , we add an edge with probability proportional to Bernoulli distribution, i.e., .
4.4. Heterogeneous Graph Attention Network (HGAT)
We have presented data augmentation methods to generate sub-graphs as views for contrastive learning. In this subsection, we propose HGAT to capture extensive structural and semantic information from the generated views. Heterogeneous graphs are composed of different types of nodes and edges. The features of nodes and edges differ in types and dimensionality. Compared with general heterogeneous graphs, the semantic graph and the skeleton graph are special cases with their own properties. In either the semantic graph or the skeleton graph, there is only one type of node. In this paper, we need to aggregate the direct neighbors connected through different types of edge. Compared with traditional heterogeneous graph attention networks [36], it is a lightweight model that has fewer parameters and trains faster.
Before we present HGAT, we first introduce semantic edge feature vectors. The feature vector of a semantic edge is a two-dimensional vector . Let us recall that a semantic edge connects two nodes and if either they share similar features, i.e., , or they have been visited by the same user o, i.e., , . Thus, if and share similar features, the first dimension of is defined as the similarity between their features, i.e., . Otherwise, the first dimension is defined as the number of users that have visited both and . In both cases, the second dimension is the shortest distance between and in the original geospatial graph.
As shown in Figure 6, HGAT calculates the representation for each node via an aggregation of information from structural neighbors, semantic neighbors and corresponding semantic edges as follows:
where is the weighted sum of the structural node representation of the target node at the l layer, is the aggregation of the semantic neighborhood node representation and the corresponding semantic edge representation at l layer, is the representation of at the l-th layer, is the node feature of node , is the features of the semantic edge , is the activation function, and are parameters to be learned, is the weight of the structural neighbor
and is the weight of semantic neighbors and the corresponding semantic edges
where , are the structural and semantic neighbors of node i and W are a parameters to be learned.
Finally, the outputs of HGAT are encoded by a MAP layer, i.e.,
where is the activation function, and are parameters to be learned.
4.5. Contrastive Learning
Most of the existing contrastive learning methods [9,10,11] take the same node under different views as positive examples. However, these methods overlook the problem of insufficient number of positive examples. To solve this problem, we take the semantic neighbors as the positive examples to expand the number of positive examples.
Please note that SE-GCL generates two views from the input graph by data augmentation and then maximizes the mutual information between encoded representations (i.e., the outputs of the MLP layer) of the two views. Let and denote encoded representation and the semantic neighbors of node in one of the view, and and denote encoded representation and the semantic neighbors of in the other view. Given a representation , its positive examples include , and . The negative samples consist of two parts: the set of all nodes except , denoted by , and ’s semantic neighbors in the same and different views, denoted by . The objective function for positive examples in different views is defined as follows:
where is the similarity between the representation of the same (semantic related) nodes in different views, represents the similarity between and its negative examples in same view, represents the similarity between and its negative examples in different views, is the cosine similarity function and is the temperature parameter. The objective function for each positive sample in the same view is calculated by:
where represents the similarity between the representation of semantic-related nodes in the same view. The objective function of a view is defined as follows:
The total objective function of SE-GCL is the sum of the objective functions of both views.
Given a semantic geospatial graph or skeleton graph, SE-GCL generates two views by E-RRW, C-NP, C-FM and C-EP in turn. The views are then transformed into the HGAT network. The outputs of HGAT are passed to a multi-layer perceptron (MLP) network to generate final representations of nodes. Finally, the contrastive training process constantly adjusts the parameters to shorten the distance between positive sample pairs, while pushing the distance between negative sample pairs.
5. Experiments
In this section, we conduct extensive experiments on three real-world geospatial datasets to demonstrate the effectiveness of our model. We begin with a brief introduction of the experimental setup, and then we present experimental results in comparison with the state-of-the-art baselines. After that, we perform ablation experiments to verify the validity of the modules in our model. Finally, we conduct extensive experiments on several non-geospatial datasets to evaluate the scalability of SE-GCL.
5.1. Datasets
We conduct experiments on three datasets including Gowalla, Brightkite and Nanjing POI.
- Gowalla and Brightkite. Gowalla and Brightkite [37] are social network datasets based on geolocation information, mainly composed of users’ check-in and geolocation information. We extract the maximum connected sub-graph from the original graph in our experimental study.
- Nanjing POI. The Nanjing POI dataset covers seven types of geographical location points: catering, public facilities, companies, medical treatment, accommodation, government and transportation facilities. Each record in the dataset consists of the following six parts: geolocation point type, longitude, latitude, province, city and street. The graph contains a total of 12,004 position nodes, 4,004,346 structural edges and 59,953 semantic edges.
The details of the datasets are reported in Table 1.
5.2. Experiment Setup
Evaluation tasks. In this experimental study, we consider three tasks to evaluate the effectiveness of our proposed approach.
- Node classification. In the Nanjing POI dataset, each node in the geospatial graph corresponds to a POI in real life. Each node is associated with a category attribute, which indicates the type of POI. The node classification task classifies the nodes based on their category. To evaluate the quality of the results, we employ F1-Macro and F1-Micro as the metrics. F1-Macro score is the unweighted mean of the F1 scores calculated per class. F1-Micro score is the normal F1 formula but calculated using the total number of true positives (TPs), false positives (FPs) and false negatives (FNs), instead of individually for each class.
- Node clustering. In the Brightkite and Gowalla datasets, each node in the geospatial graph corresponds to a location. Users have recorded their visits to different locations in the past. The node-clustering task divides the locations into multiple disjoint groups, such that the locations in the same group that are likely to be visited by the same set of users. To evaluate the quality of the clustering results, we propose adjusted purity as metric for the clustering task. Adjusted purity is a novel metric proposed in this paper to evaluate the quality of clustering results. Intuitively, the locations visited by the same user are likely to be similar. Hence, we assume that the locations visited by the same user belong to the same cluster. Given n clusters , the adjusted purity score is defined as:where is the set of locations that u has visited and represents the clustering set.
- Parameters and Baselines. For all datasets, SE-GCL uses a two-layer HGAT as the encoder, and Adam as the model optimizer, the number of training batches is set to 100 and the dimension of MLP layers is set to 16.
We compare SE-GCL with the following two types of models: (1) Supervised graph neural network methods: GCN [23], GAT [24] and GraphSAGE [25], (2) Graph contrastive learning methods: GRACE [10], GCA [14], ProGCL [38], BGRL [12] and GBT [14]. For all baseline methods, we adopt the parameters suggested in their papers. In the classification tasks, we alternate logistic regression, SVM and random forest as classifiers, and report the best performing results. The input data are randomly divided into training, testing and validation sets with a ratio of 7:2:1. For all the experiments, except the ablation study (effect of augmentations), we apply all the four methods to the graph. The ratio of the E-RRW is set to 0.2. The ratios of the C-NP, C-EP and C-FM are set to 0.3.
5.3. Experimental Results
5.3.1. Overall Evaluation
Table 2 the shows the adjusted purity of all comparison unsupervised representation methods in the node-clustering task in Gowalla and Brightkite. We observe that SE-GCL achieves the best performance on both datasets. Specifically, it is 21.03% and 13.33% higher than the baselines on Govalla and Brightkite on average, respectively.
SE-GCL is higher than supervised representation methods GRACE, GCA and ProGCL by 23.15%, 18.49% and 20.24% on the Gowalla dataset, and 13.01%, 11.73% and 13.95% on the Brightkite dataset, respectively. Compared with negative example-based graph contrastive learning models, SE-GCL is 18.66% and 24.59% higher than BGRL and GBT on the Gowalla dataset, and 12.3% and 15.65% on the Brightkite dataset, respectively. Existing contrastive learning methods only consider the structural neighbors and ignore the semantic information. Hence, they perform worse than the proposed method. Therefore, the results demonstrate the superiority of our proposed approach in the node-clustering task.
Table 3 shows the node classification task on the Nanjing POI dataset. We observe graph neural network models perform worse than graph contrastive learning models. GCN is the worst method. BGRL is the best baseline in the classification task. The proposed SE-GCL achieves the best performance. It is % and % higher than the best baseline BGRL with regard to F1-Micro and F1-Macro, respectively, and % and % higher the worst baseline GCN with regard to F1-Micro and F1-Macro, respectively.
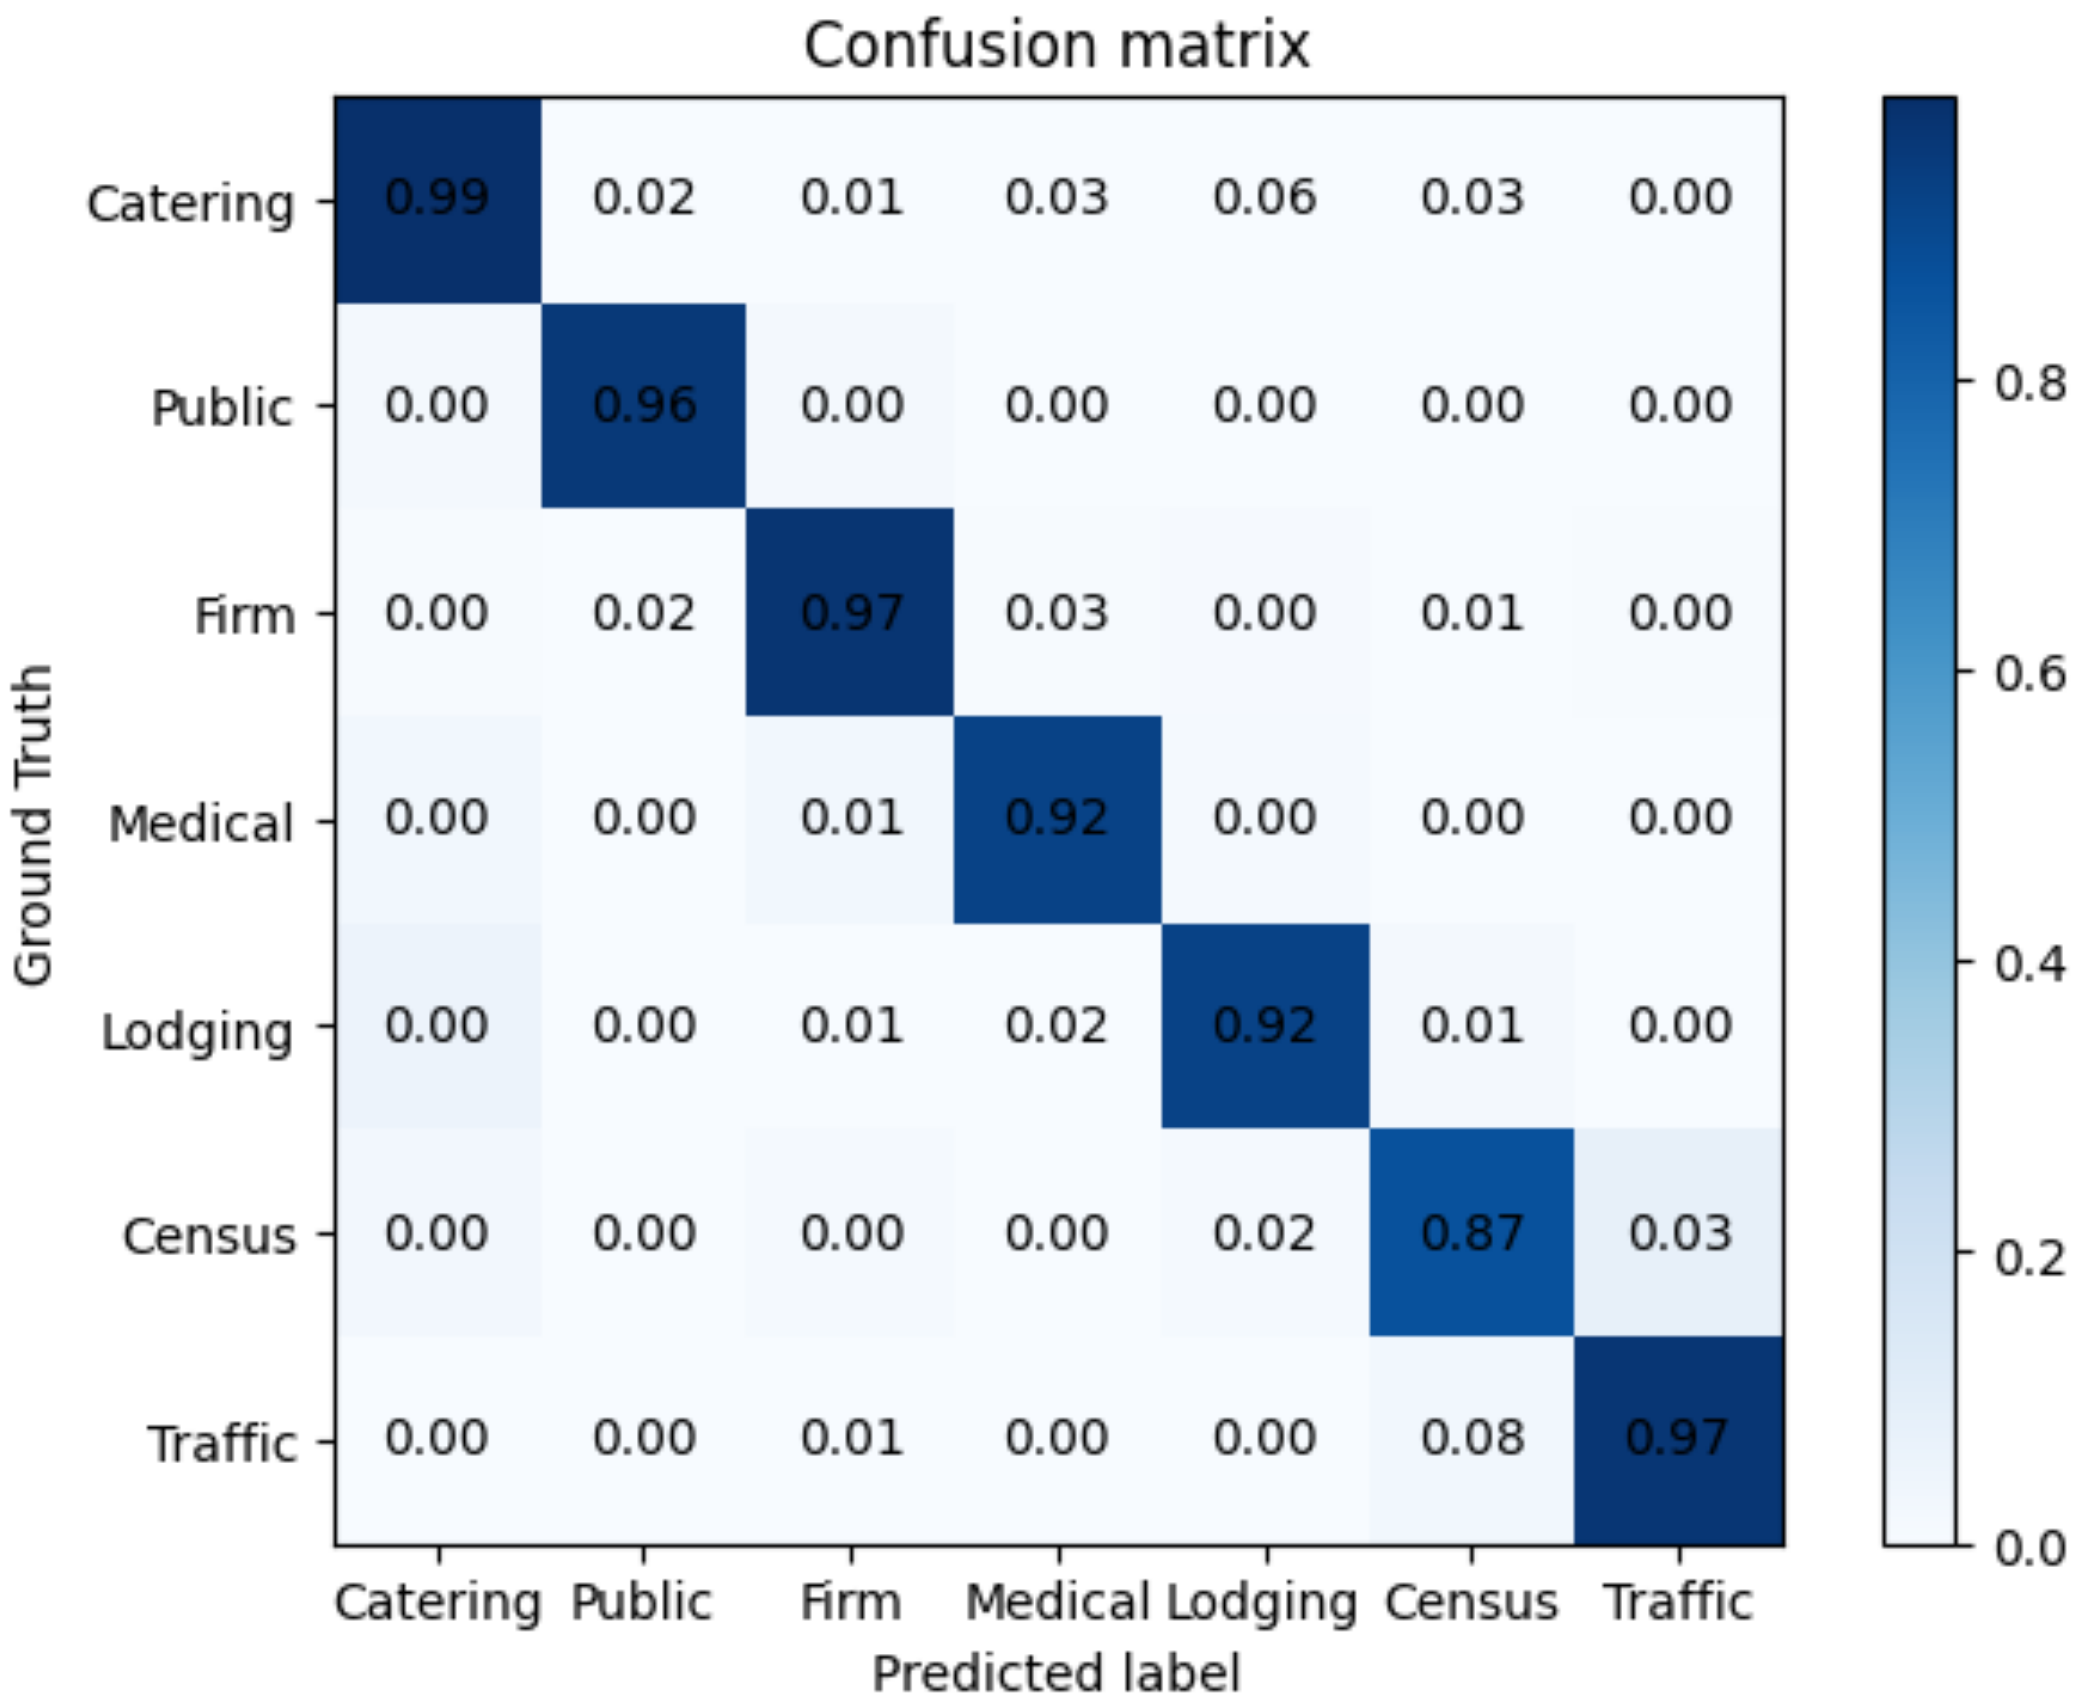
Figure 7 shows the confusion matrix of SE-GCL on the Nanjing POI dataset. The confusion matrix is an error matrix commonly used to visualize the classification performance of a model, where the value of the diagonal element represents the classification accuracy of a particular category. The larger the value of the element on the diagonal of the confusion matrix diagram, the darker the square color on the diagonal. From Figure 7, we observe that the color of the square in the diagonal line is darker, while the color of other areas is lighter, which reflects that SE-GCL has achieved a good classification effect for each node category.
5.3.2. Effects of Data Augmentations
In order to verify the effectiveness of proposed data augmentation methods, we conducted extensive experiments on different data augmentation strategies.
Table 4 shows the comparison of proposed data augmentations and existing data augmentations in the clustering tasks. We see that the performance of the improved data augmentations are better than that of the original data augmentations. The score of E-RRW is 13% higher than that of RRW. C-NP + C-FM + C-EP is 1.93% higher than NP + FM + EP. E-RRW + C-NP + C-FM + C-EP is 12.6% higher than RRW + NP + FM + EP. In the Brightkite dataset, E-RRW is 5.88% higher than that of the RRW strategy. C-NP + C-FM + C-EP is 6.46% higher than NP + FM + EP. E-RRW + C-NP + C-FM + C-EP is 8% higher than RRW + AM + ND + ER.
Table 5 shows the comparison of the proposed data augmentations and existing data augmentations in the classification tasks. We observe that the F1-Micro and F1-Macro of E-RRW are 3.41% and 4.98% higher than RRW, respectively. The F1-Macro of E-RRW + C-NP + C-FM + C-EP is 5.33% higher than RRW+NP + FM + EP. This is because E-RRW samples the sub-graphs based on the mixed centrality measure, which preserves the important structural and semantic information in the graph. On the contrary, the original RRW samples sub-graphs based on random walk, which may break the critical information. In addition, we observe that combining different data augmentations improves the performance of the model. Combining all the proposed data augmentations achieves the best performance.
In summary, the proposed mixed centrality measure can improve the data augmentation method. All data augmentation methods contribute to the improvement the performance.
5.3.3. Effects of Encoding Networks
To verify the effectiveness of the proposed encoding network, we replace HGAT with GAT and show the comparison of their experimental results in Table 6 and Table 7.
As can be seen in Table 6 and Table 7, HGAT achieves the best performance in all tasks. In the clustering tasks, the scores of the SE-GCL with the HGAT encoder are and higher than the SE-GCL with the GAT encoder in the Gowalla and Brightkite datasets, respectively. In classification tasks, HGAT is and higher than GAT with regard to F1-Micro and F1-Macro, respectively. This is because the traditional GAT encoder ignores the heterogeneous information in the graph and has relatively limited information capture ability. The above experiments show that the HGAT encoder is able to capture useful information more effectively in classification and clustering tasks compared to the traditional GAT.
5.3.4. Effects of Learning Methods
Traditional contrastive learning methods take the representations of the same node under different views as positive samples. In Section 4.5, we propose to take the representations of semantic neighbors as well as the same node as the positive samples. In this set of experiments, we evaluate the effects of different learning methods.
Table 8 and Table 9 show the comparison of the proposed learning method and traditional methods. We observe that the proposed learning method outperforms the traditional learning method in all tasks. In the clustering task, the scores of the proposed leaning method are 15.58% and 10.63% higher than the traditional method in the Gowalla and Brightkite datasets, respectively. In the node classification task, the proposed method is 2.75% and 3.51% higher than the traditional method with regard to F1-Micro and F1-Macro, respectively. These results show that the learning method designed in this paper can better explore the relationship between semantic-related nodes and further achieve better performance in downstream tasks.
5.4. Performance on Non-Geospatial Graphs
The previous results have shown the effectiveness of our proposed approach in both the node classification task and the node clustering task on geospatial graphs. Our approach is a general approach and can also be applied to non-geospatial graphs. In this subsection, we evaluate the proposed approach on non-geospatial graphs with two tasks: node classification and graph classification.
5.4.1. Node Classification in Non-Geospatial Graphs
- Experimental setting. In this set of experiments, we use the F1-score as the evaluation metric. We use five non-geospatial datasets in node classification tasks. The Cora [39] dataset and the Wiki-CS [40] dataset are citation datasets based on citations to papers and Wikipedia entries, respectively. The Cora dataset covers a total of seven different categories, and each node has 1433 feature dimensions. Wiki-CS covers 10 different categories of data samples, with a total of 11,701 edges and 216,123 edges.The Amazon-Computers [41] dataset is a syndicated purchase graph extracted from the Amazon platform, with nodes representing goods and edges representing syndicated purchase relationships between goods, including 10 different node categories. The Darknet [42] dataset covers eight specific application types in normal traffic and malicious traffic, and we sample from the original dataset in the experiments. The details of these datasets are shown in Table 10.
- Overall evaluation.Table 11 shows the experimental results of node classification. We observe that SE-GCL outperforms all baselines on all datasets. First, the graph neural network models (GCN, GAT and GraphSAGE) are 7.96%, 4.87%, 9.12% and 6.97% lower than the SE-GCL model on Darknet, WikiCS, Cora and Amazon_Computers on average, respectively, which shows that SE-GCL is better than the graph neural network models. Second, the performance of SE-GCL is much higher than that of commonly used contrastive learning models. The F1-scores obtained by SE-GCL on the Darknet, WikiCS, Cora and Amazon-Computers datasets are 3.37%, 6.41%, 4.79% and 5.58% higher than GCA, respectively. As an improved model of GCA, the ProGCL model achieves the best performance in all baselines on the WikiCS and Cora datasets. However, its performance on these two datasets is still 1.63% and 4.42% lower than SE-GCL, respectively. BGRL is 3.19% lower than SE-GCL on the Amazon_computers dataset, although it achieves the best performance among the baselines on the Amazon_computers dataset. SE-GCL is 3.37% higher than best baseline GBT on the Darknet dataset.
- Effects of each component. In order to justify the design of each module, we evaluate the variants of the SE-GCL. Table 12 shows the performance of different data augmentations on node classification. We observe that the data augmentations proposed in this paper are better than the original data augmentations in all datasets. Table 13 shows the comparison of different encoding networks. The F1-scores of the HGAT are 0.38%, 2.94%, 0.94% and 2.84% higher than those of the traditional GAT on the Darknet, Cora, WikiCS and Amazon-Computers datasets, respectively. Table 14 shows the experimental results with regard to different learning methods. HGAT is 6.25% higher than GAT on the Cora dataset. This is because the traditional contrastive learning methods ignore the mining of sufficient positive samples, and SE-GCL compensates for this deficiency to some extent.
5.4.2. Graph Classification Tasks
- Datasets. In the graph classification task, we use four datasets including PTC_MR [43], MUTAG [44], PROTEINS [45] and IMDB_BINARY [46]. PTC_MR contains a total of 344 sub-graphs. Each sub-graph represents a compound molecule, according to whether it has carcinogenicity delineating the corresponding sub-graphs label. MUTAG has a total of 188 sub-graphs. Each sub-graph represents a nitro compound molecule. The category label represents whether the molecule is mutagenic aromatic or heteroaromatic. PROTEINS is a graph classification dataset composed of 1113 protein molecules, in which nodes represent amino acids. If the distance between nodes is less than a specific threshold, an edge is added between the corresponding nodes. The label represents whether the current protein molecule is enzymatic or non-enzymatic. IMDB_BINARY is a large-scale social network graph. It contains a total of 1000 sub-graphs. In each sub-graph, nodes represent actors/actresses, and there is an edge between them if they appear in the same movie. The sub-graph label represents the movie category of the current sub-graph. The details of the datasets are shown in Table 15.
- Experimental results. The experimental results on the four graph classification datasets are shown in Table 16. We observe that SE-GCL achieves the best classification performance in the four graph classification datasets. First, the performance of SE-GCL is 3.5% and 2.5% higher than the SOTA methods GraphCL and AD-GCL with regard to datasets PTC_MR and MUTAG, respectively. The performance of SE-GCL is 10% and 6% higher than the SOTA method GAT in IMDB_BINARY and PROTEINS, respectively.
In summary, the performance of SE-GCL outperforms existing supervised representation models and contrastive learning models in multiple non-geospatial datasets. These results show that the proposed method has good scalability and can be well extended to other applications.
6. Conclusions
Geospatial data representation is a challenging but critical task nowadays. To address this problem, we propose a novel model named SE-GCL. First, we generate a semantic geolocation graph and a skeleton graph to preserve the general relationships between geo-locations. Then, we propose four mixed centrality measure-based data augmentation methods. Finally, we propose HGAT to aggregate information from both the structural and semantic neighbors. The experiments demonstrate that SE-GCL outperforms state-of-the-art methods significantly and has good scalability. In the future work, we will explore more methods to combine the skeleton graph representation and semantic graph representation in an unsupervised way.
Author Contributions
Conceptualization, L.F. and Z.K.; methodology, L.F., Z.K. and Y.Y.; software, Z.K. and L.F.; validation, Z.K., L.F. and Y.Y.; formal analysis, L.F. and Z.K.; investigation, L.F. and Z.K.; resources, L.F., Z.K. and T.L.; data curation, L.F. and Z.K.; writing—original draft preparation, Z.K. and L.F.; writing—review and editing, L.F.; visualization, L.F. and Z.K.; supervision, L.F. and T.L.; project administration, L.F. and T.L.; funding acquisition, L.F. and T.L. All authors have read and agreed to the published version of the manuscript.
Funding
This research was funded by the National Natural Science Foundation of China (Grant No. 61906039), Youth Scholar Program of SEU, and the Fundamental Research Funds for the Central Universities (Grant No. 2242022k30007).
Data Availability Statement
The geospatial dataset Gowalla comes from https://snap.stanford.edu/data/loc-Gowalla.html (accessed on 8 June 2022), Brightkite comes from https://snap.stanford.edu/data/loc-brightkite.html (accessed on 8 June 2022), and Nanjing POI comes from https://github.com/zhouqiangnju/Nanjing-POI (accessed on 8 June 2022). The non-geospatial dataset CIC-Darknet2020 comes from https://www.unb.ca/cic/datasets/darknet2020.html (accessed on 10 June 2022), WikiCS comes from https://github.com/pmernyei/wiki-cs-dataset (accessed on 10 June 2022), Cora comes from https://linqs.org/datasets/#cora (accessed on 11 June 2022) and Amazon-Computers comes from https://www.cs.cit.tum.de/daml/gnn-benchmark/ (accessed on 8 June 2022). PTC_MR, MUTAG, PROTEINS and IMDB-BINARY come from https://chrsmrrs.github.io/datasets/docs/datasets/ (accessed on 10 June 2022).
Conflicts of Interest
The authors declare no conflict of interest.
References
- Yu, X.; Lu, S.; Guo, L.; Wang, S.H.; Zhang, Y.D. ResGNet-C: A graph convolutional neural network for detection of COVID-19. Neurocomputing 2021, 452, 592–605. [Google Scholar] [CrossRef]
- Zhang, Y.D.; Satapathy, S.C.; Guttery, D.S.; Górriz, J.M.; Wang, S.H. Improved breast cancer classification through combining graph convolutional network and convolutional neural network. Inf. Process. Manag. 2021, 58, 102439. [Google Scholar] [CrossRef]
- Wang, S.H.; Govindaraj, V.V.; Górriz, J.M.; Zhang, X.; Zhang, Y.D. COVID-19 classification by FGCNet with deep feature fusion from graph convolutional network and convolutional neural network. Inf. Fusion 2021, 67, 208–229. [Google Scholar] [CrossRef]
- Chen, G.; Wu, J.; Yang, W.; Bashir, A.K.; Li, G.; Hammoudeh, M. Leveraging graph convolutional-LSTM for energy-efficient caching in blockchain-based green IoT. IEEE Trans. Green Commun. Netw. 2021, 5, 1154–1164. [Google Scholar] [CrossRef]
- Li, G.; Wu, J.; Li, S.; Yang, W.; Li, C. Multitentacle Federated Learning Over Software-Defined Industrial Internet of Things Against Adaptive Poisoning Attacks. IEEE Trans. Ind. Inform. 2022, 19, 1260–1269. [Google Scholar] [CrossRef]
- Bengio, Y.; Courville, A.; Vincent, P. Representation learning: A review and new perspectives. IEEE Trans. Pattern Anal. Mach. Intell. 2013, 35, 1798–1828. [Google Scholar] [CrossRef]
- Perozzi, B.; Al-Rfou, R.; Skiena, S. Deepwalk: Online learning of social representations. In Proceedings of the 20th ACM SIGKDD International Conference on Knowledge Discovery and Data Mining, New York, NY, USA, 24–27 August 2014; pp. 701–710. [Google Scholar]
- Grover, A.; Leskovec, J. node2vec: Scalable feature learning for networks. In Proceedings of the 22nd ACM SIGKDD International Conference on Knowledge Discovery and Data Mining, San Francisco, CA, USA, 13–17 August 2016; pp. 855–864. [Google Scholar]
- You, Y.; Chen, T.; Sui, Y.; Chen, T.; Wang, Z.; Shen, Y. Graph contrastive learning with augmentations. Adv. Neural Inf. Process. Syst. 2020, 33, 5812–5823. [Google Scholar]
- Zhu, Y.; Xu, Y.; Yu, F.; Liu, Q.; Wu, S.; Wang, L. Deep graph contrastive representation learning. arXiv 2020, arXiv:2006.04131. [Google Scholar]
- Zhu, Y.; Xu, Y.; Yu, F.; Liu, Q.; Wu, S.; Wang, L. Graph contrastive learning with adaptive augmentation. In Proceedings of the Web Conference 2021, Ljubljana, Slovenia, 19–23 April 2021; pp. 2069–2080. [Google Scholar]
- Thakoor, S.; Tallec, C.; Azar, M.G.; Munos, R.; Veličković, P.; Valko, M. Bootstrapped representation learning on graphs. In Proceedings of the ICLR 2021 Workshop on Geometrical and Topological Representation Learning, Vienna, Austria, 4–8 May 2021. [Google Scholar]
- Sun, F.Y.; Hoffmann, J.; Verma, V.; Tang, J. InfoGraph: Unsupervised and Semi-supervised Graph-Level Representation Learning via Mutual Information Maximization. arXiv 2019, arXiv:1908.01000. [Google Scholar]
- Bielak, P.; Kajdanowicz, T.; Chawla, N.V. Graph Barlow Twins: A self-supervised representation learning framework for graphs. arXiv 2021, arXiv:2106.02466. [Google Scholar] [CrossRef]
- Wang, X.; Zhu, M.; Bo, D.; Cui, P.; Shi, C.; Pei, J. Am-gcn: Adaptive multi-channel graph convolutional networks. In Proceedings of the 26th ACM SIGKDD International Conference on Knowledge Discovery & Data Mining, Virtual, 6–10 July 2020; pp. 1243–1253. [Google Scholar]
- Jin, W.; Derr, T.; Wang, Y.; Ma, Y.; Liu, Z.; Tang, J. Node similarity preserving graph convolutional networks. In Proceedings of the 14th ACM international conference on Web Search and Data Mining, Virtual, 8–12 March 2021; pp. 148–156. [Google Scholar]
- Wang, L.; Wang, C.; Xing, X.; Forman, J.; Ying, L. Detecting dominant locations from search queries. In Proceedings of the SIGIR05: The 28th ACM/SIGIR International Symposium on Information Retrieval 2005, Salvador, Brazil, 15–19 August 2005. [Google Scholar]
- Han, B.; Cook, P.; Baldwin, T. Geolocation Prediction in Social Media Data by Finding Location Indicative Words. In Proceedings of the Coling, Mumbai, India, 8–15 December 2012. [Google Scholar]
- Christoforidis, G.; Kefalas, P.; Papadopoulos, A.; Manolopoulos, Y. Recommendation of points-of-interest using graph embeddings. In Proceedings of the 2018 IEEE 5th International Conference on Data Science and Advanced Analytics (DSAA), Turin, Italy, 1–3 October 2018; IEEE: Piscataway, NJ, USA, 2018; pp. 31–40. [Google Scholar]
- Wang, Y.; Sun, H.; Zhao, Y.; Zhou, W.; Zhu, S. A Heterogeneous Graph Embedding Framework for Location-Based Social Network Analysis in Smart Cities. IEEE Trans. Ind. Inform. 2020, 16, 2747–2755. [Google Scholar] [CrossRef]
- Mai, G.; Janowicz, K.; Cai, L.; Zhu, R.; Regalia, B.; Yan, B.; Shi, M.; Lao, N. SE-KGE: A location-aware Knowledge Graph Embedding model for Geographic Question Answering and Spatial Semantic Lifting. arXiv 2020, arXiv:2004.14171. [Google Scholar] [CrossRef]
- Wang, C.; Yuan, M.; Zhang, R.; Peng, K.; Liu, L. Efficient Point-of-Interest Recommendation Services with Heterogenous Hypergraph Embedding. IEEE Trans. Serv. Comput. 2022, 2. [Google Scholar] [CrossRef]
- Kipf, T.N.; Welling, M. Semi-supervised classification with graph convolutional networks. arXi 2016, arXiv:1609.02907. [Google Scholar]
- Veličković, P.; Cucurull, G.; Casanova, A.; Romero, A.; Lio, P.; Bengio, Y. Graph attention networks. arXiv 2017, arXiv:1710.10903. [Google Scholar]
- Hamilton, W.; Ying, Z.; Leskovec, J. Inductive representation learning on large graphs. In Proceedings of the 31st International Conference on Neural Information Processing Systems December, Los Angeles, CA, USA, 4–9 December 2017; pp. 1025–1035. [Google Scholar]
- Pei, H.; Wei, B.; Chang, C.C.; Lei, Y.; Yang, B. Geom-GCN: Geometric Graph Convolutional Networks. arXiv 2020, arXiv:2002.05287. [Google Scholar]
- Velikovi, P.; Fedus, W.; Hamilton, W.L.; Liò, P.; Bengio, Y.; Hjelm, R.D. Deep Graph Infomax. arXiv 2018, arXiv:1809.10341. [Google Scholar]
- Hassani, K.; Khasahmadi, A.H. Contrastive Multi-View Representation Learning on Graphs. In Proceedings of the 37th International Conference on Machine Learning, Virtual, 13–18 July 2020. [Google Scholar]
- Hassani, K.; Khasahmadi, A.H. Learning Graph Augmentations to Learn Graph Representations. arXiv 2022, arXiv:2201.09830. [Google Scholar]
- Park, H.; Lee, S.; Kim, S.; Park, J.; Jeong, J.; Kim, K.M.; Ha, J.W.; Kim, H.J. Metropolis-Hastings Data Augmentation for Graph Neural Networks. arXiv 2022, arXiv:2203.14082. [Google Scholar]
- Chen, D.B.; Gao, H.; Lü, L.; Zhou, T. Identifying Influential Nodes in Large-Scale Directed Networks: The Role of Clustering. PLoS ONE 2013, 8, e77455. [Google Scholar] [CrossRef]
- Page, L.; Brin, S.; Motwani, R.; Winograd, T. The PageRank Citation Ranking: Bringing Order to the Web. In Stanford Digital Libraries Working Paper; Stanford InfoLab: Stanford, CA, USA, 1998. [Google Scholar]
- Liu, J.; Xiong, Q.; Shi, W.; Shi, X.; Wang, K. Evaluating the importance of nodes in complex networks. Phys. A Stat. Mech. Appl. 2016, 452, 209–219. [Google Scholar] [CrossRef]
- Bavelas; Alex. Communication Patterns in Task-Oriented Groups. J. Acoust. Soc. Am. 1950, 22, 725–730. [Google Scholar] [CrossRef]
- Bai, J.; Ren, Y.; Zhang, J. Ripple Walk Training: A Sub-graph-based Training Framework for Large and Deep Graph Neural Network. In Proceedings of the International Joint Conference on Neural Network, Montreal, QC, Canada, 7–15 January 2021; pp. 1–8. [Google Scholar]
- Wang, X.; Ji, H.; Shi, C.; Wang, B.; Ye, Y.; Cui, P.; Yu, P.S. Heterogeneous graph attention network. In Proceedings of the World Wide Web Conference, San Francisco, CA, USA, 13–17 May 2019; pp. 2022–2032. [Google Scholar]
- Cho, E.; Myers, S.A.; Leskovec, J. Friendship and mobility: User movement in location-based social networks. In Proceedings of the 17th ACM SIGKDD International Conference on Knowledge Discovery and Data Mining, San Diego, CA, USA, 21–24 August 2011. [Google Scholar]
- Xia, J.; Wu, L.; Wang, G.; Chen, J.; Li, S.Z. Progcl: Rethinking hard negative mining in graph contrastive learning. In Proceedings of the International Conference on Machine Learning. PMLR, Baltimore, MA, USA, 17–23 July 2022; pp. 24332–24346. [Google Scholar]
- Sen, P.; Namata, G.; Bilgic, M.; Getoor, L.; Eliassi-Rad, T. Collective Classification in Network Data. AI Mag. 2008, 29, 93. [Google Scholar] [CrossRef]
- Mernyei, P.; Cangea, C. Wiki-CS: A Wikipedia-Based Benchmark for Graph Neural Networks. arXiv 2020, arXiv:2007.02901. [Google Scholar]
- Shchur, O.; Mumme, M.; Bojchevski, A.; Günnemann, S. Pitfalls of Graph Neural Network Evaluation. arXiv 2018, arXiv:1811.05868. [Google Scholar]
- Lashkari, A.H.; Kaur, G.; Rahali, A. DIDarknet: A Contemporary Approach to Detect and Characterize the Darknet Traffic using Deep Image Learning. In Proceedings of the 2020 the 10th International Conference on Communication and Network Security (ICCNS 2020), Tokyo, Japan, 27–29 November 2020. [Google Scholar]
- Shervashidze, N.; Schweitzer, P.; Jan, E.; Leeuwen, V.; Borgwardt, K.M. Weisfeiler-Lehman Graph Kernels. J. Mach. Learn. Res. 2011, 12, 2539–2561. [Google Scholar]
- Debnath, A.K.; Lopez de Compadre, R.L.; Debnath, G.; Shusterman, A.J.; Hansch, C. Structure-activity relationship of mutagenic aromatic and heteroaromatic nitro compounds. Correlation with molecular orbital energies and hydrophobicity. J. Med. Chem. 1991, 34, 786–797. [Google Scholar] [CrossRef]
- Dobson, P.D.; Doig, A.J. Distinguishing Enzyme Structures from Non-enzymes Without Alignments. J. Mol. Biol. 2003, 330, 771–783. [Google Scholar] [CrossRef] [Green Version]
- Yanardag, P.; Vishwanathan, S.V.N. Deep Graph Kernels. In Proceedings of the the 21th ACM SIGKDD International Conference, Sydney, Australia, 10–13 August 2015. [Google Scholar]
Figure 1.
(a–d) Challenges of geospatial graph representation.
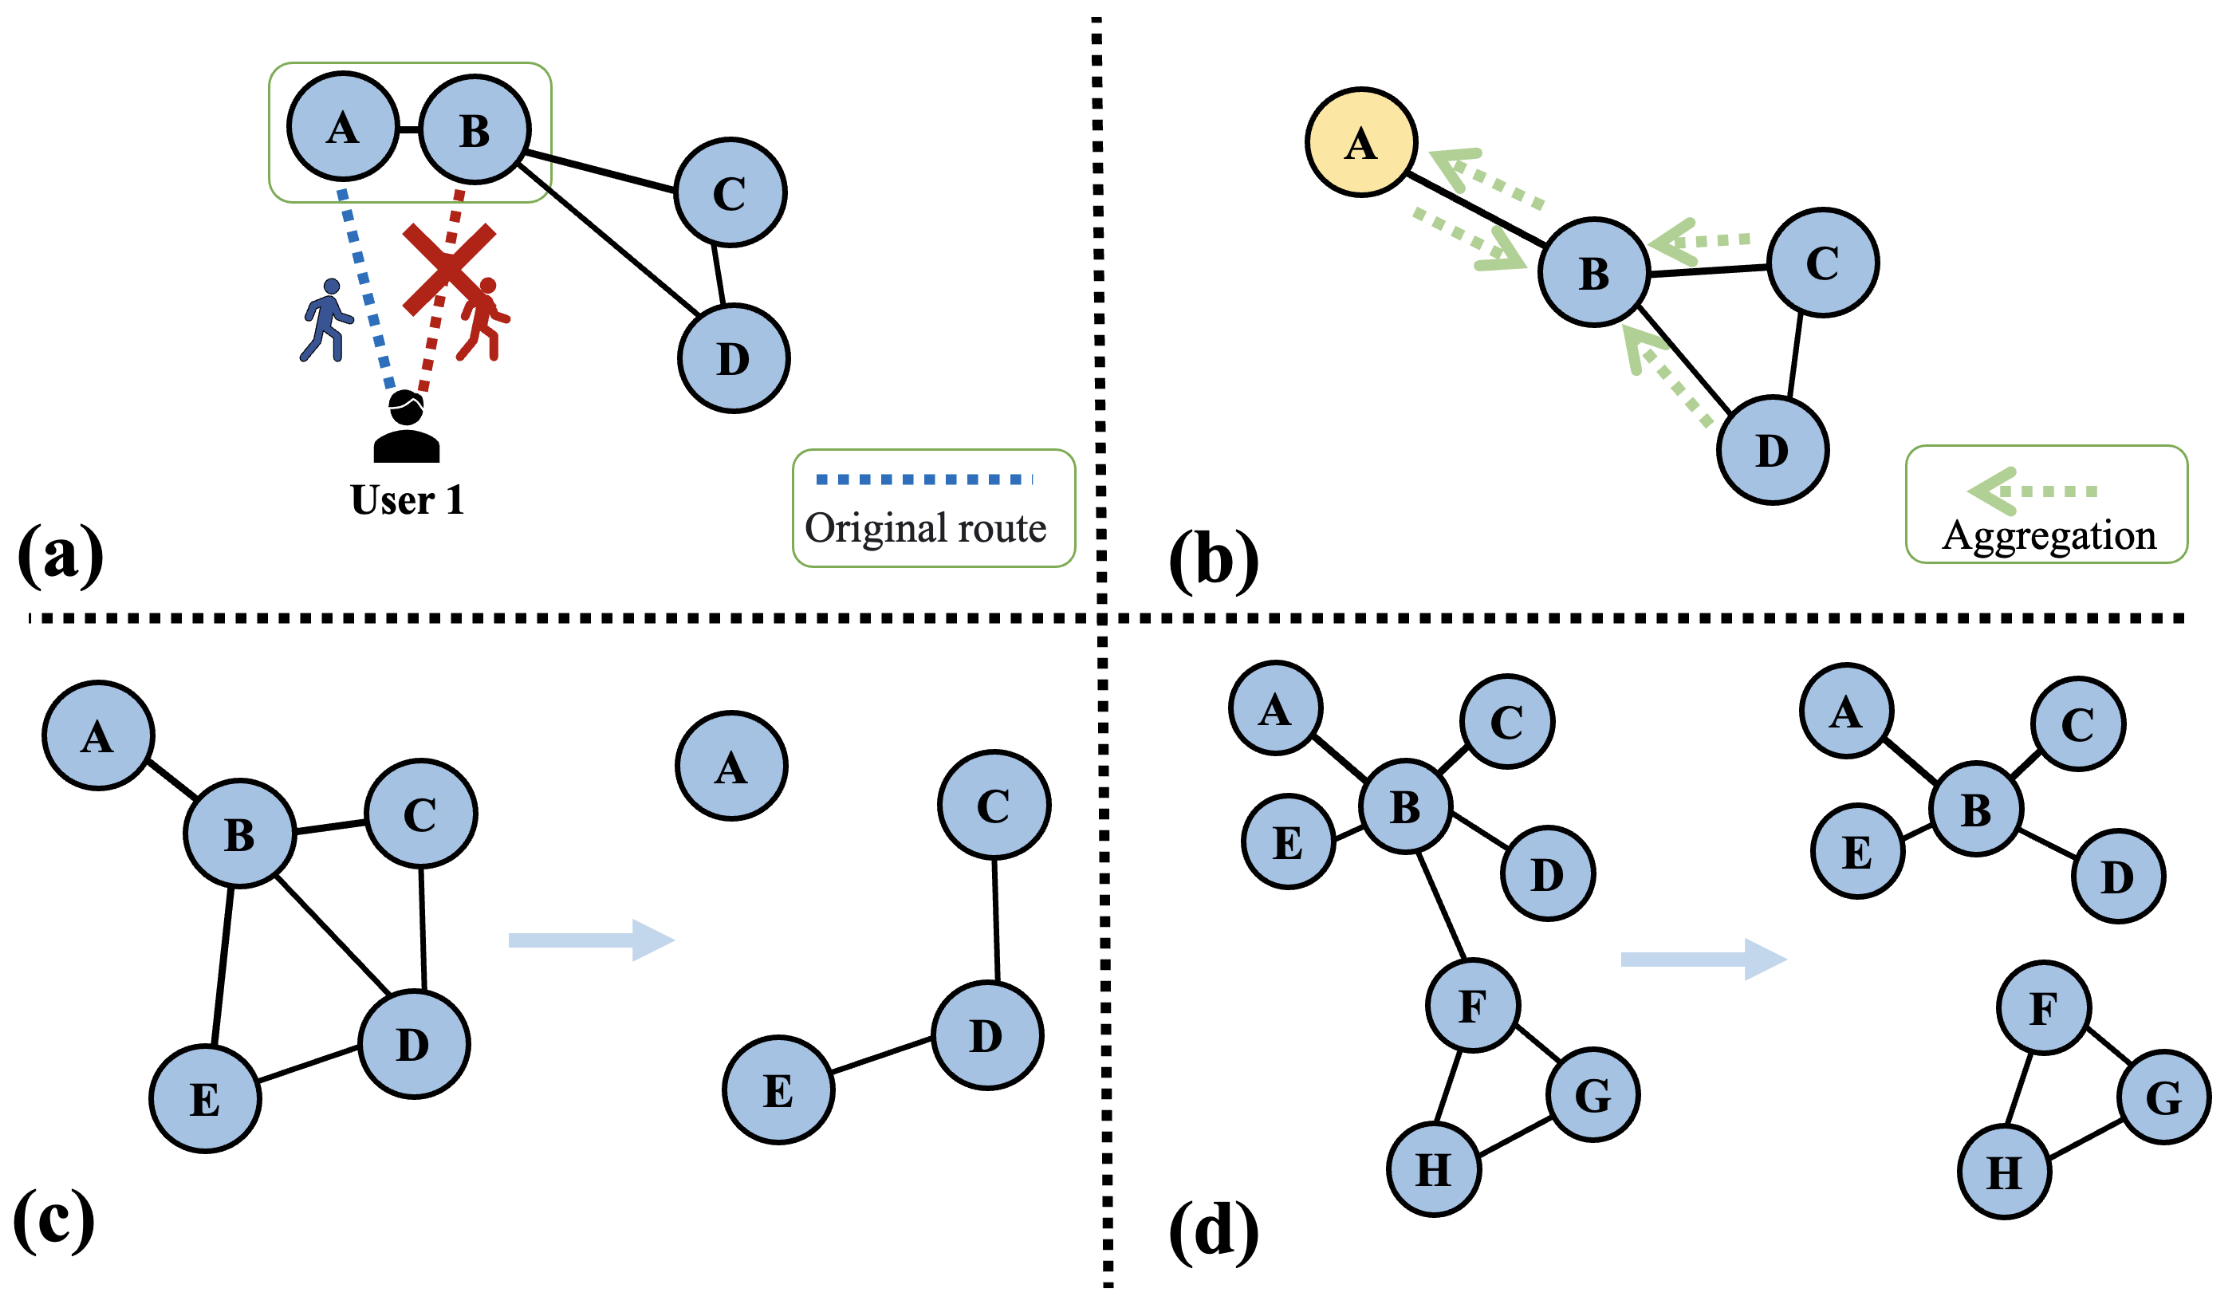
Figure 2.
An example of semantic geospatial graph and skeleton graph. The structural edges are colored in black, while the semantic edges are marked as red dashed lines.
Figure 2.
An example of semantic geospatial graph and skeleton graph. The structural edges are colored in black, while the semantic edges are marked as red dashed lines.
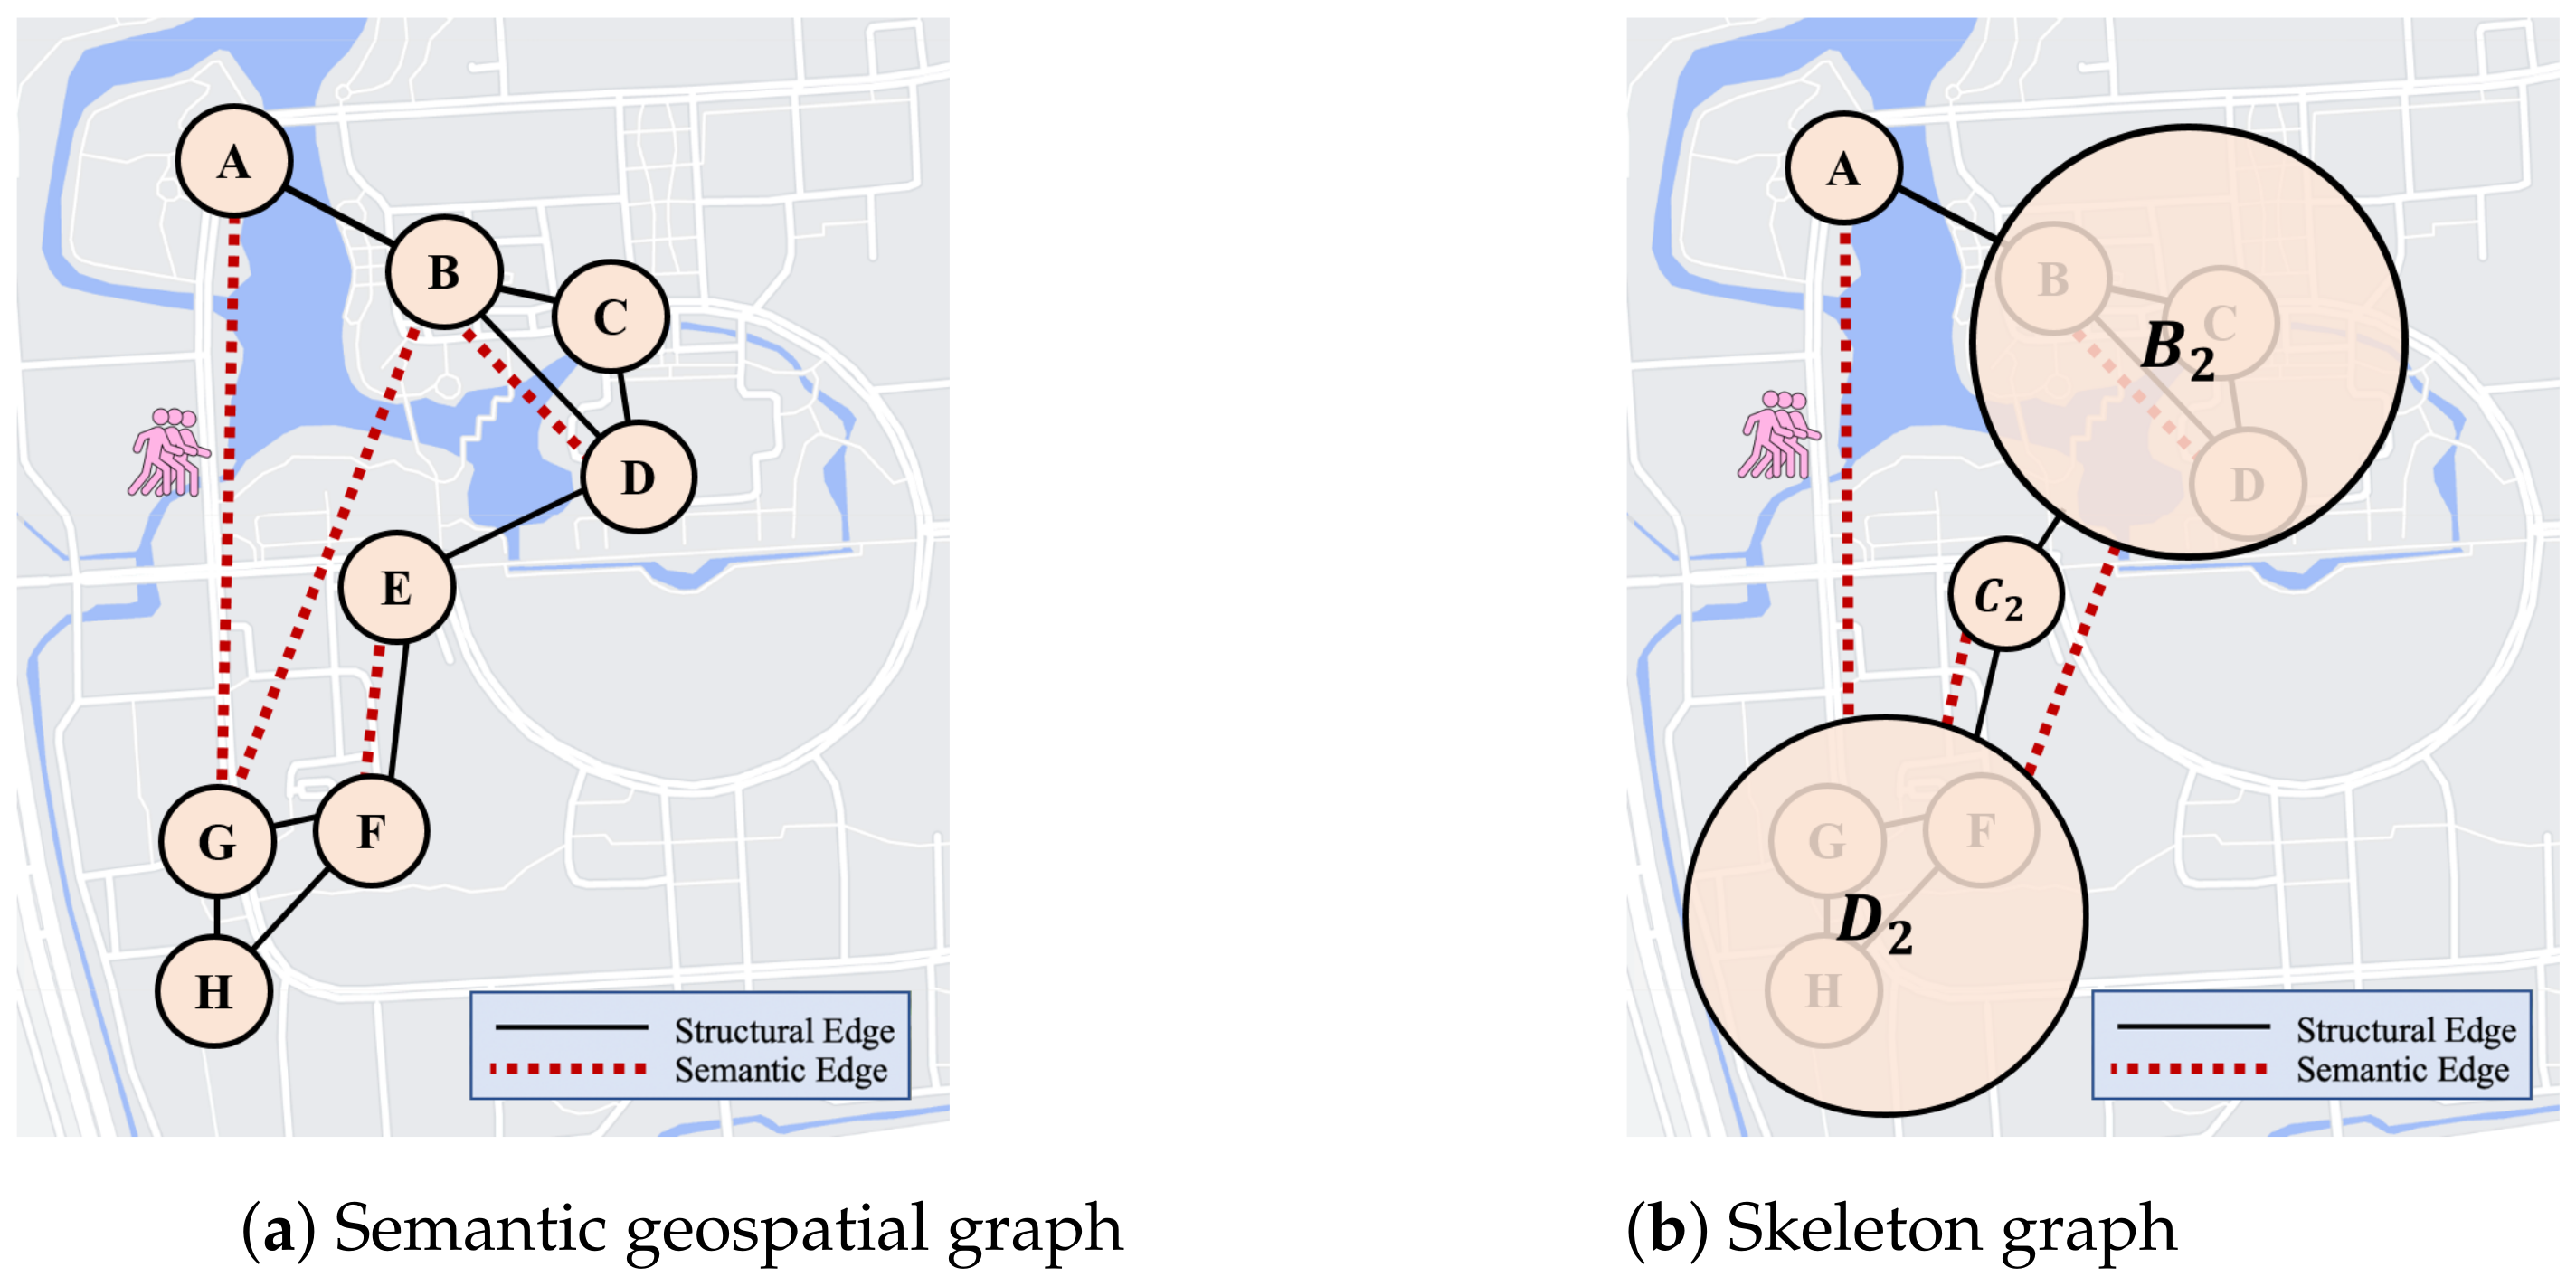
Figure 3.
The proposed framework for SE-GCL model. The left side is the overall framework. The right side is the detailed learning process.
Figure 3.
The proposed framework for SE-GCL model. The left side is the overall framework. The right side is the detailed learning process.
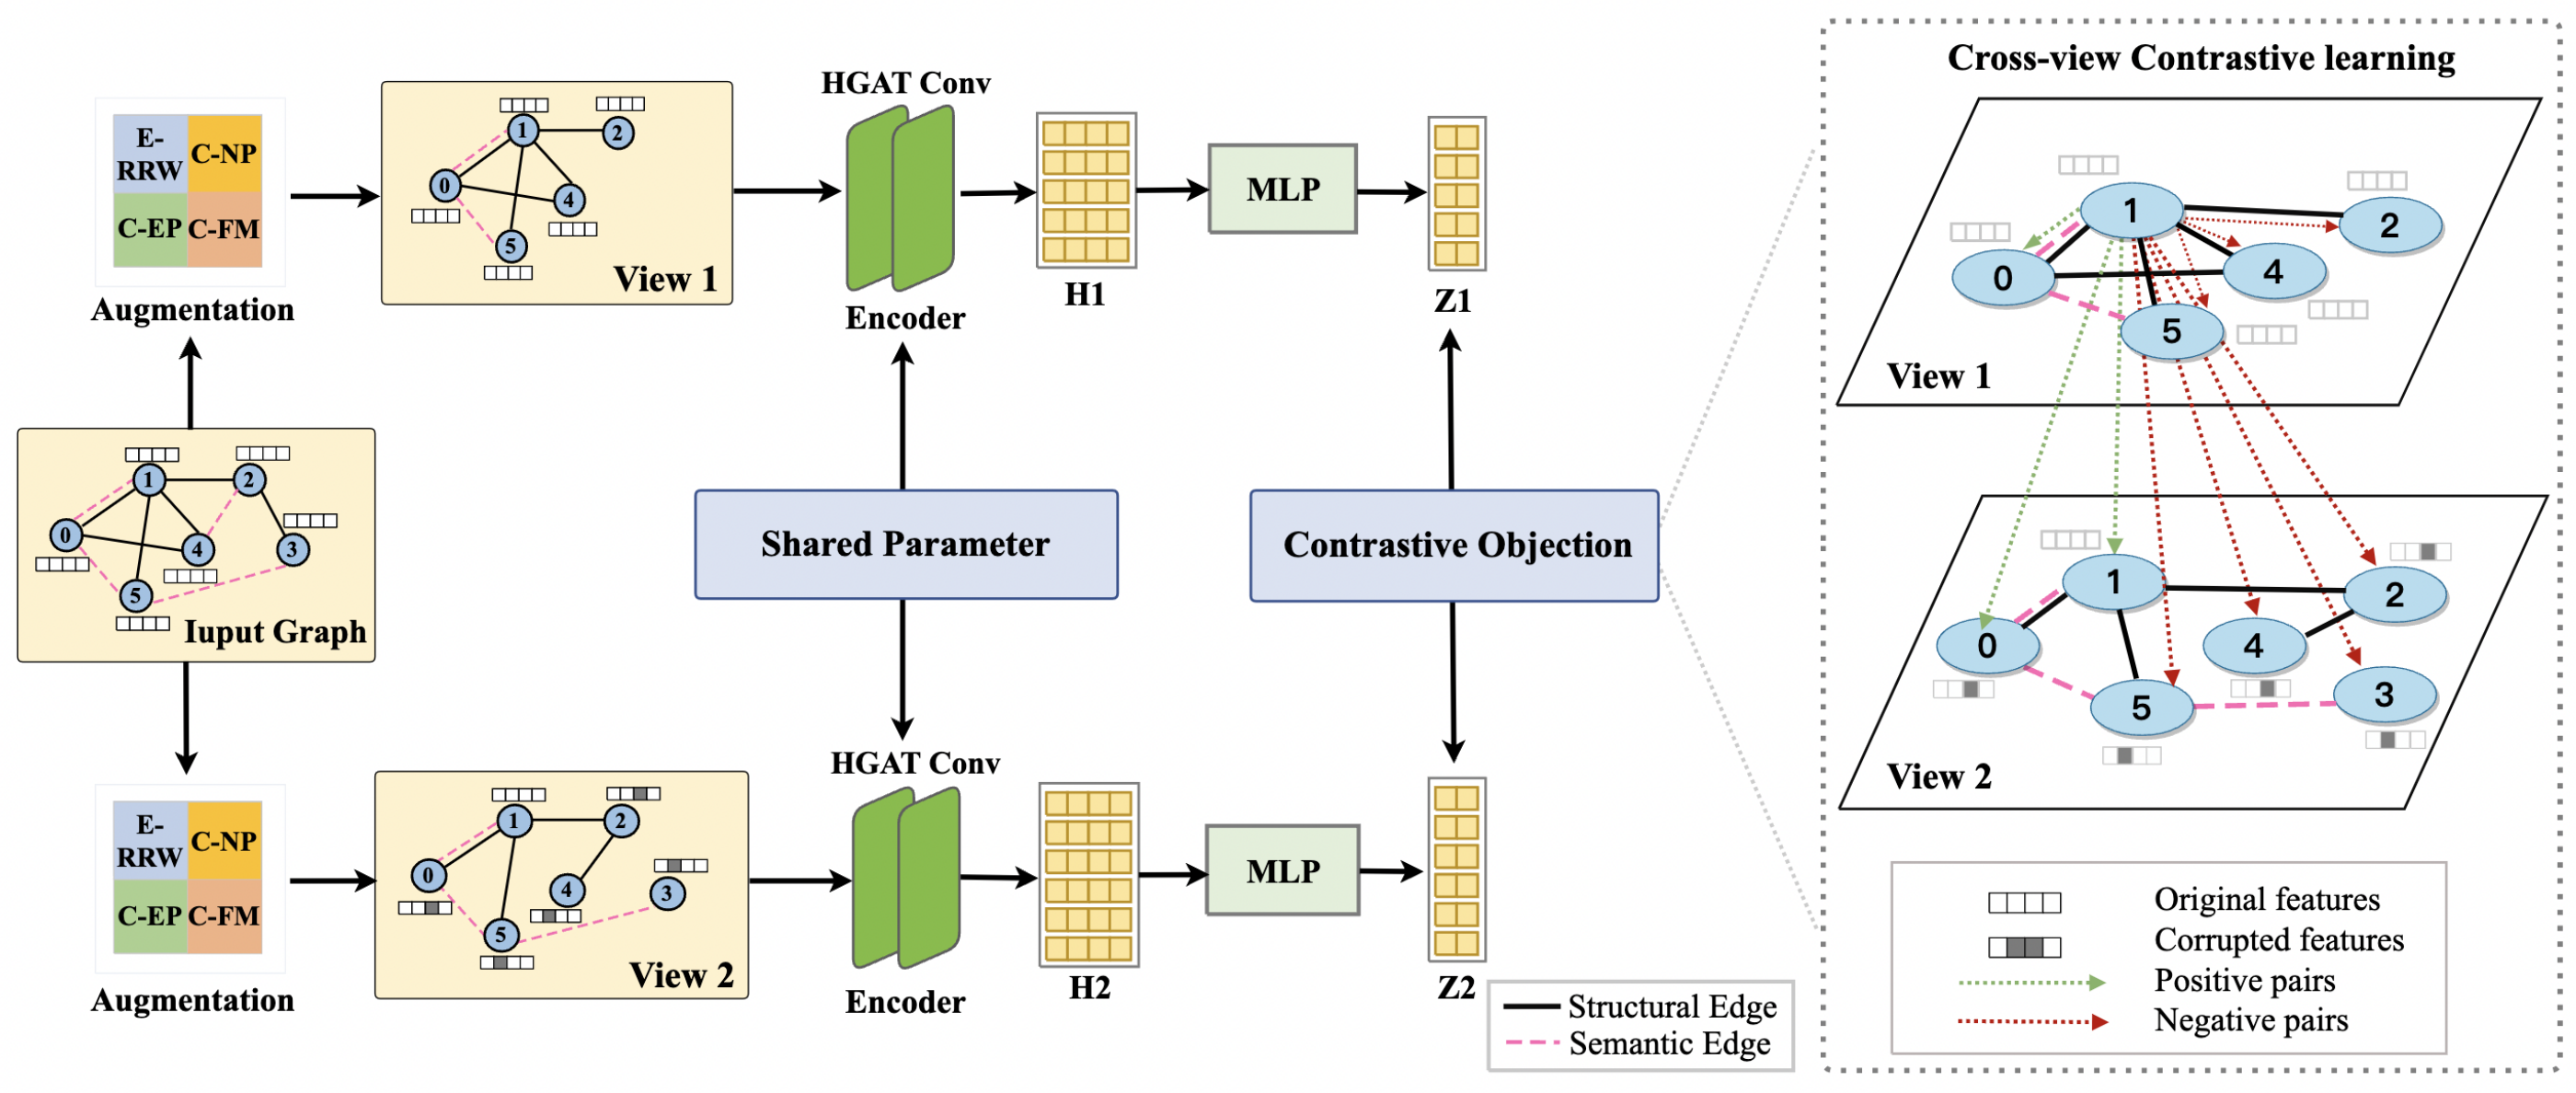
Figure 5.
Centrality-aware node perturbation, feature masking and edge perturbation. The black lines represent structural edges and the red dashed lines represent semantic edges.
Figure 5.
Centrality-aware node perturbation, feature masking and edge perturbation. The black lines represent structural edges and the red dashed lines represent semantic edges.
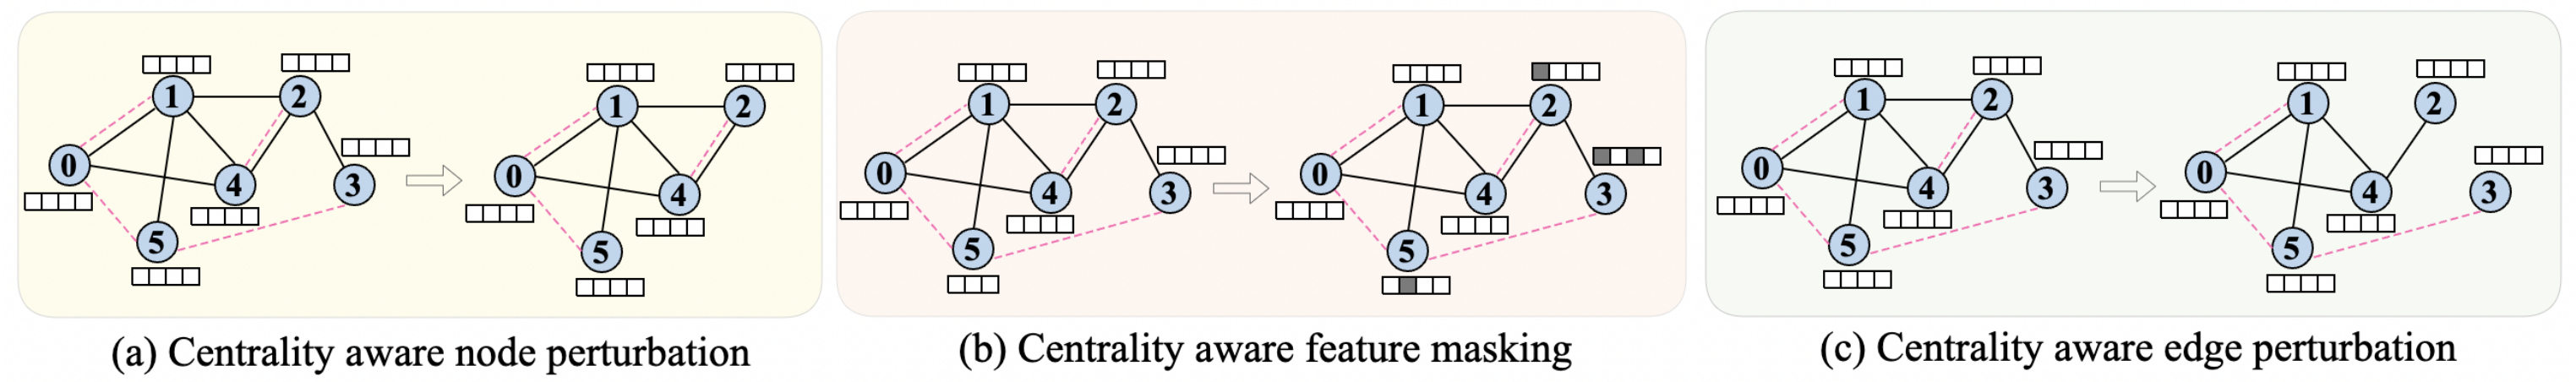
Figure 6.
HGAT: the green and yellow circles represent the structural neighbors and semantic neighbors; the blue circles represent the semantic edges; and represent the attention weights.
Figure 6.
HGAT: the green and yellow circles represent the structural neighbors and semantic neighbors; the blue circles represent the semantic edges; and represent the attention weights.
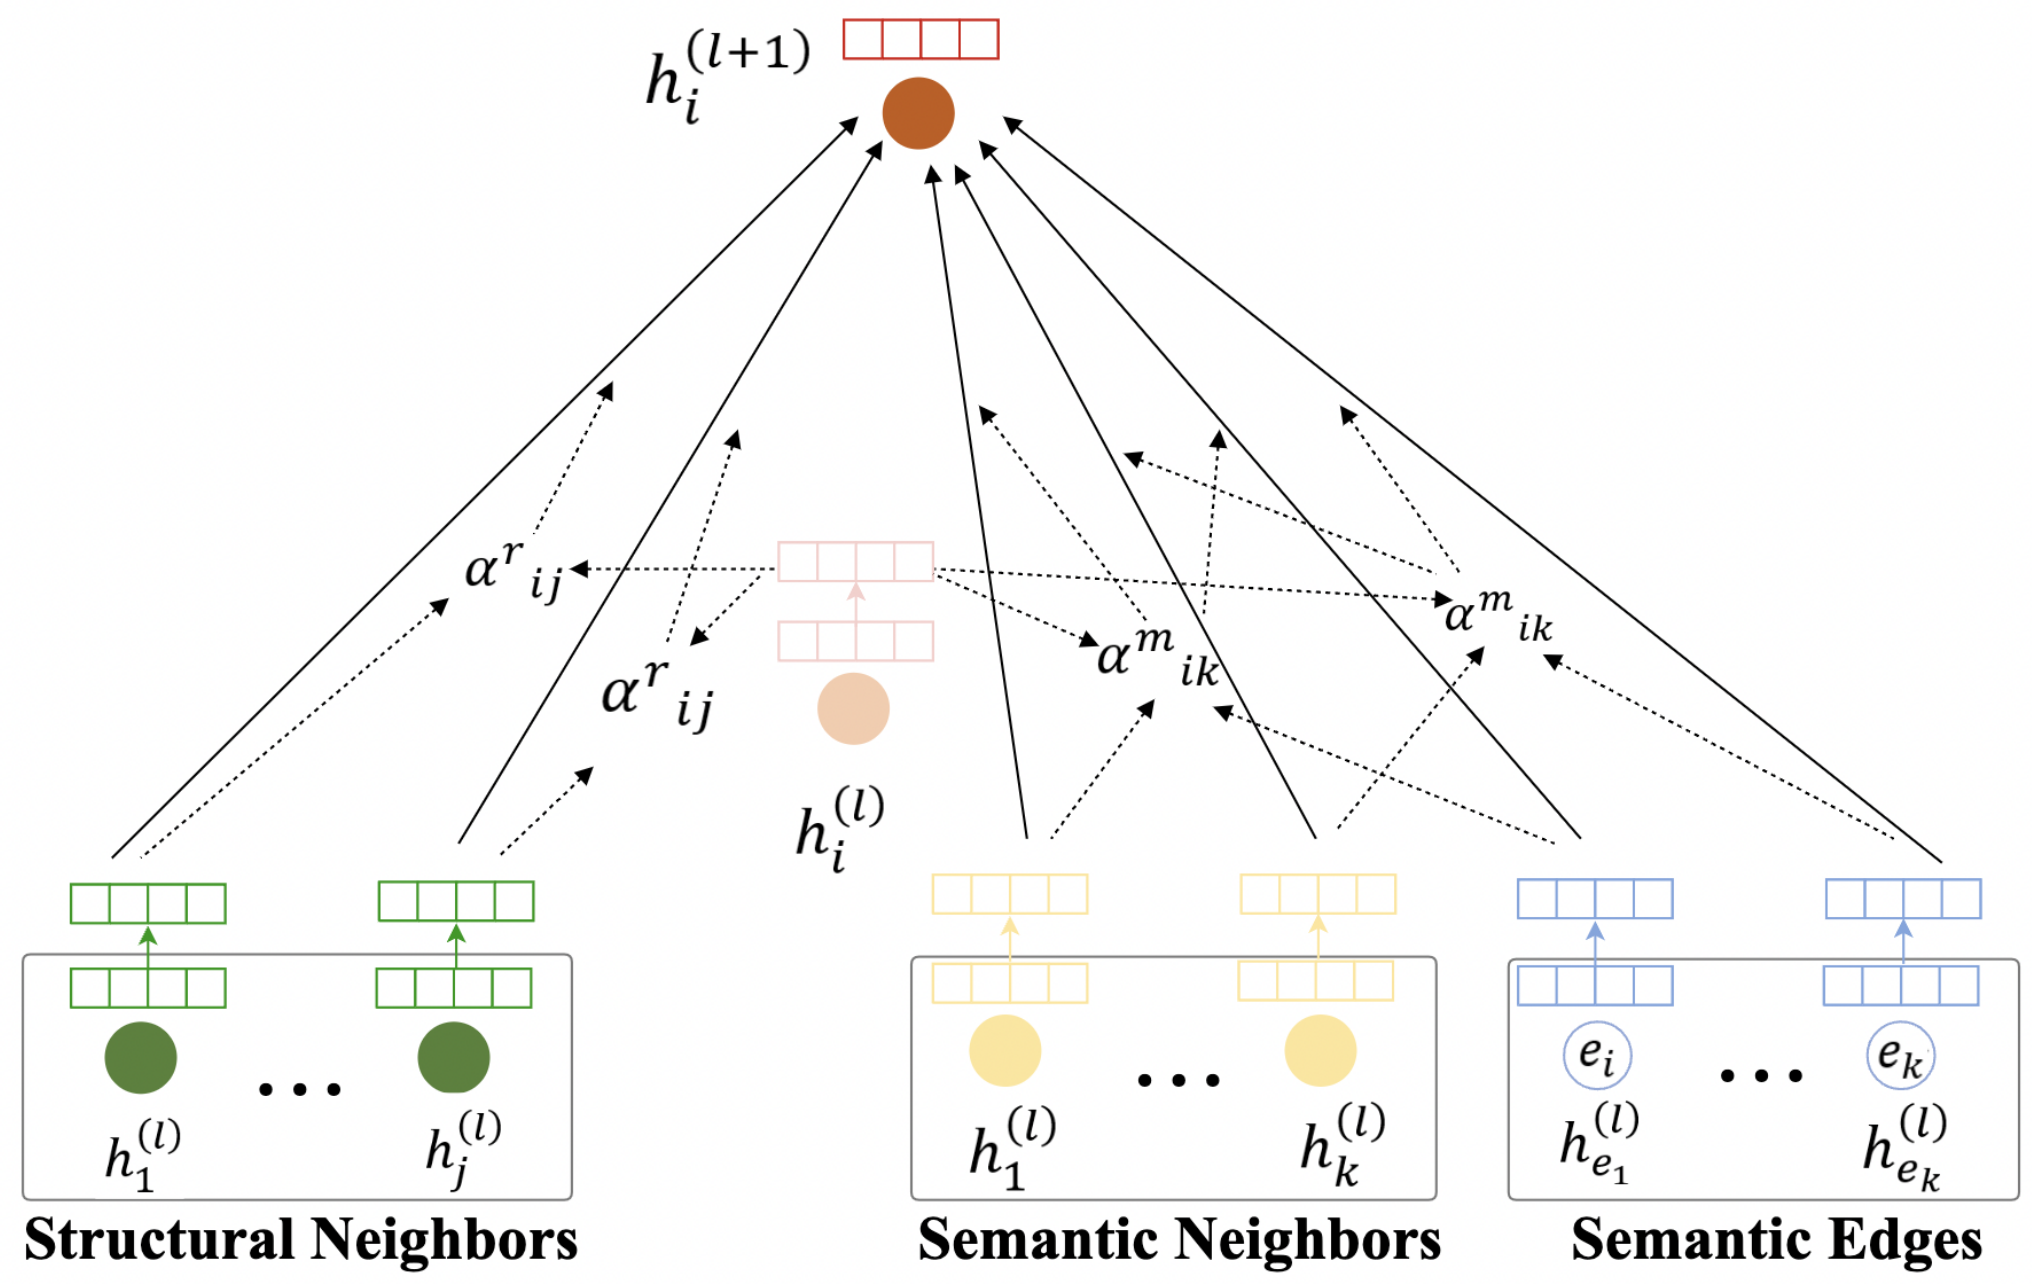
Figure 7.
Confusion matrix of node classification on Nanjing POI dataset.

Table 1.
Summary of dataset statistic.
| Datasets | #Nodes | #Structural Edges | #Semantic Edges |
|---|---|---|---|
| Gowalla | 16,731 | 2,933,798 | 2,350,884 |
| Brightkite | 18,679 | 2,918,587 | 2,523,466 |
| Nanjing POI | 12,004 | 4,004,346 | 59,953 |
Table 2.
Performance of unsupervised representation methods in location clustering.
| Datasets | GRACE | GCA | ProGCL | BGRL | GBT | SE-GCL |
|---|---|---|---|---|---|---|
| Gowalla | 0.2364 | 0.2830 | 0.2655 | 0.2813 | 0.2220 | 0.4679 |
| Brightkite | 0.3558 | 0.3686 | 0.3464 | 0.3629 | 0.3294 | 0.4859 |
Table 3.
Performance of models in location classification.
| Datasets | GCN | GAT | GraphS AGE | GRACE | GCA | ProGCL | BGRL | GBT | SE-GCL |
|---|---|---|---|---|---|---|---|---|---|
| F1-Micro | 0.8108 | 0.9158 | 0.8804 | 0.9384 | 0.9143 | 0.9259 | 0.9484 | 0.9218 | 0.9792 |
| F1-Macro | 0.6582 | 0.8432 | 0.7734 | 0.8938 | 0.8492 | 0.8786 | 0.9123 | 0.8549 | 0.9677 |
Table 4.
Comparison of proposed data augmentations and existing data augmentations in clustering task.
Table 4.
Comparison of proposed data augmentations and existing data augmentations in clustering task.
| Datasets | RRW | NP + FM + EP | RRW + NP + FM + EP | E-RRW | C-NP + C-FM + C-EP | E-RRW + C-NP + C-FM + C-EP |
|---|---|---|---|---|---|---|
| Gowalla | 0.3343 | 0.2971 | 0.3419 | 0.4588 | 0.3164 | 0.4679 |
| Brightkite | 0.3610 | 0.4198 | 0.4060 | 0.3835 | 0.4231 | 0.4859 |
Table 5.
Comparison of data augmentations in classification task (Nanjing POI dataset).
| Datasets | RRW | NP + FM + EP | RRW + NP + FM + EP | E-RRW | C-NP + C-FM + C-EP | E-RRW + C-NP + C-FM + C-EP |
|---|---|---|---|---|---|---|
| F1-Micro | 0.9343 | 0.9475 | 0.9509 | 0.9684 | 0.9592 | 0.9792 |
| F1-Macro | 0.9023 | 0.9161 | 0.9144 | 0.9521 | 0.9434 | 0.9677 |
Table 6.
Comparison of encoding networks in clustering task.
| Datasets | GAT | HGAT |
|---|---|---|
| Gowalla | 0.3974 | 0.4679 |
| Brightkite | 0.3898 | 0.4859 |
Table 7.
Comparison of encoding networks in classification task (Nanjing POI dataset).
| Metric | GAT | HGAT |
|---|---|---|
| F1-Micro | 0.9617 | 0.9792 |
| F1-Macro | 0.9398 | 0.9677 |
Table 8.
Performance of different learning methods in clustering task.
| Datasets | Traditional | Proposed |
|---|---|---|
| Gowalla | 0.3121 | 0.4679 |
| Brightkite | 0.3796 | 0.4859 |
Table 9.
Performance of different learning methods in classification task (Nanjing POI dataset).
| Metric | Traditional | Proposed |
|---|---|---|
| F1-Micro | 0.9517 | 0.9792 |
| F1-Macro | 0.9326 | 0.9677 |
Table 10.
Summary of dataset statistics.
| Datasets | #Nodes | #Edges | #Features | #Classes |
|---|---|---|---|---|
| Wiki-CS | 11,701 | 216,123 | 300 | 10 |
| Amazon-Computers | 13,752 | 245,861 | 767 | 10 |
| Cora | 2708 | 5429 | 1433 | 7 |
| Darknet | 20,408 | 103,552 | 25 | 9 |
Table 11.
Performance on node classification.
| Methods | Darknet | WikiCS | Cora | Amazon _Computers |
|---|---|---|---|---|
| GCN | 0.8669 | 0.7644 | 0.8137 | 0.8048 |
| GAT | 0.8529 | 0.7978 | 0.8243 | 0.8865 |
| GraphSAGE | 0.8738 | 0.8153 | 0.8237 | 0.8657 |
| GRACE | 0.9065 | 0.8053 | 0.8641 | 0.8496 |
| GCA | 0.9074 | 0.7771 | 0.8639 | 0.8684 |
| GBT | 0.9104 | 0.8071 | 0.8456 | 0.8881 |
| ProGCL | 0.9045 | 0.8249 | 0.8676 | 0.8511 |
| BGRL | 0.8898 | 0.7976 | 0.8579 | 0.8903 |
| SE-GCL | 0.9441 | 0.8412 | 0.9118 | 0.9222 |
Table 12.
Comparison of data augmentations.
| Datasets | RRW | RRW + NP + FM + EP | E-RRW | S-NP + C-FM + C-EP | E-RRW + C-NP + S-FM + C-EP |
|---|---|---|---|---|---|
| Darknet | 0.9321 | 0.9417 | 0.9373 | 0.9456 | 0.9441 |
| Cora | 0.9005 | 0.9002 | 0.9048 | 0.9007 | 0.9118 |
| WikiCS | 0.8181 | 0.8318 | 0.8428 | 0.8232 | 0.8412 |
| Amazon-Computers | 0.9042 | 0.9063 | 0.9084 | 0.9001 | 0.9222 |
Table 13.
Comparison of encoding networks.
| Datasets | GAT | HGAT |
|---|---|---|
| Darknet | 0.9241 | 0.9441 |
| Cora | 0.8752 | 0.9118 |
| WikiCS | 0.8199 | 0.8412 |
| Amazon-Computers | 0.9205 | 0.9222 |
Table 14.
Comparison of learning methods.
| Datasets | Traditional | Proposed |
|---|---|---|
| Darknet | 0.9343 | 0.9441 |
| Cora | 0.8493 | 0.9118 |
| WikiCS | 0.8361 | 0.8412 |
| Amazon-Computers | 0.9041 | 0.9222 |
Table 15.
Statistics of datasets used in graph classification tasks.
| Datasets | Category | #Graph | #Node (Avg.) | #Edge (Avg.) | #Feature | #Class |
|---|---|---|---|---|---|---|
| PTC_MR | Molecule Graphs | 344 | 14.29 | 14.69 | 19 | 2 |
| MUTAG | Molecule Graphs | 188 | 17.93 | 19.79 | 7 | 2 |
| PROTEINS | Protein Networks | 1113 | 39.06 | 72.81 | 4 | 2 |
| IMDB_B | Social Networks | 1000 | 19.77 | 96.53 | - | 2 |
Table 16.
Performance on graph classification.
| Methods | PTC_MR | MUTAG | PROTEINS | IMDB_BINARY |
|---|---|---|---|---|
| GCN | 0.6731 | 0.8620 | 0.7120 | 0.7121 |
| GAT | 0.7019 | 0.8902 | 0.7600 | 0.7500 |
| GraphSAGE | 0.6252 | 0.8300 | 0.7533 | 0.7311 |
| GraphCL | 0.7429 | 0.9000 | 0.7321 | 0.7201 |
| InfoGraph | 0.6857 | 0.8998 | 0.7232 | 0.7305 |
| AD-GCL | 0.6076 | 0.9271 | 0.7403 | 0.7299 |
| SE-GCL | 0.7778 | 0.9512 | 0.8200 | 0.8500 |
Disclaimer/Publisher’s Note: The statements, opinions and data contained in all publications are solely those of the individual author(s) and contributor(s) and not of MDPI and/or the editor(s). MDPI and/or the editor(s) disclaim responsibility for any injury to people or property resulting from any ideas, methods, instructions or products referred to in the content. |
© 2023 by the authors. Licensee MDPI, Basel, Switzerland. This article is an open access article distributed under the terms and conditions of the Creative Commons Attribution (CC BY) license (https://creativecommons.org/licenses/by/4.0/).
Share and Cite
MDPI and ACS Style
Fang, L.; Kou, Z.; Yang, Y.; Li, T. Representing Spatial Data with Graph Contrastive Learning. Remote Sens. 2023, 15, 880. https://doi.org/10.3390/rs15040880
AMA Style
Fang L, Kou Z, Yang Y, Li T. Representing Spatial Data with Graph Contrastive Learning. Remote Sensing. 2023; 15(4):880. https://doi.org/10.3390/rs15040880
Chicago/Turabian StyleFang, Lanting, Ze Kou, Yulian Yang, and Tao Li. 2023. "Representing Spatial Data with Graph Contrastive Learning" Remote Sensing 15, no. 4: 880. https://doi.org/10.3390/rs15040880
Note that from the first issue of 2016, this journal uses article numbers instead of page numbers. See further details here.