

Quantitative Analysis of the Contributions of Climatic and Anthropogenic Factors to the Variation in Net Primary Productivity, China

1
The School of Geoscience and Technology, Zhengzhou University, Zhengzhou 450001, China
2
South China Institute of Environmental Sciences, Ministry of Environmental Protection, Guangzhou 510655, China
3
State Environmental Protection Key Laboratory of Urban Ecological Simulation and Protection, Guangzhou 510655, China
4
Qiannan Meteorological Bureau, Qiannan Buyizu and Miaozu Autonomous Prefecture 558000, China
*
Author to whom correspondence should be addressed.
Remote Sens. 2023, 15(3), 789; https://doi.org/10.3390/rs15030789
Submission received: 1 November 2022
/
Revised: 27 January 2023
/
Accepted: 28 January 2023
/
Published: 30 January 2023
(This article belongs to the Special Issue Remote Sensing of Primary Production)
Abstract
:Accurate quantification of the contributions of climatic and anthropogenic factors to the variation in NPP is critical for elucidating the relevant driving mechanisms. In this study, the spatiotemporal variation in net primary productivity (NPP) in China during 2000–2020, the interactive effects of climatic and anthropogenic factors on NPP and the optimal characteristics of driving forces were explored. Our results indicate that NPP had obvious spatial differentiation, an overall increasing trend was identified and this trend will continue in the future for more than half of the pixels. Land use and Land cover and precipitation were the main factors regulating NPP variation at both the national scale and the sub-region scale, except in southwest China, which was dominated by altitude and temperature. Moreover, an interactive effect between each pair of factors was observed and the effect of any pair of driving factors was greater than that of any single factor, manifested as either bivariate enhancement or nonlinear enhancement. Furthermore, the responses and optimal characteristics of NPP concerning driving forces were diverse. The findings provide a critical understanding of the impacts of driving forces on NPP and could help to create optimal conditions for vegetation growth to mitigate and adapt to climate changes.
1. Introduction
As a critical component and pivotal link between terrestrial ecosystems and the atmosphere, vegetation plays a significant part in absorbing greenhouse gases such as CO2 from the atmosphere and plays a key role in mitigating climate change. The net primary productivity (NPP), defined as the total amount of organic matter accumulated by vegetation in a certain amount of time and a certain area [1], reflects not only the growth and reproduction of vegetation, but also the health status of the vegetation ecosystem [2]. As an indispensable factor regulating the terrestrial carbon cycle, carbon balance and ecosystem [3], the spatiotemporal variation in NPP is a result of various factors that include the complex interactions among vegetation, climate and anthropogenic activities; all of these may have individual effects and interactive effects on NPP variation simultaneously, making it vital to explore the relationships and response mechanisms of vegetation NPP with/to driving forces in order to mitigate and adapt to climate change and intensive anthropogenic activities.
Over the past few decades, the responses of vegetation NPP to climate change and anthropogenic activities have been deeply explored at both regional and global scales [4,5,6,7]. For instance, Reference [8] explored the relationship between NPP and temperature, precipitation and solar radiation in China during 1982–2015. Reference [9] established a statistics-based multiple regression model to estimate forest NPP and analyzed the relationship between temperature and precipitation. Reference [10] and Reference [11] explored anthropogenic activities and climate factors in NPP variation and all identified that land cover change had a greater impact on NPP change than climate variations. However, these studies mainly concerned the relationships between NPP and climate factors and/or anthropogenic factors based on linear regression analysis or partial correlation analysis [12,13], despite these relationships not usually being linear under a complex environment.
Previous studies have illustrated that interactive effects existed among influencing factors [14,15], making it difficult to isolate the independent contributions of climate factors and anthropogenic factors to NPP variation. Although previous studies have attempted to apply several methods to isolate these two kinds of factors in NPP variation, these methods are based on the assumption that the relationships between NPP and influencing factors are linear, despite non-linear relationships being illustrated [16]. For instance, residual trend analysis has been widely applied to isolate independent contributions of climate factors and anthropogenic factors to NPP, the main idea of the residual trend analysis was that of predicting NPP according to the relationships between NPP and climate factors (e.g., linear relationship) and then the difference between predicted NPP and observed NPP was regarded as the impact of anthropogenic activities. However, this method is primarily applicable to regions that have obviously controlled climate factors, such as precipitation in arid, semi-arid and desert areas [16]. Moreover, the difference between predicted and observed NPP is more than the effect of anthropogenic activities on NPP. It theoretically includes the impacts of all other driving forces besides climatic and anthropogenic factors, such as topography. Alternatively, many studies applied potential and actual NPP to distinguish the relative contributions of the two kinds of factors to NPP variation [2,17,18]. However, the potential NPP is a virtual value with great uncertainty [14]. Additionally, the single contribution of a climate factor (e.g., temperature) or anthropogenic factor (e.g., urbanization, irrigation, fertilization) to NPP variation cannot be detected. Attempts to disentangle single-factor effects and the interactive effects of several factors are immature [19]; the interactive effect between climate factors and anthropogenic activities on NPP variation is often ignored. Moreover, the interactive effects among factors are usually regarded as a multiplicative relationship [20]. However, the relationships are far from this. Considering that the responses of an ecosystem to multiple factors are regulated by complex, nonlinear processes [21], concurrent changes in multiple factors potentially have complex interactive influences on vegetation growth [22] and that the interactive effects can differ greatly from simple combinations of single-factor responses [23], understanding the interactive effects of climate factors and anthropogenic activities can improve the predictions of productivity with global climate change in mind [20].
Optimal intervals of influencing factors have a key effect on vegetation growth and the identity of the optimal interval could mitigate the adverse effects of influencing factors on vegetation growth and improve carbon sequestration in order to mitigate climate warming. Unfortunately, the main controlling factors that affect vegetation were recognized by many studies, but the optimal interval of the main controlling factor for vegetation growth was neglected.
To overcome the limitations mentioned above, the general goals of this study were to explore the interactive effects of climatic and anthropogenic factors on NPP variation and identify the optimal intervals of influencing factors for NPP in China, which has proposed to achieve carbon neutrality before 2060. Specifically, we first analyze the spatiotemporal variation in NPP in China during 2000–2020 and predict the future trends based on the Hurst exponent. Second, the dominant controlling factors that force NPP variation are explored. Third, the interactive effects of climate factors and anthropogenic activities on NPP are investigated and lastly, the optimal intervals of forcing factors with regard to NPP variation are identified. Our findings help to understand the variation in NPP and the interactions between NPP and driving forces. Additionally, this paper could provide a theoretical reference for decision makers to develop optimized ecosystem management to mitigate and adapt to climate change and to achieve carbon neutrality.
2. Materials and Methods
2.1. Study Area
China is located in the east of Eurasia. It has a vast territory, numerous mountains and complex topography. The country is located between 135°2′E and 73°40′E, 3°52′N and 53°33′N. It spans a number of climatic zones, including the monsoon, temperate continental and plateau climate zones that span tropical, subtropical and temperate climates. The average annual temperature in China ranges from above 20 °C in southern China to below −20 °C in the Qinghai-Tibet Plateau. The average annual precipitation ranges from more than 2400 mm in South China to less than 100 mm in Northwest China [24]. In addition, the terrain of the country is extremely rugged and the elevation on the whole is high in the west and low in the east. Due to the diversity of topographic and climatic conditions, the spatial distribution of vegetation is obviously different. Woodland is mainly distributed in Southwest and Northeast China; grassland is more distributed in Northwest China and about one third of bare land is distributed in Northwest China. According to the research needs, China was divided into six geographical regions, as in previous studies, by taking into account the differences in natural conditions and economic development levels and the integrity of administrative regions (Figure 1).
2.2. Data Sources
The study data were divided into two categories: NPP data (2000–2020) and the driving forces of NPP. The NPP data came from the Land Processes Distributed Active Archive Center (LP DAAC); the version was MOD17A3 HGF.061 and its spatial resolution was 500 m. The driving forces included topographic data, climate data and economic data. The specific driving factors and corresponding symbols are shown in Table 1 and the flow chart is displayed as Figure 2.
2.3. Methods
2.3.1. Sen and Mann–Kendall Method
The non-parametric trend method (Sen) was applied to calculate the trend of NPP and the significance of the trend was tested by the Mann–Kendall statistical test. The advantages of Sen’s trend analysis are that it does not require samples to follow a certain distribution and it is not disturbed by outliers. It has a strong ability to avoid measurement errors or outlier data [25] and the calculation process is as follows:
where is the trend of NPP; NPPi and NPPj represent the NPP value of year i and year j (i > j), respectively; and N represents the length of the time series.
The Mann–Kendall test is a non-parametric statistical test method that is applied to judge the significance of a trend [26] and the calculation formula is as follows:
where n is the length of the time series and is the sign function.
The variance is calculated as
where m is the number of tied groups and is the number of ties in the extent of i.
The test statistic Z is calculated as follows and a significance level of and were applied.
2.3.2. Coefficient of Variation
The coefficient of variation is expressed as the ratio between the standard deviation and the average, which reflects the relative volatility of the observed data and measures the stability of the data [27]. The larger the coefficient of variation is, the more unstable the NPP variation is and vice versa. The calculation of coefficient of variation is as follows:
where is the length of the observation year, is the standard deviation of NPP, is the NPP value of year i, is the mean value NPP and is the coefficient of variation. Referring to previous studies [27], is divided into four categories: very stable ( < 0.1), stable (0.1 < < 0.2), unstable (0.2 < < 0.3) and very unstable ( > 0.3).
2.3.3. Hurst Index
The Hurst index was calculated to analyze the future evolution trend of NPP and the index was calculated based on rescaled range (R/S) analysis in this study. The index is a time series analysis that is based on the idea of long-range correlation. Due to its superiority for trend estimation, the index has been widely applied [28,29,30,31]. The basic principle is as follows:
Given a time series , t = 1, 2, …, n, for any positive integer τ ≥ 1, define the mean sequence as follows:
Define the NPP series {NPP(i)} (i = 1, 2, …, m) into i sub series and for each series n = 1, 2, … i,
Calculate the average sequence of the time series:
Calculate the range sequence:
Create the range sequence:
Calculate the Standard deviation sequence:
Calculate the Hurst exponent:
where H is the Hurst exponent and the least-squares method was applied as:
The value ranges from 0 to 1: ① if 0.5 < H < 1, the time series is a sustainable series and the future trend of NPP is consistent with the past trend, the closer the value of H is to 1, the stronger the sustainability; ② if H = 0.5, the time series is random and the future trend of NPP has nothing to do with the past trend; ③ if 0 < H < 0.5, the time series has anti-sustainability, the future trend of NPP is the opposite to that of the past and the closer H is to 0, the stronger the anti-sustainability.
2.3.4. Geographic Detector Model
Spatial differentiation is one of the basic characteristics of geographical phenomena and the geographical detector is a tool to detect spatial differentiation [32,33]. In this study, a geographic detector was applied to analyze the effects of driving forces on NPP variation.
(1) Spatial differentiation and factor detector: the influences of various factors on the spatial distribution of vegetation NPP can be calculated through factor detection. The calculation of the explanatory power (q) of the influence factor is as follows:
where q represents the degree of influence of each factor on the evolution of NPP and ranges from 0 to 1. The higher the q value, the larger the effect of the factor on NPP variation and vice versa. h represents stratification of factors and NPP. is the number of units of layer h, and N is the number of units for the whole region. Similarly, is the variance of the NPP for the monolayer h and is the variance of the NPP in the whole region. SSW is the sum of intra-layer variance and SST is the total variance.
The factor detector reveals the explanatory power of each factor on NPP. By calculating the q value of the influence factor, the effect of each factor on NPP is identified. The larger the q value, the greater the forces of the factor.
(2) An interaction detector was applied to quantify the interactive effect of any of two factors and identify whether the interactive power was larger than the explanatory power of either of the single factors or the sum of the explanatory power of the two factors. For more information on interactive effects, see Figure S1 for details.
(3) A risk area detector was applied to judge whether there is a significant difference in the mean value of an attribute between two sub-regions and to find NPP degradation or improvement areas. The risk detector was tested with the t-statistic:
where and represent NPP values of sub-regions i and j, respectively; and represent the mean values of NPP for sub-regions i and j, respectively; and Var represents variance.
3. Results
3.1. Spatial and Temporal Variation in NPP
3.1.1. Spatial and Stable Patterns of NPP
Obvious spatial differentiation was observed for NPP (Figure 3A) and it decreased from southeast to northwest. The values of NPP lower than 0.6 kg·C·m−2 accounted for 76.32% and were mostly distributed in the northwest of China, such as the northwest of Xinjiang province (Figure 3(Aa)), the middle of Inner Mongolia (Figure 3(Ab,c)), the southwest of Qinghai and central and southern Tibet. The values of NPP between 0.6 and 1.2 kg·C·m−2 accounted for 21.13% and were mostly related to South Central China, such as Hunan, Jiangxi, etc. NPP values larger than 1.2 kg·C·m−2 accounted for less than 3% and were mostly distributed in Taiwan, Guangdong and Yunnan (Figure 3(Ad,b,e)).
The spatial pattern of coefficient of variation () is displayed in Figure 3B and the variation in NPP in China from 2000 to 2020 was mostly stable ( < 0.2). More than 92% of the total pixels were stable. Specifically, very stable ( < 0.1) NPP values existed for approximately 66% of pixels, mostly distributed in the northeast, southeast and southwest of China; stable (0.1 < < 0.2) pixels accounted for about 27% and were mainly related to the north of China, such as Inner Mongolia. In contrast, unstable (0.2 < < 0.3) or very unstable ( > 0.3) status accounted for approximately 7% of pixels, which were mostly scatted in Inner Mongolia, Xinjiang province and Tibet.
3.1.2. Temporal Trend of NPP
The variation in the annual NPP was between −0.07 and 0.06 kg·C·m−2·a−1 across 2000–2020 (Figure 4A) Overall, NPP increased during the study period. The mean value was 0.99 × 10⁻³ kg·C·m−2·a−1. NPP showed either a significant increasing trend or a significant decreasing trend (p < 0.05) in 34% of pixels (Figure 4B). NPP displaying a decreasing trend accounted for 31.9%, these having a mean value of −0.24 × 10⁻² kg·C·m−2·a−1 and approximately 7.8% of the total pixels showed a significantly negative trend (p < 0.05, Figure 4B). The decreasing trend of NPP was mostly located in the east of China and the central and middle parts of China, such as south of Henan province, north of Hebei province and the southeast of Tibet. In contrast, more than 68% of the total pixels showed an increasing trend, with a mean value of 0.25 × 10⁻² kg·C·m−2·a−1. More than 27% of the total showed a significantly positive trend (p < 0.05, Figure 4B) and were mostly distributed in Inner Mongolia and Gansu.
3.1.3. Sustainability of NPP Variation
The sustainability of NPP variation in the future is illustrated in Figure 5A based on the Hurst exponent (H). More than half of the total pixels showed a sustainable trend (H > 0.5), which means that NPP will continue increase in the future. The sustainable area is mostly distributed in North China and Northwest China, such as Inner Mongolia, Shanxi, Shaanxi, Gansu and the middle and lower reaches of the Yangtze River. In contrast, the areas where NPP will reverse its trend in the future account for 48.55% of the total and are mainly distributed in the North China Plain and Northeast China. Other areas that maintain the variation trend only accounted for 0.08%.
In order to explore the trend of NPP in the future, we coupled the Hurst exponent and NPP trend and found that approximately 50% of the total will maintain an increasing trend (Figure 5B). These areas are mainly distributed in North China, such as east of Inner Mongolia, the Ningxia Hui Autonomous Region, Shanxi and Shaanxi province. In contrast, about 19.41% of the total will continue decreasing in the future and such areas are mainly located in Tibet, southwest of Yunan province. Approximately 19% of the total area changed from a decreasing trend at present to an increasing trend in the future in the test. These areas are mainly scattered in both South Central China and North China. However, about 12% of the total changed from an increasing trend to a decreasing trend and they were concentrated in Henan, Liaoning province and the northwest of Heilongjiang province.
3.2. Driving Factors of NPP Variation
3.2.1. Influencing Effects of Natural and Anthropogenic Factors
At the sub-region scale, the explanatory power of LUCC was larger than those of other factors for all sub-regions (Figure 6), except in Southwest China, which was mostly affected by DEM (Figure 6f). Climate factors (PRE, TEM, PET, SH) were also critical for NPP variation and the q values of PRE and SH were larger than those of TEM and PET in Northwest China, Northeast China, North China and East China. In South Central and Southwest China, the q value of TEM was the largest of the climate factors. GDP and POP represent another two anthropogenic factors that affect NPP variation. However, the explanatory power was lower than those of both LUCC and climate factors during the study period.
At the national scale, the explanatory power of PRE and that of LUCC were higher than those of others (Figure 6e), as their q values were larger than 0.6. Additionally, SH and TEM also made critical contributions to the variation in NPP; their values of q were mainly larger than 0.55 and 0.44, respectively. In terms of POP and GDP, the explanatory powers were lower than those of climate factors and LUCC and the q values were lower than 0.05 and 0.25 for GDP and POP, respectively. Topography could be considered as a constant; therefore, the q value of DEM was 0.21 for the five years and the q values of aspect and slope were 0.01 and 0.08, respectively, for the five years.
3.2.2. Interaction Effects between Factors
The explanatory power (q value) of interactive effects between influencing factors on NPP are shown (Figure 7). The influences of driving factors on NPP variation are not independent and the effect of any two factors on NPP variation was greater than that of any single factor, manifested as either bivariate enhancement or nonlinear enhancement. Specifically, the interactive effects between LUCC and SH, LUCC and PET, TEM and PRE, and PRE and DEM in the five years were all greater than 0.7 and exhibited bivariate enhancement. Interestingly, the interactions between PRE and slope were lower than 0.7 before 2010, but the explanatory power exceeded 0.7 after 2010, meaning that the bivariate enhancement effect was increased. In terms of TEM and PRE, they illustrated bivariate enhancement and the interaction effect showed a decreasing trend during 2000–2005. However, the bivariate enhancement effect was continually increasing and the explanatory power exceeded 0.7 during 2010–2020. The interactive effects between DEM and slope; aspect and slope, aspect and TEM, PET, GDP and POP. and aspect and PET and GDP all exhibited nonlinear enhancement in the five years, but the explanatory power was less than 0.6 in each case.
3.2.3. Non-linear Influence of Risk Detector
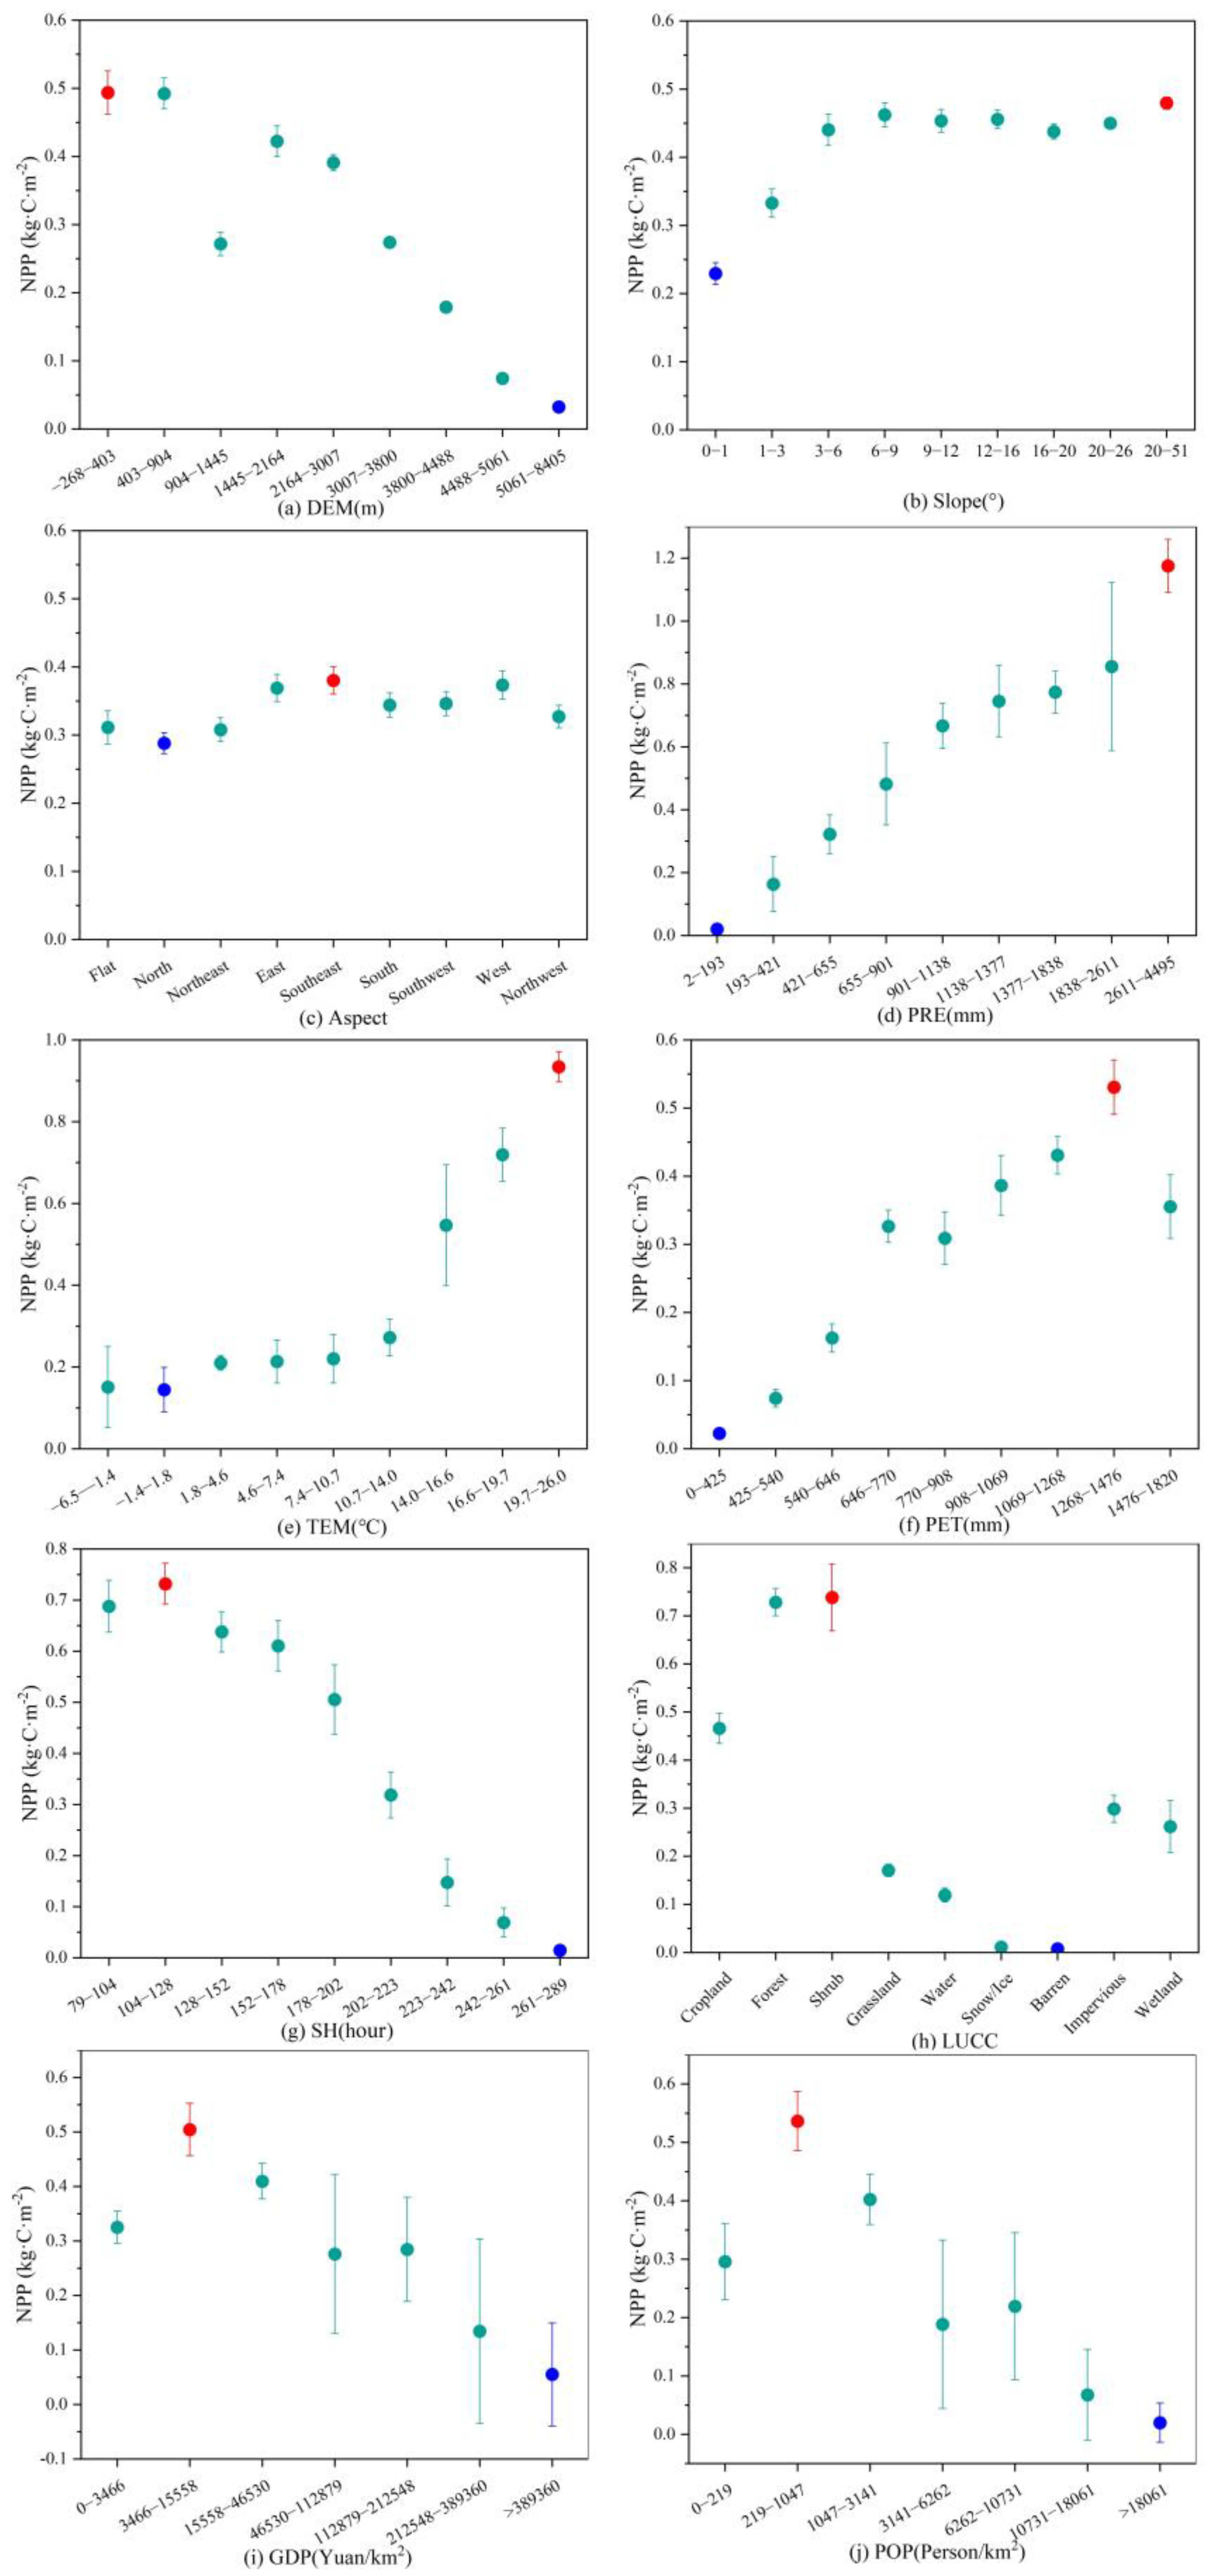
The risk detector depicts suitable environmental conditions for vegetation growth for each influencing factor and, the larger the NPP value, the more suitable those factor levels are to vegetation growth.
The suitable levels of different influencing factors for the NPP increase are shown in Figure 8 and different factors presented divergent results in NPP. The maximum NPP values were mostly distributed at lower altitudes, with DEM less than 900 m and the annual mean NPP reached approximately 0.5 kg·C·m−2 (Figure 8a). At altitudes higher than 900 m, the NPP decreased with the increase in DEM. Slope had a complex impact on NPP which was lower than 0.35 kg·C·m−2 (Figure 8b) when the slope was less than 3° and NPP had a relatively higher value (greater than 0.4 kg·C·m−2) when the slope was higher than 3°. In contrast, NPP increased when the slope was higher than 20° (Figure 8b). NPP did not change much with change of aspect and NPP had higher values in East, Southeast, South, Southwest and West China than elsewhere (Figure 8c). In terms of climate factors, NPP showed an upward trend with PRE increase and, when PRE was between 2600 and 4500 mm, the mean NPP was above 1.1 kg·C·m−2 (Figure 8d). NPP had no obvious change when the TEM was lower than 14 °C, but NPP showed an upward trend when TEM ranged from 14 to 26 °C and NPP was above 0.9 kg·C·m−2 when TEM was at the level of 19.7–26.0 °C (Figure 8e). With the increases in PET and SH, NPP indicated a trend of an initial increase and then a decrease and the conversion levels observed were 1268–1476 mm and 104–128 h for PET and SH, respectively (Figure 8f,g). The response of NPP to LUCC was different and forests and shrubs were associated with high values of NPP. Cropland and barren land had the lowest NPP values (Figure 8h). Anthropogenic factors also had a critical effect on NPP. When GDP and POP increased, NPP increased initially and decreased afterwards; the tuning intervals were 3466–15,558 Yuan/km2 and 219–1047 Person/km2 for GDP and POP, respectively.
4. Discussion
4.1. Spatiotemporal Variation in NPP
Generally, the spatial pattern of NPP in China decreased from southeast to northwest, similar to previous studies [23,34,35]. This result is obvious and may result from the hydrothermal distribution caused by the climatic gradient [36]. NPP was lower than 0.6 kg·C·m−2 mostly in the northwest of China and this may be due to the inland nature of the areas and annual precipitation mostly less than 400 mm [37], which have a critical impact on vegetation productivity [38]. The risk detector results also illustrated this conclusion, as NPP was below 0.2 kg·C·m−2 when precipitation was lower than 421 mm (Figure 8d). Additionally, vegetation type may be another factor that caused low NPP in Northwest China. The vegetation in the northwest is dominantly grassland and barren land (Figure S2). These vegetation types usually have NPP values of less than 0.1 kg·C·m−2, as we have illustrated in Figure 8h. In contrast, due to the effects of southeast and southwest monsoons, the hydrothermal conditions in Southeast and Southwest China are superior: the annual mean temperature is higher than 16 °C and the annual cumulative precipitation is higher than 2000 mm (Figure S2). Moreover, forests and shrubs are wildly distributed (Figure S2) and these have higher NPP values than grassland and barren land. The detection of optimal ranges of climate factors to NPP also illustrated this conclusion (Figure 8d–g).
Overall, the NPP in China during 2000–2020 was stable and the inter-annual fluctuations were small. Coefficients of variation of less than 0.2 accounted for more than 92% of the total pixels. This may because strict forest land protection policies were implemented in China in 2005, such as forbidding deforestation and afforestation [39]. Furthermore, China proposed the construction of an ecological civilization in 2012, coordinating socioeconomic and eco-environmental development and ensuring ecosystem functions are not damaged by economic development [40]. Those combined efforts promote vegetation protection and prevent vegetation from degradation severely.
Although the temporal trend of NPP displayed spatial heterogeneity across China, an overall increasing trend with an average value of 0.99 × 10⁻³ kg·C·m−2·a−1 was observed, which is similar to values found in previous studies [9,39]. Reference [41] revealed that China contributed 25% of the global net increase in leaf area and [39] found that NPP of forests in China significantly increased (p < 0.01) during 2000–2014. The increasing trend of NPP may have resulted from widespread national-scale afforestation projects launched around the year 2000 in China, such as the Beijing–Tianjin Sand Source Control Project, the Forest Protection Project, the Second-Term River Shelter Forest Projects and the Grain for Green Program [42,43]. Additionally, the increasing trend of NPP intensifies the critical role of vegetation in carbon sequestration, which would facilitate achievement of the carbon neutrality goal for China. In contrast, approximately 32% of the total pixels displayed a decreasing trend of NPP and they were mainly distributed in the east of China, central and middle parts of China and the Pearl River Delta, which is consistent with previous results [44,45]. This may have been an urbanization-induced decrease [45]. For instance, reference [46] declared that approximately 309.95 Gg C was lost due to the conversion of cropland to built-up land. Reference [47] showed an overall negative effect of urban land development on terrestrial NPP in the cities of China. However, urbanization does not always reduce NPP due to the positive indirect effect of urbanization on NPP [13]. For instance, NPP in the Yangtze Delta was mostly increased under the background of intense urbanization. Reference [45] revealed that the indirect effect of urbanization usually had a positive impact on NPP and it could offset about 30% of the direct effect (e.g., land-cover replacement) in Kunming, China. This may have been because indirect effects such as artificial irrigation, fertilization, introduction of new species, pruning, the urban heat island effect, etc., caused by anthropogenic activities in urban areas, could create superior conditions for vegetation growth [45] and reduce the impacts of adverse factors, such as drought and urban heat waves, on vegetation growth.
The increasing trend of NPP will be sustained over half of the study area in the future based on the Hurst exponent and approximately 20% of the total pixels changed from a decreasing trend to an increasing trend in the future estimation. The improvement of NPP may not only benefit due to the successful related forest protection policies of the government [48], but also to strict ecological environment protection implemented in the future, such as the establishment of a Chinese ecological conservation red line and the construction of nature reserves [49]. In addition, the dissemination and practice of ecological civilization theory, balancing the ecological, economic, social, cultural and political dimensions of change [50], and providing guidelines and a framework for Chinese development plans in the future will improve the country’s ecological security and effectively promote harmonious coexistence between humanity and nature. Although most of the pixels show increasing trends of NPP in the future based on the Hurst exponent, it should be noted that we cannot know how long this trend will be maintained in the future according to this exponent. Therefore, careful attention should be paid to how long the future trend will be maintained.
4.2. Driving Factors of NPP Variation
The variation in NPP was affected by various factors, such as climate factors and anthropogenic factors. Identifying the main driving factors in NPP variation could provide a useful reference for coping with global climate change and realizing sustainable development [51]. Our results revealed that the driving factors of NPP variation showed obvious spatial differences, LUCC, SH and PRE were the main driving factors that determined the spatial distribution of NPP in Northwest China and North China, and this is consistent with previous results [29,51,52,53]. This may have resulted from the vegetation types in these two regions, which are dominated by desert and grassland. Additionally, the two regions mentioned above are located inland in China and the annual rainfall is low, which creates an arid or semi-arid environment. Both of those conditions determine the decisive role of precipitation for vegetation-induced NPP variation [54]. Anthropogenic activities have a critical effect on NPP and previous studies have illustrated that dramatic changes in land use have had a significant impact on the productivity of grassland in China [4,55], such as urbanization and grazing. The dominant role of LUCC in NPP variation in South China and East China (Figure 6c,d)—which have relatively high economic and urbanization levels and dense population—is accompanied by intensified anthropogenic activities, such as land-use and land-cover changes, illustrating the conclusion. Generally, the more SH, the more time vegetation has for photosynthesis and a longer SH is usually accompanied by high temperatures [7]. Both promote vegetative carbon accumulation, especially of vegetation in high latitudes. This explains to some extent why SH was one of the determinant factors affecting NPP variation in Northwest China and North China. In terms of influencing factors in Southwest China, DEM was the dominate factor. This may have been because the mean altitude is over 3000 m (Figure S2) and the temperature is normally low, which restricts vegetation growth. The pivotal role of TEM in NPP in Southwest China illustrates this conclusion (Figure 6f).
A single factor could not explain the spatiotemporal variation fully and the synergistic effects of multiple factors, including natural and anthropogenic factors, needed to be considered [56]. Previous studies have illustrated that the interactions among multiple factors affect NPP due to the complexity of geography [51,57,58]. Our results show that interactive effects could be observed among the factors and the interactive effects were greater than the effect of a single factor. Additionally, the interactive effect of any two factors was greater than the effect of any one factor, which is consistent with other studies [14,33,59]. Moreover, the types of interactive effect were either nonlinear enhancement or bivariate enhancement. Specifically, the interactive effects between LUCC and PRE, LUCC and TEM and DEM and PRE were larger than the others, which is in line with previous studies. For instance, reference [60] illustrated that the interactive effect of precipitation and land-use type was larger than the others and had a q value of 0.944. Reference [56] revealed that the interactive effect of DEM and precipitation was the highest, having a q value of 0.680. Reference [61] showed that the interactive effects of LUCC and PRE and LUCC and TEM were larger than the others; the q values between LUCC and PRE and between LUCC and TEM were 0.360 and 0.291, respectively. Although the individual effects of GDP and POP had relatively smaller impacts on NPP compared with topography and climate factors, their interactive effects all enhanced the explanatory powers (Table S1), similarly to previous studies [29,61]. This implies that not only the direct effect of each factor, but also the interactive effects among factors, should be considered in the future when exploring the driving forces of NPP variation.
4.3. Optimal Adaptation Range for NPP
The knowledge of the optimal adaption ranges of factors that affect vegetation NPP would help decision makers improve the ecological environment for vegetation growth [62]. Topographic factors are usually regarded as having vital roles in regulating NPP’s spatial distribution through the control of water, thermal changes and soil conditions and result in essential effects on the surrounding environment of vegetation [63]. In terms of DEM, the maximum NPP occurred when the DEM was lower than 403 m, indicating that a lower altitude is beneficial to vegetation growth and promotes NPP increase. This may have resulted from a lower altitude, usually accompanied by a warmer temperature, and this may have partly increased the activity of photosynthetic enzymes, decreased the rates of chlorophyll degradation, improved the capacity of photosynthesis [7] and finally, increased NPP. However, a lower altitude is usually accompanied by intense anthropogenic activities (e.g., land use and land cover change), which may have a negative impact through increasing the NPP.
Slope is regarded as a pivotal factor that decides vegetation distribution and NPP by affecting vegetation’s water uptake, soil erosion and vegetation’s light exposure [64]. Our results indicated that, when the slope lower than 3°, the NPP was small—values lower than 0.35 kg·C·m−2; and when the slope was greater than 3°, the NPP was larger than 0.4 kg·C·m−2. Similarly, [65] illustrated higher NPP values than 0.65 kg·C·m−2 with slopes higher than 2° in the southwest Karst area of China. Although a gentle slope is beneficial for vegetation growth, the flat areas are more likely to be disturbed by anthropogenic activities, such as intensive agricultural production and urban development, which in turn have negative effects on NPP [8].
Southeast China was usually associated with high NPP values of more than 0.35 kg·C·m−2. This may have been due to the sufficient warm air supplied by the southeast monsoon and the plentiful precipitation for vegetation growth. Additionally, the solar radiation is usually sufficient and higher than elsewhere, which would aid in photosynthesis. The spatiotemporal variation of NPP is closely associated with climate change and the increase of precipitation could promote vegetation growth, especially for arid and semi-arid areas, theoretically [66]. Our results indicated that NPP increases with increased precipitation and temperature and the optimal ranges of temperature and precipitation for NPP were 19–26 °C and 2611–4495 mm, respectively. Interestingly, when the temperature was lower than 14 °C, NPP increased slowly and, for temperatures higher than 14 °C, NPP increased obviously. This indicates that only up to a certain degree can temperature stimulate vegetation growth and carbon accumulation. NPP increased first and then decreased as PET and SH increased and the optimal PET and SH for NPP were 1268–1476 mm and 104–128 h, respectively. This shows that more PET or a longer SH is not always better for vegetation growth; the demands of vegetation for these two factors have thresholds and, over the thresholds, negative impacts appear. With respect to anthropogenic activities, NPP increased with GDP and POP at first. The optimal ranges were 3466–15,558 Yuan/km2 and 219–1047 person/km2 for GDP and POP, respectively. If GDP and POP surpassed the highest values of their optimum range, NPP decreased obviously and this result is consistent with [18]. This may be because the exceedance of a certain GDP or POP value that surpasses the environmental carrying capacity will also cause damage to the ecological environment [56] and affect vegetation’s carbon sequestration.
4.4. Policy Implications
The main driving forces of NPP were divergent among sub-regions in China, which made for differentiated measures to increase NPP and to achieve the carbon neutrality goal. In most parts of China (e.g., Northwest China, North China), LUCC was the dominant factor that drives NPP variation and reasonable land use seems particularly important in these regions. Previous studies have illustrates that increase in fraction of vegetation cover was mostly contributed to by afforestation in China, such as the Grain for Green Project [67,68] and there are large areas of un-vegetated land in northern China [47]. As we found that forest and shrub have a higher NPP value than other vegetation types, ecological restoration fully utilizing these un-vegetated areas, and with the use of forest and shrub, will increase the storage capacity of carbon and assistant in mitigating climate warming as well as achieving carbon neutrality. However, in most parts of Northern China, the annual mean precipitation was less than 400 mm and this becomes a limiting factor that affects vegetation growth. According to the optimal intervals of precipitation for NPP (Figure 8d), the NPP value is less than 0.17 kg·C·m−2 when precipitation is less than 421 mm. Therefore, artificial irrigation is vital for afforestation in Northern China. Additionally, due to water deficiency, the effect of afforestation on underground water should receive more attention from decision makers. In Southwest China, DEM and temperature were the two dominant factors affecting NPP variation. Therefore, areas with DEM less than 1000 m and temperature higher than 14 °C should receive more attention from decision makers in terms of afforestation, according to the optimal intervals (Figure 8a,e). In terms of social factors, the q values of GDP decreases after 2010 in all sub-regions and the q values of POP decreased after 2010 in Northeast China and South central China, and for the year of 2005 and 2015 for East China and Southwest China, respectively. The decreasing impact of anthropogenic activities on NPP may partly be contributed to by the construction of ecological civilization in China and the enhancement of ecological environmental protection awareness. However, the q values of POP increased after 2010 and 2015 in Northwest China and North China, respectively. Therefore, more attention should be paid to POP when it higher than 1047 Person/km2 (Figure 8j) in Northwest China and North China.
4.5. Limitations
The variation in NPP has a critical impact on the quality of the ecosystem, the mitigation of global climate change and the achievement of carbon neutrality. This study analyzed the spatiotemporal variation of NPP in China and explored the contributions and interactive effects of influencing factors on NPP. However, this study does have some limitations. First, the future change trend for NPP was predicted based on the Hurst exponent, but how long this trend will continue in the future is unknown. Second, the driving forces that impel NPP variation are not only factors that were selected in this study; other factors, such as soil nutrients and soil moisture, vegetation phenology, characteristics of soil stoichiometry, CO2 concentration and so on should be taken into consideration in the future. Third, the interactions between pairs of forcing factors were explored. However, the interactions were complex; in fact, interactions among multiple factors (e.g., more than two) could be considered to explore more accurate predictions of NPP variation based on the combination of artificial intelligence algorithms and geographical weighted regression [69] statistical analysis. Furthermore, the direct effects of influencing factors on NPP were explored. However, the indirect effects among factors were ignored and the indirect effects could be discussed in a future study based on structural equation modeling.
5. Conclusions
The spatial distribution of NPP was differentiated and decreased from southeast to northwest as a whole. The variation of NPP was mostly stable and an overall increasing trend was observed currently and in the future. LUCC and PRE were the main factors that drove NPP variation at both the national scale and the sub-region scale, except in southwest China, which was mainly affected by DEM and TEM. Therefore, reasonable land use and proper artificial irrigation in most parts of China especially in North China, would increase NPP and help to achieve the goal of carbon neutrality. Additionally, areas with DEM less than 1000 m and temperature higher than 14 °C in Southwest China could make full use of afforestation to increase carbon storage for the vegetation ecosystem. Moreover, the impact of POP on NPP in Northwest China and North China should be given more attention. The driving factors of NPP variation are not independent and interactive effects between any two factors were observed. Furthermore, the combined effect of any pair of driving factors on NPP variation was greater than that of any single factor, manifested as either bivariate enhancement or nonlinear enhancement, and in the process of achieving the carbon neutrality goal, the combined effect of influencing factors should be considered. In addition, the optimal range or categories of driving factors for vegetation growth were determined.
Supplementary Materials
The following supporting information can be downloaded at: https://www.mdpi.com/article/10.3390/rs15030789/s1. Table S1: Interactive effects in sub-regions. Figure S1: Schematic diagram of interaction detection. Figure S2: Schematic diagram of interaction detection.
Author Contributions
Z.L. outlined the research topic, assisted with manuscript writing and coordinated the revision activities. L.Z. and H.Q. performed data collection, data analysis, the interpretation of results. S.S. performed the manuscript writing and coordinated the revision activities. All authors have read and agreed to the published version of the manuscript.
Funding
This study was supported by National Natural Science Foundation of China (42001214), Central Fund Supporting Nonprofit Scientific Institutes for Basic Research and Development (No. PM-zx703-202111-313).
Data Availability Statement
NPP datasets used in our work can be freely accessed at https://www.usgs.gov/, climate data used in this work can be freely accessed at http://www.geodata.cn, and anthropogenic data can be freely accessed at http://www.resdc.cn/.
Conflicts of Interest
The authors declare no conflict of interest.
References
- Chen, S.-T.; Guo, B.; Zhang, R.; Zang, W.-Q.; Wei, C.-X.; Wu, H.-W.; Yang, X.; Zhen, X.-Y.; Li, X.; Zhang, D.-F.; et al. Quantitatively determine the dominant driving factors of the spatial—Temporal changes of vegetation NPP in the Hengduan Mountain area during 2000–2015. J. Mt. Sci. 2021, 18, 427–445. [Google Scholar] [CrossRef]
- Wu, Y.; Luo, Z.; Wu, Z. The Different Impacts of Climate Variability and Human Activities on NPP in the Guangdong–Hong Kong–Macao Greater Bay Area. Remote Sens. 2022, 14, 2929. [Google Scholar] [CrossRef]
- Wang, D.; Qin, W.; Jia, G.; Shan, Z.; Hao, M. Assessing the effects of climate variability and vegetation conversion on variations of net primary productivity in the mountainous area of North China. For. Ecol. Manag. 2022, 506, 119957. [Google Scholar] [CrossRef]
- Luo, Z.; Wu, W.; Yu, X.; Song, Q.; Yang, J.; Wu, J.; Zhang, H. Variation of Net Primary Production and Its Correlation with Climate Change and Anthropogenic Activities over the Tibetan Plateau. Remote Sens. 2018, 10, 1352. [Google Scholar] [CrossRef]
- Cao, D.; Zhang, J.; Han, J.; Zhang, T.; Yang, S.; Wang, J.; Prodhan, F.A.; Yao, F. Projected Increases in Global Terrestrial Net Primary Productivity Loss Caused by Drought Under Climate Change. Earth’s Future 2022, 10, e2022EF002681. [Google Scholar] [CrossRef]
- Campana, S.; Yahdjian, L.; Decocq, G. Plant quality and primary productivity modulate plant biomass responses to the joint effects of grazing and fertilization in a mesic grassland. Appl. Veg. Sci. 2021, 24, e12588. [Google Scholar] [CrossRef]
- Yang, J.; Zhang, X.; Luo, Z.; Yu, X. Nonlinear Variations of Net Primary Productivity and Its Relationship with Climate and Vegetation Phenology, China. Forests 2017, 8, 361. [Google Scholar] [CrossRef] [Green Version]
- Du, Z.; Liu, X.; Wu, Z.; Zhang, H.; Zhao, J. Responses of Forest Net Primary Productivity to Climatic Factors in China during 1982–2015. Plants 2022, 11, 2932. [Google Scholar] [CrossRef]
- Ji, Y.; Zhou, G.; Luo, T.; Dan, Y.; Zhou, L.; Lv, X. Variation of net primary productivity and its drivers in China’s forests during 2000–2018. For. Ecosyst. 2020, 7, 1–11. [Google Scholar] [CrossRef] [Green Version]
- Xie, C.; Wu, S.; Zhuang, Q.; Zhang, Z.; Hou, G.; Luo, G.; Hu, Z. Where Anthropogenic Activity Occurs, Anthropogenic Activity Dominates Vegetation Net Primary Productivity Change. Remote Sens. 2022, 14, 1092. [Google Scholar] [CrossRef]
- Li, S.; He, S. The variation of net primary productivity and underlying mechanisms vary under different drought stress in Central Asia from 1990 to 2020. Agric. For. Meteorol. 2022, 314, 108767. [Google Scholar] [CrossRef]
- Yan, X.; Li, J.; Shao, Y.; Hu, Z.; Yang, Z.; Yin, S.; Cui, L. Driving forces of grassland vegetation changes in Chen Barag Banner, Inner Mongolia. GISci. Remote Sens. 2020, 57, 753–769. [Google Scholar] [CrossRef]
- Zhang, L.; Yang, L.; Zohner, C.M.; Crowther, T.W.; Li, M.; Shen, F.; Guo, M.; Qin, J.; Yao, L.; Zhou, C. Direct and indirect impacts of urbanization on vegetation growth across the world’s cities. Sci. Adv. 2022, 8, eabo0095. [Google Scholar] [CrossRef]
- Liu, Y.; Liu, S.; Sun, Y.; Li, M.; An, Y.; Shi, F. Spatial differentiation of the NPP and NDVI and its influencing factors vary with grassland type on the Qinghai-Tibet Plateau. Environ. Monit. Assess. 2021, 193, 48. [Google Scholar] [CrossRef]
- Luo, Z.; Song, Q.; Wang, T.; Zeng, H.; He, T.; Zhang, H.; Wu, W. Direct Impacts of Climate Change and Indirect Impacts of Non-Climate Change on Land Surface Phenology Variation across Northern China. ISPRS Int. J. Geo-Inf. 2018, 7, 451. [Google Scholar] [CrossRef] [Green Version]
- Yan, Y.; Liu, X.; Wen, Y.; Ou, J. Quantitative analysis of the contributions of climatic and human factors to grassland productivity in northern China. Ecol. Indic. 2019, 103, 542–553. [Google Scholar] [CrossRef]
- Wu, Y.; Wu, Z. Quantitative assessment of human-induced impacts based on net primary productivity in Guangzhou, China. Environ. Sci. Pollut. Res. 2018, 25, 11384–11399. [Google Scholar] [CrossRef]
- Zhou, W.; Yang, H.; Huang, L.; Chen, C.; Lin, X.; Hu, Z.; Li, J. Grassland degradation remote sensing monitoring and driving factors quantitative assessment in China from 1982 to 2010. Ecol. Indic. 2017, 83, 303–313. [Google Scholar] [CrossRef]
- Ma, Z.; Chen, H.Y.H.; Li, Y.; Chang, S.X.; Mariotte, P. Interactive effects of global change factors on terrestrial net primary productivity are treatment length and intensity dependent. J. Ecol. 2020, 108, 2083–2094. [Google Scholar] [CrossRef]
- Luo, Y.; Gerten, D.; Le Maire, G.; Parton, W.J.; Weng, E.; Zhou, X.; Keough, C.; Beier, C.; Ciais, P.; Cramer, W.; et al. Modeled interactive effects of precipitation, temperature, and [CO2] on ecosystem carbon and water dynamics in different climatic zones. Glob. Change Biol. 2008, 14, 1986–1999. [Google Scholar] [CrossRef]
- Zhou, X.; Weng, E.; Luo, Y. Modeling patterns of nonlinearity in ecosystem responses to temperature, CO2, and precipitation changes. Ecol. Appl. 2008, 18, 453–466. [Google Scholar] [CrossRef] [Green Version]
- Fuhrer, J. Agroecosystem responses to combinations of elevated CO2, ozone, and global climate change. Agric. Ecosyst. Environ. 2003, 97, 1–20. [Google Scholar] [CrossRef]
- Wang, X.; Tan, K.; Chen, B.; Du, P. Assessing the Spatiotemporal Variation and Impact Factors of Net Primary Productivity in China. Sci. Rep. 2017, 7, 44415. [Google Scholar] [CrossRef] [Green Version]
- Pei, F.; Wu, C.; Liu, X.; Li, X.; Yang, K.; Zhou, Y.; Wang, K.; Xu, L.; Xia, G. Monitoring the vegetation activity in China using vegetation health indices. Agric. For. Meteorol. 2018, 248, 215–227. [Google Scholar] [CrossRef]
- Zuo, D.; Han, Y.; Xu, Z.; Li, P.; Ban, C.; Sun, W.; Pang, B.; Peng, D.; Kan, G.; Zhang, R.; et al. Time-lag effects of climatic change and drought on vegetation dynamics in an alpine river basin of the Tibet Plateau, China. J. Hydrol. 2021, 600, 126532. [Google Scholar] [CrossRef]
- Yue, S.; Pilon, P.; Cavadias, G. Power of the Mann-Kendall and Spearman’s Rho Tests For Detecting Monotonic Trends in Hydrological Series. J. Hydrol. 2002, 259, 254–271. [Google Scholar] [CrossRef]
- Cai, Y.; Zhang, F.; Duan, P.; Yung Jim, C.; Weng Chan, N.; Shi, J.; Liu, C.; Wang, J.; Bahtebay, J.; Ma, X. Vegetation cover changes in China induced by ecological restoration-protection projects and land-use changes from 2000 to 2020. Catena 2022, 217, 106530. [Google Scholar] [CrossRef]
- Li, J.; Wang, J.; Zhang, J.; Zhang, J.; Kong, H. Dynamic changes of vegetation coverage in China-Myanmar economic corridor over the past 20 years. Int. J. Appl. Earth Obs. Geoinf. 2021, 102, 102378. [Google Scholar] [CrossRef]
- Kang, Y.; Guo, E.; Wang, Y.; Bao, Y.; Bao, Y.; Mandula, N. Monitoring Vegetation Change and Its Potential Drivers in Inner Mongolia from 2000 to 2019. Remote Sens. 2021, 13, 3357. [Google Scholar] [CrossRef]
- Bonney, M.T.; Danby, R.K.; Treitz, P.M. Landscape variability of vegetation change across the forest to tundra transition of central Canada. Remote Sens. Environ. 2018, 217, 18–29. [Google Scholar] [CrossRef]
- Fang, X.; Zhu, Q.; Ren, L.; Chen, H.; Wang, K.; Peng, C. Large-scale detection of vegetation dynamics and their potential drivers using MODIS images and BFAST: A case study in Quebec, Canada. Remote Sens. Environ. 2018, 206, 391–402. [Google Scholar] [CrossRef]
- Wang, J.-F.; Zhang, T.-L.; Fu, B.-J. A measure of spatial stratified heterogeneity. Ecol. Indic. 2016, 67, 250–256. [Google Scholar] [CrossRef]
- Peng, W.; Kuang, T.; Tao, S. Quantifying influences of natural factors on vegetation NDVI changes based on geographical detector in Sichuan, western China. J. Clean. Prod. 2019, 233, 353–367. [Google Scholar] [CrossRef]
- Chen, Y.; Feng, X.; Tian, H.; Wu, X.; Gao, Z.; Feng, Y.; Piao, S.; Lv, N.; Pan, N.; Fu, B. Accelerated increase in vegetation carbon sequestration in China after 2010: A turning point resulting from climate and human interaction. Glob. Change Biol. 2021, 27, 5848–5864. [Google Scholar] [CrossRef]
- Ge, W.; Deng, L.; Wang, F.; Han, J. Quantifying the contributions of human activities and climate change to vegetation net primary productivity dynamics in China from 2001 to 2016. Sci. Total Environ. 2021, 773, 145648. [Google Scholar] [CrossRef]
- Luo, Z.; Yu, S. Spatiotemporal Variability of Land Surface Phenology in China from 2001–2014. Remote Sens. 2017, 9, 65. [Google Scholar] [CrossRef] [Green Version]
- Meng, X.; Zhang, S.; Zhang, Y.; Wang, C. Temporal and spatial changes of temperature and precipitation in Hexi Corridor during 1955–2011. J. Geogr. Sci. 2013, 23, 653–667. [Google Scholar] [CrossRef]
- Sayemuzzaman, M.; Jha, M.K. Seasonal and annual precipitation time series trend analysis in North Carolina, United States. Atmos. Res. 2014, 137, 183–194. [Google Scholar] [CrossRef]
- Chen, Y.; Chen, L.; Cheng, Y.; Ju, W.; Chen, H.Y.H.; Ruan, H. Afforestation promotes the enhancement of forest LAI and NPP in China. For. Ecol. Manag. 2020, 462, 117990. [Google Scholar] [CrossRef]
- Du, W.; Yan, H.; Feng, Z.; Yang, Y.; Liu, F. The supply-consumption relationship of ecological resources under ecological civilization construction in China. Resour. Conserv. Recycl. 2021, 172, 105679. [Google Scholar] [CrossRef]
- Chen, C.; Park, T.; Wang, X.; Piao, S.; Xu, B.; Chaturvedi, R.K.; Fuchs, R.; Brovkin, V.; Ciais, P.; Fensholt, R.; et al. China and India lead in greening of the world through land-use management. Nat. Sustain. 2019, 2, 122–129. [Google Scholar] [CrossRef]
- Lu, F.; Hu, H.; Sun, W.; Zhu, J.; Liu, G.; Zhou, W.; Zhang, Q.; Shi, P.; Liu, X.; Wu, X.; et al. Effects of national ecological restoration projects on carbon sequestration in China from 2001 to 2010. Proc. Natl. Acad. Sci. USA 2018, 115, 4039–4044. [Google Scholar] [CrossRef] [Green Version]
- Cao, S.; Chen, L.; Shankman, D.; Wang, C.; Wang, X.; Zhang, H. Excessive reliance on afforestation in China’s arid and semi-arid regions: Lessons in ecological restoration. Earth-Sci. Rev. 2011, 104, 240–245. [Google Scholar] [CrossRef]
- Jiang, C.; Wu, Z.F.; Cheng, J.; Yu, Q.; Rao, X.Q. Impacts of urbanization on net primary productivity in the Pearl River Delta, China. Int. J. Plant Prod. 2015, 9, 581–598. [Google Scholar]
- Guan, X.; Shen, H.; Li, X.; Gan, W.; Zhang, L. A long-term and comprehensive assessment of the urbanization-induced impacts on vegetation net primary productivity. Sci. Total Environ. 2019, 669, 342–352. [Google Scholar] [CrossRef]
- Liu, S.; Du, W.; Su, H.; Wang, S.; Guan, Q. Quantifying Impacts of Land-Use/Cover Change on Urban Vegetation Gross Primary Production: A Case Study of Wuhan, China. Sustainability 2018, 10, 714. [Google Scholar] [CrossRef] [Green Version]
- Pei, F.; Li, X.; Liu, X.; Wang, S.; He, Z. Assessing the differences in net primary productivity between pre- and post-urban land development in China. Agric. For. Meteorol. 2013, 171–172, 174–186. [Google Scholar] [CrossRef]
- Zuo, Y.; Li, Y.; He, K.; Wen, Y. Temporal and spatial variation characteristics of vegetation coverage and quantitative analysis of its potential driving forces in the Qilian Mountains, China, 2000–2020. Ecol. Indic. 2022, 143, 109429. [Google Scholar] [CrossRef]
- Gao, J.; Wang, Y.; Zou, C.; Xu, D.; Lin, N.; Wang, L.; Zhang, K. China’s ecological conservation redline: A solution for future nature conservation. Ambio 2020, 49, 1519–1529. [Google Scholar] [CrossRef]
- Zhen, L.; Ishwaran, N.; Luo, Q.; Wei, Y.; Zhang, Q. Role and significance of restoration technologies for vulnerable ecosystems in building an ecological civilization in China. Environ. Dev. 2020, 34, 100494. [Google Scholar] [CrossRef]
- Liu, C.; Li, W.; Wang, W.; Zhou, H.; Liang, T.; Hou, F.; Xu, J.; Xue, P. Quantitative spatial analysis of vegetation dynamics and potential driving factors in a typical alpine region on the northeastern Tibetan Plateau using the Google Earth Engine. Catena 2021, 206, 105500. [Google Scholar] [CrossRef]
- Nie, T.; Dong, G.; Jiang, X.; Lei, Y. Spatio-Temporal Changes and Driving Forces of Vegetation Coverage on the Loess Plateau of Northern Shaanxi. Remote Sens. 2021, 13, 613. [Google Scholar] [CrossRef]
- Shi, M.; Wu, H.; Jiang, P.; Shi, W.; Zhang, M.; Zhang, L.; Zhang, H.; Fan, X.; Liu, Z.; Zheng, K.; et al. Cropland Expansion Mitigates the Supply and Demand Deficit for Carbon Sequestration Service under Different Scenarios in the Future—The Case of Xinjiang. Agriculture 2022, 12, 1182. [Google Scholar] [CrossRef]
- Chi, D.; Wang, H.; Li, X.; Liu, H.; Li, X. Assessing the effects of grazing on variations of vegetation NPP in the Xilingol Grassland, China, using a grazing pressure index. Ecol. Indic. 2018, 88, 372–383. [Google Scholar] [CrossRef]
- Wang, Z.; Zhang, Y.; Yang, Y.; Zhou, W.; Gang, C.; Zhang, Y.; Li, J.; An, R.; Wang, K.; Odeh, I.; et al. Quantitative assess the driving forces on the grassland degradation in the Qinghai–Tibet Plateau, in China. Ecol. Inform. 2016, 33, 32–44. [Google Scholar] [CrossRef]
- Gao, S.; Dong, G.; Jiang, X.; Nie, T.; Yin, H.; Guo, X. Quantification of Natural and Anthropogenic Driving Forces of Vegetation Changes in the Three-River Headwater Region during 1982–2015 Based on Geographical Detector Model. Remote Sens. 2021, 13, 4175. [Google Scholar] [CrossRef]
- Zhou, Y.; Li, X.; Liu, Y. Land use change and driving factors in rural China during the period 1995–2015. Land Use Policy 2020, 99, 105048. [Google Scholar] [CrossRef]
- Wang, H.; Yan, S.; Liang, Z.; Jiao, K.; Li, D.; Wei, F.; Li, S. Strength of association between vegetation greenness and its drivers across China between 1982 and 2015: Regional differences and temporal variations. Ecol. Indic. 2021, 128, 107831. [Google Scholar] [CrossRef]
- Zheng, K.; Tan, L.; Sun, Y.; Wu, Y.; Duan, Z.; Xu, Y.; Gao, C. Impacts of climate change and anthropogenic activities on vegetation change: Evidence from typical areas in China. Ecol. Indic. 2021, 126, 107648. [Google Scholar] [CrossRef]
- Yang, Z.; Gao, X.; Lei, J.; Meng, X.; Zhou, N. Analysis of spatiotemporal changes and driving factors of desertification in the Africa Sahel. Catena 2022, 213, 106213. [Google Scholar] [CrossRef]
- Zhu, L.; Meng, J.; Zhu, L. Applying Geodetector to disentangle the contributions of natural and anthropogenic factors to NDVI variations in the middle reaches of the Heihe River Basin. Ecol. Indic. 2020, 117, 106545. [Google Scholar] [CrossRef]
- Meng, X.; Gao, X.; Li, S.; Lei, J. Spatial and Temporal Characteristics of Vegetation NDVI Changes and the Driving Forces in Mongolia during 1982–2015. Remote Sens. 2020, 12, 603. [Google Scholar] [CrossRef] [Green Version]
- Tao, J.; Xu, T.; Dong, J.; Yu, X.; Jiang, Y.; Zhang, Y.; Huang, K.; Zhu, J.; Dong, J.; Xu, Y.; et al. Elevation-dependent effects of climate change on vegetation greenness in the high mountains of southwest China during 1982-2013. Int. J. Climatol. 2018, 38, 2029–2038. [Google Scholar] [CrossRef]
- Kamali, A.; Khosravi, M.; Hamidianpour, M. Spatial-temporal analysis of net primary production (NPP) and its relationship with climatic factors in Iran. Environ. Monit. Assess. 2020, 192, 718. [Google Scholar] [CrossRef] [PubMed]
- Ma, B.; Jing, J.; Liu, B.; Xu, Y.; Dou, S.; He, H. Quantitative assessment of the relative contributions of climate change and human activities to NPP changes in the Southwest Karst area of China. Environ. Sci. Pollut. Res. 2022, 29, 80597–80611. [Google Scholar] [CrossRef]
- Huang, S.; Zheng, X.; Ma, L.; Wang, H.; Huang, Q.; Leng, G.; Meng, E.; Guo, Y. Quantitative contribution of climate change and human activities to vegetation cover variations based on GA-SVM model. J. Hydrol. 2020, 584, 124687. [Google Scholar] [CrossRef]
- Chen, Y.; Wang, K.; Lin, Y.; Shi, W.; Song, Y.; He, X. Balancing green and grain trade. Nat. Geosci. 2015, 8, 739–741. [Google Scholar] [CrossRef]
- Zheng, K.; Wei, J.Z.; Pei, J.Y.; Cheng, H.; Zhang, X.L.; Huang, F.Q.; Li, F.M.; Ye, J.S. Impacts of climate change and human activities on grassland vegetation variation in the Chinese Loess Plateau. Sci. Total Environ. 2019, 660, 236–244. [Google Scholar] [CrossRef]
- Wang, X.; Shi, S.; Zhao, X.; Hu, Z.; Hou, M.; Xu, L. Detecting Spatially Non-Stationary between Vegetation and Related Factors in the Yellow River Basin from 1986 to 2021 Using Multiscale Geographically Weighted Regression Based on Landsat. Remote Sens. 2022, 14, 6276. [Google Scholar] [CrossRef]
Figure 1.
Sketch of study area.
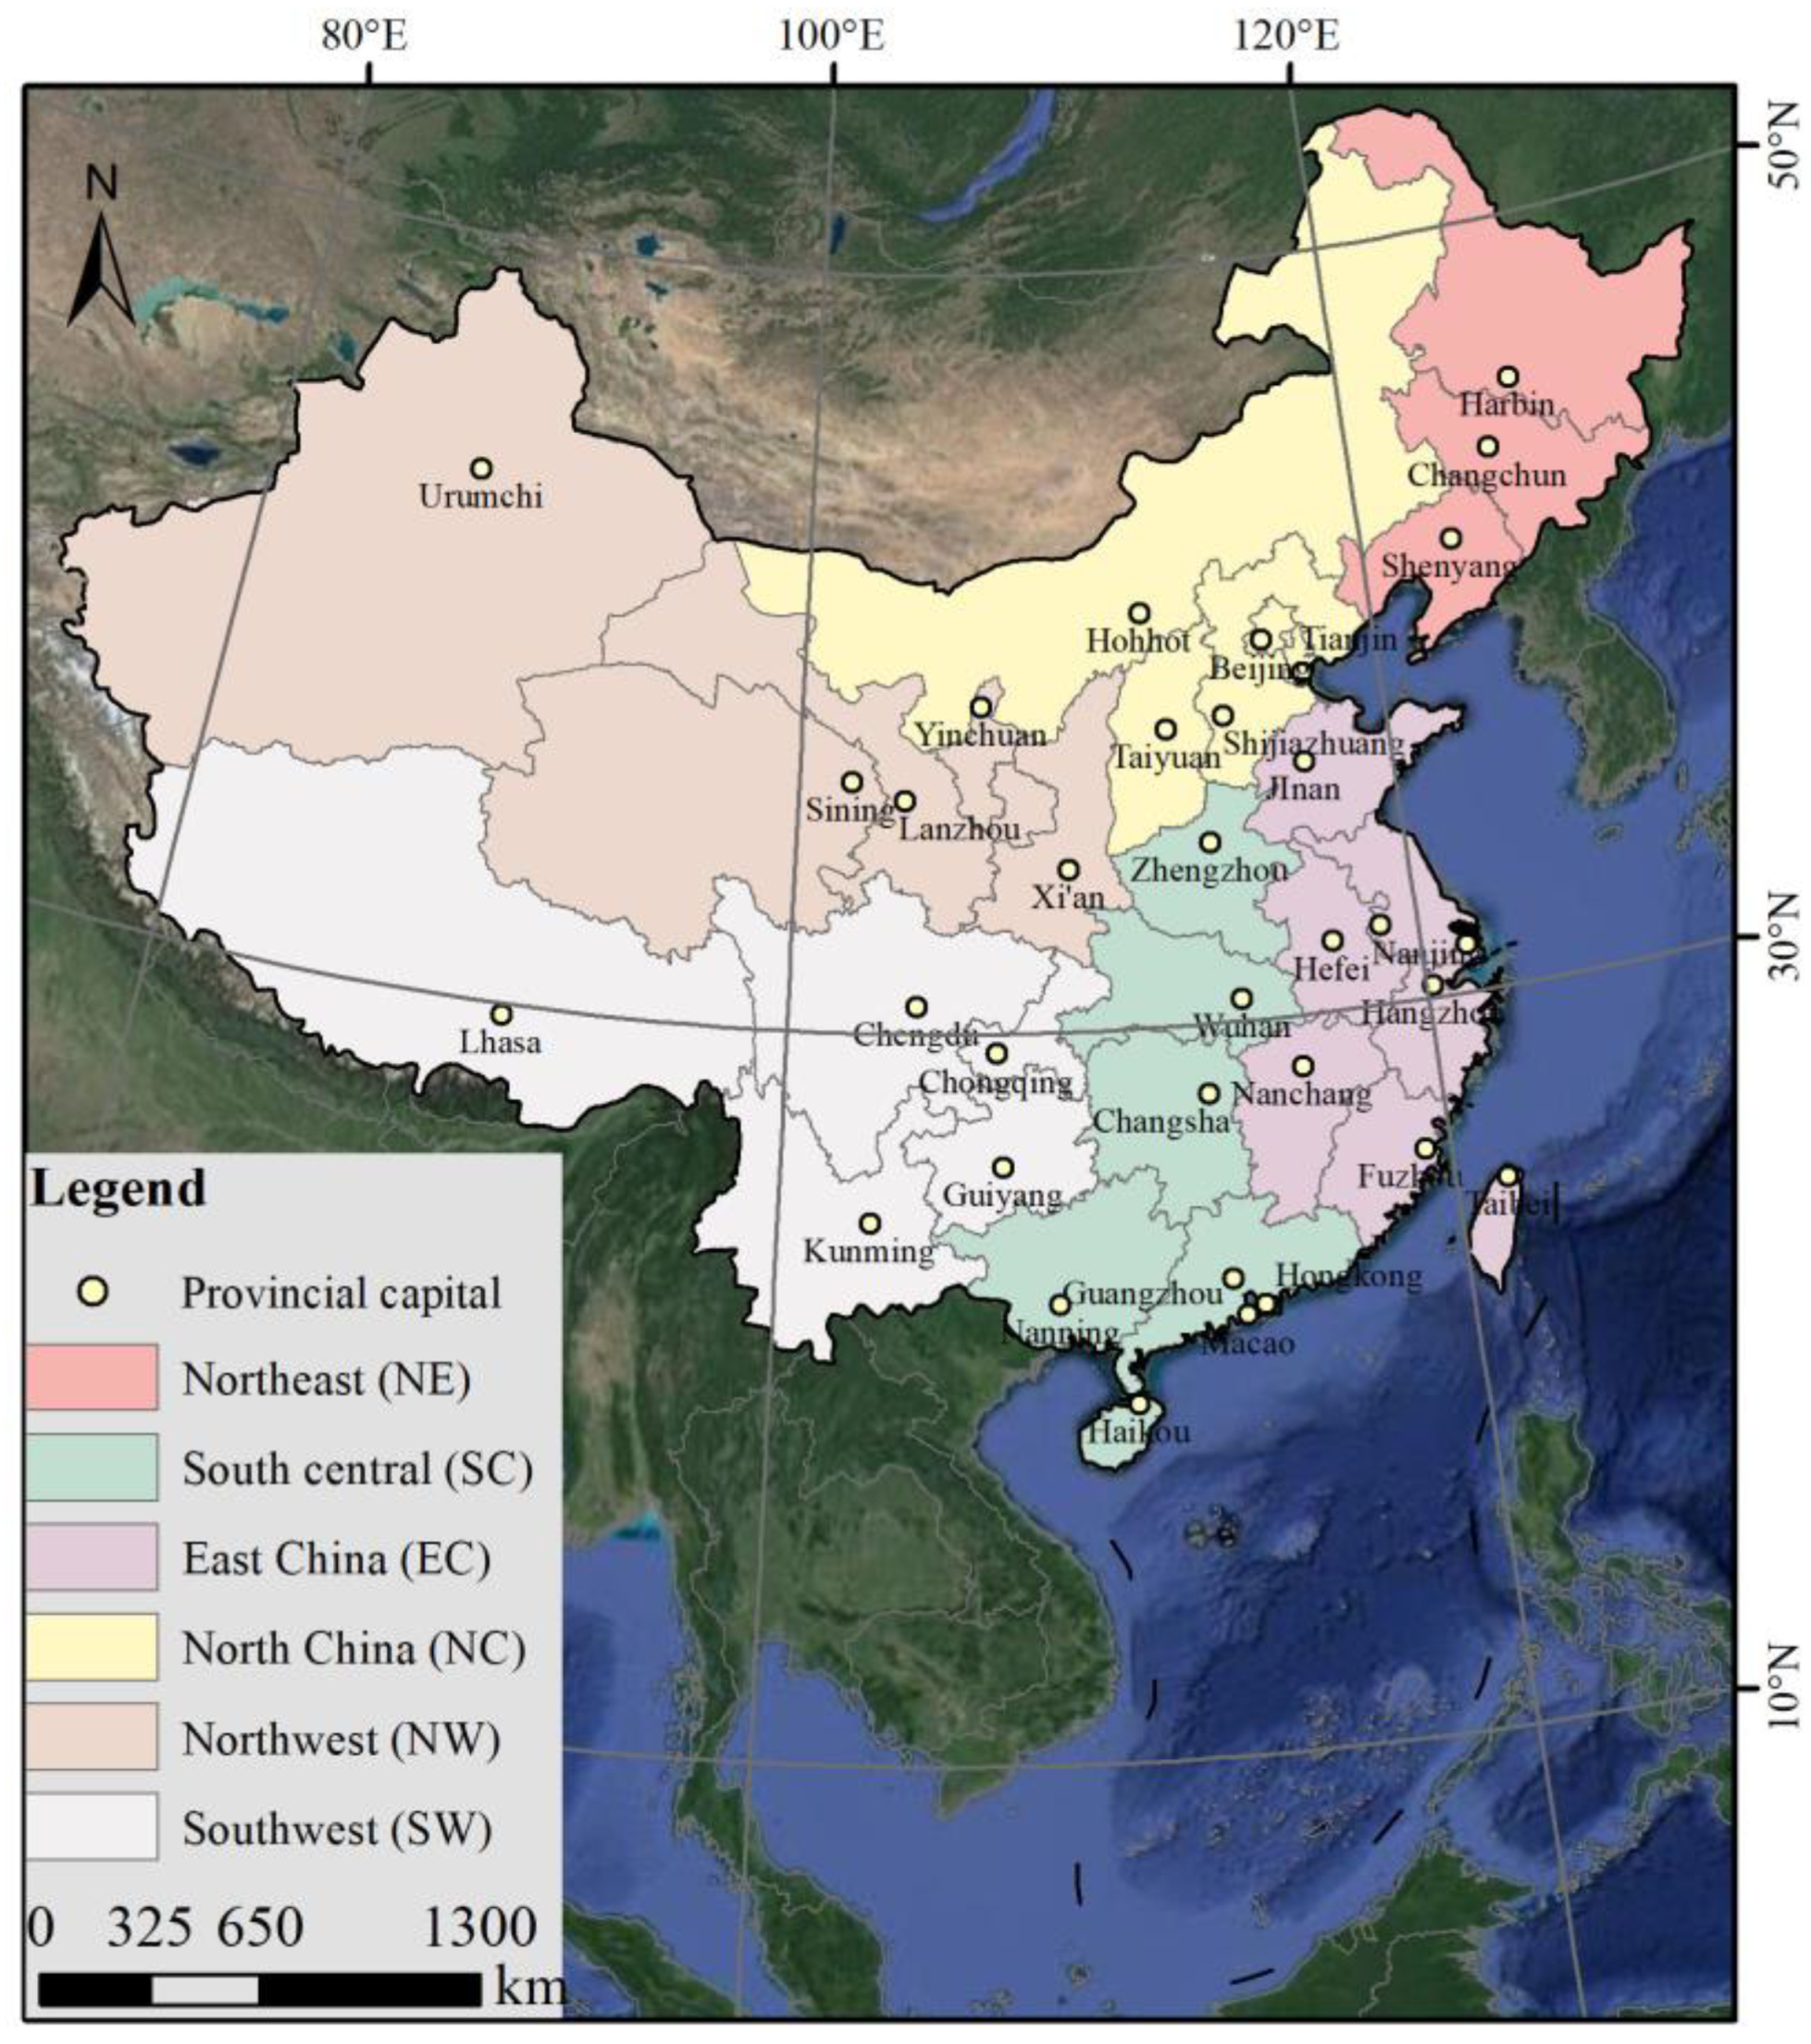
Figure 2.
Technical flow chart.

Figure 3.
(A,B) Spatial and stable patterns of NPP. (a–e) represent the detailed information for the northwest China, northeast China, Central China, southeast China and southwest China, respectively.
Figure 3.
(A,B) Spatial and stable patterns of NPP. (a–e) represent the detailed information for the northwest China, northeast China, Central China, southeast China and southwest China, respectively.
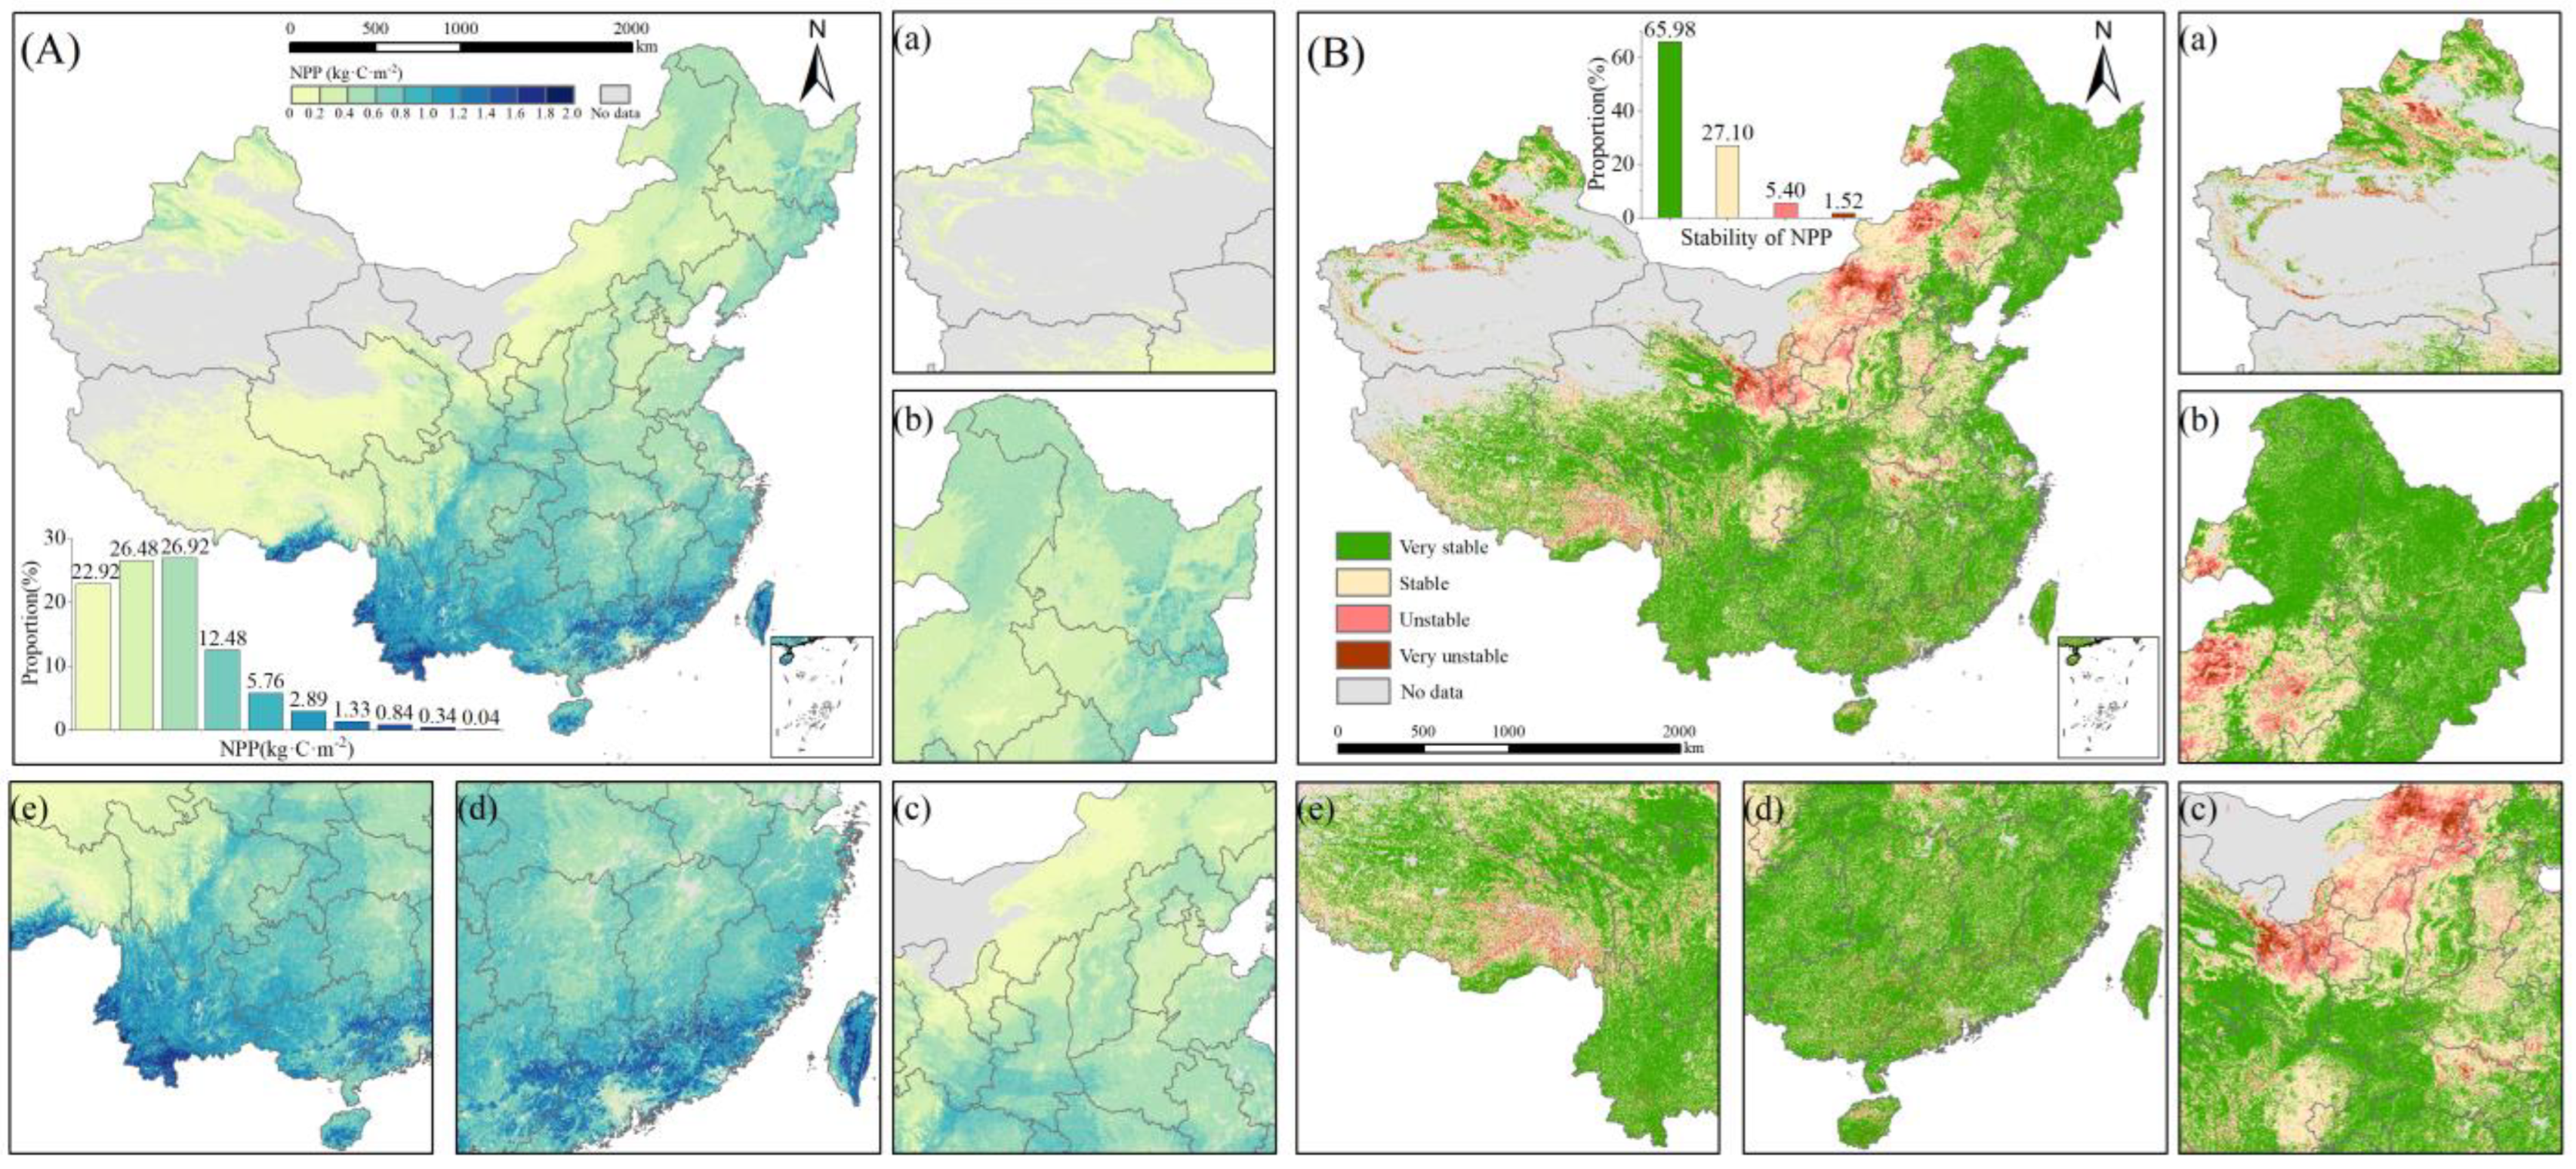
Figure 4.
(A) Temporal trends of NPP in China between 2000 and 2020 and (B) the spatial distribution of significant (p < 0.05) and very significant (p < 0.01) trends for NPP variation. SD, decreased significantly; ESD, decreased very significantly; SI, increased significantly; ESI, increased very significantly. (a–e) represent the detailed information for the northwest China, northeast China, Central China, southeast China and southwest China, respectively.
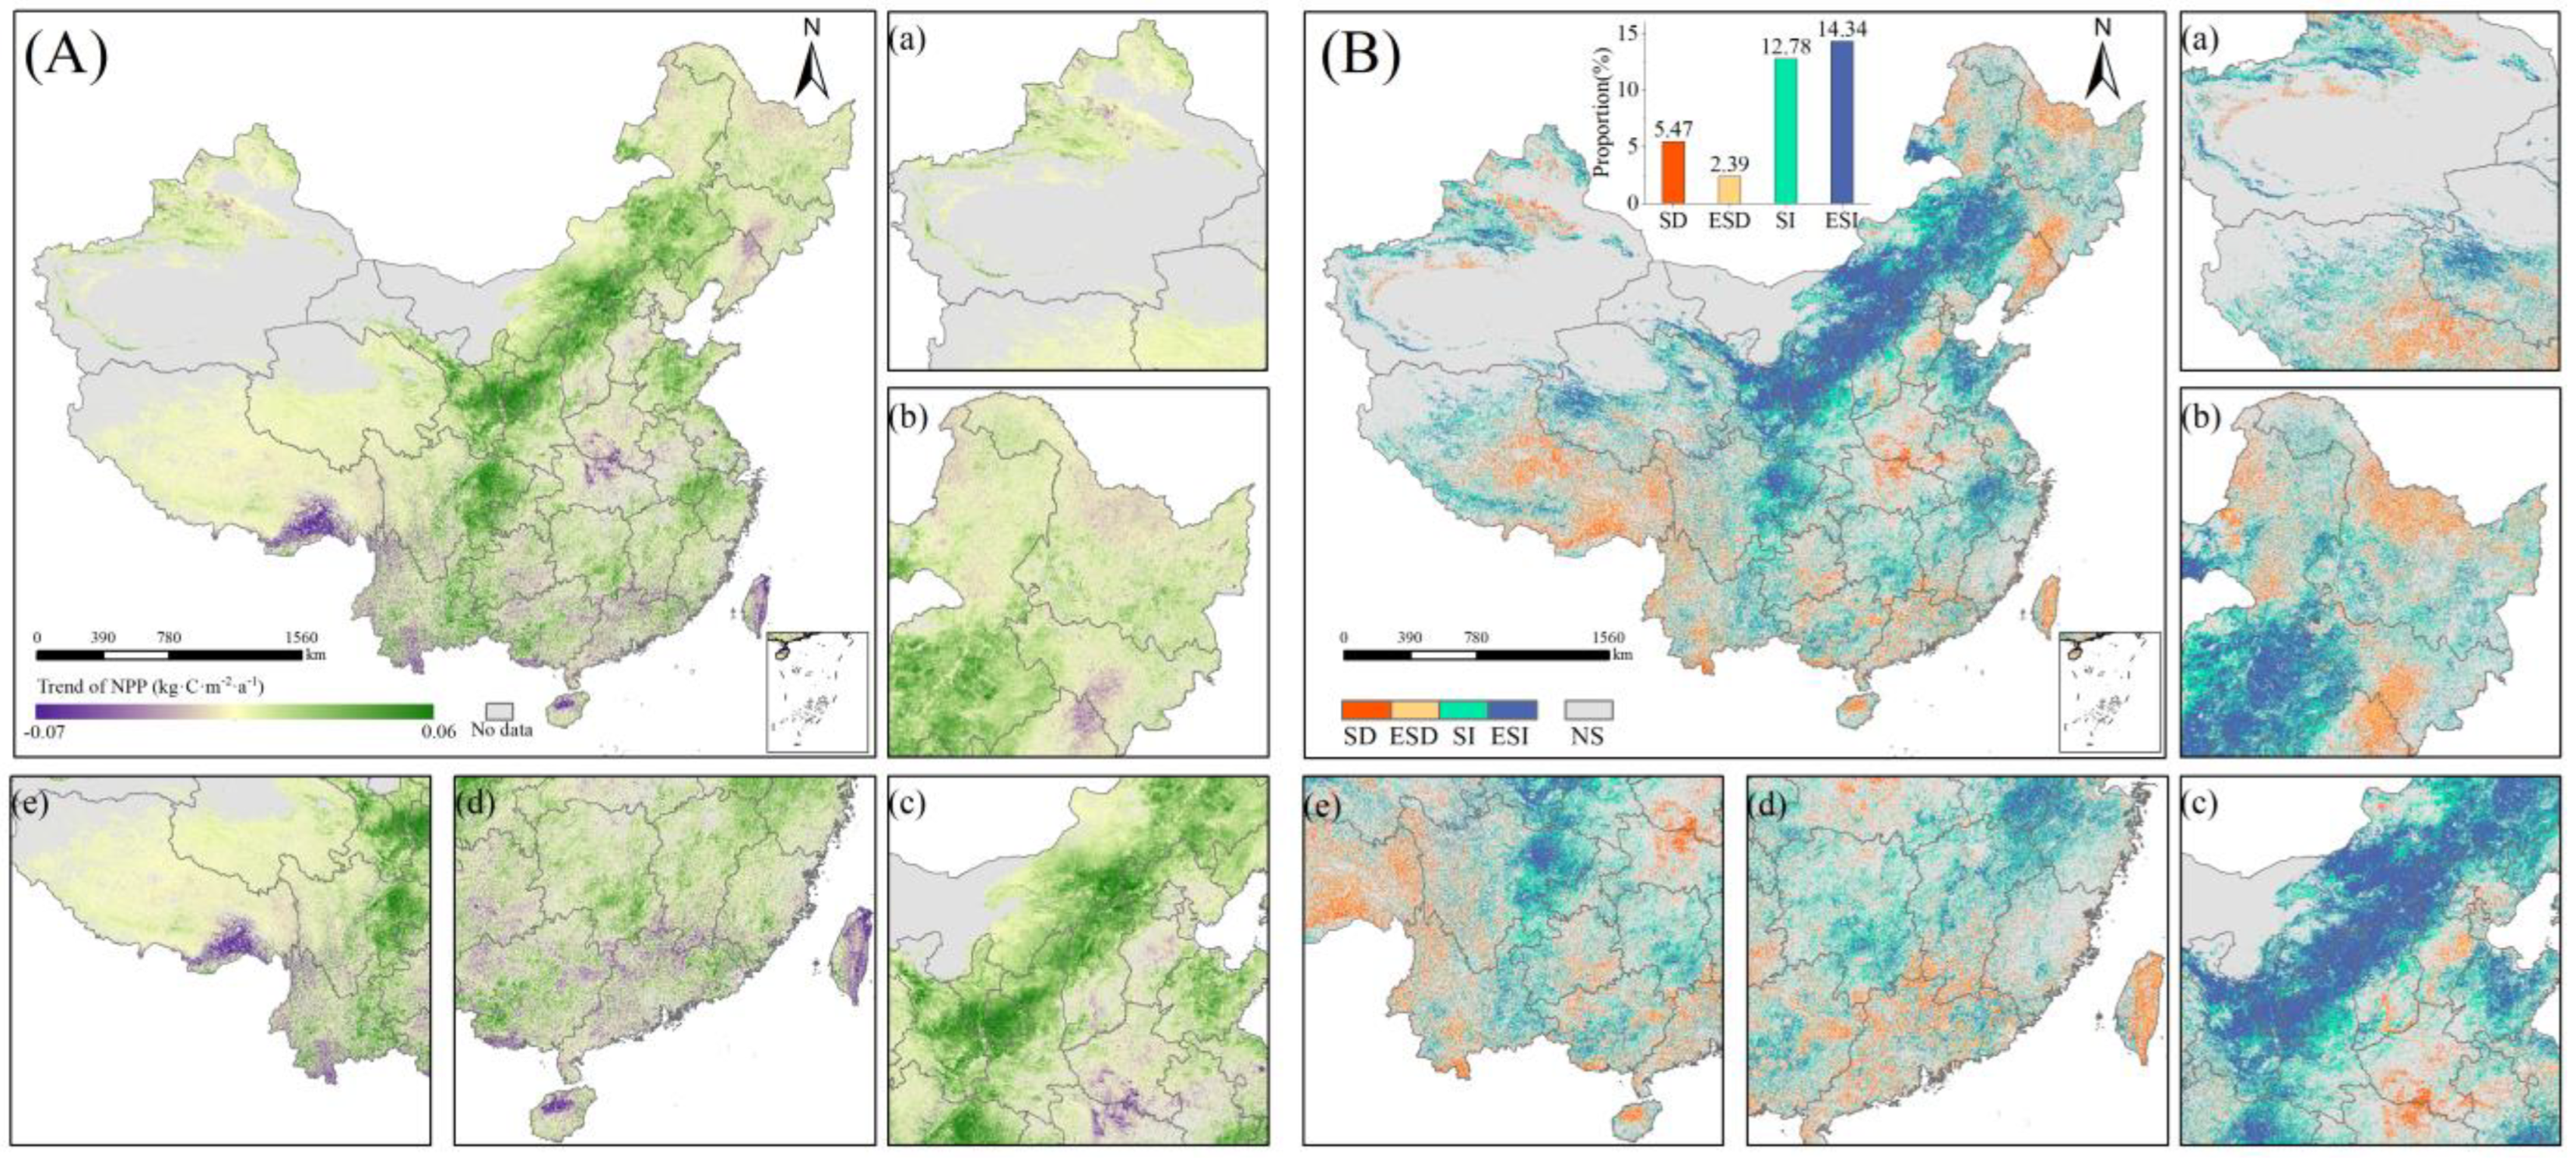
Figure 5.
Hurst exponent of NPP (A) and future trend of NPP (B). CI, continue increase; CD, continue decrease; FITD, from an increasing trend to a decreasing trend; FDTI, from a decreasing trend to an increasing trend. (a–e) represent the detailed information for the northwest China, northeast China, Central China, southeast China and southwest China, respectively.
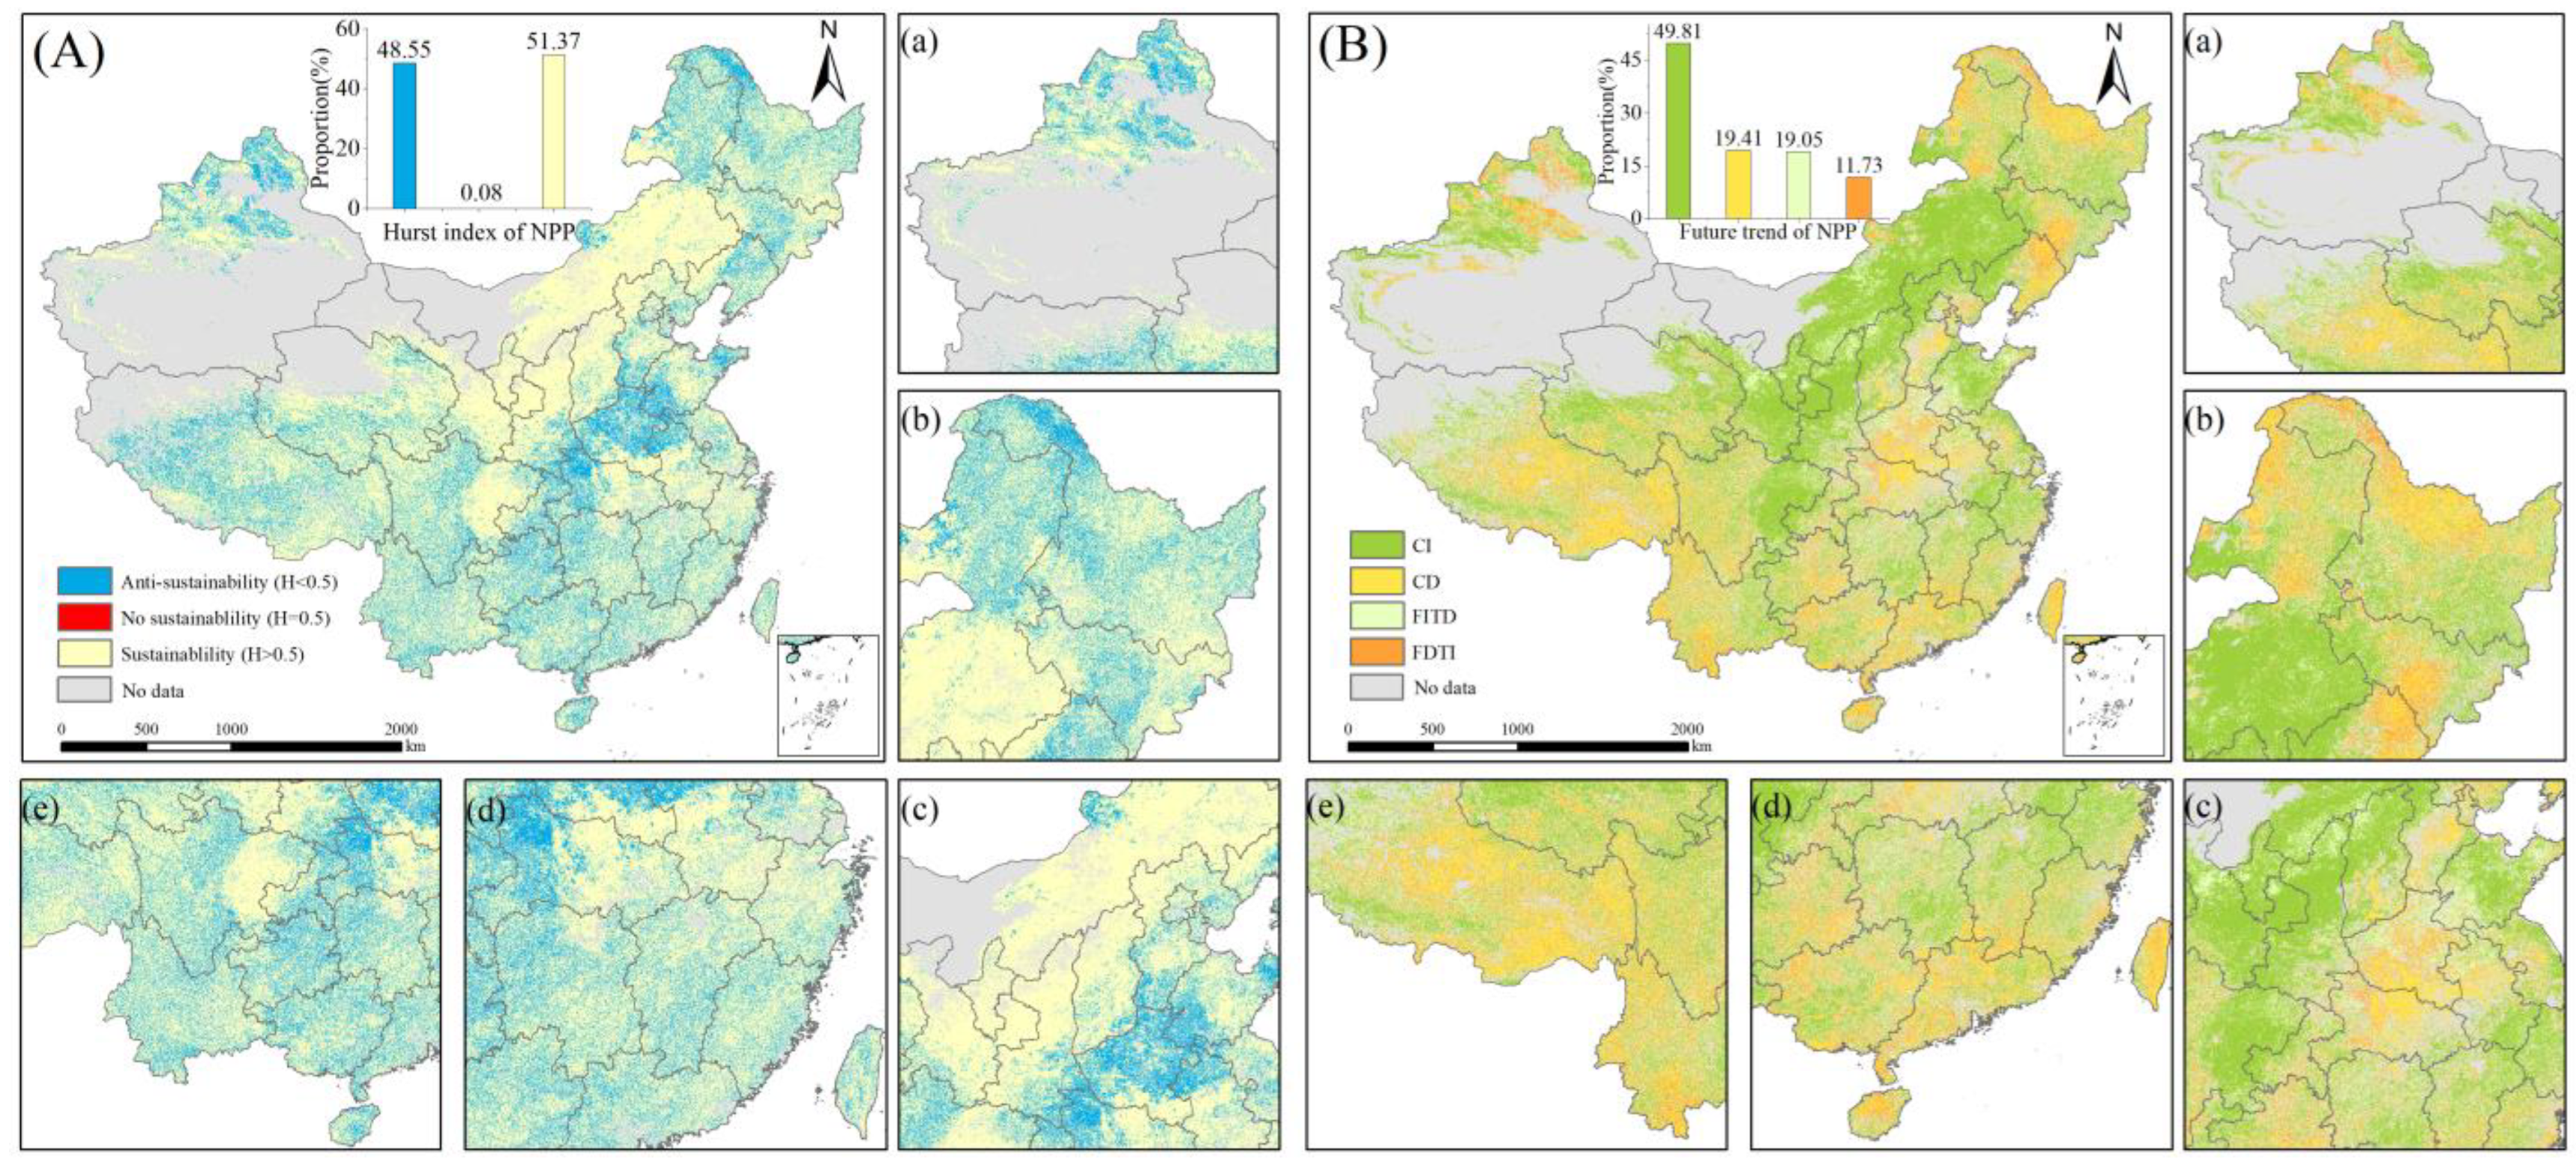
Figure 6.
Changes in the q values of influential factors in China during 2000–2020.
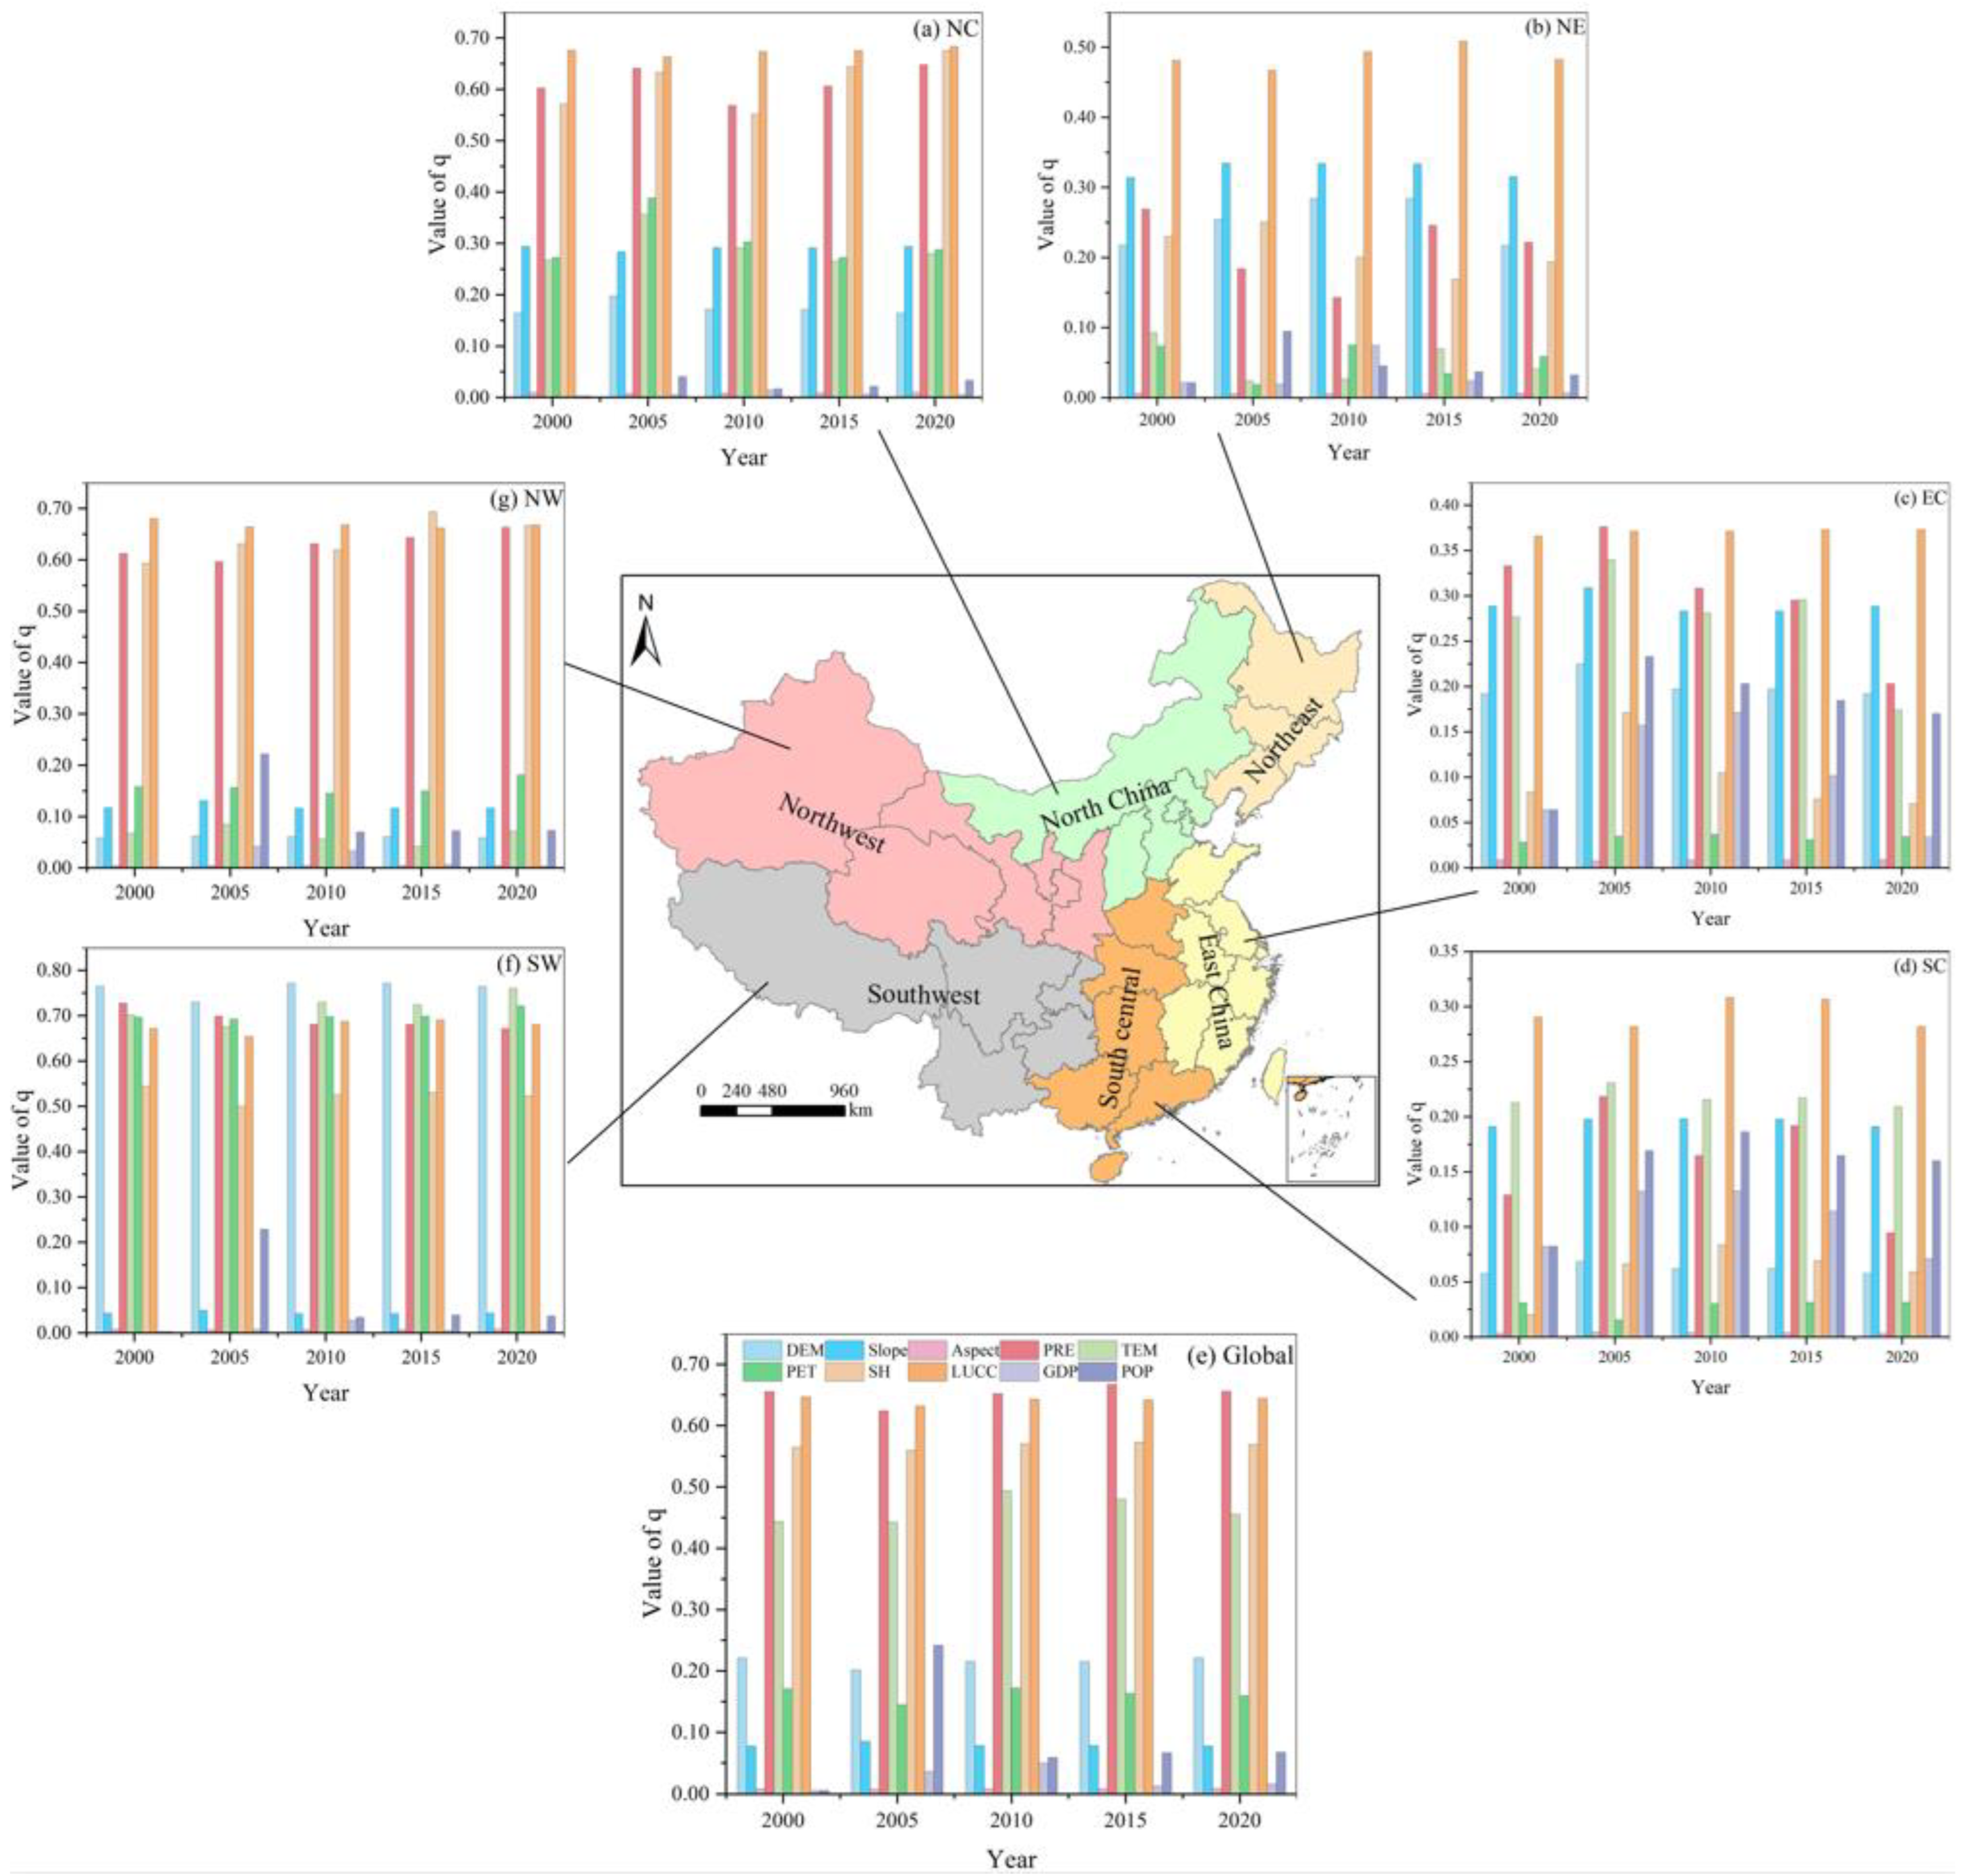
Figure 7.
The interactive effect between influencing factors and NPP.
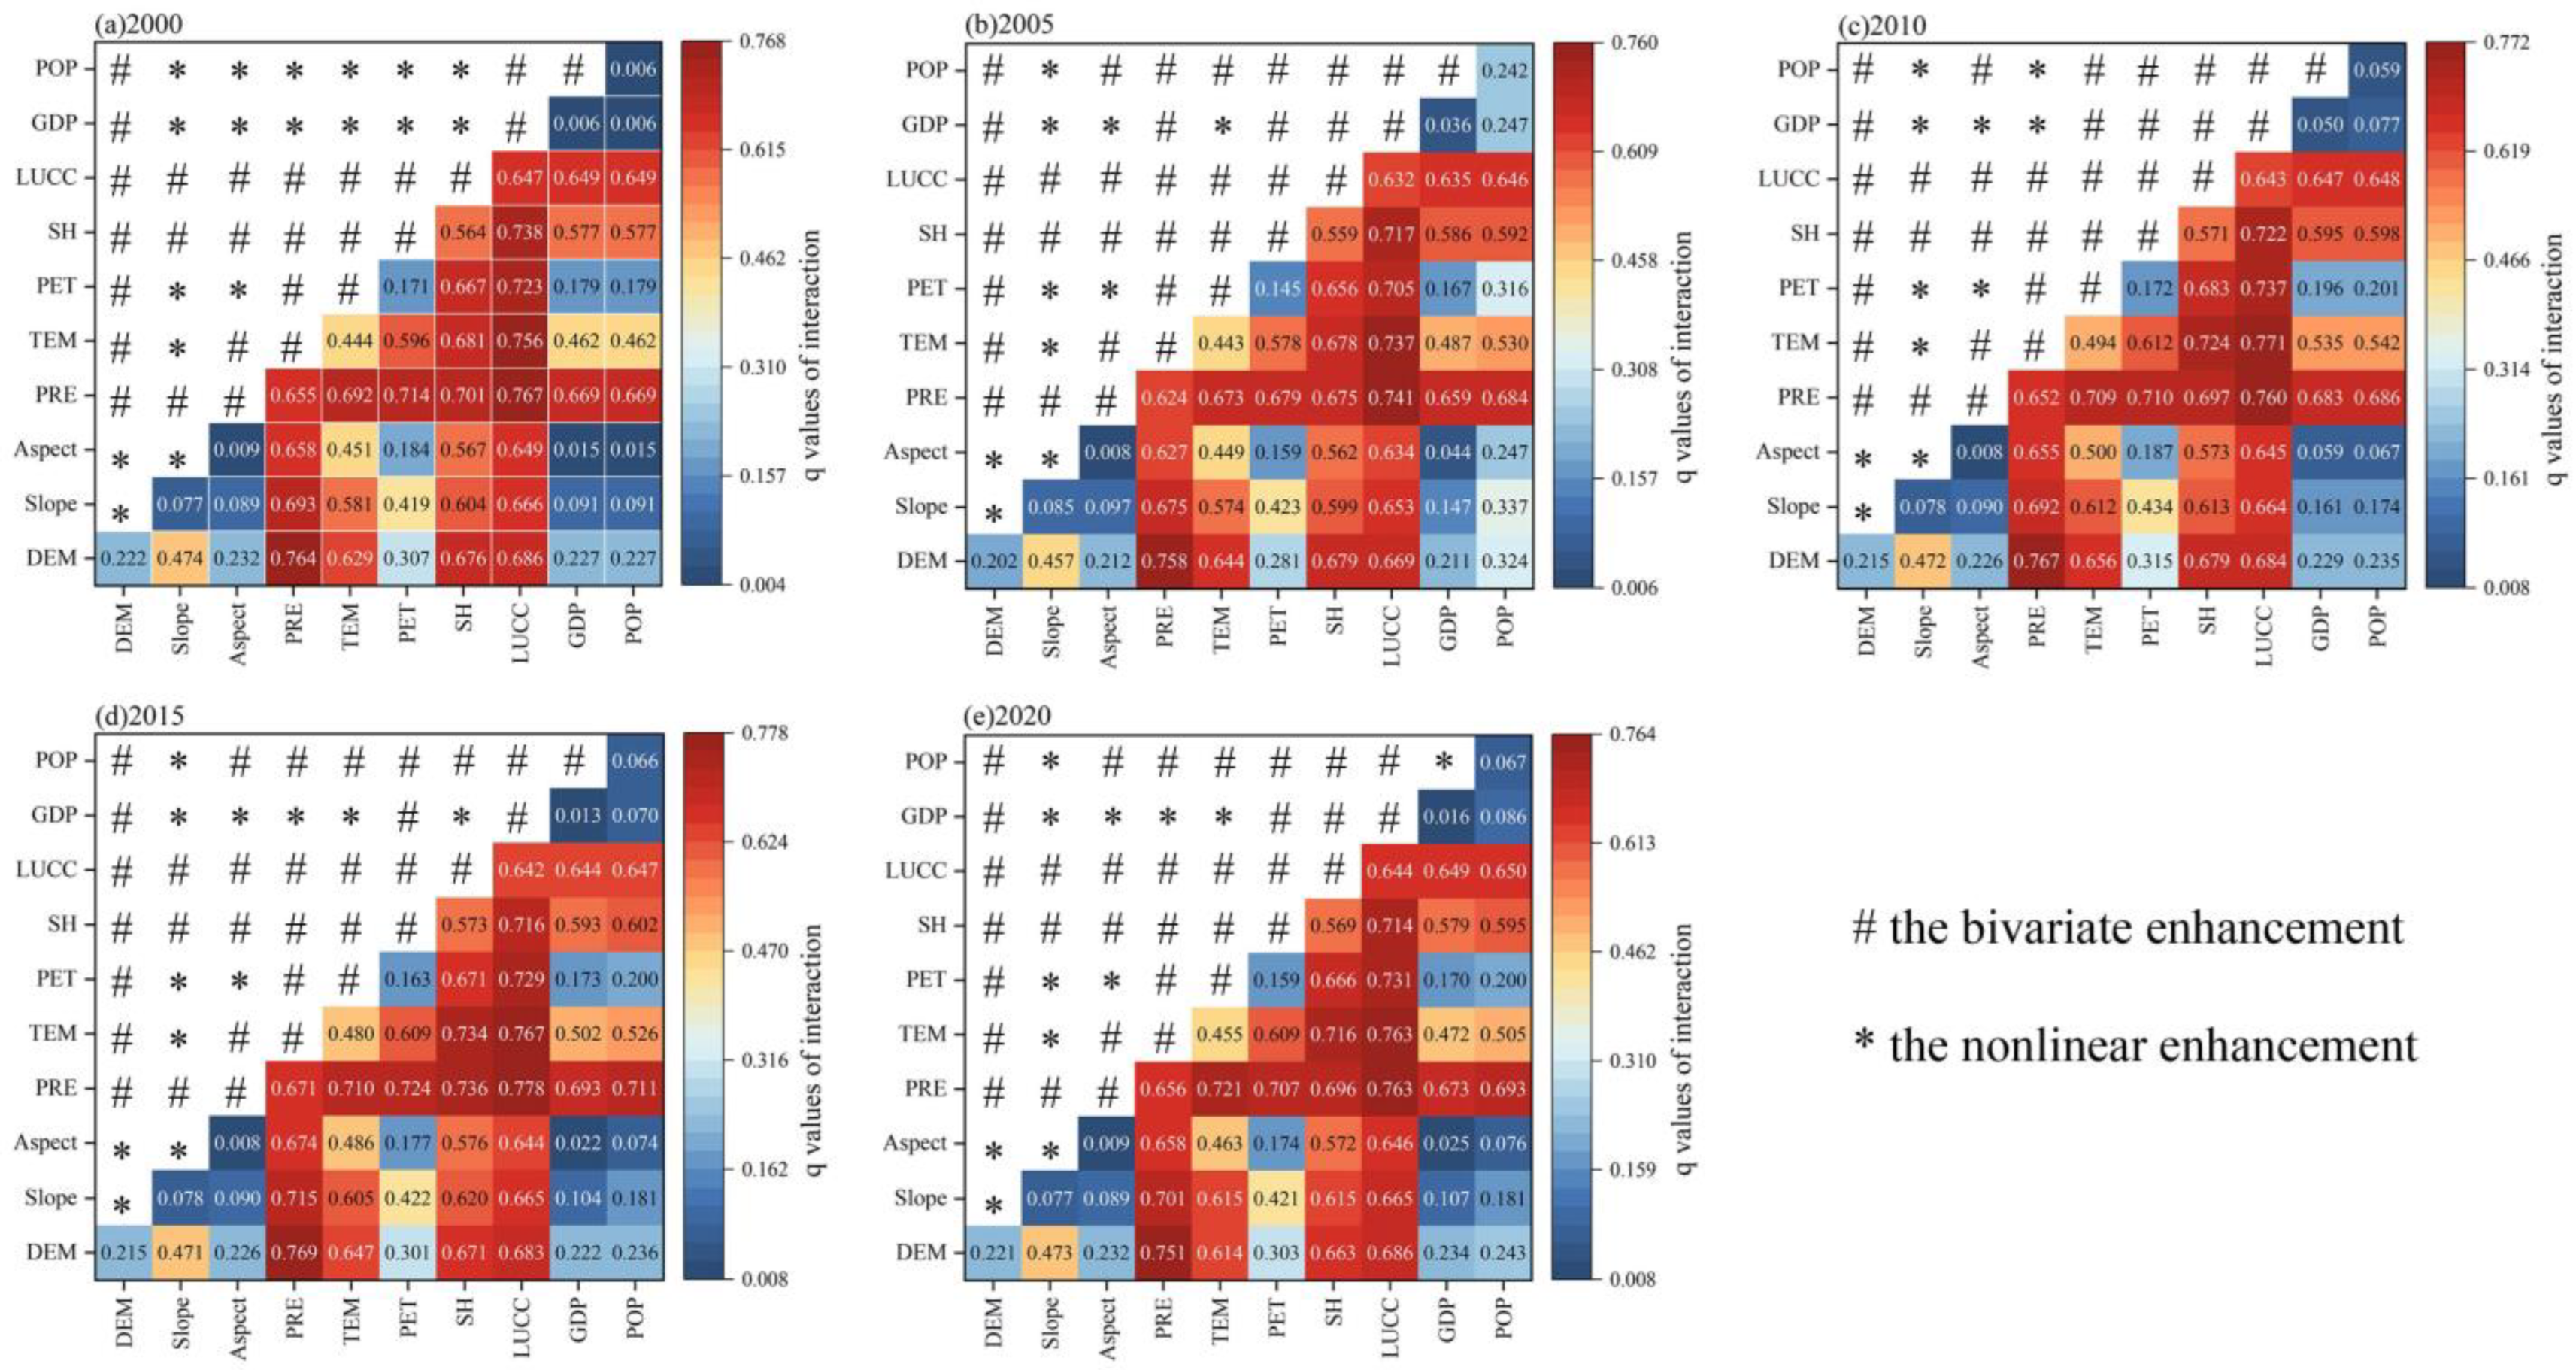
Figure 8.
Risk detector for optimal ranges of influencing factors of NPP.

Table 1.
Driving factors of NPP.
| Factor | Code | Unit | Data Sources |
|---|---|---|---|
| Digital elevation model | DEM | m | United States Geological Survey (The Shuttle Radar Topography Mission, SRTM) (https://www.usgs.gov/, accessed on 27 September 2022) |
| Slope | Slope | ° | |
| Aspect | Aspect | / | |
| Annual mean precipitation | PRE | mm | National Earth System Science Data Center (http://www.geodata.cn, accessed on 9 June 2022) |
| Annual mean temperature | TEM | °C | |
| Potential evapotranspiration | PET | mm | |
| Sunshine hours | SH | hour | |
| Gross domestic product density | GDP | Yuan/km2 | Data Center for Resources and Environmental Sciences, Chinese Academy of Sciences (http://www.resdc.cn/, accessed on 9 June 2022) |
| Population density | POP | Person/km2 | |
| Land use/land cover | LUCC | / |
Disclaimer/Publisher’s Note: The statements, opinions and data contained in all publications are solely those of the individual author(s) and contributor(s) and not of MDPI and/or the editor(s). MDPI and/or the editor(s) disclaim responsibility for any injury to people or property resulting from any ideas, methods, instructions or products referred to in the content. |
© 2023 by the authors. Licensee MDPI, Basel, Switzerland. This article is an open access article distributed under the terms and conditions of the Creative Commons Attribution (CC BY) license (https://creativecommons.org/licenses/by/4.0/).
Share and Cite
MDPI and ACS Style
Shi, S.; Zhu, L.; Luo, Z.; Qiu, H. Quantitative Analysis of the Contributions of Climatic and Anthropogenic Factors to the Variation in Net Primary Productivity, China. Remote Sens. 2023, 15, 789. https://doi.org/10.3390/rs15030789
AMA Style
Shi S, Zhu L, Luo Z, Qiu H. Quantitative Analysis of the Contributions of Climatic and Anthropogenic Factors to the Variation in Net Primary Productivity, China. Remote Sensing. 2023; 15(3):789. https://doi.org/10.3390/rs15030789
Chicago/Turabian StyleShi, Shouhai, Luping Zhu, Zhaohui Luo, and Hua Qiu. 2023. "Quantitative Analysis of the Contributions of Climatic and Anthropogenic Factors to the Variation in Net Primary Productivity, China" Remote Sensing 15, no. 3: 789. https://doi.org/10.3390/rs15030789
Note that from the first issue of 2016, this journal uses article numbers instead of page numbers. See further details here.