Technical Note

Assessing the Efficacy of Phenological Spectral Differences to Detect Invasive Alien Acacia dealbata Using Sentinel-2 Data in Southern Europe

by
Dario Domingo
1,2,
Fernando Pérez-Rodríguez
3,
Esteban Gómez-García
3,4,5 and
Francisco Rodríguez-Puerta
1,*
1
EiFAB-iuFOR, Campus Duques de Soria s/n, Universidad de Valladolid, 42004 Soria, Spain
2
Geoforest-IUCA, Departamento de Geografía, Universidad de Zaragoza, Pedro Cerbuna 12, 50009 Zaragoza, Spain
3
Föra Forest Technologies Sll, Campus Duques de Soria s/n, 42004 Soria, Spain
4
Centro de Investigación Forestal de Lourizán, Xunta de Galicia, Carretera de Marín km 3,5, 36153 Pontevedra, Spain
5
Escuela de Ingeniería Forestal, Universidad de Vigo, A Xunqueira s/n, 36005 Pontevedra, Spain
*
Author to whom correspondence should be addressed.
Remote Sens. 2023, 15(3), 722; https://doi.org/10.3390/rs15030722
Submission received: 5 December 2022 / Revised: 19 January 2023 / Accepted: 24 January 2023 / Published: 26 January 2023

Abstract

:
Invasive alien plants are transforming the landscapes, threatening the most vulnerable elements of local biodiversity across the globe. The monitoring of invasive species is paramount for minimizing the impact on biodiversity. In this study, we aim to discriminate and identify the spatial extent of Acacia dealbata Link from other species using RGB-NIR Sentinel-2 data based on phenological spectral peak differences. Time series were processed using the Earth Engine platform and random forest importance was used to select the most suitable Sentinel-2 derived metrics. Thereafter, a random forest machine learning algorithm was trained to discriminate between A. dealbata and native species. A flowering period was detected in March and metrics based on the spectral difference between blooming and the pre flowering (January) or post flowering (May) months were highly suitable for A. dealbata discrimination. The best-fitted classification model shows an overall accuracy of 94%, including six Sentinel-2 derived metrics. We find that 55% of A. dealbata presences were widely widespread in patches replacing Pinus pinaster Ait. stands. This invasive alien species also creates continuous monospecific stands representing 33% of the presences. This approach demonstrates its value for detecting and mapping A. dealbata based on RGB-NIR bands and phenological peak differences between blooming and pre or post flowering months providing suitable information for an early detection of invasive species to improve sustainable forest management.

1. Introduction

Invasive alien plants (IAPs) currently constitute a major threat to biodiversity at a global scale [1]. IAPs are characterized by their rapid proliferation modifying native ecosystems [2,3] and degrading habitat quality [4]. Most of the species of the genus Acacia (wattles) are native from Australia, but there are also species native from Africa, Asia, and America [5]. In Europe, Acacia spp. is not naturally spread in the North, but there are at least eight Australian wattles which are naturalized and have become potential IAPs in the Southern countries [5]. Among these, one of the most widespread is silver wattle (Acacia dealbata Link) because it is very frugal and capable of re-growth after fires, replacing native vegetation due to its shadow effect and allelopathic compounds [5,6].
In Spain, A. dealbata is included in the Spanish Catalog of IAPs [7], being especially widespread in the northwestern region of Galicia [6,7]. The expansion of the genus Acacia in Spain (mainly Acacia dealbata and Acacia melanoxylon R.Br.) has been considerable during the last four decades with an increase of roughly 32.5 million trees in Galicia from 1987 to 2009, according to the Spanish National Forest Inventory (NFI). This is the equivalent of an increase in Acacia spp. tree biomass from 10,000 Mg to 1,350,000 Mg [8,9] in 22 years. The genus reported a total of 1789 ha of A. dealbata pure stands being present in 1.5% of plots from Galician NFI-4, representing 2.4% of the total forest area in 2009 [10]. Due to the invasive nature of A. dealbata, it is paramount to continuously detect the presence of IAPs to keep it under control and minimize its expansion, effect, and impact on biodiversity [11], soil [12,13] and fire regimes [14], promoting early engagement and monitoring strategies [15].
One of the most important tools to manage and detect IAPs early is mapping their spatial distribution. Traditionally, IAP monitoring has been carried out by means of field sampling using global positioning systems (GPSs) or combined with photointerpretation and digitization of aerial photographs, which are costly and labor-intensive [16]. In Spain, the cartographic basis of NFI is the Spanish Forest Map (SFM) [17], which provides a 1:25,000 mapping of forest species, including IAPs, approximately every 10 years. The SFM of 2004–2007 is the most updated version in Galicia. Therefore, the current time lap between traditional surveys, which currently exceeds 15 years for our particular study area, is not practical for IAP monitoring purposes [18], which has moved in recent years to their use in conjunction with remote sensing information for IAP mapping [19].
Beyond the traditional field inventories or the use of aerial photographs [20], the remote sensing and machine learning approaches from digital imagery can support automated species identification [21,22,23] allowing for IAP monitoring at higher spatial and temporal resolutions for large areas [24,25]. The emergence of platforms such as Google Earth Engine (GEE: http://earthengine.google.com; [26]) together with the availability of freely accessible data from multispectral sensors, as Sentinel-2 from the Copernicus Earth observation program led by the European Commission (EC) [27], have profoundly improved the preprocessing and analyzing time for a near-continuous monitoring of species distribution. IAP monitoring has been an objective widely addressed with remote sensing [28]. Among the multiple multispectral sources of information are Landsat [28,29,30], Pléiades [31,32], Worldview [33,34,35,36], Ikonos [37,38], and Sentinel [39,40,41,42]. Particularly, multispectral and hyperspectral data have been used to discriminate Acacia species in Hawaiian rainforests [19], in Mediterranean Dune Ecosystems [43,44], and in South Africa [40]. The combination of multispectral, hyperspectral, and synthetic aperture radar was tested by [45] to identify Acacia mearnsii and Pinus patula IAPs in montane evergreen grasslands. Furthermore, high resolution satellites, as for example RapidEye, have been used to identify Acacia and other IAPs in montane grasslands [46] and arid regions [47]. The increasing use of unmanned aerial vehicles (UAVs) has been also used to map, with higher spatial resolution, species of the genus Acacia on savannas ecosystems [48] or in Portugal [15]. Though the use of remote sensing-derived information for the flowering period is a common approach to differentiate the species pattern [49,50,51,52,53], and has been also used to map Acacia in South Africa [40], little is known about the use of phenological periods within a year that experiences previous or later blooming, which may help improve IAP detection. In this sense, the spectral difference between phenology periods within a year, resembling for example the well-known spectral differences linked to pre and post hazard events (e.g., forest harvest or fires) requires further research in a Mediterranean context for IAP continuous monitoring.
We assume that A. dealbata in Galicia has phenological differences with respect to other species from mid-January to mid-March due to the characteristic yellow flowers (Figure 1) [5]. We hypothesize that the spectral differences between peak flowering periods, characterized by an increased concentration in canopy pigments, nutrients, and water content, to pre- or post-flowering periods, will be useful to discriminate A. dealbata from other species. The overall objective of the present study was to discriminate A. dealbata stands from other species using Sentinel-2 time series. Furthermore, the following secondary aims are addressed: (i) determine which months or periods of the year (i.e., pre or post flowering periods), together with the peak flowering period are most critical for classifying A. dealbata; (ii) test the effectiveness of RGB-NIR spectral bands and normalized difference-derived indices to classify A. dealbata presence; (iii) map the presence of A. dealbata within the study area.

2. Materials and Methods
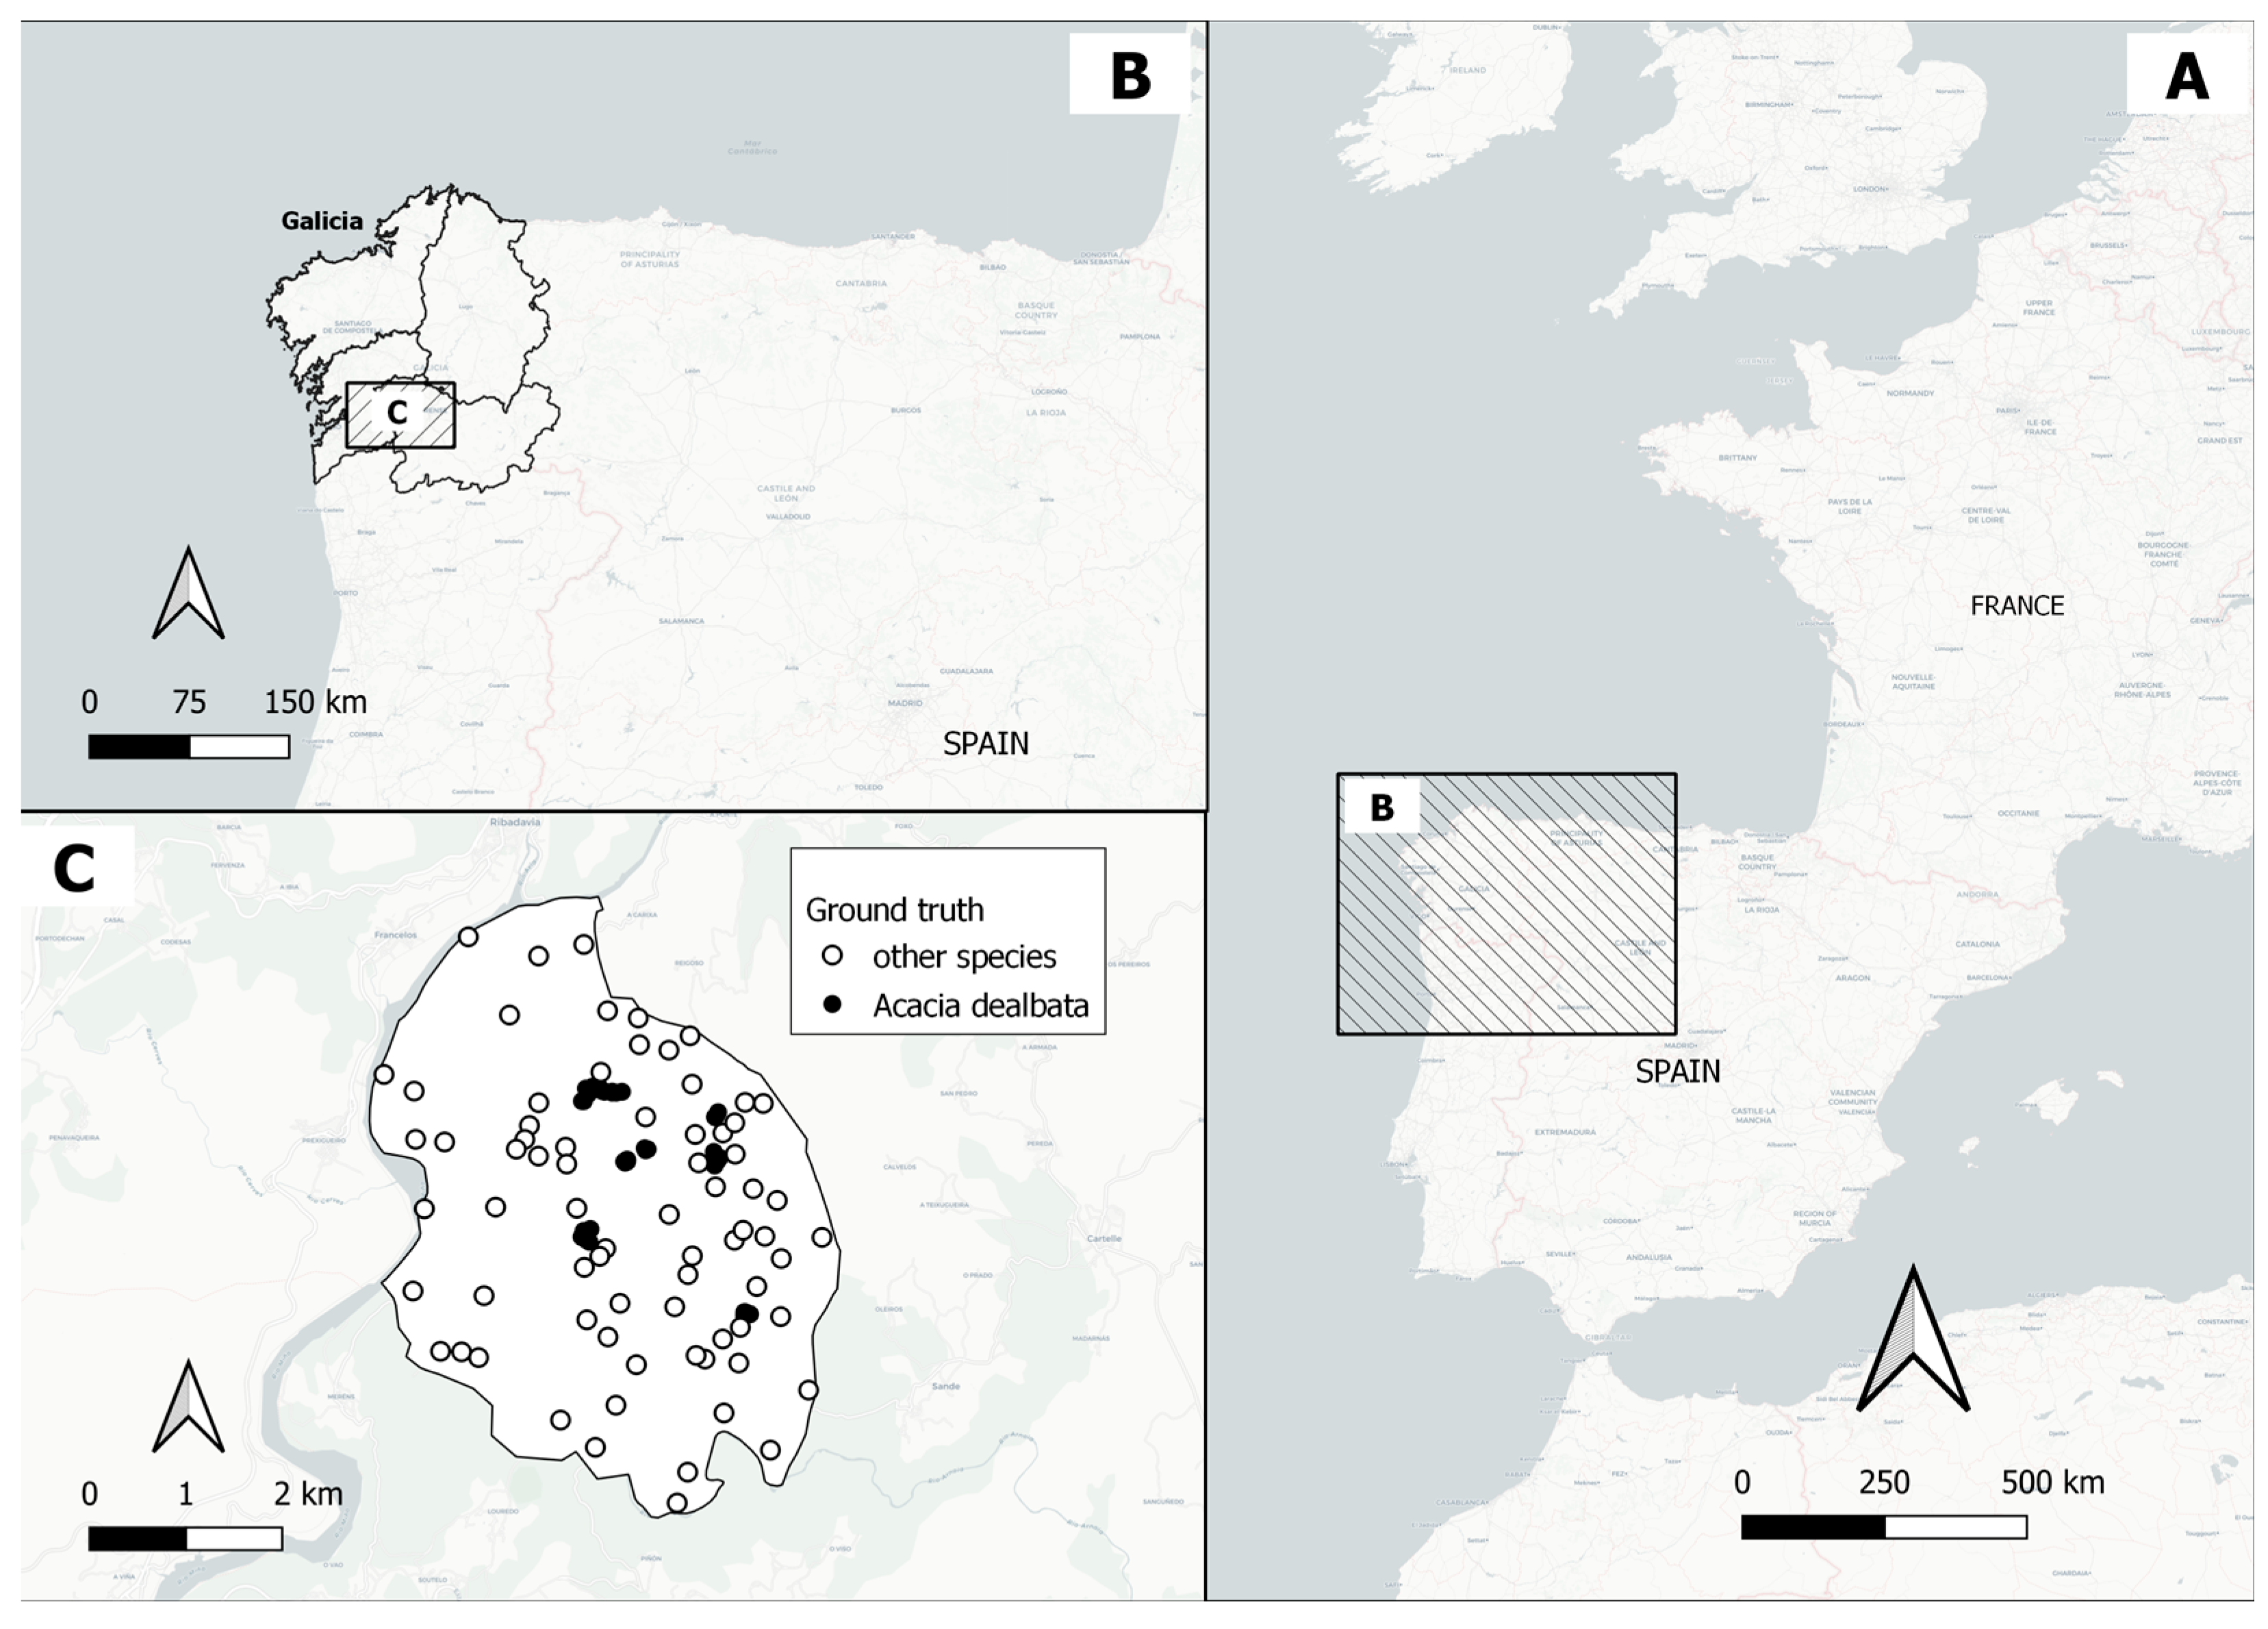
2.1. Study Area

The area of interest (AOI) of our study corresponds to the municipality of Arnoia (Figure 2). Arnoia has a surface of 20.69 km2 located within the valley of the river Miño, in the West of the province of Ourense (Spain). Forests are dominated by Pinus pinaster Ait. (70.6%), Quercus robur L. (11.2%), and Quercus suber L. (4.4%) stands according to Spanish Forest Map (SFM) 2018. A. dealbata has been widely expanded during the last years [6,17] representing 10.4% of the forests stands. The climate is influenced by the river Miño, classified as Mediterranean oceanic (Csb) according to Köppen–Geiger [54]. In this area, the average annual temperature is 14.5 °C and the total annual precipitation reaches 817 mm [6].

2.2. Field Data Collection

The ground-truth data were acquired in 120 field plots in 2018 (Figure 2). The sampling was designed based on the Spanish Forest Map (SFM). A. dealbata stands as well as local knowledge from stands not included within the SFM, but with the presence of the species, were considered to locate 48 field plots that served as presences. We collected 72 absences over the different forest types or non-forested areas present in the study area. To perform this procedure, we considered stand property as well as road and path accessibility which were verified to avoid inaccessible areas. Furthermore, field plots were located at a distance greater than 30 m to stand borders considering the spatial resolution of Sentinel-2 images. A Trimble GEO 7X Global Positioning System was used to locate the centroid of the plots where the presence or absence of A. dealbata was identified within a 15 m radius.

2.3. Sentinel-2 Data Image Collection and Processing

Sentinel-2 mission belongs to the Copernicus Earth observation program led by the European Commission (EC). The mission includes a constellation of 2 satellites, Sentinel-2A, launched in June 2015, and Sentinel-2B, launched in June 2017, which together have a frequency of 5 days. Sentinel image processing was performed using the GEE platform [26]. Concretely, we used the GEE application programming interface (API) through JavaScript and GEE-based operators. The atmospherically calibrated and corrected surface reflectance at the bottom of atmosphere “Level-2A” product was selected. Thereafter, a cloud and cirrus mask, based on the Sentinel 2 bitmask quality band, was applied for images with less than 20% cloudiness. The bitmask quality band has a spatial resolution of 60 m and enables cloud and cirrus selection in bits 10 and 11, respectively. A monthly median composite image was created containing cloud-free images from 2018 to 2021, resulting in a total of 208 scenes. The blue (B), green (G), red (R), and near infrared (NIR) 10 m spatial resolution bands were selected. Then, six indices were computed based on the relation among normalized differences (NDs) [55] to all pair combinations of R-G-B-NIR bands, including the Normalized Difference Vegetation Index (NDVI) (Equations (1)–(6)). These indices have been widely used to measure moisture content [56], indicate vegetation health [57,58], and distinguish natural features from human-made objects [59]. The Sentinel-2 processing source code is available at https://github.com/ddomingoLiDAR/Acacia_detection (accessed on 24 January 2023) or https://github.com/CambiumRG (accessed on 24 January 2023).
ND   between   Red   and   Green   RG = Red Green Red + Green
ND   between   Green   and   Blue   GB = Green Blue Green + Blue
ND   between   Blue   and   Red   BR = Blue   Red Blue   + Red
NDVI = NIR   Red NIR   + Red
ND   between   NIR   and   Green   NIRG = NIR   Green NIR   + Green
ND   between   NIR   and   Blue   NIRB = NIR   Blue NIR   + Blue
where Blue refers to band 2, Green is band 3, Red refers to band 4, and NIR is band 8 from Sentinel-2 A/B MSI.

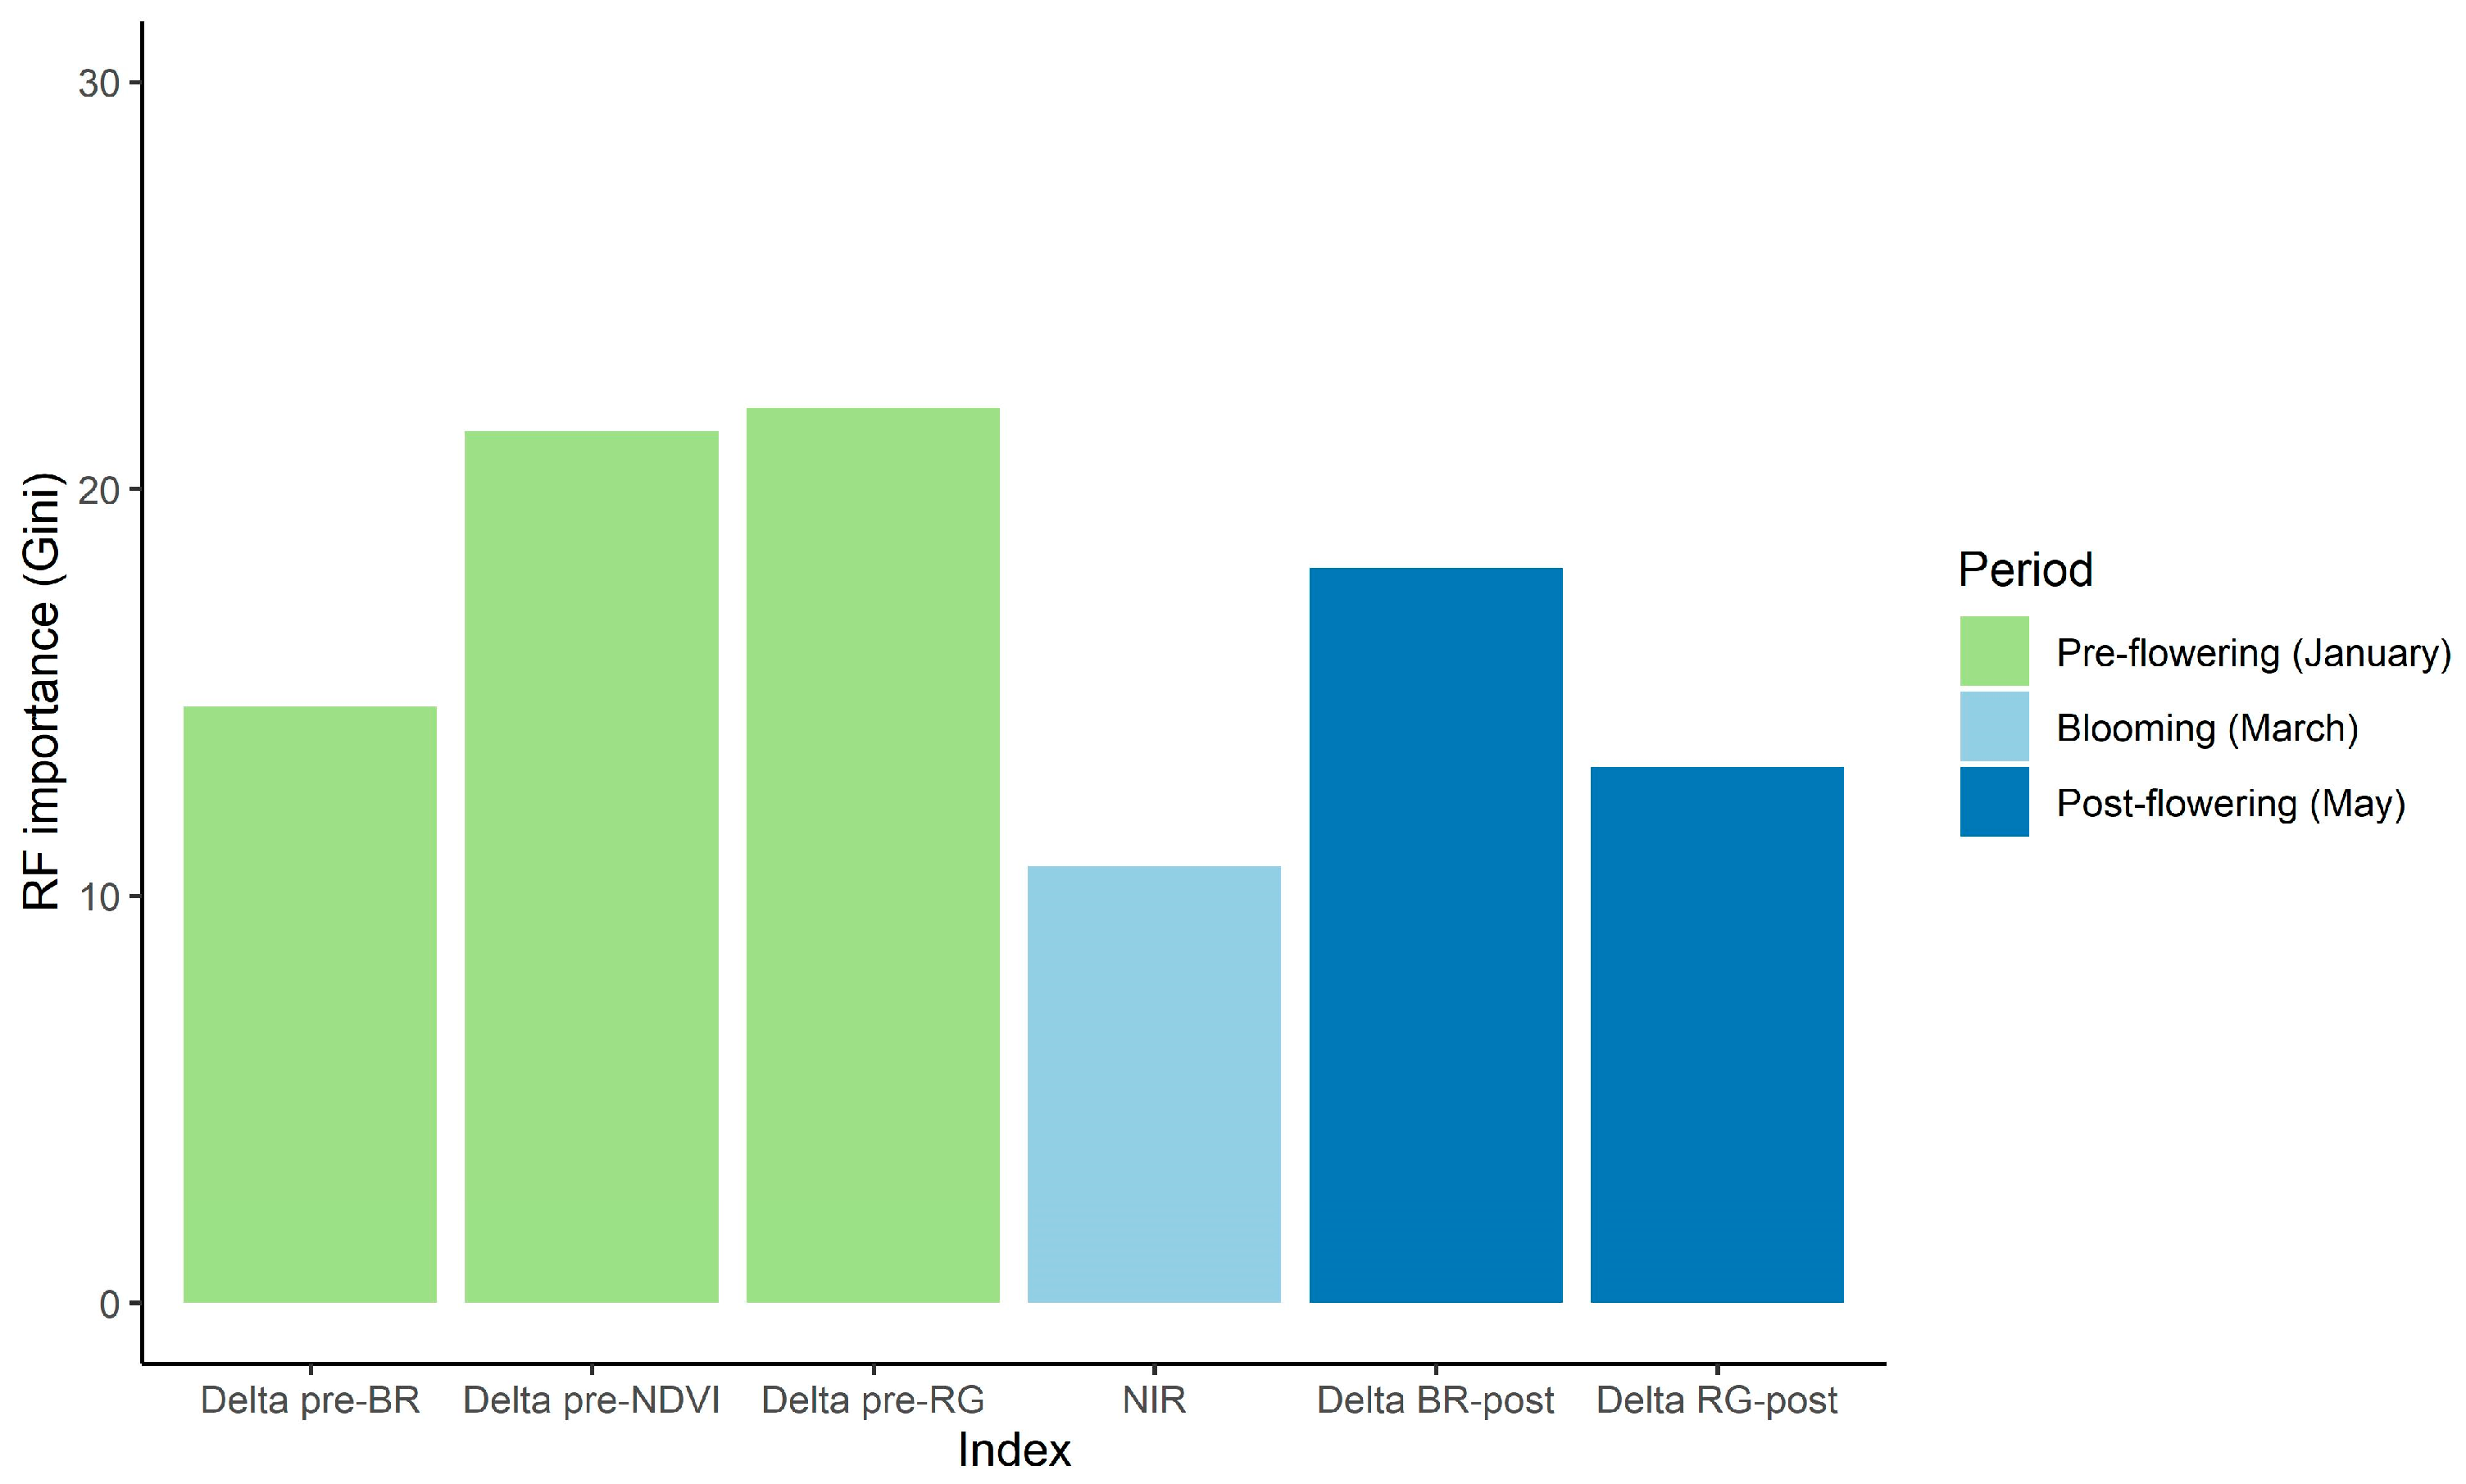
2.4. Identification of Optimal Time for Distinguishing A. dealbata

The peak flowering period is considered a highly sensitive period to determine the presence of Acacia spp. based on spectral information [40], although the identification of further spectral phenological peaks may help in distinguishing A. dealbata from other species. The identification of optimal time for distinguishing A. dealbata in northeast Spain was based on the identification of spectral peaks between months. Firstly, we analyzed the monthly spectral values based on graphics and determined the peak spectral values (maximum and minimum values) from bands R, G, B, and NIR and the six derived RGB-NIR indices (see Section 2.3) to determine the peak flowering period for the study area. Furthermore, we analyzed the spectral difference from blooming to previous or posterior periods to determine the pre flowering and post flowering months (see Figure 3 as an example). Consequently, we computed the spectral differences between the pre flowering period and blooming, and blooming with respect to the post flowering period. The computed monthly difference indices were named as the following examples for the NDVI index: Δ pre-NDVI and Δ NDVI-post (Equations (7) and (8)). Accordingly, we used the same equation formulation for the RGB and NIR bands and the remaining five indices (RG, GB, BR, NIRG, and NIRB). Overall, we computed nine metrics for each of the three periods (i.e., pre flowering, blooming, post flowering) resulting in a total of 27 Sentinel-2 derived metrics which were subsequently included as suitable metrics for the classification analysis (see Section 2.5).
Δ   preNDVI = NDVI   pre   flowering NDVI   blooming  
Δ   NDVIpost = NDVI   blooming NDVI   post   flowering  

2.5. Classification of A. dealbata Presence, Model Validation, and Mapping

The classification and mapping of A. dealbata presence was carried out using a three-step methodological approach: (i) selection of Sentinel2 metrics using random forest importance; (ii) training and validation of random forest classifier for year 2018; (iii) map IAP presence for 2018 and up to 2022 by temporally transferring the random forest model. Random forest (RF) is an ensemble learning method based on decision trees.
The selection of Sentinel2 metrics for A. dealbata presence classification was performed based on random forest importance for the year 2018, matching with field data acquisition time. Random forest importance was computed based on the Gini index, which makes it possible to measure each feature contribution. The Sentinel2 metrics with higher importance, which constitute the best subsets, were subsequently used for model computation. The classification of A. dealbata presence was carried out using the RF algorithm. In order to test the performance of RF, we performed a random sampling of 75% for testing (i.e., 90 samples) and 25% for validation purposes (i.e., 30 samples) including the presence of A. dealbata (1) vs. absence (0). The performance of RF was parametrized by applying between 1 and 3000 trees to growth (ntrees) and between 1 and 3 metrics in each node (mtry) in accordance with Rodrigues et al. [60] and Domingo et al. [61]. The model was computed using the “smileRandomForest” function within the GEE platform. The training of the model was carried out interactively adding one Sentinel-2 metric at a time, from the ones with higher random forest importance values, and modifying the tuning parameters (mtry and ntrees) comparing the overall accuracy between them to generate parsimonious models. The models were validated using the testing sample that includes 25% of the total sample for both the tuning phase and for the selection of the final model. The validation was executed 10 times to increase the robustness of the results [62] and average performance values were computed. The classification overall accuracy, confusion matrices, user’s and producer’s accuracy were evaluated to compare and, subsequently, determine the best classification model [63]. Subsequently, the most accurate model was selected for wall-to-wall A. dealbata mapping in 2018 and temporally transferred using the same Sentinel-2 metrics up to 2022.

3. Results

3.1. Determining Critical Periods to Classify A. dealbata

The graphical and statistical analysis based on the maximum and minimum spectral values during a year shows that the spectral peak corresponding to the blooming period occurs between the first and third week of March (Figure 3). The selection of the pre and post flowering period was determined using the ND indices that showed in all the cases a peak. A relative peak was seen in the case of NIRB, NIRG, or NDVI, while GB and RG showed the maximum ND along a year and BR the minimum spectral ND. Particularly the ND between BR and the ND between RG were the ones showing the highest relative changes. Accordingly, the pre-flowering period was determined two months before blooming, in January, while the post flowering period in May was determined two months after blooming. The pre and post flowering periods were determined considering that BR and RG values returned to the baseline trend. Consequently, we computed the spectral differences between January and March (Δ pre-Index), and between March and May (Δ Index-post) in accordance with Equations (7) and (8) (see Section 2.4), which were subsequently included as suitable metrics for the classification analysis together with the blooming ones (i.e., 27 metrics).
Figure 3. Average monthly ND values for the analyzed Sentinel-2 time-series (2018–2022). Abbreviations: BR refers to the normalized difference (ND) between blue and red; GB is the ND between green and blue; NDVI is the normalized difference vegetation index; NIRB refers to the ND between NIR and Blue; NIRG is the ND between NIR and green; and RG refers to the ND between red and green.
Remotesensing 15 00722 g003

3.2. Classification of A. dealbata Presence

The selection of Sentinel-2 metrics based on random forest importance determined that pre flowering and post flowering-derived metrics were the most explanatory metrics for A. dealbata presence. Based on the explanatory power of the metrics, the best classification model for the year 2018 included six Sentinel-2 metrics: the NIR band for March during blooming, three metrics based on the difference between blooming and pre flowering period (Δ pre-NDVI, Δ pre-BR, and Δ pre-RG), and two metrics resulting from the spectral differences between blooming and post flowering period (Δ BR-post and Δ RG-post). In particular, the highest importance values were reached by Δ pre-RG and Δ pre-NDVI (Figure 4), while the lowest importance was the NIR band for the blooming period with a value of 10.73. The yearly classification models show an average accuracy of 0.94 and a kappa value of 0.86 after validation. The highest RF model accuracy was reached with 500 trees and two metrics in each node parametrization. We found some confusion mainly between A. dealbata and cropland areas or some shrubland areas, which may occur eventually linked to Ulex europaeus L. spring blooming.

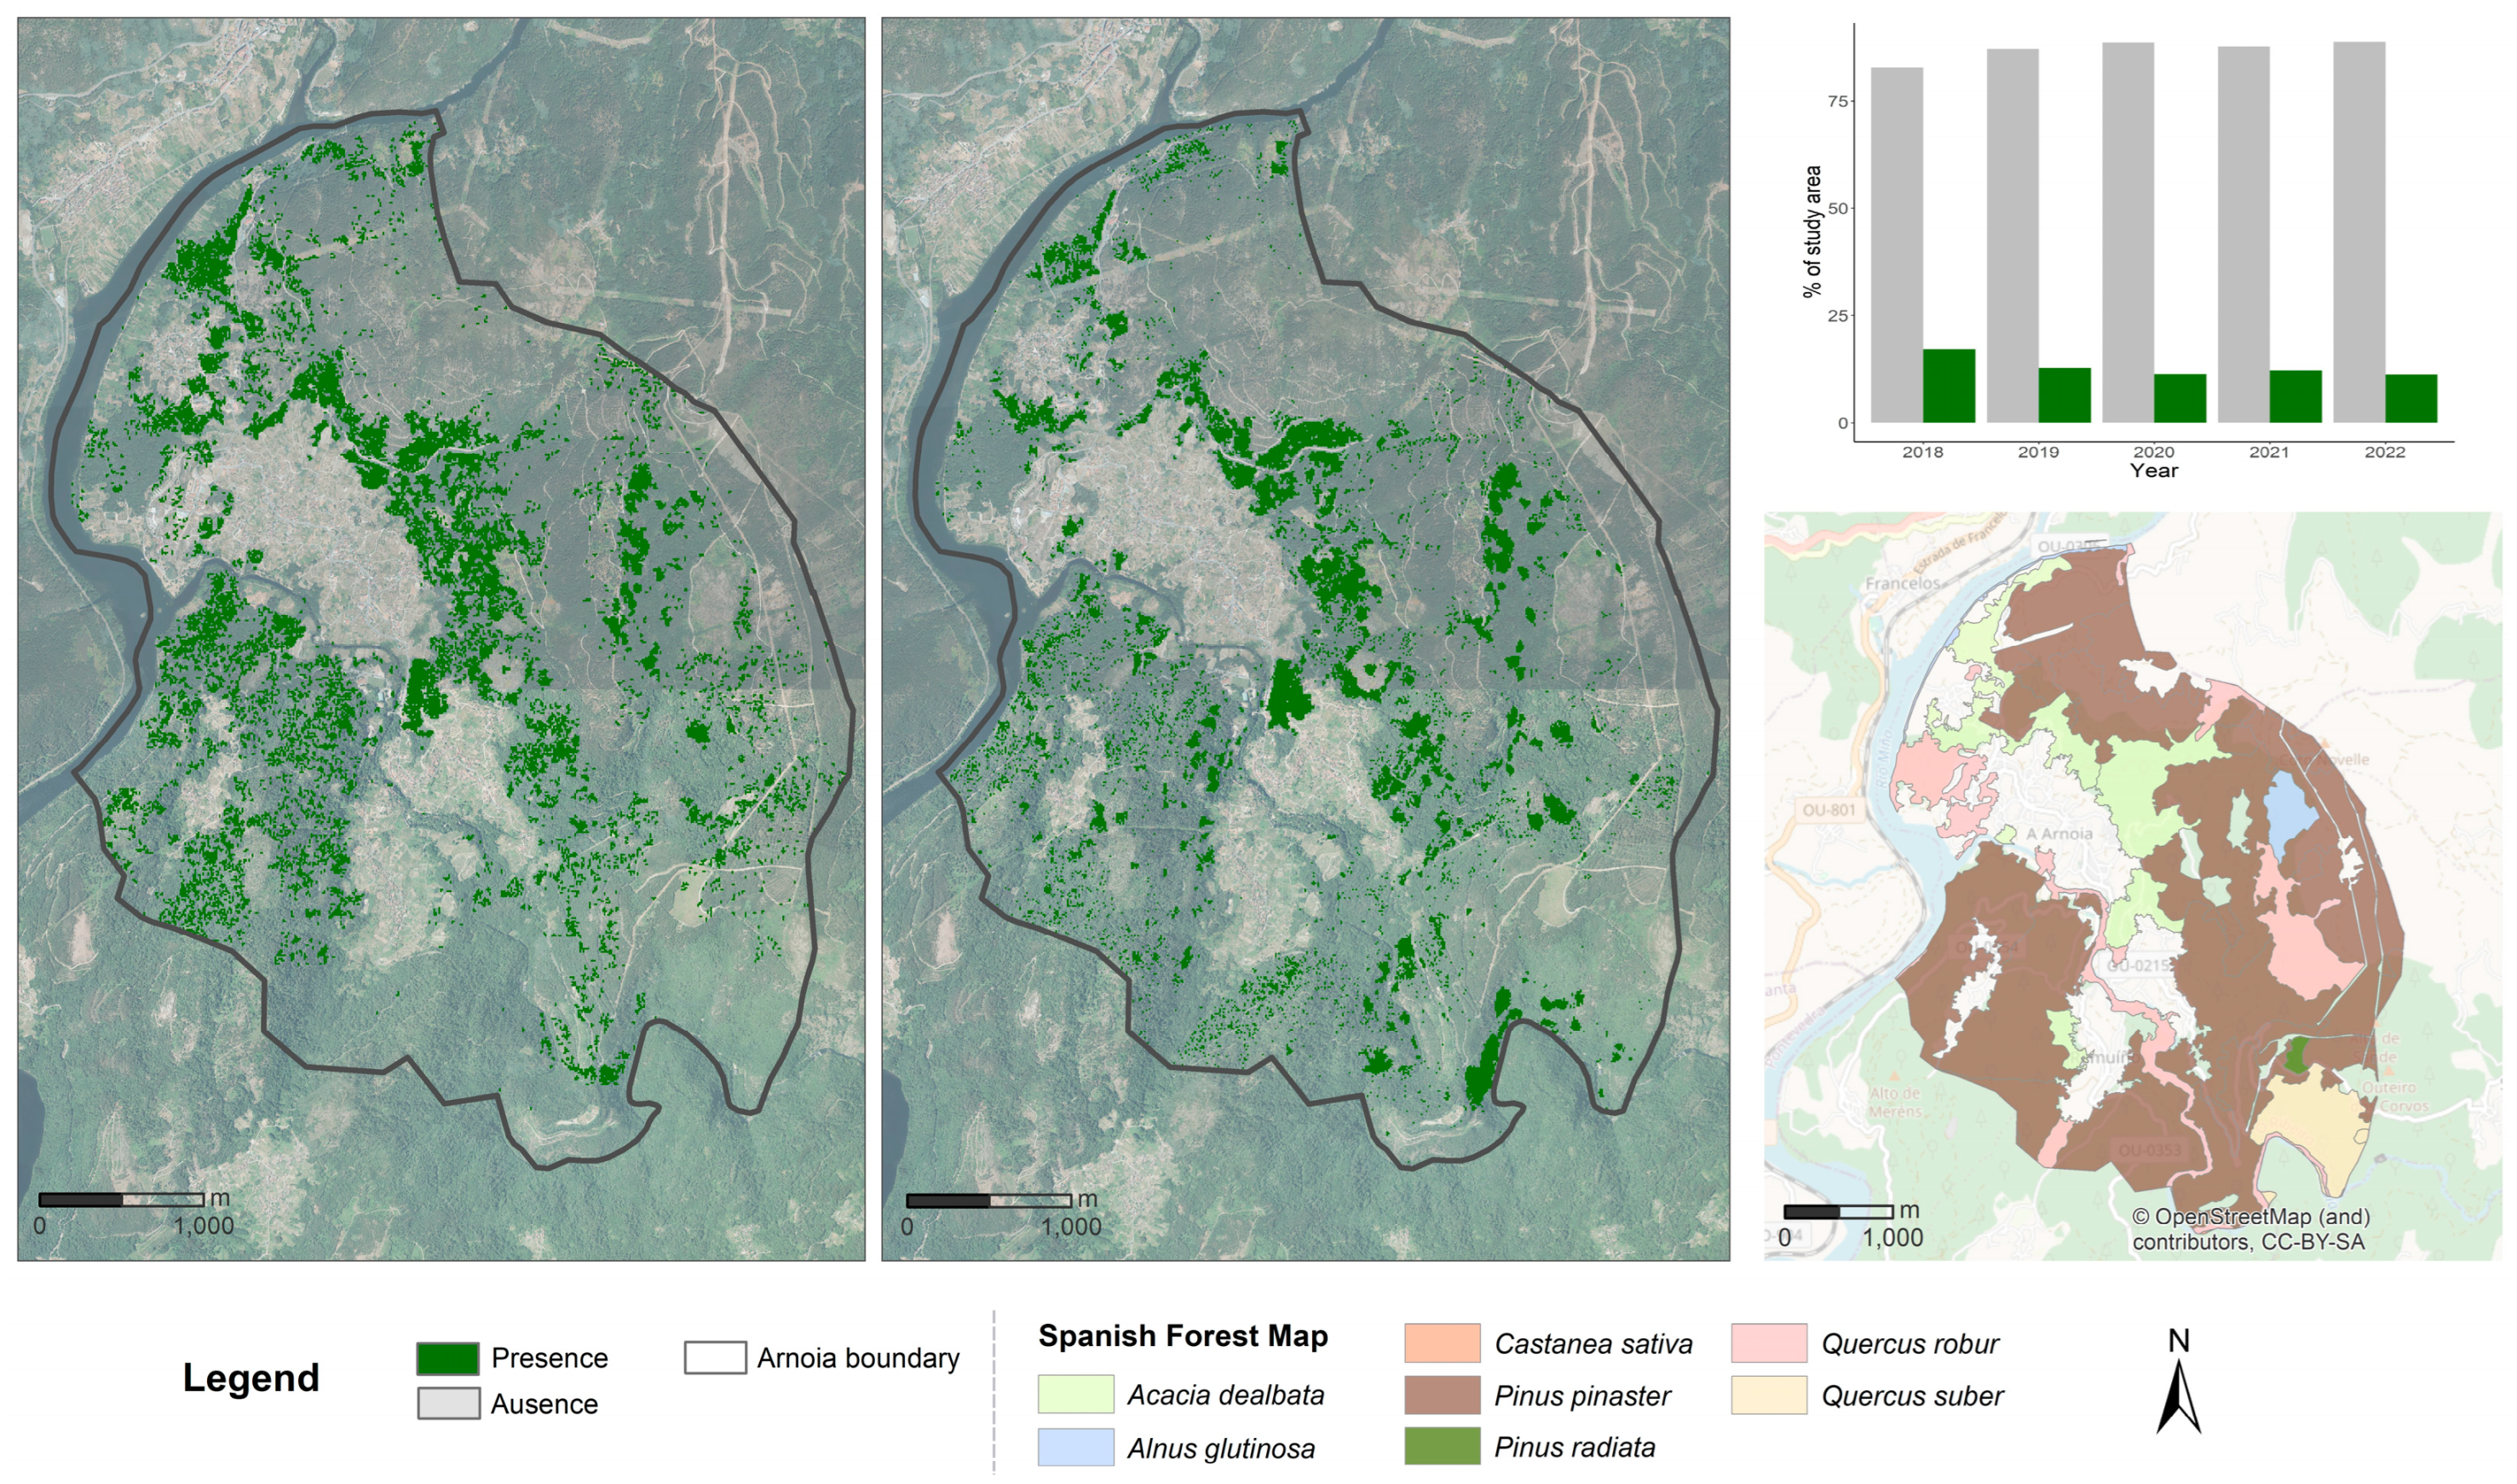
3.3. Mapping of A. dealbata Presence

Figure 5 shows the presence of A. dealbata within the study area. In 2018, the presence of A. dealbata represented 17.5% of the total forested area (1593 ha), while we observed a reduction in presence of this specie over the five analyzed years reaching 11.5% of the forested area in 2022 based on the transferred model results. The presence of A. dealbata is spread in the Arnoia area, although the majority of the presences (roughly 55%) are located within areas categorized by the Spanish Forest Map as Pinus pinaster located in the east, west, and south. The northeast part of the study area as well as the central part represents roughly 33% of the presences, which are located within areas that previously were defined as Acacia forest stands by the Spanish Forest Map.

4. Discussion

The detection and mapping of IAPs provide essential information to support monitoring and preventive actions by forest managers. Continuous monitoring is especially relevant due to the frugality and fire regrowth ability of Acacia to replace native vegetation [5,6], especially considering that the Northwest of mainland Spain is a fire-prone region [64]. IAPs could generate a partial or total modification of forest composition or even forest structure, threatening local biodiversity [1]. This study shows the usefulness of phenological peak spectral differences based on RGB-NIR Sentinel-2 bands for a continuous detection and mapping of A. dealbata in northwest Spain.
The analysis of Sentinel-2-time series revealed that the optimal time to distinguish A. dealbata from other co-occurring species was based on the spectral differences between the blooming period and two previous or posterior months. The blooming period was detected between the first and third week of March, in accordance with Lorenzo et al. [1] who established that the flowering period in Galicia, northwest Spain, was between January and March with a flower longevity from 10 to 22 days. Our results confirm that the peak flowering period was optimal for A. dealbata discrimination based on vegetation indices in agreement with Masemola et al. [40]. Furthermore, we found that the senescence of deciduous vegetation during winter (January) as well as the beginning of the growing season (May) were relevant for A. dealbata distinction as established by Masemola et al. [40] and Cho et al. [65], respectively. However, our results reveal that higher discrimination was reached by computing the spectral difference between phenological periods based on RGB-NIR indices rather than the indices themselves for a specific phenological period, resembling the well-known ΔNBR index performance for fire detection [66].
Several indices for different transition phenological peaks as well as sensors or classification methods have been analyzed to discriminate Acacia spp. from co-occurring native species. Our binary classification reached similar accuracy to previous works that used Sentinel-2 data [40,45,46] and that integrated SWIR bands. Similar results were found by Große- Stoltenberg et al. [43] by using hyperspectral indices with an 86% accuracy. The use of RGB and NIR bands seems to outperform the exclusive use of RGB bands [48], though better accuracies were reached by Arasumani et al. [46] when using AVIRIS-NG with a 98% accuracy or Gonçalves et al. [15] when using CNN methods. All in all, the combination of RGB-NIR from Sentinel-2 and indices based on phenological spectral differences constitute a suitable approach to detect A. dealbata in northwest Spain, which has profoundly spread in recent decades [10].
Our results show that A. dealbata stands are widely distributed within the study area of Arnoia. The generalized spatial distribution facilitates the spread of the Acacia species which have non-long distance dispersal adaptation [11,67,68]. Moreover, the fragmentation and mixing with other species, especially Pinus pinaster, complicates the control of invasion for forest managers. The coverage of A. dealbata within the study area represented 17.5% in 2018, in accordance with Vazquez [6] which determined a coverage of 5.7–33.8% in a study carried out in 2003 in three 1 × 1 km study areas in the same valley using aerial photointerpretation and field work validation in 2007. Even the Arnoia area is a widely widespread area of Acacia dealbata, as Hernandez et al. [67] pointed out that the specie was present in 1.5% of the plots from Galician NFI-4 [10], representing 2.4% of the total forest area. In Spain, the Spanish Forest Map (SFM) and the National Forest Inventory (NFI) are very valuable and useful tools for forest managers, but due to their cost, they are not updated as often as we foresters would like. Both data sources provide large-scale information for the planning of forest resources. The SFM is based on field data from the National Forest Inventory updated with a 10-year periodicity at a scale of 1:25,000. Thus, the periodicity and spatial scale used in SFM and NFI are too low to continuously monitor the spatial distribution and expansion of the different invasive species, and in particular A. dealbata in Galicia. This is especially important because previous studies suggested that these species have not yet reached their potential expansion area in the Iberian Peninsula [11,67,69]. The use of freely available remote sensing data sources as Sentinel-2 images which can provide relevant information with an enough frequency and resolution are suitable to create yearly distribution maps. These can be complemented with SFM and NFI ground-truth, which could be useful to validate remote sensing products, especially in the years close to publication.
Despite the fact that the available data for the analyzed period were appropriate to detect A. dealbata in our study area, the flowering period coincides with the time of the year when clouds and fog are most likely to be found in areas of northwest mainland Spain, which can eventually limit the accuracy of the detection. However, the use of all-time series images and the short revisiting time of Sentinel-2 (A and B) minimizes their effects. The ground-truth points selected for the analysis were only of pure A. dealbata stands, resulting in the detection of pure stands for a specific date. Therefore, the presence of acacias in a lower stratum or in mixed stands has not been considered in this work. The present study shows the utility of Sentinel-2-derived phenological difference information to classify and map Acacia dealbata. Future research should focus on the identification of other Acacia spp. or further IAPs as well as the validation of temporally transferred models. In this sense, this approach is applicable for larger regions due to open data availability to create continuous monitoring tools that can serve as effective control tools for forest managers. The approach is transferable to the use of UAV with an RGB-NIR sensor, which provides higher spatial resolution and can be optimal for ad hoc monitoring. Furthermore, the use of structural information derived from either UAV using structure from motion, LiDAR, or RADAR may provide useful information in areas with a mix of forests and agricultural land uses which may be subject to misclassification errors.

5. Conclusions

This study assesses the usefulness of phenological spectral differences based on RGB-NIR Sentinel-2 data to detect and map the invasive alien plant (IAP) A. dealbata from other species in northwest Spain. The random forest method produced the most accurate classification of A. dealbata presence, providing an overall accuracy of 0.94 after validation. A total of five out of six Sentinel-2-derived metrics included in the model were related to spectral differences between blooming (March) and pre flowering (January) or post flowering months (May). The metrics with the highest importance for A. dealbata discrimination were Δ pre-RG and Δ pre-NDVI, together with Δ BR-post. The presence of A. dealbata is widely widespread within the study area and its proliferation modifies, in particular, Pinus pinaster stands, generating patches that represent 55% of the presences of this IAP. Furthermore, this IAP also creates continuous monospecific stands representing 33% of the presences. This analysis demonstrated the value of the proposed approach to regularly detect and map A. dealbata by using RGB-NIR spectral information and phenological peak differences, providing suitable data for IAP forest management.

Author Contributions

Conceptualization, F.P.-R. and E.G.-G.; methodology, D.D., F.P.-R., F.R.-P. and E.G.-G.; formal analysis and validation, D.D., F.P.-R., F.R.-P. and E.G.-G.; field data acquisition, F.P.-R. and E.G.-G.; writing—original draft preparation, D.D., F.R.-P., F.P.-R. and E.G.-G.; writing—review and editing, all authors. All authors have read and agreed to the published version of the manuscript.

Funding

This work is supported by European Union-Next Generation EU through a Margarita Salas grant to Dario Domingo (MS-240621).

Institutional Review Board Statement

Not applicable.

Informed Consent Statement

Not applicable.

Data Availability Statement

The classification outputs are available at: Domingo, Dario; Pérez-Rodríguez, Fernando; Gómez-García, Esteban; Rodríguez-Puerta, Francisco (2023), “Acacia dealbata presence in Arnoia municipality, Ourense (Spain)”, Mendeley Data, V1, doi: 10.17632/wgmbwy6jns.1.

Conflicts of Interest

The authors declare no conflict of interest.

References

  1. Simberloff, D.; Martin, J.-L.; Genovesi, P.; Maris, V.; Wardle, D.A.; Aronson, J.; Courchamp, F.; Galil, B.; García-Berthou, E.; Pascal, M. Impacts of Biological Invasions: What’s What and the Way Forward. Trends Ecol. Evol. 2013, 28, 58–66. [Google Scholar] [CrossRef] [PubMed] [Green Version]
  2. Hulme, P.E. Trade, Transport and Trouble: Managing Invasive Species Pathways in an Era of Globalization. J. Appl. Ecol. 2009, 46, 10–18. [Google Scholar] [CrossRef]
  3. Pyšek, P.; Hulme, P.E.; Simberloff, D.; Bacher, S.; Blackburn, T.M.; Carlton, J.T.; Dawson, W.; Essl, F.; Foxcroft, L.C.; Genovesi, P.; et al. Scientists’ Warning on Invasive Alien Species. Biol. Rev. 2020, 95, 1511–1534. [Google Scholar] [CrossRef]
  4. Kumar Rai, P.; Singh, J.S. Invasive Alien Plant Species: Their Impact on Environment, Ecosystem Services and Human Health. Ecol. Indic. 2020, 111, 106020. [Google Scholar] [CrossRef]
  5. Lorenzo, P.; González, L.; Reigosa, M.J. The Genus Acacia as Invader: The Characteristic Case of Acacia Dealbata Link in Europe. Ann. For. Sci. 2010, 67, 101. [Google Scholar] [CrossRef] [Green Version]
  6. Vazquez de la Cueva, A. Case Studies of the Expansion of Acacia Dealbata in the Valley of the River Miño (Galicia, Spain). For. Syst. 2014, 23, 3–14. [Google Scholar] [CrossRef] [Green Version]
  7. García, L.M.G.; Íñigo, I.L. Catálogo Español de Especies Exóticas Invasoras: 10 Respuestas a 10 Dudas. Quercus 2014, 345, 40–47. [Google Scholar]
  8. Gómez-García, E. Estimating the Changes in Tree Carbon Stocks in Galician Forests (NW Spain) between 1972 and 2009. For. Ecol. Manag. 2020, 467, 118157. [Google Scholar] [CrossRef]
  9. Alberdi, I.; Sandoval, V.; Condes, S.; Cañellas, I.; Vallejo, R. El Inventario Forestal Nacional Español, Una Herramienta Para El Conocimiento, La Gestión y La Conservación de Los Ecosistemas Forestales Arbolados. Ecosistemas 2016, 25, 88–97. [Google Scholar] [CrossRef]
  10. Tecnologías y Servicios Agrarios, S. A Cuarto Inventario Forestal Nacional: Galicia; Ministerio de Medio Ambiente, y Medio Rural y Marino: Madrid, Spain, 2011; ISBN 978-84-8014-813-9.
  11. Lorenzo, P.; Palomera-Pérez, A.; Reigosa Roger, M.; González, L. Allelopathic Interference of Invasive Acacia Dealbata Link on the Physiological Parameters of Native Understory Species. Plant Ecol. 2011, 212, 403–412. [Google Scholar] [CrossRef]
  12. González-Muñoz, N.; Costa-Tenorio, M.; Espigares, T. Invasion of Alien Acacia Dealbata on Spanish Quercus Robur Forests: Impact on Soils and Vegetation. For. Ecol. Manag. 2012, 269, 214–221. [Google Scholar] [CrossRef]
  13. Rodríguez-Echeverría, S.; Afonso, C.; Correia, M.; Lorenzo, P.; Roiloa, S.R. The Effect of Soil Legacy on Competition and Invasion by Acacia Dealbata Link. Plant Ecol. 2013, 214, 1139–1146. [Google Scholar] [CrossRef]
  14. Bowd, E.J.; Lindenmayer, D.B.; Banks, S.C.; Blair, D.P. Logging and Fire Regimes Alter Plant Communities. Ecol. Appl. 2018, 28, 826–841. [Google Scholar] [CrossRef] [PubMed] [Green Version]
  15. Gonçalves, C.; Santana, P.; Brandão, T.; Guedes, M. Automatic Detection of Acacia Longifolia Invasive Species Based on UAV-Acquired Aerial Imagery. Inf. Process. Agric. 2022, 9, 276–287. [Google Scholar] [CrossRef]
  16. Marzialetti, F.; Frate, L.; De Simone, W.; Frattaroli, A.R.; Acosta, A.T.; Carranza, M.L. Unmanned Aerial Vehicle (UAV)-Based Mapping of Acacia Saligna Invasion in the Mediterranean Coast. Remote Sens. 2021, 13, 3361. [Google Scholar] [CrossRef]
  17. Bombín, R.V. El Mapa Forestal de España Escala 1: 50.000 (MFE50) Como Base Del Tercer Inventario Forestal Nacional. Cuad. La Soc. Española Cienc. For. 2005, 19, 205–210. [Google Scholar]
  18. Liang, J.; Tsui, V.; Van Abbema, A.; Bao, L.; Barrett, K.; Beresini, M.; Berezhkovskiy, L.; Blair, W.S.; Chang, C.; Driscoll, J.; et al. Lead Identification of Novel and Selective TYK2 Inhibitors. Eur. J. Med. Chem. 2013, 67, 175–187. [Google Scholar] [CrossRef]
  19. Somers, B.; Asner, G.P. Multi-Temporal Hyperspectral Mixture Analysis and Feature Selection for Invasive Species Mapping in Rainforests. Remote Sens. Environ. 2013, 136, 14–27. [Google Scholar] [CrossRef]
  20. Lahav-Ginott, S.; Kadmon, R.; Gersani, M. Evaluating the Viability of Acacia Populations in the Negev Desert: A Remote Sensing Approach. Biol. Conserv. 2001, 98, 127–137. [Google Scholar] [CrossRef]
  21. Wäldchen, J.; Mäder, P. Machine Learning for Image Based Species Identification. Methods Ecol. Evol. 2018, 9, 2216–2225. [Google Scholar] [CrossRef]
  22. Lary, D.J.; Alavi, A.H.; Gandomi, A.H.; Walker, A.L. Machine Learning in Geosciences and Remote Sensing. Geosci. Front. 2016, 7, 3–10. [Google Scholar] [CrossRef] [Green Version]
  23. Mohamed, H.; Nadaoka, K.; Nakamura, T. Towards Benthic Habitat 3D Mapping Using Machine Learning Algorithms and Structures from Motion Photogrammetry. Remote Sens. 2020, 12, 127. [Google Scholar] [CrossRef]
  24. Dubayah, R.O.; Drake, J.B. Lidar Remote Sensing for Forestry. J. For. 2000, 98, 44–46. [Google Scholar]
  25. Holmgren, J.; Persson, Å. Identifying Species of Individual Trees Using Airborne Laser Scanner. Remote Sens. Environ. 2004, 90, 415–423. [Google Scholar] [CrossRef]
  26. Gorelick, N.; Hancher, M.; Dixon, M.; Ilyushchenko, S.; Thau, D.; Moore, R. Google Earth Engine: Planetary-Scale Geospatial Analysis for Everyone. Remote Sens. Environ. 2017, 202, 18–27. [Google Scholar] [CrossRef]
  27. Aschbacher, J. ESA’s Earth Observation Strategy and Copernicus. In Satellite Earth Observations and Their Impact on Society and Policy; Springer: Singapore, 2017; pp. 81–86. [Google Scholar]
  28. Lawes, R.A.; Wallace, J.F. Monitoring an Invasive Perennial at the Landscape Scale with Remote Sensing. Ecol. Manag. Restor. 2008, 9, 53–59. [Google Scholar] [CrossRef]
  29. Park, H.-C.; Lim, J.-C.; Lee, J.-H.; Lee, G.-G. Predicting the Potential Distributions of Invasive Species Using the Landsat Imagery and Maxent: Focused On. J. Korean Soc. Environ. Restor. Technol. 2017, 20, 1–12. [Google Scholar] [CrossRef] [Green Version]
  30. Young, K.E.; Abbott, L.B.; Caldwell, C.A.; Schrader, T.S. Estimating Suitable Environments for Invasive Plant Species across Large Landscapes: A Remote Sensing Strategy Using Landsat 7 ETM+. Int. J. Biodivers. Conserv. 2013, 5, 122–134. [Google Scholar]
  31. Khare, S.; Latifi, H.; Ghosh, S.K. Multi-Scale Assessment of Invasive Plant Species Diversity Using Pléiades 1A, RapidEye and Landsat-8 Data. Geocarto Int. 2018, 33, 681–698. [Google Scholar] [CrossRef]
  32. Proença, B.; Frappart, F.; Lubac, B.; Marieu, V.; Ygorra, B.; Bombrun, L.; Michalet, R.; Sottolichio, A. Potential of High-Resolution Pléiades Imagery to Monitor Salt Marsh Evolution after Spartina Invasion. Remote Sens. 2019, 11, 968. [Google Scholar] [CrossRef] [Green Version]
  33. Alvarez-Taboada, F.; Paredes, C.; Julián-Pelaz, J. Mapping of the Invasive Species Hakea Sericea Using Unmanned Aerial Vehicle (UAV) and WorldView-2 Imagery and an Object-Oriented Approach. Remote Sens. 2017, 9, 913. [Google Scholar] [CrossRef] [Green Version]
  34. Crisigiovanni, E.L.; Figueiredo Filho, A.; Pesck, V.A.; de Lima, V.A. Potential of Machine Learning and WorldView-2 Images for Recognizing Endangered and Invasive Species in the Atlantic Rainforest. Ann. For. Sci. 2021, 78, 54. [Google Scholar] [CrossRef]
  35. Robinson, T.P.; Wardell-Johnson, G.W.; Pracilio, G.; Brown, C.; Corner, R.; Van Klinken, R.D. Testing the Discrimination and Detection Limits of WorldView-2 Imagery on a Challenging Invasive Plant Target. Int. J. Appl. Earth Obs. Geoinf. 2016, 44, 23–30. [Google Scholar] [CrossRef]
  36. Sankey, T.; Dickson, B.; Sesnie, S.; Wang, O.; Olsson, A.; Zachmann, L. WorldView-2 High Spatial Resolution Improves Desert Invasive Plant Detection. Photogramm. Eng. Remote Sens. 2014, 80, 885–893. [Google Scholar] [CrossRef]
  37. Fuller, D.O. Remote Detection of Invasive Melaleuca Trees (Melaleuca Quinquenervia) in South Florida with Multispectral IKONOS Imagery. Int. J. Remote Sens. 2005, 26, 1057–1063. [Google Scholar] [CrossRef]
  38. Laba, M.; Blair, B.; Downs, R.; Monger, B.; Philpot, W.; Smith, S.; Sullivan, P.; Baveye, P.C. Use of Textural Measurements to Map Invasive Wetland Plants in the Hudson River National Estuarine Research Reserve with IKONOS Satellite Imagery. Remote Sens. Environ. 2010, 114, 876–886. [Google Scholar] [CrossRef]
  39. Förster, M.; Schmidt, T.; Wolf, R.; Kleinschmit, B.; Fassnacht, F.E.; Cabezas, J.; Kattenborn, T. Detecting the Spread of Invasive Species in Central Chile with a Sentinel-2 Time-Series. In Proceedings of the 2017 9th International Workshop on the Analysis of Multitemporal Remote Sensing Images (MultiTemp), Bruges, Belgium, 27 June 2017; pp. 1–4. [Google Scholar]
  40. Masemola, C.; Cho, M.A.; Ramoelo, A. Towards a Semi-Automated Mapping of Australia Native Invasive Alien Acacia Trees Using Sentinel-2 and Radiative Transfer Models in South Africa. ISPRS J. Photogramm. Remote Sens. 2020, 166, 153–168. [Google Scholar] [CrossRef]
  41. Masemola, C.; Cho, M.A.; Ramoelo, A. Sentinel-2 Time Series Based Optimal Features and Time Window for Mapping Invasive Australian Native Acacia Species in KwaZulu Natal, South Africa. Int. J. Appl. Earth Obs. Geoinf. 2020, 93, 102207. [Google Scholar] [CrossRef]
  42. Kattenborn, T.; Sperlich, M.; Bataua, K.; Koch, B. Automatic Single Tree Detection in Plantations Using UAV-Based Photogrammetric Point Clouds. Int. Arch. Photogramm. Remote Sens. Spatial Inf. Sci. 2014, XL–3, 139–144. [Google Scholar] [CrossRef] [Green Version]
  43. Große-Stoltenberg, A.; Hellmann, C.; Werner, C.; Oldeland, J.; Thiele, J. Evaluation of Continuous VNIR-SWIR Spectra versus Narrowband Hyperspectral Indices to Discriminate the Invasive Acacia Longifolia within a Mediterranean Dune Ecosystem. Remote Sens. 2016, 8, 334. [Google Scholar] [CrossRef] [Green Version]
  44. Große-Stoltenberg, A.; Hellmann, C.; Thiele, J.; Werner, C.; Oldeland, J. Early Detection of GPP-Related Regime Shifts after Plant Invasion by Integrating Imaging Spectroscopy with Airborne LiDAR. Remote Sens. Environ. 2018, 209, 780–792. [Google Scholar] [CrossRef]
  45. Arasumani, M.; Bunyan, M.; Robin, V.V. Opportunities and Challenges in Using Remote Sensing for Invasive Tree Species Management, and in the Identification of Restoration Sites in Tropical Montane Grasslands. J. Environ. Manag. 2021, 280, 111759. [Google Scholar] [CrossRef] [PubMed]
  46. Arasumani, M.; Singh, A.; Bunyan, M.; Robin, V.V. Testing the Efficacy of Hyperspectral (AVIRIS-NG), Multispectral (Sentinel-2) and Radar (Sentinel-1) Remote Sensing Images to Detect Native and Invasive Non-Native Trees. Biol. Invasions 2021, 23, 2863–2879. [Google Scholar] [CrossRef]
  47. Isaacson, S.; Ephrath, J.E.; Rachmilevitch, S.; Maman, S.; Ginat, H.; Blumberg, D.G. Long and Short Term Population Dynamics of Acacia Trees via Remote Sensing and Spatial Analysis: Case Study in the Southern Negev Desert. Remote Sens. Environ. 2017, 198, 95–104. [Google Scholar] [CrossRef]
  48. Oldeland, J.; Große-Stoltenberg, A.; Naftal, L.; Strohbach, B.J. The Potential of UAV Derived Image Features for Discriminating Savannah Tree Species. In The Roles of Remote Sensing in Nature Conservation; Springer: Cham, Switzerland, 2017; pp. 183–201. [Google Scholar] [CrossRef]
  49. Paz-Kagan, T.; Silver, M.; Panov, N.; Karnieli, A. Multispectral Approach for Identifying Invasive Plant Species Based on Flowering Phenology Characteristics. Remote Sens. 2019, 11, 953. [Google Scholar] [CrossRef] [Green Version]
  50. Dixon, D.J.; Callow, J.N.; Duncan, J.M.A.; Setterfield, S.A.; Pauli, N. Satellite Prediction of Forest Flowering Phenology. Remote Sens. Environ. 2021, 255, 112197. [Google Scholar] [CrossRef]
  51. d’Andrimont, R.; Taymans, M.; Lemoine, G.; Ceglar, A.; Yordanov, M.; van der Velde, M. Detecting Flowering Phenology in Oil Seed Rape Parcels with Sentinel-1 and -2 Time Series. Remote Sens. Environ. 2020, 239, 111660. [Google Scholar] [CrossRef]
  52. Milicevic, M.; Zubrinic, K.; Grbavac, I.; Obradovic, I. Application of Deep Learning Architectures for Accurate Detection of Olive Tree Flowering Phenophase. Remote Sens. 2020, 12, 120. [Google Scholar] [CrossRef]
  53. Campbell, T.; Fearns, P. Simple Remote Sensing Detection of Corymbia Calophylla Flowers Using Common 3 –Band Imaging Sensors. Remote Sens. Appl. Soc. Environ. 2018, 11, 51–63. [Google Scholar] [CrossRef]
  54. Kottek, M.; Grieser, J.; Beck, C.; Rudolf, B.; Rubel, F. World Map of the Köppen-Geiger Climate Classification Updated. Meteorol. Z. 2006, 15, 259–263. [Google Scholar] [CrossRef]
  55. Wolf, A.F. Using WorldView-2 Vis-NIR Multispectral Imagery to Support Land Mapping and Feature Extraction Using Normalized Difference Index Ratios; SPIE: Bellingham, WA, USA, 2012; Volume 8390, pp. 188–195. [Google Scholar]
  56. Xu, H. Modification of Normalised Difference Water Index (NDWI) to Enhance Open Water Features in Remotely Sensed Imagery. Null 2006, 27, 3025–3033. [Google Scholar] [CrossRef]
  57. Huang, S.; Tang, L.; Hupy, J.P.; Wang, Y.; Shao, G. A Commentary Review on the Use of Normalized Difference Vegetation Index (NDVI) in the Era of Popular Remote Sensing. J. For. Res. 2021, 32, 1–6. [Google Scholar] [CrossRef]
  58. Mulla, D.J. Twenty Five Years of Remote Sensing in Precision Agriculture: Key Advances and Remaining Knowledge Gaps. Biosyst. Eng. 2013, 114, 358–371. [Google Scholar] [CrossRef]
  59. Dube, T.; Gumindoga, W.; Chawira, M. Detection of Land Cover Changes around Lake Mutirikwi, Zimbabwe, Based on Traditional Remote Sensing Image Classification Techniques. Afr. J. Aquat. Sci. 2014, 39, 89–95. [Google Scholar] [CrossRef]
  60. Rodrigues, M.; De la Riva, J. An Insight into Machine-Learning Algorithms to Model Human-Caused Wildfire Occurrence. Environ. Model. Softw. 2014, 57, 192–201. [Google Scholar] [CrossRef]
  61. Domingo, D.; Lamelas, M.T.; Montealegre, A.L.; García-Martín, A.; de la Riva, J. Estimation of Total Biomass in Aleppo Pine Forest Stands Applying Parametric and Nonparametric Methods to Low-Density Airborne Laser Scanning Data. Forests 2018, 9, 158. [Google Scholar] [CrossRef] [Green Version]
  62. García-Gutiérrez, J.; Martínez-Álvarez, F.; Troncoso, A.; Riquelme, J.C. A Comparison of Machine Learning Regression Techniques for LiDAR-Derived Estimation of Forest Variables. Neurocomputing 2015, 167, 24–31. [Google Scholar] [CrossRef]
  63. Foody, G.M. Explaining the Unsuitability of the Kappa Coefficient in the Assessment and Comparison of the Accuracy of Thematic Maps Obtained by Image Classification. Remote Sens. Environ. 2020, 239, 111630. [Google Scholar] [CrossRef]
  64. Rodrigues, M.; Jiménez-Ruano, A.; de la Riva, J. Fire Regime Dynamics in Mainland Spain. Part 1: Drivers of Change. Sci. Total Environ. 2020, 721, 135841. [Google Scholar] [CrossRef]
  65. Cho, M.A.; Ramoelo, A.; Dziba, L. Response of Land Surface Phenology to Variation in Tree Cover during Green-up and Senescence Periods in the Semi-Arid Savanna of Southern Africa. Remote Sens. 2017, 9, 689. [Google Scholar] [CrossRef] [Green Version]
  66. Key, C. Landscape Assessment (LA): Sampling and Analysis Methods. In FIREMON: Fire Effects Monitoring and Inventory System; Lutes, D., Keane, R., Caratti, J., Key, C., Benson, N., Sutherland, S., Gangi, L., Eds.; General Technical Report RMRS-GTR-164; USDA Forest Service, Rocky Mountain Research Station: Fort Collins, CO, USA, 2006; pp. LA1–LA51. [Google Scholar]
  67. Hernández, L.; Martínez- Fernández, J.; Cañellas, I.; de la Cueva, A.V. Assessing Spatio-Temporal Rates, Patterns and Determinants of Biological Invasions in Forest Ecosystems. The Case of Acacia Species in NW Spain. For. Ecol. Manag. 2014, 329, 206–213. [Google Scholar] [CrossRef] [Green Version]
  68. Davidson, D.W.; Morton, S.R. Dispersal Adaptations of Some Acacia Species in the Australian Arid Zone. Ecology 1984, 65, 1038–1051. [Google Scholar] [CrossRef]
  69. Gassó, N.; Thuiller, W.; Pino, J.; Vilà, M. Potential Distribution Range of Invasive Plant Species in Spain. NeoBiota 2012, 12, 25. [Google Scholar]
Figure 1. Pictures of A. dealbata in Galicia (NW Spain) at different phenological stages. Images (A,B) were taken after blooming period and (C,D) were taken when the species is in bloom.
Remotesensing 15 00722 g001
Figure 2. Localization of study area and field plots with presences and absences of Acacia dealbata. (A) Partial map of Europe where Spain is located, (B) partial map of Spain where Galicia is located, and (C) partial map of Galicia where Arnoia (study area) is located. The filled dots show the ground-truth points where A. dealbata has been detected, while the hole dots show the ground-truth data where other species have been detected.
Remotesensing 15 00722 g002
Figure 4. Metric importance from the best random forest model that includes six Sentinel-2 metrics.
Remotesensing 15 00722 g004
Figure 5. A. dealbata presence mapping using RF model for year 2018 (left) and transferred to 2022 (center) within the forested areas under study. The graph indicates the percentage of presences and absences within the study area.
Remotesensing 15 00722 g005
Disclaimer/Publisher’s Note: The statements, opinions and data contained in all publications are solely those of the individual author(s) and contributor(s) and not of MDPI and/or the editor(s). MDPI and/or the editor(s) disclaim responsibility for any injury to people or property resulting from any ideas, methods, instructions or products referred to in the content.

