
A Novel Framework for Correcting Satellite-Based Precipitation Products for Watersheds with Discontinuous Observed Data, Case Study in Mekong River Basin


Abstract
:1. Introduction
2. Materials and Method
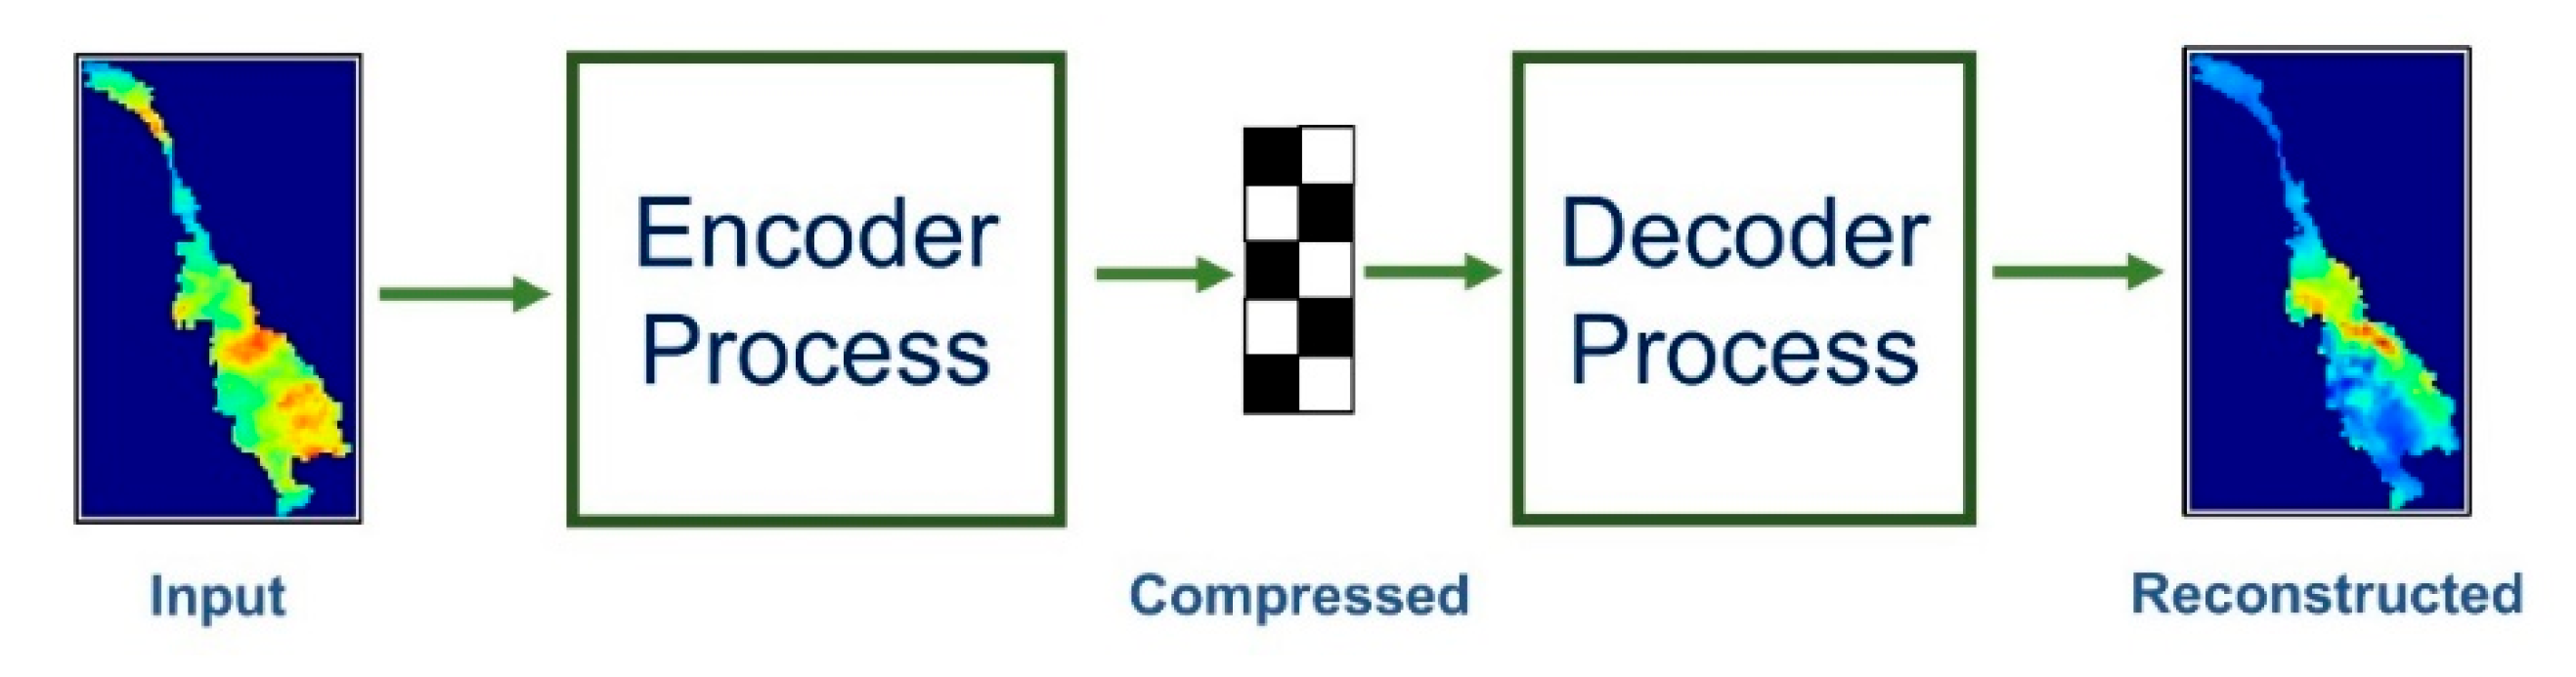
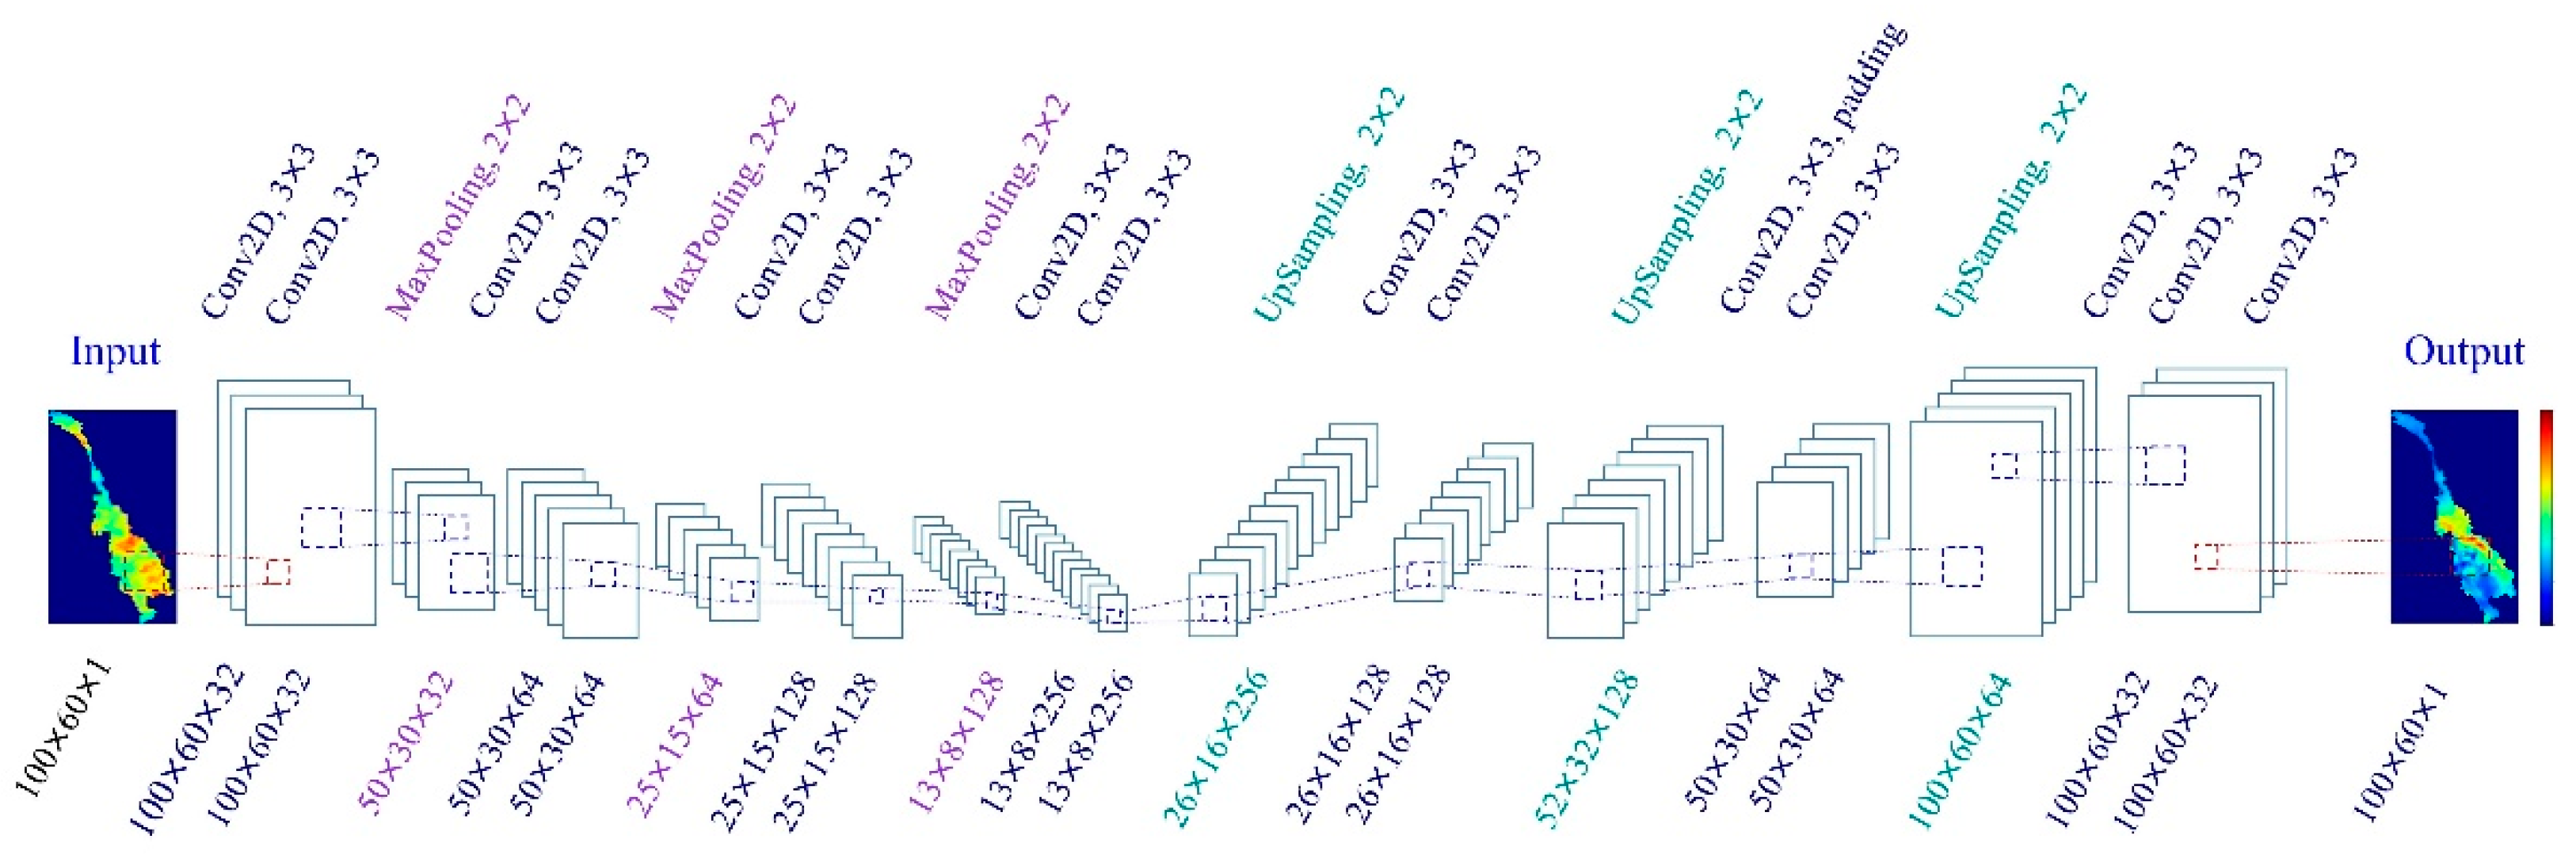
2.1. CAE Model
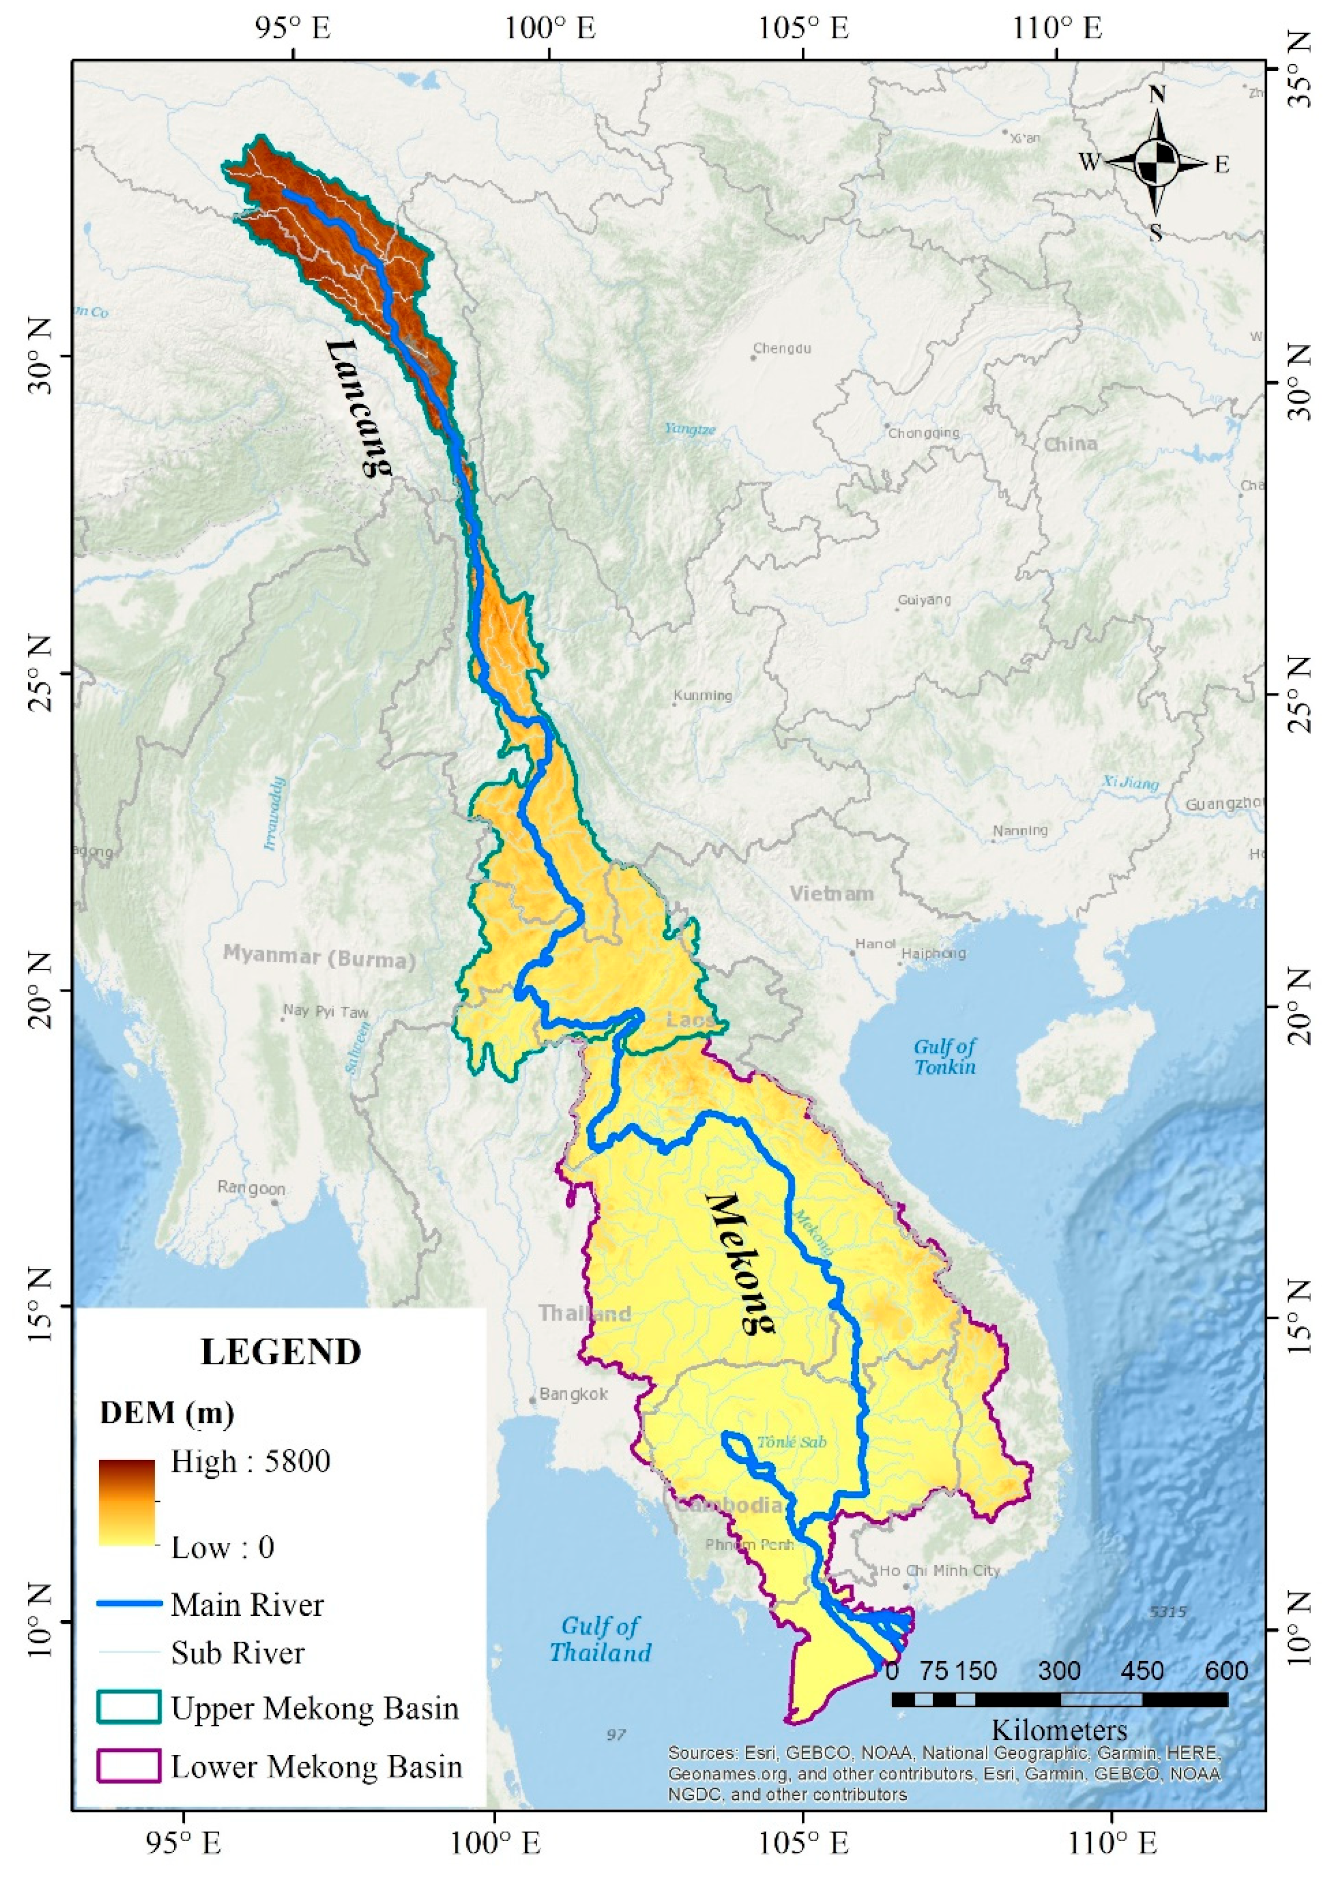
2.2. Study Area
2.3. Gridded Precipitation (GP) Products
2.3.1. Satellite-Based Precipitation (SP) Data
2.3.2. Gauge-Based Precipitation Data
3. Model Processes
4. Results and Discussion
4.1. Evaluation of Temporal Correlation
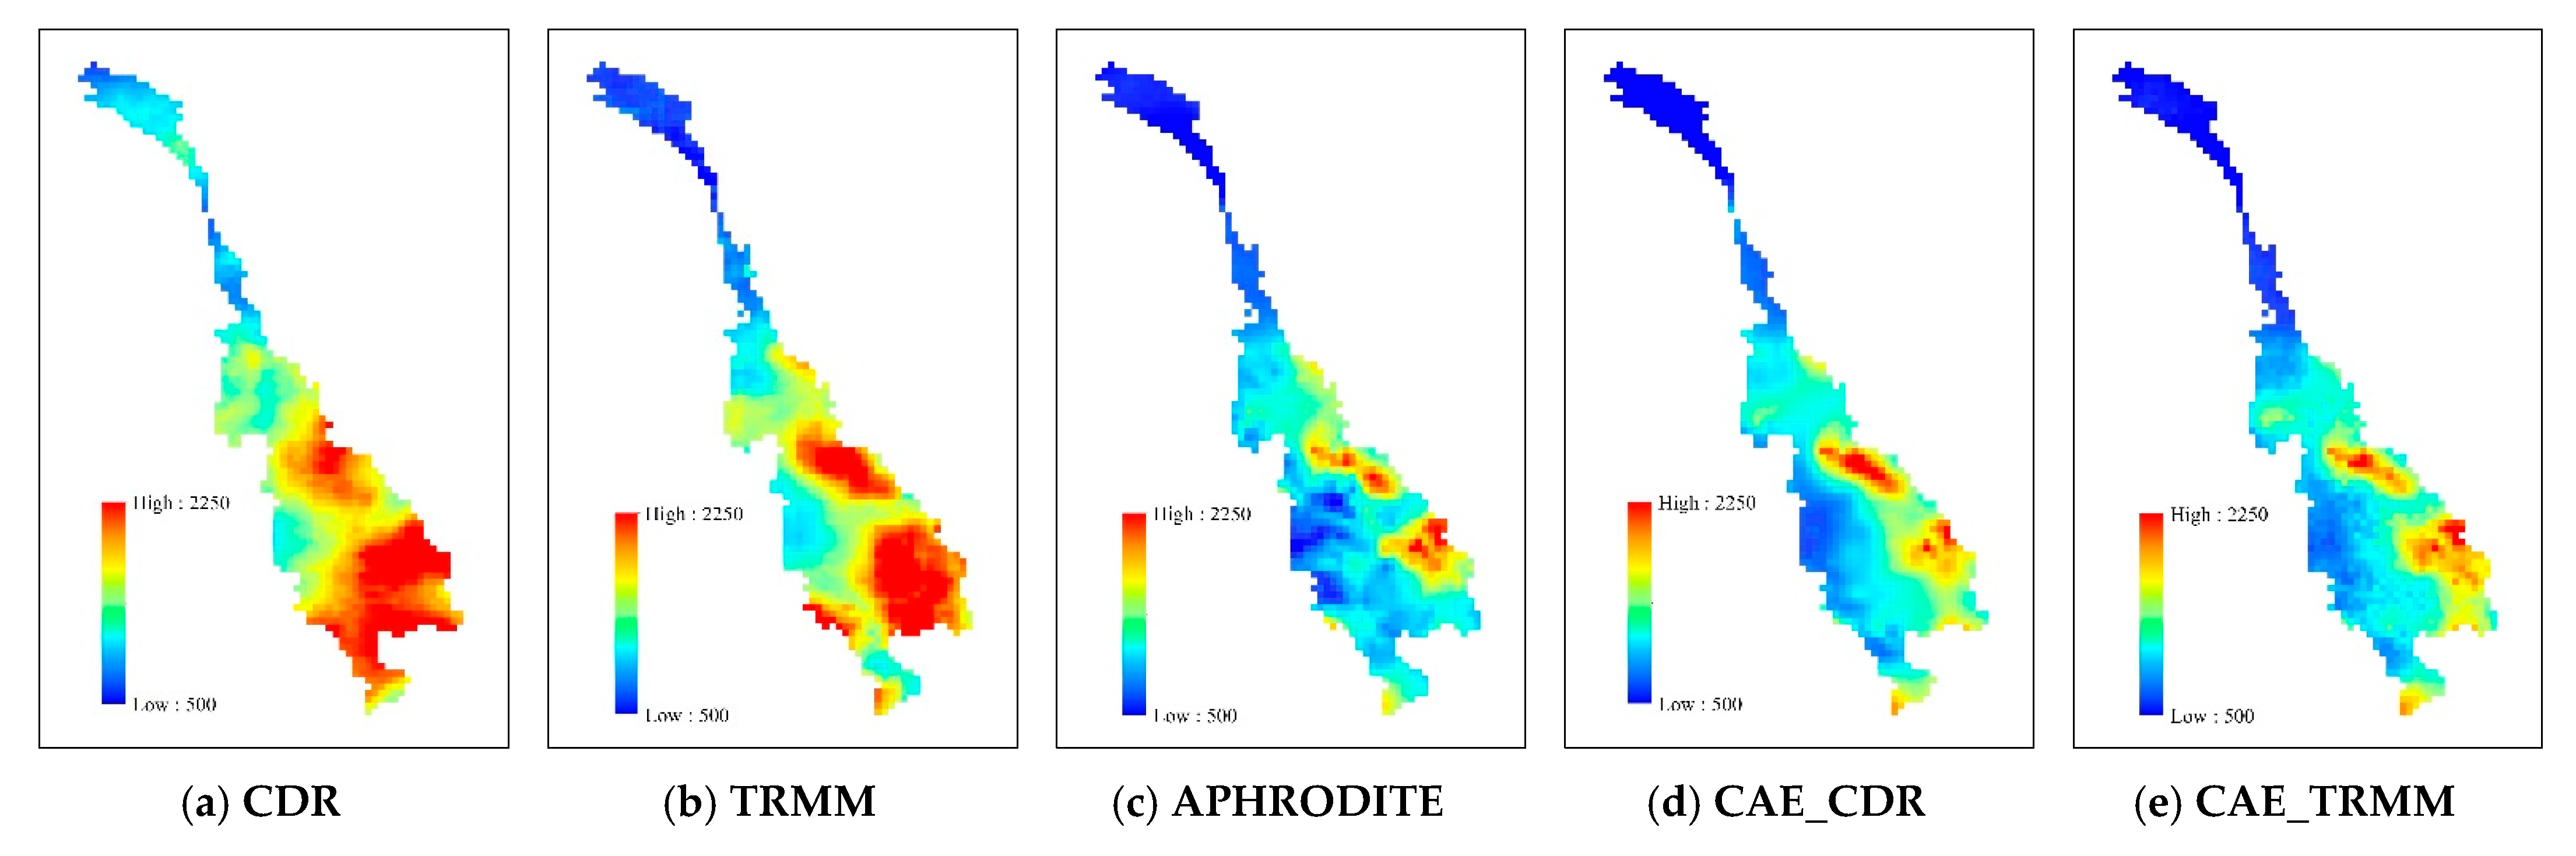
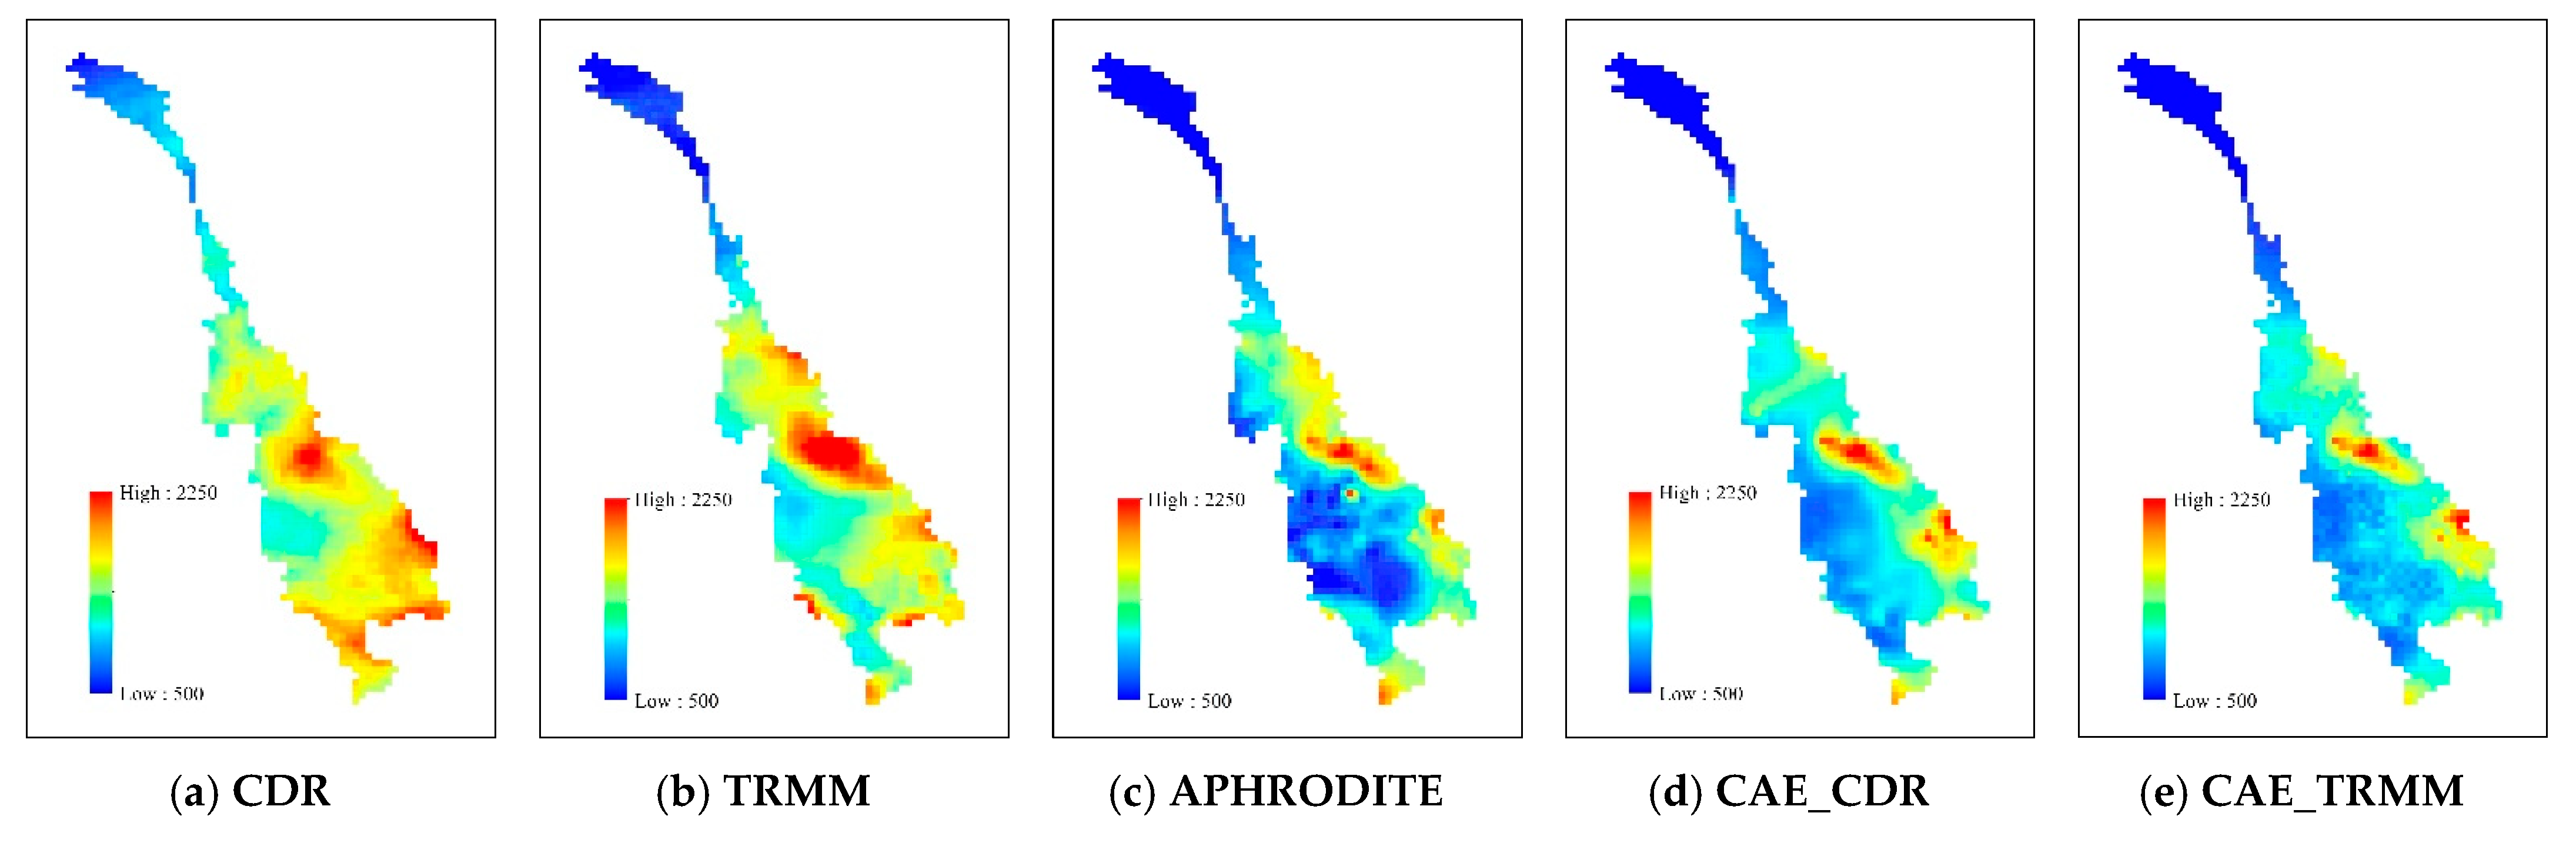
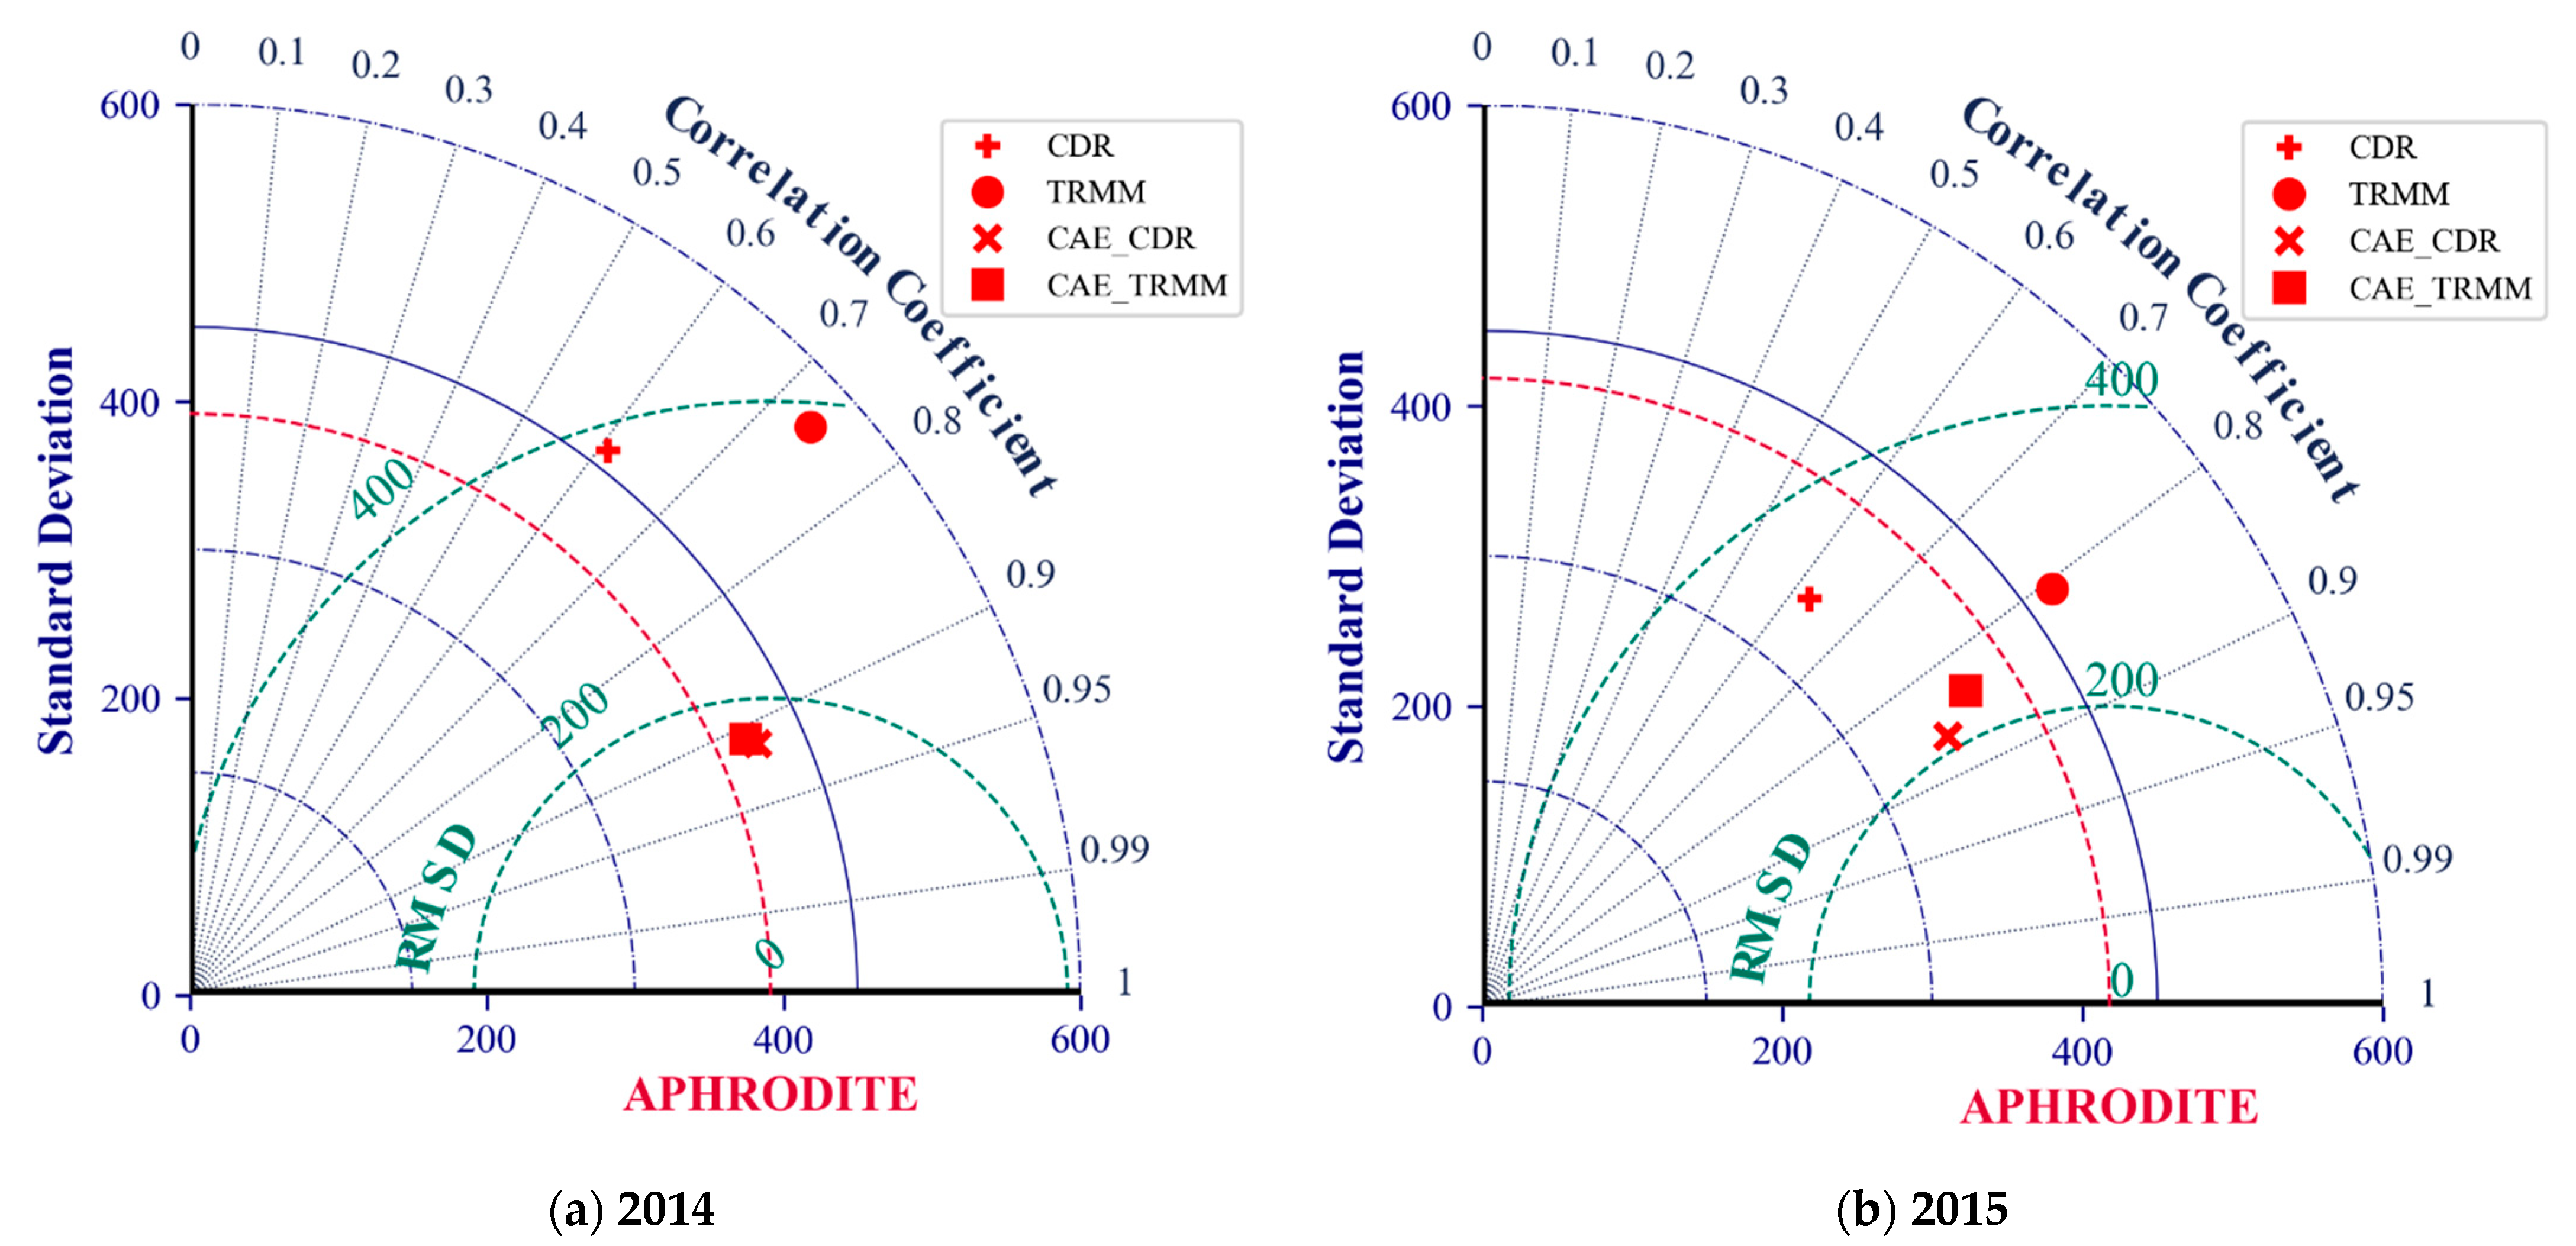
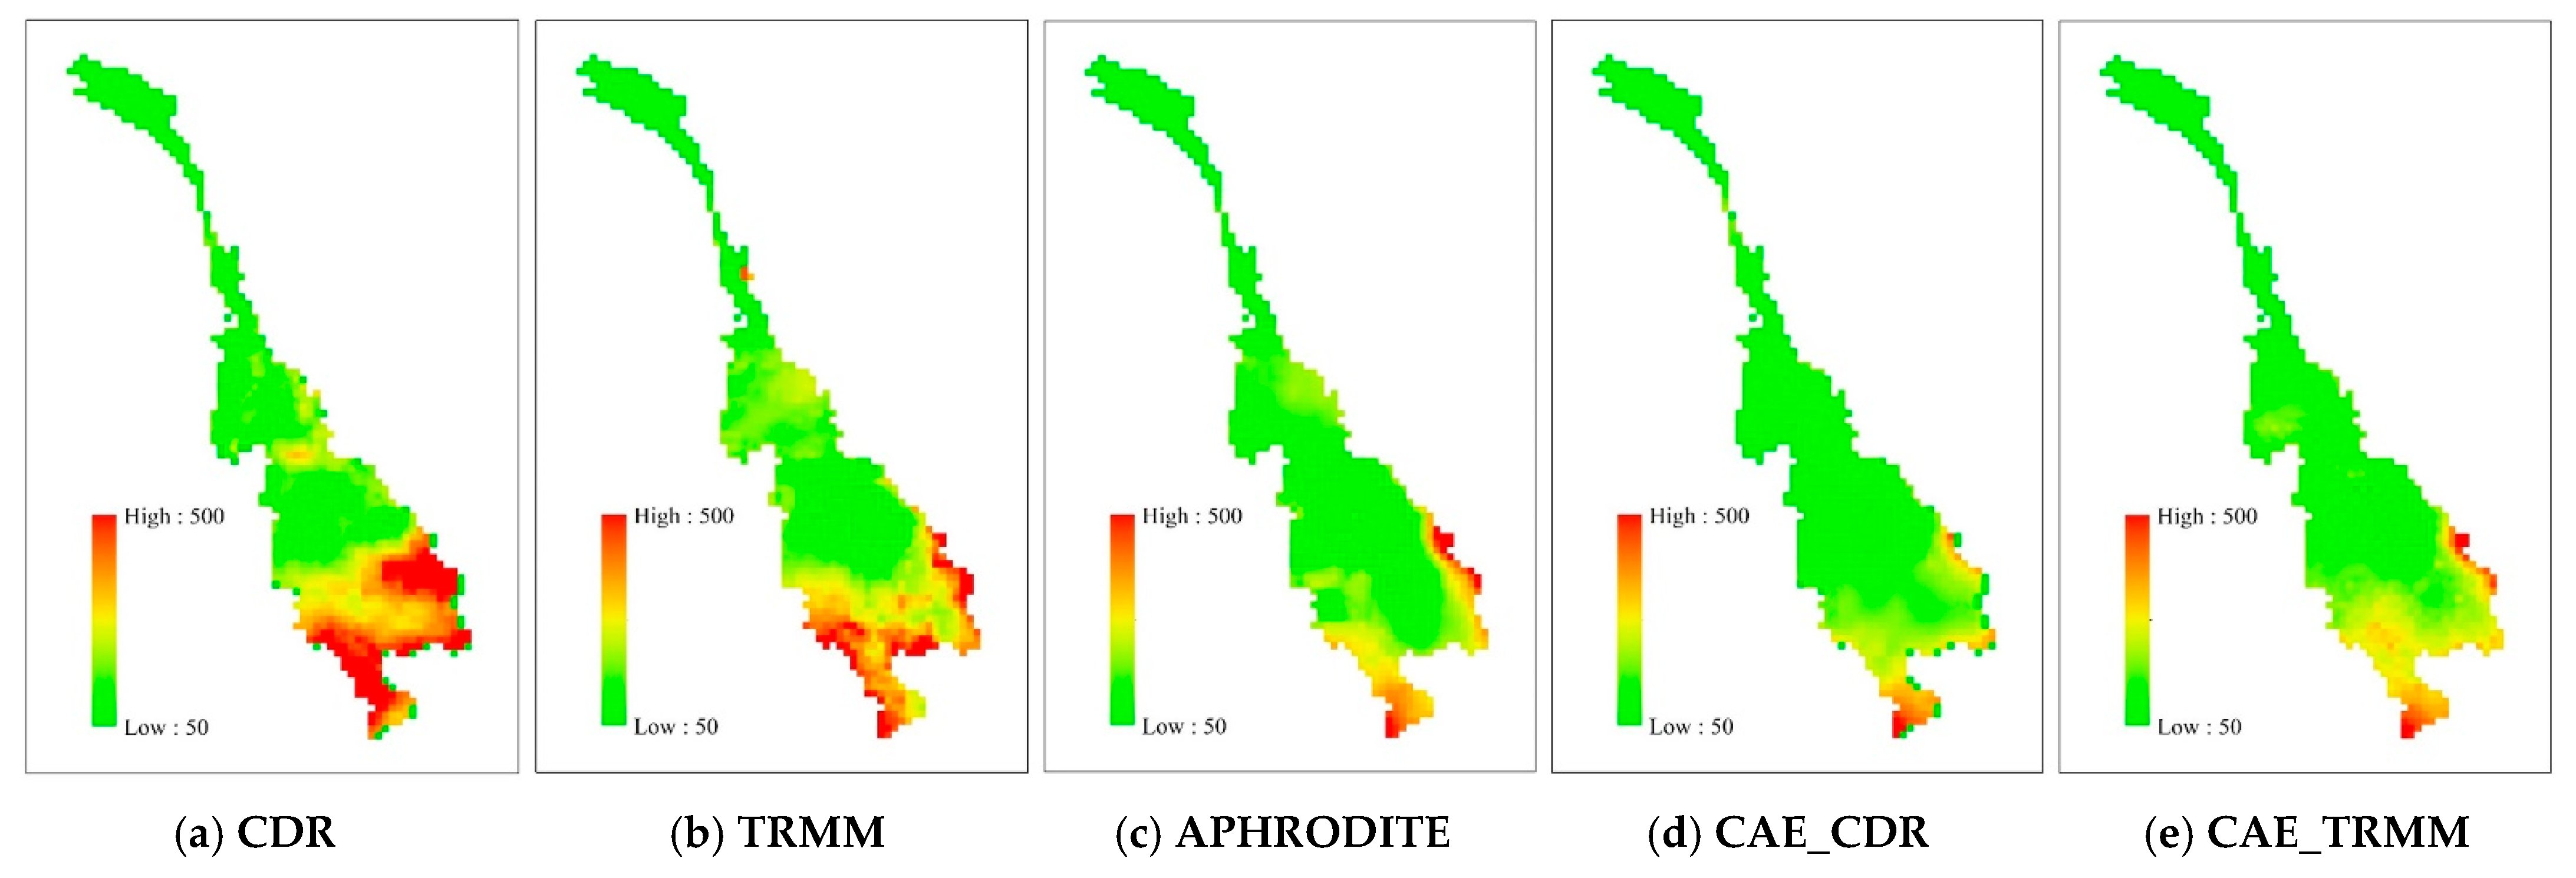
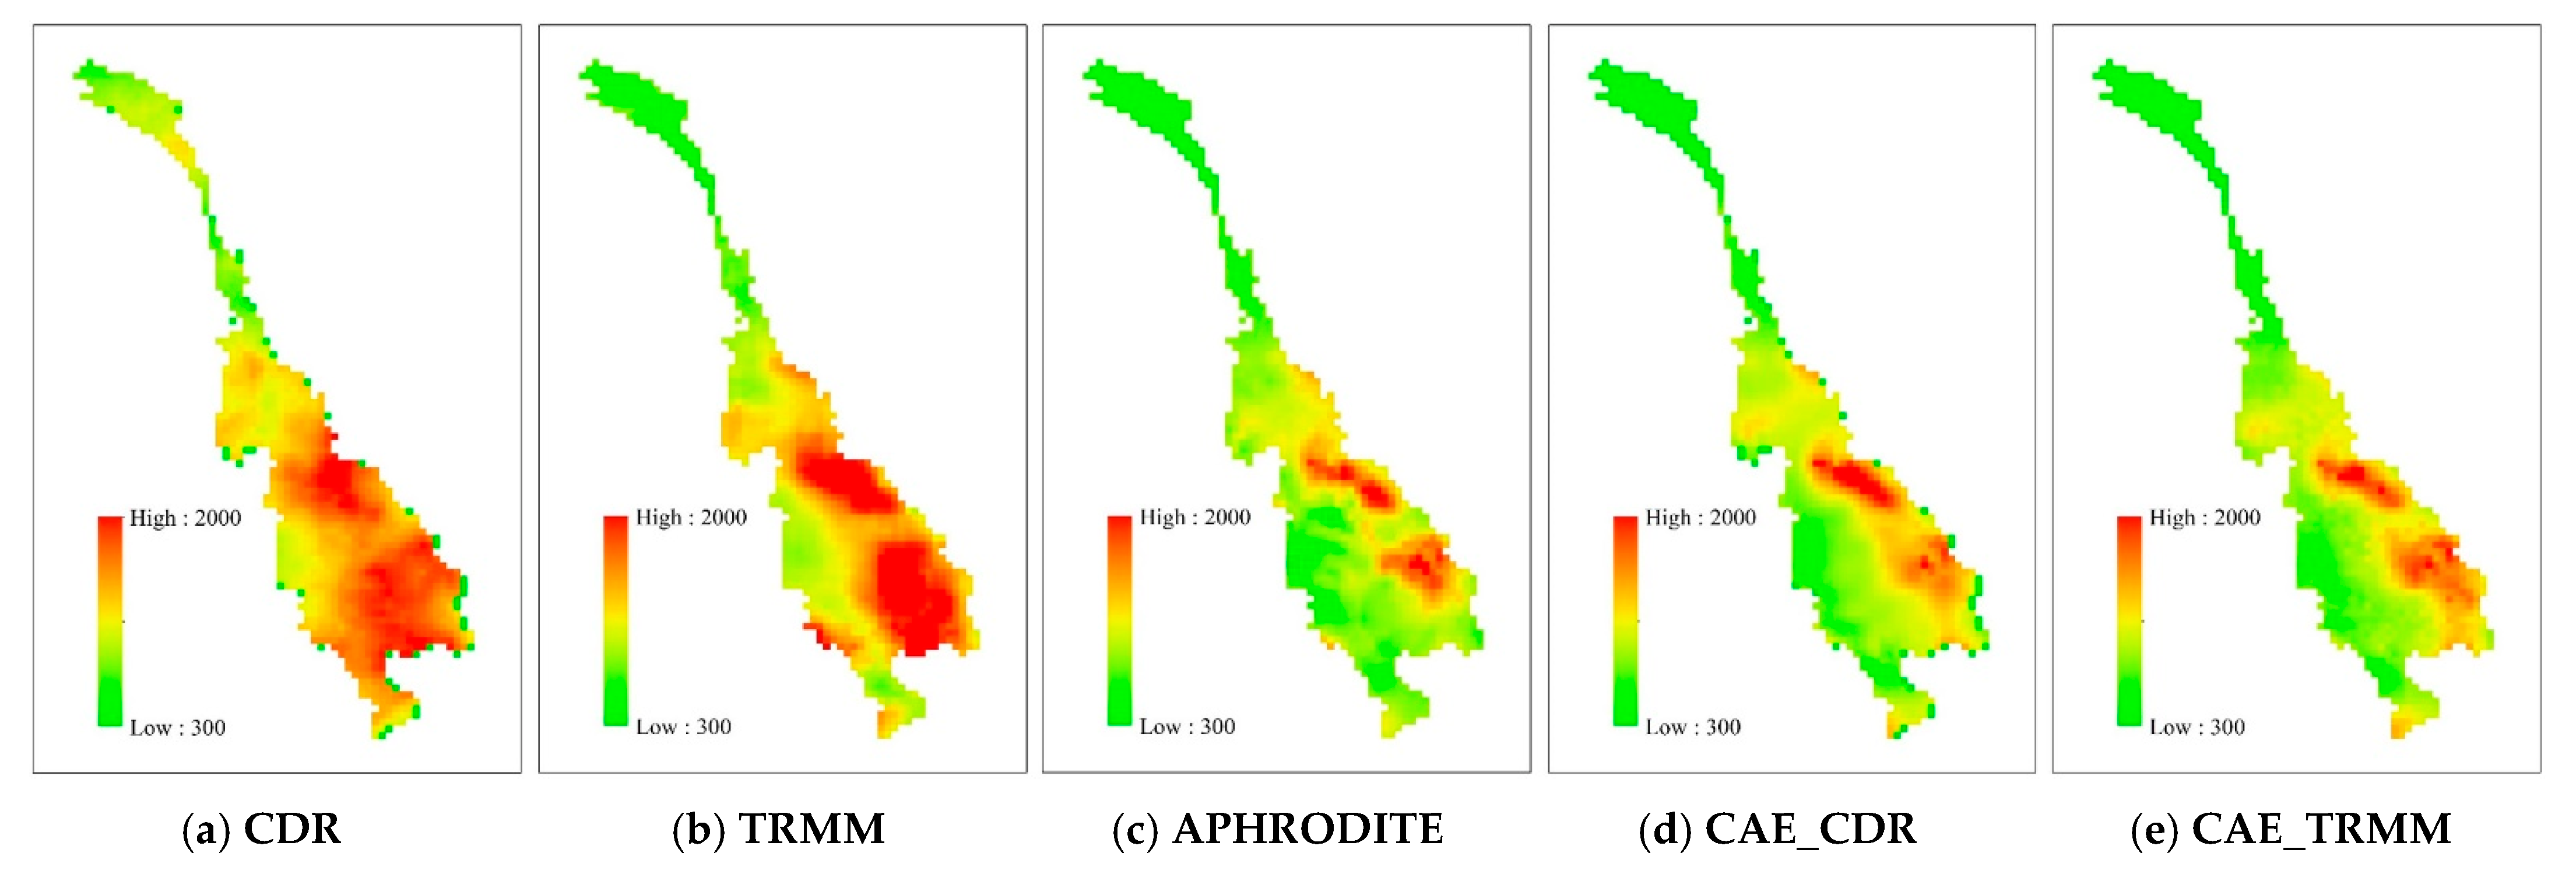
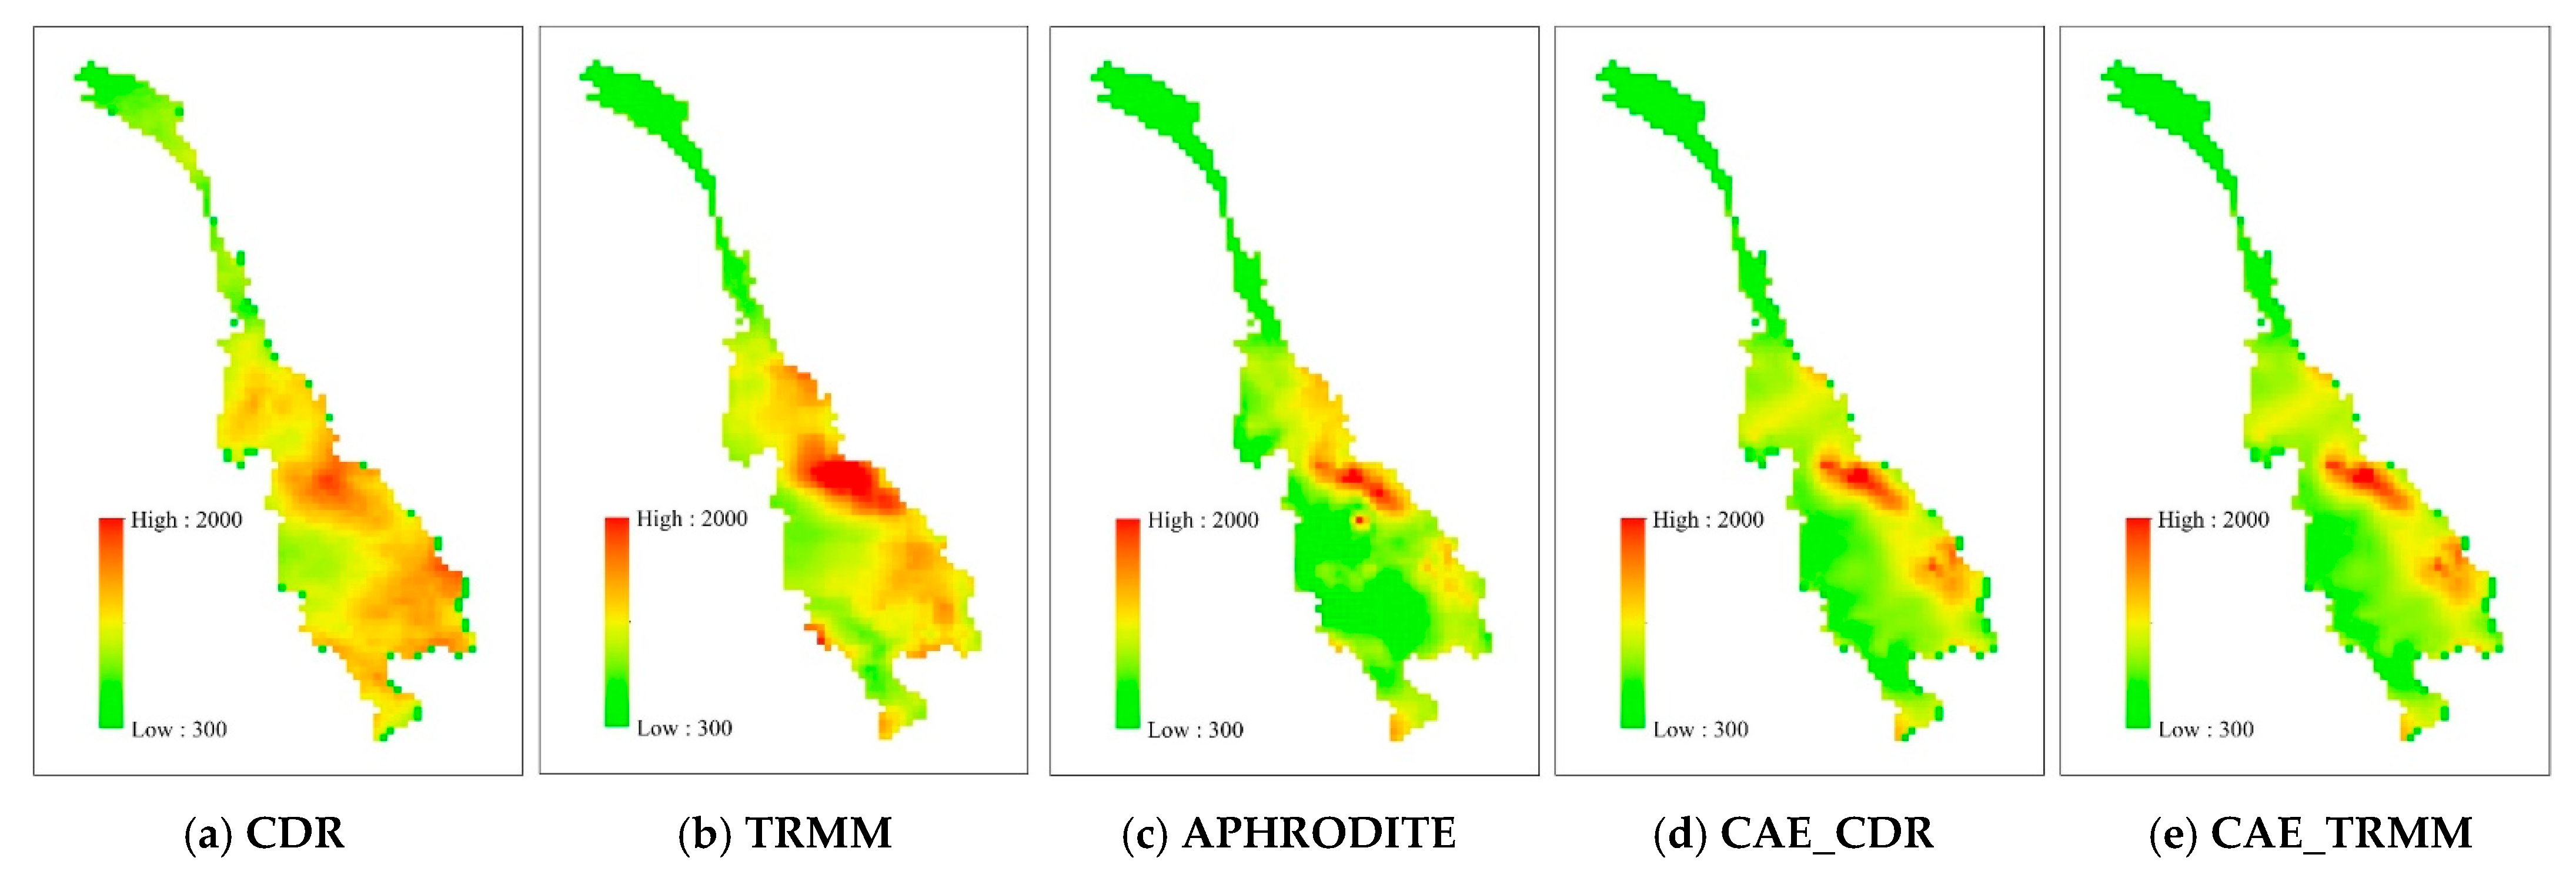
4.2. Evaluation of Spatial Correlation
5. Conclusions
- For the SP products studied in this study, TRMM exhibited a more favorable connection with observational data compared to CDR in most of the evaluation criteria.
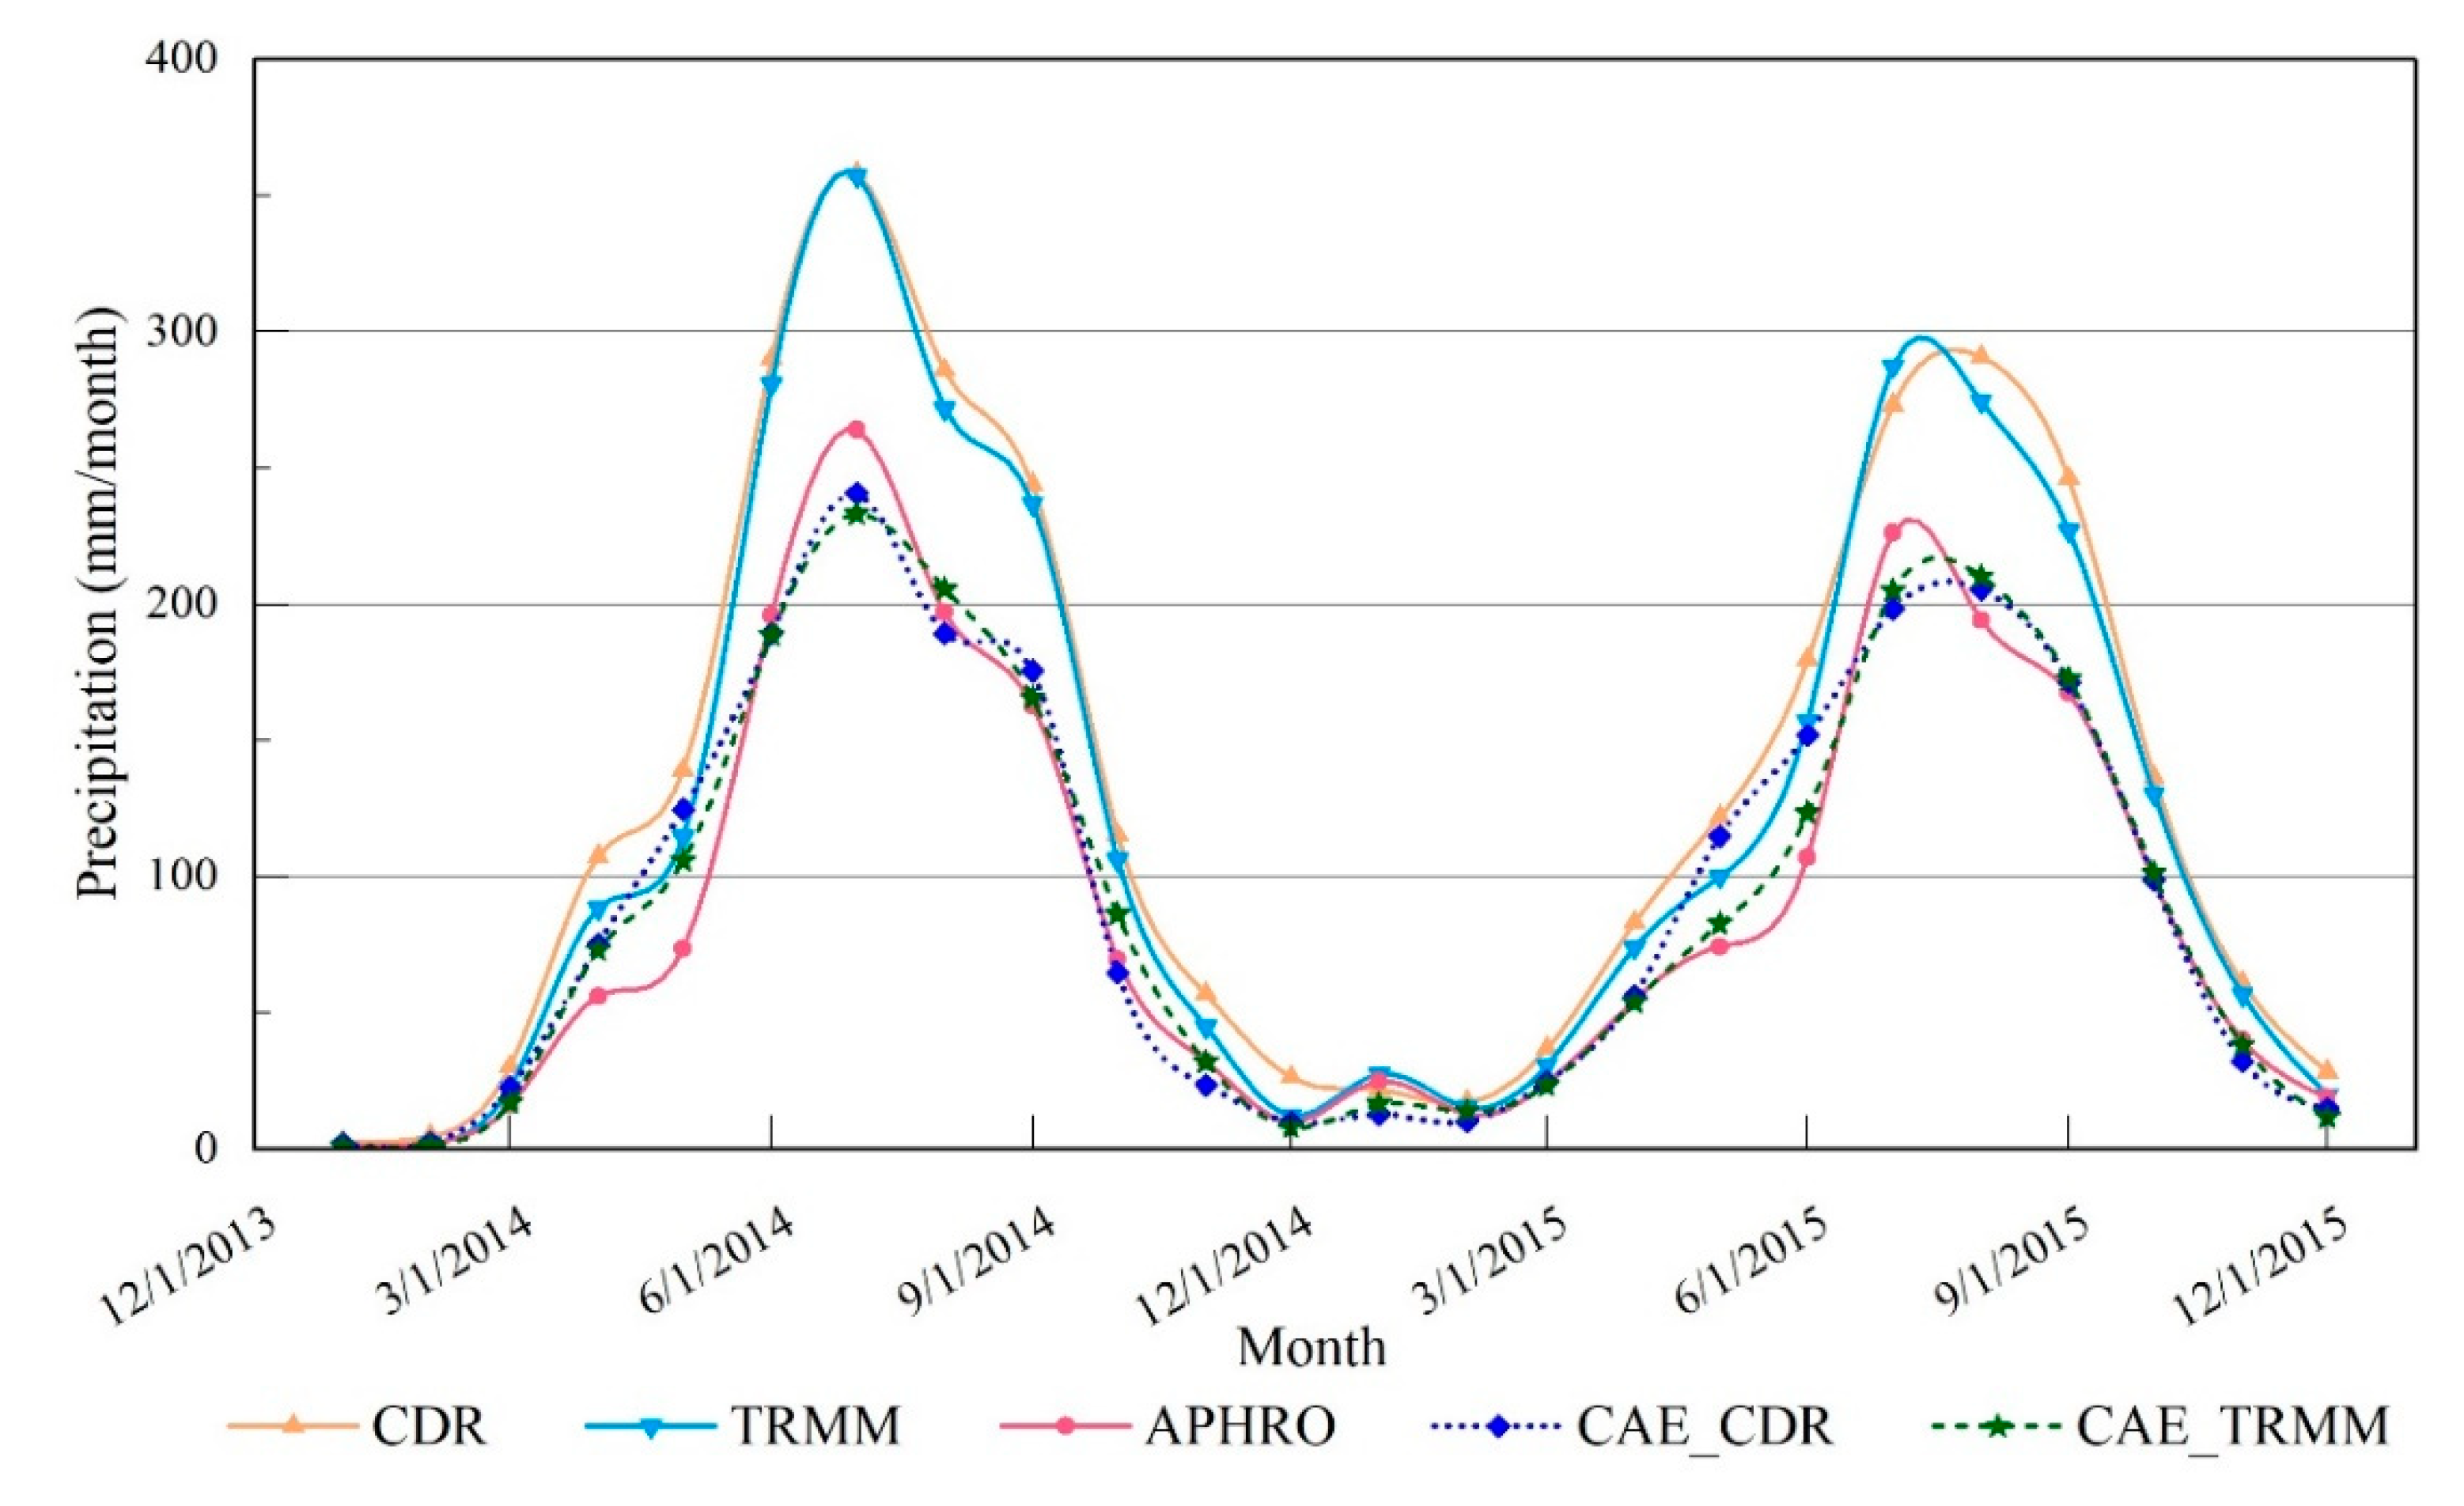
- CAE succeeded in narrowing the spatiotemporal gap between the SP and APHRODITE products. The difference in MAD, in particular, has dropped dramatically to just 12.4 mm/month with CDR and 8.7 mm/month with TRMM, equating to a decrease of 30.8 mm/month and 25.3 mm/month for these two products, respectively. Meanwhile, the temporal correlation of the basin-wide average monthly rainfall of the corrected products is up to [0.97–0.99].
- The quantified statistical criteria indicate that both bias-adjusted SP products perform equally well when compared with observed data. In this regard, CAE_TRMM appears to have a minor advantage over CAE_CDR, although the difference is insignificant.
- Because the APHRODITE product has not been upgraded since 2016, the CAE model is intended to be the solution for providing a more up-to-date and trustworthy data set for experiments in the MRB.
Author Contributions
Funding
Data Availability Statement
Conflicts of Interest
References
- Sun, Q.; Miao, C.; Duan, Q.; Ashouri, H.; Sorooshian, S.; Hsu, K.-L. A Review of Global Precipitation Data Sets: Data Sources, Estimation, and Intercomparisons. Rev. Geophys. 2018, 56, 79–107. [Google Scholar] [CrossRef] [Green Version]
- Collischonn, B.; Collischonn, W.; Tucci, C.E.M. Daily hydrological modeling in the Amazon basin using TRMM rainfall estimates. J. Hydrol. 2008, 360, 207–216. [Google Scholar] [CrossRef]
- Le, X.H.; Lee, G.; Jung, K.; An, H.-U.; Lee, S.; Jung, Y. Application of Convolutional Neural Network for Spatiotemporal Bias Correction of Daily Satellite-Based Precipitation. Remote Sens. 2020, 12, 2731. [Google Scholar] [CrossRef]
- López, P.L.; Immerzeel, W.W.; Rodríguez Sandoval, E.A.; Sterk, G.; Schellekens, J. Spatial Downscaling of Satellite-Based Precipitation and Its Impact on Discharge Simulations in the Magdalena River Basin in Colombia. Front. Earth Sci. 2018, 6, 68. [Google Scholar] [CrossRef] [Green Version]
- Kubota, T.; Shige, S.; Hashizume, H.; Aonashi, K.; Takahashi, N.; Seto, S.; Hirose, M.; Takayabu, Y.N.; Ushio, T.; Nakagawa, K.; et al. Global Precipitation Map Using Satellite-Borne Microwave Radiometers by the GSMaP Project: Production and Validation. IEEE Trans. Geosci. Remote Sens. 2007, 45, 2259–2275. [Google Scholar] [CrossRef]
- Joyce, R.J.; Janowiak, J.E.; Arkin, P.A.; Xie, P. CMORPH: A Method that Produces Global Precipitation Estimates from Passive Microwave and Infrared Data at High Spatial and Temporal Resolution. J. Hydrometeorol. 2004, 5, 487–503. [Google Scholar] [CrossRef]
- Ashouri, H.; Hsu, K.-L.; Sorooshian, S.; Braithwaite, D.K.; Knapp, K.R.; Cecil, L.D.; Nelson, B.R.; Prat, O.P. PERSIANN-CDR: Daily Precipitation Climate Data Record from Multisatellite Observations for Hydrological and Climate Studies. Bull. Am. Meteorol. Soc. 2015, 96, 69–83. [Google Scholar] [CrossRef] [Green Version]
- Huffman, G.J.; Bolvin, D.T.; Nelkin, E.J.; Wolff, D.B.; Adler, R.F.; Gu, G.; Hong, Y.; Bowman, K.P.; Stocker, E.F. The TRMM Multisatellite Precipitation Analysis (TMPA): Quasi-Global, Multiyear, Combined-Sensor Precipitation Estimates at Fine Scales. J. Hydrometeorol. 2007, 8, 38–55. [Google Scholar] [CrossRef]
- Hsu, K.-L.; Gao, X.; Sorooshian, S.; Gupta, H.V. Precipitation Estimation from Remotely Sensed Information Using Artificial Neural Networks. J. Appl. Meteorol. Climatol. 1997, 36, 1176–1190. [Google Scholar] [CrossRef]
- Habib, E.; Haile, A.T.; Sazib, N.; Zhang, Y.; Rientjes, T. Effect of Bias Correction of Satellite-Rainfall Estimates on Runoff Simulations at the Source of the Upper Blue Nile. Remote Sens. 2014, 6, 6688–6708. [Google Scholar] [CrossRef]
- Chen, S.; Xiong, L.; Ma, Q.; Kim, J.-S.; Chen, J.; Xu, C.-Y. Improving daily spatial precipitation estimates by merging gauge observation with multiple satellite-based precipitation products based on the geographically weighted ridge regression method. J. Hydrol. 2020, 589, 125156. [Google Scholar] [CrossRef]
- Katiraie-Boroujerdy, P.-S.; Rahnamay Naeini, M.; Akbari Asanjan, A.; Chavoshian, A.; Hsu, K.-L.; Sorooshian, S. Bias Correction of Satellite-Based Precipitation Estimations Using Quantile Mapping Approach in Different Climate Regions of Iran. Remote Sens. 2020, 12, 2102. [Google Scholar] [CrossRef]
- Ajaaj, A.A.; Mishra, A.K.; Khan, A.A. Comparison of BIAS correction techniques for GPCC rainfall data in semi-arid climate. Stoch. Environ. Res. Risk Assess. 2016, 30, 1659–1675. [Google Scholar] [CrossRef]
- Fang, G.H.; Yang, J.; Chen, Y.N.; Zammit, C. Comparing bias correction methods in downscaling meteorological variables for a hydrologic impact study in an arid area in China. Hydrol. Earth Syst. Sci. 2015, 19, 2547–2559. [Google Scholar] [CrossRef] [Green Version]
- Gumindoga, W.; Rientjes, T.H.M.; Haile, A.T.; Makurira, H.; Reggiani, P. Performance of bias-correction schemes for CMORPH rainfall estimates in the Zambezi River basin. Hydrol. Earth Syst. Sci. 2019, 23, 2915–2938. [Google Scholar] [CrossRef] [Green Version]
- Mendez, M.; Maathuis, B.; Hein-Griggs, D.; Alvarado-Gamboa, L.-F. Performance Evaluation of Bias Correction Methods for Climate Change Monthly Precipitation Projections over Costa Rica. Water 2020, 12, 482. [Google Scholar] [CrossRef] [Green Version]
- Ji, X.; Li, Y.; Luo, X.; He, D.; Guo, R.; Wang, J.; Bai, Y.; Yue, C.; Liu, C. Evaluation of bias correction methods for APHRODITE data to improve hydrologic simulation in a large Himalayan basin. Atmos. Res. 2020, 242, 104964. [Google Scholar] [CrossRef]
- Ho, H.V.; Nguyen, D.H.; Le, X.-H.; Lee, G. Multi-step-ahead water level forecasting for operating sluice gates in Hai Duong, Vietnam. Environ. Monit. Assess. 2022, 194, 442. [Google Scholar] [CrossRef]
- Yang, X.; Yang, S.; Tan, M.L.; Pan, H.; Zhang, H.; Wang, G.; He, R.; Wang, Z. Correcting the bias of daily satellite precipitation estimates in tropical regions using deep neural network. J. Hydrol. 2022, 608, 127656. [Google Scholar] [CrossRef]
- Tao, Y.; Gao, X.; Hsu, K.; Sorooshian, S.; Ihler, A. A Deep Neural Network Modeling Framework to Reduce Bias in Satellite Precipitation Products. J. Hydrometeorol. 2016, 17, 931–945. [Google Scholar] [CrossRef]
- MRC. Summary State of the Basin Report 2018; Mekong River Commission: Vientiane, Laos, 2020. [Google Scholar]
- Irannezhad, M.; Liu, J. Evaluation of six gauge-based gridded climate products for analyzing long-term historical precipitation patterns across the Lancang-Mekong River Basin. Geogr. Sustain. 2022, 3, 85–103. [Google Scholar] [CrossRef]
- Tian, W.; Liu, X.; Wang, K.; Bai, P.; Liang, K.; Liu, C. Evaluation of six precipitation products in the Mekong River Basin. Atmos. Res. 2021, 255, 105539. [Google Scholar] [CrossRef]
- Chen, A.; Chen, D.; Azorin-Molina, C. Assessing reliability of precipitation data over the Mekong River Basin: A comparison of ground-based, satellite, and reanalysis datasets. Int. J. Climatol. 2018, 38, 4314–4334. [Google Scholar] [CrossRef]
- Yatagai, A.; Kamiguchi, K.; Arakawa, O.; Hamada, A.; Yasutomi, N.; Kitoh, A. APHRODITE: Constructing a Long-Term Daily Gridded Precipitation Dataset for Asia Based on a Dense Network of Rain Gauges. Bull. Am. Meteorol. Soc. 2012, 93, 1401–1415. [Google Scholar] [CrossRef]
- Goodfellow, I.; Bengio, Y.; Courville, A. Deep Learning; MIT Press: Cambridge, MA, USA, 2016. [Google Scholar]
- Zhang, A.; Lipton, Z.C.; Li, M.; Smola, A.J. Dive into Deep Learning. arXiv 2021, arXiv:2106.11342. [Google Scholar]
- Le, X.H.; Nguyen, D.H.; Jung, S.; Yeon, M.; Lee, G. Comparison of Deep Learning Techniques for River Streamflow Forecasting. IEEE Access 2021, 9, 71805–71820. [Google Scholar] [CrossRef]
- Ronneberger, O.; Fischer, P.; Brox, T. U-Net: Convolutional Networks for Biomedical Image Segmentation. arXiv 2015, arXiv:1505.04597. [Google Scholar]
- Shi, X.; Chen, Z.; Wang, H.; Yeung, D.-Y.; Wong, W.-K.; Woo, W.-C. Convolutional LSTM Network: A Machine Learning Approach for Precipitation Nowcasting. arXiv 2015, arXiv:1506.04214. [Google Scholar]
- Tuyen, D.N.; Tuan, T.M.; Le, X.H.; Tung, N.T.; Chau, T.K.; Van Hai, P.; Gerogiannis, V.C.; Son, L.H. RainPredRNN: A New Approach for Precipitation Nowcasting with Weather Radar Echo Images Based on Deep Learning. Axioms 2022, 11, 107. [Google Scholar] [CrossRef]
- MRC. Annual Mekong Flood Report 2014; Mekong River Commission: Vientiane, Laos, 2015; p. 70. Available online: http://www.mrcmekong.org/publications/reports/basin-reports/ (accessed on 20 January 2021).
- MRC. Overview of the Hydrology of the Mekong Basin; Mekong River Commission: Vientiane, Laos, 2005; p. 73. [Google Scholar]
- Adamson, P.T.; Rutherfurd, I.D.; Peel, M.C.; Conlan, I.A. Chapter 4—The Hydrology of the Mekong River. In The Mekong; Campbell, I.C., Ed.; Academic Press: San Diego, CA, USA, 2009; pp. 53–76. [Google Scholar] [CrossRef]
- Ashouri, H.; Nguyen, P.; Thorstensen, A.; Hsu, K.-L.; Sorooshian, S.; Braithwaite, D. Assessing the Efficacy of High-Resolution Satellite-Based PERSIANN-CDR Precipitation Product in Simulating Streamflow. J. Hydrometeorol. 2016, 17, 2061–2076. [Google Scholar] [CrossRef]
- Nguyen, P.; Shearer, E.J.; Tran, H.; Ombadi, M.; Hayatbini, N.; Palacios, T.; Huynh, P.; Braithwaite, D.; Updegraff, G.; Hsu, K.; et al. The CHRS Data Portal, an easily accessible public repository for PERSIANN global satellite precipitation data. Sci. Data 2019, 6, 180296. [Google Scholar] [CrossRef] [PubMed] [Green Version]
- Islam, M.A.; Yu, B.; Cartwright, N. Assessment and comparison of five satellite precipitation products in Australia. J. Hydrol. 2020, 590, 125474. [Google Scholar] [CrossRef]
- Araujo Palharini, R.S.; Vila, D.A.; Rodrigues, D.T.; Palharini, R.C.; Mattos, E.V.; Pedra, G.U. Assessment of extreme rainfall estimates from satellite-based: Regional analysis. Remote Sens. Appl. Soc. Environ. 2021, 23, 100603. [Google Scholar] [CrossRef]
- Brasil Neto, R.M.; Santos, C.A.G.; da Costa Silva, J.F.C.B.; da Silva, R.M.; dos Santos, C.A.C.; Mishra, M. Evaluation of the TRMM product for monitoring drought over Paraíba State, northeastern Brazil: A trend analysis. Sci. Rep. 2021, 11, 1097. [Google Scholar] [CrossRef] [PubMed]
- Vu, T.T.; Li, L.; Jun, K.S. Evaluation of Multi-Satellite Precipitation Products for Streamflow Simulations: A Case Study for the Han River Basin in the Korean Peninsula, East Asia. Water 2018, 10, 642. [Google Scholar] [CrossRef] [Green Version]
- Try, S.; Tanaka, S.; Tanaka, K.; Sayama, T.; Oeurng, C.; Uk, S.; Takara, K.; Hu, M.; Han, D. Comparison of gridded precipitation datasets for rainfall-runoff and inundation modeling in the Mekong River Basin. PLoS ONE 2020, 15, e0226814. [Google Scholar] [CrossRef] [Green Version]
- Yatagai, A.; Arakawa, O.; Kamiguchi, K.; Kawamoto, H.; Nodzu, M.I.; Hamada, A. A 44-Year Daily Gridded Precipitation Dataset for Asia Based on a Dense Network of Rain Gauges. SOLA 2009, 5, 137–140. [Google Scholar] [CrossRef] [Green Version]
- Kamiguchi, K.; Arakawa, O.; Kitoh, A.; Yatagai, A.; Hamada, A.; Yasutomi, N. Development of APHRO_JP, the first Japanese high-resolution daily precipitation product for more than 100 years. Hydrol. Res. Lett. 2010, 4, 60–64. [Google Scholar] [CrossRef] [Green Version]
- Dangol, S.; Talchabhadel, R.; Pandey, V.P. Performance evaluation and bias correction of gridded precipitation products over Arun River Basin in Nepal for hydrological applications. Theor. Appl. Climatol. 2022, 148, 1353–1372. [Google Scholar] [CrossRef]
- Try, S.; Lee, G.; Yu, W.; Oeurng, C.; Jang, C. Large-Scale Flood-Inundation Modeling in the Mekong River Basin. J. Hydrol. Eng. 2018, 23, 05018011. [Google Scholar] [CrossRef]
- Dandridge, C.; Lakshmi, V.; Bolten, J.; Srinivasan, R. Evaluation of Satellite-Based Rainfall Estimates in the Lower Mekong River Basin (Southeast Asia). Remote Sens. 2019, 11, 2709. [Google Scholar] [CrossRef] [Green Version]
- Hubens, N. Deep Inside: Autoencoders. Available online: https://towardsdatascience.com/deep-inside-autoencoders-7e41f319999f (accessed on 20 January 2021).
- Chollet, F. Building Autoencoders in Keras. Available online: https://blog.keras.io/building-autoencoders-in-keras.html (accessed on 6 June 2022).
- Karpathy, A. CS231n: Convolutional Neural Networks for Visual Recognition. Available online: http://cs231n.github.io/convolutional-networks/ (accessed on 10 September 2021).
- Szegedy, C.; Liu, W.; Jia, Y.; Sermanet, P.; Reed, S.; Anguelov, D.; Erhan, D.; Vanhoucke, V.; Rabinovich, A. Going Deeper with Convolutions. arXiv 2014, arXiv:1409.4842. [Google Scholar] [CrossRef]
- Rosebrock, A. Keras Conv2D and Convolutional Layers. Available online: https://www.pyimagesearch.com/2018/12/31/keras-conv2d-and-convolutional-layers/ (accessed on 1 March 2022).
- Brownlee, J. A Gentle Introduction to Pooling Layers for Convolutional Neural Networks. Available online: https://machinelearningmastery.com/pooling-layers-for-convolutional-neural-networks/ (accessed on 15 January 2020).
- Le, X.H.; Ho, H.V.; Lee, G.; Jung, S. Application of Long Short-Term Memory (LSTM) Neural Network for Flood Forecasting. Water 2019, 11, 1387. [Google Scholar] [CrossRef] [Green Version]
- Le, X.-H.; Nguyen Van, L.; Duc Hai, N.; Nguyen, G.V.; Jung, S.; Lee, G. Comparison of bias-corrected multisatellite precipitation products by deep learning framework. Int. J. Appl. Earth Obs. Geoinf. 2023, 116, 103177. [Google Scholar] [CrossRef]
- Kingma, D.P.; Ba, J. Adam: A method for stochastic optimization. arXiv 2014, arXiv:1412.6980. [Google Scholar]
- Ruder, S. An Overview of Gradient Descent Optimization Algorithms. Available online: https://ruder.io/optimizing-gradient-descent/ (accessed on 6 June 2020).
- Srivastava, N.; Hinton, G.; Krizhevsky, A.; Sutskever, I.; Salakhutdinov, R. Dropout: A simple way to prevent neural networks from overfitting. J. Mach. Learn. Res. 2014, 15, 1929–1958. [Google Scholar] [CrossRef]


| Purpose | Year | CDR (mm/Year) | TRMM (mm/Year) | APHRODITE (mm/Year) | CAE_CDR (mm/Year) | CAE_TRMM (mm/Year) |
|---|---|---|---|---|---|---|
| Testing | 2014 | 1661 | 1540 | 1086 | 1125 | 1121 |
| 2015 | 1498 | 1402 | 1050 | 1095 | 1058 | |
| Average precipitation | 1579 | 1471 | 1068 | 1110 | 1090 | |
| Compared with APHRODITE | Period | MAD (mm/Month) | RMSD (mm/Month) | NSE |
|---|---|---|---|---|
| CDR | Jan 2014–Dec 2015 | 43.2 | 54.1 | 0.61 |
| TRMM | Jan 2014–Dec 2015 | 34.0 | 45.6 | 0.74 |
| CAE_CDR | Jan 2014–Dec 2015 | 12.4 | 19.0 | 0.97 |
| CAE_TRMM | Jan 2014–Dec 2015 | 8.7 | 12.7 | 0.99 |
| Year | Compared with APHRODITE | RMSD (mm/Year) | MAD (mm/Year) | Bias (mm/Year) | Spatial Correlation |
|---|---|---|---|---|---|
| 2014 | CDR | 690 | 582 | 574 | 0.61 |
| TRMM | 594 | 461 | 453 | 0.74 | |
| CAE_CDR | 174 | 134 | 39 | 0.91 | |
| CAE_TRMM | 177 | 137 | 35 | 0.91 | |
| 2015 | CDR | 561 | 480 | 448 | 0.63 |
| TRMM | 450 | 366 | 352 | 0.81 | |
| CAE_CDR | 236 | 186 | 46 | 0.84 | |
| CAE_TRMM | 210 | 166 | 8 | 0.86 |
| Year | Season | Compared with APHRODITE | RMSD (mm/Year) | MAD (mm/Year) | Bias (mm/Year) | Spatial Correlation |
|---|---|---|---|---|---|---|
| 2014 | Dry | CDR | 115 | 156 | 104 | 0.70 |
| TRMM | 65 | 100 | 58 | 0.78 | ||
| CAE_CDR | 40 | 52 | −7 | 0.86 | ||
| CAE_TRMM | 39 | 48 | 14 | 0.89 | ||
| Wet | CDR | 488 | 574 | 474 | 0.60 | |
| TRMM | 406 | 520 | 400 | 0.78 | ||
| CAE_CDR | 122 | 154 | 45 | 0.93 | ||
| CAE_TRMM | 113 | 151 | 22 | 0.92 | ||
| 2015 | Dry | CDR | 108 | 128 | 81 | 0.67 |
| TRMM | 75 | 97 | 61 | 0.82 | ||
| CAE_CDR | 60 | 80 | −27 | 0.79 | ||
| CAE_TRMM | 49 | 62 | −15 | 0.88 | ||
| Wet | CDR | 396 | 458 | 370 | 0.62 | |
| TRMM | 304 | 378 | 296 | 0.82 | ||
| CAE_CDR | 149 | 193 | 74 | 0.85 | ||
| CAE_TRMM | 129 | 170 | 23 | 0.87 |
Disclaimer/Publisher’s Note: The statements, opinions and data contained in all publications are solely those of the individual author(s) and contributor(s) and not of MDPI and/or the editor(s). MDPI and/or the editor(s) disclaim responsibility for any injury to people or property resulting from any ideas, methods, instructions or products referred to in the content. |
© 2023 by the authors. Licensee MDPI, Basel, Switzerland. This article is an open access article distributed under the terms and conditions of the Creative Commons Attribution (CC BY) license (https://creativecommons.org/licenses/by/4.0/).
Share and Cite
Lee, G.; Nguyen, D.H.; Le, X.-H. A Novel Framework for Correcting Satellite-Based Precipitation Products for Watersheds with Discontinuous Observed Data, Case Study in Mekong River Basin. Remote Sens. 2023, 15, 630. https://doi.org/10.3390/rs15030630
Lee G, Nguyen DH, Le X-H. A Novel Framework for Correcting Satellite-Based Precipitation Products for Watersheds with Discontinuous Observed Data, Case Study in Mekong River Basin. Remote Sensing. 2023; 15(3):630. https://doi.org/10.3390/rs15030630
Chicago/Turabian StyleLee, Giha, Duc Hai Nguyen, and Xuan-Hien Le. 2023. "A Novel Framework for Correcting Satellite-Based Precipitation Products for Watersheds with Discontinuous Observed Data, Case Study in Mekong River Basin" Remote Sensing 15, no. 3: 630. https://doi.org/10.3390/rs15030630