Article

Analysis of Spatiotemporal Variations and Influencing Factors of Sea Ice Extent in the Arctic and Antarctic

1
Key Laboratory of Research on Marine Hazards Forecasting, National Marine Environmental Forecasting Center, Beijing 100081, China
2
Aerospace Information Research Institute, Chinese Academy of Sciences, Beijing 100101, China
3
Ocean and Spatial Information College, China University of Petroleum, Qingdao 266000, China
*
Author to whom correspondence should be addressed.
Remote Sens. 2023, 15(23), 5563; https://doi.org/10.3390/rs15235563
Submission received: 25 September 2023 / Revised: 7 November 2023 / Accepted: 8 November 2023 / Published: 29 November 2023
(This article belongs to the Special Issue GIS and Remote Sensing in Ocean and Coastal Ecology)

Abstract

:
The 44 years (1979–2022) of satellite-derived sea ice extent in the Arctic and Antarctic reveals the details and new trends in the process of polar sea ice coverage changes. The speed of Arctic sea ice extent reduction and the interannual difference significantly increased after 2004. Trend analysis suggests that the Arctic Ocean may experience an ice-free period around 2060. The maximum anomaly of Arctic sea ice extent has gradually transitioned from September to October, indicating a trend of prolonged melting period. The center of gravity of sea ice in the Arctic Ocean is biased towards the Pacific side, and the spatial distribution pattern of sea ice is greatly influenced by the Atlantic warm current. The dynamism of the sea ice extent on the Atlantic side is significantly greater than in other regions. Since 2014, the Antarctic sea ice extent has shifted from slow growth to a rapid decreasing trend; the sea ice extent reached a historical minimum in 2022, decreasing by 2.02 × 10⁶ km2 compared to 2014. The Antarctic experiences seven months of ice growth each year and five months of ice melting period, the annual change patterns of sea ice extent in the Arctic and Antarctic are slightly different.

1. Introduction

The Antarctic and Arctic, acting as crucial components of the Earth’s climate system, possess significant influence over not only their respective polar climates and ecosystems [1,2], but also on regions as far-reaching as the lower latitudes [3,4,5,6]. Relative to the Arctic, the Antarctic, situated in the less anthropogenically impacted Southern Hemisphere, seems to respond more sluggishly to global climate change effects. Up until 2015, the Antarctic sea ice extent was on an upward trend, which, post-2015, transitioned into a steady decline [7,8,9,10,11,12,13,14,15,16,17,18,19]. In stark contrast, the Arctic, located in the densely populated Northern Hemisphere, has borne the brunt of significant human-induced impacts. Amid the backdrop of global climate change, the Arctic has been identified as the region sustaining the most pronounced temperature increases, accompanied by a considerable annual decrease in sea ice volume [20,21,22,23,24,25,26]. Particularly noteworthy is the accelerating decline in Arctic sea ice extent during the Northern Hemisphere’s summer and autumn, characterized by an extended melting period and diminishing long-term ice coverage [23,27].
Climate models from the Intergovernmental Panel on Climate Change (IPCC) predict that Arctic sea ice will vanish completely during the summer season by mid-century [28,29]. The decline of Arctic sea ice is attributed to numerous factors, including the greenhouse effect, atmospheric circulation, inter-ocean heat transport, and solar radiation.
While the diminishing of Arctic sea ice may unlock potential for resource extraction and shipping route development, it equally poses significant adverse effects. These impacts span from the Arctic’s ecological environment to the global ocean, atmospheric circulation patterns, and even global weather and climate patterns [30,31,32,33,34,35,36,37]. In recent times, the reduction of polar sea ice has manifested feedback effects on the global climate, exerting direct or indirect negative impacts on various aspects of China’s climate and weather [38,39,40]. In this study, we leveraged long-term time series of remote sensing and meteorological observational data to scrutinize the spatial and temporal distribution of sea ice extent in the Arctic and Antarctic, investigate alteration patterns, and project future trends. The data employed in this study boasts of an extensive time period and robust timeliness. Our research methods and results reflect a certain degree of innovativeness, featuring statistical and regression analysis, as well as spatiotemporal and modeling analysis. This study not only unveils new discoveries but also corroborates previous findings.

2. Study Area, Data and Methods

The polar regions, situated at the extremities of the Earth’s rotational axis, represent the largest sources of cold within the Earth’s system. The Antarctic continent, enveloped by a sprawling ice sheet of an average thickness exceeding 2000 m, is encircled by the Pacific, Atlantic, and Indian Oceans. With a climate that leans towards the colder side, its sea ice extent during the winter months reaches close to 20 × 106 km2. The Arctic, by contrast, primarily comprises of the Arctic Ocean along with adjacent land and islands (Figure 1). The Arctic region is characterized by a chilling climate, with the Arctic Ocean being swathed in sea ice all year round. It is hemmed in by permafrost regions in northern Asia, Europe, and North America, amassing a total area of 21 × 106 km2.
The sea ice extent data utilized in this investigation are monthly mean passive microwave radiometer data sets, provided by the Institute of Environmental Physics (IUP), University of Bremen and the Alfred Wegener Institute, Helmholtz Centre for Polar and Marine Research (AWI). These data, sourced from various satellite sensors using diverse sea ice concentration retrieval algorithms, define the boundary of sea ice extent at a 15% concentration threshold. Covering all sea ice regions in both poles, these data span from 1979 to the present. As shown in Table 1, different satellite sensors were used over different time periods. To smoothly integrate new data sources, linear transformations were implemented to match the mean and standard deviation of the new data source with the overlapping period of the old data source [34,41]. The temperature data utilized in this study were sourced from the National Centers for Environmental Information (NCEI) and the British Antarctic Survey (BAS), which offer meteorological station observation data that align with the time range of the sea ice extent data.
This study primarily employs methodologies, such as trend analysis, zonal statistics analysis, anomaly analysis, correlation analysis, spatial overlay analysis, and model evaluation analysis, to discern the spatiotemporal distribution characteristics and future evolution trends of the extent of sea ice at both poles. The specific technical route is depicted in Figure 2. The trend analysis primarily uses polynomials to simulate the long-standing trend of sea ice extent data, thereby determining the future progression trend of sea ice extent. The spatial analysis chiefly uses rasterized data overlays to ascertain the accumulated number of sea ice occurrences at varying spatial grid points. The correlation analysis aims to analyze the relationship between sea ice extent data and temperature data, resulting in a correlation coefficient. The modeling analysis evaluates the dynamism of sea ice extent by calculating the year-to-year changes in sea ice extent.

3. Data Analysis

3.1. Analysis of the Features of Seasonal Fluctuations in the Extent of Sea Ice in the Arctic and Antarctic

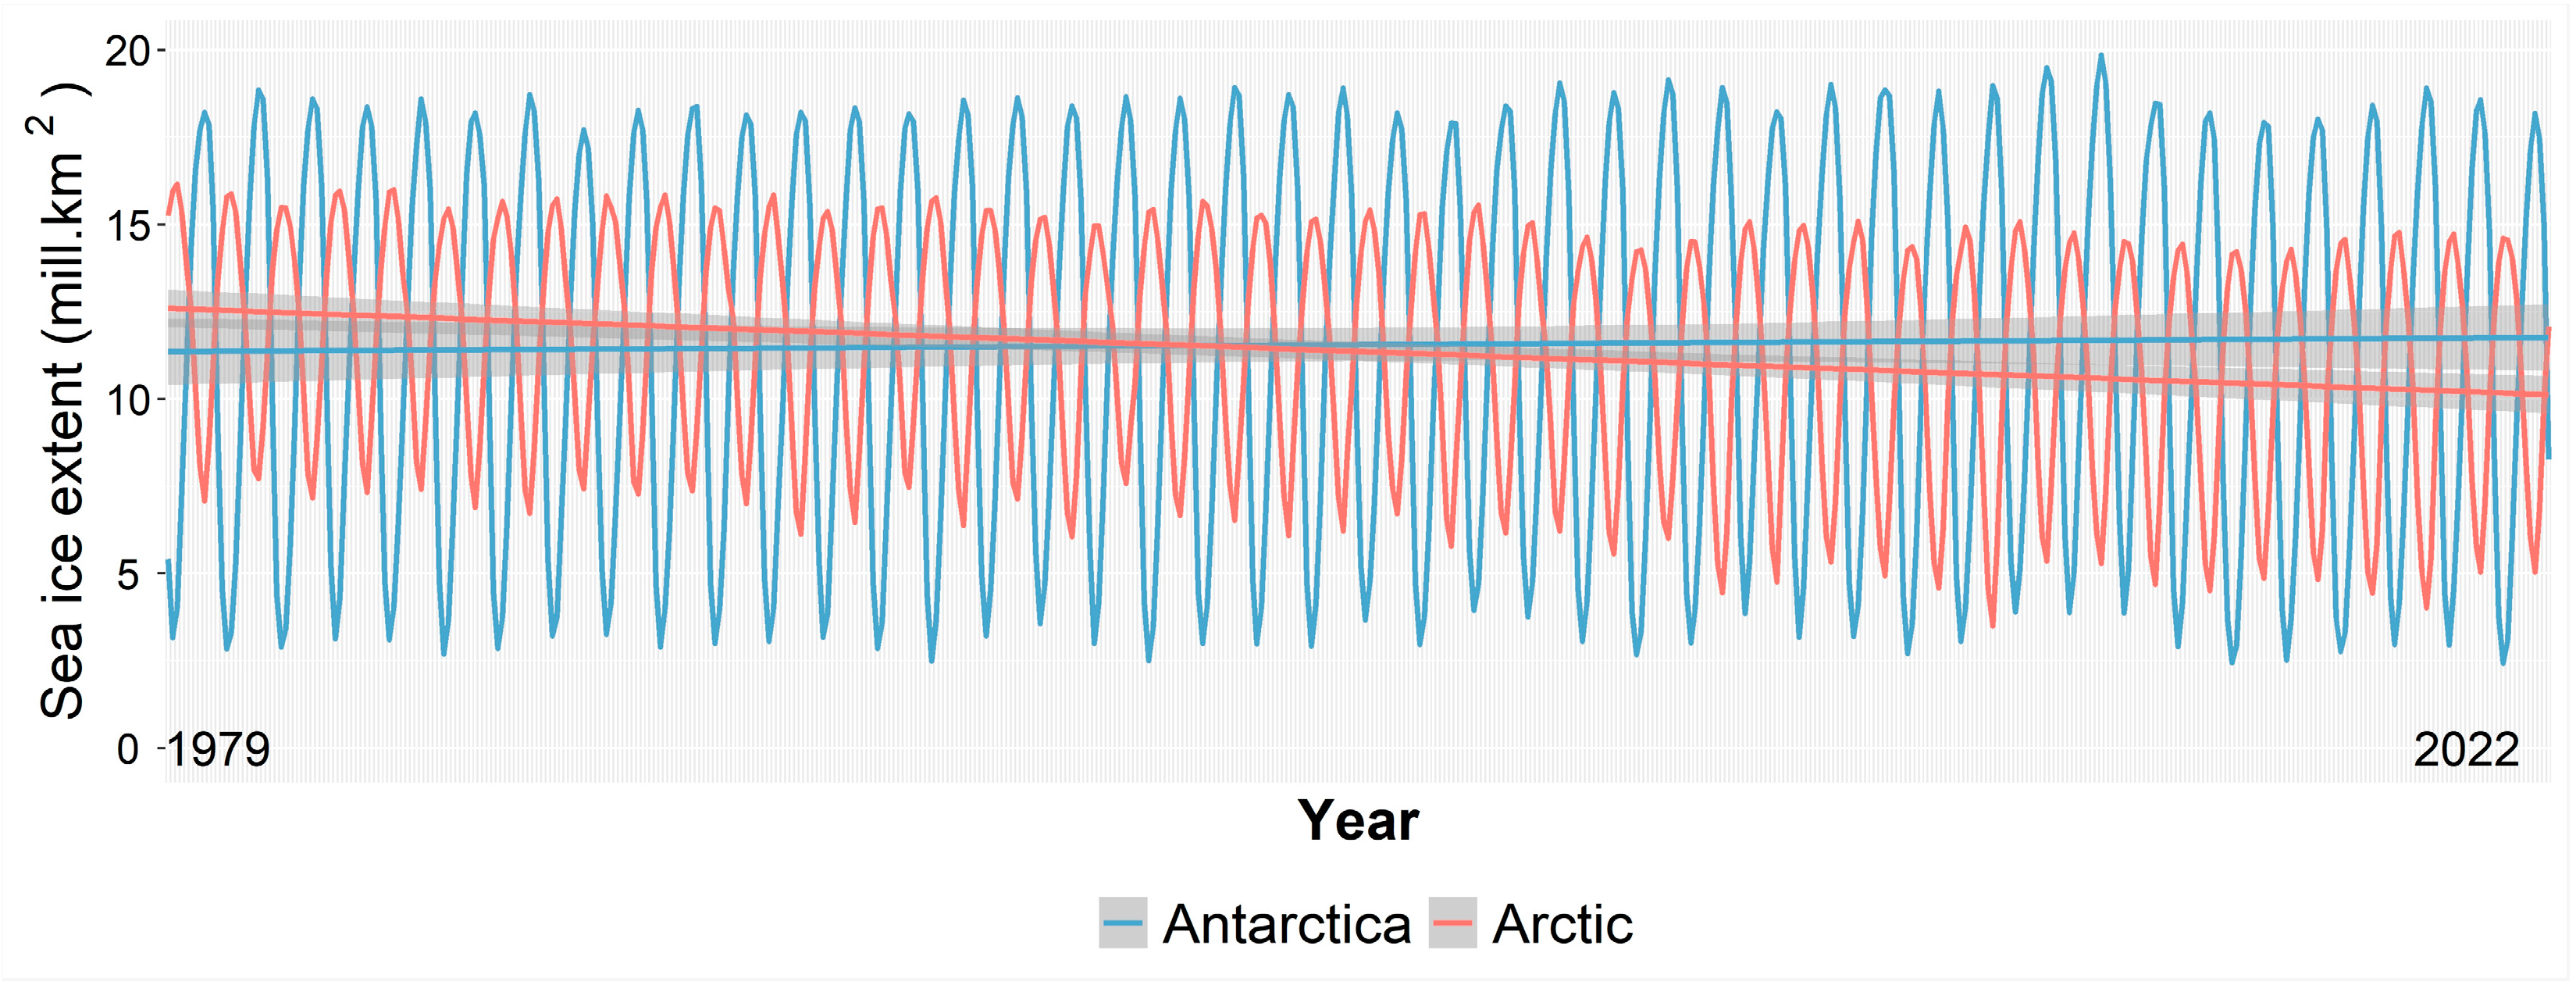
As depicted in Figure 2, the sea ice extent at both the North and South Poles demonstrates periodic fluctuations. Given the alternating seasons at the two poles, the sea ice extent is roughly offset by half a cycle. The Antarctic sea ice extent curve presents larger wave amplitudes and more pronounced seasonal changes compared to the Arctic. Nonetheless, the historical differences in sea ice extent during corresponding periods remain relatively minor. Every September, the Arctic sea ice extent hits its lowest point, while the Antarctic sea ice extent attains its peak. In contrast, the maximum sea ice extent in the Arctic is reached in March, while the Southern Ocean hits its minimum in February. Consequently, the sea ice extent in the Arctic more closely aligns with a sinusoidal wave, whereas the Southern Ocean displays comparatively irregular patterns. The Southern Ocean sea ice extent takes 7 months to transition from a trough to a peak and 5 months to shift from a peak to a trough.
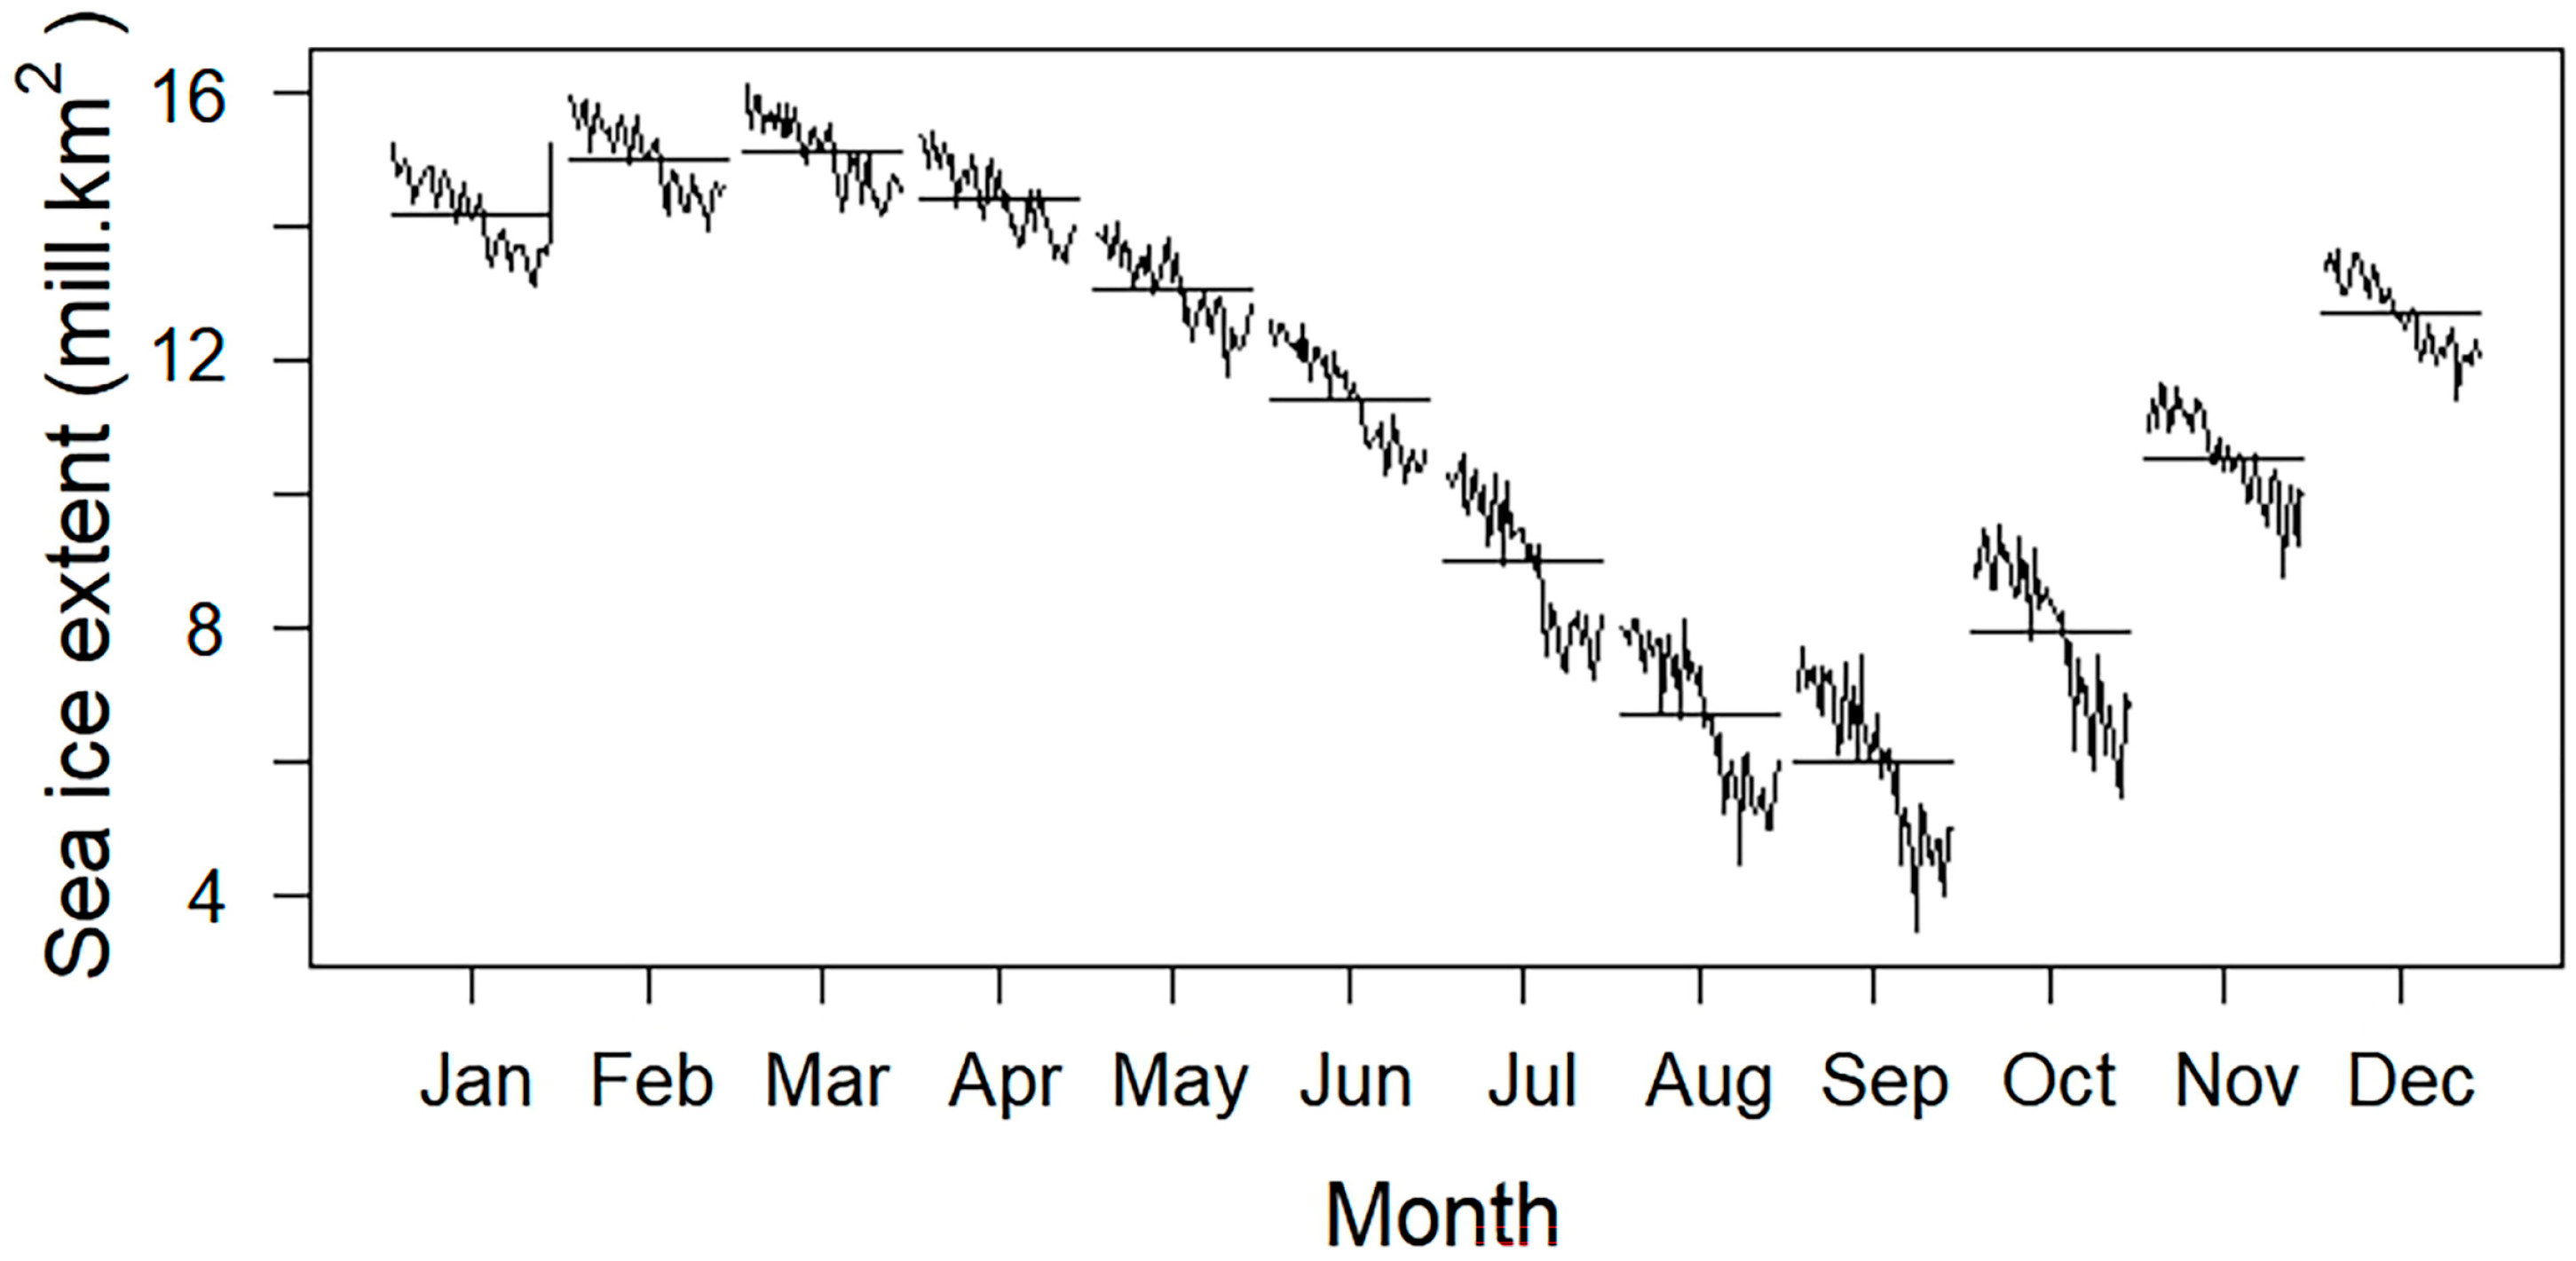
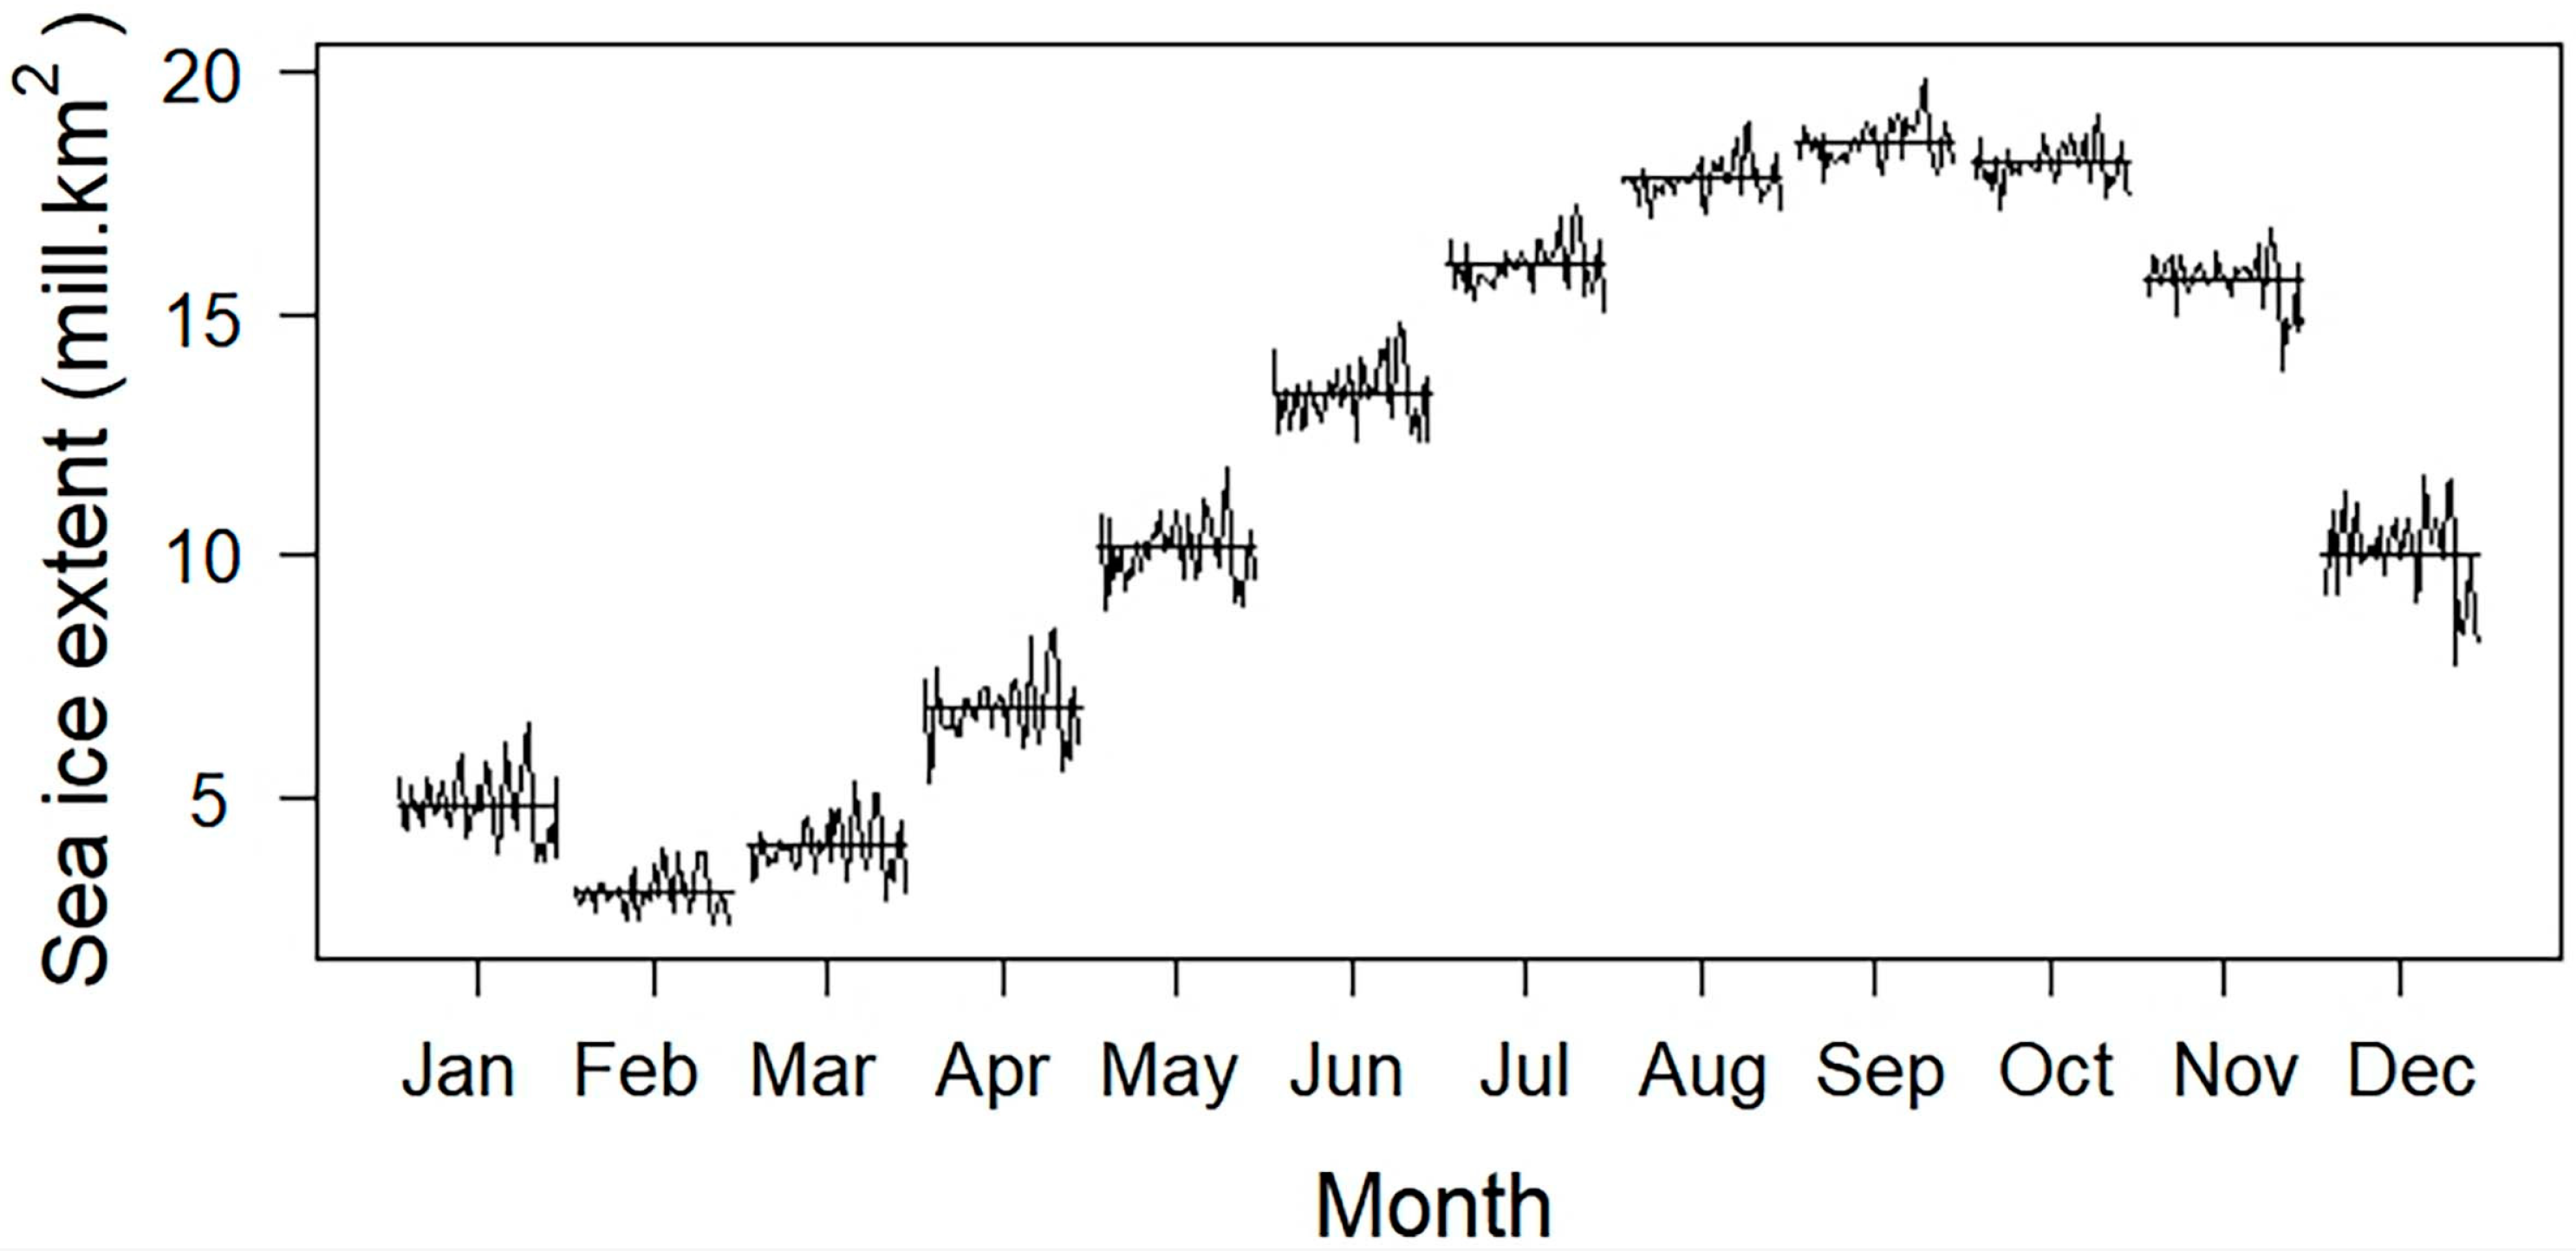
By scrutinizing the 44-year cycle variation graph depicting monthly average values of sea ice extent (Figure 3), it is evident that the Arctic sea ice extent reaches its nadir annually in September. The sequence of months in which the sea ice extent escalates from the smallest to the largest unfolds as follows: September, August, October, July, November, June, December, May, January, April, February, and March. The pattern of seasonal fluctuation of sea ice extent is pronounced, especially from June to December, where the sea ice extent is diminished, and the order remains wholly stable. The average expanse of sea ice in September is merely 6 × 10⁶ km2, with the nadir recorded in 2012 at 3.49 × 10⁶ km2, and the zenith registered in 1980 at 7.71 × 10⁶ km2. Conversely, the peak sea ice extent is witnessed annually in March, with a multi-year average of 15.16 × 10⁶ km2. The trough was observed in 2017 with 14.21 × 10⁶ km2, while the crest was recorded in 1979 with an extent of 16.15 × 10⁶ km2. While the interannual disparities in the extent of sea ice during the identical period are substantial, the pattern of annual sea ice fluctuation remains comparatively consistent. From March to April, the extent of sea ice witnesses a slow reduction, and from April to August, it displays an accelerated downward trend. From August to September, the rate of decline in sea ice extent significantly decelerates, attaining its nadir in September. From September to December, the span of sea ice surges rapidly, and from December to March, it incrementally ascends to its zenith for the year. During the initial phase of the study, there was relatively little variation in the monthly sea ice extent within the same year, indicating a stable pattern. However, a significant shift occurred after 2004, when the extent of sea ice in summer and autumn experienced a sharp decline. This decline led to an increase in the monthly differences in sea ice extent from June to December over time.
It is evident that the maximum extent of sea ice in the Antarctic is observed in September of each year. The order from largest to smallest is as follows: September, October, August, July, November, June, May, December, April, January, March, and February. The seasonal variation in sea ice extent is notably pronounced, with a relatively consistent ranking of the four months with the highest and lowest extents. The long-term average extent in September stands at 18.55 × 10⁶ km2. The largest recorded extent was 19.85 × 10⁶ km2 in 2014, while the smallest extent was observed in 1986 at 17.71 × 10⁶ km2. In contrast, the minimum sea ice extent occurs in February each year, with an average of 3.08 × 10⁶ km2 over multiple years. The smallest extent to date was recorded in 2022, measuring 2.43 × 10⁶ km2. On the other hand, the largest extent was recorded in 2003, reaching 3.95 × 10⁶ km2.
Before the year 2001, the interannual variation in sea ice extent during different periods was less pronounced. However, after 2001, the stability gradually deteriorated. The sea ice extent experiences a gradual increase from February to March each year. From March to August, there is a steady and continuous increase in sea ice extent. The rate of increase slows down significantly from August to September, when the extent reaches its maximum for the year. From September to January, the sea ice extent decreases rapidly, and from January to February, it slowly decreases to its minimum extent for that year. During the early part of the study period, the monthly variation in sea ice extent remained relatively stable, with few significant changes observed between months. Before 2004, the annual average sea ice extent remained around 11 × 106 km2, with the first breakthrough of 12 × 106 km2 occurring in 2004. Between 2004 and 2015, there were a total of seven years with an annual average sea ice extent exceeding 12 × 106 km2. The largest extent was recorded in 2014, reaching 12.72 × 10⁶ km2. Conversely, the past six years have witnessed four years with sea ice extent below 11 × 106 km2. This suggests that the historical pattern of interannual variation in Antarctic sea ice extent has been disrupted, with a clear overall trend towards a decrease in sea ice extent.

3.2. Key Years of Sea Ice Extent Changes and Analysis of Future Trends

3.2.1. Analysis of Key Years in Sea Ice Extent Variation

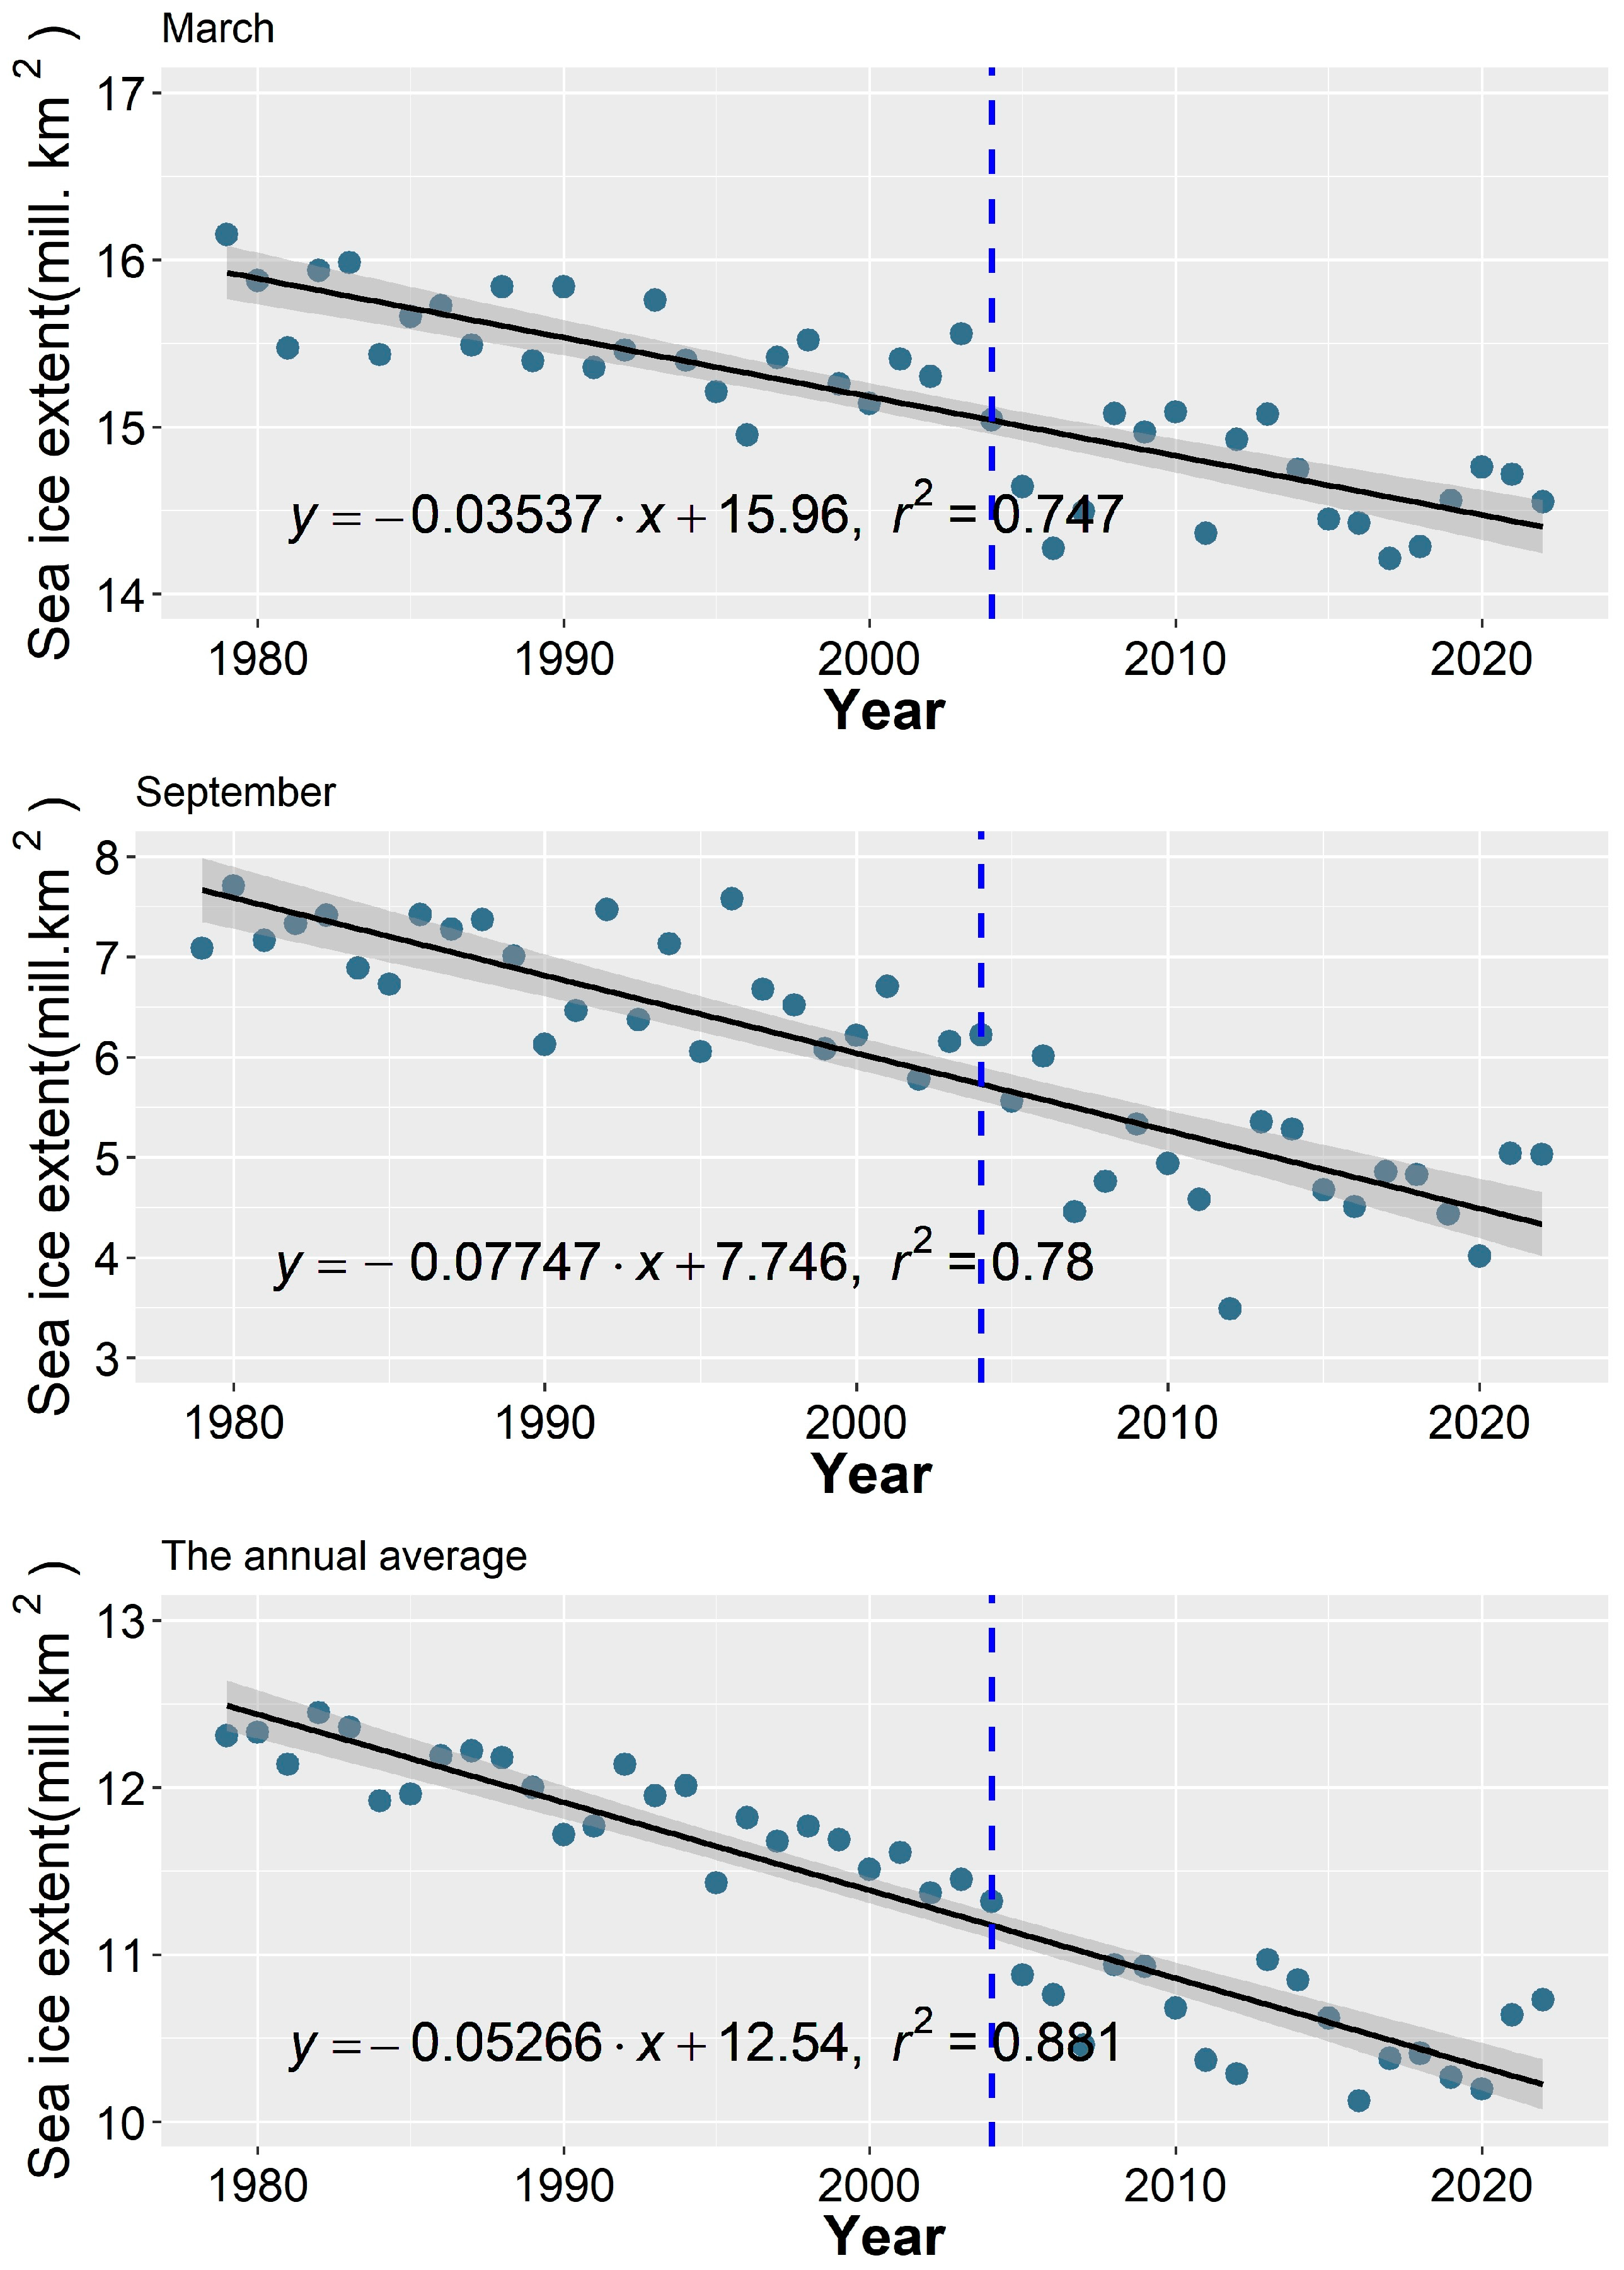
From the trend line (Figure 4), it is clear that the extent of Arctic sea ice has consistently decreased over the years. The relationship between the trend line and the distribution of sea ice points indicates that 2004 marks a significant year of change in sea ice extent. Prior to 2004, there was a slight fluctuation in sea ice extent with an overall decreasing trend. The periods of sea ice increase and decrease were relatively balanced, with an average extent of 11.92 × 10⁶ km2 per year. In March, the average extent was 15.54 × 10⁶ km2, whereas in September, it was 6.83 × 10⁶ km2. After 2004, the annual average sea ice extent decreased to 10.59 × 10⁶ km2, with an average extent of 14.65 × 10⁶ km2 in March and only 4.84 × 10⁶ km2 in September. The difference in average extent between the two periods is 1.33 × 10⁶ km2 annually, with a difference of 0.89 × 10⁶ km2 in March and a significant difference of 1.99 × 10⁶ km2 in September. These findings suggest that there have been drastic changes in sea ice extent between the two periods, particularly during the summer and autumn seasons. After 2004, there has been a noticeable increase in the year-to-year fluctuations of sea ice extent. Additionally, the rate at which the sea ice extent is decreasing has gradually slowed down over this period.
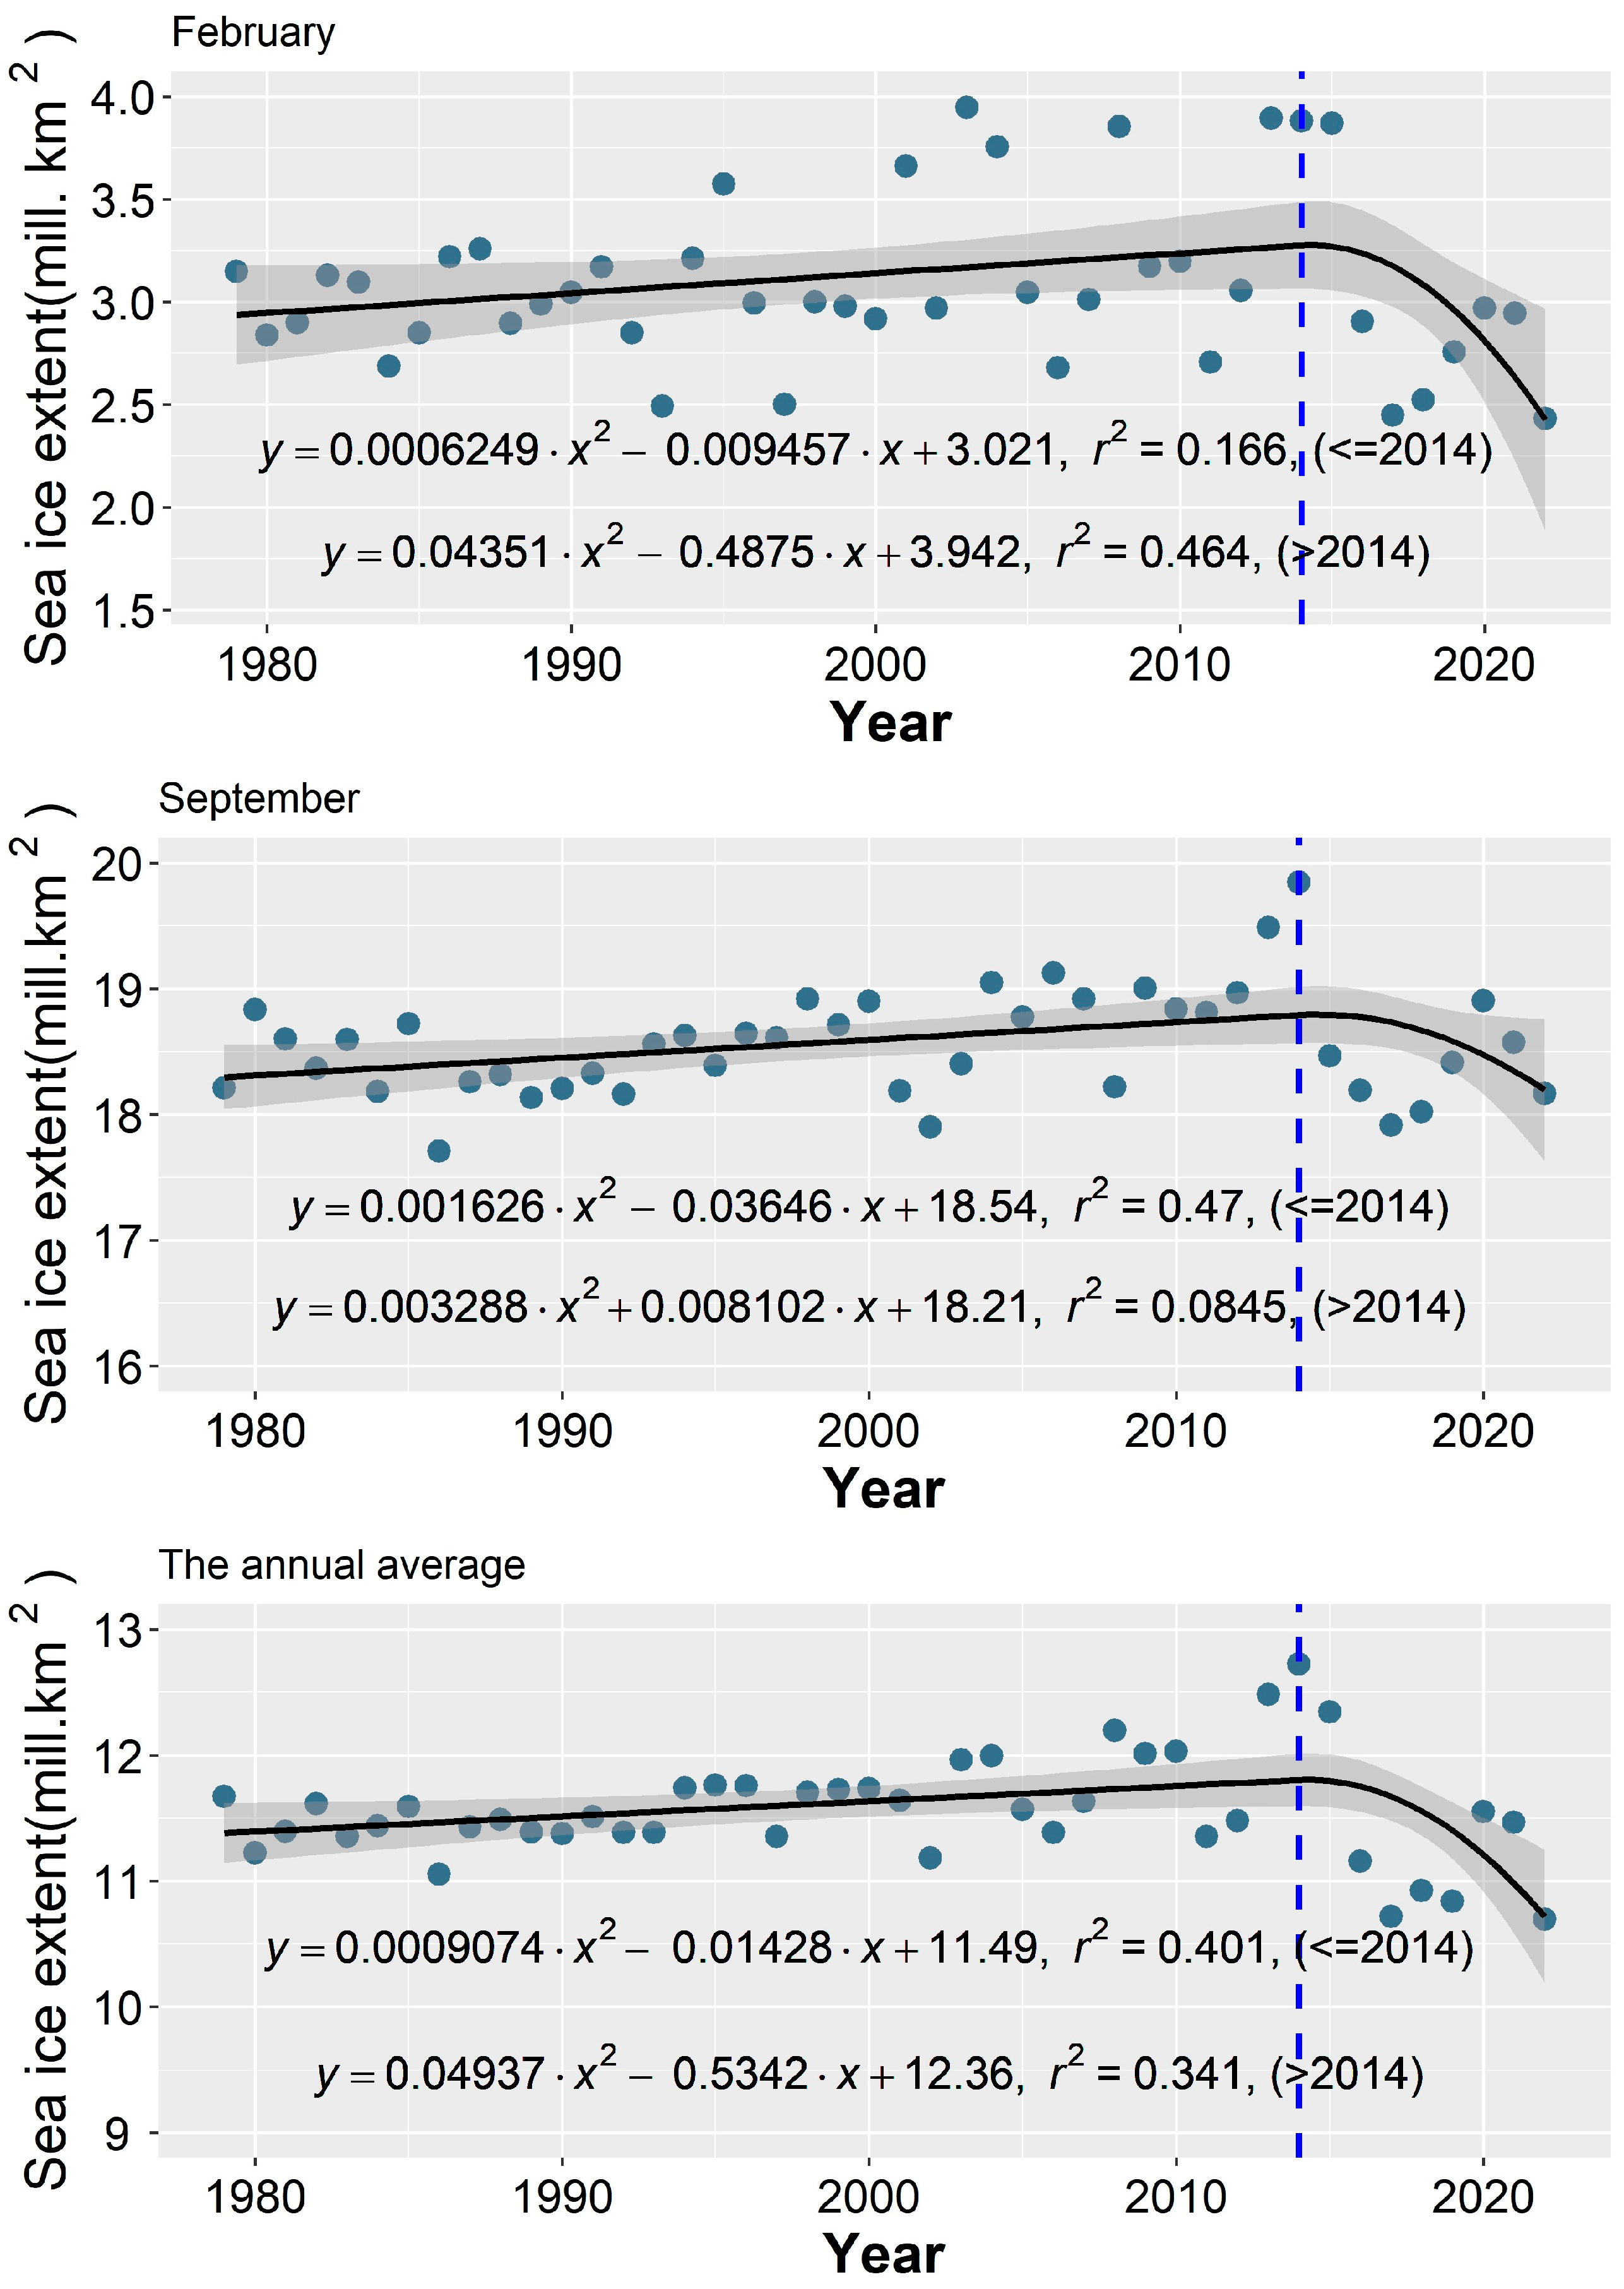
The trend line in Figure 5 clearly demonstrates the changing pattern of Antarctic sea ice extent, with periods of increase followed by periods of decrease. Notably, the years 2001 and 2014 emerge as critical timeframes marked by substantial changes in sea ice extent. Prior to 2001, there was a gradual increasing trend in sea ice extent, accompanied by slight fluctuations. The interannual variability in sea ice extent was relatively minimal, with an average annual extent of 11.51 × 10⁶ km2. The maximum extent of 11.76 × 10⁶ km2 was recorded in 1995, while the minimum extent of 11.05 × 10⁶ km2 was observed in 1986. The difference between the maximum and minimum extents was a mere 0.71 × 10⁶ km2. However, from 2001 to 2014, there was a significant increase and fluctuation in sea ice extent. The minimum extent of sea ice was recorded in 2002, measuring 11.19 × 10⁶ km2. The maximum extent observed during the study period occurred in 2014, measuring 12.72 × 10⁶ km2. The difference between the maximum and minimum extents during this period was 1.53 × 10⁶ km2. Since 2014, there has been a significant decrease in sea ice extent, with the lowest value observed in 2022 during the study period. This decrease amounts to 2.02 × 10⁶ km2 compared to the annual average sea ice extent in 2014. These findings align with the research conclusions of scholars such as Parkinson and Simmonds [42,43,44].

3.2.2. Analysis of Sea Ice Extent Change Trends

Based on Figure 6, it is apparent that there is a noticeable and consistent decline in Arctic sea ice extent over the years, with a relatively steady rate of decrease. In contrast, Antarctic sea ice extent exhibits a slight upward trend over the 44-year period, albeit at a very slow pace. As mentioned previously, there are significant variations in the behavior of Antarctic sea ice extent across different time segments. Hence, it is crucial to analyze it in distinct time intervals for a comprehensive understanding.
Through trend analysis of the Arctic sea ice extent data in Figure 4, it is evident that the most significant reduction in sea ice extent occurs in September during the study period, with an average annual decrease rate of 7.75 × 10⁴ km2 per year. In March, the average annual decrease rate is 3.54 × 10⁴ km2 per year, while the overall annual average decrease rate of sea ice extent is 5.26 × 10⁴ km2 per year. Notably, the trend analysis of the change rate in sea ice extent reveals a gradual slowdown in the rate of decrease. The most pronounced deceleration is observed in March, indicating a trend towards stability in winter sea ice extent. In September, a weak deceleration trend is observed, suggesting that the long-term decrease rate of sea ice extent in September will remain relatively constant.
Trend line analysis was conducted on the sea ice extent in September (Figure 4) to understand the future trajectory. If a linear fit is used, based on the current trend since 1979, it suggests that it would take approximately 100 years, around 2078, for the sea ice to completely disappear. However, a more accurate quadratic polynomial fit was used for trend analysis, which projects that the ice-free state will occur much earlier. It is estimated that it would take around 82 years, around 2060, for the large-scale seasonal ice cover in the Arctic during summer and autumn to disappear. This finding aligns with the beliefs of scholars such as Stroeve JC and Overland JE, who suggest that the Arctic will likely experience an ice-free period in the mid-21st century [29,45].
Through trend line analysis of Antarctic sea ice extent (Figure 5), it was found that prior to 2014, there was a consistent annual increase in sea ice extent for each month. However, after reaching its peak in 2014, there has been a negative trend in sea ice extent for all months. September had the highest overall growth rate, with an annual increase of 0.78 × 10⁶ km2. Before 2014, September had the fastest growth rate, with an annual increase of 2.3 × 10⁶ km2. After 2014, September experienced the slowest decrease in sea ice extent, with a reduction of 0.74 × 10⁶ km2 per year. The overall annual decrease in sea ice extent reached 16.37 × 10⁶ km2. In February, the overall annual growth rate was only 0.14 × 10⁶ km2. Before 2014, the growth rate for February was 1.37 × 10⁶ km2 per year, but after 2014, it decreased to 13.54 × 10⁶ km2 per year. This trend analysis indicates that Antarctic sea ice extent has transitioned from positive growth to negative growth.

3.3. Seasonal Anomaly Analysis of Sea Ice Extent

In this study, an analysis was conducted on the anomaly fluctuations in Arctic sea ice extent. Figure 7 illustrates the gradual increase in these fluctuations, starting from June each year and reaching their peak in September. After September, the fluctuations gradually decrease. From a temporal perspective, the year 2004 marked a significant turning point in the positive and negative anomaly values. Before 2004, positive anomalies were more common, but after that year, negative anomalies became more prevalent. Throughout the study period, there were a total of five months with negative anomalies exceeding 2 × 10⁶ km2. Among these, August, September, and October of 2012 each had one occurrence, while the other two instances were in October of 2019 and 2020. Through rigorous statistical analysis, it has been observed that the maximum anomaly values have gradually shifted from September to October. This shift indicates that the sea ice extent in October has experienced significant changes when compared to historical averages, further exacerbated by the impacts of global climate change. While October traditionally represents a period of sea ice growth, recent years have shown a highly unstable growth rate during this month. In fact, 2018, 2019, and 2020 recorded the slowest-growing October months in history. These substantial shifts in sea ice extent anomalies strongly suggest that the duration of the Arctic sea ice melting season is gradually extending. This implies that the period during which the sea ice melts is becoming longer, which could have significant implications for the Arctic ecosystem and climate patterns.
When examining the Antarctic region, it becomes apparent that there are larger deviations from the average in terms of anomalies (Figure 8). Moreover, there is a clear trend of increasing anomalies from smaller to larger as each season progresses. Among the months of the year, December experiences the highest fluctuations in anomaly values, while February has the lowest. Before 2014, with a few exceptions, the seasonal anomaly index remained within ±1 × 10⁶ km2. However, in 2014, the positive anomaly index reached its peak for every month. Following this, the anomaly index rapidly declined and became predominantly negative. The negative anomaly in December was particularly noteworthy, with December 2016 recording a negative anomaly of −2.26 × 10⁶ km2. This figure represents the lowest negative anomaly index during the study period. These observations suggest that the interannual stability of Antarctic sea ice extent has gradually weakened over time, with increasing variations between years. Additionally, there is a clear negative growth trend in the sea ice extent.

3.4. Patterns of Sea Ice Extent Changes with Temperature

Through a comparative analysis of temperature data from multiple meteorological observation stations and sea ice extent data, it has been found that there is a direct correlation between polar sea ice extent and temperature changes. In the Arctic region, the highest temperatures of the year are primarily observed in July, gradually transitioning into August. Consequently, the minimum extent of Arctic sea ice occurs in September, followed by a gradual decrease in ice extent throughout October. This suggests that the timing of the minimum Arctic sea ice extent is delayed by approximately two months compared to the timing of the highest temperatures of the year. On the other hand, the coldest temperatures in the Arctic typically occur in February and March, and correspondingly, the maximum extent of Arctic sea ice is observed during these months as well. This indicates that the melting process in the Arctic responds rapidly to temperature changes.
On the other hand, in the Antarctic, the lowest temperatures of the year primarily occur in July, while the maximum sea ice extent occurs in September. This indicates a two-month delay between the peak sea ice extent and the coldest temperatures in the Antarctic. Conversely, the highest temperatures in the Antarctic are most common in December and January, while the minimum sea ice extent occurs in February. There is a one-month delay between the minimum sea ice extent and the highest temperatures. This phenomenon is mainly attributed to the fact that the average temperature in the Antarctic is significantly lower than in the Arctic. It takes a longer time for the temperature to rise to the melting point of sea ice, particularly while the sea ice is still growing. Furthermore, the analysis of sea ice extent data and multi-station meteorological observations suggests a strong correlation between the temporal turning point of interannual sea ice extent change and temperature variations.
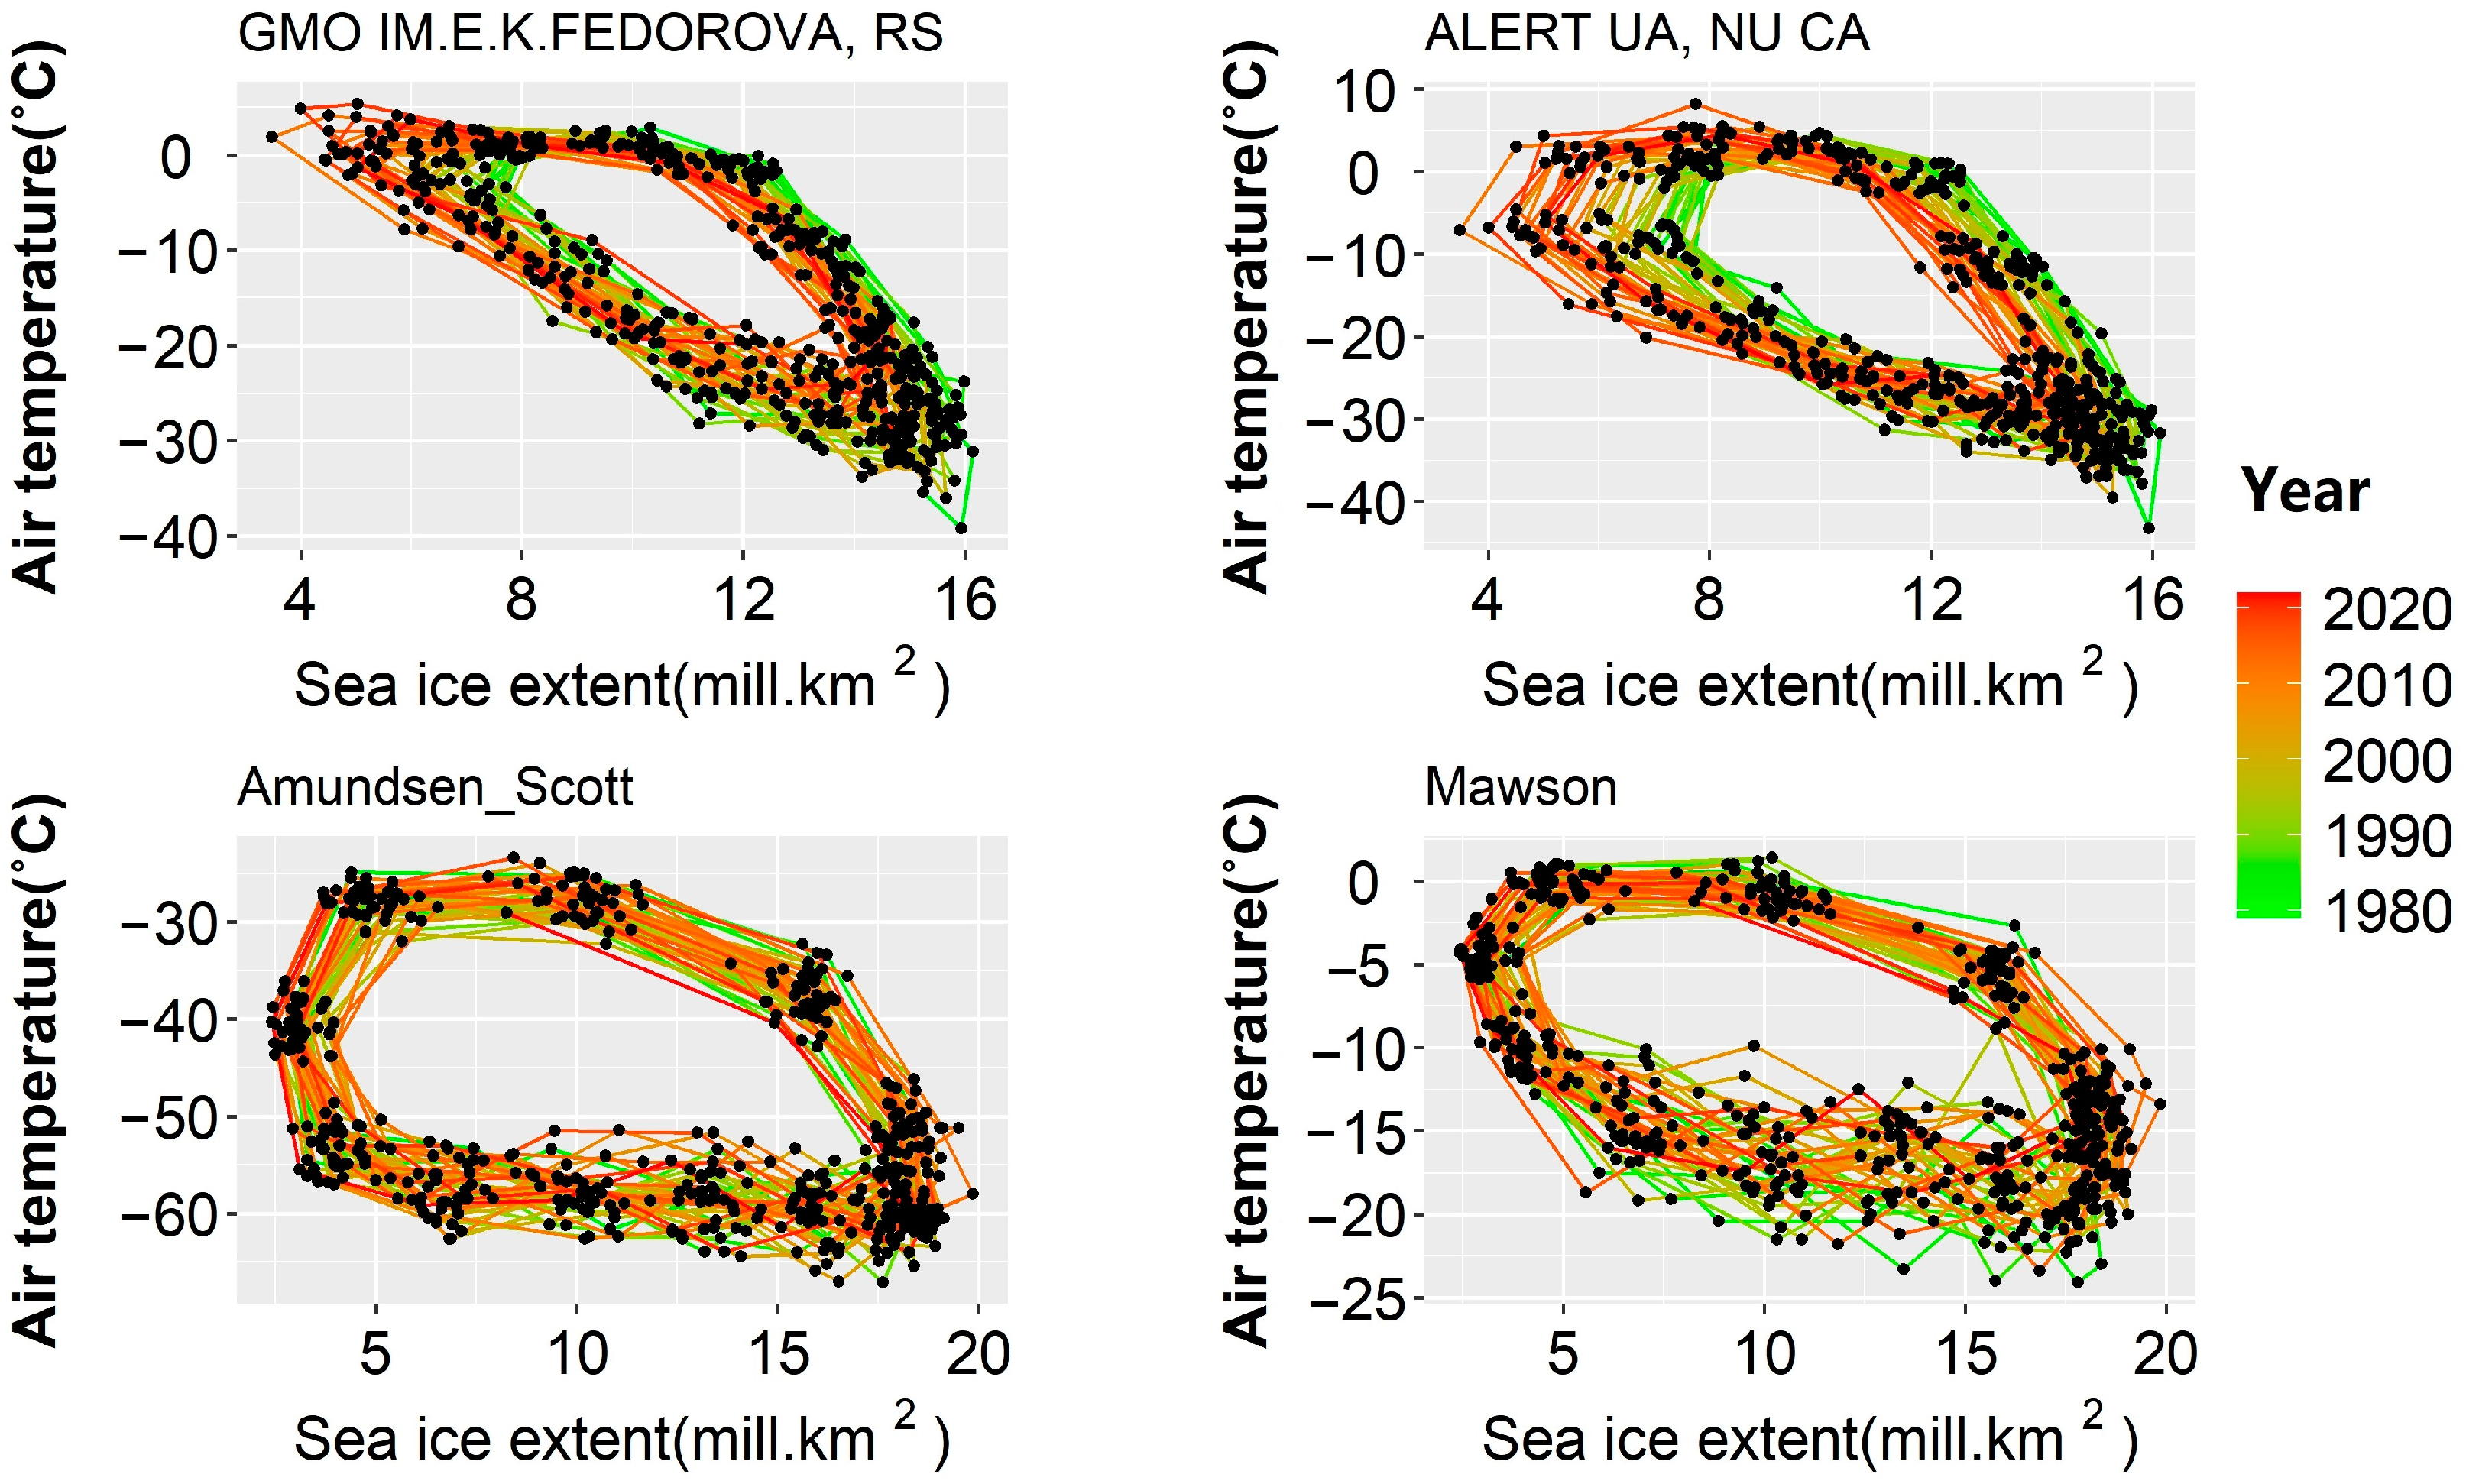
A comprehensive analysis was conducted to examine the interannual variation of sea ice extent and temperature in the Arctic and Antarctic over a 44-year period. To ensure the reliability of the study, multiple meteorological stations were selected for analysis in both polar regions. The findings revealed distinct patterns of sea ice extent variation in response to temperature changes (Figure 9), with similar patterns observed among different stations within each polar region. Specifically, the analysis focused on the Mawson and Amundsen Scott stations in the Antarctic, and the GMO IM.E.K.FEDOROVA and ALERT UA stations in the Arctic. The figure illustrates a counterclockwise relationship between sea ice extent and temperature changes.
The sea ice extent in the Arctic follows a triangular pattern in response to temperature changes. Initially, it reaches its maximum value and then gradually decreases as the temperature rises. When the sea ice extent reduces to 12–13 × 106 km2, it enters a sensitive phase where it becomes highly responsive to temperature changes. As the temperature continues to increase, the sea ice extent undergoes a rapid decline. Once it reaches its minimum value, it follows a linear decreasing pattern as the temperature decreases until it reaches its maximum value again.
The sea ice extent in the Antarctic responds to temperature changes in a shape closer to an ellipse. As the temperature increases, the sea ice extent undergoes a uniform acceleration process without distinct changes in nodes, unlike the Arctic. After reaching the highest temperature of the year, the rate of decrease in sea ice extent starts to slow down. With further temperature decrease, the sea ice extent continues to slowly decrease until it reaches its minimum value of the year. As the temperature continues to drop, the sea ice extent demonstrates a uniform acceleration in growth until it reaches its maximum value.

3.5. Analysis of the Spatiotemporal Distribution Characteristics of Sea Ice Extent

3.5.1. Spatial Overlay Analysis of Multi-Year Sea Ice Extent

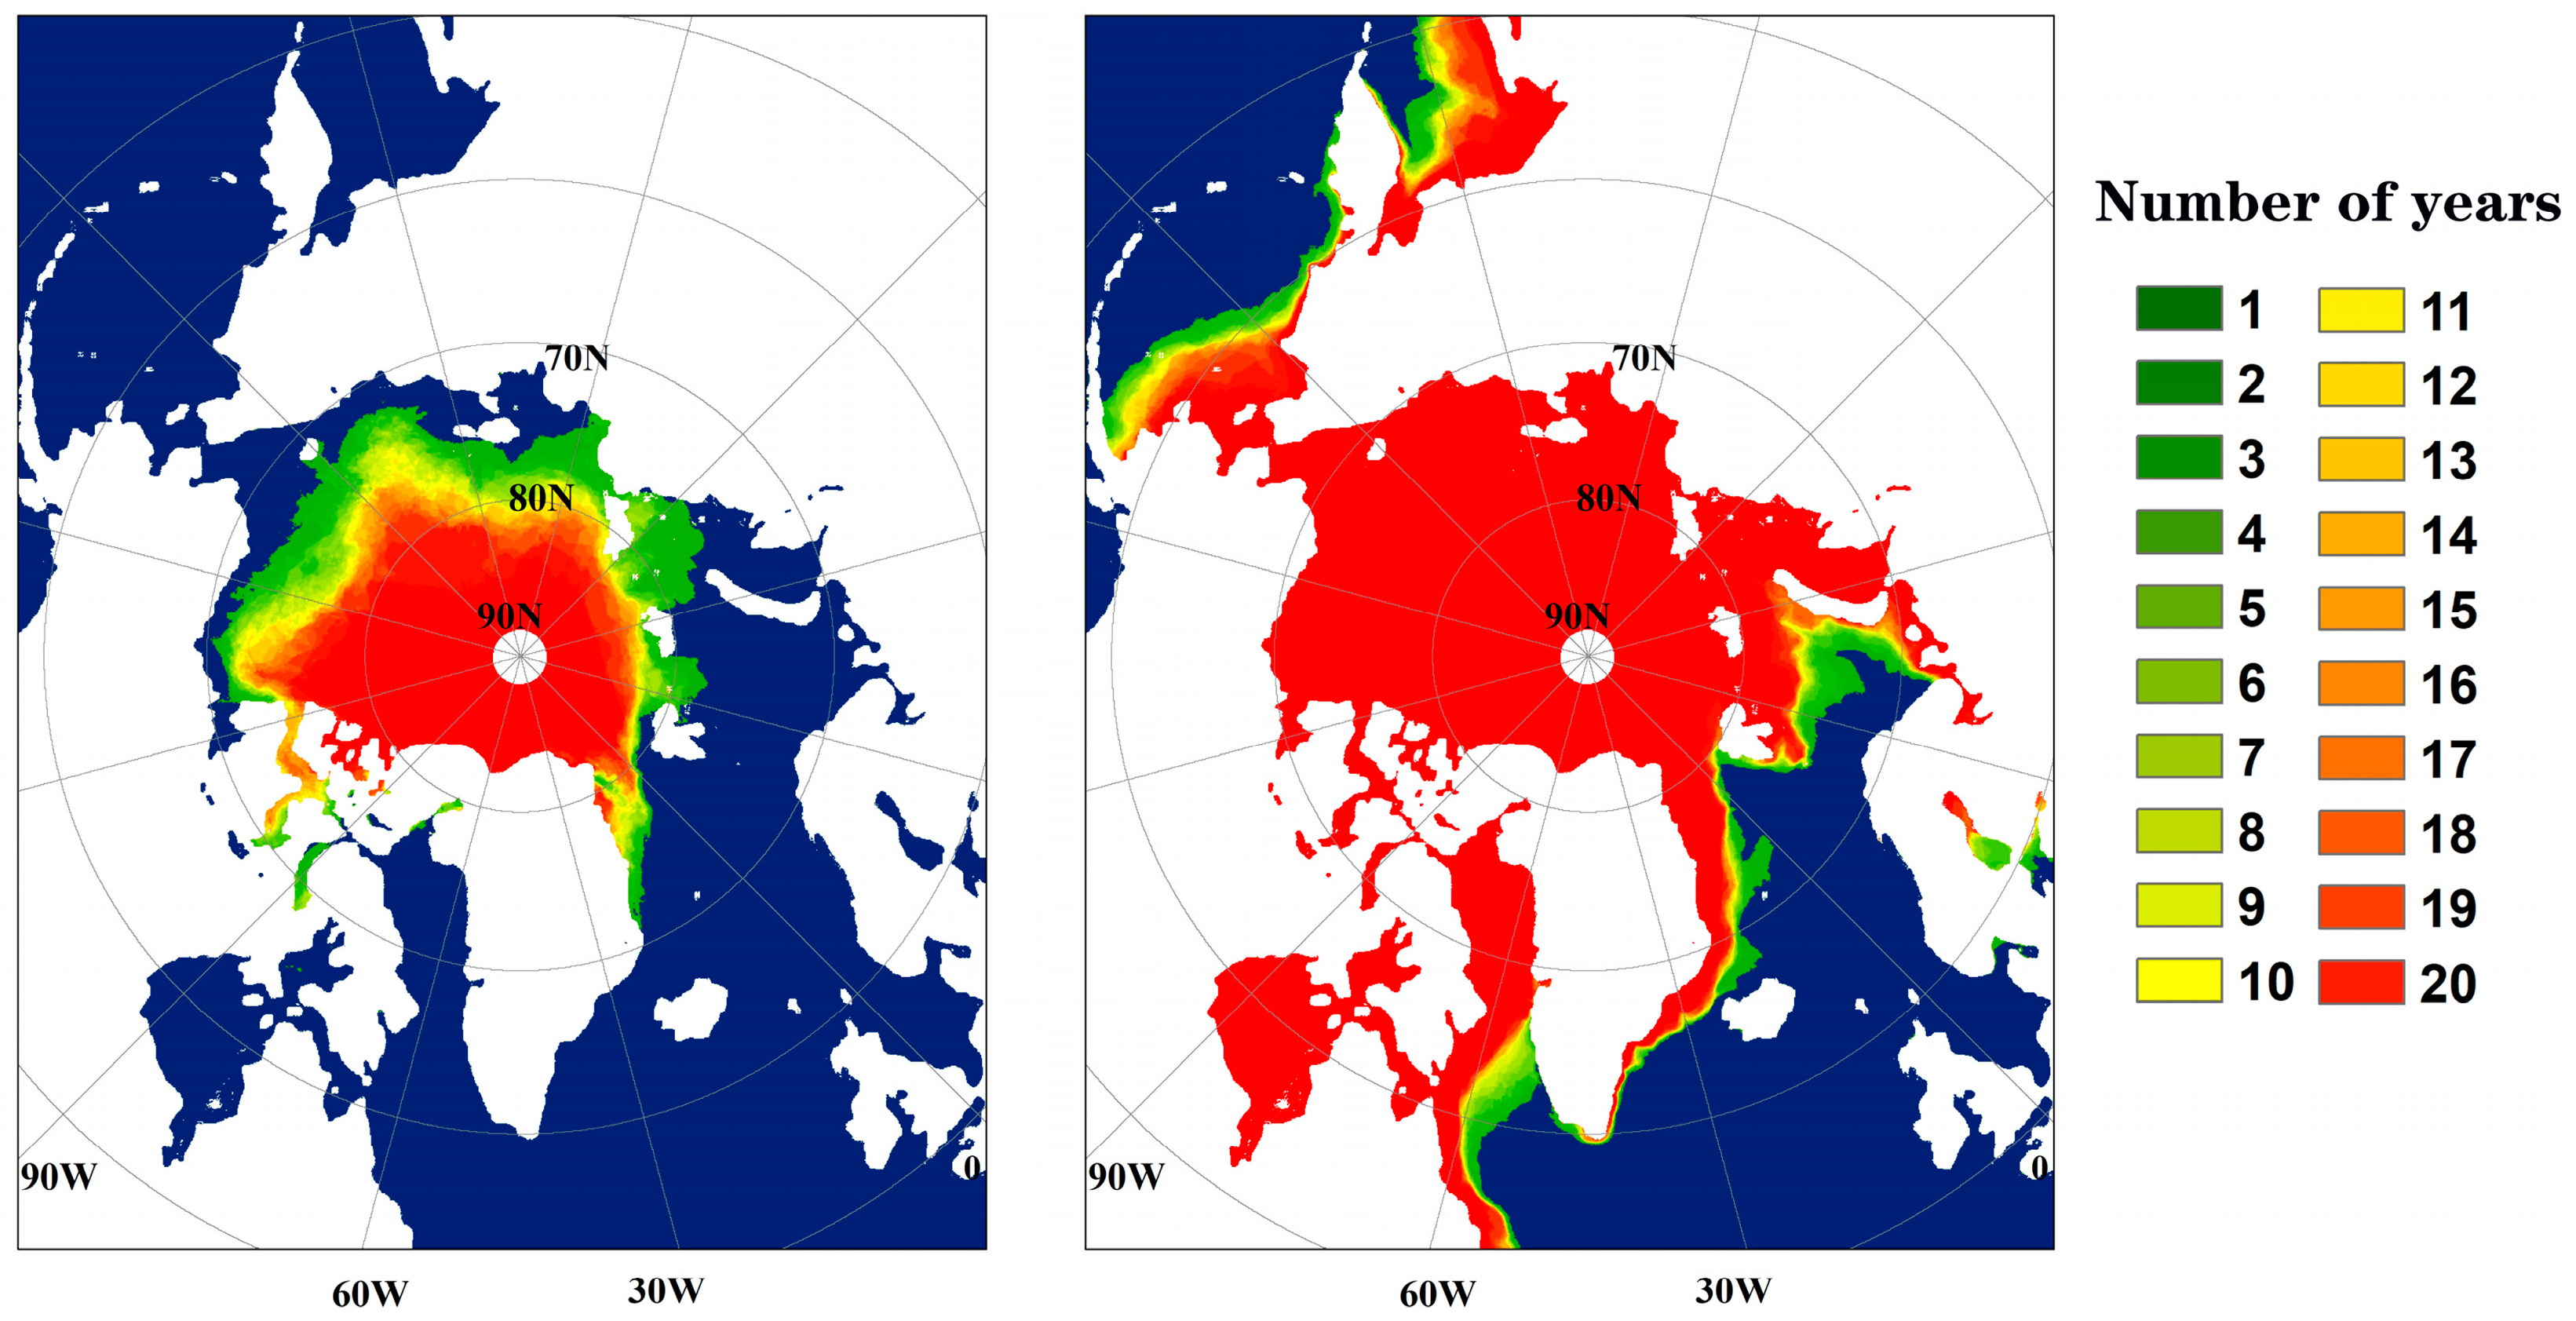
Spatial overlay analysis was conducted on the grid data of sea ice extent over the past 20 years (Figure 10). The centroid of Arctic sea ice extent is noticeably biased towards the Pacific side. During the summer, the minimum sea ice extent on the Pacific side is generally located south of 80°N, and in most years, the sea ice extent in the East Siberian Sea can extend to areas south of 75°N. On the Atlantic side, the minimum sea ice extent near the Svalbard Archipelago generally retreats to north of 82°N. In a few years, between the Svalbard and Franz Josef Land, as well as along the eastern coast of Greenland, the sea ice extent can extend to areas south of 80°N. The maximum sea ice extent in the Barents Sea region remains relatively stable near 60°N. On the western side of the Kamchatka Peninsula, the sea ice extent along the coast of the Okhotsk Sea can extend to areas south of 50°N. On the Atlantic side, the maximum sea ice extent in the western part of the Novaya Zemlya region in the Barents Sea remains relatively stable north of 75°N. In the Norwegian Sea, except for the coastal areas of Greenland, sea ice is present every year, while other areas are generally ice-free. The spatial distribution of Arctic sea ice is primarily influenced by topography, ocean currents, and land rivers. The Arctic Ocean is connected to the Pacific Ocean through the narrow Bering Strait, while it is completely open to the Atlantic Ocean. The differences in sea ice on both sides are significantly influenced by ocean currents. During the summer, the spatial distribution of sea ice is mainly located north of Franz Josef Land, the New Siberian Islands, the Northern Land Islands, the Svalbard Archipelago, and Greenland. On the Pacific side, the Chukchi Sea is connected to the Pacific Ocean, and the East Siberian Sea and Laptev Sea receive inflows from rivers. Therefore, the coastal areas of these three regions are generally ice-free during the summer, and the spatial distribution of sea ice is irregular. However, the Northern Land Islands are less influenced by ocean currents and land rivers, so in some years, sea ice can still be present in the summer. During the winter, the Pacific side is not significantly influenced by rivers and ocean currents, and the development of sea ice is mainly controlled by temperature. Therefore, the sea ice extent can reach lower latitudes in this region. On the Atlantic side, throughout the year, it is influenced by the North Atlantic Warm Current. In the summer, there is an annual open water window in the western part of the Kara Sea. Even in the winter, the coastal areas of the Norwegian Sea and the Barents Sea remain ice-free.
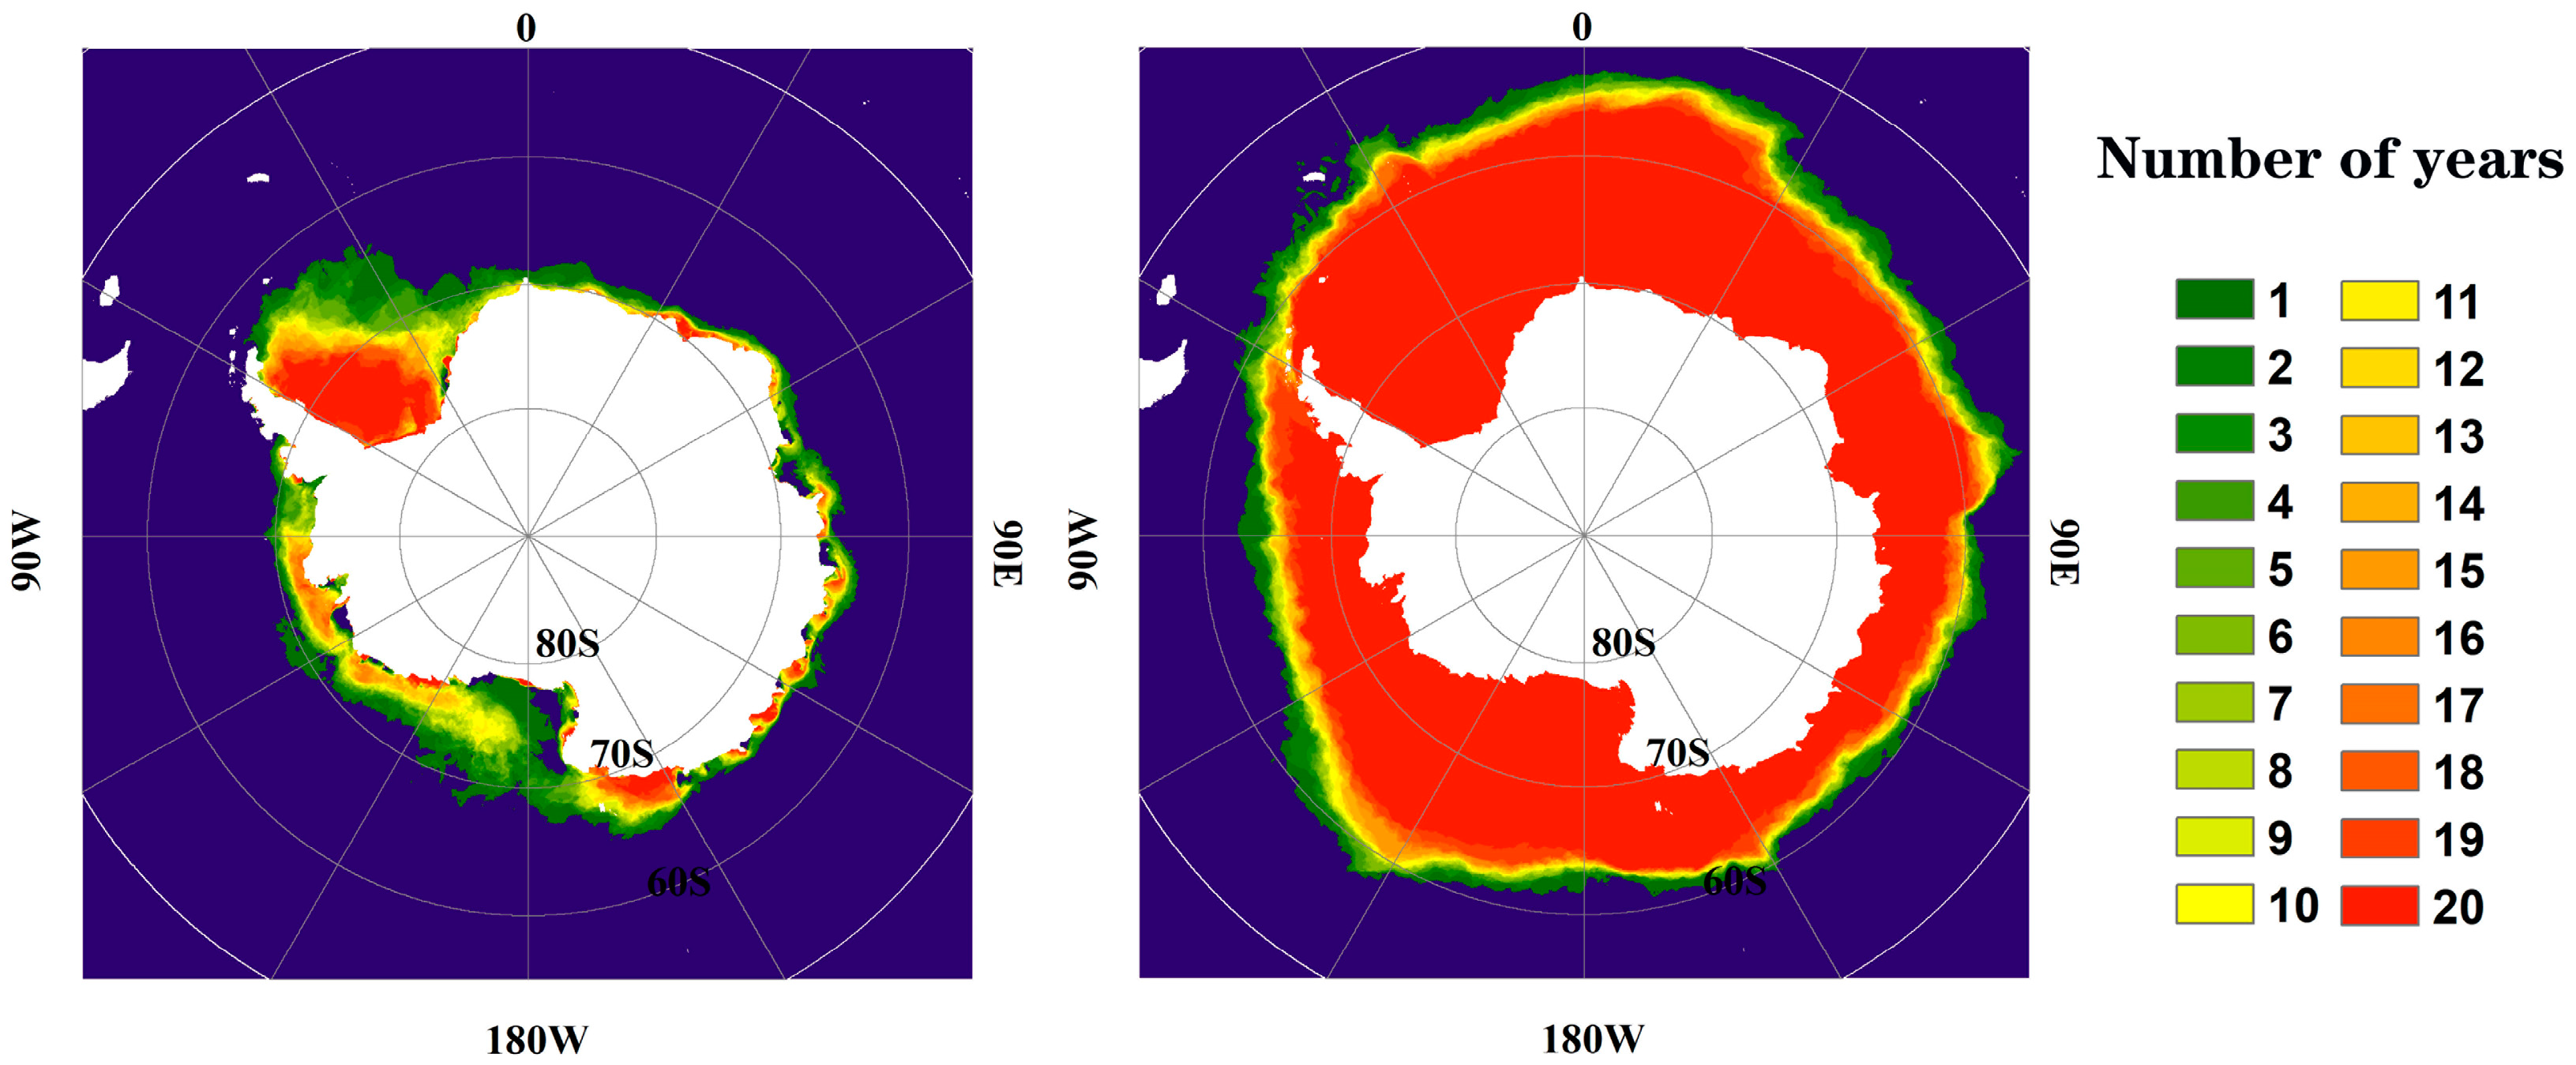
By overlaying and analyzing spatial data of the maximum and minimum sea ice extent in the past 20 years (Figure 11), it can be observed that the majority of the multi-year ice in Antarctica is mainly located in the West Antarctic, with the Weddell Sea being the main area. There is also a small amount of multi-year ice distributed along the coast of the Bellingshausen Sea and the Amundsen Sea. In contrast, in the East Antarctic, the majority of the multi-year ice is found in the D’Urville Sea, with only a small amount of scattered multi-year ice along the coast in other areas. The spatial distribution of annual sea ice in Antarctica remains relatively consistent, with the outer boundary line typically situated near 60°S. Notably, the Bellingshausen Sea, due to its proximity to the Drake Passage and the influence of cyclones in the westerly winds, exhibits the smallest extent of annual sea ice, typically occurring around 65°S. Conversely, the Hakon VII Sea boasts the largest extent of annual sea ice, with the outer boundary occasionally extending north of 55°S. It is worth mentioning that the distribution of sea ice in Antarctica is intricately linked to the topography of the continent. With the exception of the Antarctic Peninsula, the coastlines of West Antarctica generally have higher latitudes, with the Wilkes Land and Ross Sea coastlines reaching latitudes close to 80°S. As a result, the extent of summer sea ice in West Antarctica is significantly larger than in East Antarctica. Additionally, the presence of the Antarctic Peninsula and the Drake Passage amplifies the impact of westerly winds on the Bellingshausen Sea side, while their influence on the Weddell Sea is significantly weakened by the topography. Consequently, the Weddell Sea maintains a significant amount of perennial sea ice throughout the year.

3.5.2. Spatial Analysis of the Years in Which the Maximum and Minimum Sea Ice Extents Occurred

To present a more comprehensive depiction of the spatiotemporal distribution traits of sea ice extent, an in-depth regional spatiotemporal analysis was conducted on polar regions. These regions were segmented into sectors, each encompassing 60 degrees and commencing from the 0-degree meridian. As can be discerned from Figure 12, the periodicity of the maximal and minimal sea ice extent in the Arctic displays notable spatial characteristics. Predominantly, the minimum sea ice extent transpires in September. Within the Pacific sector, the minimum sea ice extent invariably transpires in September.
Conversely, in the Atlantic sector(Figure 13), the Greenland side experiences the minimum sea ice extent in August in over 60% of the years, whereas on the Barents Sea side, it occurs in September in three-quarters of the years, with the residual one-quarter materializing in August. In the intermediate zone straddling the two sectors, the minimum sea ice extent predominantly occurs in September, with only a handful of exceptional instances taking place in August.
Although the maximum extent of sea ice across various spatial zones can transpire in multiple months, it is predominantly observed in February and March. Specifically, in the Atlantic sector, maximum sea ice extent is more commonly observed in March. In the Pacific sector, the maximum sea ice extent in the East Siberian Sea is equally probable to occur in February or March. On the Beaufort Sea, while the maximum sea ice extent has been noted in January, February, March, and April, it has only happened once in January. March frequently witnesses the highest extent, with February and April almost on par, albeit slightly less than March.
In the combined area of the two sectors, the maximum sea ice extent on the side of the Northwest Passage is only observed in February and March, with February occurrences slightly more frequent. In contrast, the Northeast Passage sees the maximum sea ice extent from December to May. However, the incidences in December, January, and May are less than twice. April exhibits the highest frequency, followed by February and March.
This pattern implies that the Atlantic sector is subject to warm ocean currents, resulting in the minimum sea ice extent appearing noticeably earlier than in the Pacific sector. However, the maximum sea ice extent in the Atlantic sector tends to manifest slightly later than in the Pacific sector.
The least sea ice coverage in the Antarctic typically happens in February, maintaining a regular spatial pattern. However, certain years can witness the smallest sea ice extent in the Hakon VII Sea and the Bellingshausen Sea, positioned in East Antarctica, as late as March. The occurrence of the maximum sea ice extent exhibits substantial spatial discrepancies. In the low-latitude regions along the East Antarctic coast, the peak sea ice coverage predominantly takes place in September and October. Similarly, the Amundsen Sea also reaches its highest sea ice extent primarily in September and October. In contrast, the maximum sea ice extent in other areas mainly occurs in August and September. The Antarctic Peninsula and the Dumont d’Urville Sea are exceptions, with a few years recording the maximum sea ice extent as early as July.

3.5.3. Spatial Analysis of the Dynamics of Sea Ice Extent

In an effort to quantitatively assess the year-to-year variability of sea ice extent across various regions, we designed a dynamic evaluation model specific to sea ice extent. Within this model, σ serves as the dynamic index of sea ice extent, effectively mirroring the degree of interannual variations in sea ice extent. s i is indicative of the average sea ice area for a specific year, denoted as ‘i’.
σ = ( _ ( i 1 ) ^ 20 [ ( | s _ i s _ ( i 1 )   | s _ i ) × 100 ] ) 20
As depicted in Figure 14 and Table 2, a distinct spatial symmetry is noticeable in the dynamic index of Arctic sea ice extent. The sector encompassing the Barents Sea displays a significantly higher dynamic index of sea ice extent, scoring 10.91, compared to other regions. Following this, the sector containing Greenland has a dynamic index of 6.97. The Kara Sea sector posts a dynamic index of 6.21. The two sectors hosting the Northwest Passage display marginally lower dynamic indices compared to the Kara Sea sector. The sectors of the East Siberian Sea and Laptev Sea register the smallest dynamic indices of sea ice extent, both at a value of 4.92. Considering the differences in intensity between the Atlantic Warm Current and the Transpolar Drift, coupled with the spatial distribution attributes of the dynamic index of sea ice extent, it can be inferred that ocean currents primarily influence the dynamic index of sea ice extent in the Arctic Ocean.
The variances in the dynamic index of sea ice extent across different regions of Antarctica are fairly minimal. The fifth sector, home to the Antarctic Peninsula, boasts the highest dynamic index of sea ice extent, registering at 8.63. Coming in second is the third sector, where the Dumont d’Urville Sea is located, with a dynamic index of 7.65. Ranking third is the Astronaut Sea sector on the western flank of the Indian Ocean, posting a dynamic index of 6.8. The second sector, encompassing Davis Sea, along with the fourth sector, which includes Ross Sea and Amundsen Sea, and the sixth sector, home to the Weddell Sea, all report relatively smaller dynamic indices, all falling below the range of 5– 6. On the whole, the dynamic index of sea ice extent among the various sectors in Antarctica does not exhibit much disparity. Within the fifth sector, to the west of the Antarctic Peninsula, the presence of the Drake Passage results in a heightened impact of cyclones and ocean currents on sea ice. This primarily accounts for the larger dynamic index of sea ice extent in this region.

4. Conclusions

This article provides a comprehensive revelation and meticulous analysis of the temporal change process, spatial distribution characteristics, and future development trends of the sea ice extent in the Arctic and Antarctic from 1979 to 2022. The main conclusions of the study are as follows:
(1)
Throughout the study period, Arctic sea ice extent consistently diminished, with 2004 serving as a critical turning point for this decline. Post-2004, a substantial and accelerated decrease was observed. On the other hand, Antarctic sea ice extent initially expanded, then contracted, with significant fluctuations between 2001 and 2014. Following 2014, a marked decline ensued, culminating in 2022 with the lowest recorded sea ice extent of the study period.
(2)
In the Arctic, sea ice typically peaks in March and hits its lowest in September. Early in the study, monthly sea ice variations were minimal. But post-2004, significant summer and fall reductions led to greater monthly differences from June to December. In contrast, Antarctic sea ice is at its sparsest in February and most expansive in September. With a seven-month growth season and five-month retreat period, the Antarctic’s ice expansion is slower than its contraction.
(3)
Trend analysis suggests that by around 2060, the Arctic’s extensive seasonal ice cover could completely vanish in September. In the Antarctic, sea ice changes in distinct phases, slowly increasing until 2014, and then rapidly declining.
(4)
Anomaly analysis reveals that the peak sea ice extent anomaly has progressively moved from September to October in the Arctic, lengthening its melting period. The Antarctic shows greater sea ice extent anomaly fluctuations, with growing anomalies in all seasons. Its interannual stability is decreasing, as evidenced by greater year-to-year variances and a downward growth trend.
(5)
The Arctic’s minimum sea ice extent lags nearly two months behind peak temperatures, rapidly responding to temperature shifts. Meanwhile, in the Antarctic, maximum sea ice extent trails two months behind the coldest temperatures, and minimum sea ice extent is delayed by a month relative to the warmest temperatures. The Arctic and Antarctic sea ice extents behave differently in response to temperature changes; it is triangular in the Arctic with distinct turning points, and elliptical in the Antarctic, mainly characterized by steady acceleration in sea ice decrease and increase.
(6)
The sea ice extent’s center in the Arctic Ocean leans towards the Pacific side year-round. The spatial layout and fluctuations of sea ice are dictated not only by temperature but also significantly by ocean currents, especially the Atlantic Warm Current, which causes the Atlantic side’s annual minimum sea ice extent to occur sooner than the Pacific’s and leads to a higher dynamic index of sea ice extent compared to other regions. Due to geographical factors, the bulk of Antarctica’s summer sea ice is located in West Antarctica, primarily in the Weddell Sea. The combined effect of topography and cyclones results in less sea ice extent year-round on the western side of the Antarctic Peninsula, which also exhibits the highest sea ice extent dynamic index.

5. Outlook and Discussion

Due to current limitations in acquiring sea ice thickness data, our research has been restricted to examining the three-dimensional spatiotemporal alterations in sea ice. To achieve a more comprehensive understanding of the evolving trends in polar sea ice, we aim to conduct a four-dimensional spatiotemporal analysis once our capabilities to procure sea ice thickness data improve.
Current data analysis has revealed a disruption in the annual change pattern of Antarctic sea ice extent. However, to definitively conclude whether the sea ice extent has entered a phase of substantial reduction, a more extended period of observation is necessary.

Author Contributions

Conceptualization, X.S.; Data curation, H.S.; Formal analysis, X.S. and T.L.; Funding acquisition, Q.S. and H.S.; Methodology, X.S.; Resources, Z.D. and H.S.; Writing—original draft, X.S.; Writing—review & editing, T.L., Z.D., H.S., Y.G., Y.H., M.F. and C.L. All authors have read and agreed to the published version of the manuscript.

Funding

This work was supported by the Simulation and evaluation of sea ice models and sea-ice-air interactions (2022YFF0802002) and The Business and scientific research of polar exploration (2023).

Data Availability Statement

No new data were created or analyzed in this study. Data sharing is not applicable to this article.

Acknowledgments

We would like to express our gratitude to the Institute of Environmental Physics (IUP) at the University of Bremen and the Alfred Wegener Institute, Helmholtz Centre for Polar and Marine Research (AWI) for providing the sea ice extent data. We are also grateful to the National Centers for Environmental Information (NCEI) and the British Antarctic Survey (BAS) for their generous contribution of meteorological data.

Conflicts of Interest

The authors declare no conflict of interest.

References

  1. Meier, W.N.; Hovelsrud, G.K.; van Oort, B.E.; Key, J.R.; Kovacs, K.M.; Michel, C.; Haas, C.; Granskog, M.A.; Gerland, S.; Perovich, D.K.; et al. Arctic sea ice in transformation: A review of recent observed changes and impacts on biology and human activity. Rev. Geophys. 2014, 52, 185–217. [Google Scholar] [CrossRef]
  2. Walsh, J.E. Melting ice: What is happening to Arctic sea ice, and what does it mean for us? Oceanography 2013, 26, 171–181. [Google Scholar] [CrossRef]
  3. Cohen, J.; Agel, L.; Barlow, M.; Garfinkel, C.I.; White, I. Linking Arctic variability and change with extreme winter weather in the United States. Science 2021, 373, 1116–1121. [Google Scholar] [CrossRef] [PubMed]
  4. Luo, D.; Chen, X.; Overland, J.; Simmonds, I.; Wu, Y.; Zhang, P. Weakened Potential Vorticity Barrier Linked to Recent Winter Arctic Sea Ice Loss and Midlatitude Cold Extremes. J. Clim. 2019, 32, 4235–4261. [Google Scholar] [CrossRef]
  5. Rind, D.; Healy, R.; Parkinson, C.; Martinson, D. The Role of Sea Ice in 2×CO2 Climate Model Sensitivity. Part I: The Total Influence of Sea Ice Thickness and Extent. J. Clim. 1995, 8, 449–463. [Google Scholar] [CrossRef]
  6. Vihma, T. Effects of Arctic sea ice decline on weather and climate: A review. Surv. Geophys. 2014, 35, 1175–1214. [Google Scholar] [CrossRef]
  7. Parkinson, C.L.; DiGirolamo, N.E. New visualizations highlight new information on the contrasting Arctic and Antarctic sea-ice trends since the late 1970s. Remote Sens. Environ. 2016, 183, 198–204. [Google Scholar] [CrossRef]
  8. Yang, J.; Xiao, C.; Liu, J.; Li, S.; Qin, D. Variability of Antarctic sea ice extent over the past 200 years. Sci. Bull. 2021, 66, 2394–2404. [Google Scholar] [CrossRef]
  9. Zhao, X.; Xu, L.; Stein, A.; Pang, X. The impact of averaging methods on the trend analysis of the Antarctic sea ice extent and perimeter. Spat. Stat. 2016, 18, 221–233. [Google Scholar] [CrossRef]
  10. Zwally, H.J.; Comiso, J.C.; Parkinson, C.L.; Cavalieri, D.J.; Gloersen, P. Variability of Antarctic sea ice 1979–1998. J. Geophys. Res. Ocean. 2002, 107, 9-1–9-19. [Google Scholar] [CrossRef]
  11. Crosta, X.; Etourneau, J.; Orme, L.C.; Dalaiden, Q.; Campagne, P.; Swingedouw, D.; Goosse, H.; Masse, G.; Miettinen, A.; McKay, R.M.; et al. Multi-decadal trends in Antarctic sea-ice extent driven by ENSO-SAM over the last 2000 years. Nat. Geosci. 2021, 14, 156–160. [Google Scholar] [CrossRef]
  12. Eayrs, C.; Li, X.; Raphael, M.N.; Holland, D.M. Rapid decline in Antarctic sea ice in recent years hints at future change. Nat. Geosci. 2021, 14, 460–464. [Google Scholar] [CrossRef]
  13. Hobbs, W.R.; Massom, R.; Stammerjohn, S.; Reid, P.; Williams, G.; Meier, W. A review of recent changes in Southern Ocean sea ice, their drivers and forcings. Glob. Planet. Chang. 2016, 143, 228–250. [Google Scholar] [CrossRef]
  14. Meehl, G.A.; Arblaster, J.M.; Bitz, C.M.; Chung, C.T.Y.; Teng, H. Antarctic sea-ice expansion between 2000 and 2014 driven by tropical Pacific decadal climate variability. Nat. Geosci. 2016, 9, 590–595. [Google Scholar] [CrossRef]
  15. Sigmond, M.; Fyfe, J.C. Has the ozone hole contributed to increased Antarctic sea ice extent? Geophys. Res. Lett. 2010, 37, L18502. [Google Scholar] [CrossRef]
  16. Stammerjohn, S.E.; Martinson, D.G.; Smith, R.C.; Yuan, X.; Rind, D. Trends in Antarctic annual sea ice retreat and advance and their relation to El Niño–Southern Oscillation and Southern Annular Mode variability. J. Geophys. Res. 2008, 113, C03S90. [Google Scholar] [CrossRef]
  17. Wang, Z.; Turner, J.; Wu, Y.; Liu, C. Rapid Decline of Total Antarctic Sea Ice Extent during 2014–16 Controlled by Wind-Driven Sea Ice Drift. J. Clim. 2019, 32, 5381–5395. [Google Scholar] [CrossRef]
  18. Wang, G.; Hendon, H.H.; Arblaster, J.M.; Lim, E.-P.; Abhik, S.; van Rensch, P. Compounding tropical and stratospheric forcing of the record low Antarctic sea-ice in 2016. Nat. Commun. 2019, 10, 13. [Google Scholar] [CrossRef]
  19. Parkinson, C.L.; DiGirolamo, N.E. Sea ice extents continue to set new records: Arctic, Antarctic, and global results. Remote Sens. Environ. 2021, 267, 112753. [Google Scholar] [CrossRef]
  20. Cavalieri, D.J.; Parkinson, C.L. Arctic sea ice variability and trends, 1979–2010. Cryosphere 2012, 6, 881–889. [Google Scholar] [CrossRef]
  21. Comiso, J.C.; Parkinson, C.L.; Gersten, R.; Stock, L. Accelerated decline in the Arctic sea ice cover. Geophys. Res. Lett. 2008, 35, L01703. [Google Scholar] [CrossRef]
  22. Haas, C.; Pfaffling, A.; Hendricks, S.; Rabenstein, L.; Etienne, J.L.; Rigor, I. Reduced ice thickness in arctic transpolar drift favors rapid ice retreat. Geophys. Res. Lett. 2008, 35, L17501. [Google Scholar] [CrossRef]
  23. Nghiem, S.V.; Rigor, I.G.; Perovich, D.K.; Clemente-Colón, P.; Weatherly, J.W.; Neumann, G. Rapid reduction of Arctic perennialsea ice. Geophys. Res. Lett. 2007, 34, L19504. [Google Scholar] [CrossRef]
  24. Lei, R.B.; Xie, H.J.; Wang, J.; Leppäranta, M.; Jónsdottir, I.; Zhang, Z.H. Changes in sea ice conditions along the arctic northeast passage from 1979 to 2012. Cold Reg. Sci. Technol. 2015, 119, 132–144. [Google Scholar] [CrossRef]
  25. Xie, H.; Lei, R.; Ke, C.; Wang, H.; Li, Z.; Zhao, J.; Ackley, S.F. Summer sea ice characteristics and morphology in the Pacific Arctic sector as observed during the CHINARE 2010 cruise. Cryosphere 2013, 7, 1057–1072. [Google Scholar] [CrossRef]
  26. Rodrigues, J. The rapid decline of the sea ice in the Russian Arctic. Cold Reg. Sci. Technol. 2008, 54, 124–142. [Google Scholar] [CrossRef]
  27. Markus, T.; Stroeve, J.C.; Miller, J. Recent changes in Arctic sea ice melt onset, freeze up, and melt season length. J. Geophys. Res. 2009, 114, C12024. [Google Scholar] [CrossRef]
  28. Stroeve, J.C.; Kattsov, V.; Barrett, A.; Serreze, M.; Pavlova, T.; Holland, M.; Meier, W.N. Trends in Arctic sea ice extent from CMIP5, CMIP3 and observations. Geophys. Res. Lett. 2012, 39, L16502. [Google Scholar] [CrossRef]
  29. Overland, J.E.; Wang, M. When will the summer Arctic be nearly sea ice free? Geophys. Res. Lett. 2013, 40, 2097–2101. [Google Scholar] [CrossRef]
  30. Screen, J.A. Far-flung effects of Arctic warming. Nat. Geosci. 2017, 10, 253–254. [Google Scholar] [CrossRef]
  31. Sévellec, F.; Fedorov, A.V.; Liu, W. Arctic sea-ice decline weakens the Atlantic meridional overturning circulation. Nat. Clim. Change 2017, 7, 604–610. [Google Scholar] [CrossRef]
  32. Strawa, A.W.; Latshaw, G.; Farkas, S.; Russell, P.; Zornetzer, S. Arctic ice loss threatens national security: A path forward. Orbis 2020, 64, 622–636. [Google Scholar] [CrossRef] [PubMed]
  33. Rahmstorf, S.; Box, J.E.; Feulner, G.; Mann, M.E.; Robinson, A.; Rutherford, S.; Schaffernicht, E.J. Exceptional twentieth-century slowdown in Atlantic Ocean overturning circulation. Nat. Clim. Chang. 2015, 5, 475–480. [Google Scholar] [CrossRef]
  34. Grosfeld, K.; Treffeisen, R.; Asseng, J.; Bartsch, A.; Bräuer, B.; Fritzsch, B.; Gerdes, R.; Hendricks, S.; Hiller, W.; Heygster, G.; et al. Online sea-ice knowledge and data platform. Polarforsch. Bremerhav. Alfred Wegener Inst. Polar Mar. Res. Ger. Soc. Polar Res. 2016, 85, 143–155. [Google Scholar]
  35. Liu, Z. Arctic sea ice decline and its driving mechanisms. Chin. J. Nat. 2022, 44, 39–46. [Google Scholar]
  36. Liu, Y.; Wang, Z.; Liu, T. Change Analysis for Antarctic and Arctic Sea Ice Concentration and Extent. Remote Sens. Inf. 2016, 31, 24–29. [Google Scholar]
  37. Wei, L.; Zhang, Z. Analysis of Arctic Sea Ice Variability. Mar. Forecast. 2007, 24, 42–48. [Google Scholar]
  38. Yang, J.; He, J.; Zhao, G. Telecorrelation of Arctic Sea-Ice with Spring Sandstorm in Ningxia. J. Nanjing Inst. Meteorol. 2003, 26, 296–307. [Google Scholar]
  39. Wang, L.; Yang, W.; Zhang, L.; Li, C.; Zhang, F. Effect of Arctic sea ice on precipitation in the main flood season of the Yangtze River basin. Adv. Water Sci. 2019, 30, 623–631. [Google Scholar]
  40. Zhang, R.; Sun, C.; Li, W. Relationship between the interannual variations of Arctic sea ice and summer Eurasian teleconnection and associated influence on summer precipitation over China. Chin. J. Geophys. 2018, 61, 91–105. [Google Scholar]
  41. Spreen, G.; Kaleschke, L.; Heygster, G. Sea ice remote sensing using AMSR-E 89 GHz channels. J. Geophys. Res. 2008, 113, C02S03. [Google Scholar] [CrossRef]
  42. Parkinson, C.L. A 40-y record reveals gradual Antarctic sea ice increases followed by decreases at rates far exceeding the rates seen in the Arctic. Proc. Natl. Acad. Sci. USA 2019, 116, 14414–14423. [Google Scholar] [CrossRef] [PubMed]
  43. Simmonds, I. Comparing and contrasting the behaviour of Arctic and Antarctic sea ice over the 35 year period 1979–2013. Ann. Glaciol. 2015, 56, 18–28. [Google Scholar] [CrossRef]
  44. Turner, J.; Hosking, J.S.; Bracegirdle, T.J.; Marshall, G.J.; Phillips, T. Recent changes in Antarctic Sea Ice. Philos. Trans. R. Soc. A: Math. Phys. Eng. Sci. 2015, 373, 20140163. [Google Scholar] [CrossRef] [PubMed]
  45. Stroeve, J.C.; Serreze, M.C.; Holland, M.M.; Kay, J.E.; Malanik, J.; Barrett, A.P. The Arctic’s rapidly shrinking sea ice cover: A research synthesis. Clim. Chang. 2012, 110, 1005–1027. [Google Scholar] [CrossRef]
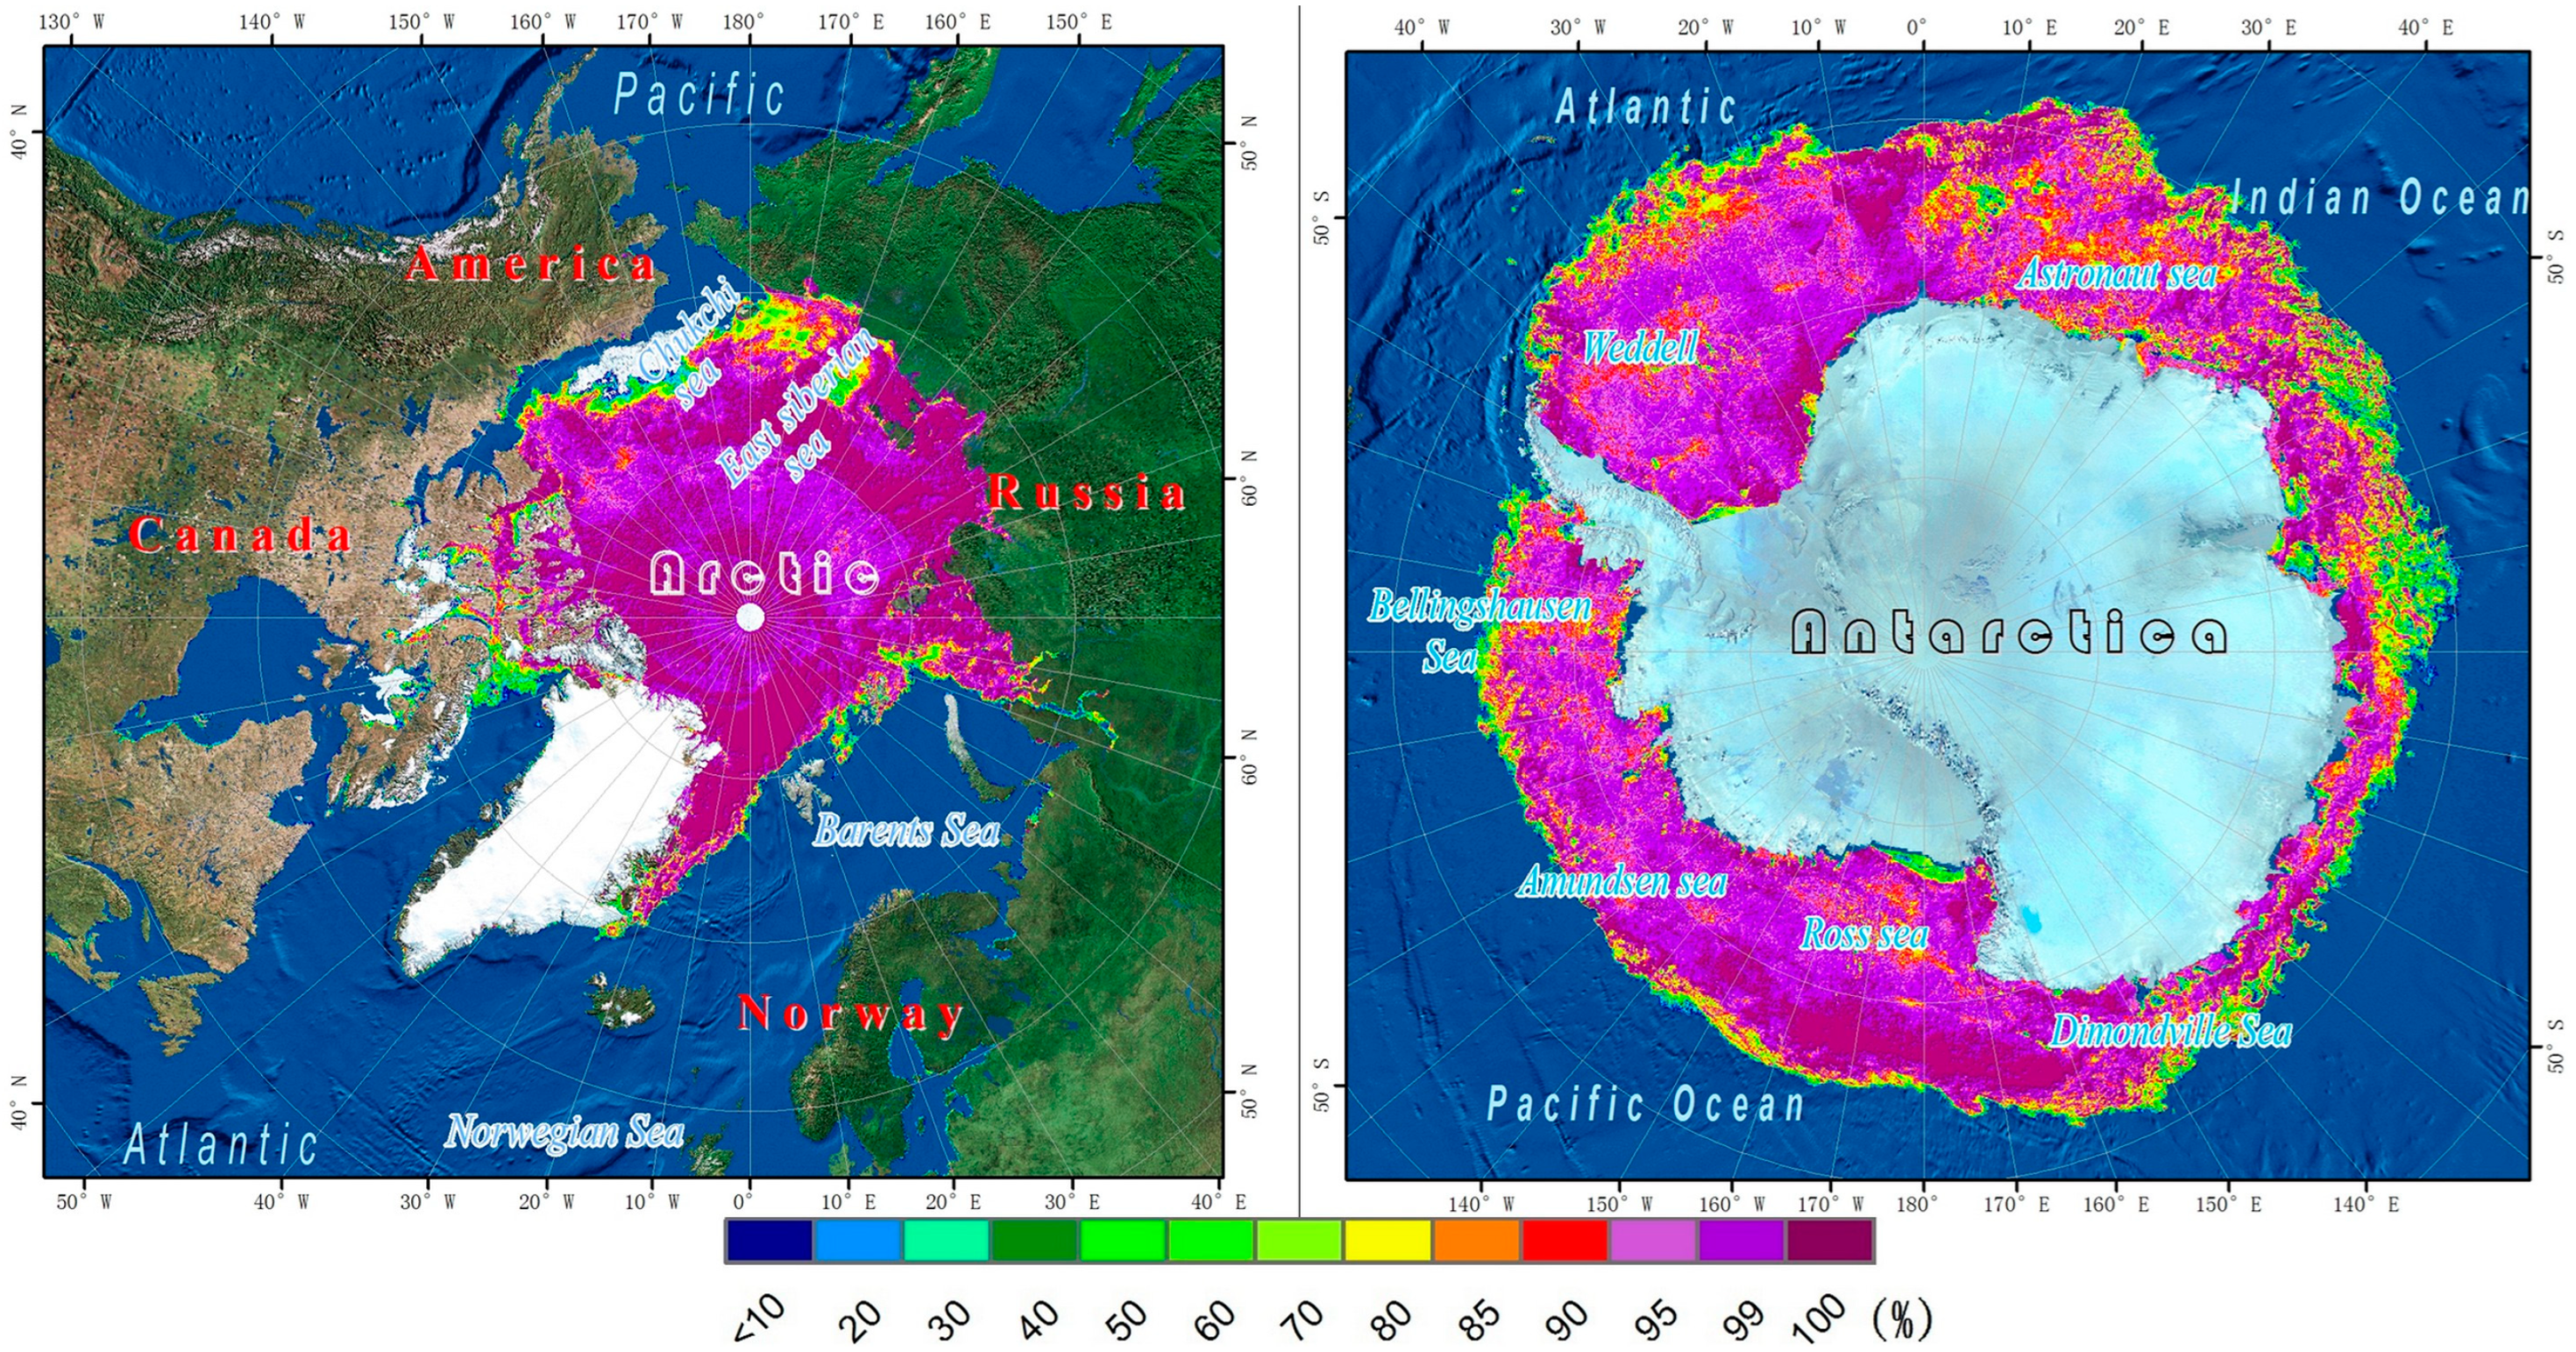
Figure 1. Research area and sea ice concentration data (sea ice extent is derived from sea ice concentration).
Remotesensing 15 05563 g001
Figure 2. Technical route.
Remotesensing 15 05563 g002
Figure 3. Statistical distributions of monthly sea ice extents and its threshold.
Remotesensing 15 05563 g003
Figure 4. Trend of Arctic sea ice extent change.
Remotesensing 15 05563 g004
Figure 5. Trend of Antarctic sea ice extent change.
Remotesensing 15 05563 g005
Figure 6. The trend of annual average sea ice extent in the Arctic and Antarctic.
Remotesensing 15 05563 g006
Figure 7. Anomalies curve of Arctic sea ice extent.
Remotesensing 15 05563 g007
Figure 8. Anomalies curve of Antarctic sea ice extent.
Remotesensing 15 05563 g008
Figure 9. The interannual variation pattern of sea ice extent with temperature.
Remotesensing 15 05563 g009
Figure 10. Spatial overlay analysis of the maximum and minimum sea ice extents in the Arctic.
Remotesensing 15 05563 g010
Figure 11. Spatial overlay analysis of the maximum and minimum sea ice extents in the Antarctic.
Remotesensing 15 05563 g011
Figure 12. Spatial distribution of the months when the maximum and minimum sea ice extents occurred in the Arctic from 2003 to 2022.
Remotesensing 15 05563 g012
Figure 13. Spatial distribution of the months when the maximum and minimum sea ice extents occurred in the Antarctic from 2003 to 2022.
Remotesensing 15 05563 g013
Figure 14. Spatial distribution of the dynamics of sea ice extent in the Arctic and Antarctic.
Remotesensing 15 05563 g014
Table 1. Remote sensing sensors and algorithms.
YearSatellites and SensorsAlgorithm
1972–2002NIMBUS-7 SMMR and DMSP SSM/I, 19 and 37 GHzNASA Team
26 October 1978–October 2010NIMBUS-7 SMMR and DMSP SSM/I-SSMIS, 19 and 37 GHzNASA Team
1 June 2002–4 October 2011Aqua AMSR-E, 89 GHzASI
5 October 2011–2 July 2012F-17 SSMIS, 91 GHzASI
3 July 2012–todayGCOM-W1 AMSR2, 89 GHzASI
Table 2. Regional statistics of the dynamics of sea ice extent in the Arctic and Antarctic.
Zone NumberSpatial RangeArctic Sea Ice Extent DynamicsAntarctic Sea Ice
Extent Dynamics
10°–60°E10.916.8
260°–120°E6.215.57
3120°–180°E4.927.65
4180°–240°E5.135.05
5240°–300°E5.678.63
6300°–360°E6.975.41
Disclaimer/Publisher’s Note: The statements, opinions and data contained in all publications are solely those of the individual author(s) and contributor(s) and not of MDPI and/or the editor(s). MDPI and/or the editor(s) disclaim responsibility for any injury to people or property resulting from any ideas, methods, instructions or products referred to in the content.