


Susceptibility Mapping of Unhealthy Trees in Jiuzhaigou Valley Biosphere Reserve

1
Key Laboratory of Digital Earth Science, Aerospace Information Research Institute, Chinese Academy of Sciences, Beijing 100094, China
2
International Research Center of Big Data for Sustainable Development Goals, Beijing 100094, China
3
University of Chinese Academy of Sciences, Beijing 100049, China
4
Jiuzhaigou Valley Scenic Area Administration, Jiuzhaigou 623402, China
*
Author to whom correspondence should be addressed.
Remote Sens. 2023, 15(23), 5516; https://doi.org/10.3390/rs15235516
Submission received: 18 October 2023
/
Revised: 20 November 2023
/
Accepted: 25 November 2023
/
Published: 27 November 2023
(This article belongs to the Special Issue Remote Sensing of Urban Forests and Landscape Ecology)
Abstract
:Jiuzhaigou Valley is recognized as both a world natural heritage site and a biosphere reserve. Conducting research on vegetation health within its scope can provide a demonstration role for sustainable development research. In this study, we proposed a technology integration approach that combined remote sensing intelligent identification and quantitative retrieval, and achieved vegetation health monitoring and susceptibility mapping of unhealthy trees. Leveraging WorldView-2 high-resolution satellite images, unhealthy trees were elaborately identified through the object-oriented classification method employing spectral and texture features, with F1 Score exceeding 75%. By applying fuzzy operations on indices related to leaf pigment and canopy architecture, we ultimately generated susceptibility maps of unhealthy trees on Sentinel-2 satellite images, with Area Under the Curve (AUC) exceeding 0.85. Our findings underscore that the vegetation health in Jiuzhaigou Valley is predominantly influenced by human activities and geological hazards. The forests of Jiuzhaigou Valley exhibit a certain degree of resilience to geological disasters, while human activities have been continuously exerting adverse effects on forest health in recent years, necessitating heightened attention. The methodology proposed in this study for mapping unhealthy trees susceptibility presents a cost-effective solution that can be readily applied for vegetation health monitoring and early warning in analogous biosphere reserves.
1. Introduction
As human influence on the environment continues to grow with economic and social development, the world has witnessed an increase in extreme climate events in recent years, posing significant challenges to sustainable development [1,2,3]. Emissions of greenhouse gases, such as carbon dioxide, remain a leading factor contributing to climate deterioration, such as global warming, extreme precipitation, and shortening of the winter season [4,5,6]. In response, several countries, including China, have set carbon peak and carbon neutrality targets [7,8].
Launched by the United Nations in 1971, the Man and the Biosphere Programme aimed to establish a scientific foundation for enhancing the relationship between humanity and the environment [9]. It has been noted that these biosphere reserves play a pivotal role in achieving sustainable development goals [10,11]. In biosphere reserves, vegetation plays a crucial role. It serves as a vital component of the carbon cycle, providing energy and habitat for animals. This role is of great significance for enhancing land carbon sinks and maintaining ecosystem stability [12]. Therefore, it is essential to monitor vegetation health in biosphere reserves.
Monitoring vegetation health with traditional manual forest patrol methods becomes challenging for covering extensive areas. Remote sensing technology, with its ability to provide extensive and repeatable Earth observations, holds immense potential for monitoring vegetation health on a broad scale [13,14]. Changes in photosynthetic pigment levels and canopy architecture accompany vegetation stress [14,15], and recent studies have demonstrated that remote sensing can identify spectral changes resulting from alterations in pigment content and canopy architecture. For instance, Jump et al. [16] discovered that tree dieback can lead to a decrease in water content and Leaf Area Index (LAI). Dallahi et al. [17] assessed forest dieback using the Normalized Difference Vegetation Index (NDVI); Eitel et al. [18] found that the Normalized Difference Red-edge Index (NDRE) can be used to monitor early red-edge increase; Gitelson et al. [19] found a strong correlation between the Green Normalized Difference Vegetation Index (GNDVI) and chlorophyll a, and Wojtowicz et al. [20] used GNDVI to identify the vegetation infected with leaf rust; Gupta and Pandey [21] analyzed and mapped forest health using Anthocyanin Reflectance Index 1 (ARI1). Typically, researchers fit vegetation indices to field data to reflect forest health conditions.
With advancements in remote sensing image resolution and the availability of computing power, research focus has shifted towards the elaborate identification of unhealthy trees using high-resolution (30 cm–2 m) and ultra-high-resolution (<30 cm) remote sensing images. Researchers frequently employ intelligent classification algorithms such as random forest (RF), Support Vector Machine (SVM), and Convolutional Neural Networks (CNN) to automate image classification and target extraction [22]. For example, Wang et al. [23] mapped robinia pseudoacacia forest health conditions using RF; Syifa et al. [24] achieved a 94.13% accuracy in identifying pine trees suffering from pine wilt disease using SVM; Han et al. [25] and Hu et al. [26] used deep learning algorithms to monitor pine forest disease outbreaks.
Although machine learning algorithms can be effective for monitoring forest species [27,28,29], there may be some limitations in terms of vegetation health. Vegetation indices for forest health mapping actually correspond to the proportion of unhealthy trees within sample plots using medium-resolution (2 m–30 m) remote sensing images [17,30,31,32,33,34]. In areas where the probability of unhealthy tree occurrence is low, such sample data is difficult to obtain, which is because a single pixel typically corresponds to approximately 100 square meters in medium-resolution image (i.e., Sentinel-2 image). This is particularly true for biosphere reserves, especially those at high elevations and steep regions, where field sampling often involves danger. Due to conservation policies and safety factors, research in such areas is relatively scarce [35]. High-resolution remote sensing images can be used to identify unhealthy trees elaborately. Relative to medium-resolution images, it provides more sample pixels for the same area in field surveys. However, the high cost of acquiring high-resolution remote sensing images has limited their application. Due to the challenges of field sampling and data acquisition costs, most research has focused on forest areas already experiencing severe diseases [24,36]. Nevertheless, from the warning perspective, monitoring vegetation health in areas with a low probability of unhealthy tree occurrence is equally important [37].
Considering the limitations of previous research, this study aims to conduct vegetation health monitoring in areas with a low probability of unhealthy tree occurrence. Jiuzhaigou Valley Biosphere Reserve was selected as a case in this study. Jiuzhaigou Valley is not only a world nature heritage site but also a biosphere reserve, where forest ecosystems have been relatively well-preserved. However, recent disturbances, including human activities and geological disasters, particularly landslides, have resulted in varying degrees of disruption to the forest health status of Jiuzhaigou Valley.
We proposed a technology integration approach that combines remote sensing intelligent identification and quantitative retrieval, and analyzed forest health in Jiuzhaigou Valley Biosphere Reserve’s typical areas. We utilized WorldView-2 images to perform elaborate identification of unhealthy trees within specific years. Based on elaborate identification results of unhealthy trees, we used Sentinel-2 images to extract typical indices related to vegetation and map the susceptibility of unhealthy trees through fuzzy operations yearly. By overcoming the sampling amount constraint, this method enabled cost-effective tree health monitoring in large areas annually with low probability of unhealthy tree occurrence through the applied solution of technology integration.
2. Study Area and Data
2.1. Study Area
Jiuzhaigou Valley, located in Zhangzha Town in Aba Autonomous Prefecture, Sichuan Province, China (geographic coordinates: 32°54′N–33°19′N, 103°46′E–104°5′E), holds the dual status of being a world heritage site and a biosphere reserve. The reserve boasts not only stunning landscapes, including waterfalls, calcifications, and terraces, but also hosts a diverse array of rare and protected species, making it a crucial animal and plant gene bank [38,39]. The topography of Jiuzhaigou Valley is characterized by rolling peaks, with elevations ranging from 1996 m at the entrance to 4764 m at the highest point [40]. Jiuzhaigou Valley boasts an impressive 80% vegetation cover, displaying a vertical distribution pattern [41]. The forest types include mixed coniferous and broadleaf forests dominated by Chinese pine and poplar at elevations of 2000 to 2800 m, subalpine coniferous forests primarily featuring spruce and fir at elevations of 2800 to 3800 m, and alpine meadows above 3800 m. Results from field surveys indicate that that unhealthy trees in Jiuzhaigou Valley are concentrated among coniferous trees, with Chinese pine being affected by Sonsaucoccus sinensis, leading to a visible whitening of affected trees, and human activities will intensify this process. Spruce and fir suffer from leaf fall disease, resulting in yellowing leaves that gradually fall off. In addition to being disturbed by diseases, the vegetation in Jiuzhaigou Valley is also affected by geological disasters. For example, landslides will cause damage to the root system of vegetation, which will lead to the withering of vegetation. In this study, trees infected by natural diseases, aggravated by human activities, and affected by geological disasters are collectively referred to as unhealthy trees.
Jiuzhaigou Valley comprises two typical regions, namely Zaru Valley and Changhai Valley (Figure 1). Zaru Valley, situated near the reserve entrance, is one of the main areas for residents, covering an area of approximately 23 km2, with elevations ranging from 2000 to 2500 m. The dominant vegetation type in this region is Chinese pine. Changhai Valley, the innermost scenic point within the reserve, has elevations around 3500 m, covering an area of approximately 10 km2. Changhai Valley is primarily covered by spruce and fir forests.
2.2. Data Description
We conducted extensive data acquisitions from spaceborne, Unmanned Aerial Vehicle (UAV), and ground-based platforms in Zaru Valley and Changhai Valley. To understand and confirm the spectral characteristics exhibited by unhealthy trees, in Zaru Valley and Changhai Valley, we conducted spectral measurements of Chinese pine, spruce, and fir using a spectroradiometer (Product Model: ASD FieldSpec) in July 2022. Due to the high risk of geological hazards such as landslides, we only measured the spectral curves of healthy trees and unhealthy trees affected by diseases. We measured spectral data for 40 sets of healthy spruce and 20 sets of unhealthy spruce, 20 sets of healthy fir and 10 sets of unhealthy fir, and 30 sets of healthy Chinese pine and 15 sets of unhealthy Chinese pine. Then spectral curves of healthy and unhealthy trees were generated (Figure 2), revealing that unhealthy spruce and fir share similar spectral trends, exhibiting high reflectance anomalies from 450 nm to 700 nm and low reflectance anomalies in the near-infrared (NIR) range. Spectral curves of Chinese pine show a slightly different trend, with high reflectance anomalies occurring in the NIR range. Overall, the spectral curve trends of these three types of unhealthy trees are consistent with previous research, thus supporting the use of commonly employed spectral indices for elaborate identification of unhealthy trees in this study [14,28,33].
To construct the sample dataset, we conducted low-altitude UAV flights above the canopy and captured realistic images in July 2022. We also conducted nap-of-the-earth flights in Zaru Valley and Changhai Valley using the DJI Phantom 4 RTK UAV. The DJI Phantom 4 RTK offers a positioning accuracy of 2 cm, equipped with a lens with 20 million effective pixels per photo. The flight altitude was set at 150 m, with a lateral overlap rate of 70% and a forward overlap rate of 50%. Through flight planning, we obtained a series of overlapping aerial photos, which were registered and stitched together in DJITerra 3.3.4 software to produce ultra-high-resolution orthophotos. These images of unhealthy trees and orthophotos were used to determine the locations of unhealthy trees (Figure 3). Through UAV orthophotos and realistic images, we delineated 103 samples of unhealthy trees in the WorldView-2 images. Among them, 49 were located in Zaru Valley, and 54 were in Changhai Valley.
Jiuzhaigou Valley experiences unpredictable weather, with mountain peaks often shrouded in clouds and frequent rain showers within a single day. This results in a limited time window for UAV operations, making it difficult to collect data on a large scale. To overcome this limitation, we utilized WorldView-2 images to perform elaborate identification of unhealthy trees in the study area. WorldView-2 images offer eight bands, providing more features than other multispectral images (e.g., Pleiades-1, ZY-3, SuperView Neo, KOMPSAT-3) that typically offer only four bands (blue, green, red, and NIR). The additional bands in WorldView-2 can be used to construct more features, enhancing the ability to reflect vegetation health conditions. The WorldView-2 image underwent radiometric calibration, FLAASH atmospheric correction, orthorectification, and Gram-Schmidt pan sharpening using Envi 5.3 software, resulting in a 0.5 m multispectral surface reflectance image for the study area (Figure 4). The Digital Elevation Model (DEM) employed for orthorectification was sourced from Shuttle Radar Topography Mission (SRTM). In FLAASH atmospheric correction, we applied the atmospheric model ‘sub-arctic summer’ during spring and ‘mid-latitude summer’ during summer. The aerosol model was ‘tropospheric’ for both cases. For Zaru Valley, WorldView-2 images from 22 July 2022 (summer) and 29 April 2018 (spring) were selected. In the case of Changhai Valley, WorldView-2 images from 13 September 2021 (summer) were chosen.
We utilized Sentinel-2 images to achieve cost-effective annual vegetation health monitoring. The original Sentinel-2 images were L1C products, and we performed atmospheric correction using the Sen2Cor processor to obtain surface reflectance products (L2A products). Subsequently, the Sen2Res plugin in Snap 9.0.0 software was used to resample L2A products to a 10-m resolution. The Sen2Res plugin established a model to unmix the 20-m and 60-m pixel bands while retaining their reflectance information. We examined the entire archive of Sentinel-2 images from 2017 to 2022 and selected images with minimal cloud cover. The final selection of image dates is as follows: 29 July 2017; 14 July 2018; 3 August 2019; 27 August 2020; 2 August 2021; and 8 July 2022.
3. Methods
Vegetation under stress exhibits anomalous spectral responses, which can be utilized to construct spectral features for identifying unhealthy trees, and unhealthy trees can be distinctly observed in ultra-high-resolution images captured by UAV, providing reliable sample data. Based on these features and samples, a classifier can be developed to identify unhealthy trees in high-resolution satellite remote sensing images. Generally, a medium-resolution remote sensing image is cost-effective and offers a greater number of spectral bands than a high-resolution image, allowing for more accurate atmospheric correction and quantitative retrieval [42]. Indices obtained through this quantitative retrieval can be used to monitor trends in leaf pigment and canopy architecture of unhealthy trees, and these trends can be fitted using fuzzy operations to complete susceptibility mapping of unhealthy trees.
Building upon the mentioned principles, a flowchart for susceptibility mapping of unhealthy trees was proposed (Figure 5). Firstly, data acquisition was conducted. After data acquisition, we initially applied the ENVI forest health tool on the Sentinel-2 image to find the hot-score area, which represented the study area with a low level of forest health [21]. Then we computed indices related to leaf pigment and canopy architecture in the study area. Subsequently, we conducted elaborate identification of unhealthy trees within the study area using the WorldView-2 image, in conjunction with field data and UAV images. Based on identification results of unhealthy trees, we calculated the relative certainty factor (RCF) of indices from Sentinel-2 and fitted them using fuzzy membership functions. Then we applied the fitted membership functions on the entire sentinel-2 image, producing membership images for each index in the study area. Finally, by fusing individual membership images, we mapped the susceptibility of unhealthy trees.
Our innovative methods seamlessly integrate data from multiple sources, enabling vegetation health monitoring. Through ultra-high-resolution images and field data, we have successfully identified unhealthy trees in high-resolution remote sensing images. These identification results can be further applied in medium-resolution images, especially in regions where the occurrence rate of unhealthy trees is low. By employing fuzzy operations and combining indices derived from Sentinel-2 images with the identified unhealthy trees from subzones, we generated susceptibility maps for unhealthy trees. This method allowed for cost-effective and large-scale vegetation health monitoring and early warning in similar biosphere reserves.
3.1. Feature Extraction
3.1.1. Calculation of Forest Health Index
Forest Health Index is calculated by the ENVI forest health tool. The delineation of forest health levels relies on predefined prior knowledge, with results influenced by indices related to leaf pigment and canopy water content or light use efficiency. The forest health tool categorizes an image into 10 levels, and the reliability of the result is contingent on the degree to which prior knowledge matches the actual situation. Formula (1) is listed as follows:
where is the forest health index, determines whether pixels participate in calculation, reflects the concentration of carotenoids and anthocyanin under vegetation stress, measures the efficiency of vegetation in utilizing incident light during photosynthesis.
3.1.2. Calculation of Index Related to Leaf Pigment and Canopy Architecture
Leaf pigments, including chlorophyll, carotenoids, and anthocyanin [43], exhibit strong light absorption capabilities in specific spectral bands, which can be assessed through surface reflectance. Based on the wavelengths of the bands in Sentinel-2 images, we selected three spectral indices to reflect vegetation leaf pigment content: GNDVI for chlorophyll [44], Red Green Ratio Index (RGRI) for carotenoids [43], and Anthocyanin Reflectance Index 2 (ARI2) for anthocyanin [45]. The three indices are formulated as follows:
where and are reflectances at NIR and green bands on Sentinel-2 image, is the reflectance at nm on the Sentinel-2 image, is the reflectance at nm on the Sentinel-2 image, , , and are reflectances at 800 nm, 700 nm, and 550 nm on the Sentinel-2 image.
Unhealthy trees can also suffer damage to their canopy architecture. Snap 9.0.0 software provides the biophysical processor tool for the retrieval of vegetation canopy architecture [46]. This retrieval algorithm is based on a predefined PROSAIL radiative transfer model, which links the spectral dimension of the reflectance to the directional dimension related to canopy architecture [47,48]. The indices retrieved include Leaf Area Index (LAI), Canopy Water Content (CWC), and Canopy Chlorophyll Content (CCC) [49]. LAI represents the multiple of the total leaf area of plants per unit land area. CWC and CCC represent the content of water and chlorophyll per unit area.
3.2. Elaborate Identification of Unhealthy Trees
We used WorldView-2 images for elaborate identification of unhealthy trees in the study area. Firstly, we performed multiresolution segmentation on the WorldView-2 image. Multiresolution segmentation is developed by eCognition 9.0 software, with results determined by three parameters, including scale, shape, and compactness. Previous research has shown that for vegetation, setting the shape parameter to 0.5 and the compactness parameter to 0.8 is appropriate [36,50]. Scale parameters need to be adjusted according to the application scenario.
After multiresolution segmentation, the object feature value was extracted by the mean pixels feature values. Spectral features were calculated based on spectral curves (Table 1), and texture features were computed using gray-level co-occurrence matrix (GLCM). There are 8 texture measures calculated from GLCM, including Mean, Dissimilarity, Second moment, Contrast, Correlation, Variance, Homogeneity, and Entropy [51,52].
Based on ultra-high-resolution UAV images, the sample dataset was created. To simplify the classification model, only two categories were set up, which are unhealthy tree and others. Subsequently, an RF classifier was constructed based on the feature set and sample dataset. RF is the most commonly used machine learning algorithm in vegetation health monitoring [22] which can distinguish between unhealthy tree and others.
To evaluate the accuracy in identification of unhealthy trees, Precision, Recall, and F1 Score served as metrics for identifying unhealthy trees. They are formulated as follows:
where represents the quantity of correctly identified positive samples, represents the quantity of falsely identified negative samples, and represents the quantity of missed positive samples.
3.3. Susceptibility Mapping of Unhealthy Trees
3.3.1. Calculation of RCF
After processing in Section 3.1 and Section 3.2, we obtained indices related to leaf pigment and canopy architecture on the Sentinel-2 image and elaborate identification results of unhealthy trees on the WorldView-2 image. We employed the certainty factor (CF) method for calculating index sensitivity. The CF method was initially proposed by Shortliffe and Buchanan [53] and subsequently applied to assess landslide susceptibility in Jiuzhaigou Valley [54]. In this study, we analyzed the sensitivity of each index affecting the occurrence of unhealthy trees from Sentinel-2 images. To facilitate subsequent fuzzy fitting, we normalized the CF to RCF. The RCF is formulated as follows:
where is the probability of unhealthy tree occurrence in category “” of a feature, and is the probability of unhealthy tree occurrence in the whole area. The range of is 0 to 1, and the closer it is to 1, the probability of unhealthy tree occurrence is higher.
3.3.2. Fuzzy Fitting and Fusion
Fuzzy set theory, first introduced by Zadeh [55], extends the classical set theory to handle cases where binary (0 and 1) definitions are not suitable. It involves analyzing fuzzy objects through the establishment of appropriate membership functions and related operations on fuzzy sets. Common fuzzy membership function curves include Z-shaped, S-shaped, and bell-shaped curves (Figure 6).
In this study, we employed the sigmoid function (Formula (6)) to fit S-shaped and Z-shaped curves and utilized the Gaussian function (Formula (7)) and the Fuzzy Near function (Formula (8)) to fit bell-shaped curves.
where is the feature value, is the spread, is the midpoint of the function. The spread determines the steepness of the function. The midpoint determines the feature value with the membership equal to 0.5.
After fitting RCF with fuzzy membership functions, we applied the fitted membership functions to the whole Sentinel-2 image, resulting in membership images for each index. These images were then fused using the Fuzzy Gamma (Formula (9)) method to map the susceptibility of unhealthy trees.
where is the membership value of each index, controls the increasing and decreasing effect of the final result.
Based on the distribution and susceptibility of unhealthy trees, we used the Receiver Operating Characteristic (ROC) curve to evaluate the quality of the Fuzzy Gamma method. The ROC curve visualized the trade-off between true positive and false positive rates, which can be effectively used to evaluate binary classification problems in machine learning [56]. The X-axis of the ROC curve is the False Positive Rate, and the Y-axis of the ROC curve is the True Positive Rate. The Area Under the Curve (AUC) represents the area under the ROC curve, which ranges from 0 to 1, with higher values indicating better model performance.
4. Results
4.1. FHI Distribution
In order to mitigate interference from alpine meadows and areas with low vegetation cover on the calculation of , the calculation area was limited to a 1 km buffer zone on both sides of scenic roads in Jiuzhaigou Valley. Additionally, we computed at different altitudes with 500 m elevation intervals. The final distribution is depicted in Figure 7. The distribution map reveals that every region within Jiuzhaigou exhibits areas with low forest health levels. This is because Envi 5.3 forces the division of into 10 levels. Consequently, even in regions that are generally healthy, pixels with low are observed. Therefore, it was necessary to disregard scattered pixels with low forest health levels and focus on the clustered areas of low forest health levels as hot-score areas of unhealthy trees. We identified clusters of low forest health pixels in the northwest of Zaru Valley and the west of Changhai Valley. Therefore, we designated Zaru and Changhai Valley as the hot-score areas for research on unhealthy trees.
4.2. Identification of Unhealthy Trees
We conducted elaborate identification of unhealthy trees in Zaru and Changhai Valley. Initially, we determined the optimal scale parameter in multiresolution segmentation. As shown in Figure 8, when the scale parameter increased from 5 to 20, unhealthy trees were effectively segmented. Therefore, we set the scale parameter to 20. Subsequently, we constructed an RF classifier. The sample dataset was divided into train and test sets at a 7:3 ratio. Gao et al. [57] have previously demonstrated that using the kernel size of 31 for GLCM at the pixel level results in optimal classification (Figure 9). Thus, in this study, GLCM was calculated using the kernel size of 31. We computed the mean values of 8 bands, spectral features, and GLCM texture measures for each object on the WorldView-2 image, using them as features to construct a new RF classifier. Classification results on the test set indicated that, at the object level, the F1 Score for identifying unhealthy trees reached 77.1% in Zaru Valley and 81.2% in Changhai Valley.
We applied the constructed RF classifier to the entire Zaru and Changhai Valley, ultimately obtaining elaborate distributions of unhealthy trees, as depicted in Figure 10. It is evident that unhealthy trees in Changhai Valley are primarily concentrated in the landslide-prone area flanking Changhai Lake, and unhealthy trees in Zaru Valley are concentrated near the residential area, which implies that geological disasters and human activities will cause a certain degree of disturbance to vegetation health in Jiuzhaigou Valley.
4.3. Mapping Susceptibility of Unhealthy Trees
We combined altitude (calculated from SRTM DEM) and indices calculated from Sentinel-2 images with identification results of unhealthy trees to calculate their RCFs, and used fuzzy membership functions to fit RCFs. Figure 11 displays the curves of RCF and the corresponding fitted fuzzy membership functions.
In Changhai Valley, CCC and LAI exhibited S-shaped curves, indicating that areas with low CCC and LAI were more susceptible to unhealthy trees, and the probability of unhealthy trees decreased as CCC and LAI increased. ARI2 and RGRI displayed bell-shaped curves, suggesting that in areas under vegetation stress, the increase in anthocyanin and carotenoids content occurred, which led to a yellowing appearance of leaves. Beyond a certain threshold in ARI2 and RGRI, the probability of unhealthy trees occurrence declined, corresponding to areas not covered by spruce and fir. As for CWC, we found that unhealthy trees in Changhai Valley were not sensitive to CWC, implying that leaf fall disease did not directly affect the canopy water content of vegetation in Changhai Valley. From the altitude distribution of unhealthy trees, there were fewer unhealthy trees at 3000 m, and there were significantly more unhealthy trees from 3000 m to 3400 m upwards. Later, as the altitude increased, the number of unhealthy trees gradually decreased again. Since the decrease was much smaller in magnitude than the increase, we chose to use a Z-shaped curve to fit the altitude in Changhai Valley.
In Zaru Valley, the trends of RCFs curves for CCC, LAI, ARI2, and RGRI were similar to those in Changhai Valley: LAI and CCC exhibited S-shaped curves, with a lower probability of unhealthy trees as LAI and CCC increased; ARI2 and RGRI displayed bell-shaped curves, indicating that unhealthy trees in Zaru Valley were more likely to occur in areas with elevated carotenoids and anthocyanin content. In contrast to Changhai Valley, unhealthy trees in Zaru Valley exhibited a bell-shaped sensitivity curve to CWC. The area with 0.01 to 0.02 g/m2 CWC represented herbaceous and mixed pixel, while unhealthy trees were predominantly found in areas with 0.03 g/m2 CWC. This suggests that Sonsaucoccus sinensis affects the canopy water content in Jiuzhaigou Valley. Examining the altitude distribution of unhealthy trees in Zaru Valley, it exhibited the pattern of the Gaussian function. Notably, the probability of unhealthy trees occurrence increased slightly at an elevation of 3000 m in Zaru Valley, which was associated with minor landslides at the mountaintop.
We applied the fitted membership functions to each feature and performed the Fuzzy Gamma method. Figure 12 illustrates the trend of AUC with varying gamma values in 2022. It can be seen that gamma has a minor impact on AUC, with the maximum AUC achieved when gamma equals 0.9, yielding an AUC of 0.852. Figure 13 displays the ROC curves for data in 2022 and 2018. The AUC was 0.852 in 2022 and 0.921 in 2018. The high AUC values indicate the reliability of mapping the susceptibility of unhealthy trees through the Fuzzy Gamma method. Figure 14 shows a partial enlarged view of the susceptibility of unhealthy trees in Zaru Valley in 2022, demonstrating a high consistency between high susceptibility areas and unhealthy trees identified through the WorldView-2 image.
5. Discussion
5.1. Advantage and Limitation
Satellite images have traditionally been employed to identify widespread forest diseases [28,36]. This is because only when tree diseases occur extensively can they be clearly observed in satellite remote sensing images [36,58,59]. Dennison et al. [60] and Malinee et al. [61] used machine learning to identify unhealthy trees in satellite remote sensing images, but their results were all at the pixel level.
In areas with a low probability of unhealthy tree occurrence, it is necessary to identify the objects of individual trees. This study utilized an object-oriented classification approach that combines spectral and textural features and found that 0.5 m resolution WorldView-2 images can achieve elaborate identification of unhealthy trees in Jiuzhaigou Valley. The object-oriented approach identifies unhealthy tree objects rather than individual pixels.
While the WorldView-2 image is suitable for identification of unhealthy trees, its high acquisition cost and limited archive data make it unsuitable for continuous vegetation health monitoring. The Sentinel-2 image, provided by European Space Agency (ESA) free of charge, offers a wealth of images to choose from each year, making it a suitable choice for long-term monitoring. The Sentinel-2 image can be resampled to a maximum of 10-m resolution, which is insufficient for distinguishing individual trees [29,58]. However, Sentinel-2 images can provide more precise indices related to leaf pigment and canopy architecture [62]. These indices can be used to infer the susceptibility of unhealthy trees. This study, through the calculation of RCF and fuzzy fitting, discovered spatial relationships between unhealthy tree distribution and indices such as altitude, CCC, LAI, RGRI, and ARI2. These relationships indicate that unhealthy trees show significant trends in pigment content and canopy architecture [21,43,45,63,64]. The CWC in Changhai Valley indicates that the disease characteristics of vegetation in different regions may not necessarily be entirely identical. Finally, leveraging these relationships, we conducted susceptibility mapping of unhealthy trees, and the results exhibited high reliability across different years.
The final susceptibility maps of unhealthy trees can be used to analyze trends of forest health in recent years within the study area. They can also pinpoint hot-score areas where diseases are currently occurring. In the future, these areas can in turn be targeted for elaborate identification of unhealthy trees using WorldView-2 images, with forest conservation officers dispatched to rescue unhealthy trees in key areas. In contrast to previous studies [65,66], our methods markedly reduce the dependence on sample quantity.
Our research also has some limitations, primarily related to the time scale. The spectral response of vegetation exhibits seasonal variations, and the spectral characteristics of stressed vegetation also change over time [67]. Typically, these spectral differences are most pronounced during the summer [31], which coincides with the Sentinel images used in this study. In fact, we were unable to find suitable Sentinel-2 images for other seasons due to high cloud cover in Jiuzhaigou Valley. Consequently, the inability to analyze the forest health of Jiuzhaigou Valley in different seasons is a limitation of our study. Additionally, it is worth noting that, for longer time spans, it may be necessary to correct the membership functions using WorldView-2 images in a specific year.
5.2. Annual Maps of Unhealthy Tree Susceptibility
Figure 15 displays the annual maps of unhealthy tree susceptibility in Zaru Valley from 2017 to 2022. It is evident that in Zaru Valley, high susceptibility zones for unhealthy trees are concentrated in residential areas of northwestern Zaru Valley, while the forests in the southeastern part of Zaru Valley experience very few diseases. This suggests that human activities are the primary driving factor for vegetation health in Zaru Valley. From 2017 to 2022, the high susceptibility areas near residential areas have shown an increasing trend, indicating continuous disturbance by human activities in the forests near these residential areas, with no effective control measures in place. Additionally, the sides of roads in Zaru Valley have also been identified as high susceptibility zones for unhealthy trees. This is because the pixels in Sentinel-2 images located on the sides of roads are mixed pixels of both road and vegetation. Mixed pixels refer to pixels that represent a combination of multiple different types. These mixed pixels exhibit spectral characteristics similar to those of unhealthy trees, making them easily identifiable as high susceptibility pixels [68].
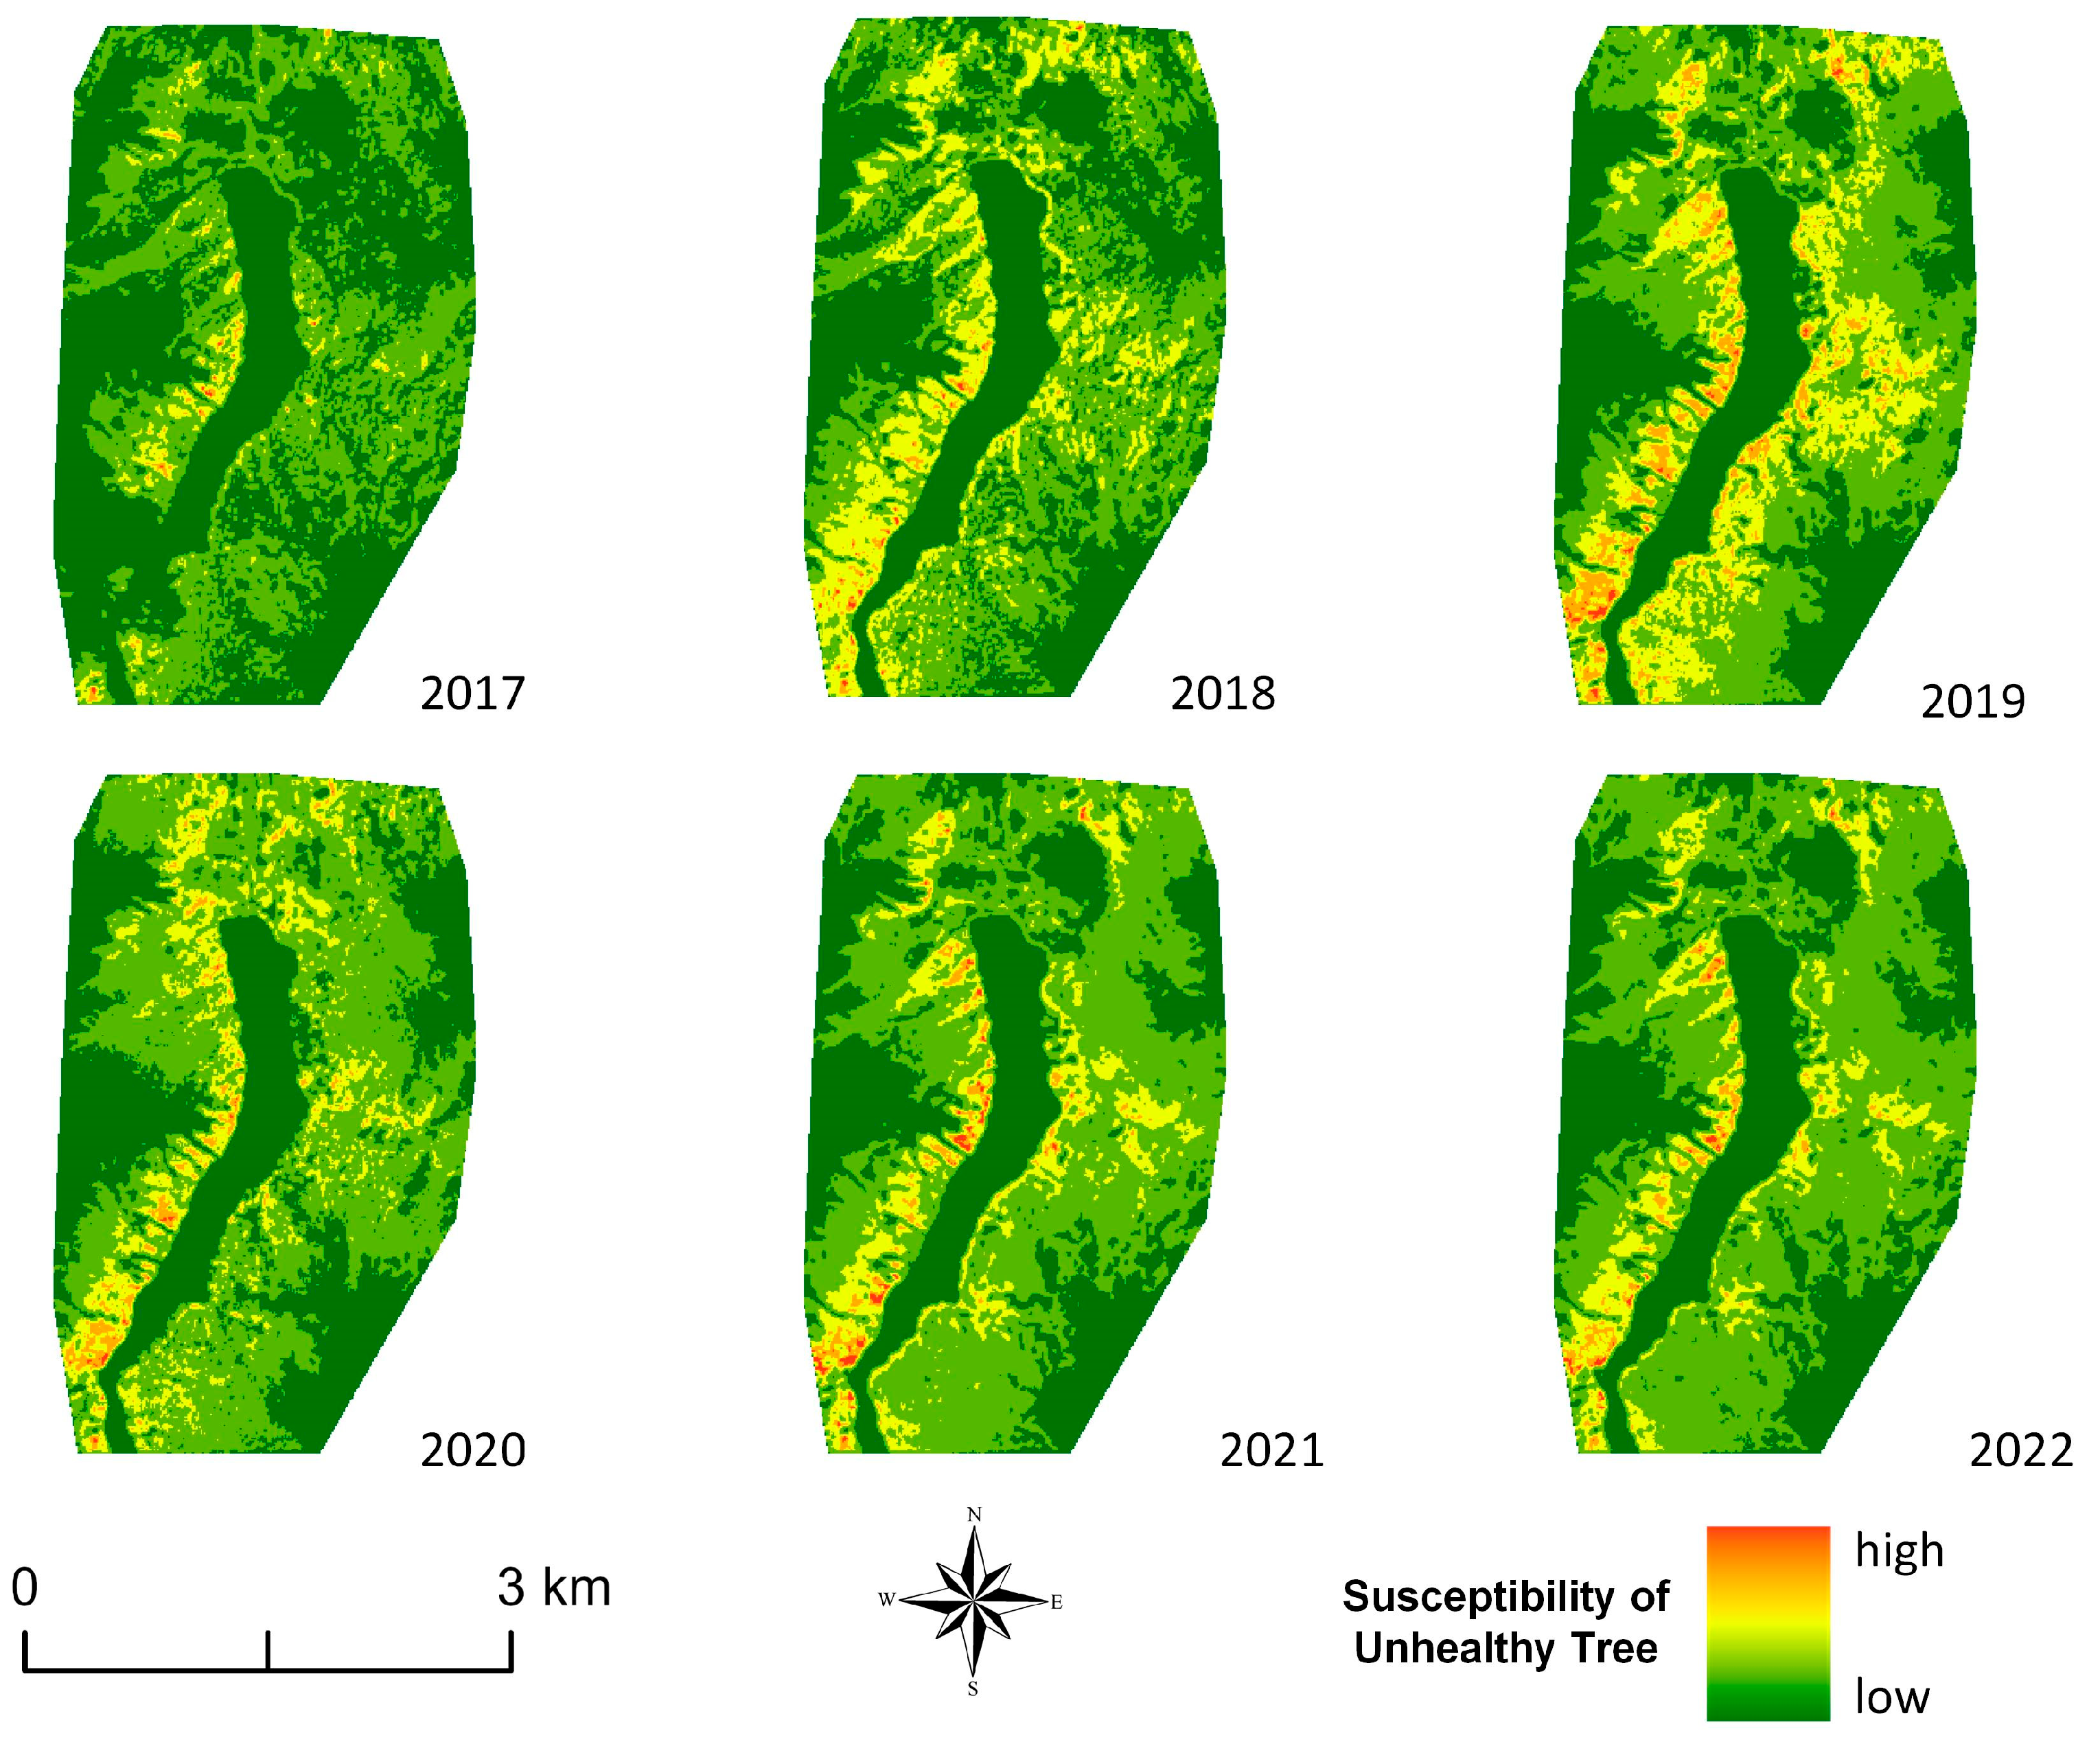
Figure 16 illustrates the annual maps of unhealthy tree susceptibility in Changhai Valley from 2017 to 2022. We observed that in 2017, the forests in Changhai Valley were in good health. However, in 2018 and 2019, the high susceptibility areas for unhealthy trees expanded significantly, primarily concentrated on the hillsides on both sides of Changhai Lake. This expansion can be attributed to the 2017 Ms 7.0 Jiuzhaigou earthquake [54], which triggered landslides that damaged the root systems of the vegetation. This directly led to vegetation mortality. Starting from 2020, the high susceptibility areas for unhealthy trees remained relatively stable. This indicates that the damage caused by landslides was not fatal to the forests. Forests in Changhai Valley exhibit a certain level of resistance to disturbances, and are currently in the process of recovery.
Our mapping of annual unhealthy tree susceptibility in Zaru and Changhai Valley reveals that human activities and geological disasters influence the forest health in Jiuzhaigou Valley. The forests in Jiuzhaigou Valley possess inherent resilience to disturbances, with geological events such as landslides causing limited damage over the short-term. However, continuous human disturbances, exacerbated by post-disaster reconstruction activities in recent years, could contribute to a more substantial impact.
6. Conclusions
In this study, we have produced susceptibility maps of unhealthy trees in the Jiuzhaigou Valley Biosphere Reserve through a technology integration approach. Our findings indicate the following:
- (1)
- The object-oriented classification method employing spectral and texture features has proven effective in identifying unhealthy trees within Jiuzhaigou Valley Biosphere Reserve on high-resolution satellite images;
- (2)
- Fuzzy fitting has revealed the relationship of leaf pigment and canopy architecture to unhealthy trees in the Jiuzhaigou Valley. And the Fuzzy Gamma method has enabled the effective generation of susceptibility distribution maps for unhealthy trees within the Jiuzhaigou Valley using medium-resolution satellite images;
- (3)
- The vegetation health in Jiuzhaigou Valley is primarily influenced by natural disasters and human activities. Natural processes endow forests with a certain degree of resilience to natural disasters, while human activities have continued to disturb the vegetation health over recent years. Therefore, it is imperative to focus on mitigating the effects of human activities on the forest health in Jiuzhaigou Valley and implement protective measures, especially in areas highly affected by disturbances.
Our study has demonstrated the applicability of object-oriented classification methods and fuzzy operations on forest health indices in mapping the susceptibility of unhealthy trees in the Jiuzhaigou Valley Biosphere Reserve. The ROC curves obtained from Sentinel-2 images for 2022 and 2018 suggest that the indices do not undergo significant changes over the five years of observation. Well-fitted fuzzy membership functions can be utilized for the scenario prediction in the short term. This study provides a solution for cost-effective forest health monitoring, which also has potential for the conservation of other biosphere reserves across the world.
Author Contributions
Conceptualization, S.G. and F.C.; methodology, S.G., F.C. and P.S.; software, S.G. and W.Z.; formal analysis, S.G. and Q.W.; investigation, P.S. and Q.W.; resources, W.Z., M.Z. and Q.W.; data curation, W.Z., M.Z. and Q.W.; writing—original draft preparation, S.G.; writing—review and editing, S.G. and F.C.; visualization, S.G.; supervision, F.C. and Q.W.; project administration, Q.W.; funding acquisition, F.C. and Q.W. All authors have read and agreed to the published version of the manuscript.
Funding
This research was funded by the Jiuzhaigou Scenic Area Administration Bureau with the project titled “Forest Vegetation Classification and Health Research Based on Remote Sensing Technology” (Project No.: 2021KJC-Y-0486).
Data Availability Statement
Sentinel-2 images can be downloaded from the European Space Agency (scihub.copernicus.eu/dhus/#/home) free of charge (accessed on 10 May 2023), while additional data can be obtained by contacting the corresponding author.
Acknowledgments
We would like to express our sincere gratitude to the Jiuzhaigou Scenic Area Administration Bureau for their generous support and funding.
Conflicts of Interest
The authors declare no conflict of interest.
References
- Jakob, M.; Steckel, J.C. Implications of climate change mitigation for sustainable development. Environ. Res. Lett. 2016, 11, 104010. [Google Scholar] [CrossRef]
- HalsnÆS, K.; Shukla, P.R.; Garg, A. Sustainable development and climate change: Lessons from country studies. Clim. Policy 2008, 8, 202–219. [Google Scholar] [CrossRef]
- Godfray, H.C.; Beddington, J.R.; Crute, I.R.; Haddad, L.; Lawrence, D.; Muir, J.F.; Pretty, J.; Robinson, S.; Thomas, S.M.; Toulmin, C. Food security: The challenge of feeding 9 billion people. Science 2010, 327, 812–818. [Google Scholar] [CrossRef] [PubMed]
- Gädeke, A.; Langer, M.; Boike, J.; Burke, E.J.; Chang, J.; Head, M.; Reyer, C.P.O.; Schaphoff, S.; Thiery, W.; Thonicke, K. Climate change reduces winter overland travel across the Pan-Arctic even under low-end global warming scenarios. Environ. Res. Lett. 2021, 16, 024049. [Google Scholar] [CrossRef]
- Krab, E.J.; Aerts, R.; Berg, M.P.; van Hal, J.; Keuper, F. Northern peatland Collembola communities unaffected by three summers of simulated extreme precipitation. Appl. Soil Ecol. 2014, 79, 70–76. [Google Scholar] [CrossRef]
- Wang, W.; Wang, S.; Ma, X.; Gong, J. Recent advances in catalytic hydrogenation of carbon dioxide. Chem. Soc. Rev. 2011, 40, 3703–3727. [Google Scholar] [CrossRef]
- Yang, P.; Peng, S.; Benani, N.; Dong, L.; Li, X.; Liu, R.; Mao, G. An integrated evaluation on China’s provincial carbon peak and carbon neutrality. J. Clean. Prod. 2022, 377, 134497. [Google Scholar] [CrossRef]
- Wei, Y.-M.; Chen, K.; Kang, J.-N.; Chen, W.; Wang, X.-Y.; Zhang, X. Policy and Management of Carbon Peaking and Carbon Neutrality: A Literature Review. Engineering 2022, 14, 52–63. [Google Scholar] [CrossRef]
- Batisse, M. Action Plan for Biosphere Reserves. Environ. Conserv. 2009, 12, 17–27. [Google Scholar] [CrossRef]
- Ishwaran, N.; Persic, A.; Tri, N.H. Concept and practice: The case of UNESCO biosphere reserves. Int. J. Environ. Sustain. Dev. 2008, 7, 118–131. [Google Scholar] [CrossRef]
- Reed, M.G. The contributions of UNESCO Man and Biosphere Programme and biosphere reserves to the practice of sustainability science. Sustain. Sci. 2018, 14, 809–821. [Google Scholar] [CrossRef]
- Wang, J.; Feng, L.; Palmer, P.I.; Liu, Y.; Fang, S.; Bosch, H.; O’Dell, C.W.; Tang, X.; Yang, D.; Liu, L.; et al. Large Chinese land carbon sink estimated from atmospheric carbon dioxide data. Nature 2020, 586, 720–723. [Google Scholar] [CrossRef] [PubMed]
- Iverson, L.R.; Graham, R.L.; Cook, E.A. Applications of satellite remote sensing to forested ecosystems. Landsc. Ecol. 1989, 3, 131–143. [Google Scholar] [CrossRef]
- Wulder, M.A.; Dymond, C.C.; White, J.C.; Leckie, D.G.; Carroll, A.L. Surveying mountain pine beetle damage of forests: A review of remote sensing opportunities. For. Ecol. Manag. 2006, 221, 27–41. [Google Scholar] [CrossRef]
- Croft, H.; Chen, J.M.; Zhang, Y.; Simic, A. Modelling leaf chlorophyll content in broadleaf and needle leaf canopies from ground, CASI, Landsat TM 5 and MERIS reflectance data. Remote Sens. Environ. 2013, 133, 128–140. [Google Scholar] [CrossRef]
- Jump, A.S.; Ruiz-Benito, P.; Greenwood, S.; Allen, C.D.; Kitzberger, T.; Fensham, R.; Martinez-Vilalta, J.; Lloret, F. Structural overshoot of tree growth with climate variability and the global spectrum of drought-induced forest dieback. Glob. Chang. Biol. 2017, 23, 3742–3757. [Google Scholar] [CrossRef] [PubMed]
- Dallahi, Y.; Boujraf, A.; Meliho, M.; Orlando, C.A. Assessment of forest dieback on the Moroccan Central Plateau using spectral vegetation indices. J. For. Res. 2022, 34, 793–808. [Google Scholar] [CrossRef]
- Eitel, J.U.H.; Vierling, L.A.; Litvak, M.E.; Long, D.S.; Schulthess, U.; Ager, A.A.; Krofcheck, D.J.; Stoscheck, L. Broadband, red-edge information from satellites improves early stress detection in a New Mexico conifer woodland. Remote Sens. Environ. 2011, 115, 3640–3646. [Google Scholar] [CrossRef]
- Gitelson, A.A.; Kaufman, Y.J.; Merzlyak, M.N. Use of a green channel in remote sensing of global vegetation from EOS-MODIS. Remote Sens. Environ. 1996, 58, 289–298. [Google Scholar] [CrossRef]
- Wojtowicz, A.; Piekarczyk, J.; Czernecki, B.; Ratajkiewicz, H. A random forest model for the classification of wheat and rye leaf rust symptoms based on pure spectra at leaf scale. J. Photochem. Photobiol. B 2021, 223, 112278. [Google Scholar] [CrossRef]
- Gupta, S.K.; Pandey, A.C. Spectral aspects for monitoring forest health in extreme season using multispectral imagery. Egypt. J. Remote Sens. Space Sci. 2021, 24, 579–586. [Google Scholar] [CrossRef]
- Eugenio, F.C.; da Silva, S.D.P.; Fantinel, R.A.; De Souza, P.D.; Felippe, B.M.; Romua, C.L.; Elsenbach, E.M. Remotely Piloted Aircraft Systems to Identify Pests and Diseases in Forest Species: The global state of the art and future challenges. IEEE Geosci. Remote Sens. Mag. 2022, 10, 320–333. [Google Scholar] [CrossRef]
- Wang, H.; Zhao, Y.; Pu, R.; Zhang, Z. Mapping Robinia Pseudoacacia Forest Health Conditions by Using Combined Spectral, Spatial, and Textural Information Extracted from IKONOS Imagery and Random Forest Classifier. Remote Sens. 2015, 7, 9020–9044. [Google Scholar] [CrossRef]
- Syifa, M.; Park, S.-J.; Lee, C.-W. Detection of the Pine Wilt Disease Tree Candidates for Drone Remote Sensing Using Artificial Intelligence Techniques. Engineering 2020, 6, 919–926. [Google Scholar] [CrossRef]
- Han, Z.; Hu, W.; Peng, S.; Lin, H.; Zhang, J.; Zhou, J.; Wang, P.; Dian, Y. Detection of Standing Dead Trees after Pine Wilt Disease Outbreak with Airborne Remote Sensing Imagery by Multi-Scale Spatial Attention Deep Learning and Gaussian Kernel Approach. Remote Sens. 2022, 14, 3075. [Google Scholar] [CrossRef]
- Hu, G.; Wang, T.; Wan, M.; Bao, W.; Zeng, W. UAV remote sensing monitoring of pine forest diseases based on improved Mask R-CNN. Int. J. Remote Sens. 2022, 43, 1274–1305. [Google Scholar] [CrossRef]
- Roslan, Z.; Awang, Z.; Husen, M.N.; Ismail, R.; Hamzah, R. Deep learning for tree crown detection in tropical forest. In Proceedings of the 2020 14th International Conference on Ubiquitous Information Management and Communication (IMCOM), Taichung, Taiwan, 3–5 January 2020; pp. 1–7. [Google Scholar]
- He, Y.; Chen, G.; Potter, C.; Meentemeyer, R.K. Integrating multi-sensor remote sensing and species distribution modeling to map the spread of emerging forest disease and tree mortality. Remote Sens. Environ. 2019, 231, 111238. [Google Scholar] [CrossRef]
- Grabska, E.; Hostert, P.; Pflugmacher, D.; Ostapowicz, K. Forest Stand Species Mapping Using the Sentinel-2 Time Series. Remote Sens. 2019, 11, 1197. [Google Scholar] [CrossRef]
- Candotti, A.; De Giglio, M.; Dubbini, M.; Tomelleri, E. A Sentinel-2 Based Multi-Temporal Monitoring Framework for Wind and Bark Beetle Detection and Damage Mapping. Remote Sens. 2022, 14, 6105. [Google Scholar] [CrossRef]
- Huo, L.; Persson, H.J.; Lindberg, E. Early detection of forest stress from European spruce bark beetle attack, and a new vegetation index: Normalized distance red & SWIR (NDRS). Remote Sens. Environ. 2021, 255, 112240. [Google Scholar] [CrossRef]
- Meddens, A.J.H.; Hicke, J.A.; Vierling, L.A.; Hudak, A.T. Evaluating methods to detect bark beetle-caused tree mortality using single-date and multi-date Landsat imagery. Remote Sens. Environ. 2013, 132, 49–58. [Google Scholar] [CrossRef]
- Wang, H.; Pu, R.; Zhu, Q.; Ren, L.; Zhang, Z. Mapping health levels of Robinia pseudoacacia forests in the Yellow River delta, China, using IKONOS and Landsat 8 OLI imagery. Int. J. Remote Sens. 2015, 36, 1114–1135. [Google Scholar] [CrossRef]
- Ri, A.; An, H. Health assessment of natural larch forest in arxan guided by forestry remote sensing integrated with canopy feature analysis. Front. Environ. Sci. 2023, 11, 1171660. [Google Scholar] [CrossRef]
- Wei, Z.; Jia, K.; Jia, X.; Liu, P.; Ma, Y.; Chen, T.; Feng, G. Mapping Large-Scale Plateau Forest in Sanjiangyuan Using High-Resolution Satellite Imagery and Few-Shot Learning. Remote Sens. 2022, 14, 388. [Google Scholar] [CrossRef]
- Chen, G.; He, Y.; De Santis, A.; Li, G.; Cobb, R.; Meentemeyer, R.K. Assessing the impact of emerging forest disease on wildfire using Landsat and KOMPSAT-2 data. Remote Sens. Environ. 2017, 195, 218–229. [Google Scholar] [CrossRef]
- Torres, P.; Rodes-Blanco, M.; Viana-Soto, A.; Nieto, H.; García, M. The Role of Remote Sensing for the Assessment and Monitoring of Forest Health: A Systematic Evidence Synthesis. Forests 2021, 12, 1134. [Google Scholar] [CrossRef]
- Zhang, M.H.; Shi, S.C.; Li, C.; Yan, P.; Wang, P.; Ding, L.; Du, J.; Plenkovic-Moraj, A.; Jiang, J.P.; Shi, J.S. Exploring cryptic biodiversity in a world heritage site: A new pitviper (Squamata, Viperidae, Crotalinae) from Jiuzhaigou, Aba, Sichuan, China. Zookeys 2022, 1114, 59–76. [Google Scholar] [CrossRef] [PubMed]
- Cao, Y.; Wang, B.; Zhang, J.; Wang, L.; Pan, Y.; Wang, Q.; Jian, D.; Deng, G. Lake macroinvertebrate assemblages and relationship with natural environment and tourism stress in Jiuzhaigou Natural Reserve, China. Ecol. Indic. 2016, 62, 182–190. [Google Scholar] [CrossRef]
- Li, X.; Zhang, M.; Xiao, W.; Du, J.; Sheng, M.; Zhu, D.; Plenković-Moraj, A.; Sun, G. The Color Formation Mechanism of the Blue Karst Lakes in Jiuzhaigou Nature Reserve, Sichuan, China. Water 2020, 12, 771. [Google Scholar] [CrossRef]
- Bossard, C.C.; Cao, Y.; Wang, J.; Rose, A.; Tang, Y. New patterns of establishment and growth of Picea, Abies and Betula tree species in subalpine forest gaps of Jiuzhaigou National Nature Reserve, Sichuan, southwestern China in a changing environment. For. Ecol. Manag. 2015, 356, 84–92. [Google Scholar] [CrossRef]
- Concha, J.A.; Gerace, A.D. Atmospheric compensation for WorldView-2 satellite and in-water component retrieval. In Proceedings of the 2012 IEEE International Geoscience and Remote Sensing Symposium, Munich, Germany, 22–27 July 2012; pp. 2833–2836. [Google Scholar]
- Gamon, J.A.; Surfus, J.S. Assessing leaf pigment content and activity with a reflectometer. N. Phytol. 1999, 143, 105–117. [Google Scholar] [CrossRef]
- Gitelson, A.A.; Merzlyak, M.N. Remote sensing of chlorophyll concentration in higher plant leaves. Adv. Space Res. 1998, 22, 689–692. [Google Scholar] [CrossRef]
- Gitelson, A.A.; Merzlyak, M.N.; Chivkunova, O.B. Optical Properties and Nondestructive Estimation of Anthocyanin Content in Plant Leaves. Photochem. Photobiol. 2001, 74, 38–45. [Google Scholar] [CrossRef]
- Pasqualotto, N.; D’Urso, G.; Bolognesi, S.F.; Belfiore, O.R.; Van Wittenberghe, S.; Delegido, J.; Pezzola, A.; Winschel, C.; Moreno, J. Retrieval of evapotranspiration from sentinel-2: Comparison of vegetation indices, semi-empirical models and SNAP biophysical processor approach. Agronomy 2019, 9, 663. [Google Scholar] [CrossRef]
- Jacquemoud, S.; Baret, F. PROSPECT: A model of leaf optical properties spectra. Remote Sens. Environ. 1990, 34, 75–91. [Google Scholar] [CrossRef]
- Narenkumar, J.; Parthipan, P.; Madhavan, J.; Murugan, K.; Marpu, S.B.; Suresh, A.K.; Rajasekar, A. Bioengineered silver nanoparticles as potent anti-corrosive inhibitor for mild steel in cooling towers. Environ. Sci. Pollut. Res. Int. 2018, 25, 5412–5420. [Google Scholar] [CrossRef]
- Weiss, M.; Baret, F. S2ToolBox Level 2 Products: LAI, FAPAR, FCOVER Version 1.1. 2016. Available online: https://step.esa.int/docs/extra/ATBD_S2ToolBox_L2B_V1.1.pdf (accessed on 10 October 2023).
- Chen, G.; Hay, G.J.; Castilla, G.; St-Onge, B.; Powers, R. A multiscale geographic object-based image analysis to estimate lidar-measured forest canopy height using Quickbird imagery. Int. J. Geogr. Inf. Sci. 2011, 25, 877–893. [Google Scholar] [CrossRef]
- Gadkari, D. Image Quality Analysis Using GLCM. 2004. Available online: http://purl.fcla.edu/fcla/etd/CFE0000273 (accessed on 10 October 2023).
- Haralick, R.M.; Shanmugam, K.; Dinstein, I.H. Textural features for image classification. IEEE Trans. Syst. Man Cybern. 1973, SMC-3, 610–621. [Google Scholar] [CrossRef]
- Shortliffe, E.H.; Buchanan, B.G. A model of inexact reasoning in medicine. Math. Biosci. 1975, 23, 351–379. [Google Scholar] [CrossRef]
- Guo, X.; Fu, B.; Du, J.; Shi, P.; Li, J.; Li, Z.; Du, J.; Chen, Q.; Fu, H. Monitoring and Assessment for the Susceptibility of Landslide Changes After the 2017 Ms 7.0 Jiuzhaigou Earthquake Using the Remote Sensing Technology. Front. Earth Sci. 2021, 9, 633117. [Google Scholar] [CrossRef]
- Zadeh, L.A. Fuzzy sets. Inf. Control 1965, 8, 338–353. [Google Scholar] [CrossRef]
- Luckett, D.J.; Laber, E.B.; El-Kamary, S.S.; Fan, C.; Jhaveri, R.; Perou, C.M.; Shebl, F.M.; Kosorok, M.R. Receiver operating characteristic curves and confidence bands for support vector machines. Biometrics 2021, 77, 1422–1430. [Google Scholar] [CrossRef]
- Gao, S.; Chen, F.; Shi, P.; Zhou, W.; Zhu, M.; Luo, Y.; Yang, Q.; Wang, Q. Elaborate monitoring and analyzing of vegetation health in Jiuzhaigou Valley Biosphere Reserve, taking Changhai Valley as an example. Remote Sens. Nat. Resour. 2023. Available online: http://kns.cnki.net/kcms/detail/10.1759.p.20230803.0934.004.html (accessed on 10 October 2023).
- Hao, Z.; Lin, L.; Post, C.J.; Mikhailova, E.A.; Yu, K.; Fang, H.; Liu, J. The co-effect of image resolution and crown size on deep learning for individual tree detection and delineation. Int. J. Digit. Earth 2023, 16, 3753–3771. [Google Scholar] [CrossRef]
- Dash, J.P.; Watt, M.S.; Pearse, G.D.; Heaphy, M.; Dungey, H.S. Assessing very high resolution UAV imagery for monitoring forest health during a simulated disease outbreak. ISPRS J. Photogramm. Remote Sens. 2017, 131, 1–14. [Google Scholar] [CrossRef]
- Dennison, P.E.; Brunelle, A.R.; Carter, V.A. Assessing canopy mortality during a mountain pine beetle outbreak using GeoEye-1 high spatial resolution satellite data. Remote Sens. Environ. 2010, 114, 2431–2435. [Google Scholar] [CrossRef]
- Malinee, R.; Stratoulias, D.; Nuthammachot, N. Detection of oil palm disease in plantations in krabi province, thailand with high spatial resolution satellite imagery. Agriculture 2021, 11, 251. [Google Scholar] [CrossRef]
- Vincini, M.; Calegari, F.; Casa, R. Sensitivity of leaf chlorophyll empirical estimators obtained at Sentinel-2 spectral resolution for different canopy structures. Precis. Agric. 2015, 17, 313–331. [Google Scholar] [CrossRef]
- Liu, F.; Zhang, M.; Hu, J.; Pan, M.; Shen, L.; Ye, J.; Tan, J. Early Diagnosis of Pine Wilt Disease in Pinus thunbergii Based on Chlorophyll Fluorescence Parameters. Forests 2023, 14, 154. [Google Scholar] [CrossRef]
- Watt, M.S.; Poblete, T.; de Silva, D.; Estarija, H.J.C.; Hartley, R.J.L.; Leonardo, E.M.C.; Massam, P.; Buddenbaum, H.; Zarco-Tejada, P.J. Prediction of the severity of Dothistroma needle blight in radiata pine using plant based traits and narrow band indices derived from UAV hyperspectral imagery. Agric. For. Meteorol. 2023, 330, 109294. [Google Scholar] [CrossRef]
- Zhang, Y.; Dian, Y.; Zhou, J.; Peng, S.; Hu, Y.; Hu, L.; Han, Z.; Fang, X.; Cui, H. Characterizing Spatial Patterns of Pine Wood Nematode Outbreaks in Subtropical Zone in China. Remote Sens. 2021, 13, 4682. [Google Scholar] [CrossRef]
- Vaughn, N.R.; Hughes, R.F.; Asner, G.P. Multi-scale remote sensing-based landscape epidemiology of the spread of rapid ‘Ōhiʻa Death in Hawaiʻi. For. Ecol. Manag. 2023, 538, 120983. [Google Scholar] [CrossRef]
- Ishimura, A.; Shimizu, Y.; Rahimzadeh-Bajgiran, P.; Omasa, K. Remote sensing of Japanese beech forest decline using an improved Temperature Vegetation Dryness Index (iTVDI). Iforest Biogeosci. For. 2011, 4, 195–199. [Google Scholar] [CrossRef]
- Meddens, A.J.H.; Hicke, J.A.; Vierling, L.A. Evaluating the potential of multispectral imagery to map multiple stages of tree mortality. Remote Sens. Environ. 2011, 115, 1632–1642. [Google Scholar] [CrossRef]
Figure 1.
Overview of Jiuzhaigou Valley Biosphere Reserve (Coordinate System: WGS 1984 UTM 48N on the courtesy of Google Earth). Zaru and Changhai Valley are selected as the research target areas, highlighted by brown and blue rectangles, respectively.
Figure 1.
Overview of Jiuzhaigou Valley Biosphere Reserve (Coordinate System: WGS 1984 UTM 48N on the courtesy of Google Earth). Zaru and Changhai Valley are selected as the research target areas, highlighted by brown and blue rectangles, respectively.
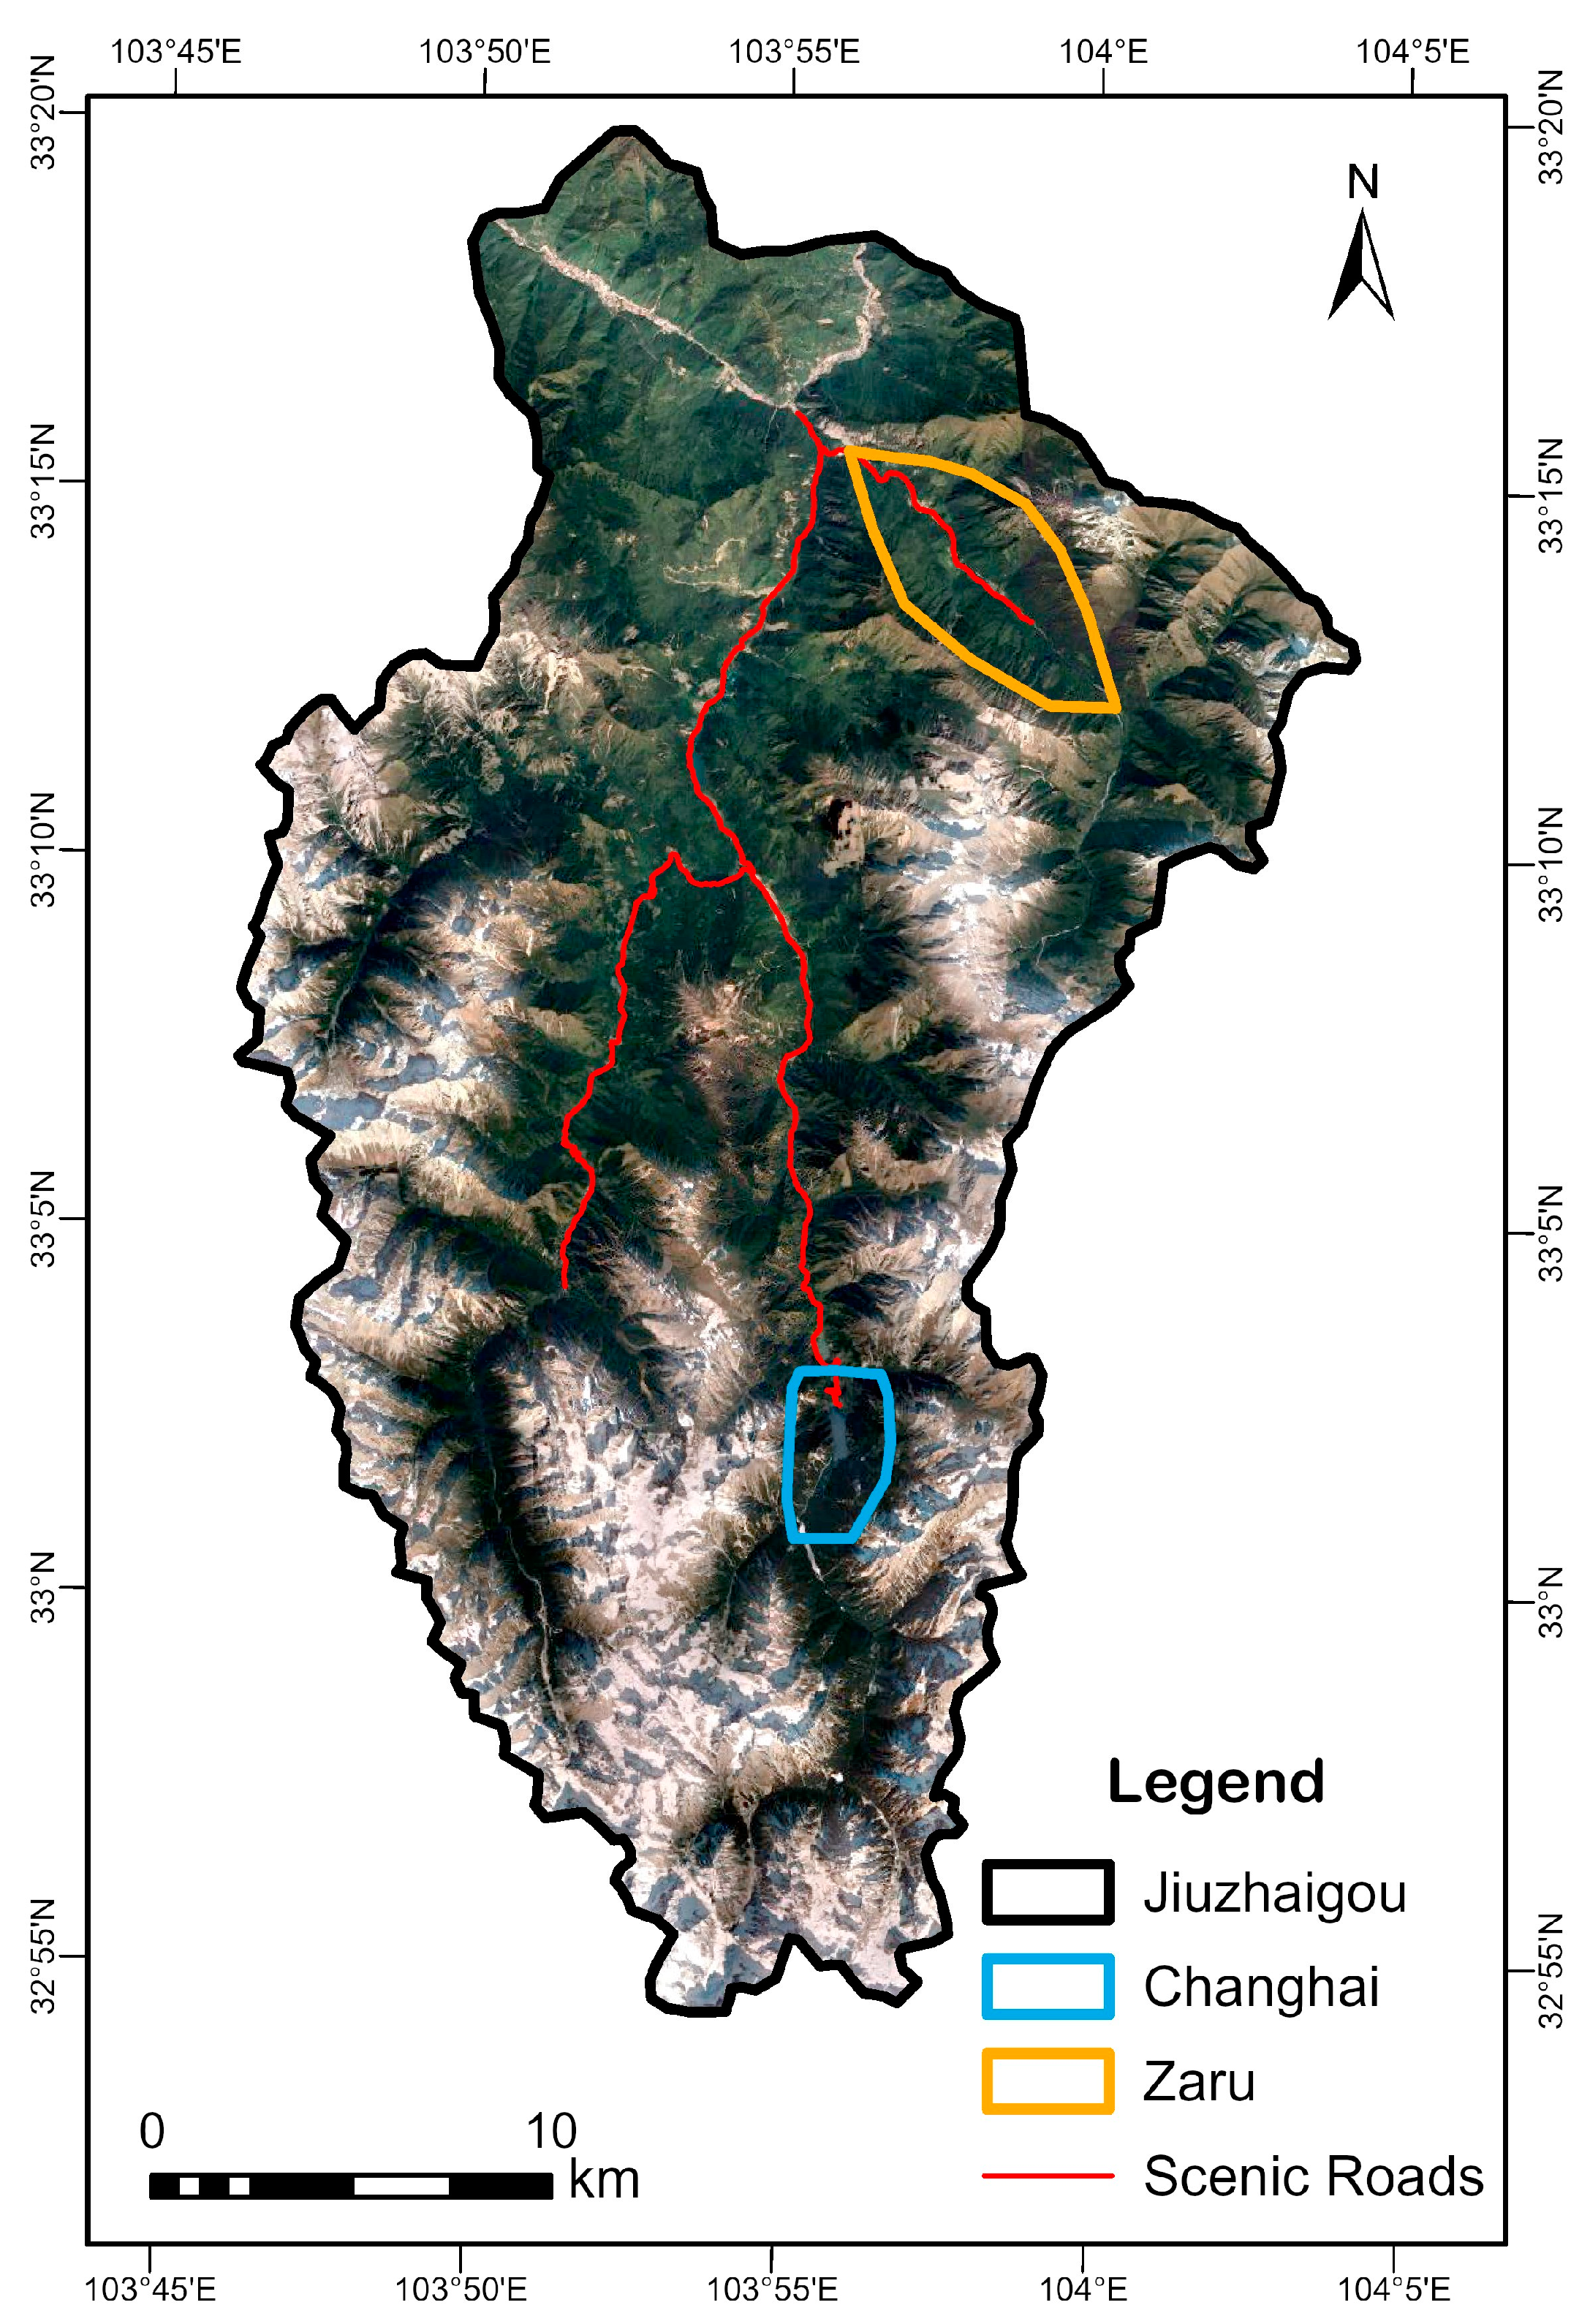
Figure 2.
Spectral curves of healthy and unhealthy trees. (a) Spectral curves of healthy and unhealthy Chinese pine. (b) Spectral curves of healthy and unhealthy fir. (c) Spectral curves of healthy and unhealthy spruce.
Figure 2.
Spectral curves of healthy and unhealthy trees. (a) Spectral curves of healthy and unhealthy Chinese pine. (b) Spectral curves of healthy and unhealthy fir. (c) Spectral curves of healthy and unhealthy spruce.
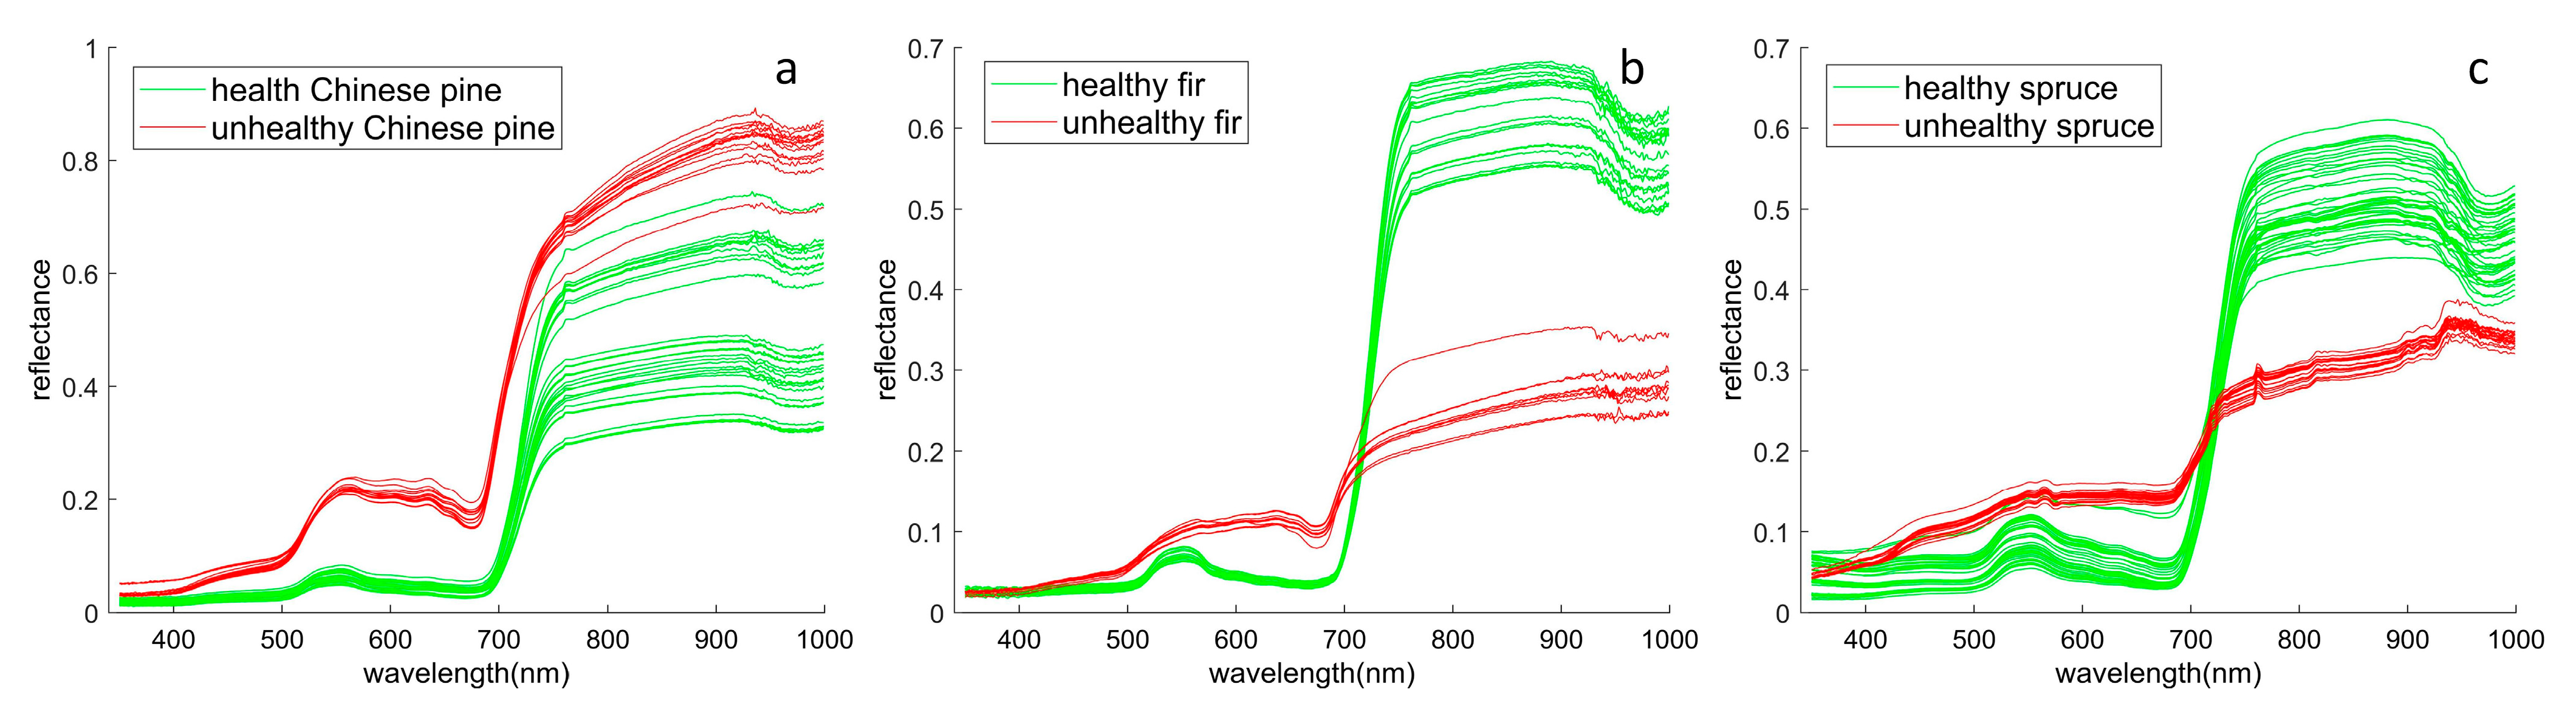
Figure 3.
(a) The location where we took realistic images. (b) A diseased Chinese pine in a realistic image.
Figure 3.
(a) The location where we took realistic images. (b) A diseased Chinese pine in a realistic image.
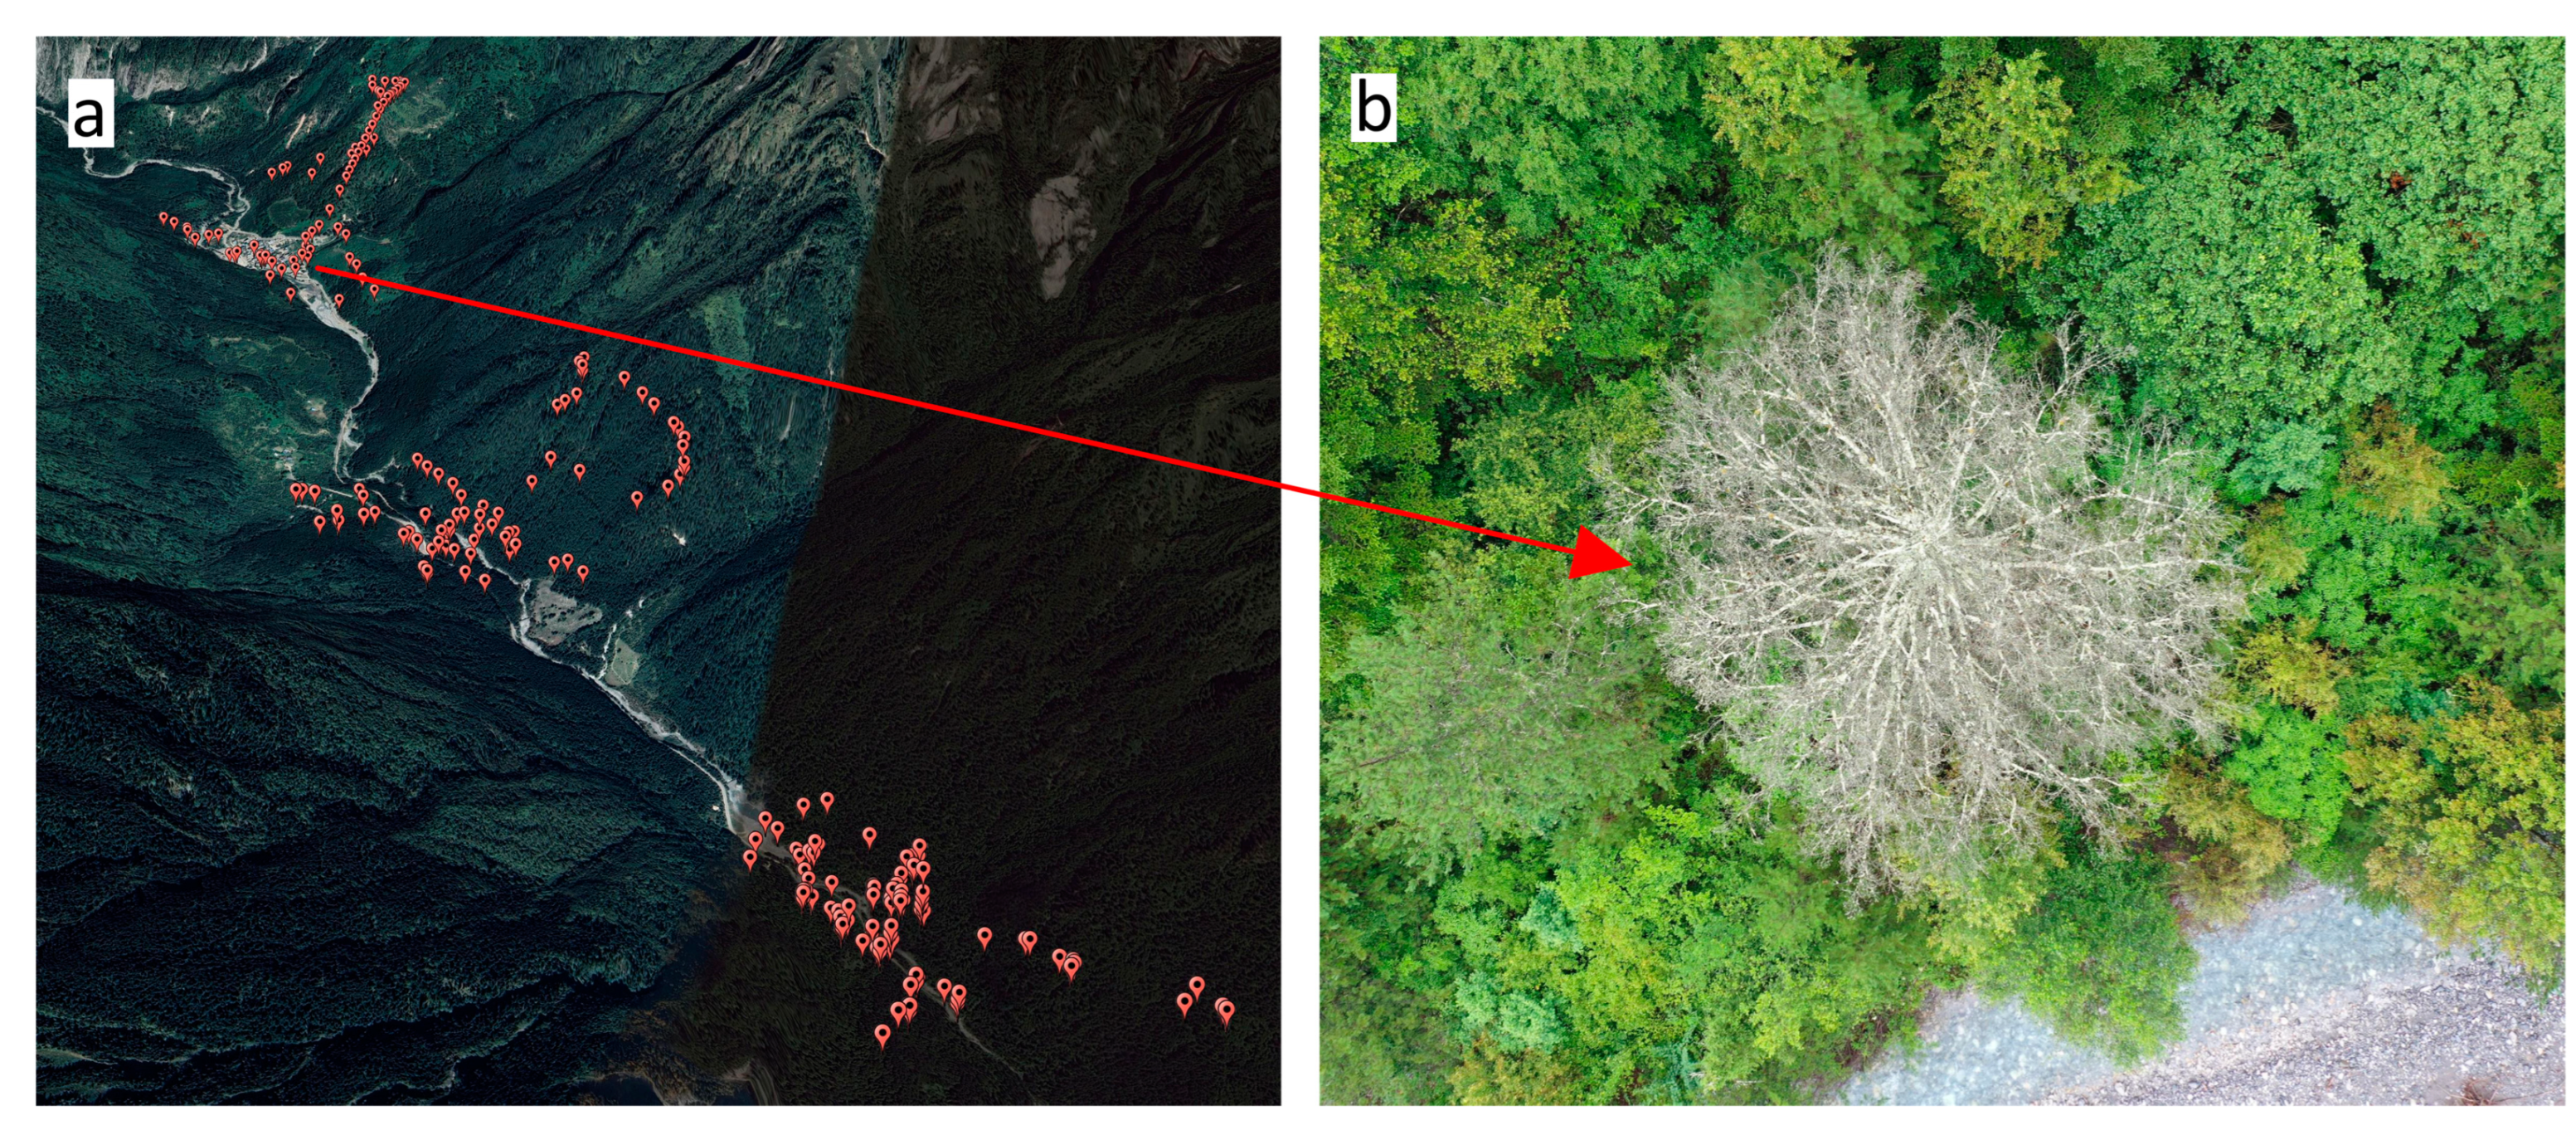
Figure 4.
An unhealthy tree in different images (pointed by the arrow). (a) in 0.5 m WorldView-2 surface reflectance image taken on 13 September 2021. (b) in UAV orthophoto taken on 18 July 2022.
Figure 4.
An unhealthy tree in different images (pointed by the arrow). (a) in 0.5 m WorldView-2 surface reflectance image taken on 13 September 2021. (b) in UAV orthophoto taken on 18 July 2022.

Figure 5.
Working flowchart for this study, which consists of four main steps, including data acquisition, feature extraction, unhealthy tree identification, and susceptibility mapping.
Figure 5.
Working flowchart for this study, which consists of four main steps, including data acquisition, feature extraction, unhealthy tree identification, and susceptibility mapping.
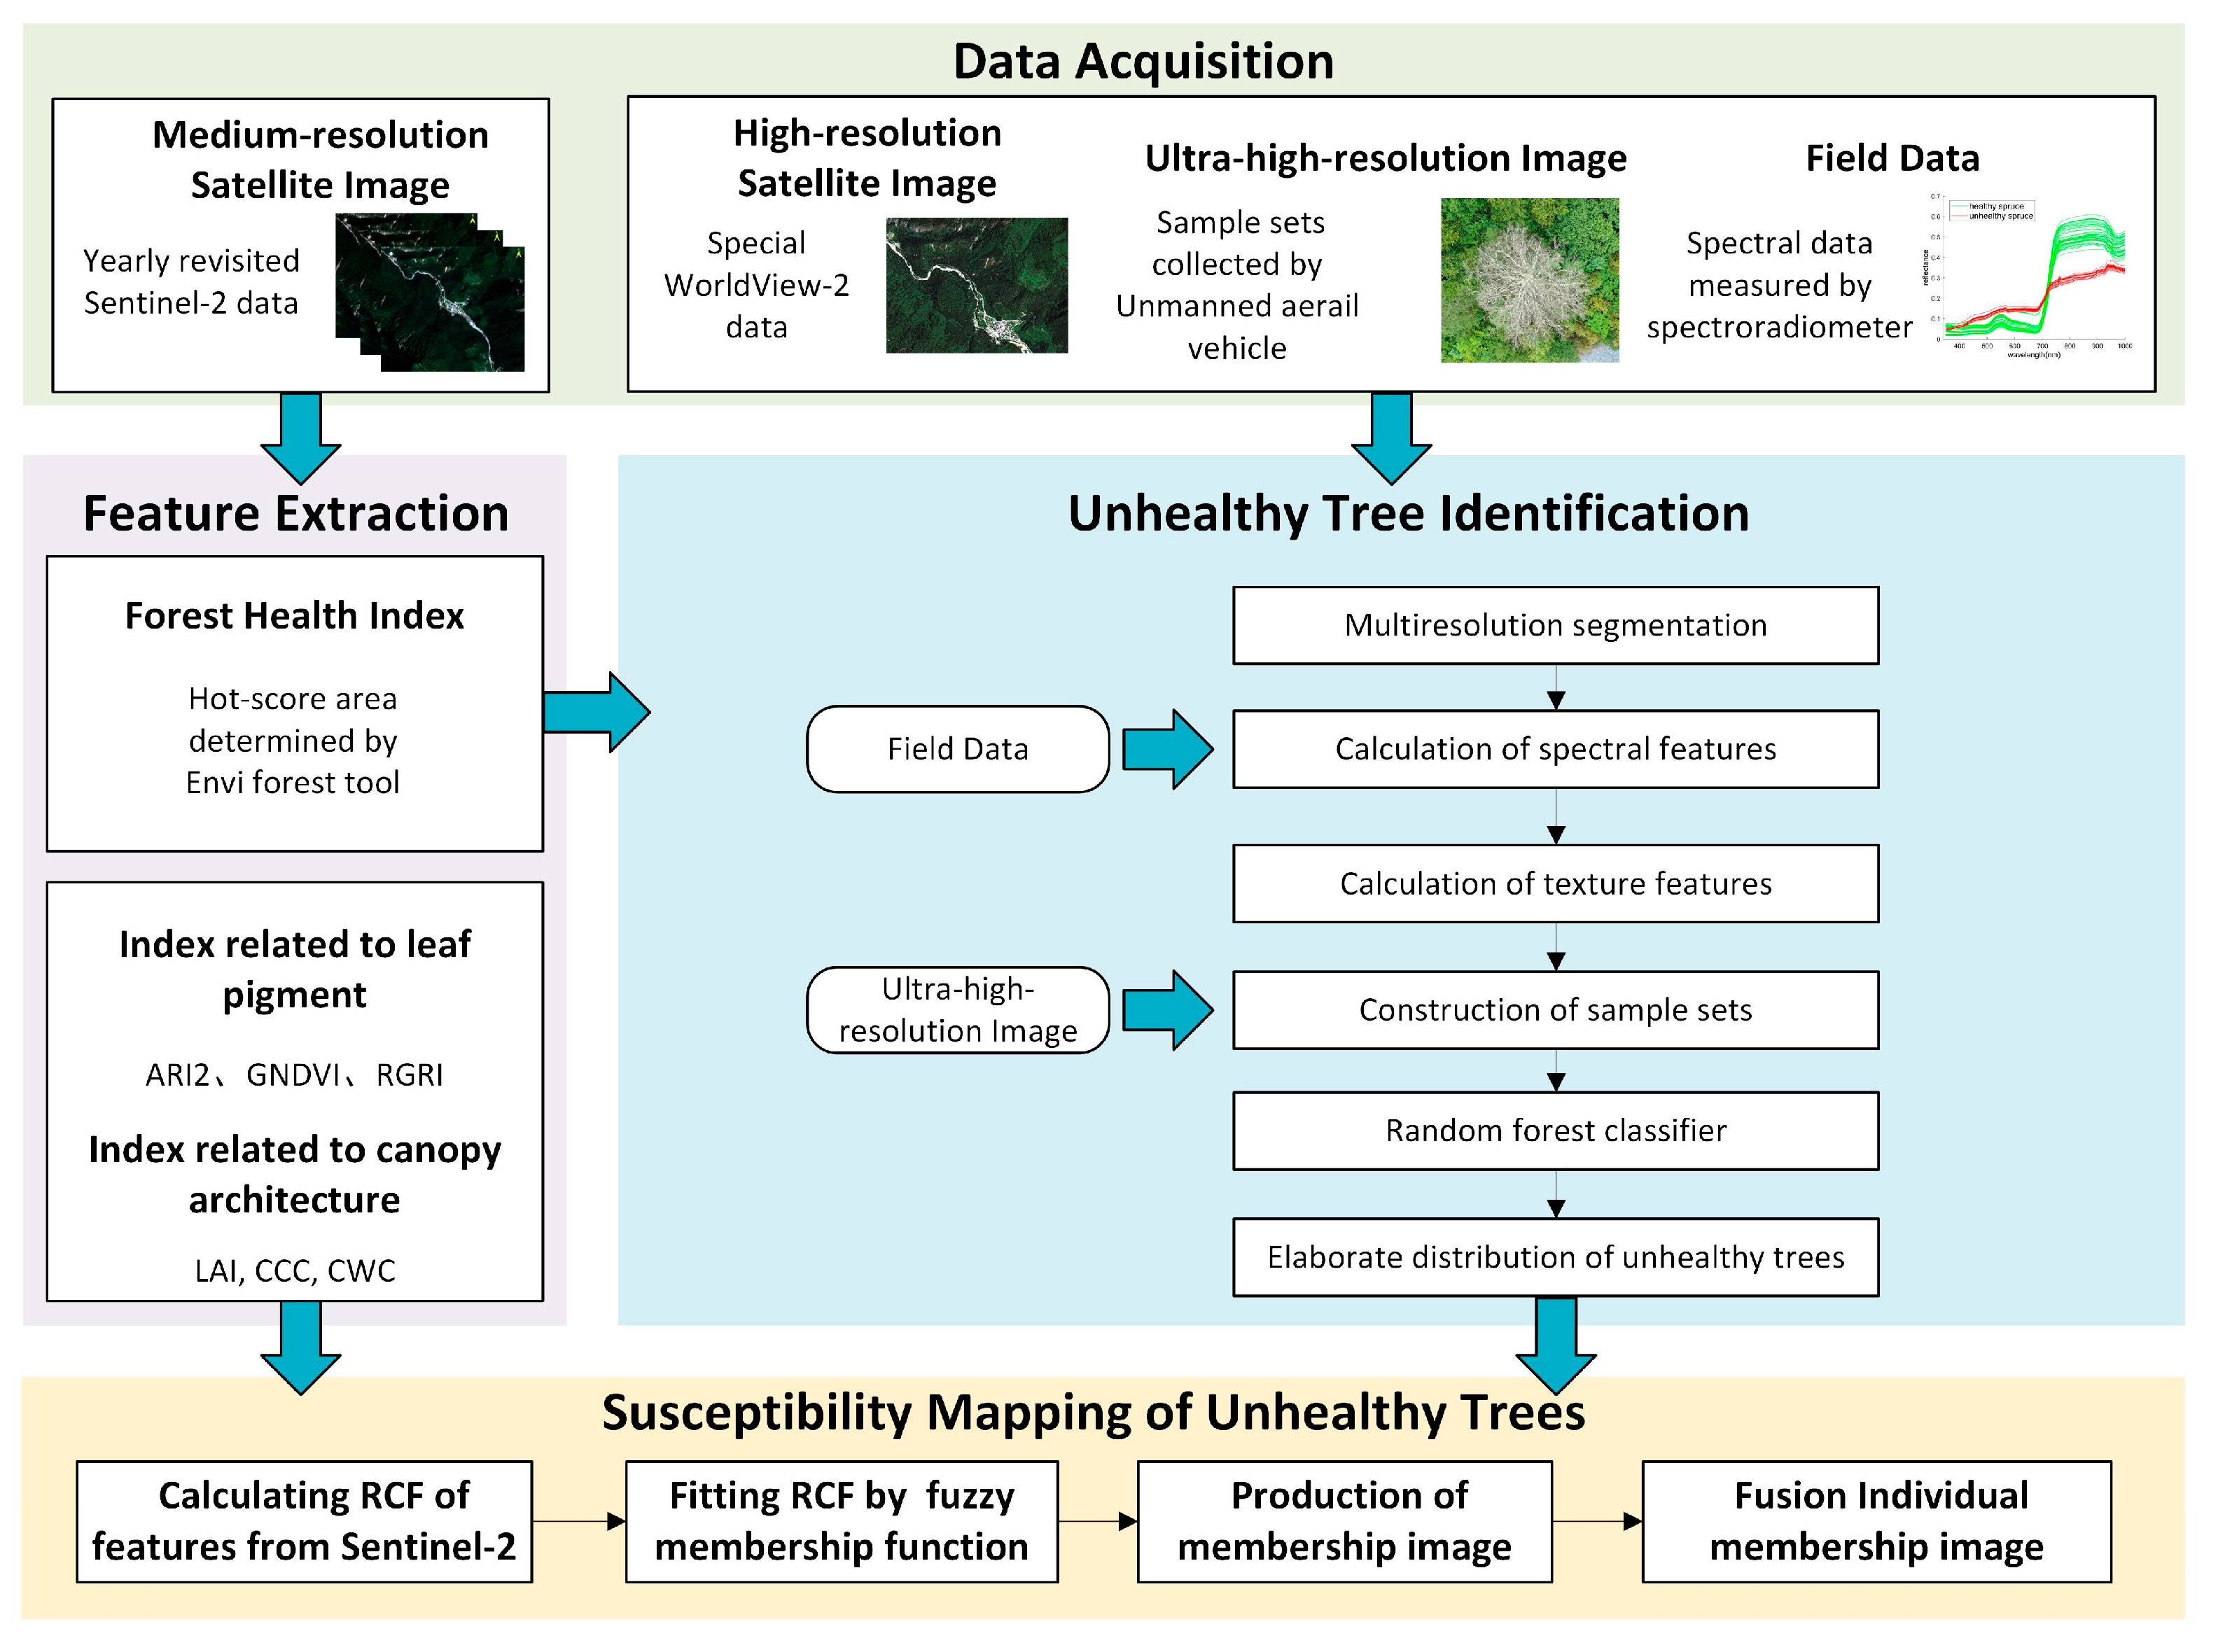
Figure 6.
(a) S-shaped curve. (b) Bell-shaped curve. (c) Z-shaped curve.
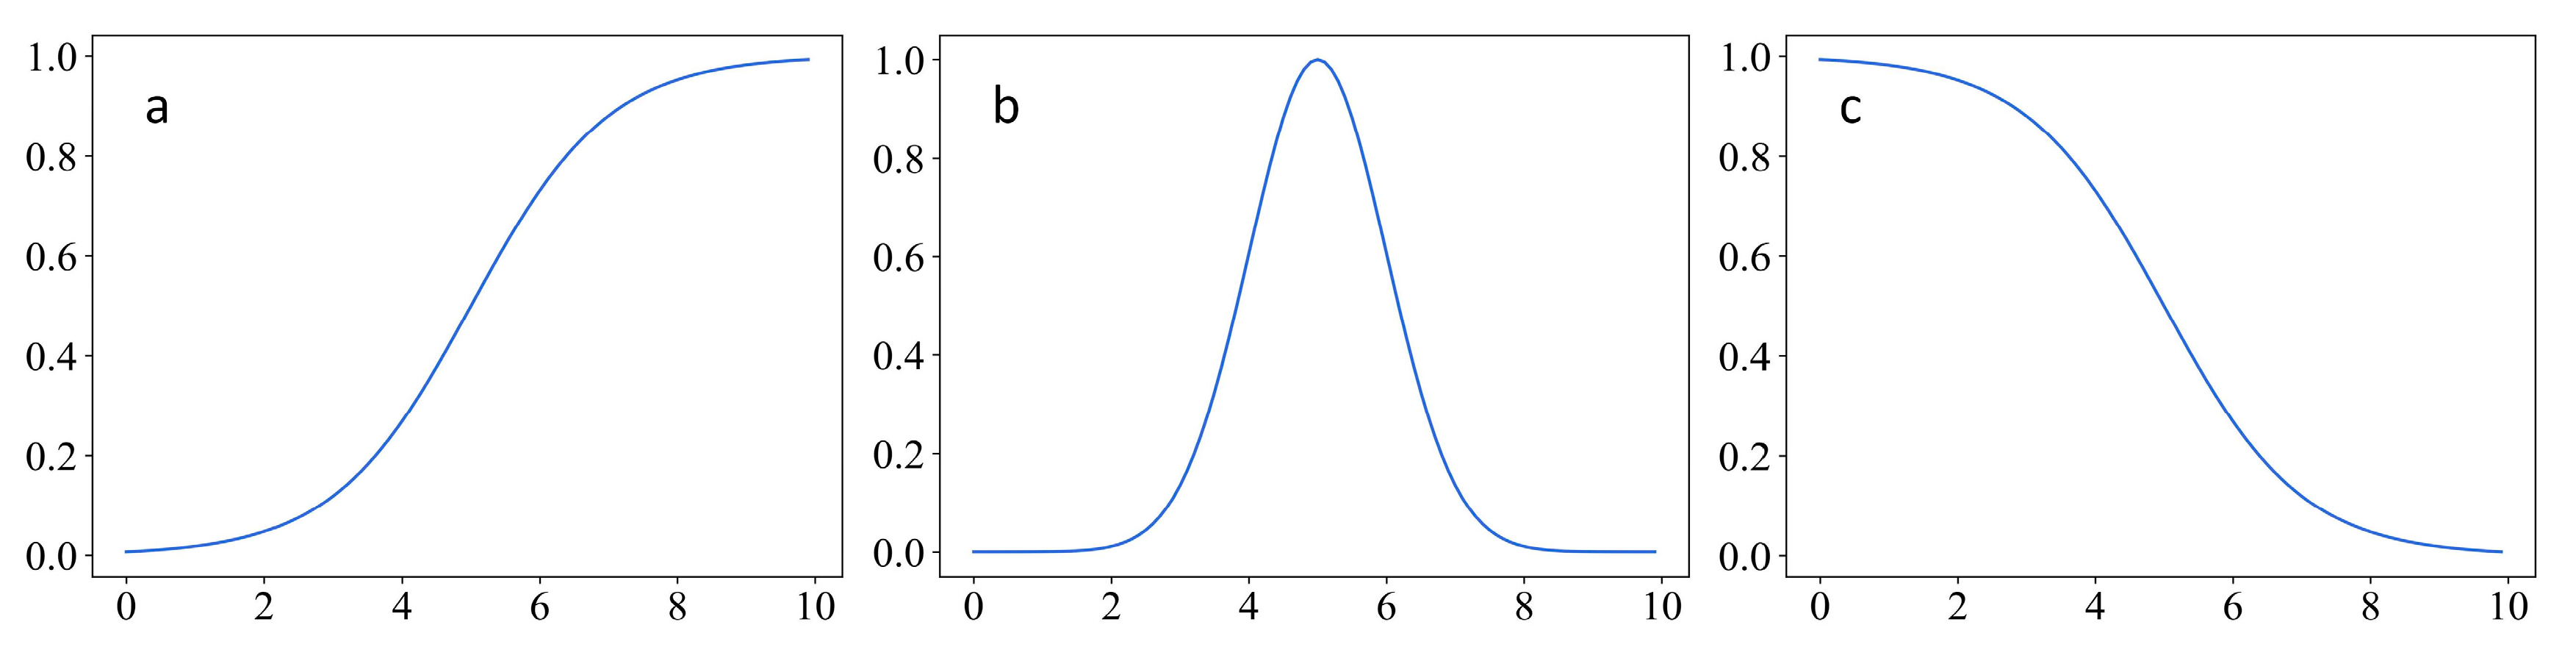
Figure 7.
in Jiuzhaigou Valley (Coordinate System: WGS 1984 UTM 48N). (a) shows in a 1 km buffer zone on both sides of scenic roads. (b,c) show the detail in Zaru and Changhai Valley. The low represents forests at a low health level.
Figure 7.
in Jiuzhaigou Valley (Coordinate System: WGS 1984 UTM 48N). (a) shows in a 1 km buffer zone on both sides of scenic roads. (b,c) show the detail in Zaru and Changhai Valley. The low represents forests at a low health level.
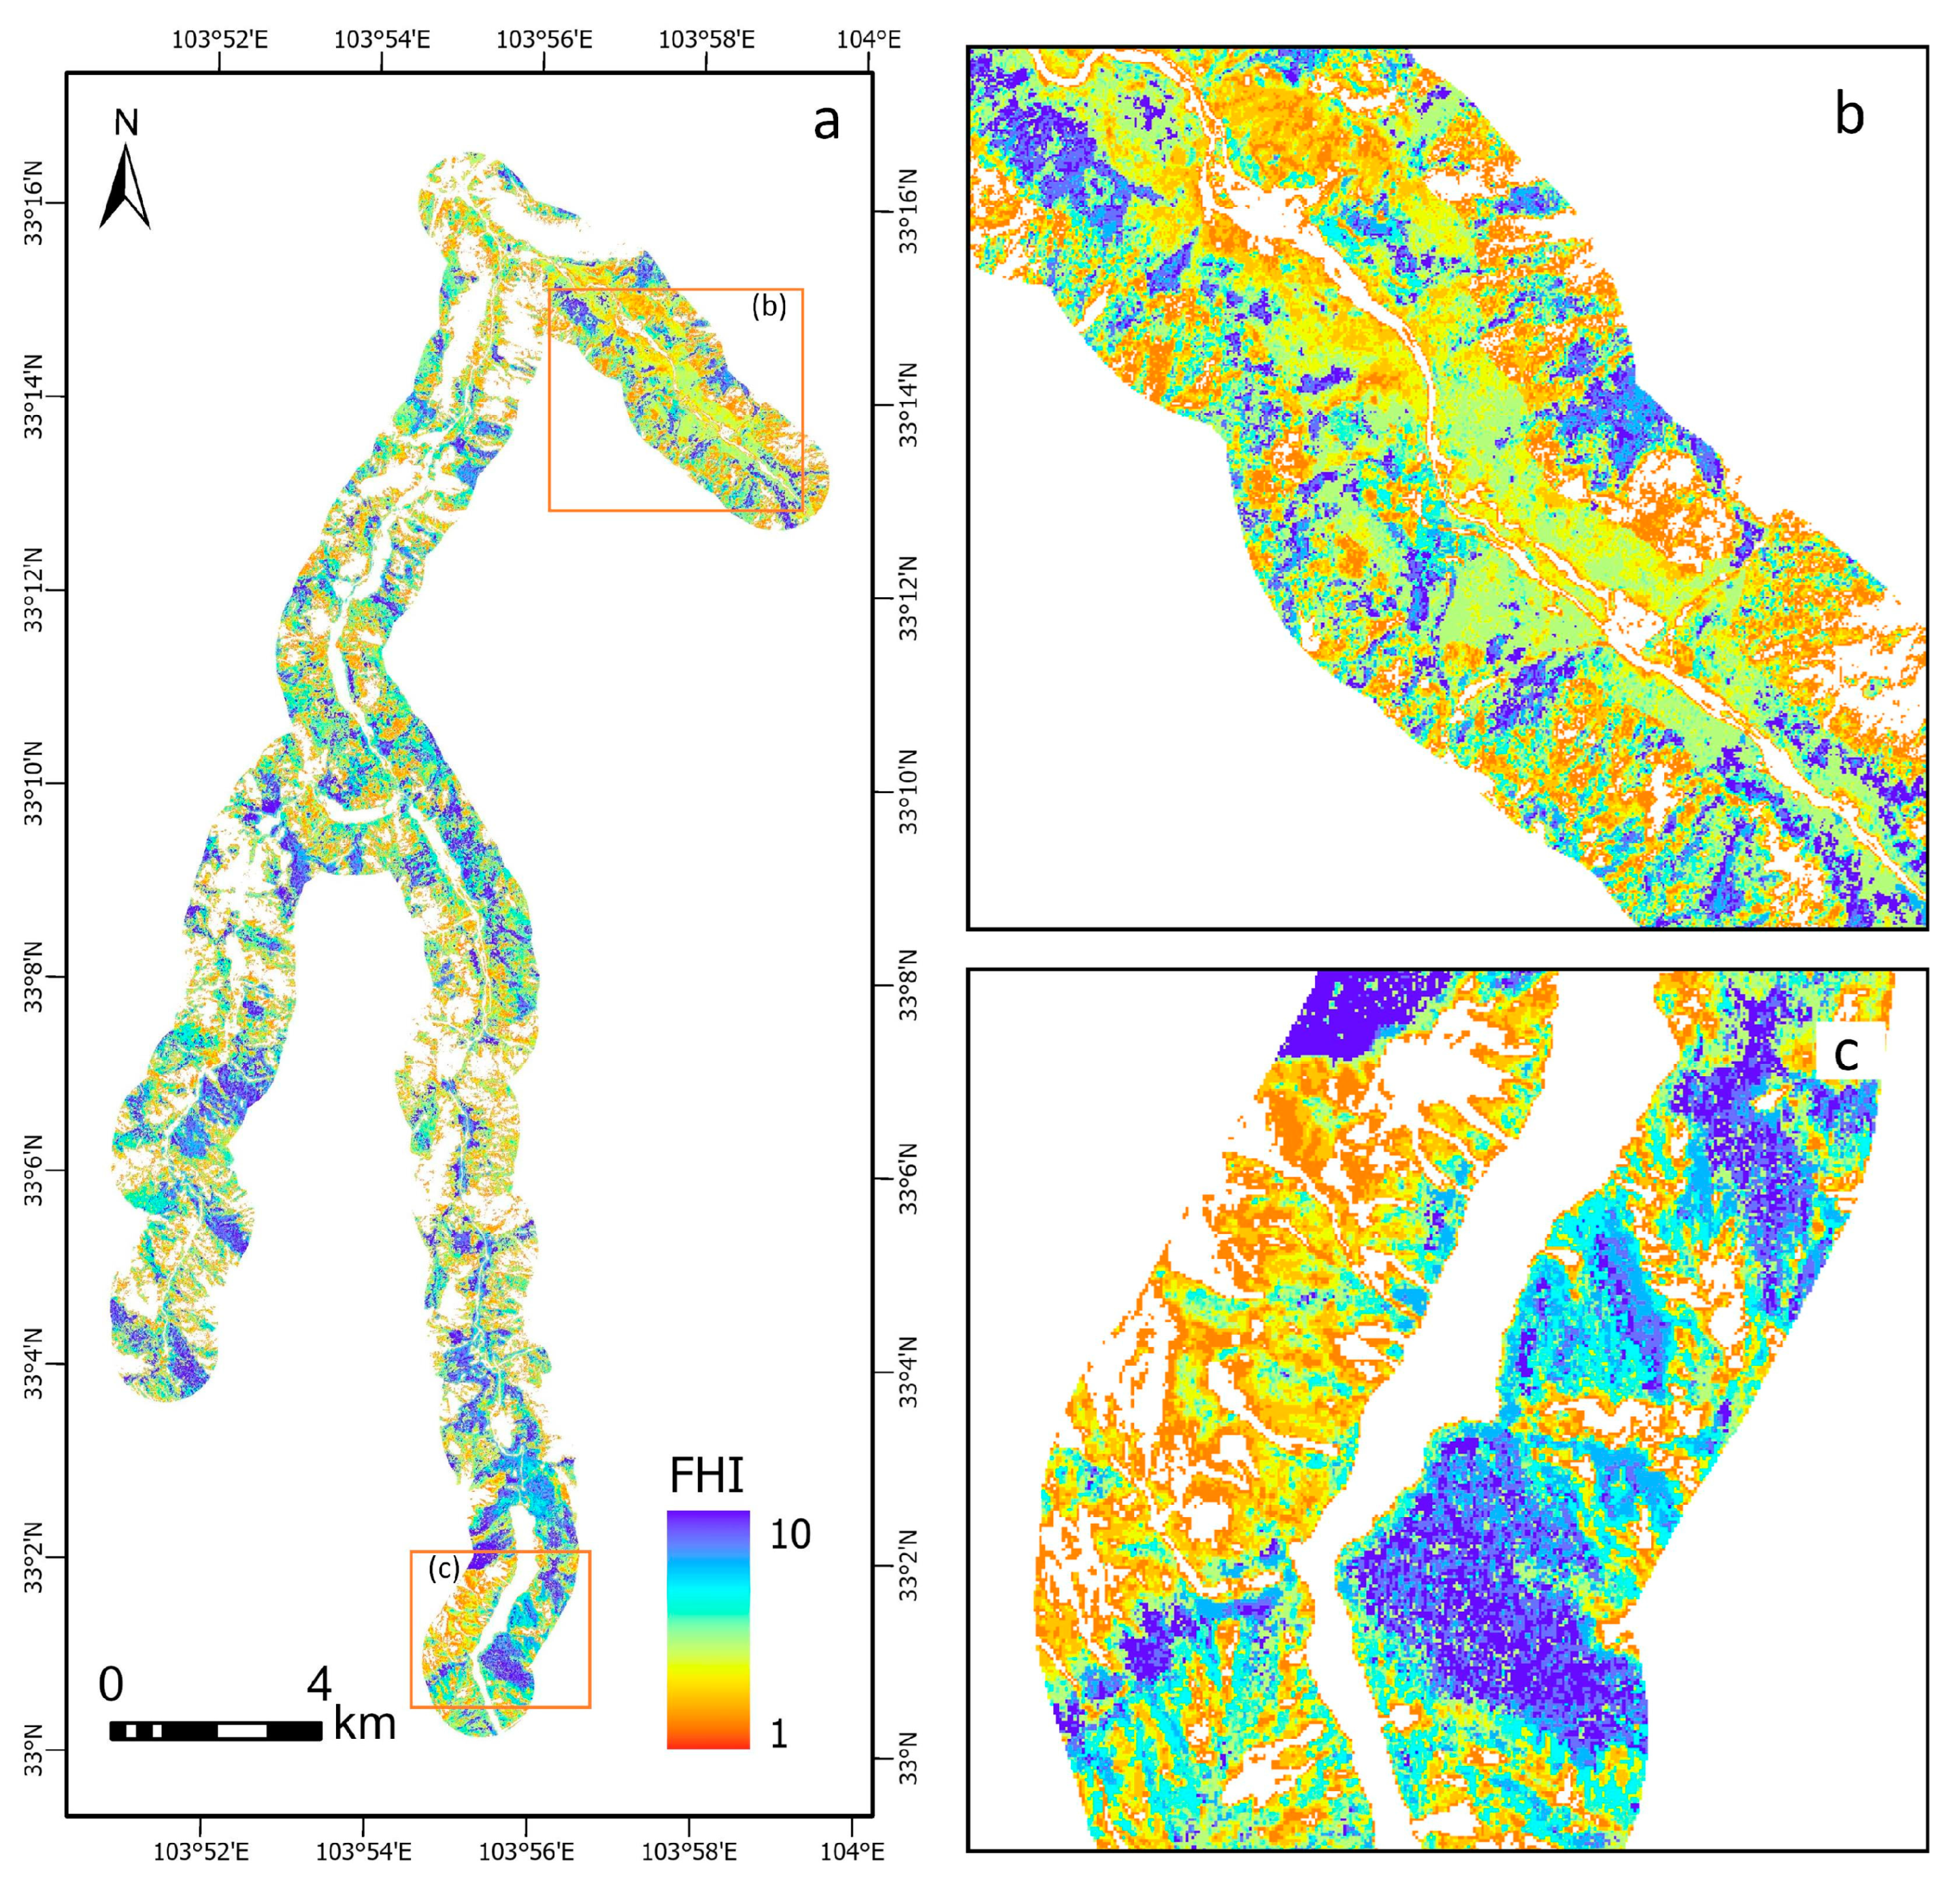
Figure 8.
Segmentation results with different scale parameters, (b) 5, (c) 10, (d) 15, (e) 20, and (f) 25. (a) original WorldView-2 image.
Figure 8.
Segmentation results with different scale parameters, (b) 5, (c) 10, (d) 15, (e) 20, and (f) 25. (a) original WorldView-2 image.
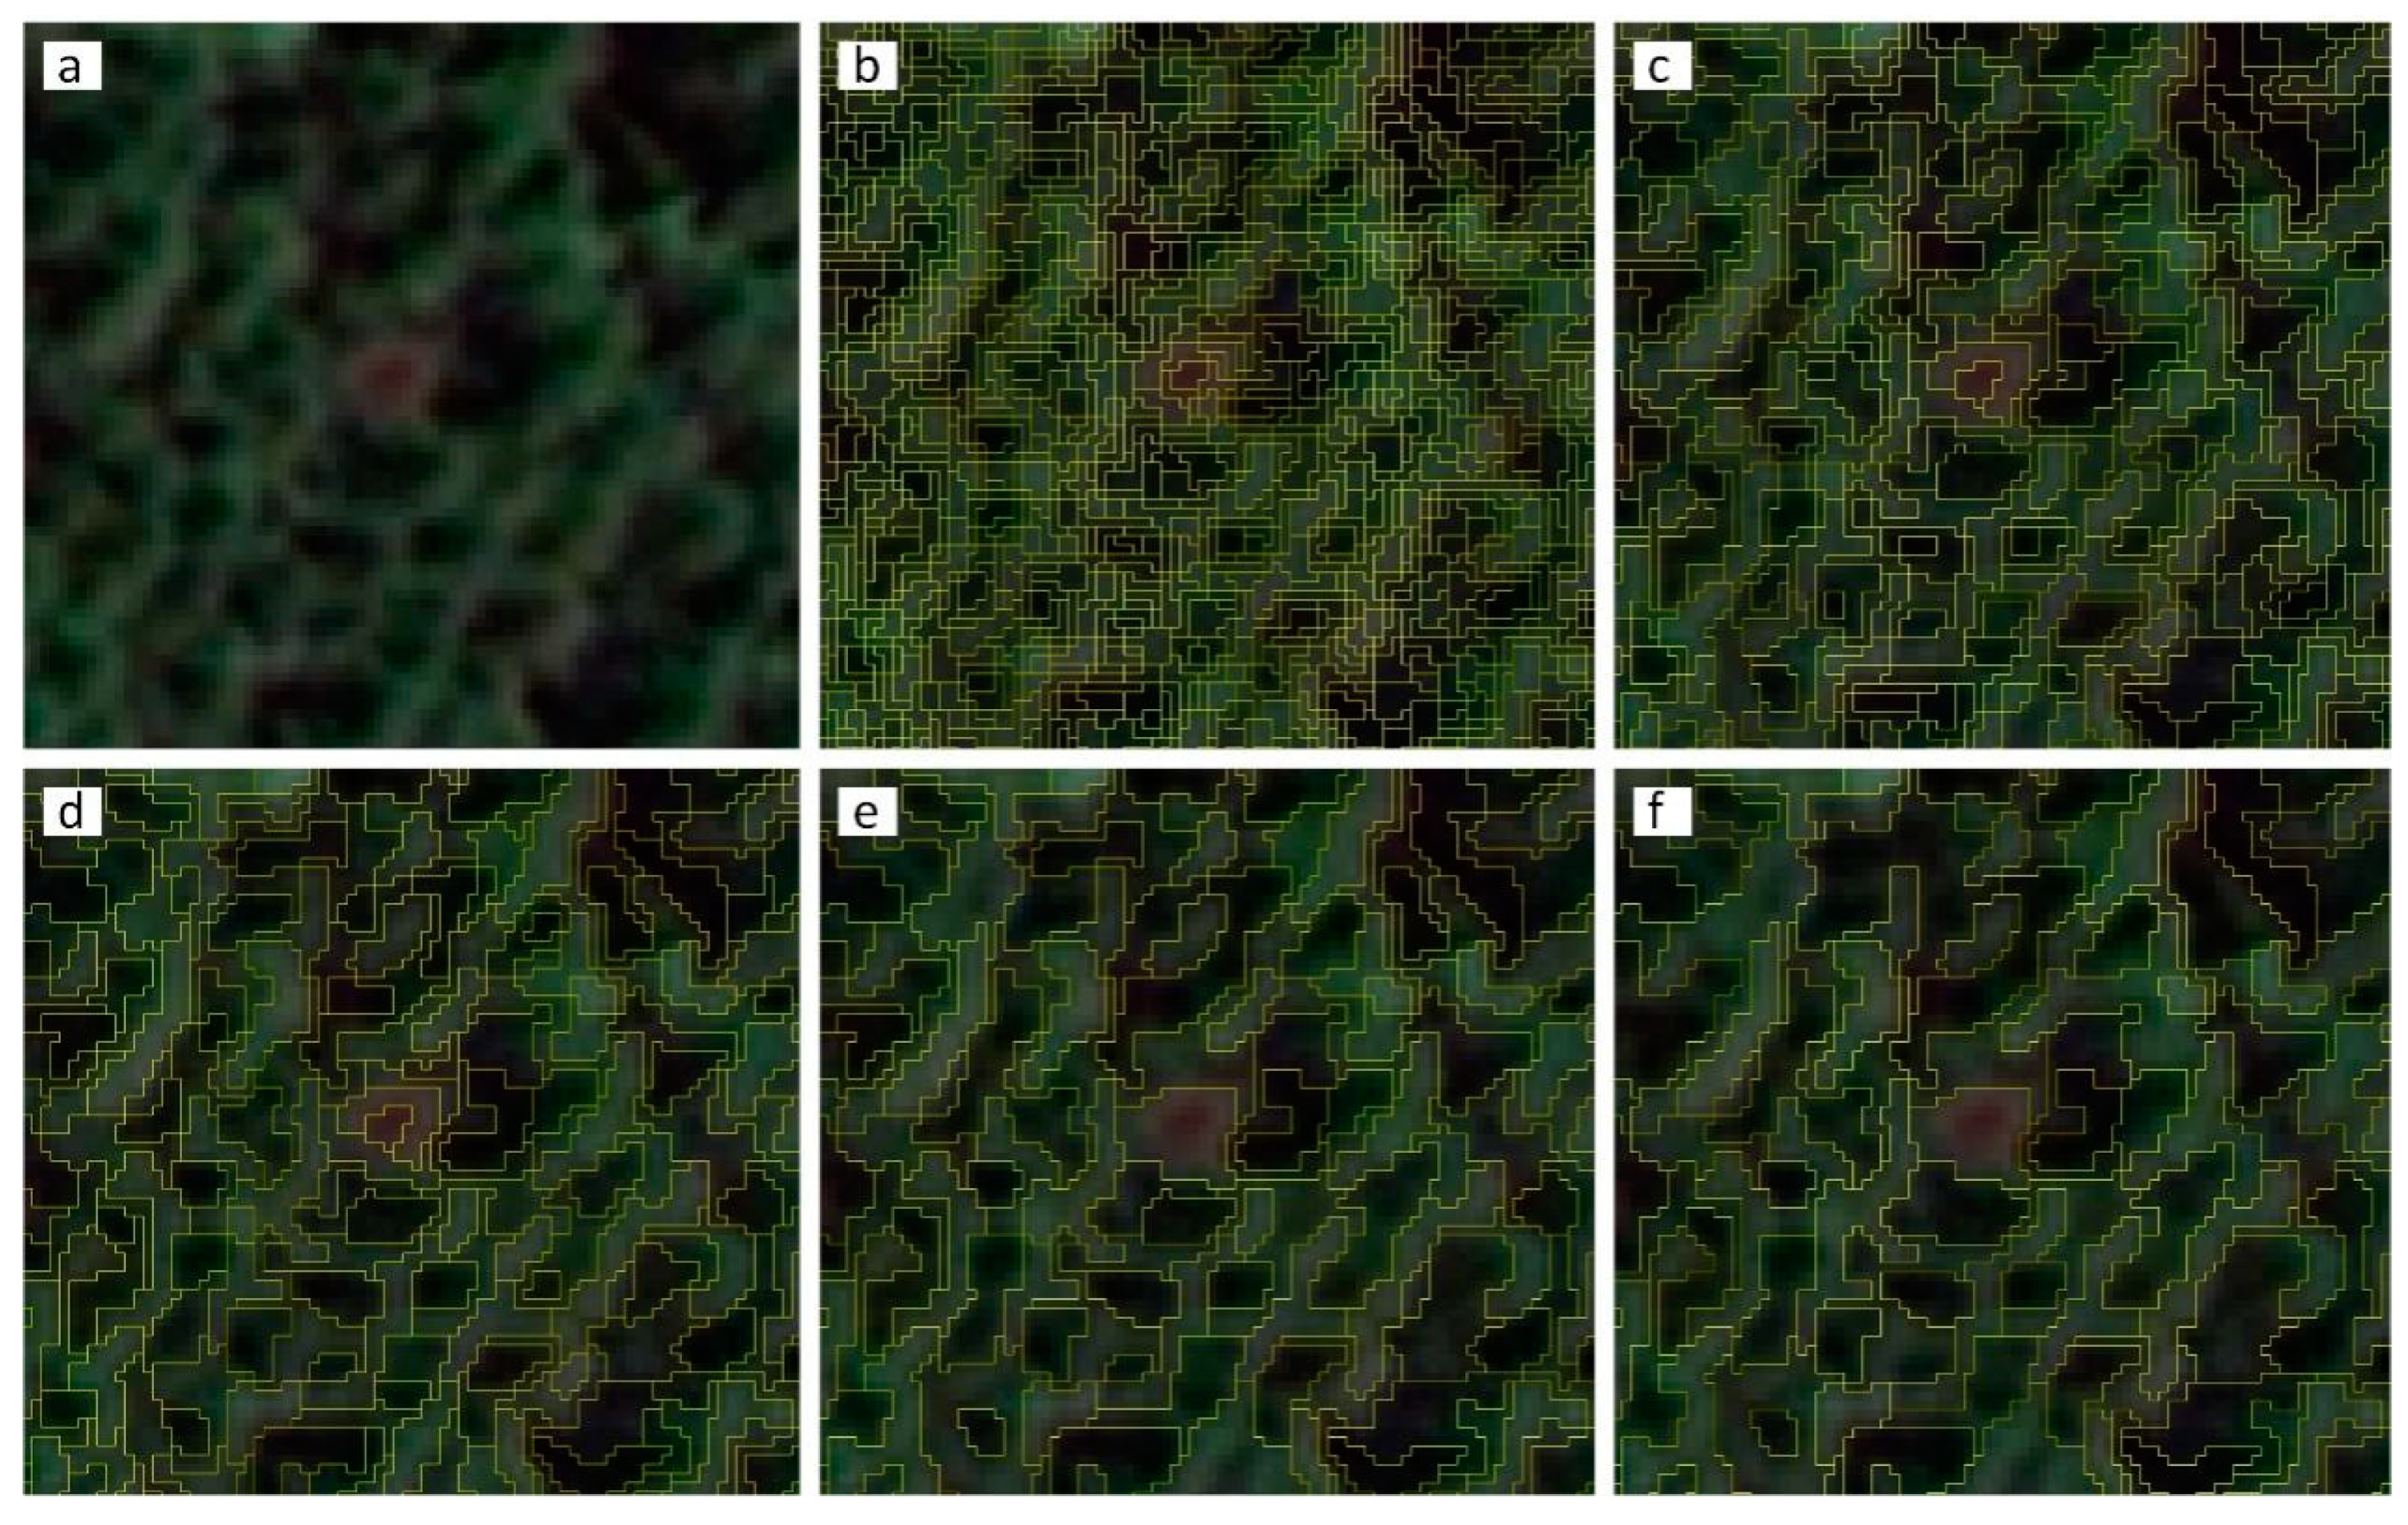
Figure 9.
Accuracies with different kernel sizes of GLCM [57]. With the increase in kernel size of GLCM, the recall for unhealthy tree identification gradually rises before reaching saturation.
Figure 9.
Accuracies with different kernel sizes of GLCM [57]. With the increase in kernel size of GLCM, the recall for unhealthy tree identification gradually rises before reaching saturation.
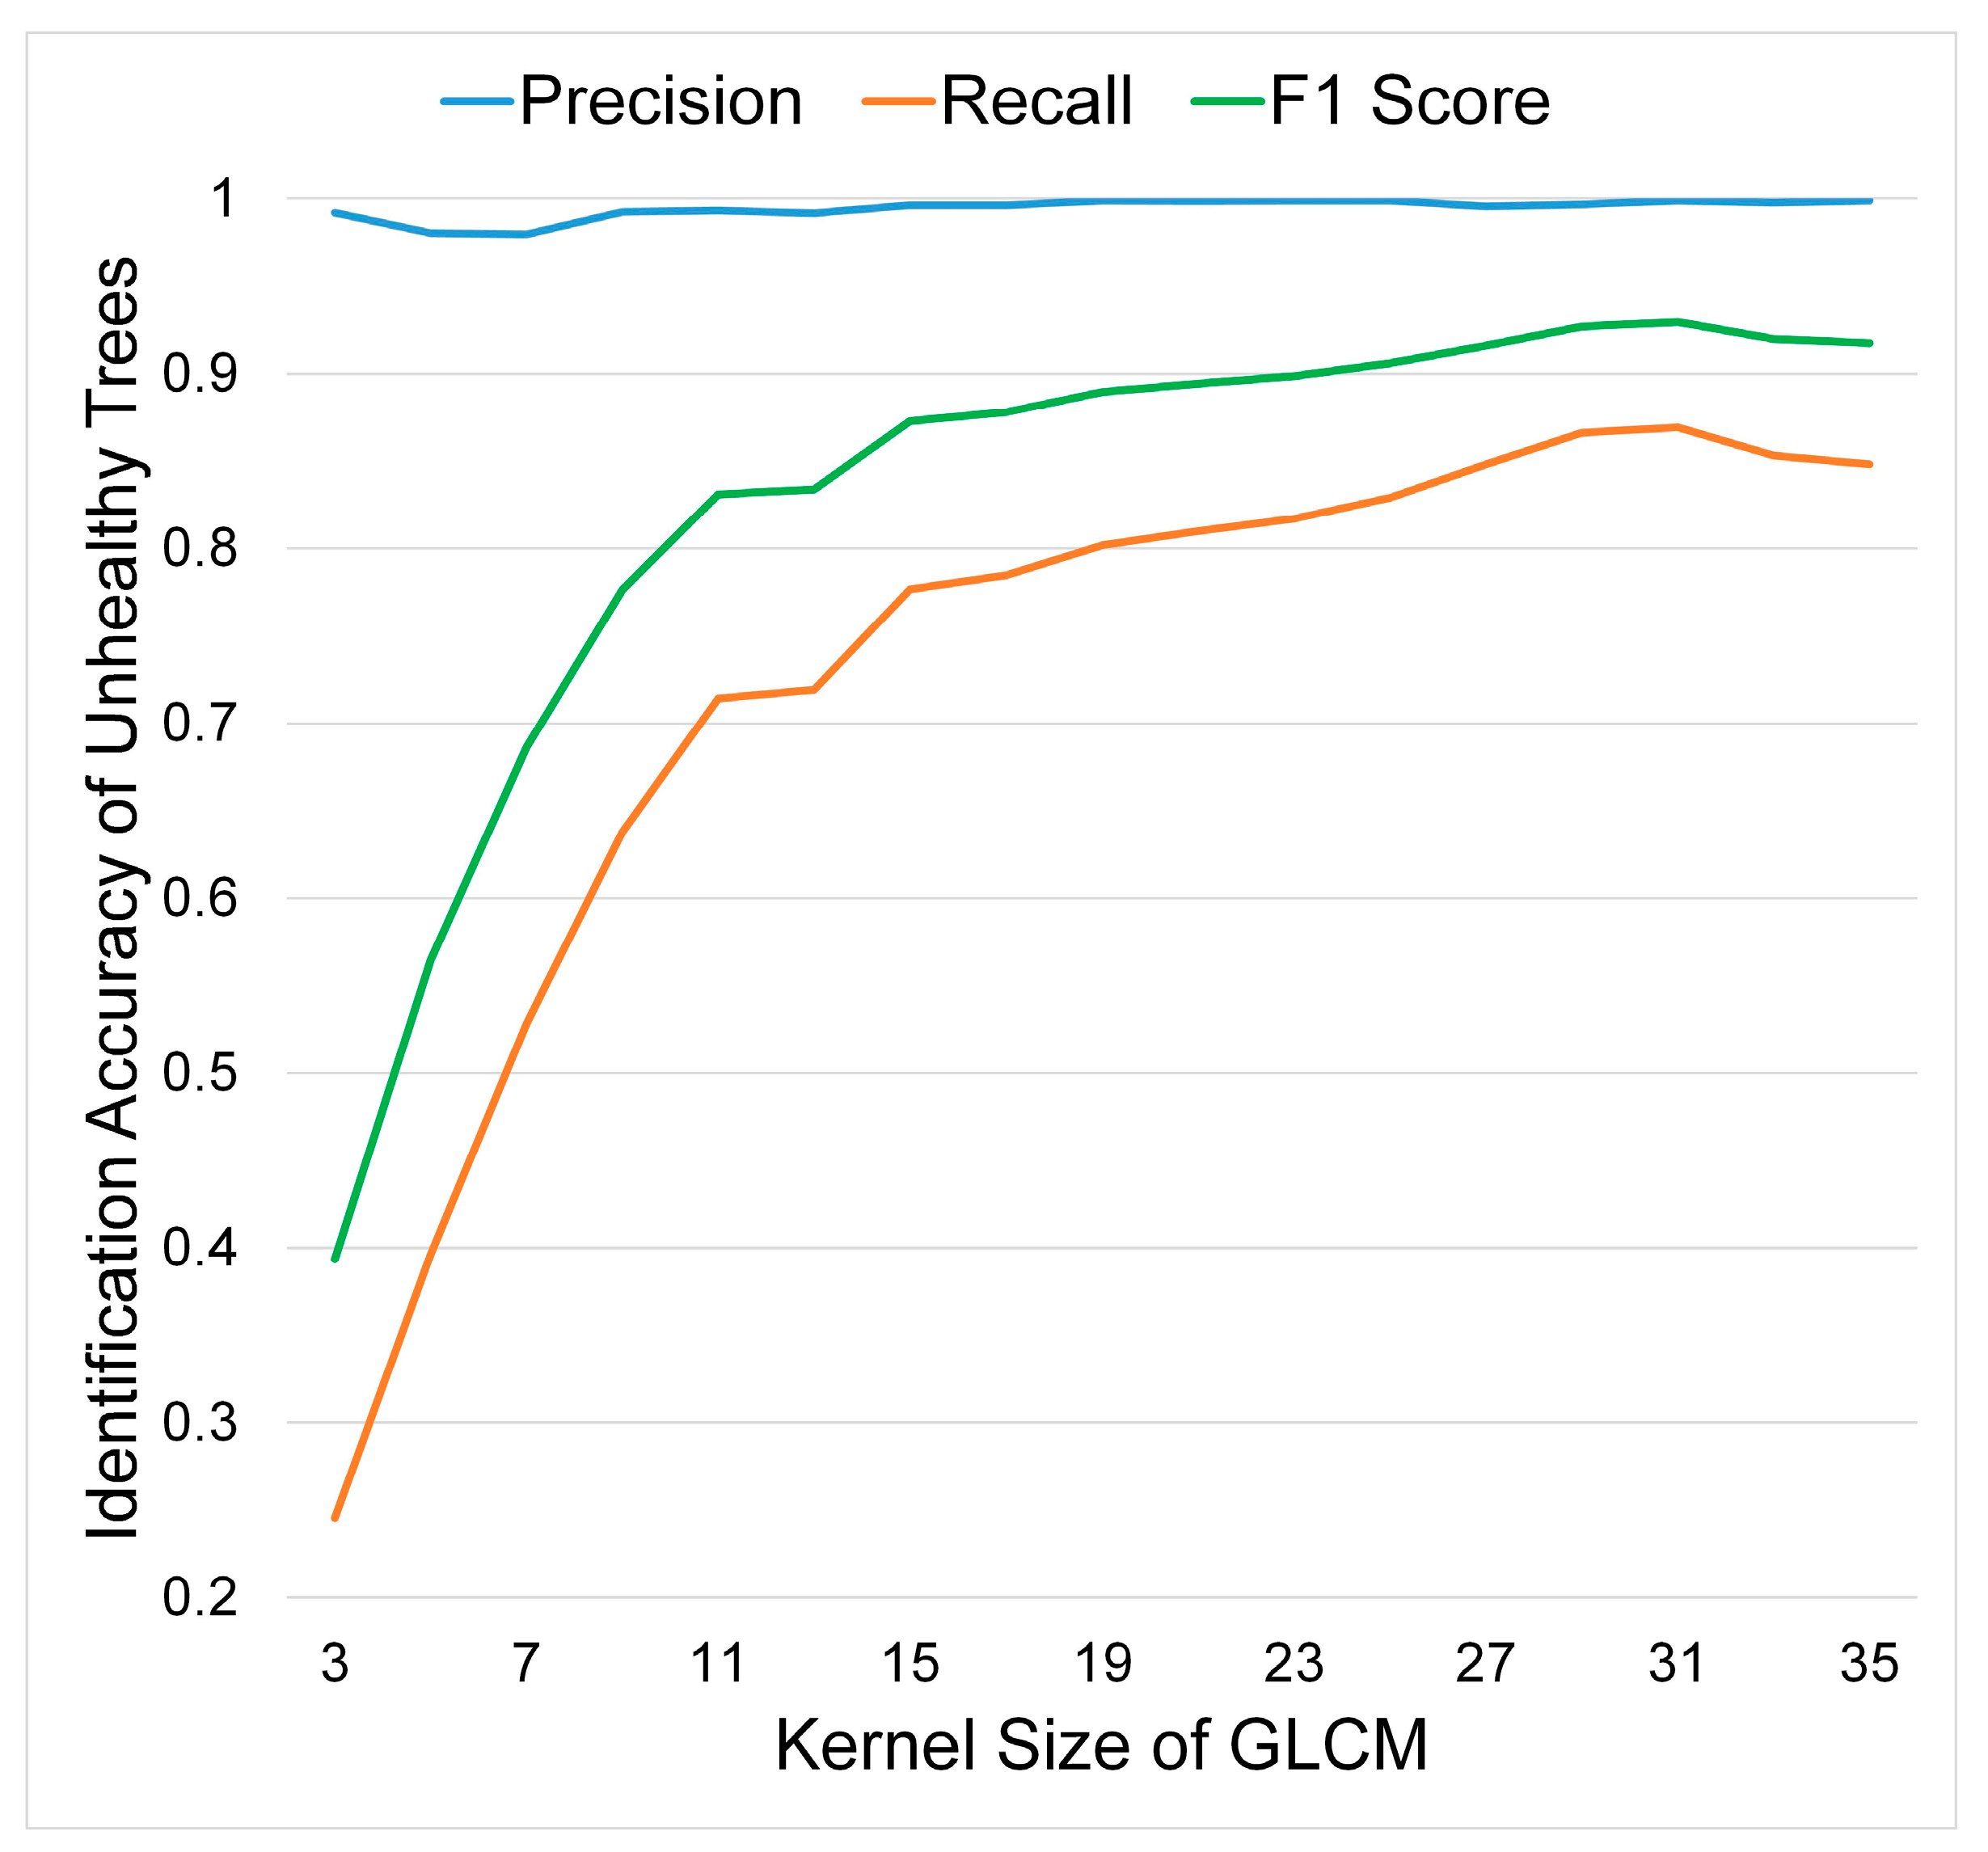
Figure 10.
Result of unhealthy tree identification (Base Map: WorldView-2; Coordinate System: WGS 1984 UTM 48N). (a) Unhealthy trees in Changhai Valley. (b) Unhealthy trees in Zaru Valley. (c) Unhealthy trees at the landslide-prone area in Changhai Valley. (d) Unhealthy trees around the residential area in Zaru Valley.

Figure 11.
Curves of RCF and fitted membership functions. (a) CCC in Changhai. (b) ARI2 in Changhai. (c) LAI in Changhai. (d) Altitude in Changhai. (e) RGRI in Changhai. (f) CWC in Changhai. (g) CCC in Zaru. (h) ARI2 in Zaru. (i) LAI in Zaru. (j) Altitude in Zaru. (k) RGRI in Zaru. (l) CWC in Zaru.
Figure 11.
Curves of RCF and fitted membership functions. (a) CCC in Changhai. (b) ARI2 in Changhai. (c) LAI in Changhai. (d) Altitude in Changhai. (e) RGRI in Changhai. (f) CWC in Changhai. (g) CCC in Zaru. (h) ARI2 in Zaru. (i) LAI in Zaru. (j) Altitude in Zaru. (k) RGRI in Zaru. (l) CWC in Zaru.

Figure 12.
AUC with different gamma values in 2022.
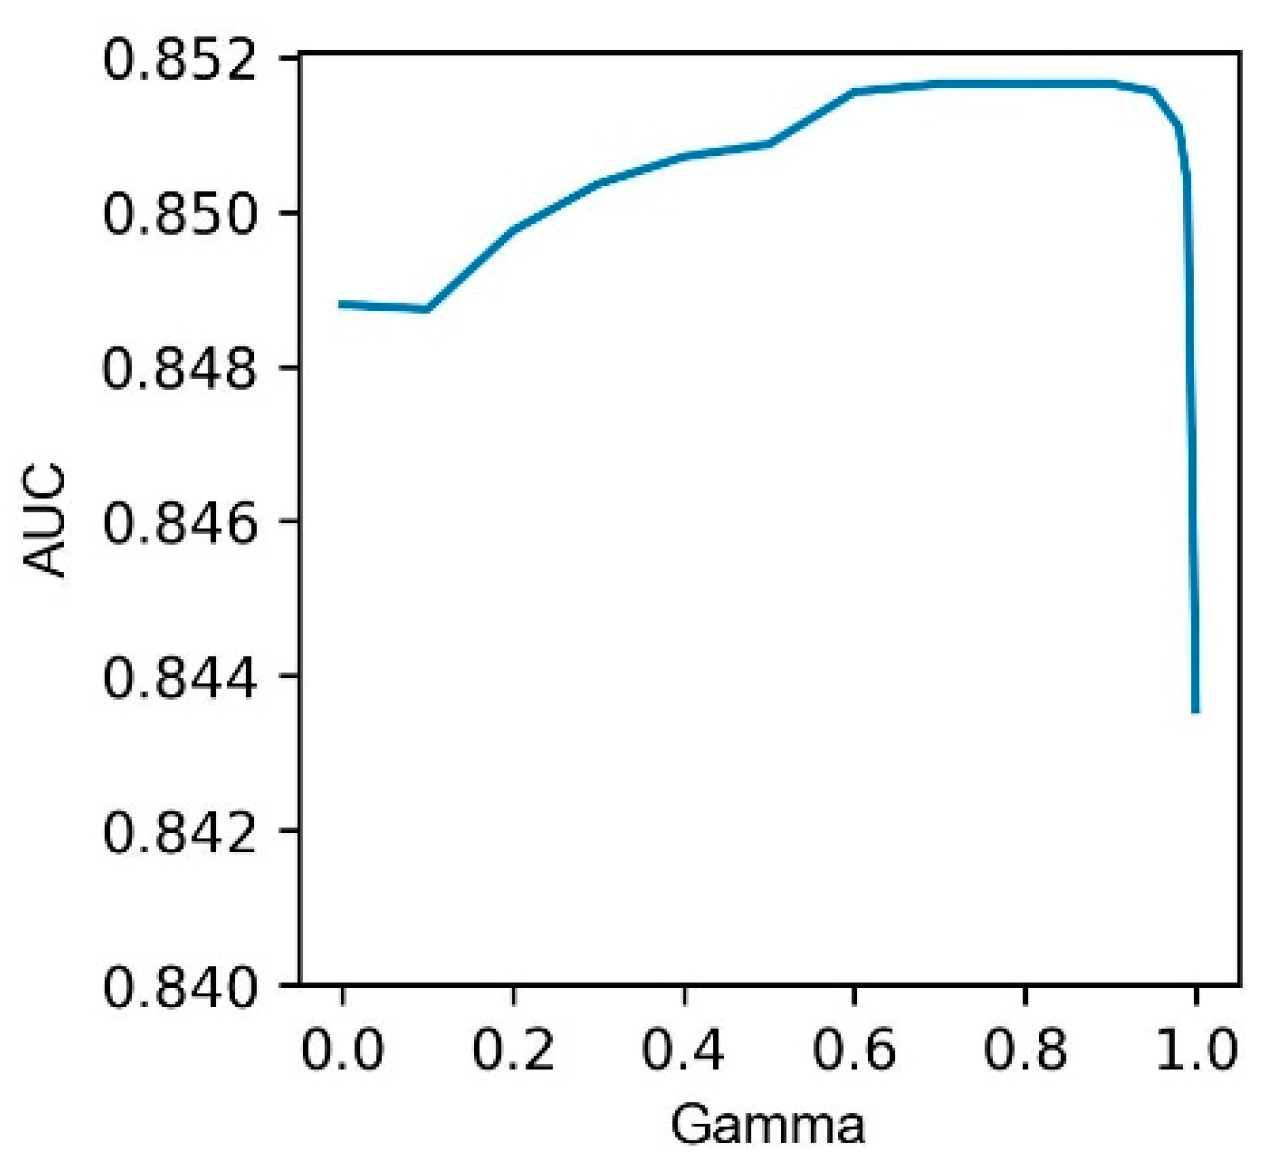
Figure 13.
ROC curves for data in 2022 and 2018.

Figure 14.
Susceptibility of unhealthy trees map for Zaru Valley in 2022. High-susceptibility locations of unhealthy trees exhibit a strong spatial correlation with the distribution of identified unhealthy trees.
Figure 14.
Susceptibility of unhealthy trees map for Zaru Valley in 2022. High-susceptibility locations of unhealthy trees exhibit a strong spatial correlation with the distribution of identified unhealthy trees.
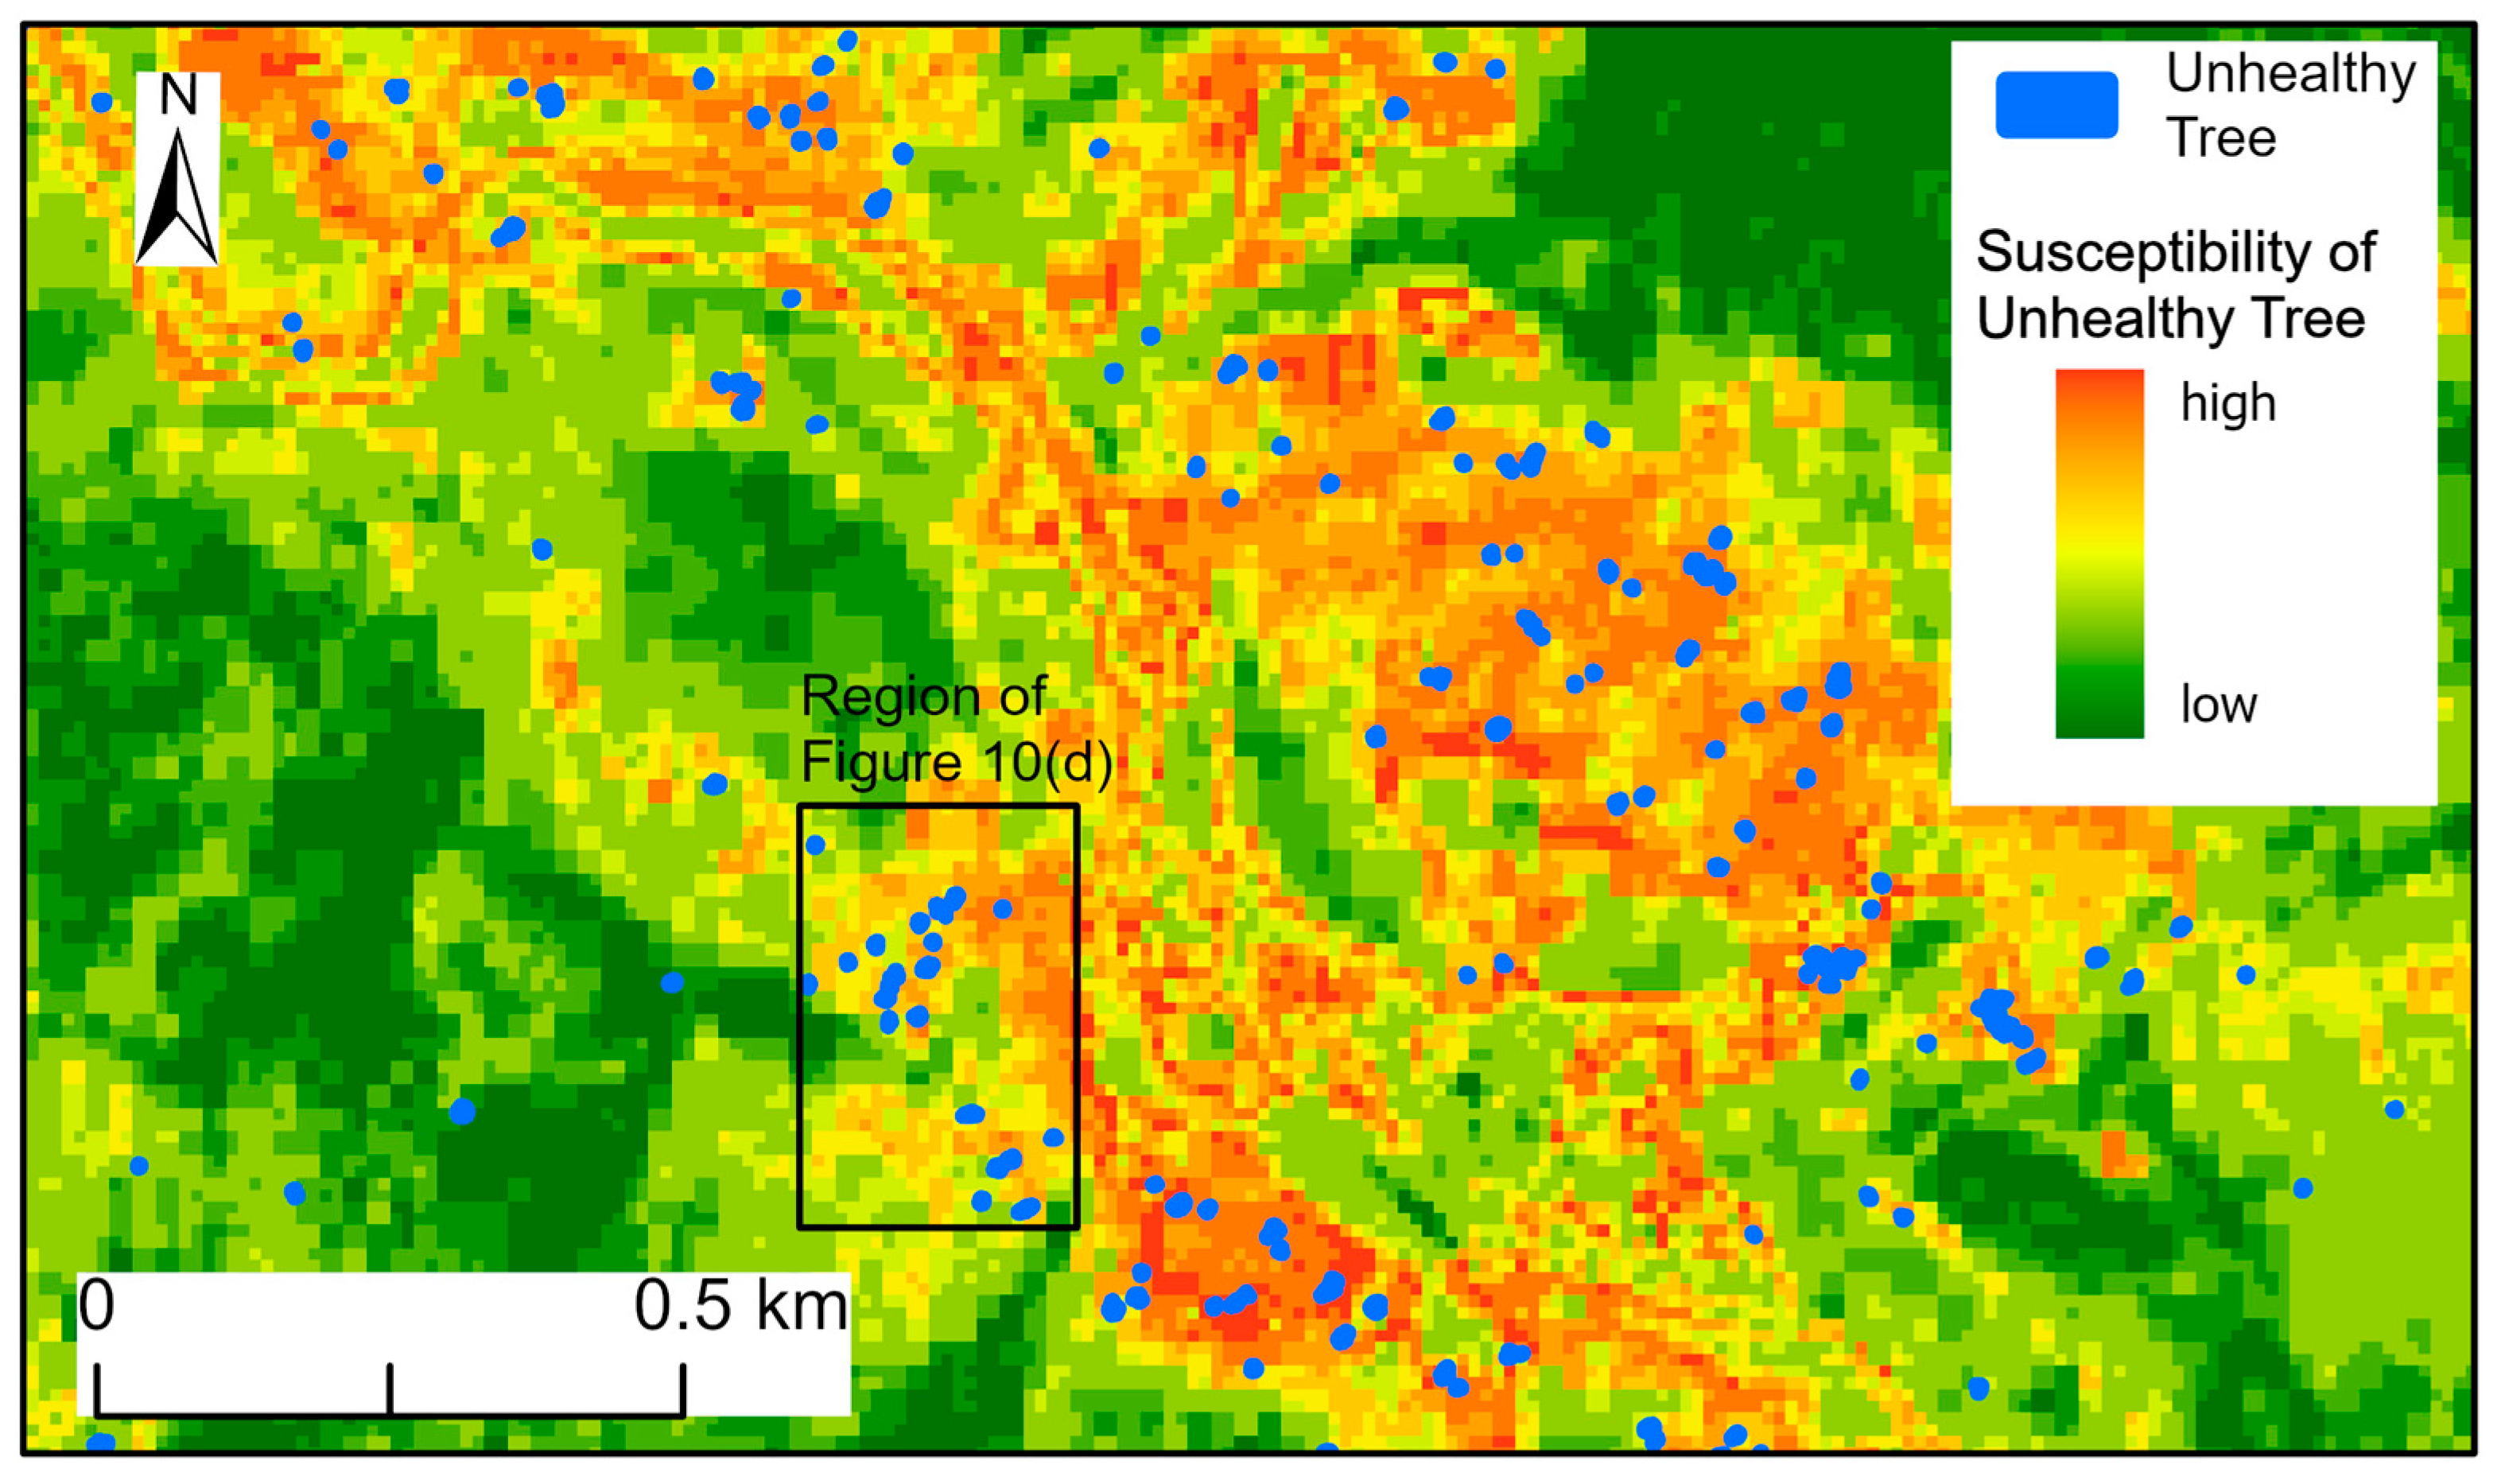
Figure 15.
Annual maps of unhealthy tree susceptibility in Zaru Valley (Data Source: Sentinel-2; Coordinate System: WGS 1984 UTM 48N). High susceptibility zones for unhealthy trees are concentrated in residential areas and exhibit an annual expansion in their extent.
Figure 15.
Annual maps of unhealthy tree susceptibility in Zaru Valley (Data Source: Sentinel-2; Coordinate System: WGS 1984 UTM 48N). High susceptibility zones for unhealthy trees are concentrated in residential areas and exhibit an annual expansion in their extent.
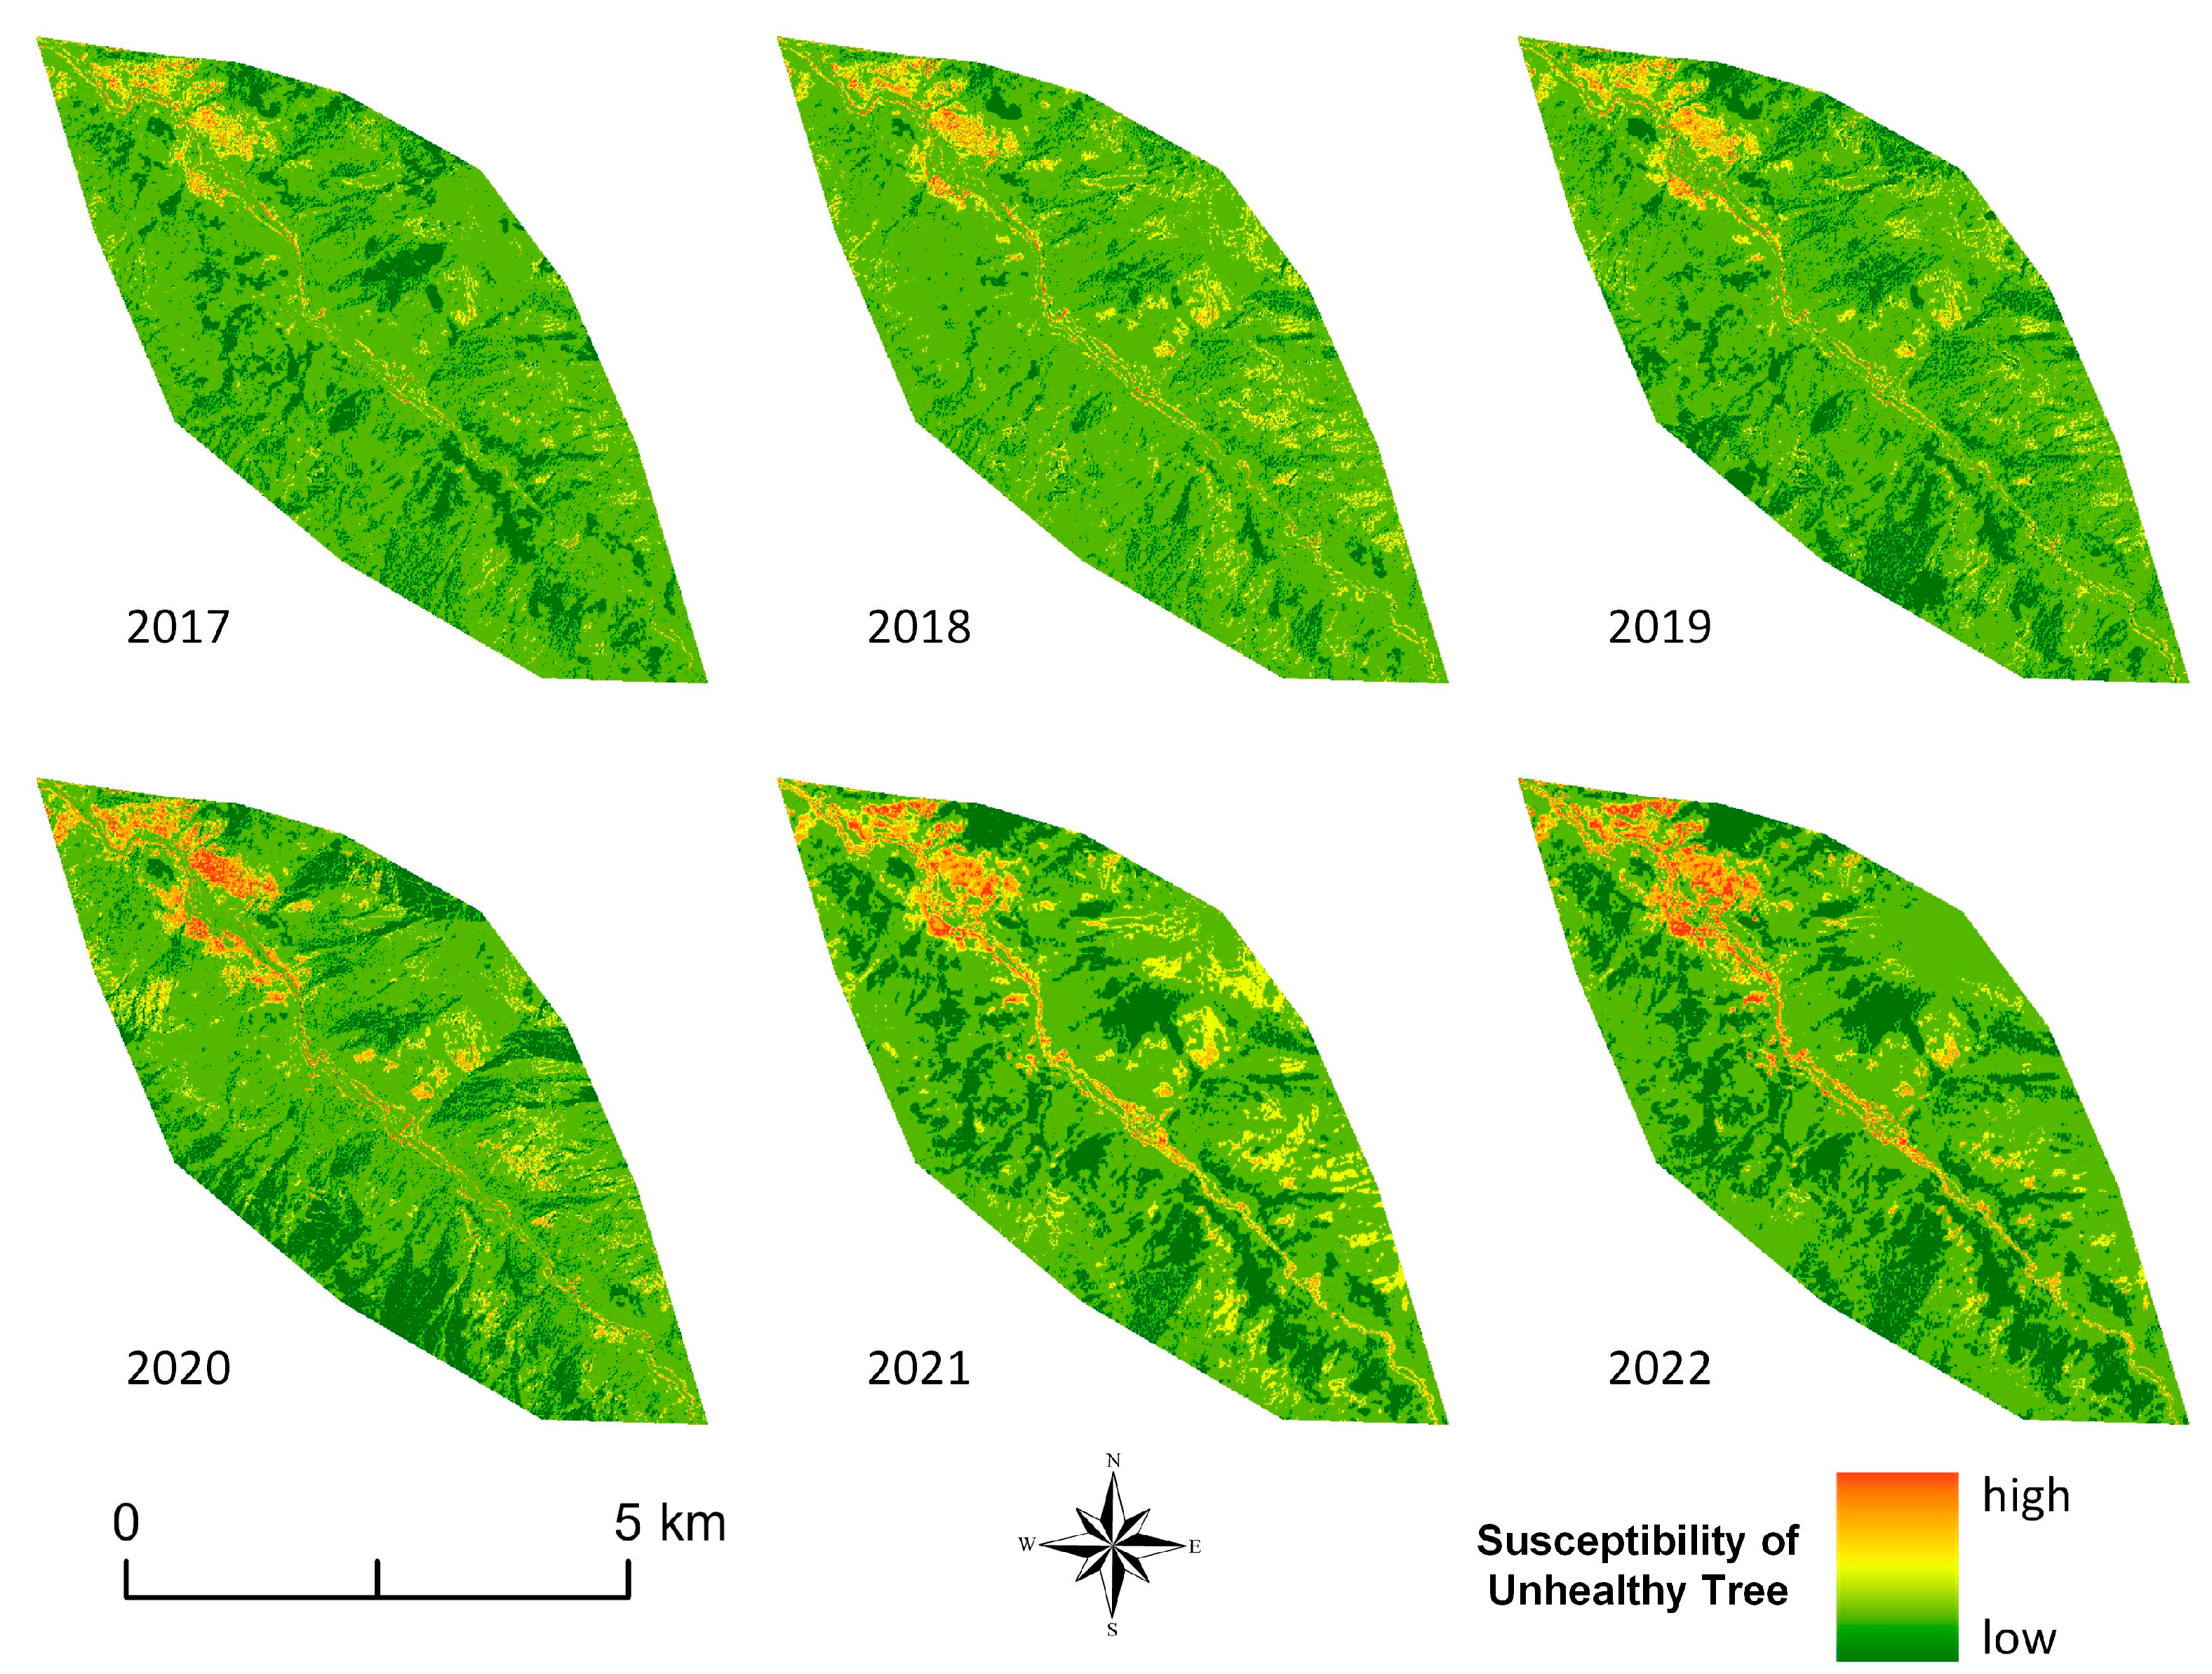
Figure 16.
Annual maps of unhealthy tree susceptibility in Changhai Valley (Data Source: Sentinel-2; Coordinate System: WGS 1984 UTM 48N). The high-susceptibility area for unhealthy trees reached its peak in 2019 and has since remained stable.
Figure 16.
Annual maps of unhealthy tree susceptibility in Changhai Valley (Data Source: Sentinel-2; Coordinate System: WGS 1984 UTM 48N). The high-susceptibility area for unhealthy trees reached its peak in 2019 and has since remained stable.

Table 1.
Spectral features calculated from WorldView-2 image.
| Name | Formula | Description |
|---|---|---|
| NDVI is traditional index for vegetation | ||
| RGI highlights the yellowing trend of leaves | ||
| MSAVI can weaken the impact of soil on vegetation | ||
| GNDVI is sensitive to chlorophyll a | ||
| NDRE reflects the early red edge anomaly when vegetation is under stress | ||
to are reflectances for band1 to band8 in the WorldView-2 image.
Disclaimer/Publisher’s Note: The statements, opinions and data contained in all publications are solely those of the individual author(s) and contributor(s) and not of MDPI and/or the editor(s). MDPI and/or the editor(s) disclaim responsibility for any injury to people or property resulting from any ideas, methods, instructions or products referred to in the content. |
© 2023 by the authors. Licensee MDPI, Basel, Switzerland. This article is an open access article distributed under the terms and conditions of the Creative Commons Attribution (CC BY) license (https://creativecommons.org/licenses/by/4.0/).
Share and Cite
MDPI and ACS Style
Gao, S.; Chen, F.; Wang, Q.; Shi, P.; Zhou, W.; Zhu, M. Susceptibility Mapping of Unhealthy Trees in Jiuzhaigou Valley Biosphere Reserve. Remote Sens. 2023, 15, 5516. https://doi.org/10.3390/rs15235516
AMA Style
Gao S, Chen F, Wang Q, Shi P, Zhou W, Zhu M. Susceptibility Mapping of Unhealthy Trees in Jiuzhaigou Valley Biosphere Reserve. Remote Sensing. 2023; 15(23):5516. https://doi.org/10.3390/rs15235516
Chicago/Turabian StyleGao, Sheng, Fulong Chen, Qin Wang, Pilong Shi, Wei Zhou, and Meng Zhu. 2023. "Susceptibility Mapping of Unhealthy Trees in Jiuzhaigou Valley Biosphere Reserve" Remote Sensing 15, no. 23: 5516. https://doi.org/10.3390/rs15235516
Note that from the first issue of 2016, this journal uses article numbers instead of page numbers. See further details here.