Article

GF-1 WFV Surface Reflectance Quality Evaluation in Countries along “the Belt and Road”

1
Aerospace Information Research Institute, Chinese Academy of Sciences, Beijing 100094, China
2
University of Chinese Academy of Sciences, Beijing 100049, China
3
School of Remote Sensing and Information Engineering, North China Institute of Aerospace Engineering, Langfang 065000, China
4
School of Geographic and Environmental Sciences, Tianjin Normal University, Tianjin 300387, China
*
Author to whom correspondence should be addressed.
Remote Sens. 2023, 15(22), 5382; https://doi.org/10.3390/rs15225382
Submission received: 26 September 2023 / Revised: 6 November 2023 / Accepted: 7 November 2023 / Published: 16 November 2023

Abstract

:
The GaoFen-1 wide field of view (GF-1 WFV) has produced level 1 digital number data globally; however, most applications have focused on China, and data quality outside China has not been validated. This study presents a preliminary assessment of the 2020 GF-1 WFV surface reflectance data for Nepal, Azerbaijan, Kenya, and Sri Lanka along “the Belt and Road” route using Sentinel-2 Multi-Spectral Instrument (MSI), Landsat-8 Operational Land Image (OLI), and Moderate Resolution Imaging Spectroradiometer (MODIS) data. A method for obtaining the GF-1 WFV surface reflectance data was also proposed, with steps including atmospheric correction, cross-radiation calibration, and bidirectional reflectance distribution function correction. The results showed that WFV surface reflectance data was not significantly different from MSI, OLI, and MODIS surface reflectance data. In the visible and near-infrared bands, for most landcover types, the bias was less than 0.02, and the precision and root mean square error were less than 0.04. When the landcover types were forest and water, the MSI, OLI, and MODIS surface reflectance data were higher than that of WFV in the near-infrared band. The results of this study provide a basis for assessing the global application potential of GF-1 WFV.

Graphical Abstract

1. Introduction

The GaoFen-1 (GF-1) satellite is an important component of China’s high-definition Earth observation satellite series. GF-1 is equipped with four wide field of view (WFV) sensors, each with a swath of up to 200 km, and a combined four camera swath of nearly 800 km, covering four wavelengths from visible to near-infrared (NIR) with a spatial resolution of 16 m and a temporal resolution of only 4 days [1]. The combination of high spatiotemporal resolution and wide coverage enables GF-1 images to be used in a variety of applications such as seasonal crop classification mapping [2,3], water resource environmental monitoring [4,5,6], leaf area index assessment [7,8], vegetation cover estimation [9,10,11], and high-resolution aerosol optical depth retrieval [12,13,14,15]. The GF series satellites already play a major role in China’s high-precision earth observation, and there is already usable analysis-ready data (ARD) for the GF-1 WFV; however, only the processing data within China has been completed, while fewer studies have been conducted on the processing of data outside China with the quality evaluation of surface reflectance [16]. As GF data become more sophisticated, we need to pay more attention to the potential of the GF series of satellites to provide high-quality services on a global scale.
The GF-1 is equipped with four sensors, WFV1–4. WFV2 and WFV3 observe zenith angles between 0° and 24°, whereas WFV1 and WFV4 observe zenith angles between 24° and 40°. The larger observed zenith angle and increase in atmospheric paths can cause a dramatic difference in reflectance between the zenith and off-zenith views [17,18]. In addition to the normal geometric and atmospheric corrections, the surface reflectance inversion of the GF-1 WFV also needs to take into consideration the bidirectional reflectance distribution function correction (BRDF) effect over a large field of view. Fortunately, the Moderate Resolution Imaging Spectroradiometer (MODIS) has developed validated global BRDF products that can be applied to simulate the BRDF effects produced by non-Lambertian surface targets in the direction of the observation object of interest [19,20,21]. No application examples of BRDF corrections for GF-1 WFV using MODIS products are available at present.
Surface reflectance is the ratio of the radiation reflected from a surface to the incident radiation, characterizing the ability of a surface to absorb and reflect solar radiation [22]. It is a fundamental remote sensing parameter for quantitative remote sensing, and its precision determines the quality and accuracy of applications such as surface parameter inversion and feature classification [23,24]. A variety of sensors similar to the GF-1 WFV are available, and these sensors already have surface reflectance data that is directly available to researchers, such as Landsat and Sentinel, and the quality of the data is widely recognized worldwide. For example, the United States Geological Survey developed an ARD for the Landsat series of satellites. The ARD is provided as a tiled, georegistered, top of atmosphere (TOA) and surface reflectance, defined in a common equal-area projection, with quality assessment. The processed ARD is currently available for Landsat-5 Thematic Mapper, Landsat-7 Enhanced Thematic Mapper Plus, Landsat-8 Operational Land Imager (OLI), and Thermal Infrared Sensor data [25]. Studies have been conducted to evaluate the quality of the Landsat-5, 7, and 8 series globally, such as cross-validation using MODIS data or validation using surface reflectance inverted from Aerosol Robotic Network (AERONET) data. The validation results show that, in more than 80% of the scenarios, the surface reflectance uncertainty of Landsat-5, 7 remains within specifications, defined as 0.071 × surface reflectance + 0.0071. The validation results for Landsat-8 are superior to those for Landsat-5 and 7 [26,27,28,29]. For Sentinel-2 multi-spectral instrument (MSI) data, users only need to perform simple processing to obtain surface reflectance data, which is facilitated by the atmospheric correction plug-in Sen2Cor developed by the European Space Agency [30,31]. Sentinel-2 surface reflectance data processed with Sen2Cor was compared with atmospherically corrected Landsat-8 data, and the overall RMSE was 0.031 for all six bands used for comparison [32]. The surface reflectance data of Gaofen-1 has not been validated outside China, compared with the quality of the same type of satellite products that have been validated worldwide.
To address the abovementioned problems, we compared the surface reflectance data of GF-1 WFV with that of Sentinel-2 MSI, Landsat-8 OLI and MODIS for quality assessment and proposed a BRDF correction method for GF-1 WFV. The main contributions of this article can be summarized follows:
  • This study validates the quality of GF-1 WFV surface reflectance data from Nepal, Azerbaijan, Kenya, and Sri Lanka. It provides quality information for the global application of GF-1 WFV and quality references for harmonization with Sentinel-2 MSI and Landsat-8 OLI.
  • A nadir-view surface reflectance processing flow for WFV is proposed, including geometric corrections, atmospheric corrections, and BRDF corrections to reduce the wide field of view effect of the sensor.
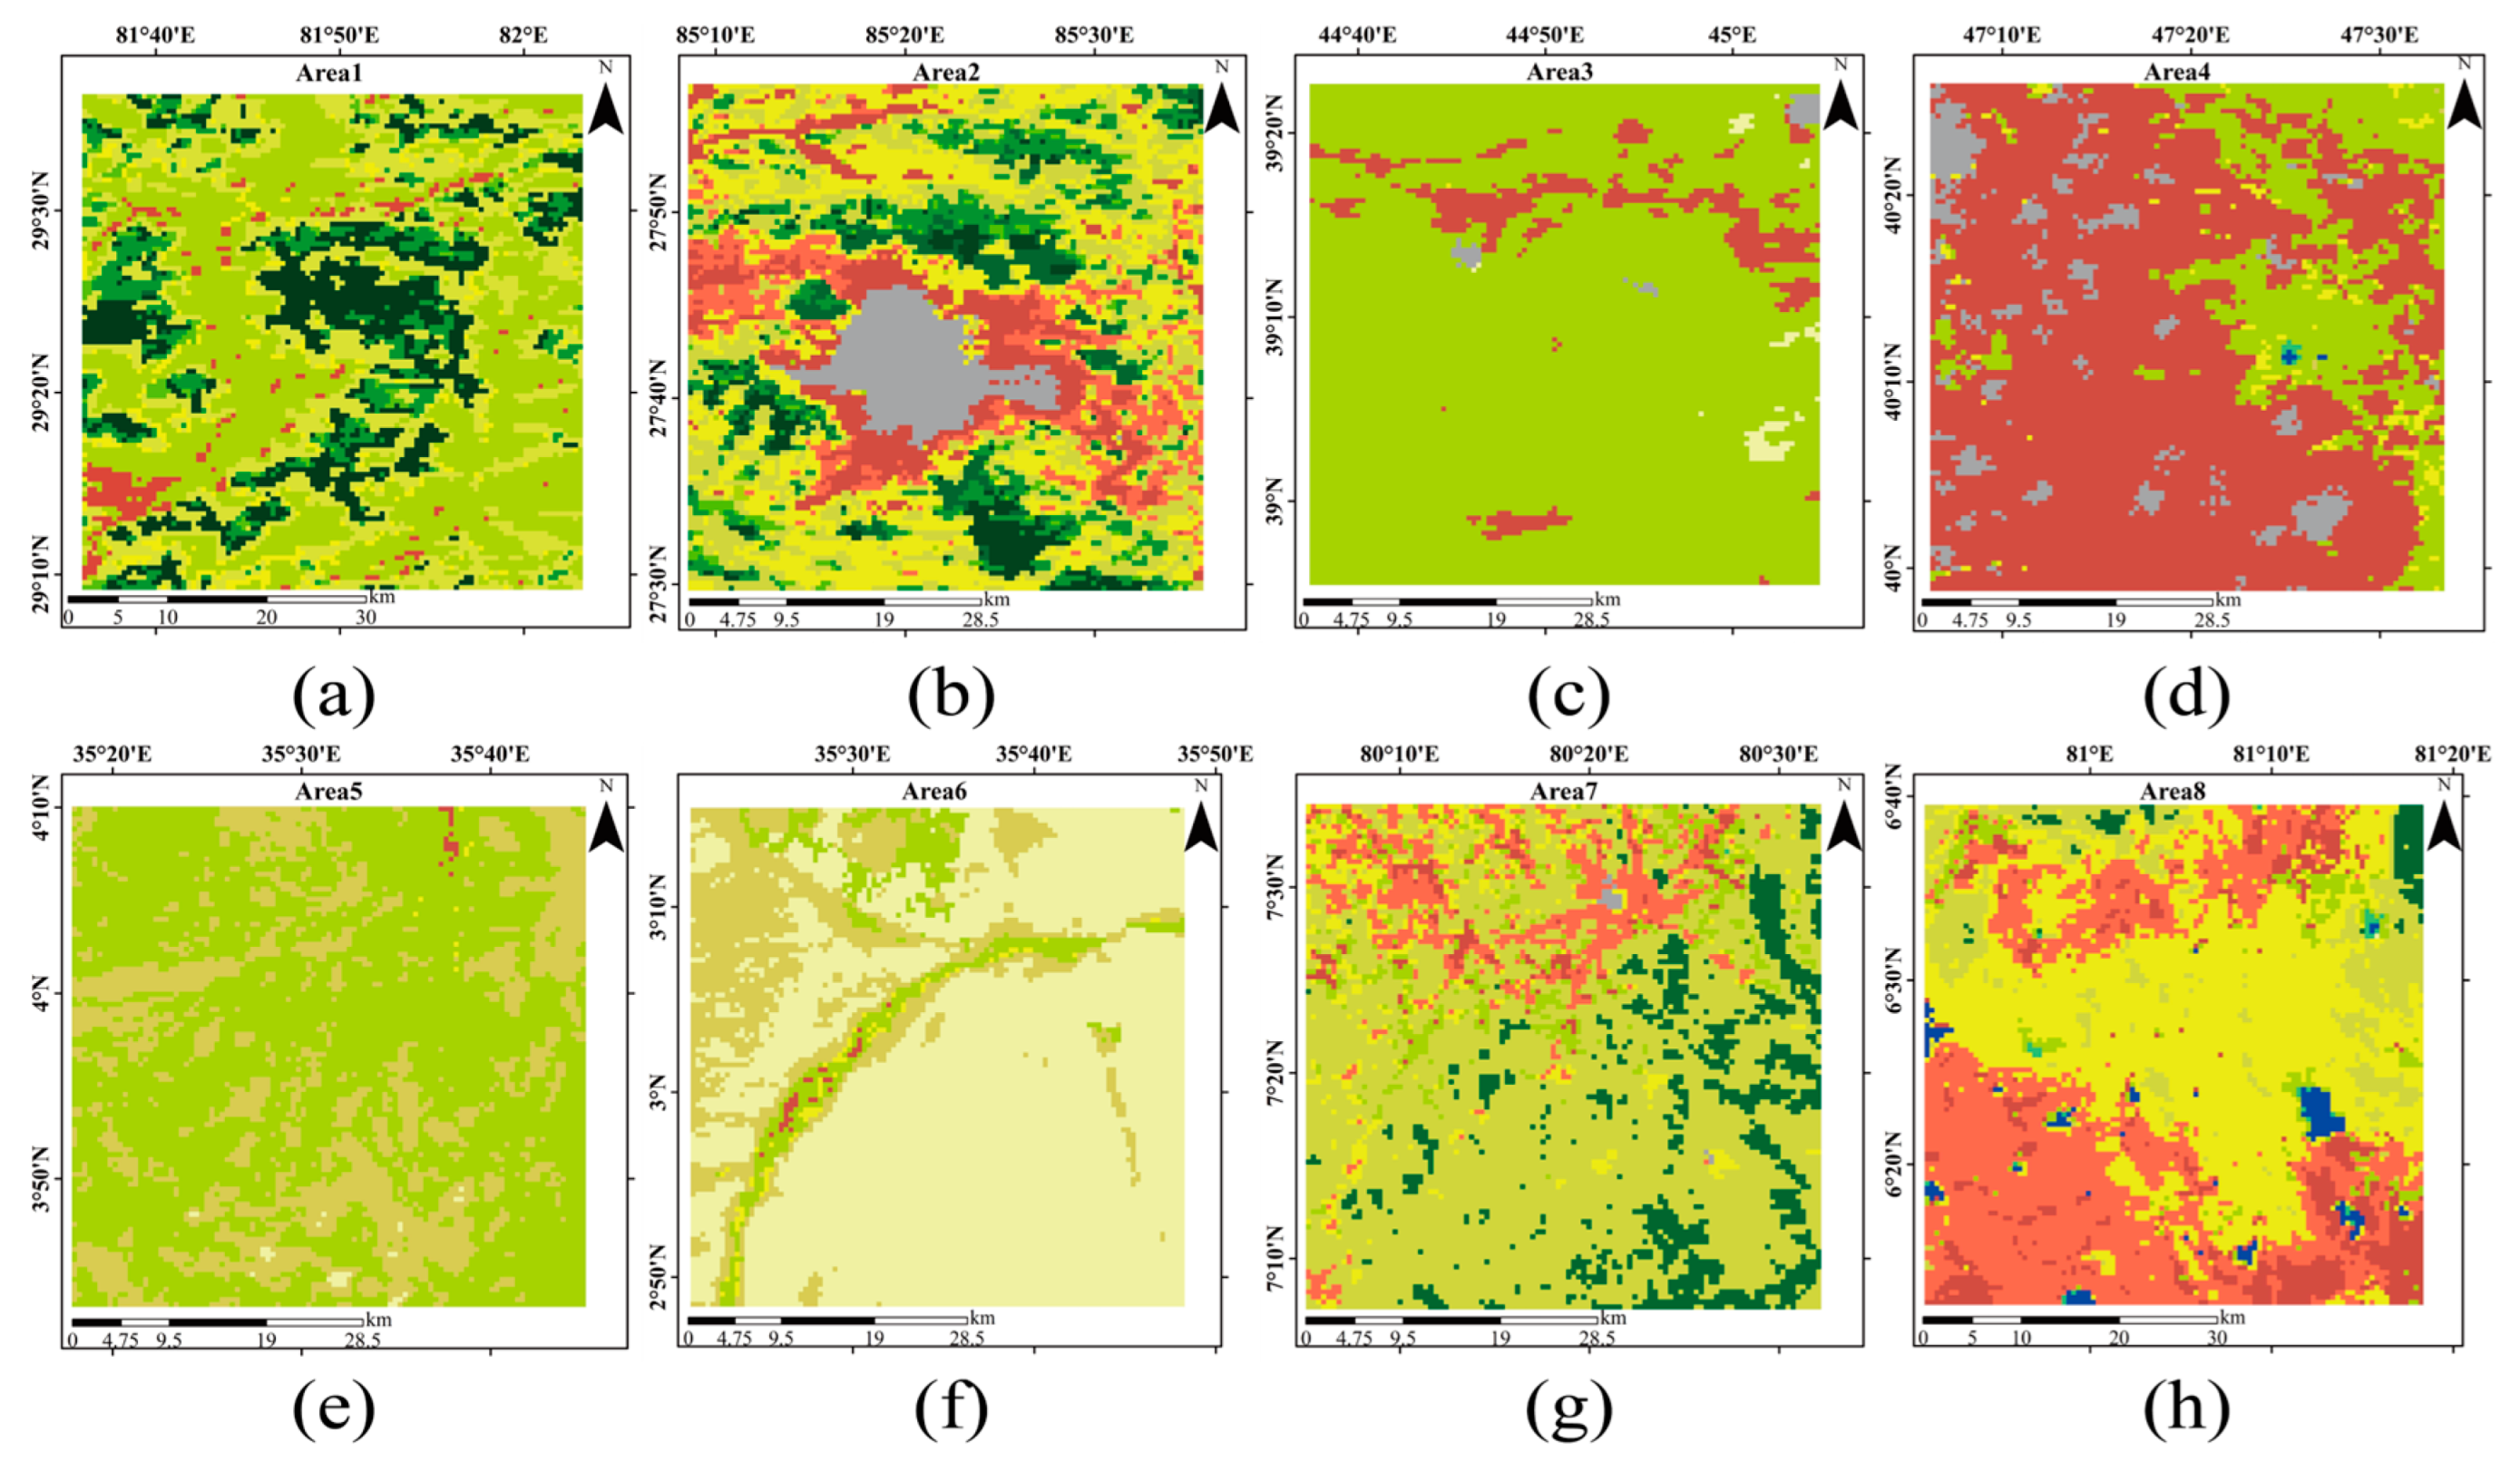
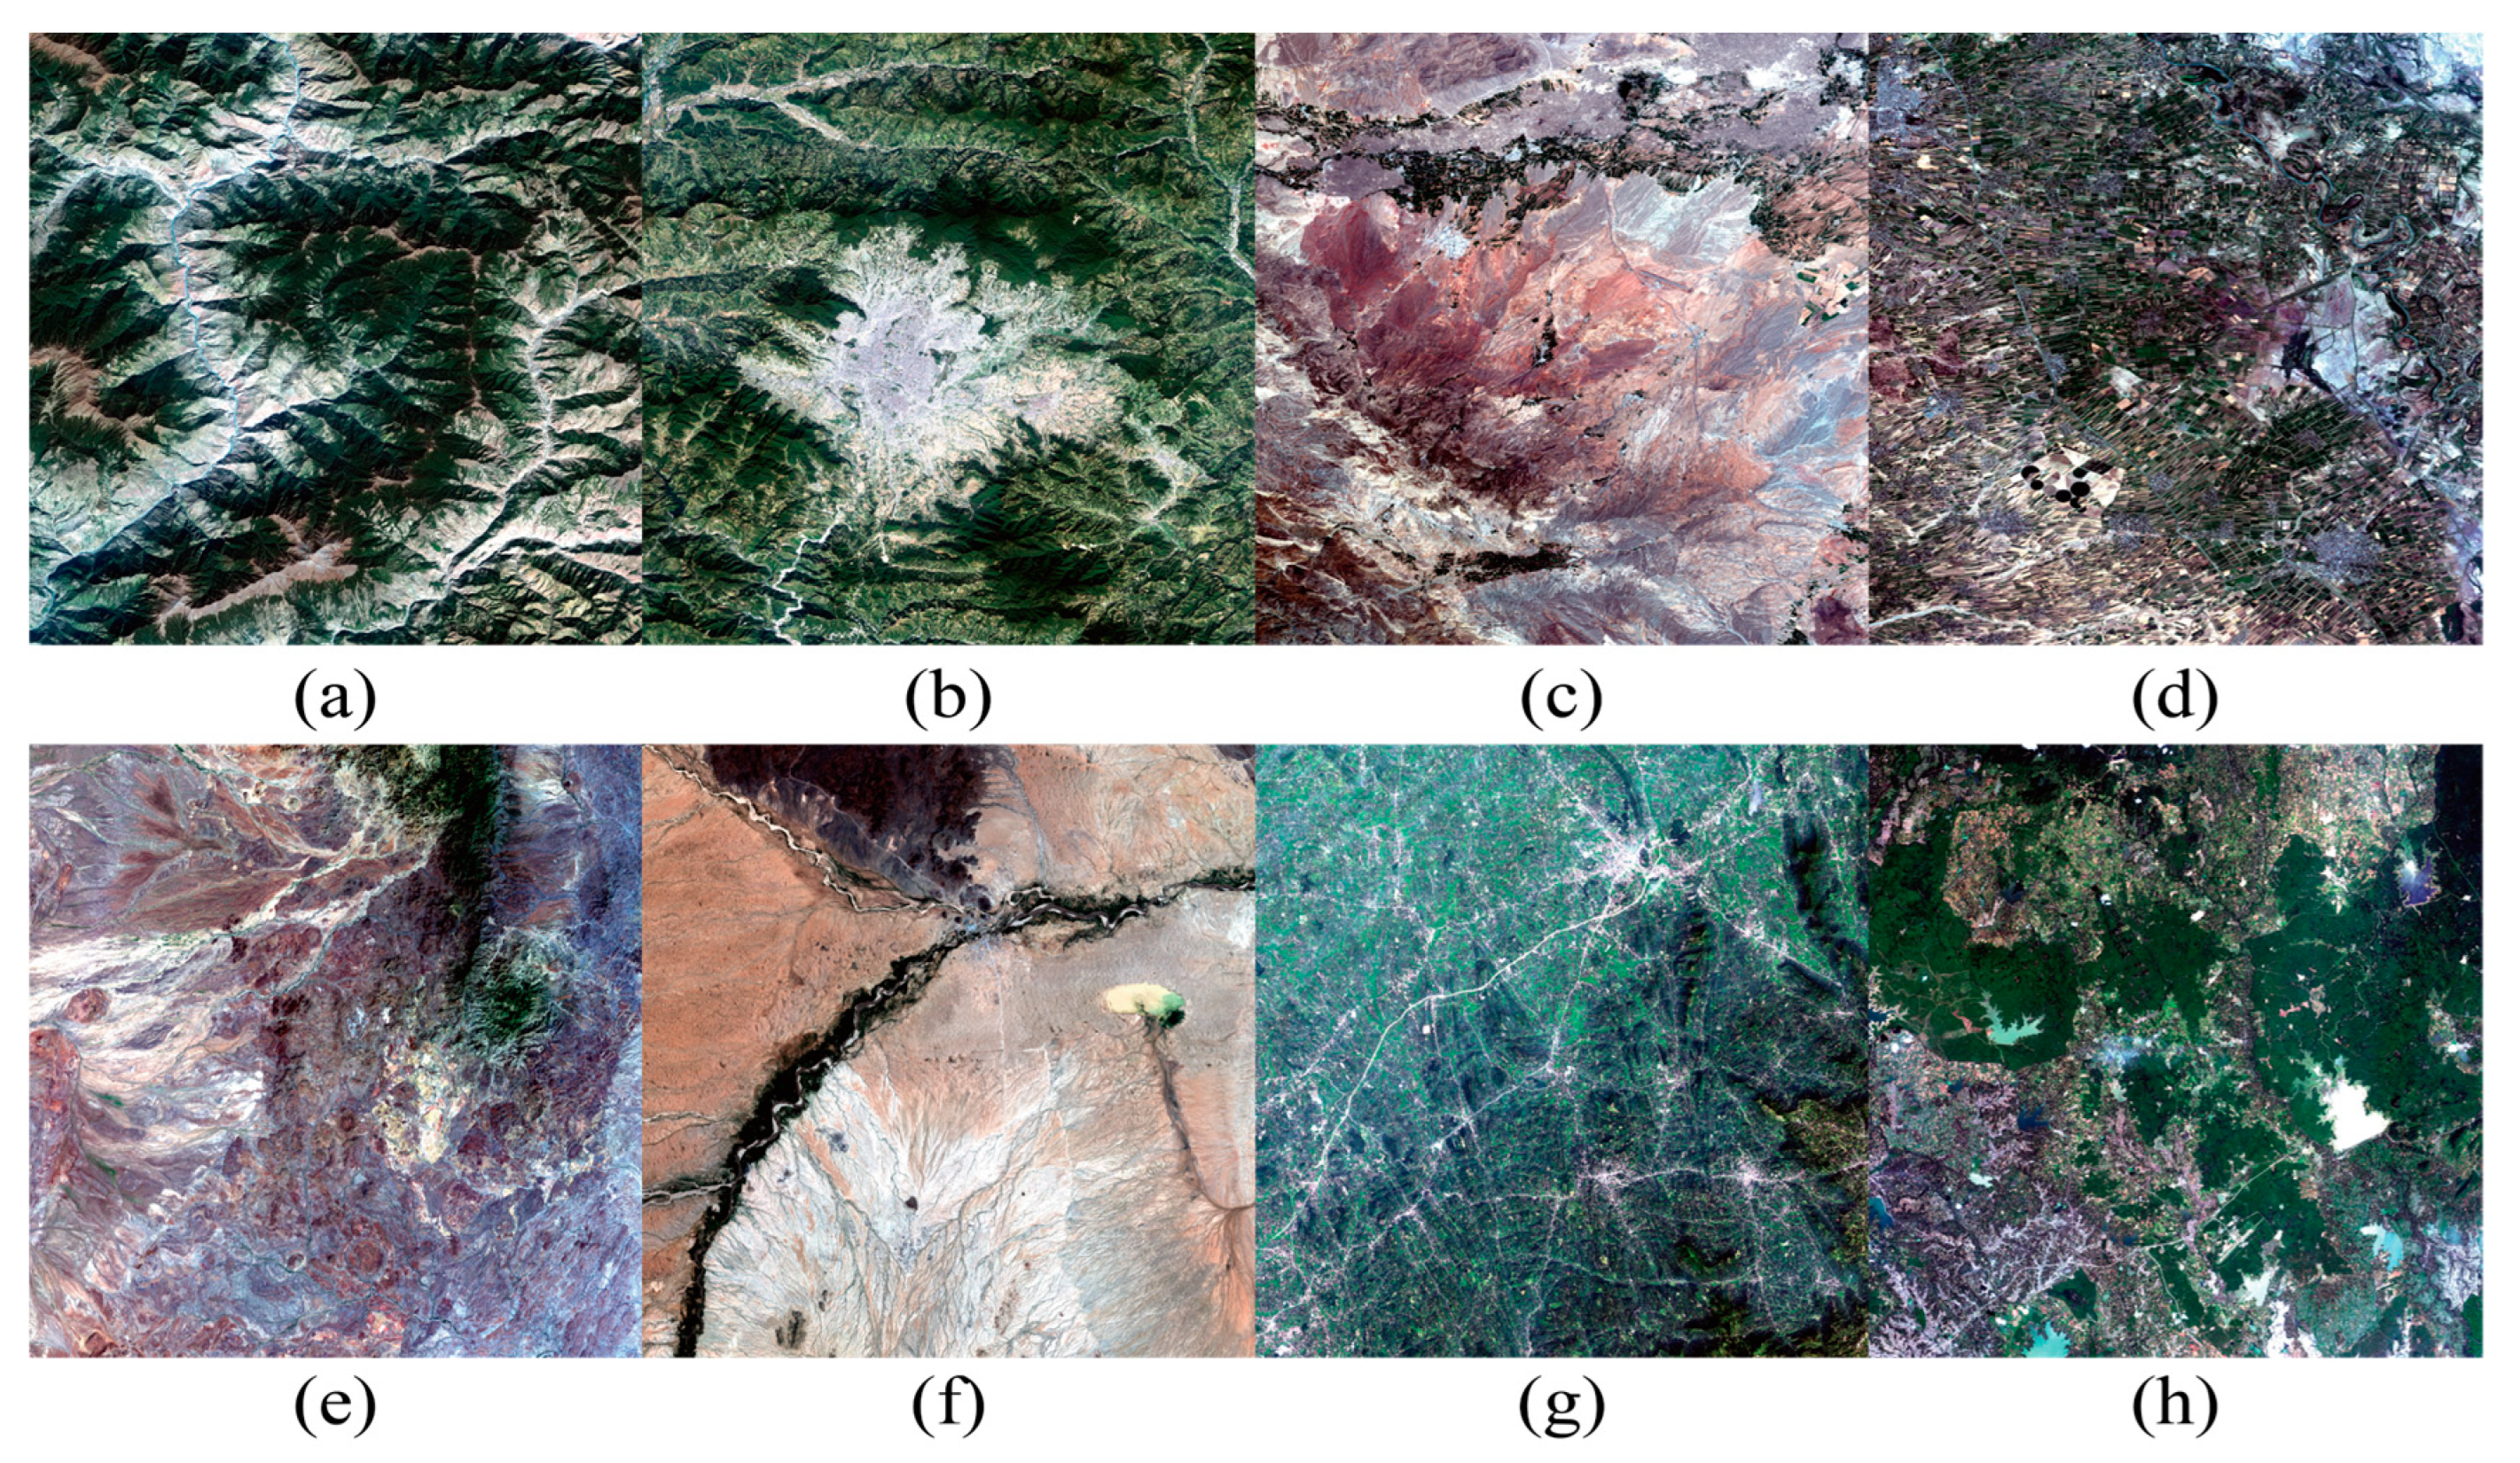
2. Study Area

Nepal, Azerbaijan, Kenya, and Sri Lanka were selected for the GF-1 WFV data quality evaluation, and two experimental areas were selected for each country, as shown in Figure 1. A zoomed-in view of the land cover types in each experimental area is shown in Figure 2. The details of each area are listed in Table 1, each covering approximately 2500 km2. These four countries have a wide range of landcover types and climate categories and provide sufficient experimental samples to verify the surface reflectance accuracy of the GF-1 WFV [33,34,35,36].

3. Data and Methodology

3.1. GF-1 WFV Satellite Data and Auxiliary Data

The GF-1 WFV data were provided by the China Center for Resources Satellite Data and Application (CRESDA), which currently releases GF-1 data at level 1 for download at https://data.cresda.cn/#/home (accessed on 26 September 2023). The downloaded GF-1 WFV images contained blue, green, and red visible bands and an NIR band, at a spatial resolution of 16 m. This was accompanied by solar and satellite angular information at the time of imaging and the rational polynomial coefficients (RPCs) used for orthographic correction. The thumbnails of the GF-1 WFV images for the eight experimental areas are shown in Figure 3; all images were composited in true color. The selected experimental areas have excellent image quality, rich landcover types, and no obvious cloud cover.
Auxiliary data included elevation, aerosol optical depth (AOD), and BRDF data. Shuttle Radar Topography Mission-SRTM 1 Arc-Second Global was selected as the digital elevation model (DEM) for orthorectification with a spatial resolution of 30 m [37]. MCD19A2 provides AOD data, where MODIS has a transit time similar to that of GF-1 and negligible aerosol variability in the absence of clouds and can therefore be used as an AOD parameter for GF-1 atmospheric correction with a spatial resolution of 1 km [38]. The MCD43A1 data provided the weighting parameters associated with the BRDF model for correction of the GF-1 WFV data [39].
The products used for quality evaluation were Sentinel-2 MSI, Landsat-8 OLI, and MODIS surface reflectance data. The MSI and OLI surface reflectance were both atmospherically corrected for high accuracy and had spatial resolutions of 10 m and 30 m, respectively. The MODIS surface reflectance employs the MCD43A product, which is nadir BRDF-adjusted reflectance data with a spatial resolution of 500 m. All three datasets contained the blue, green, red, and NIR bands. MSI, OLI, and MODIS data were downloaded from the Google Earth Engine (GEE). A summary of the remote sensing data information used in this article is shown in Table 2.

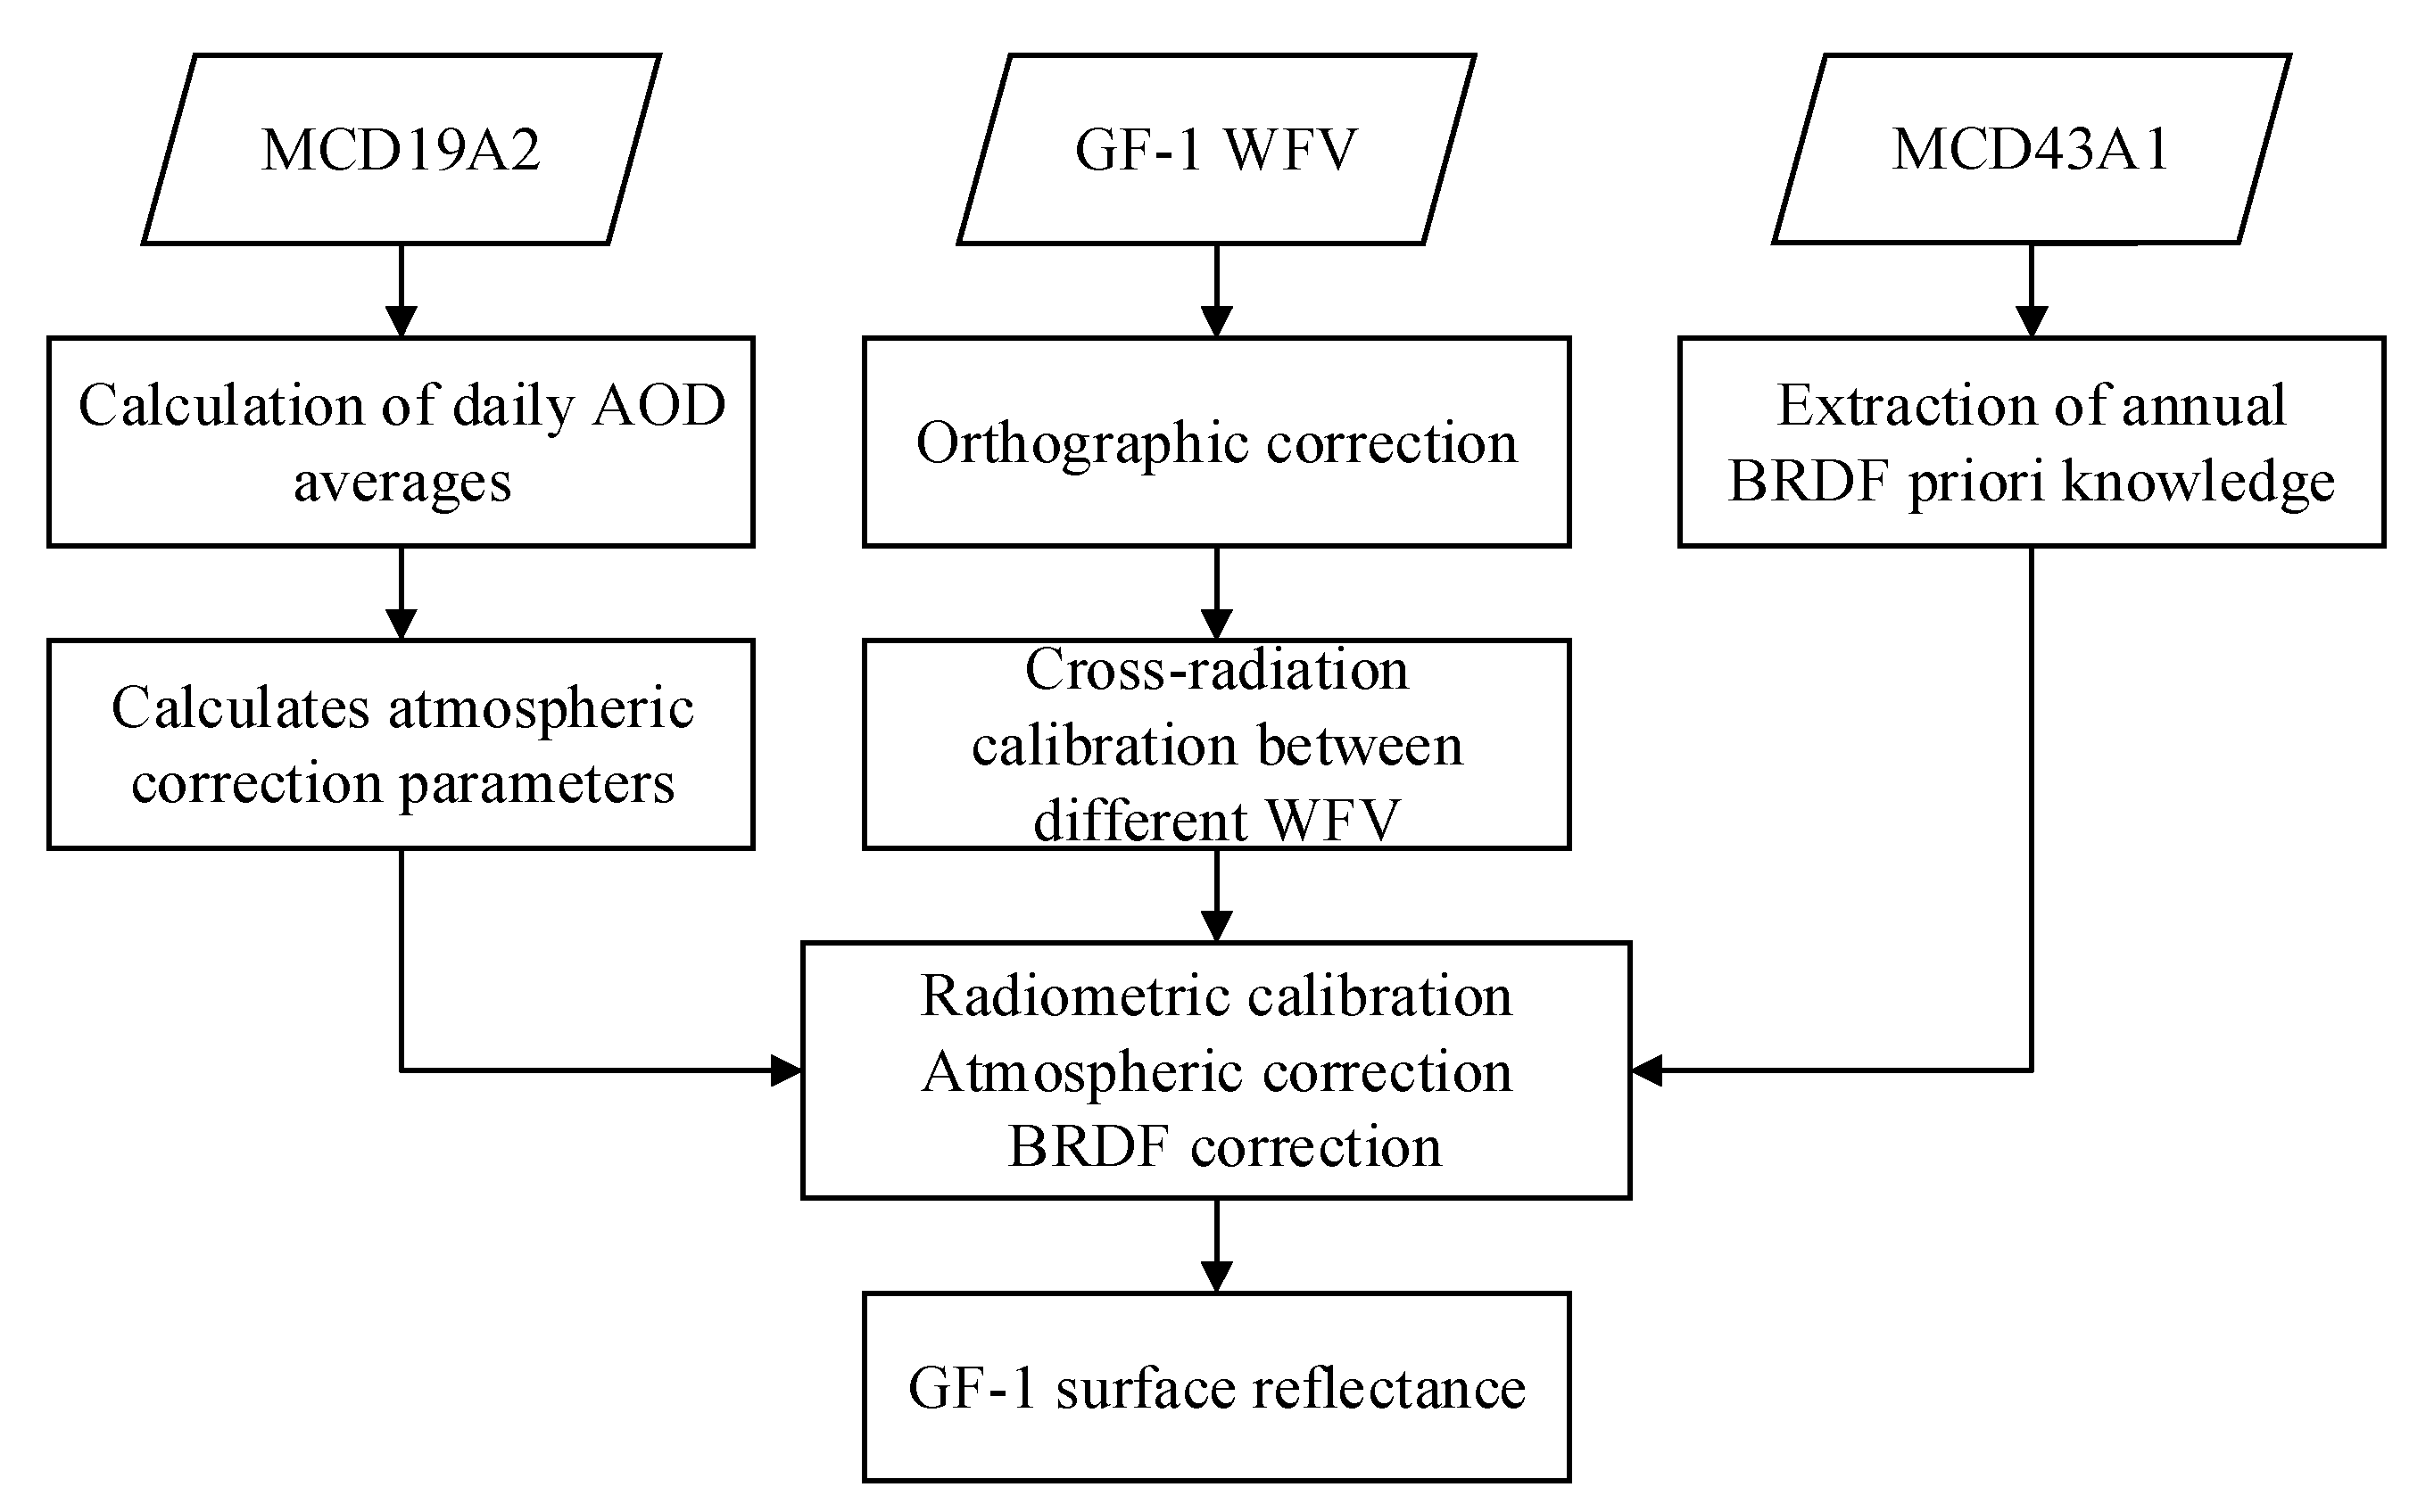
3.2. Inversion Method for GF-1 WFV Surface Reflectance

This study presents a GF-1 WFV surface reflectance inversion process that solves the geometric, radiometric, and spectral aspects of the problem, including orthorectification, radiometric calibration, geometric correction, atmospheric correction, cross-radiation calibration, and BRDF correction. The overall data processing flow is shown in Figure 4 and described in detail in each section.

3.2.1. TOA Reflectance Calculations and Orthographic Correction

The process of generating surface reflectance requires the completion of the radiometric calibration of the GF-1WFV image, which is the calculation of the image from digital number values to radiance [40,41]. Once the radiance is obtained, the TOA can be calculated according to radiative transfer theory. The calibration factors and solar radiance were obtained from the GF-1 satellite parameters published by CRESDA. The GF-1 WFV level 1 data require orthographic correction so that the pixels can accurately represent the actual ground position. CRESDA distributes level 1 data with RPCs to facilitate complete user orthorectification according to the RPC model [42,43]. To improve the orthographic correction accuracy, this study adopted the Landsat-8 OLI B8 panchromatic band as the digital orthophoto reference, provided the required ground control points, and adopted a DEM with a 30 m spatial resolution as the elevation reference.

3.2.2. Cross-Radiation Calibrations and Atmospheric Correction

GF-1 has four sensors: WFV1, WFV2, WFV3, and WFV4. Despite the similar external conditions at the time of imaging, there are some differences in the sensor configurations that require cross-radiation calibrations normalized to the same standard. When all four sensors are imaged simultaneously, there is an overlapping area characterized by a minor variation in the geometric angle information and an almost uniform external environment [44,45]. In this study, we utilized this feature to determine the cross-radiation calibration coefficients by a linear regression of the image values in the overlapping areas of different sensors [46,47]. The cross-radiation calibration of the GF-1 data was based on the WFV2 sensor and corrected for the other sensors.
The second simulation of the satellite signal in the solar spectrum (6S) radiative transfer model was used to complete the atmospheric correction of the GF-1 WFV. The model is based on mathematical and physical theories and presents the solar radiation transfer process in the solar–earth–satellite system in a scientific and reasonable manner, with a clear physical meaning [22]. The necessary inputs for the atmospheric correction of the 6S model, such as aerosol data and satellite geometry, are available.
Aerosol data used MODIS aerosol types and AOD data (MCD19A2), and MODIS has transit times similar to GF-1; solar angle and observation angle data are incidental to GF-1 WFV. According to the radiative transfer equation of the 6S model, the TOA reflectance can be generally expressed as shown in Equation (1), under the usual assumption of a homogeneous Lambertian surface for the simulation of the feature:
ρ T O A ( θ s , θ i , ϕ ) = ρ a ( θ s , θ i , ϕ ) + ρ B O A 1 - ρ B O A S T ( θ s ) T ( θ i )
where, θ s , θ i , ϕ are the solar zenith angle, the observation zenith angle, and the solar azimuth relative to the sensor; ρ a is the course radiation due to Rayleigh scattering and aerosol scattering; ρ B O A is the surface reflectance; S is the atmospheric spherical reflectance; T ( θ s ) is the total atmospheric transmittance from the sun to the feature; and T ( θ i ) is the total atmospheric transmittance from the feature to the satellite.

3.2.3. BRDF Calibration

The reflection of incident solar radiation from the Earth’s surface is isotropic, while the GF-1 WFV single-scene image has a width of up to 200 km and a satellite zenith angle of up to approximately 40°, with a difference of up to 20° in the satellite zenith angle [1]. Together with variations in the solar zenith angle and relative azimuth, this can lead to large differences in the reflectance of the same feature in multi-scene images acquired at adjacent times.
The MCD43A1 product provides the weighting parameters ( f i s o , f v o l , f g e o ) associated with the BRDF model for each band. The bi-directional reflectivity of any illumination angle of incidence and observation angle can be derived from the extrapolation or interpolation of the kernel-driven model, as shown in Equation (2). The volume scattering kernel chosen for this study is the Ross thick kernel, and the geometrical optical scattering kernel is the Li sparse reciprocal kernel [48,49,50].
R ( θ s , θ i , ϕ ; γ ) = f i s o ( γ ) + f v o l ( γ ) × k v o l ( θ s , θ i , ϕ ) + f g e o ( γ ) × k g e o ( θ s , θ i , ϕ )
R is the reflectance at solar zenith angle θ s , observed zenith angle θ i , and relative azimuth angle ϕ ; k v o l is the volume scattering kernel, and k g e o is the geometrical optics kernel, which are functions of incidence and observation angles; f i s o , f v o l , and f g e o are constants representing the ratio of the isotropic, volume scattering, and geometrical optics components of reflectance, respectively.
The processing method is to first generate an a priori BRDF model library for the study area for one year based on the MCD43A1 data. Based on the kernel-driven model, the simulated reflectance R with the same observation geometry as the actual reflectance R , and the zenith-direction simulated reflectance R n are calculated using forward simulation with a priori BRDF knowledge. Based on the relationship between R , R and R n , the zenith-direction reflectance R n is calculated.
R n = R / R × R n
This completes the preprocessing of the GF-1 WFV data to obtain the WFV surface reflectance in the near-zenith direction.

3.3. Evaluation of GF-1 WFV Surface Reflectance

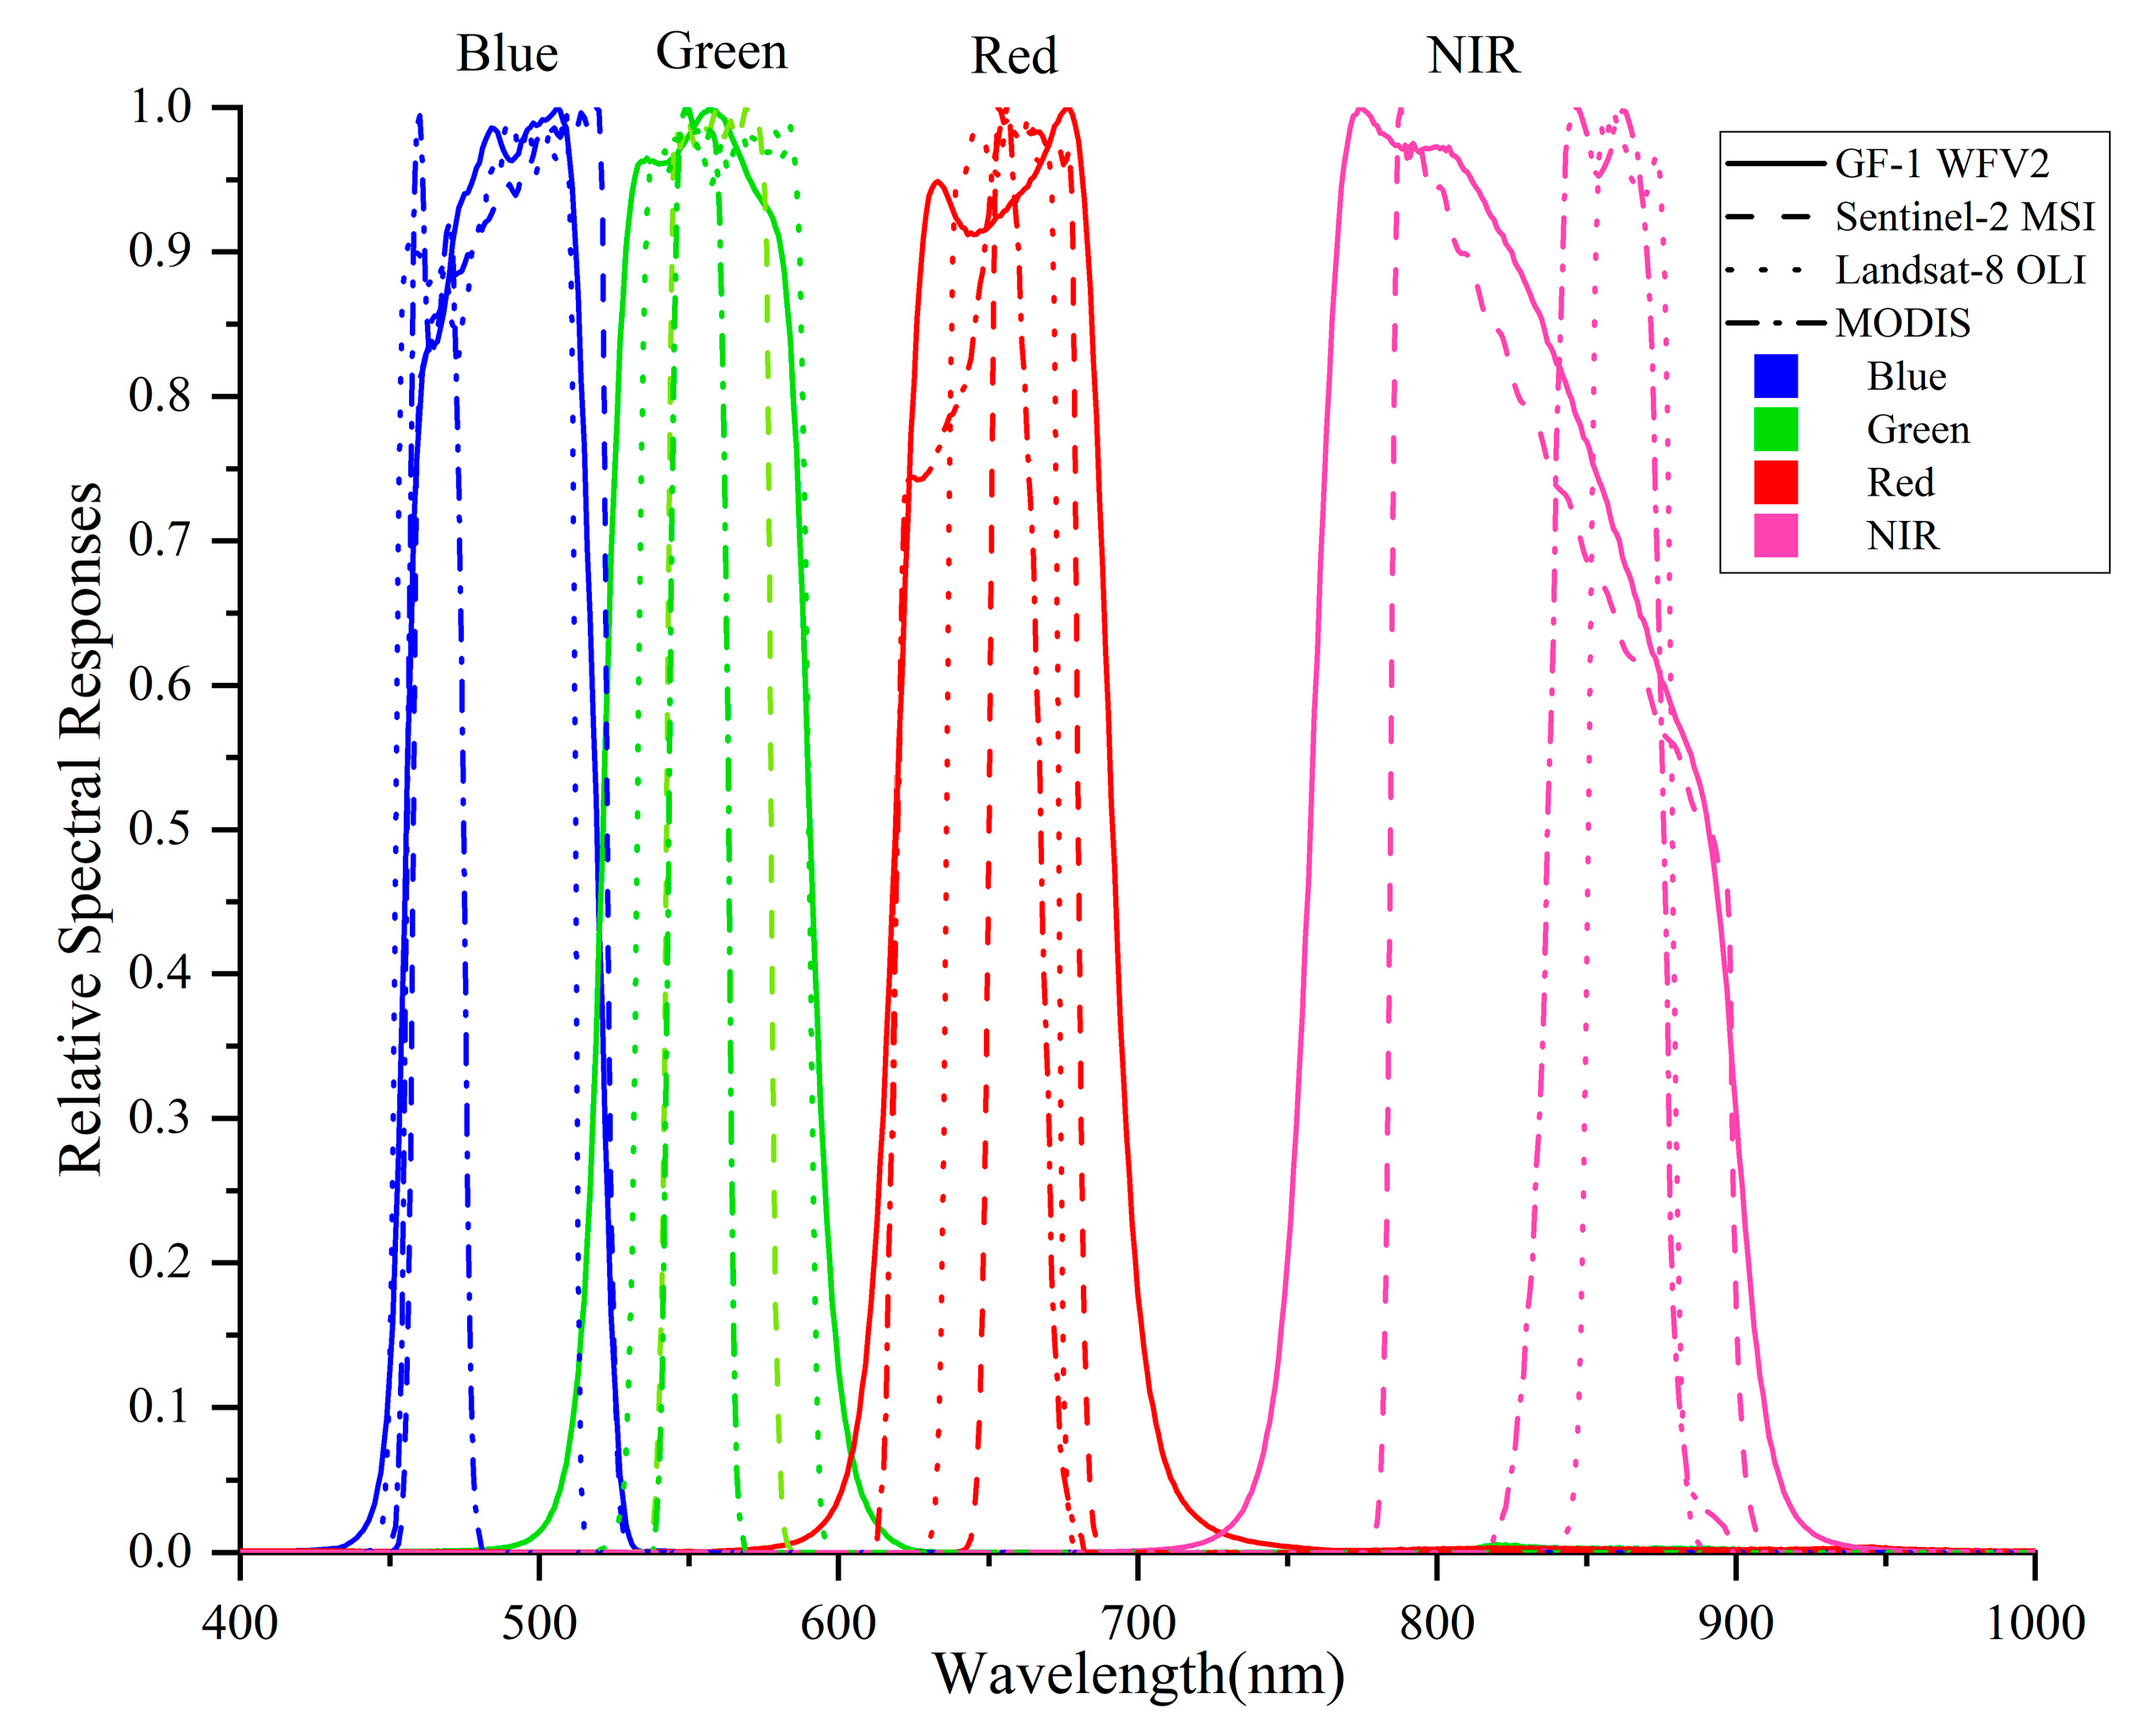
3.3.1. Selection Criteria for Sentinel-2 MSI, Landsat-8 OLI and MODIS Data

In this study, MSI, OLI, and MODIS surface reflectances were selected to evaluate the quality of the WFV surface reflectance obtained from the processing described above. The criterion for selecting MSI and OLI surface reflectance is that the image with the lowest amount of clouds is preferred with imaging dates no more than seven days before or after WFV surface reflectance; if no suitable image was available within seven days before or after, the search was extended to find an image with the most similar imaging time. The MODIS surface reflectance product is an average product generated every 16 d; therefore, it was selected for the same day as the WFV surface reflectance. For the processing of different spatial resolutions, the upsampling method was selected, that is, in the WFV comparison with MSI, the MSI was aggregated to 16 m to be consistent with WFV; in the WFV comparison with OLI, the WFV was aggregated to 30 m for consistency with OLI; in the WFV comparison with MODIS, the WFV was aggregated to 500 m to be consistent with MODIS, and the resampling methods were all selected for bilinear interpolation. The effect of clouds and cloud shadows in the images was removed, and reflectance values less than 0 and greater than 0.95 were considered outliers.

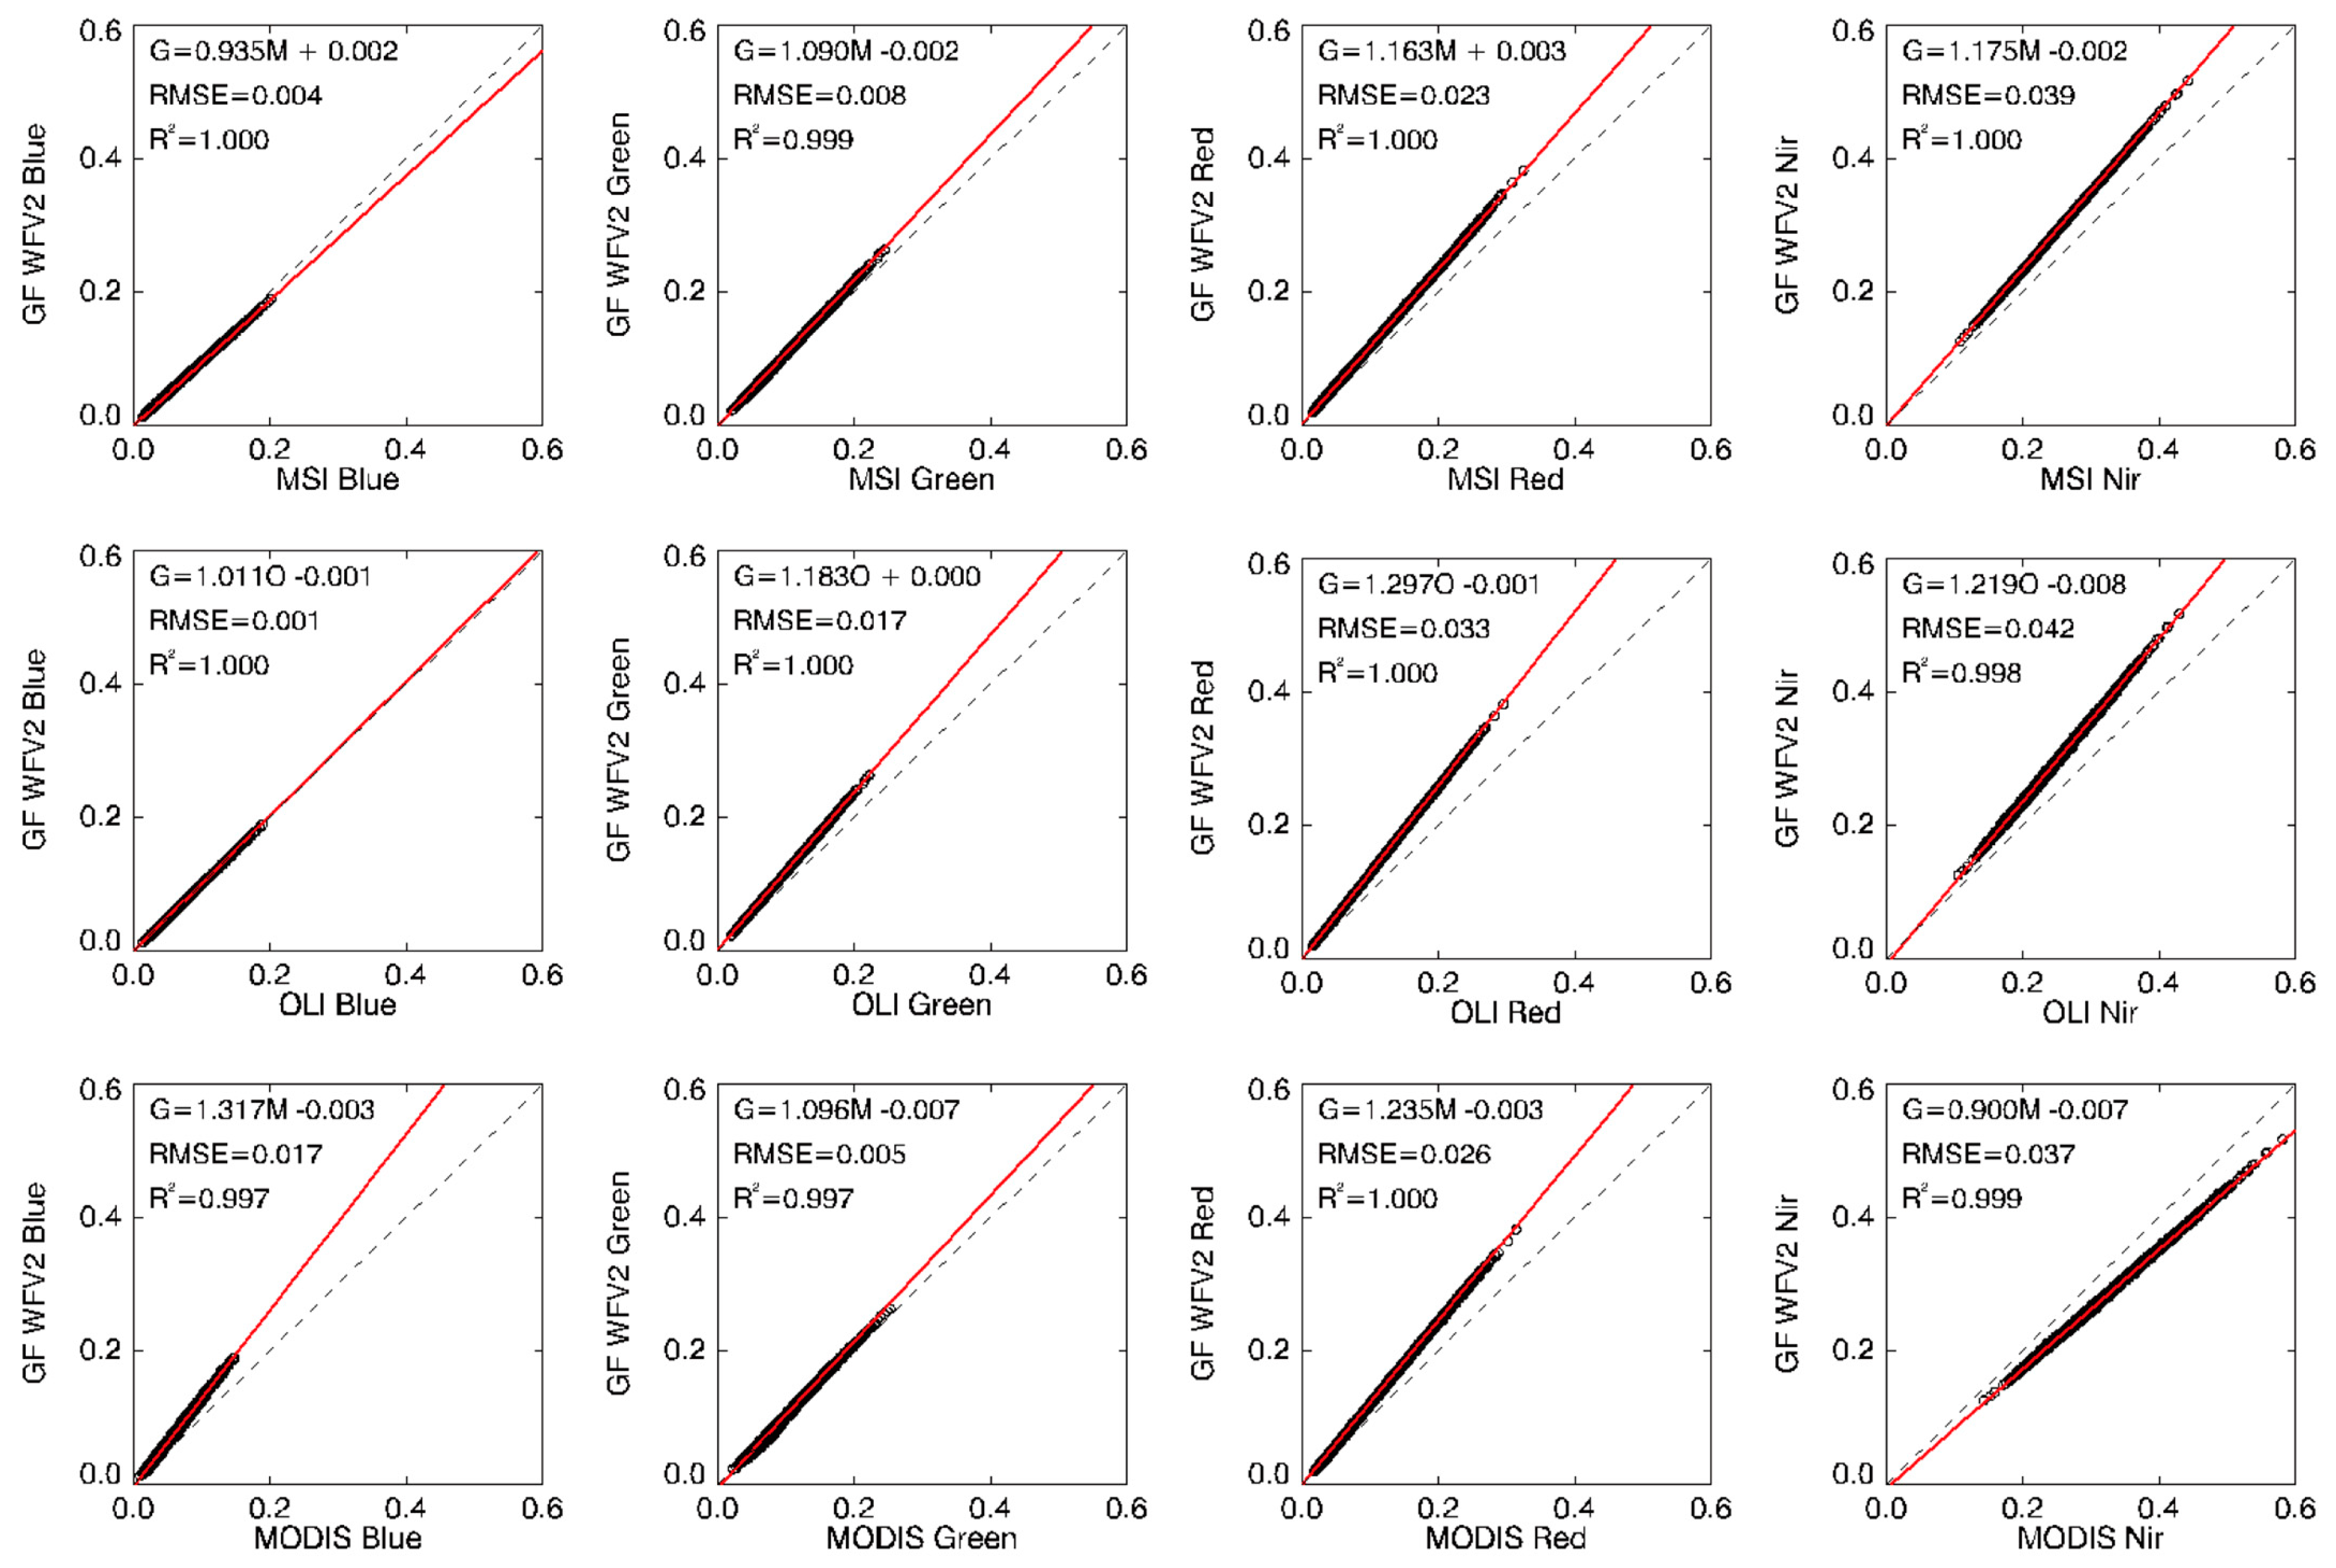
3.3.2. Spectral Adjustment

The waveband settings for each sensor are shown in Figure 5, which shows that there is still a difference in the visible-NIR band width between the WFV and the MSI, OLI, and MODIS sensors, which is the major reason for the difference in the surface reflectance. Spectral adjustment of MSI, OLI, and MODIS surface reflectance is required to reduce surface reflectance differences due to changes in sensors and ensure that the accuracy check reflects the true variance between sensors [51,52].
The following steps were adopted for specific spectral adjustment: first, the simulated reflectance of the features in the spectral library was calculated based on the spectral response functions of different sensors; second, the simulated reflectance of all features under different relative spectral responses was linearly regressed to establish the band conversion factor. The spectral adjustment factors are shown in Figure 6. The hyperspectral feature library used in this study contained surface reflectance spectral samples with 5637 features [53]. As mentioned earlier, the four WFV sensors were cross-calibrated with the WFV2 standard. Therefore, band conversion was performed using the coefficients corresponding to the relative spectral response of WFV2. In addition, the difference between the Terra and Aqua MODIS sensors and the difference between sensors A and B of Sentinel-2 was evaluated.

3.3.3. Comparison Metrics

To assess the quality of the WFV surface reflectance, three statistical indicators–bias, precision, and root mean square error (RMSE)–were applied to quantify the deviation of the WFV surface reflectance from the MSI, OLI, and MODIS reference data. The bias, precision, and RMSE values represent the variance between the comparison datasets, with lower values representing better matches, where bias corresponds to the average deviation between the two datasets, and precision corresponds to the change in the average deviation [27]. Bias, precision, and RMSE were calculated using the specific formulae shown in Equations (4)–(6):
b i a s = 1 n × i = 1 n ε i
p r e c i s i o n = 1 n 1 × i = 1 n ( ε i b i a s ) 2
R M S E = 1 n × i = 1 n ε i 2
where n is the number of valid samples used for the comparison and ε is the surface reflectance of the WFV minus the surface reflectance of the reference sensors.

4. Results

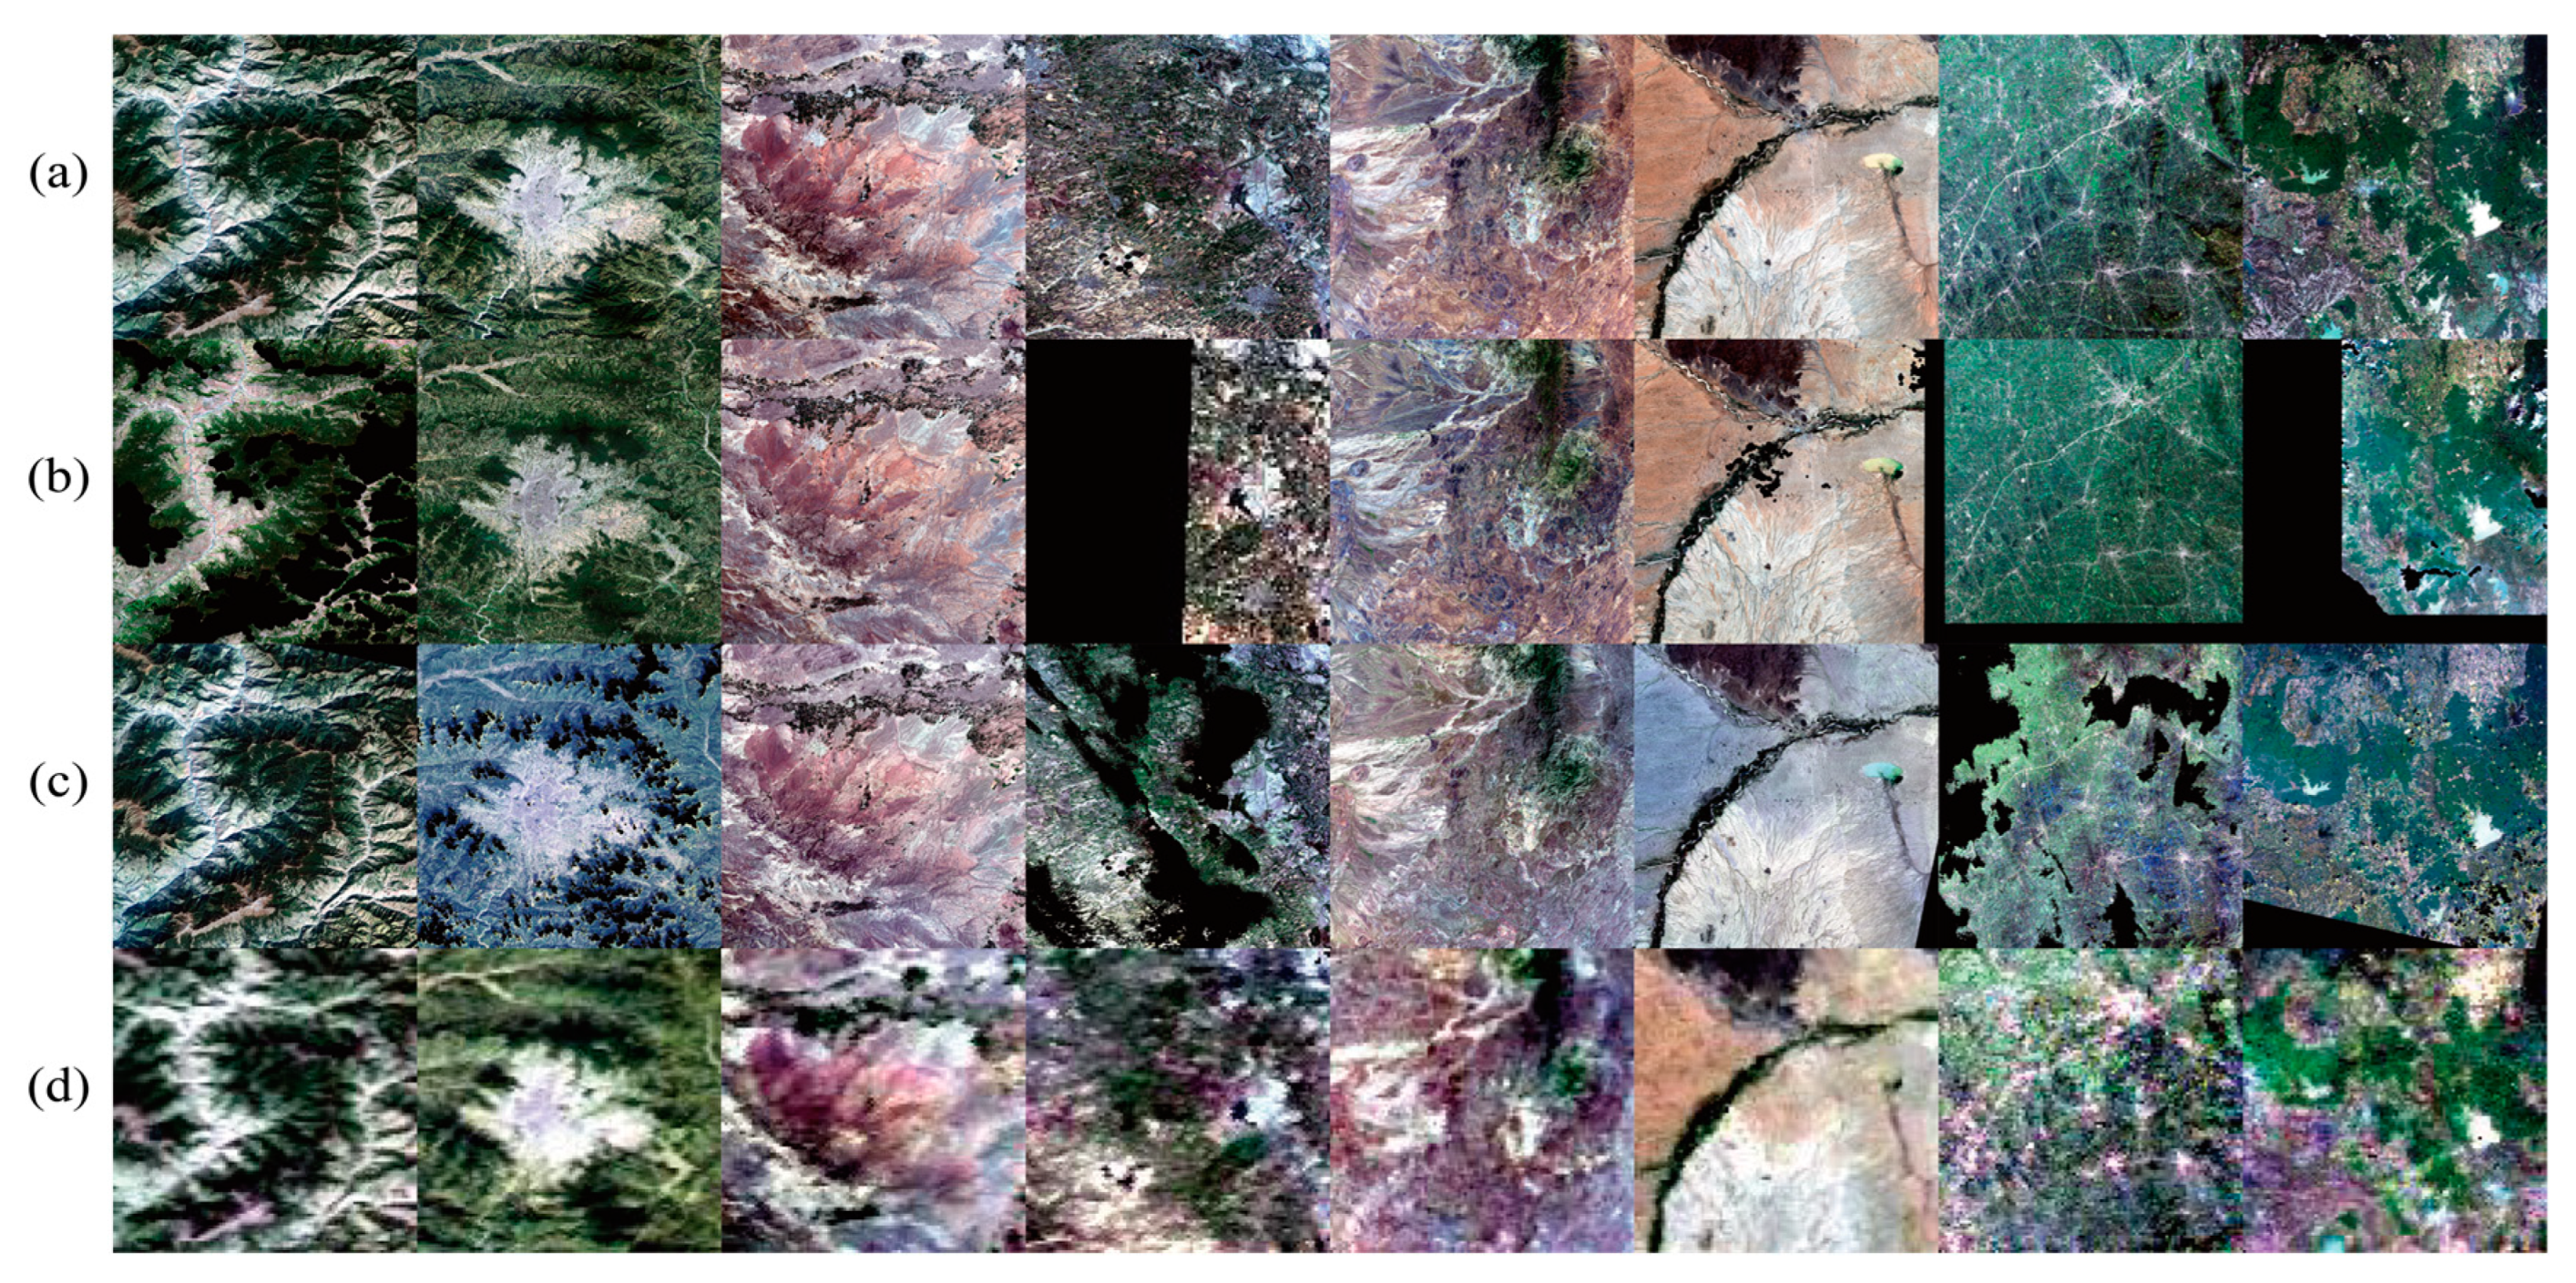
4.1. Satellite Image Selection Results

The WFV, MSI, OLI, and MODIS surface reflectance products used in this study are listed in Table 3. The image thumbnails are shown in Figure 7, all images are true color composite images. The absence of MSI and OLI images is due to the fact that the images are at the edges of the imaging trajectory or due to a cloud block effect.

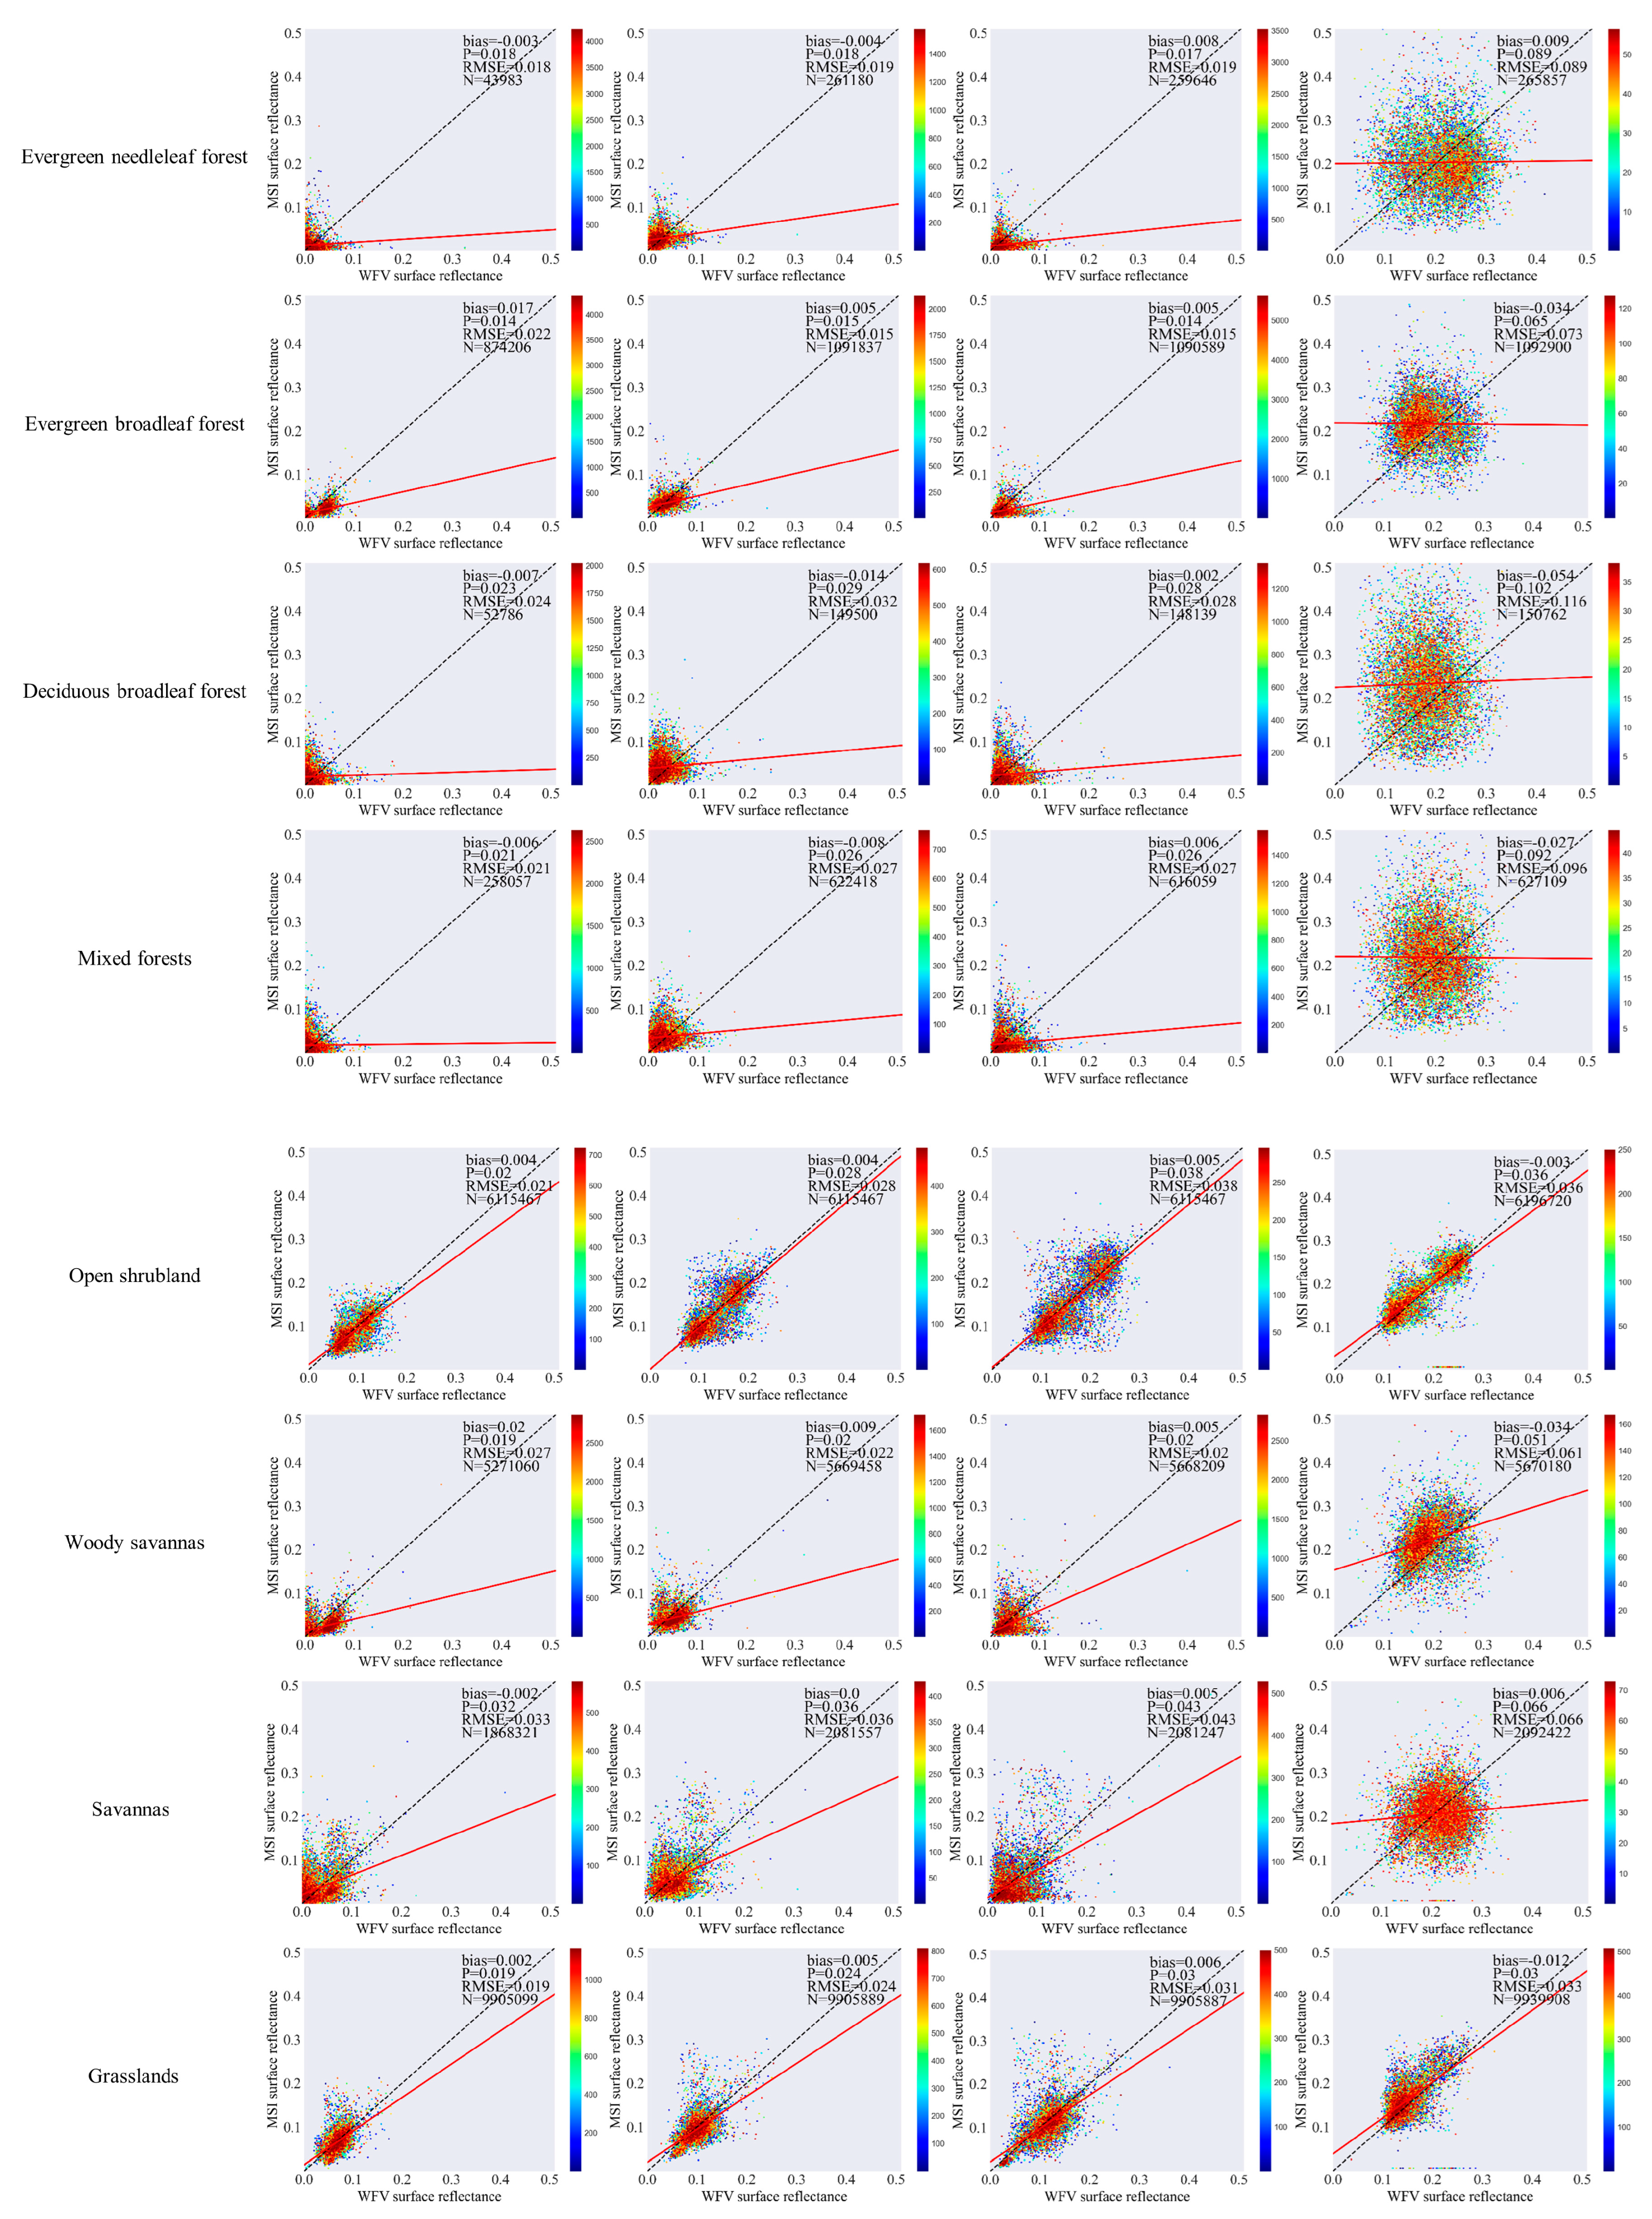
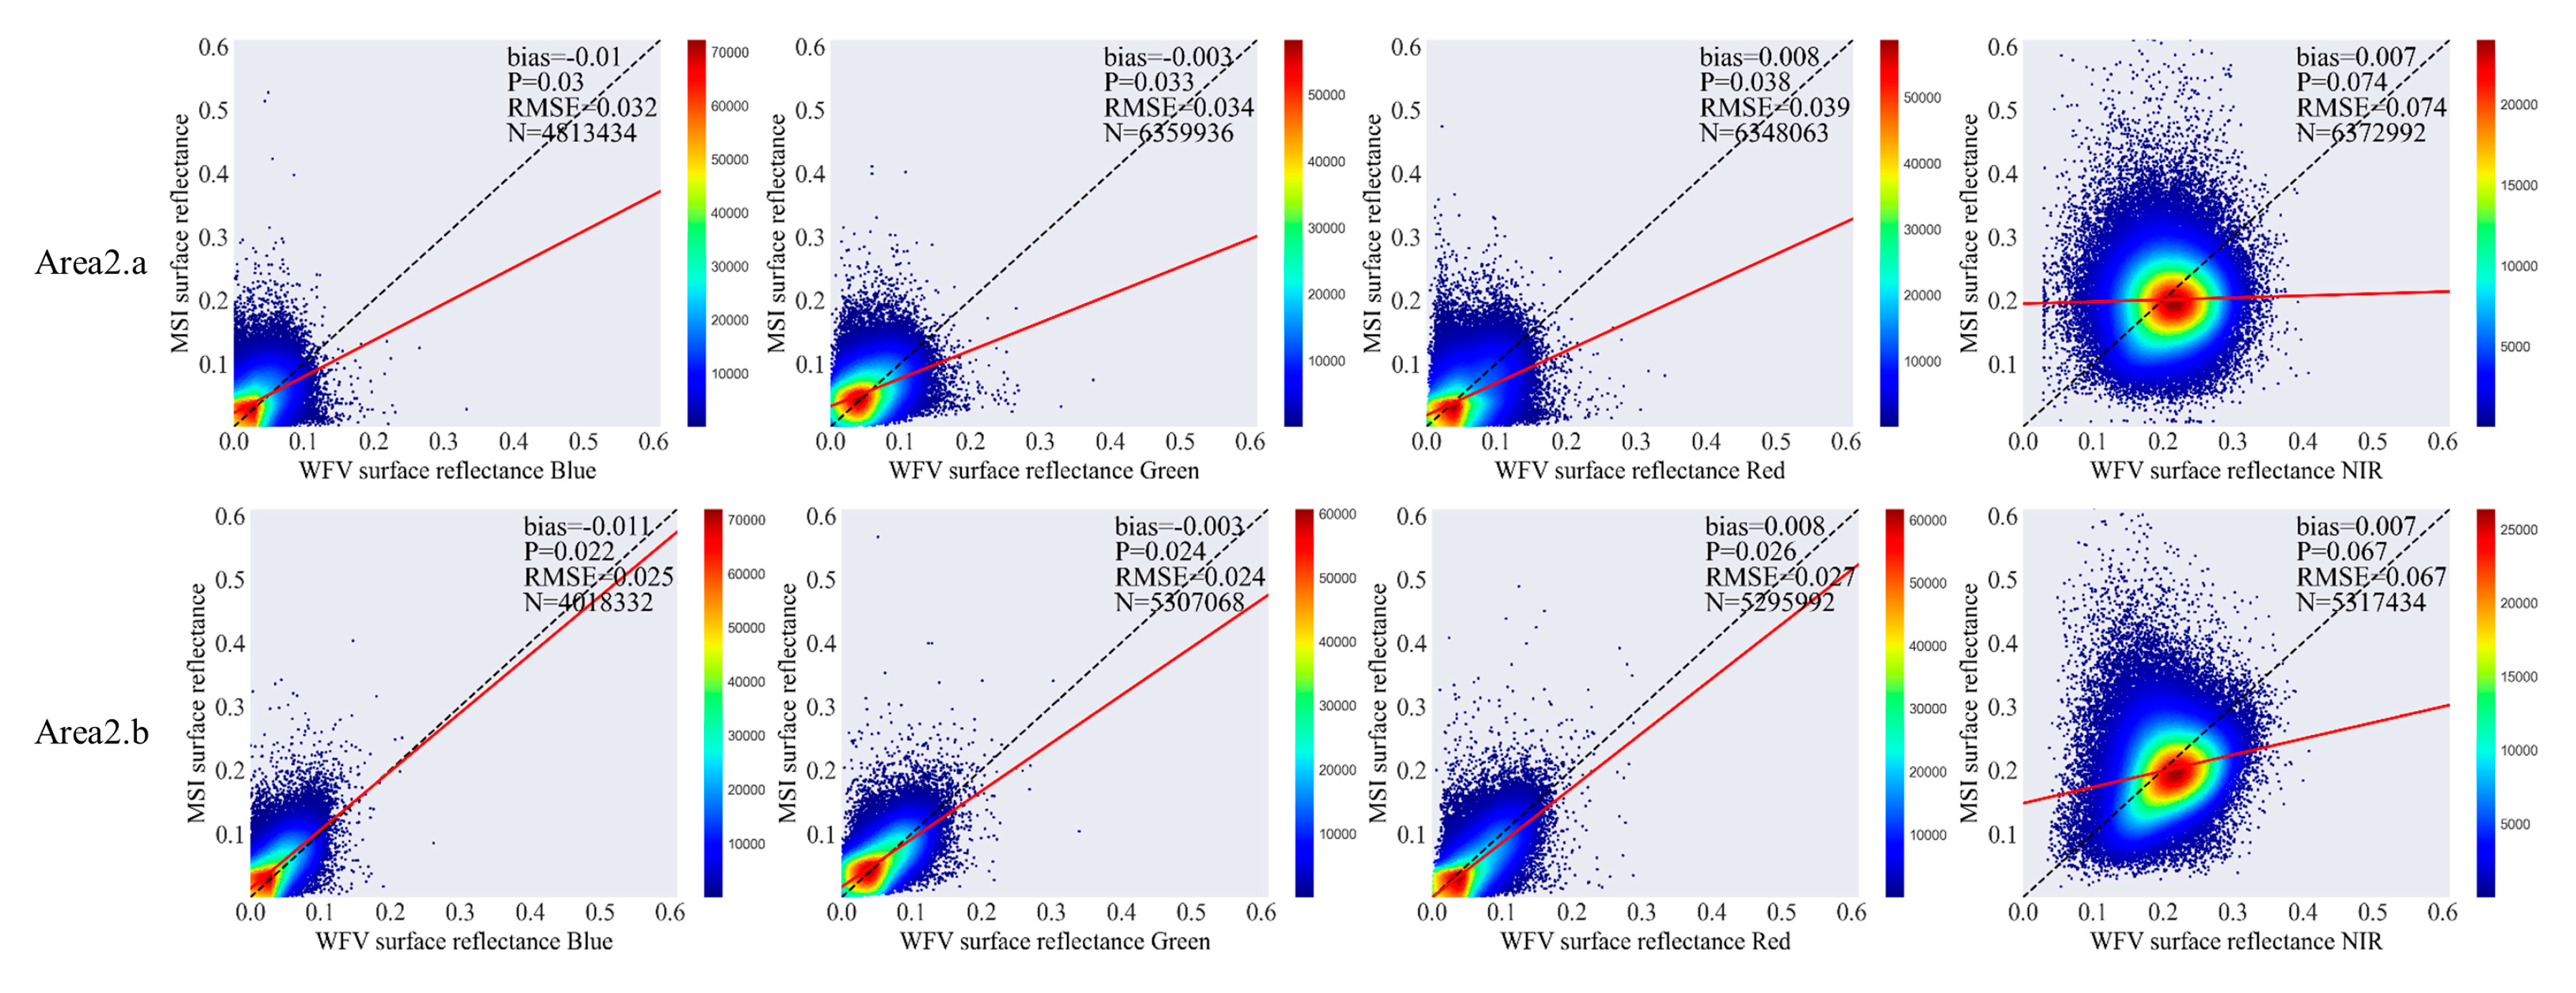
4.2. Evaluation Results of WFV and MSI Surface Reflectance

In this section, we calculated the statistical indicators for the MSI and WFV surface reflectance and analyzed the differences between the two images. Figure 8 shows the scatter plots of the MSI and WFV surface reflectance in each area, as well as the statistical indicator bias, precision, and RMSE. WFV and MSI comparisons were performed at a spatial resolution of 16 m, with spectral conversion, geometric matching, and the removal of cloud-affected and heavily missing Areas 1, 4, and 8 prior to comparison.
Among the various landcover types, MSI and WFV surface reflectance in the visible-NIR band bias was below 0.02, precision and RMSE were below 0.04, and the difference between the two images was not significant. In the NIR band, when the landcover type was forest, MSI surface reflectance was higher than WFV surface reflectance, with significant differences, and the statistical indicators were sharply higher.
The Area 3 landcover type was mainly grassland, Area 5 was dominated by sparse shrubs with some grassland, and Area 6 was bare ground with essentially no vegetation cover. In these three areas, the bias in the visible-NIR band was basically below 0.02, and precision and RMSE were below 0.03. The lower bias and RMSE values indicated that the absolute difference between the MSI and WFV surface reflectance in these areas was not significant. Lower precision indicates a more stable range in variation between the two datasets. A special case occurred in the red bands of Areas 3 and 6, where both precision and RMSE increased slightly to 0.03. This may have been due to the presence of distinctly demarcated landcover types in the two areas, which require more geometrical alignment and result in an increase in precision and RMSE, which describe the range of variation in pixel value deviation.
Area 2 is an urban built-up area with mostly impervious surfaces in the center and forests at the edges. Area 7 has a landcover type of forest grassland. The scatter plots of the two areas showed that the bias, precision, and RMSE of the MSI and WFV surface reflectance were significantly lower in the blue, green, and red bands than in the NIR band, whereas the statistical indicators in the NIR band appeared to increase sharply. The NIR scatter plot showed that a portion of the MSI surface reflectance was significantly higher than the WFV surface reflectance. Viewing the image pixels corresponding to the landcover type, the image pixels with deviations in Area 2 had a mixed forest landcover type, and the image pixels with deviations in Area 7 had a broad-leaf evergreen forest landcover type.

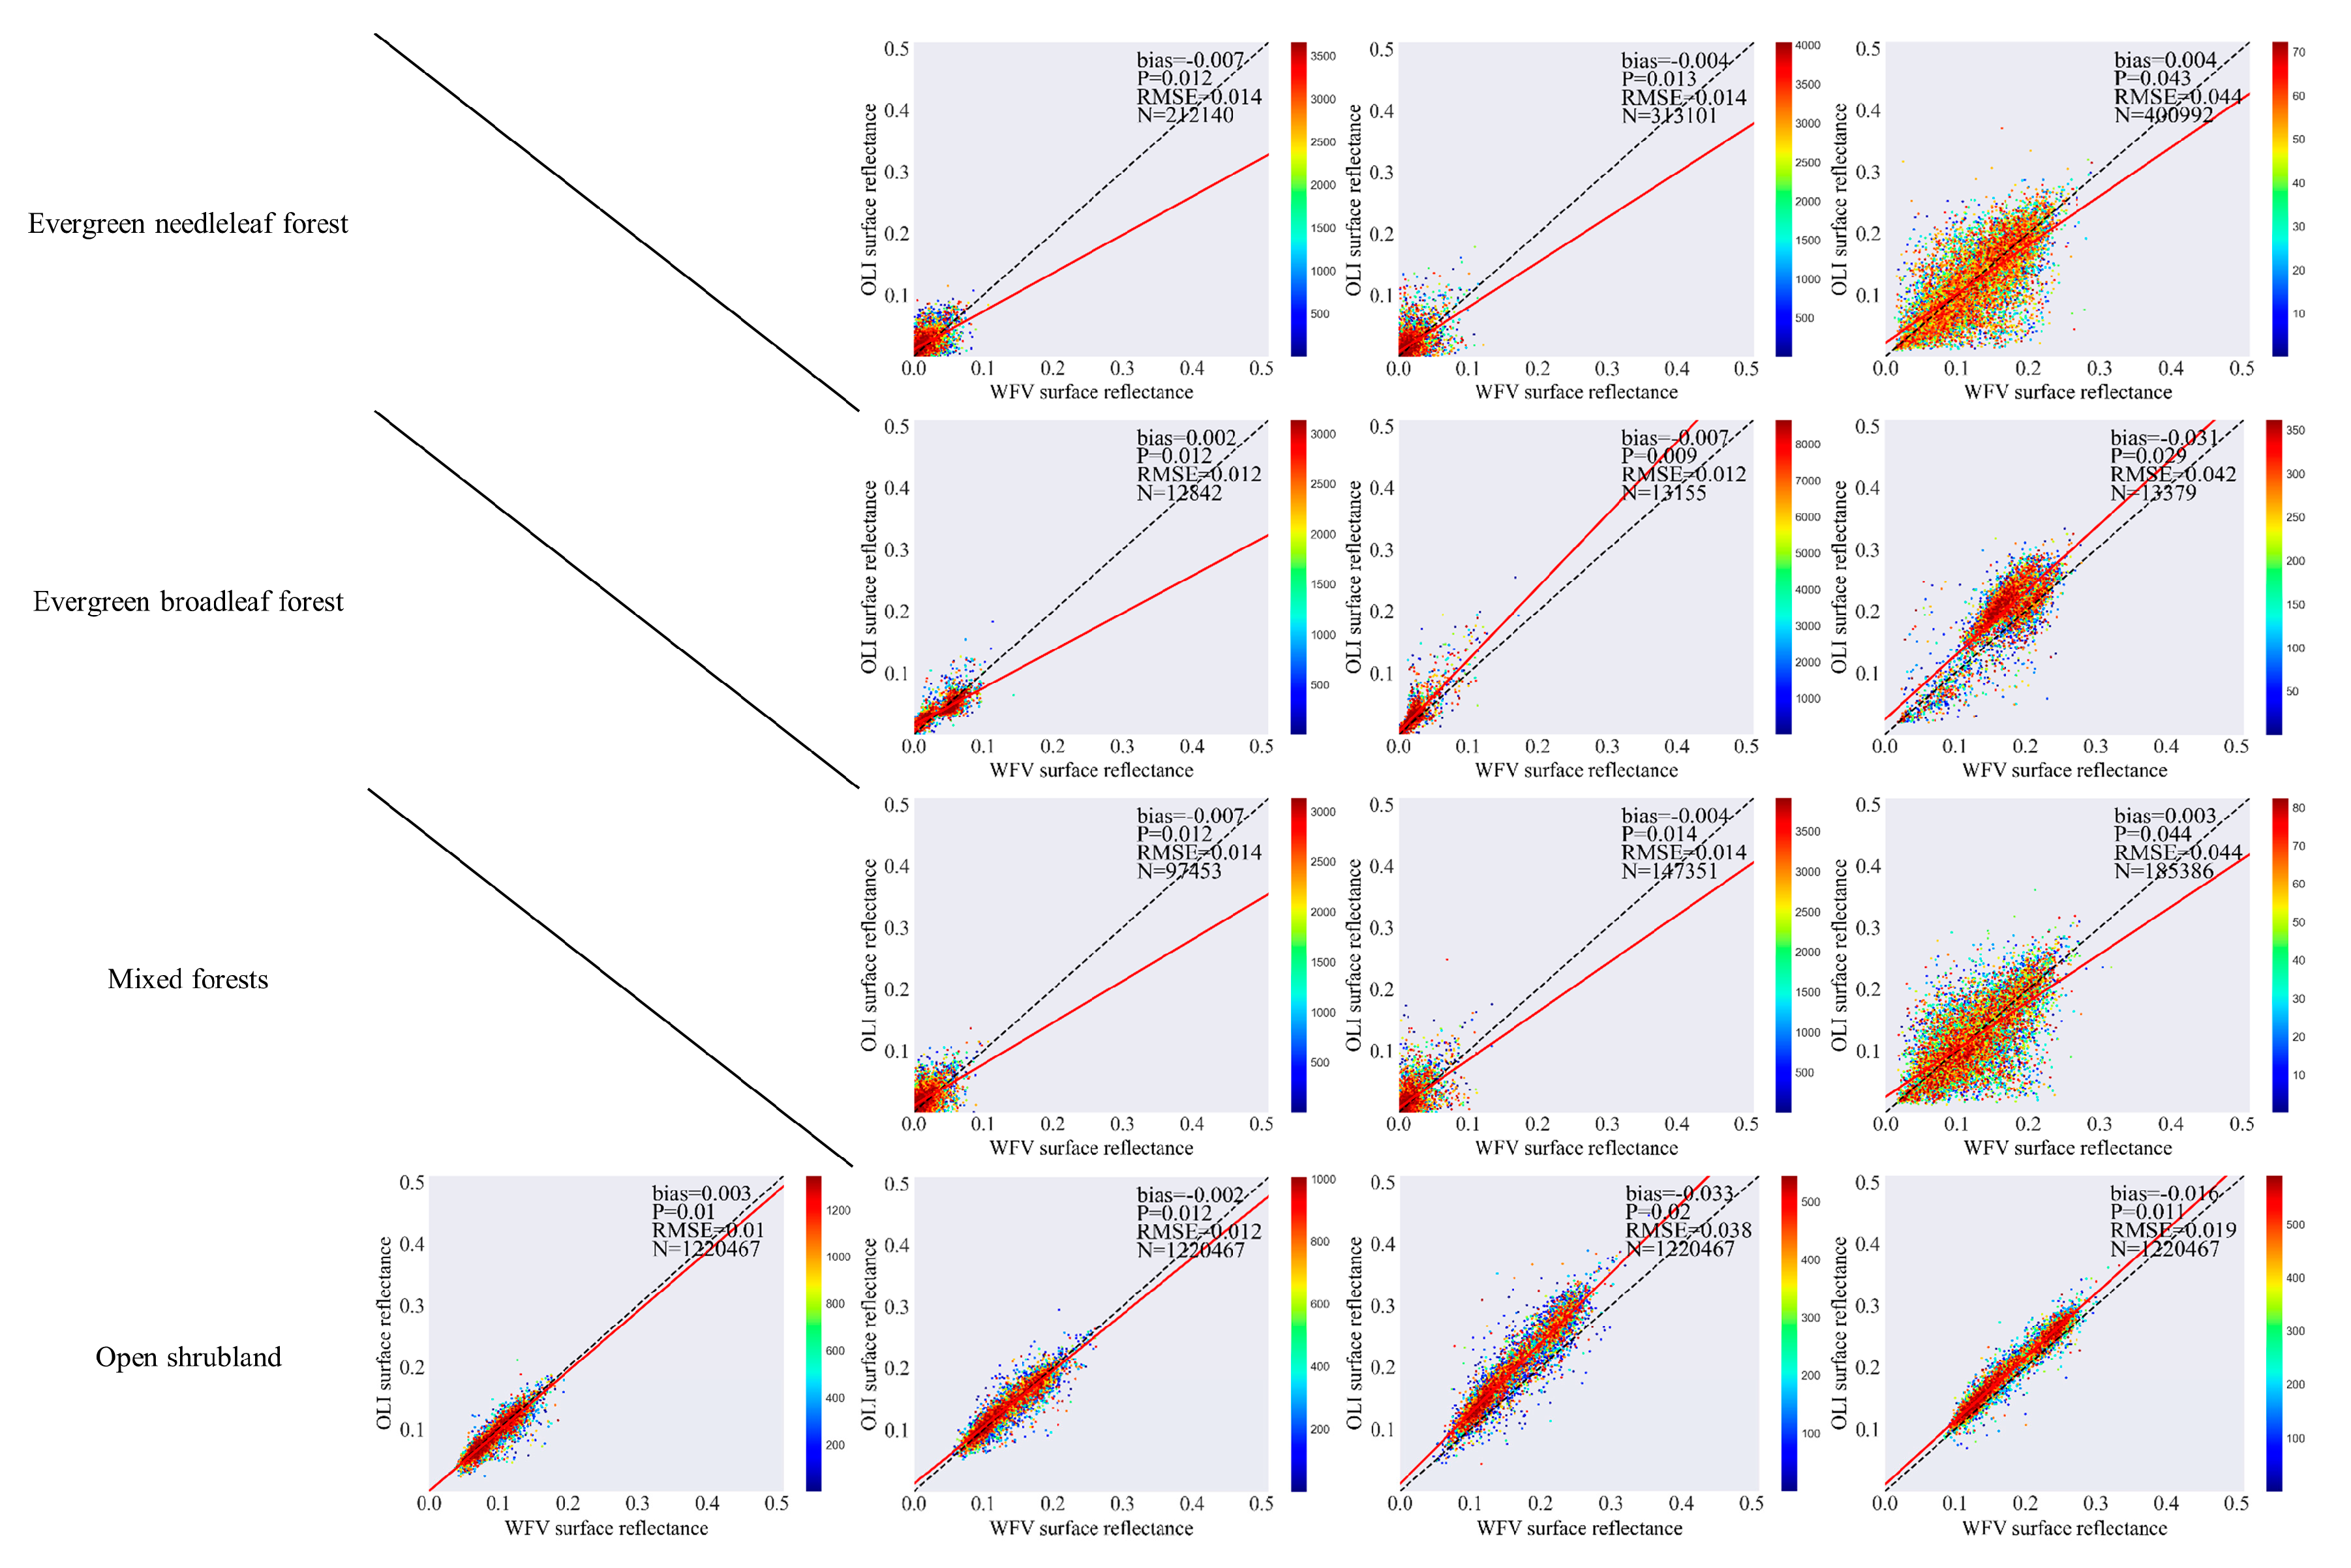
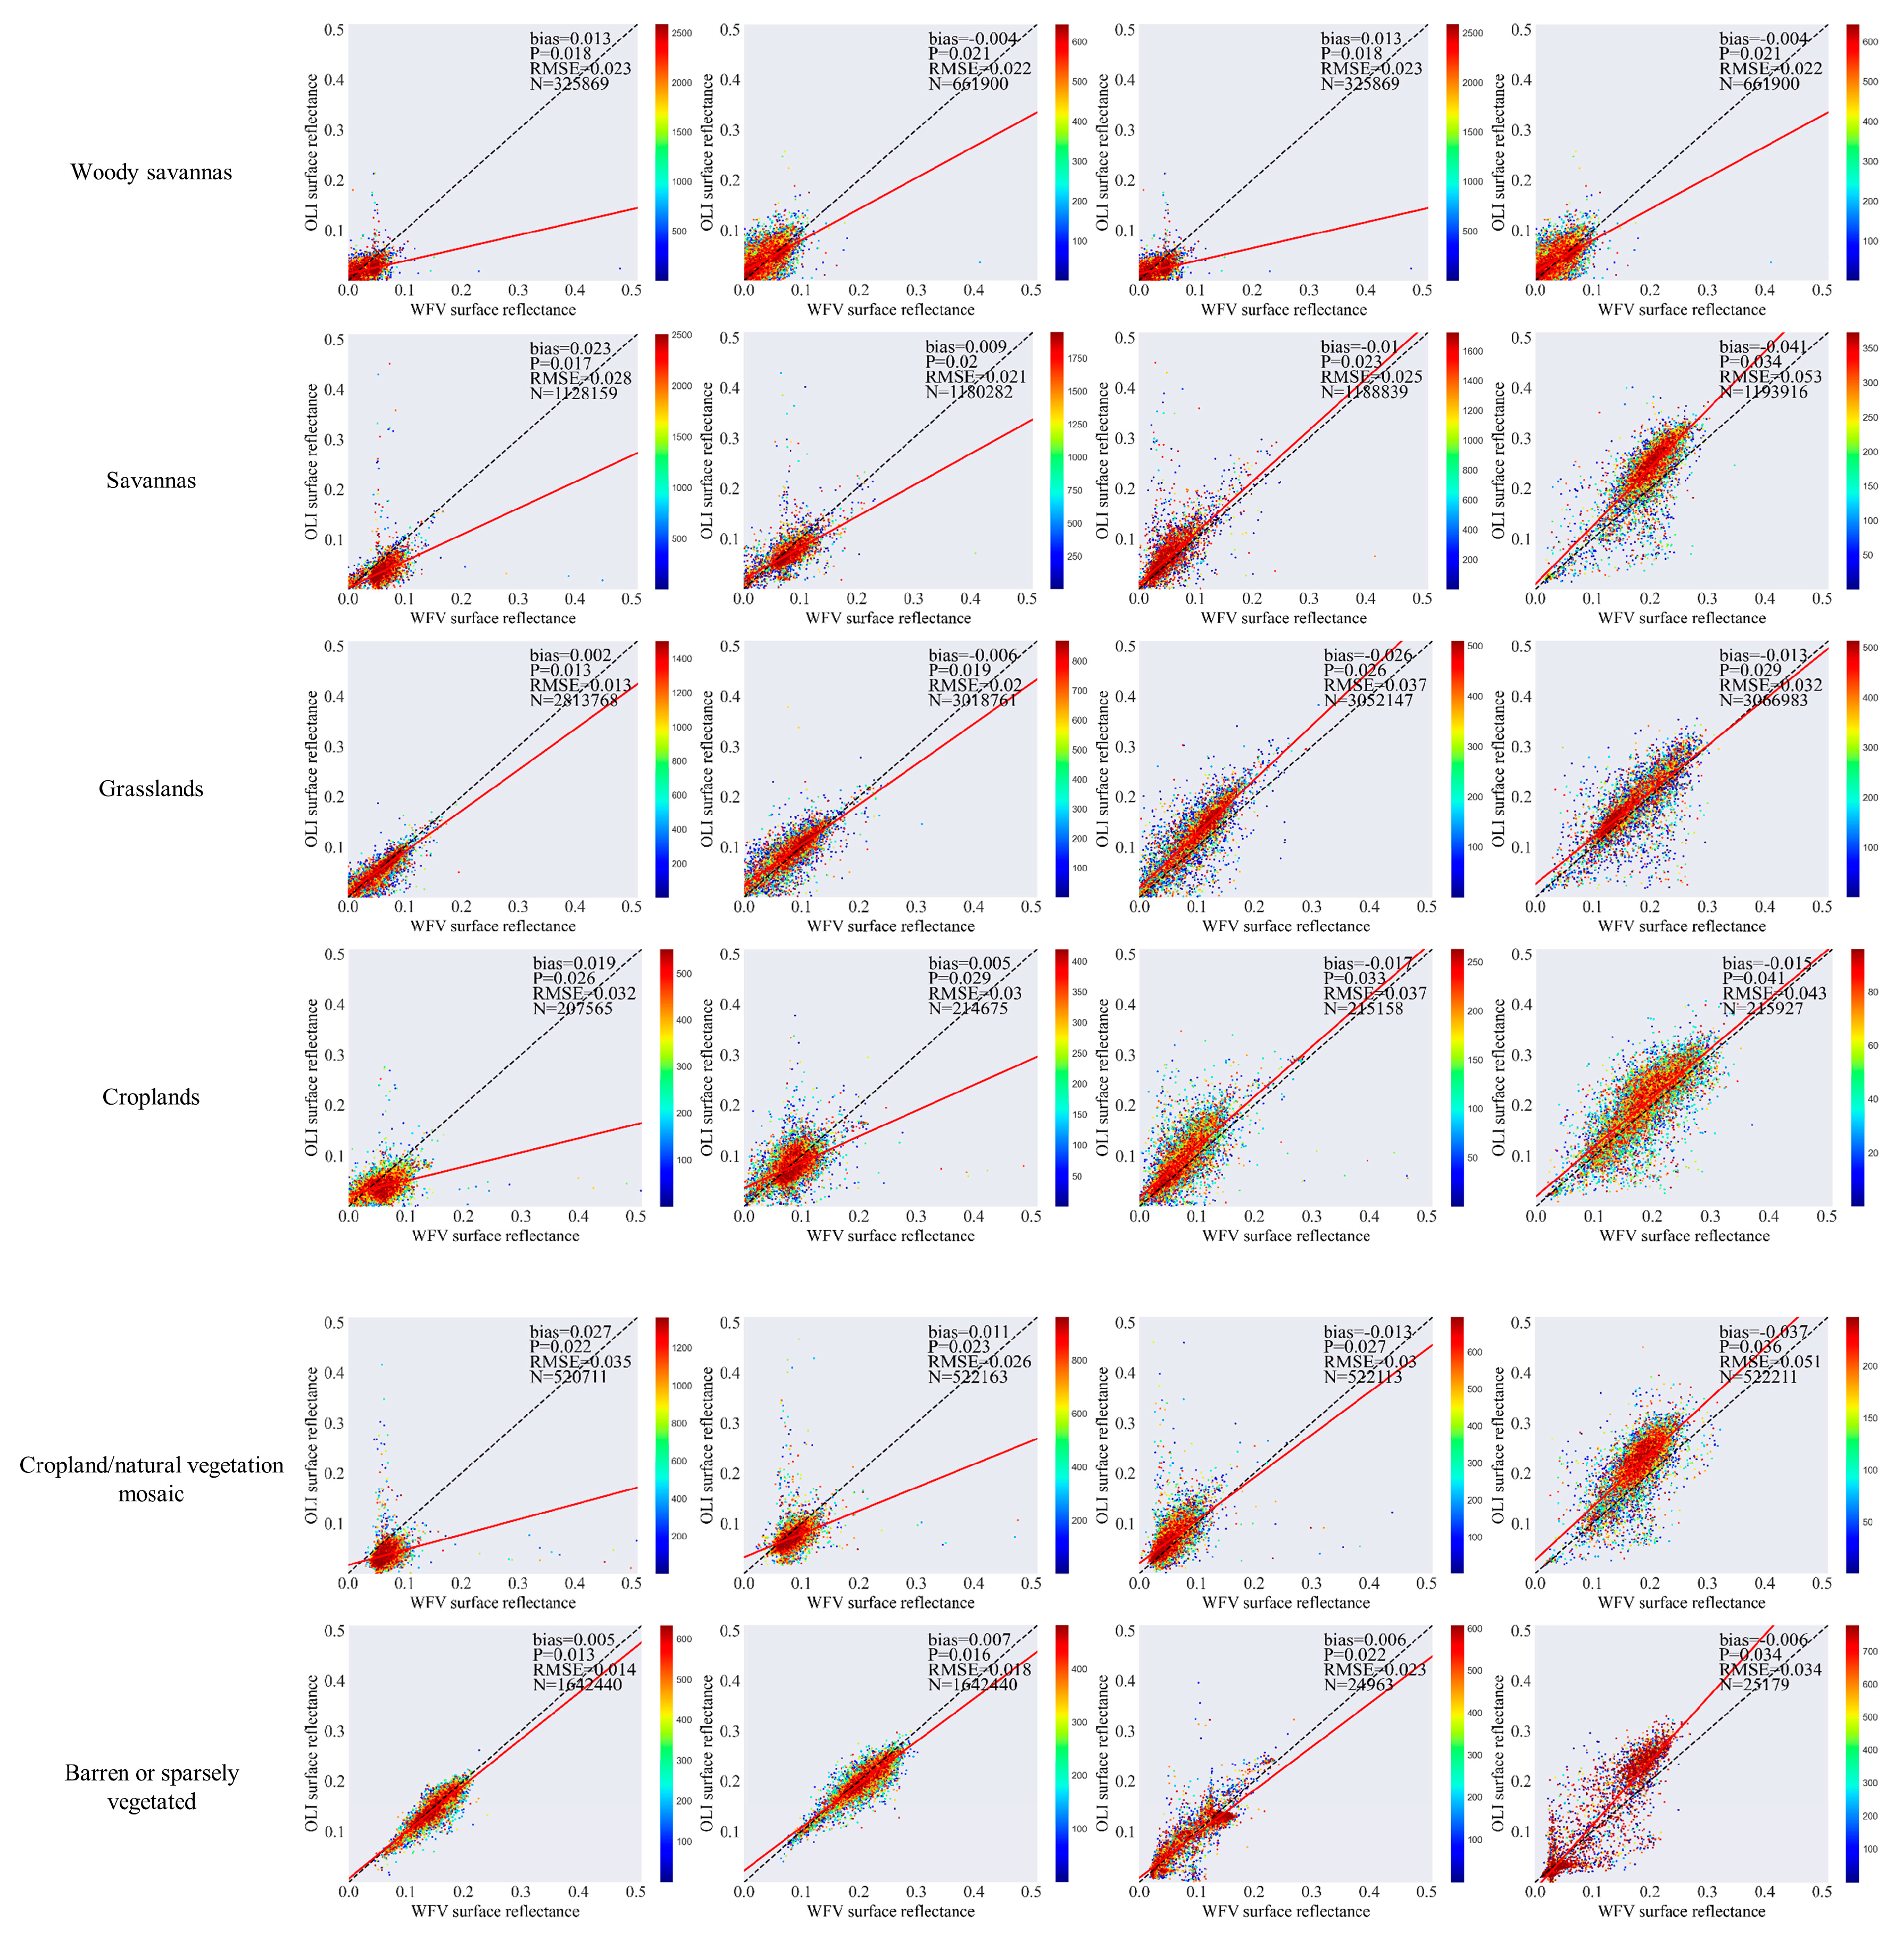
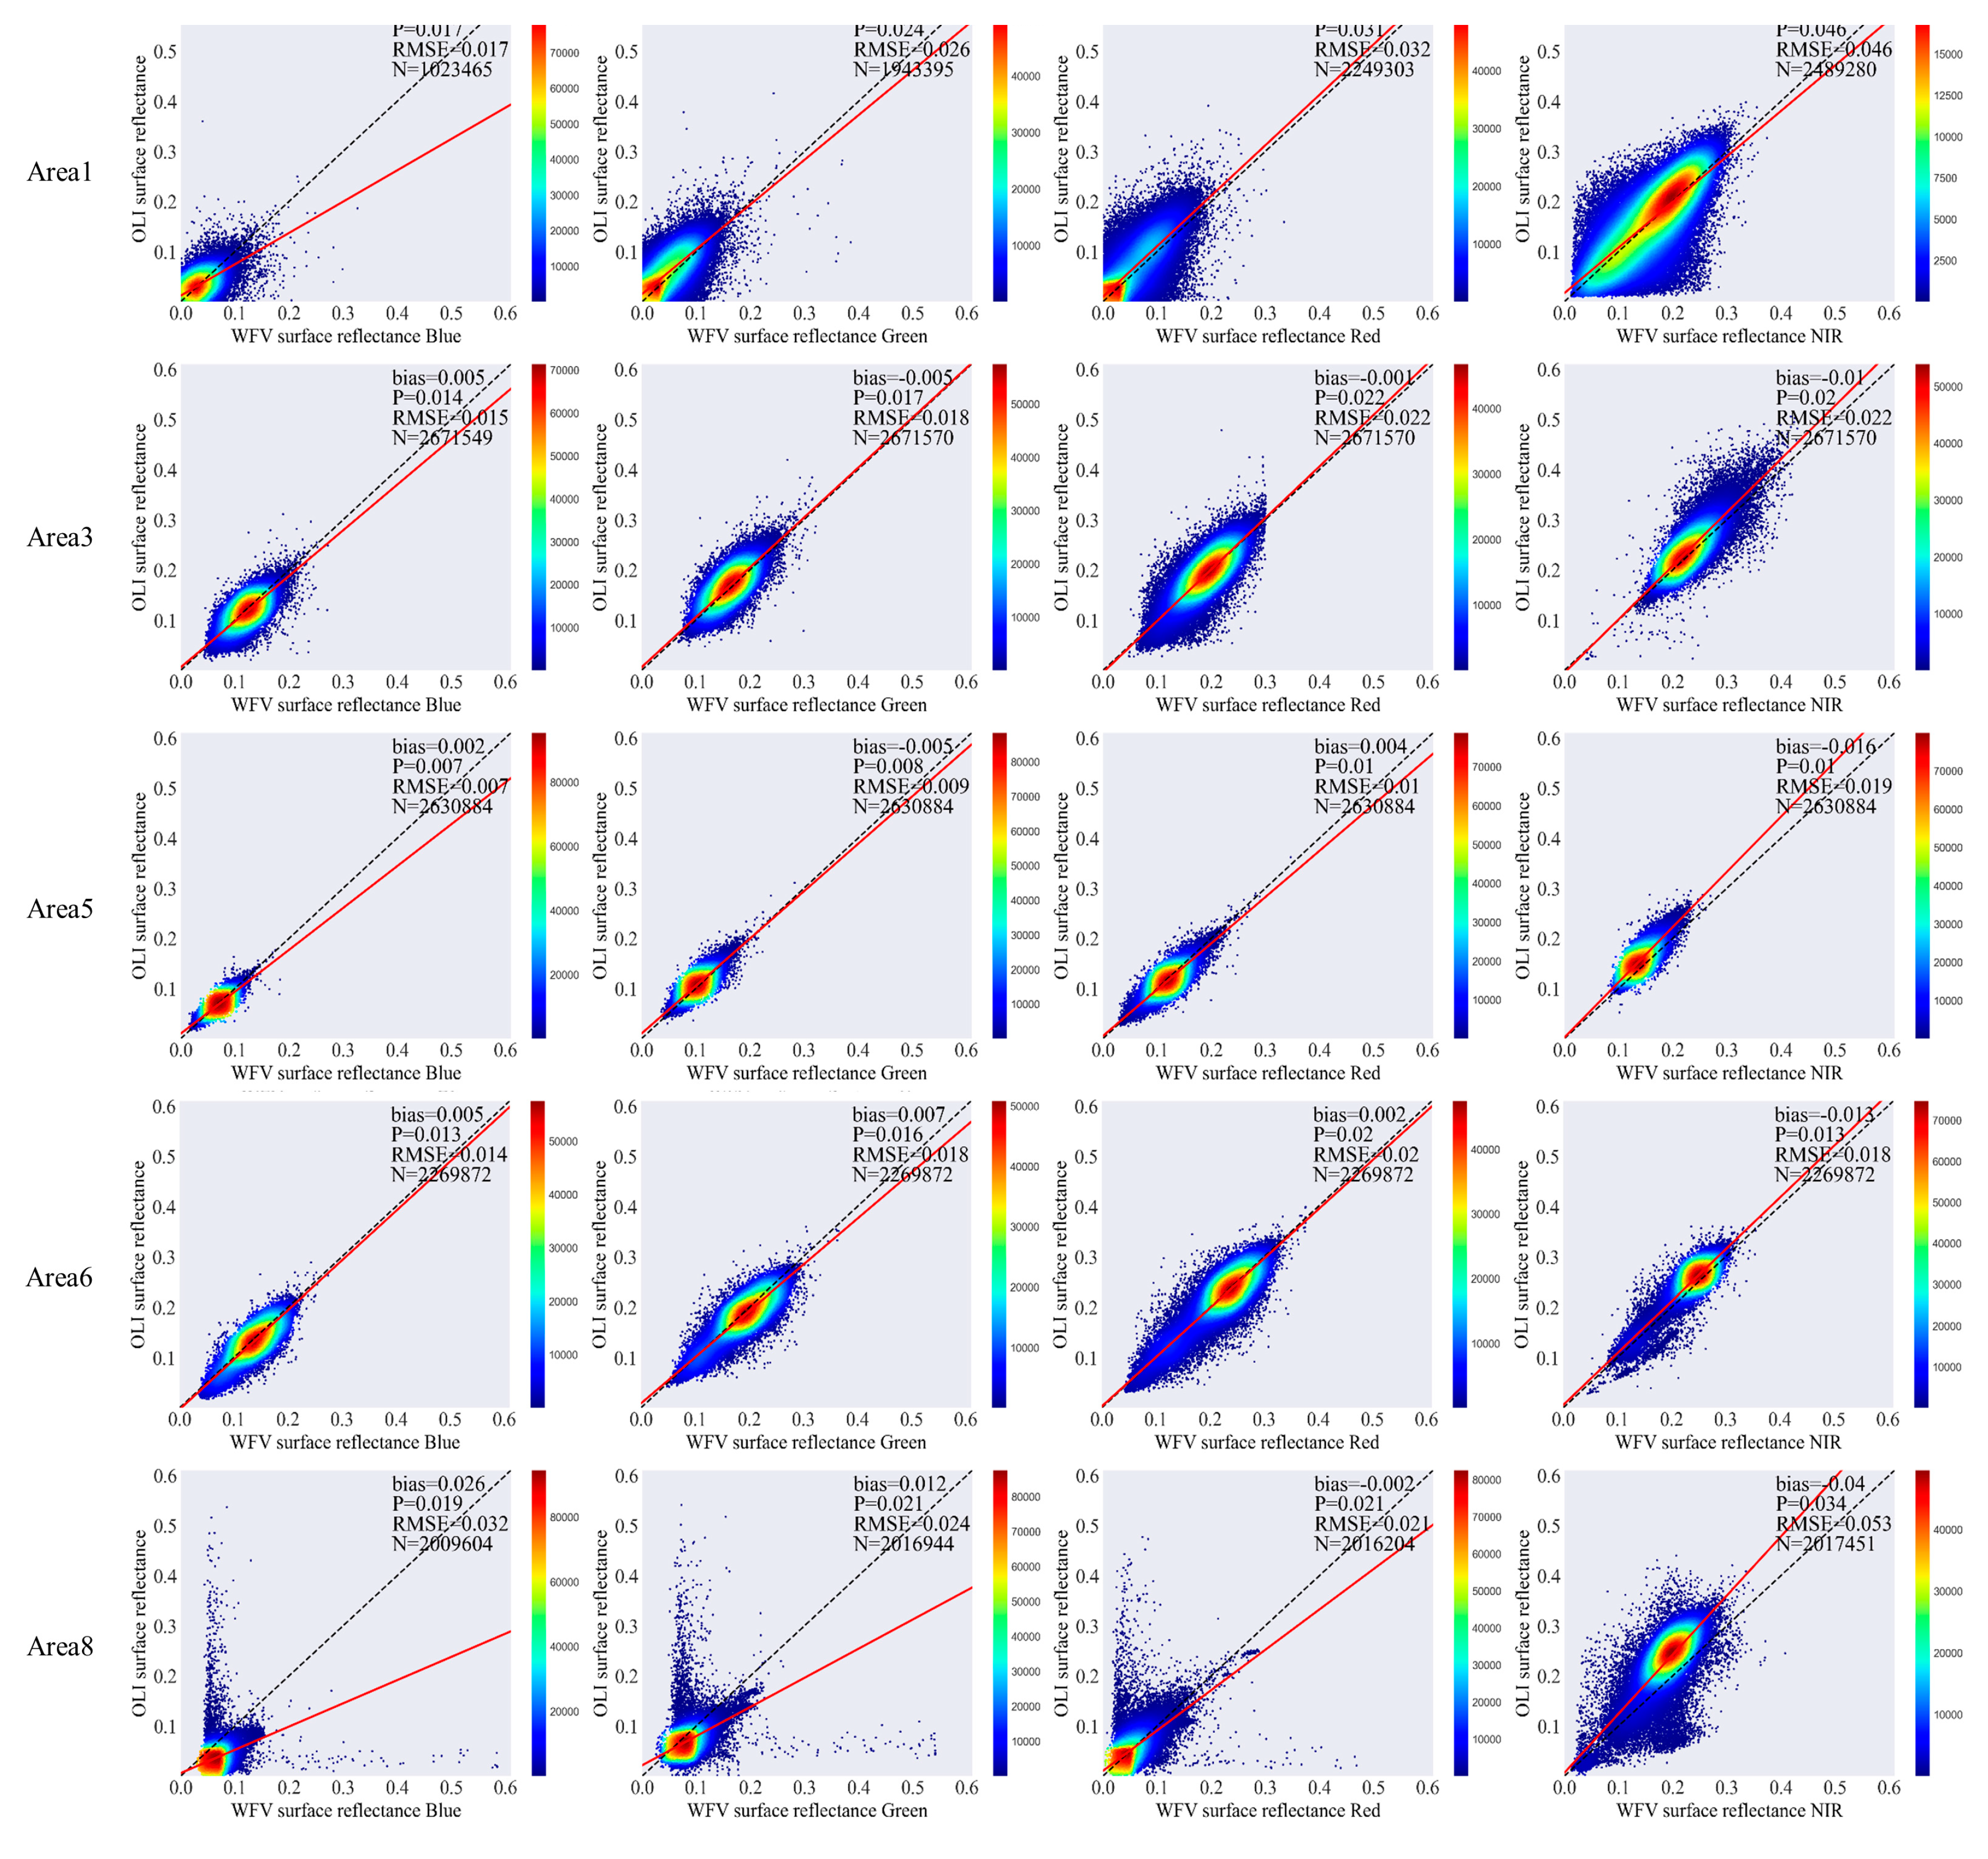
4.3. Evaluation Results of WFV and OLI Surface Reflectance

In this section, we calculated the statistical indicators for the OLI and WFV surface reflectance and analyze the differences between the two images. Figure 9 shows the scatter plots of the OLI and WFV surface reflectance in each area, as well as the statistical indicator bias, precision, and RMSE. WFV and OLI comparisons were performed at a spatial resolution of 30 m, with spectral conversion, geometric matching, and removal of cloud-affected and heavily missing Areas 2, 4, and 7, prior to the comparison.
The results showed that in most landcover types, the bias in the visible-NIR band of OLI and WFV surface reflectance was below 0.02, with precision and RMSE below 0.03. When the landcover type was forest and water, the NIR band image pixel values of OLI surface reflectance were higher than those of WFV surface reflectance, and the statistical indicators were significantly higher.
The Area 3, Area 5, and Area 6 surface cover types were mainly grassland, sparse shrubs with some grassland, and bare ground with essentially no vegetation cover, respectively. In these three areas, the bias in the visible-NIR band was below 0.02, and the precision and RMSE were below 0.025. The lower bias and RMSE values indicate that the absolute difference between the OLI and WFV surface reflectance in these areas was not significant. A lower precision indicates a more stable range of variation between the two.
The landcover types in Area 1 were grassland, mixed evergreen forest, and bare ground while Area 8 was a mixed area of savanna and agricultural land. Scatter plots in the visible band showed low statistical indicators in both areas, with bias below 0.02, precision and RMSE around 0.03, and no significant difference between the OLI and WFV surface reflectance. However, the scatter plots in the NIR bands of Areas 1 and 8 showed large differences in the OLI and WFV surface reflectance. The precision and RMSE were high for both areas, indicating a wide range of image values. In the Area 1 image, the pixels with large differences in NIR bands represented a landcover type of evergreen forest while in the Area 8 image, it indicated a landcover type of water and evergreen broad-leaf forest. For these landcover types, the WFV surface reflectance was significantly lower than the OLI surface reflectance. Anomalies with large deviations in the OLI surface reflectance could also be observed in the visible band scatter plot for Area 8. This region had cloud fringes in the image leading to elevated statistical indicators.

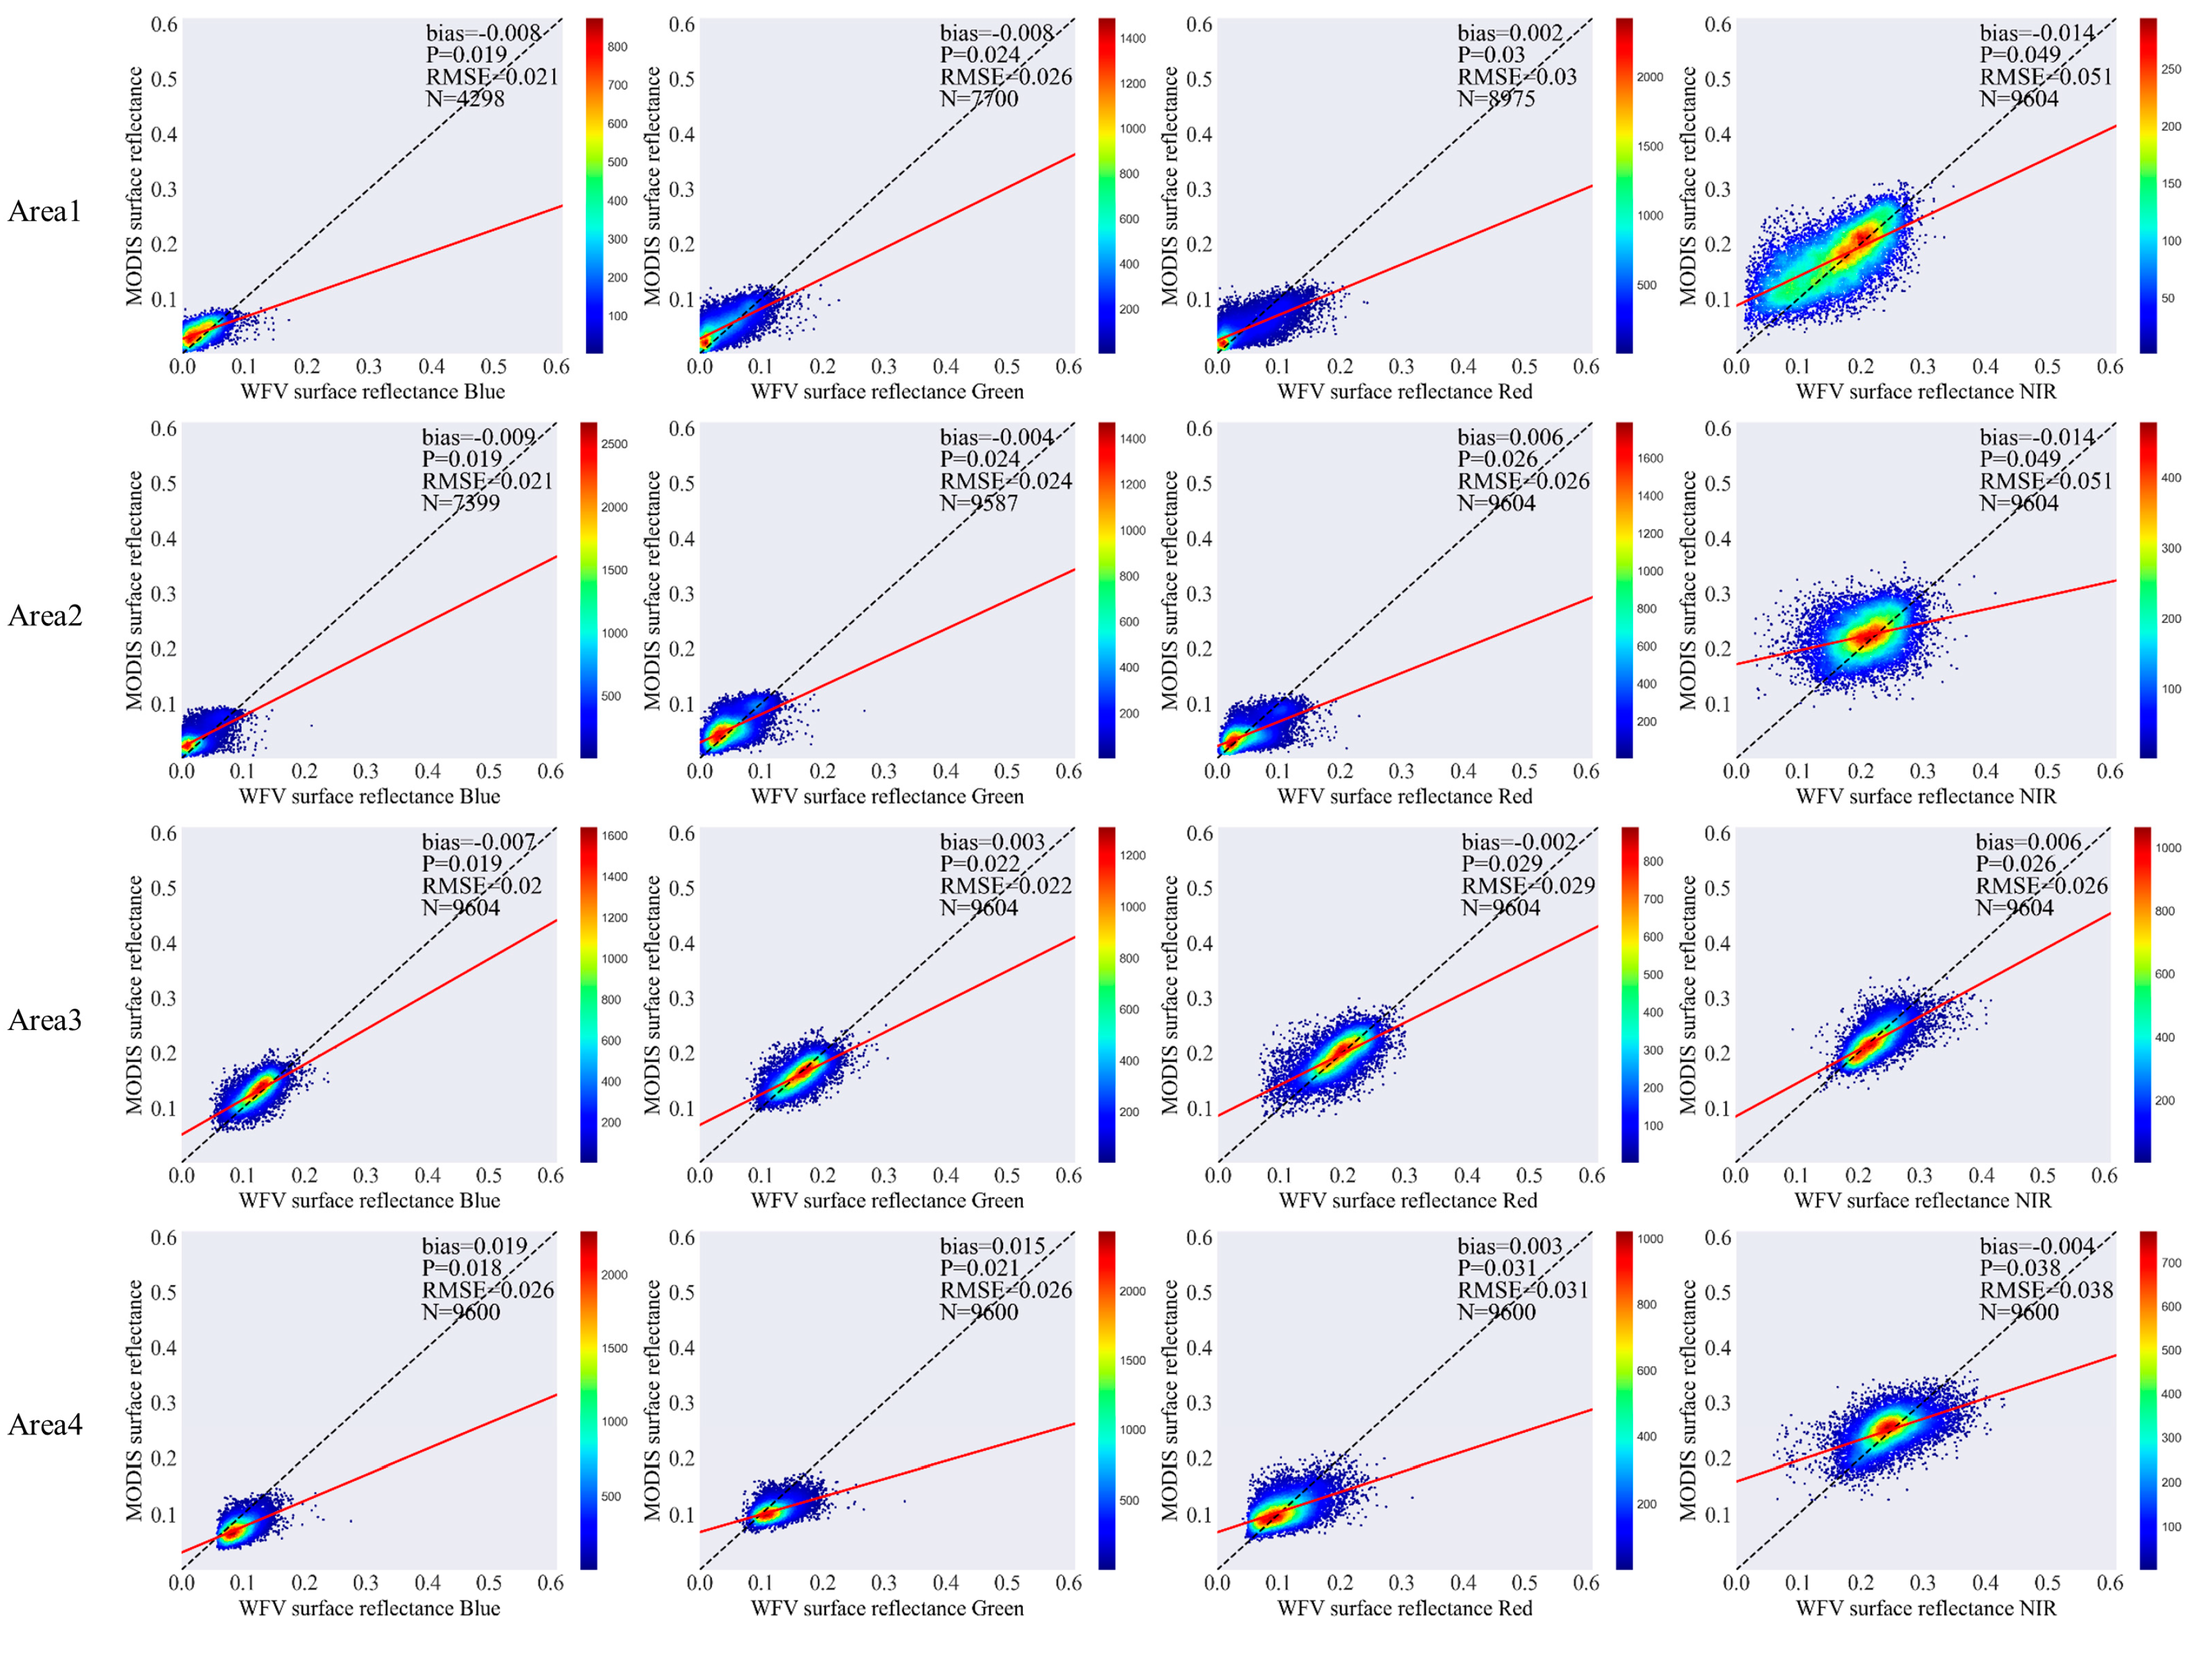
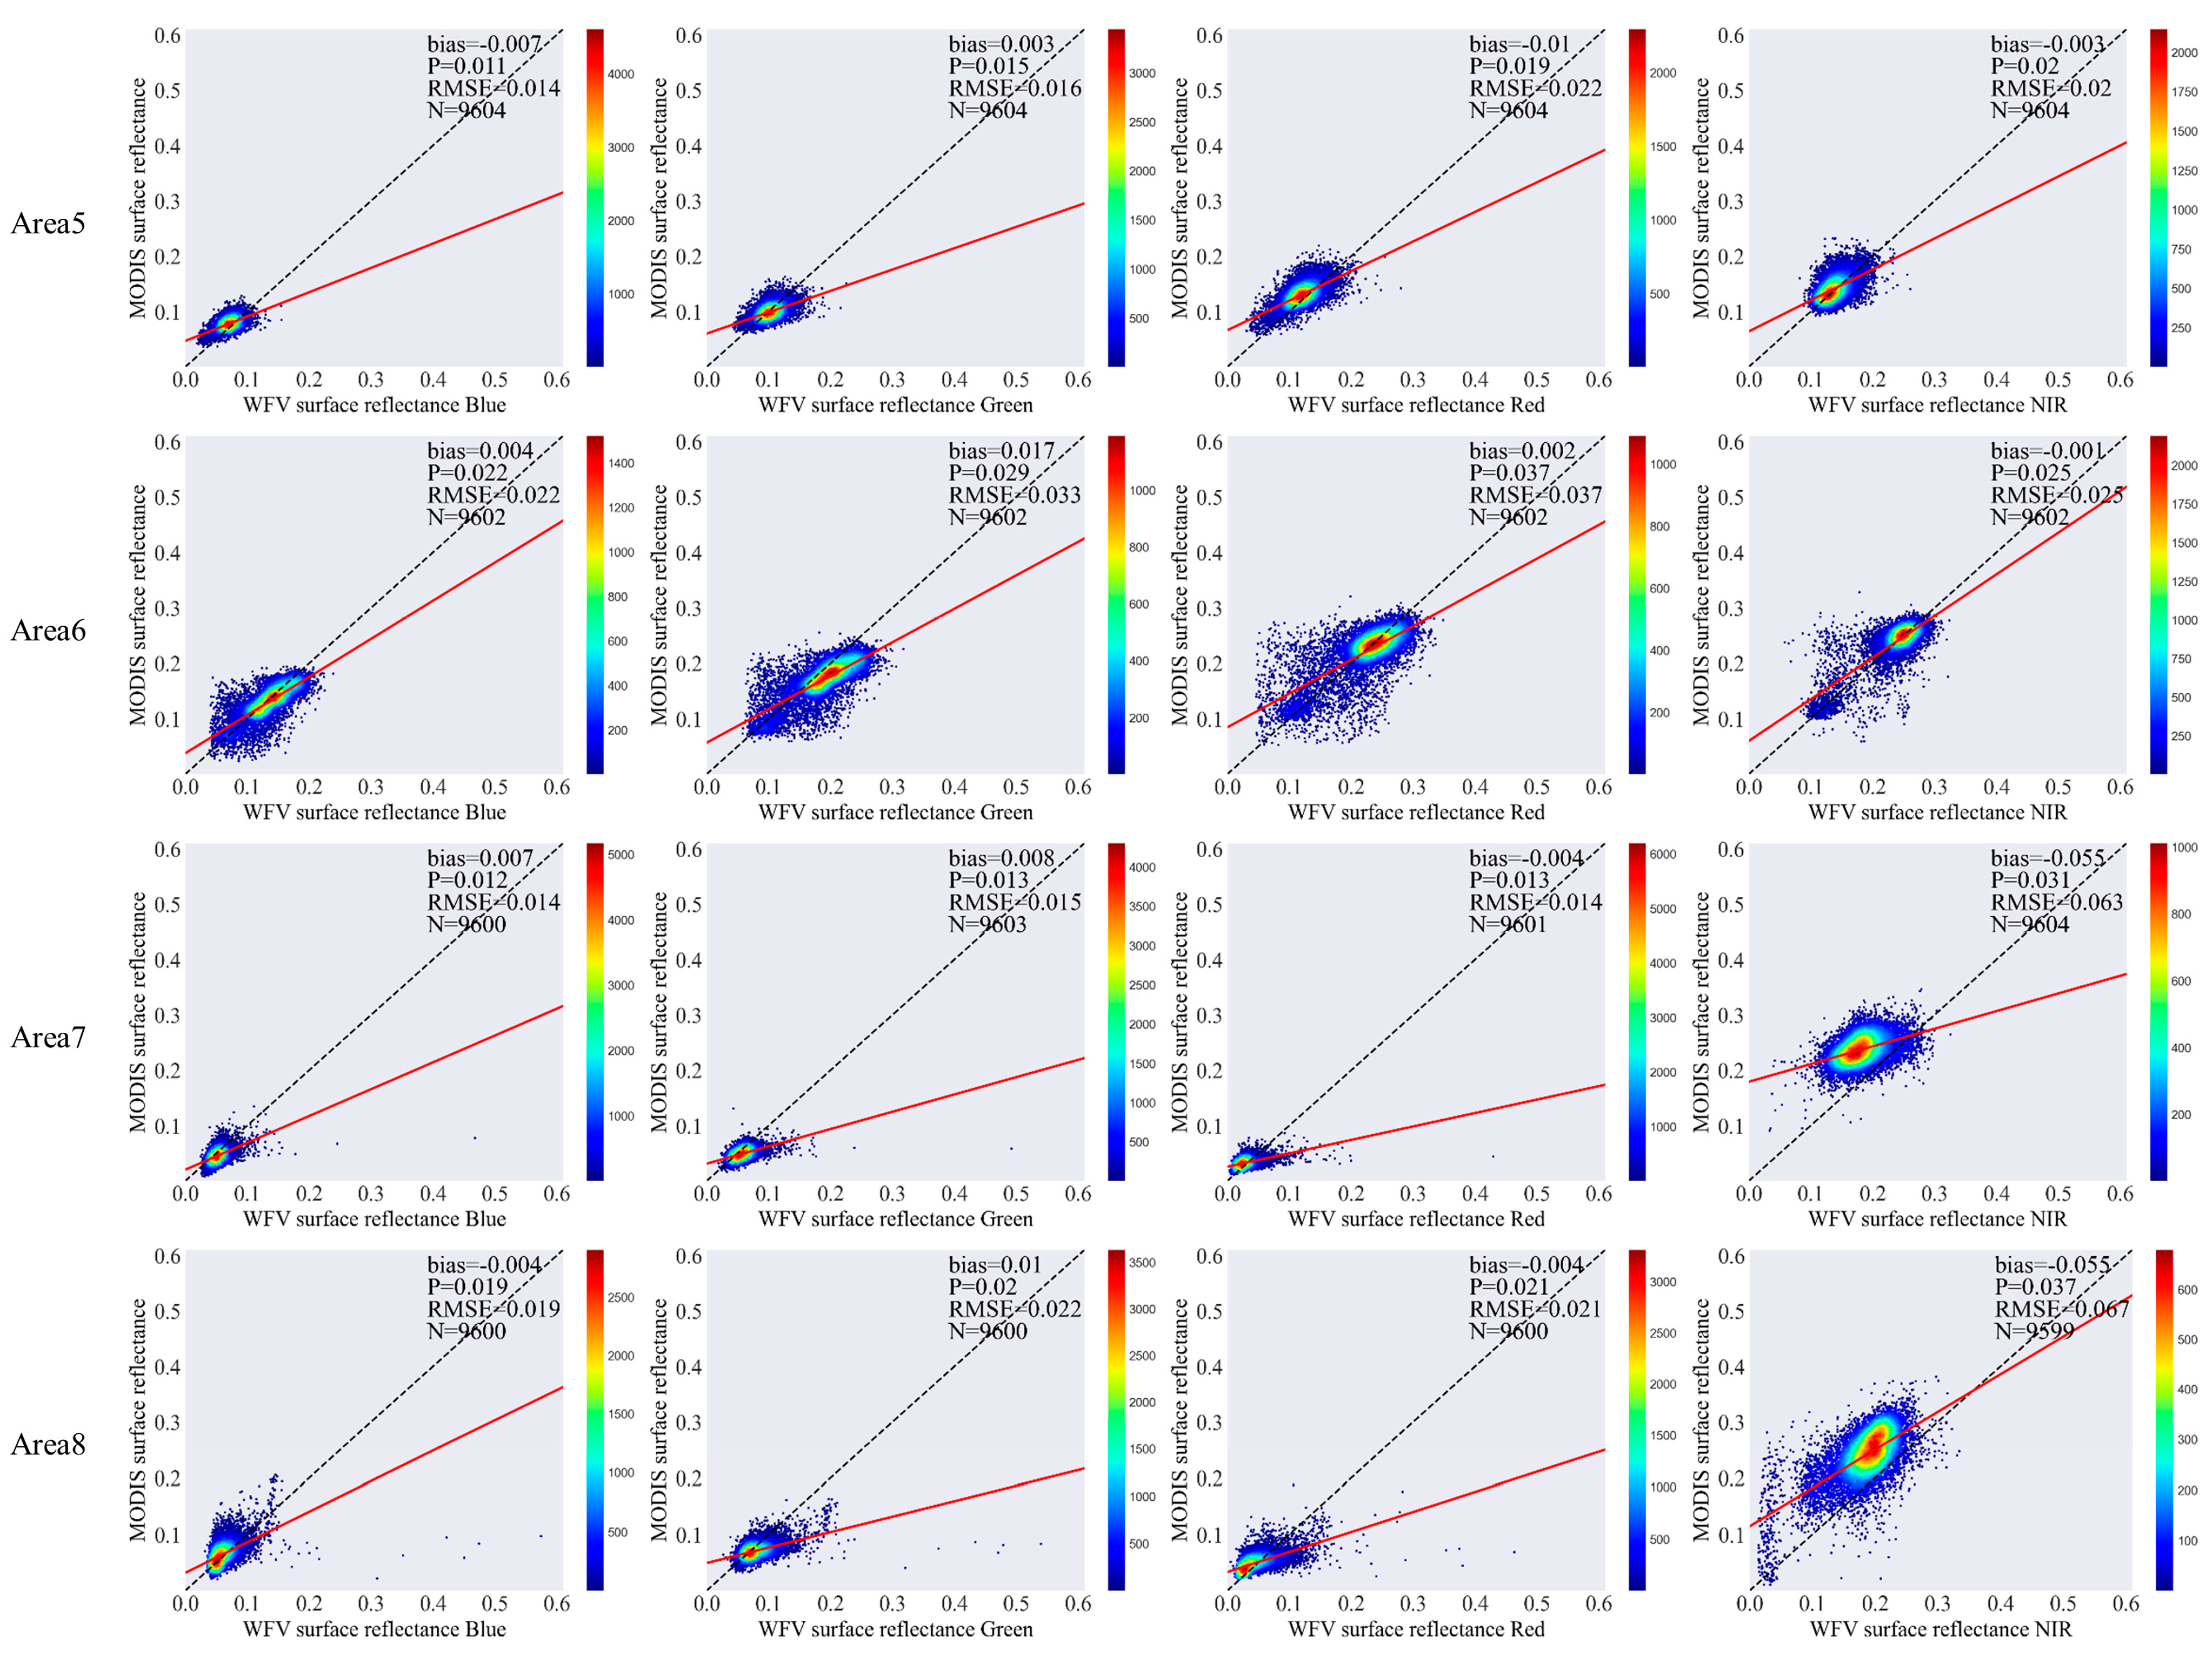
4.4. Evaluation Results of WFV and MODIS Surface Reflectance

In this section, we calculated the statistical indicators for the MODIS and WFV surface reflectance and analyze the differences between the two images. Figure 10 shows the scatter plots of the MODIS and WFV surface reflectance in each area, as well as the statistical indicator bias, precision, and RMSE. The WFV and MODIS comparisons were performed at a spatial resolution of 500 m with spectral conversion and geometric matching prior to comparison.
As a result of our experiments, we concluded that for most landcover types, MODIS surface reflectance in the visible and NIR bands was not significantly different from that of the WFV surface reflectance, with deviations below 0.02, and precision and RMSE below 0.04. In the NIR band, when the landcover types were forest and water, the MODIS surface reflectance was significantly higher than the WFV surface reflectance, and there was a large difference between the two datasets. In the red band, the MODIS surface reflectance was slightly higher than the WFV surface reflectance when the landcover type was bare.
In Areas 3–6, for visible-NIR bands, the bias was less than 0.02, and precision and RMSE were approximately 0.03. The lower bias and RMSE values indicate that the absolute difference between MODIS and WFV surface reflectance in these areas was not significant. Lower precision indicates a more stable range in variation between the two. A special case occurred in the red band of Area 6, where the statistical indicators increased with a precision and RMSE of approximately 0.037. The MODIS surface reflectance was higher than the WFV surface reflectance, and an examination of the image revealed that the landcover type for these pixels was bare ground.
Scatter plots for Areas 1–2 and 7–8 show that the statistical indicator bias, precision, and RMSE of MODIS and WFV surface reflectance were significantly lower in the visible bands than in the NIR band, while the statistical indicators in the NIR band appeared to increase sharply. The scatter plot of the NIR band showed the points where the MODSI surface reflectance was significantly higher than the WFV surface reflectance. Examination of the imagery revealed that the landcover type for this portion of the image elements in Areas 1–2 was a mixed evergreen forest while in Areas 7–8 it was an evergreen broad-leaf forest. In the scatter plot of the Area 8 NIR band in Figure 10, there are some points where the WFV surface reflectance (<0.05) is much lower than that of the MODIS surface reflectance, and inspection reveals that the landcover type of these pixels is water, which is similar to the previous comparison with OLI.

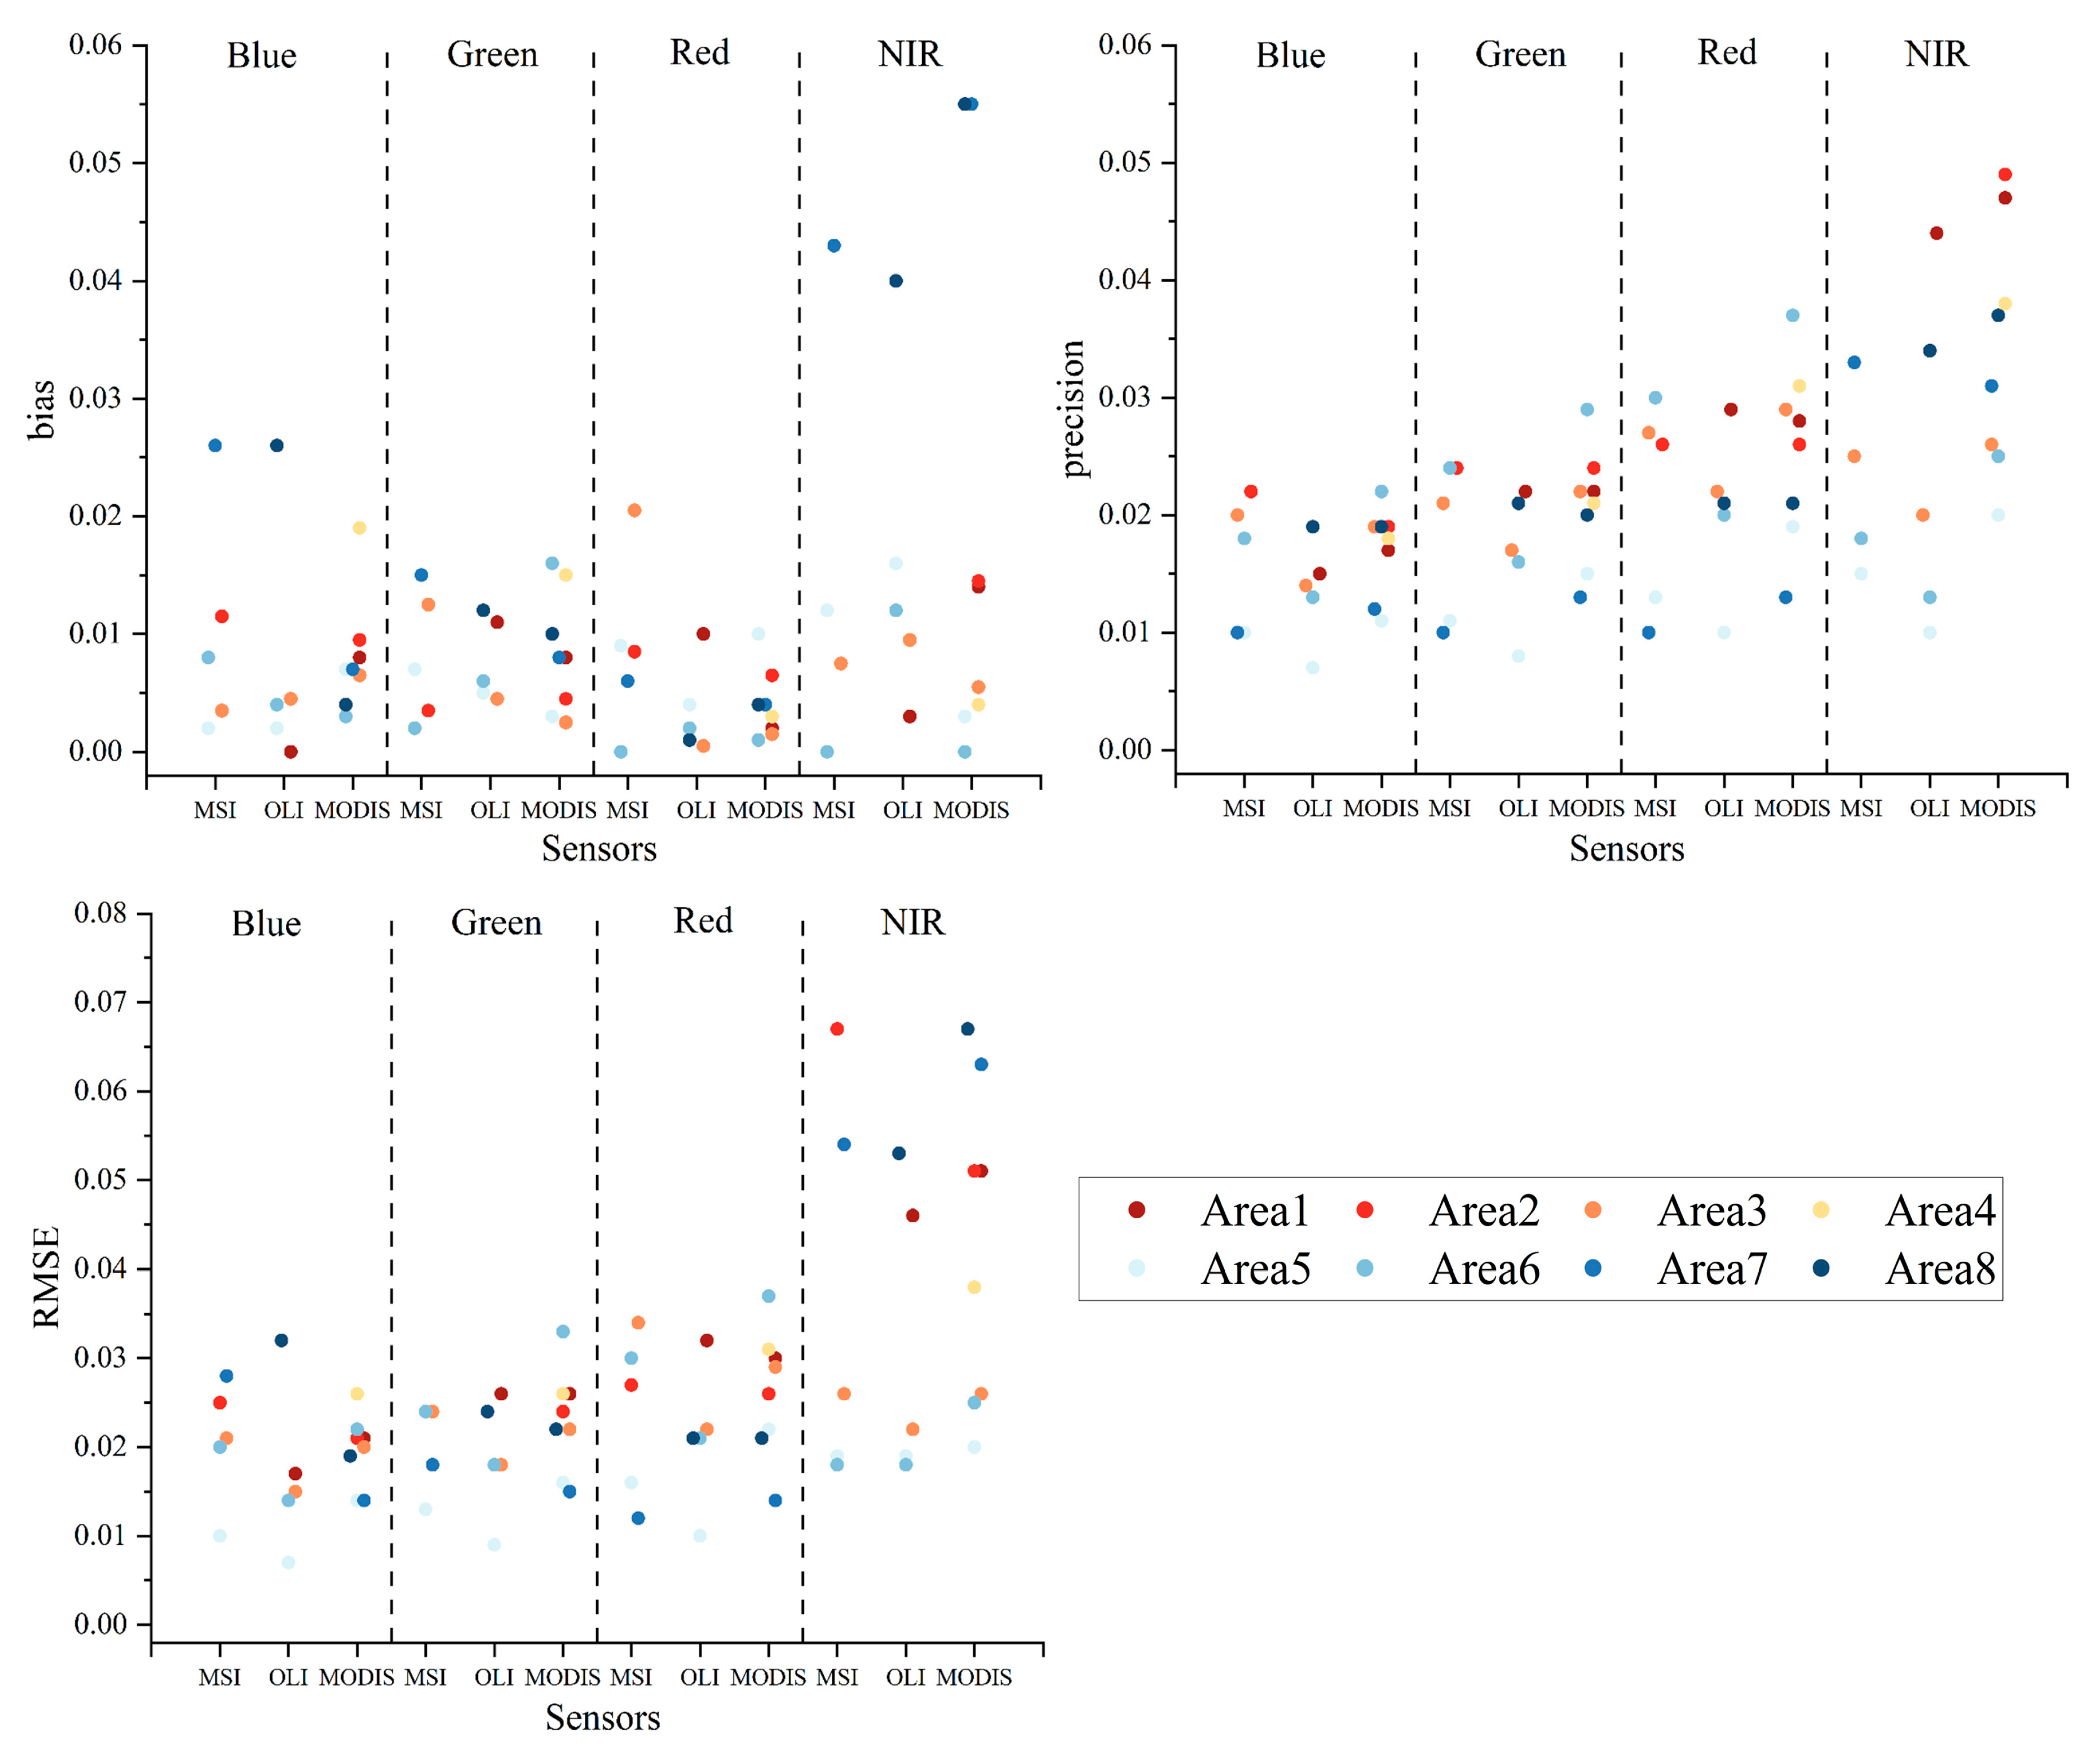
4.5. Comparison of Evaluation Results

The bias, precision, and RMSE statistics for the WFV surface reflectance when compared with the results from the MSI, OLI, and MODIS, for each of the eight experimental areas, are shown in Table 4 and Figure 11. The results showed that WFV, compared to the three datasets, had a bias below 0.02, and precision and RMSE below 0.04 for most landcover types. There were no significant differences between WFV and the three datasets, except for the forest and water landcover types, where WFV had the lowest statistical indicators and the strongest correlation with OLI.
As shown in Figure 11, the bias of the blue band in MSI Area 7 and OLI Area 8 was significantly higher than 0.02. This is because both areas are in Sri Lanka, which is cloudy throughout the year. The imaging conditions were harsh, and there were still clouds or thicker aerosols, even in the case of careful selection. The effect of clouds or aerosols decreased as the wavelength increased, and the bias in Areas 7–8 shows a decreasing trend from blue to green to red. In addition, although the RMSE of MSI and OLI in the visible band of Areas 7–8 was below 0.04, which is not outstanding, this pattern was also observed. The bias and RMSE accurately described the difference between the two datasets.
From the results of the three comparisons, the NIR band bias and RMSE of Areas 7–8 were significantly higher than those of Areas 1–2, which may be related to the forest area. Examination of the images of Areas 1–2 and 7–8 showed that all four areas had different degrees of forest cover, in which Areas 1–2 had a lower degree of forest cover than Areas 7–8. The bias and RMSE were also related to the degree of forest cover, while Area 8 had additional influence from bodies of water. The anomaly in the comparison was the NIR band of MSI Area 2, which showed anomalous precision and RMSE. It is speculated that this is because the middle of Area 2 is the Kathmandu area and has more surface buildings; resampling the MSI to 16 m added more mixed surface types to the image pixels, thus introducing more variance. This can also be seen in the Area 2 scatter plot in Section 4.2, where the correlation between the two images decreased significantly compared to the other areas of MSI.

5. Discussion

The WFV surface reflectance was compared with the MSI, OLI, and MODIS surface reflectances, and the statistical indicator bias, precision, and RMSE were calculated (Figure 8, Figure 9 and Figure 10). The results showed that WFV surface reflectance was not significantly different from MSI, OLI, and MODIS surface reflectance. In the visible and NIR bands, for most landcover types, the bias was less than 0.02, and the precision and RMSE were less than 0.04. When the landcover types were forest and water, the MSI, OLI, and MODIS surface reflectances were higher than the WFV surface reflectance in the NIR band. In this section, we analyzed the reasons for the differences between WFV and the other three sensors.

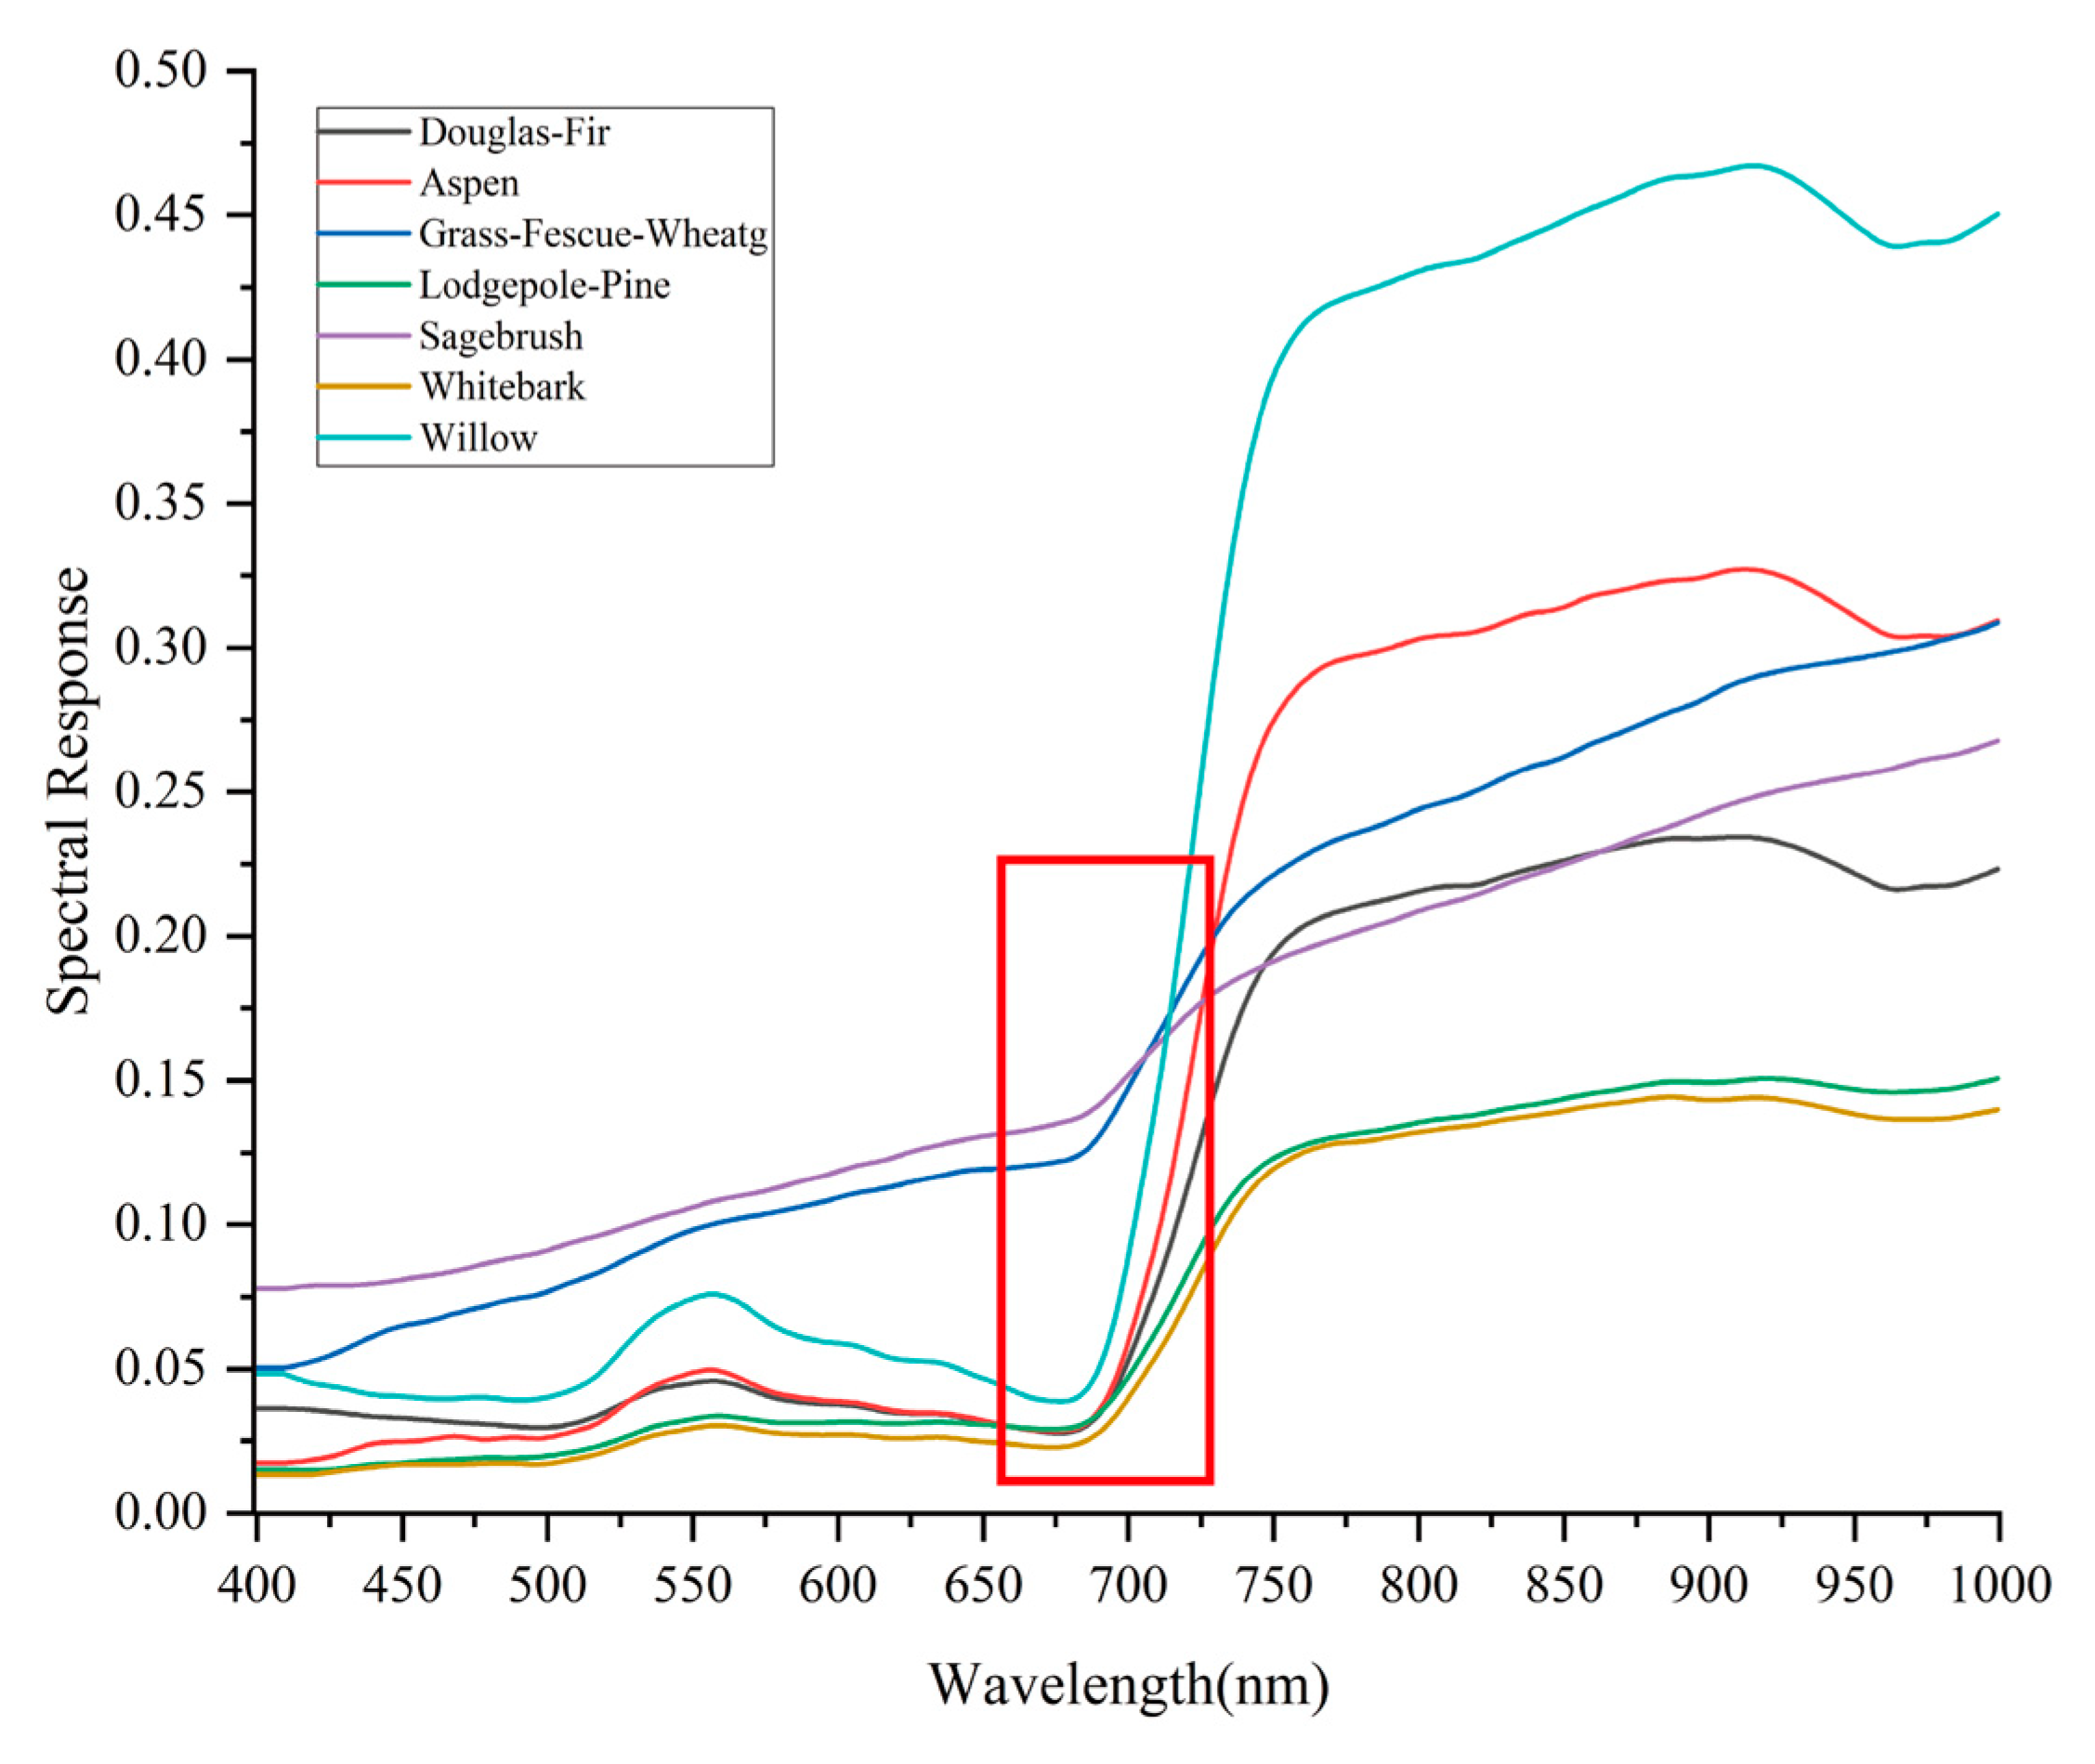
5.1. Effects of Landcover Type

For most landcover types, the consistency of WFV with MSI, OLI, and MODIS is high, with significant differences only in the NIR bands when the surface is forested and contains bodies of water. Combined with the feature spectral curves and the relative spectral response of the WFV, we hold the following more detailed discussion. From the spectral data collected by the airborne visible infrared imaging spectrometer in the United States Geological Survey spectral library, seven plant categories were identified: willow, white bark, sagebrush, lodgepole-pine, grass-fescue-wheat, aspen, and Douglas-fir, as shown in Figure 12. Viewing the spectral curves of each type of plant, we found that between 675 nm and 725 nm (the part in the red box), there is a significant difference in the reflectance of grass, shrubs, wheat and various types of trees, with the reflectance of grass, shrubs and wheat in the range of 0.1–0.15, while various types of trees show a clear reflectance trough below 0.05. The effective range of the NIR band spectral response function of the GF-1 WFV starts at 700 nm, and a wide NIR band may cause the WFV sensor to be affected by the red-edge effect of plants. This may explain the large differences in reflectance between the WFV surface reflectance and the MSI, OLI, and MODIS surface reflectance for forest landcover types, whereas no significant differences were observed in other vegetation areas. It has also been mentioned by some researchers that the normalized difference vegetation index and fractional vegetation cover of the WFV inversion do not perform as well as other vegetation types in forest areas [54,55,56]. We validated GF-1 WFV with Sentinel-2 MSI, Landsat-8 OLI based on the IGBP feature classes in MCD12Q1. We only counted feature classes with pixel counts greater than 10,000 and added the results as an Appendix A. Because the spatial resolution of MCD12Q1 is 500 m, the results of the feature class validation are affected by this. We will discuss the specifics in future work.
The NIR bands of the MSI, OLI, and MODIS surface reflectances were significantly higher than the WFV surface reflectance when the landcover type was water. In the NIR band, the ability of water to absorb light gradually increases, leading to a relatively low reflectance of water in the NIR band and making the reflectance inversion of water inherently difficult [57]. Meanwhile, the OLI and MODIS are designed to narrow the spectral range in the NIR band by removing the effect of water vapor absorption at 0.825 μm, while the WFV still maintains a wide spectral range in the NIR band. Therefore, when the landcover type was water, the differences in surface reflectance between the WFV and MSI, OLI, and MODIS in the NIR band were large.

5.2. Effects of Residual Clouds, Cloud Shadows, and Inconsistent Sensor Imaging Times

Clouds have significantly higher pixel values than the features, and residual clouds can seriously affect the evaluation quality. In Figure 9 (WFV compared to OLI), some points where OLI is significantly higher than WFV appear in the visible band scatter plot of Area 8. A review of the corresponding images reveals that both OLI surface reflectances in Area 8 have significant cloud cover. This is because OLI surface reflectance and MSI surface reflectance are downloaded from GEE. Whereas de-clouding in GEE uses a relatively simple cloud masking method based only on the quality assessment bands, although the main extensive cloud masses are removed, significant blurred patches remain near the cloud masses that can affect the quality assessment [58,59]. In this study, to validate the WFV data, the WFV images were selected to be cloud-free. To ensure that MSI and OLI are close in time to the WFV and that the features do not change significantly, some clouds are present in the MSI and OLI images for the guaranteed time range.
Changes in features over time can cause errors in quality assessment, such as large changes in plant spectra during the plant growing season with a difference in imaging time of 1–2 weeks [60,61] or ephemeral changes in the ground that cause damage to features [62]. As the transit times of the three satellites were inconsistent, it was difficult to collect images with imaging times on the same day. Even if images at similar times are retrieved, they may be affected by clouds or thick aerosols and cannot be used. In this study, we tried to ensure that the imaging time was within one week, and only the OLI surface reflectance data from Area 2 was 10 days away from the WFV, but it was not used because of excessive clouds. Nevertheless, the differences between WFV and MSI, OLI, and MODIS remained insignificant in most cases, with a high degree of consistency, suggesting that similar transit times did not have a major impact on quality evaluation.

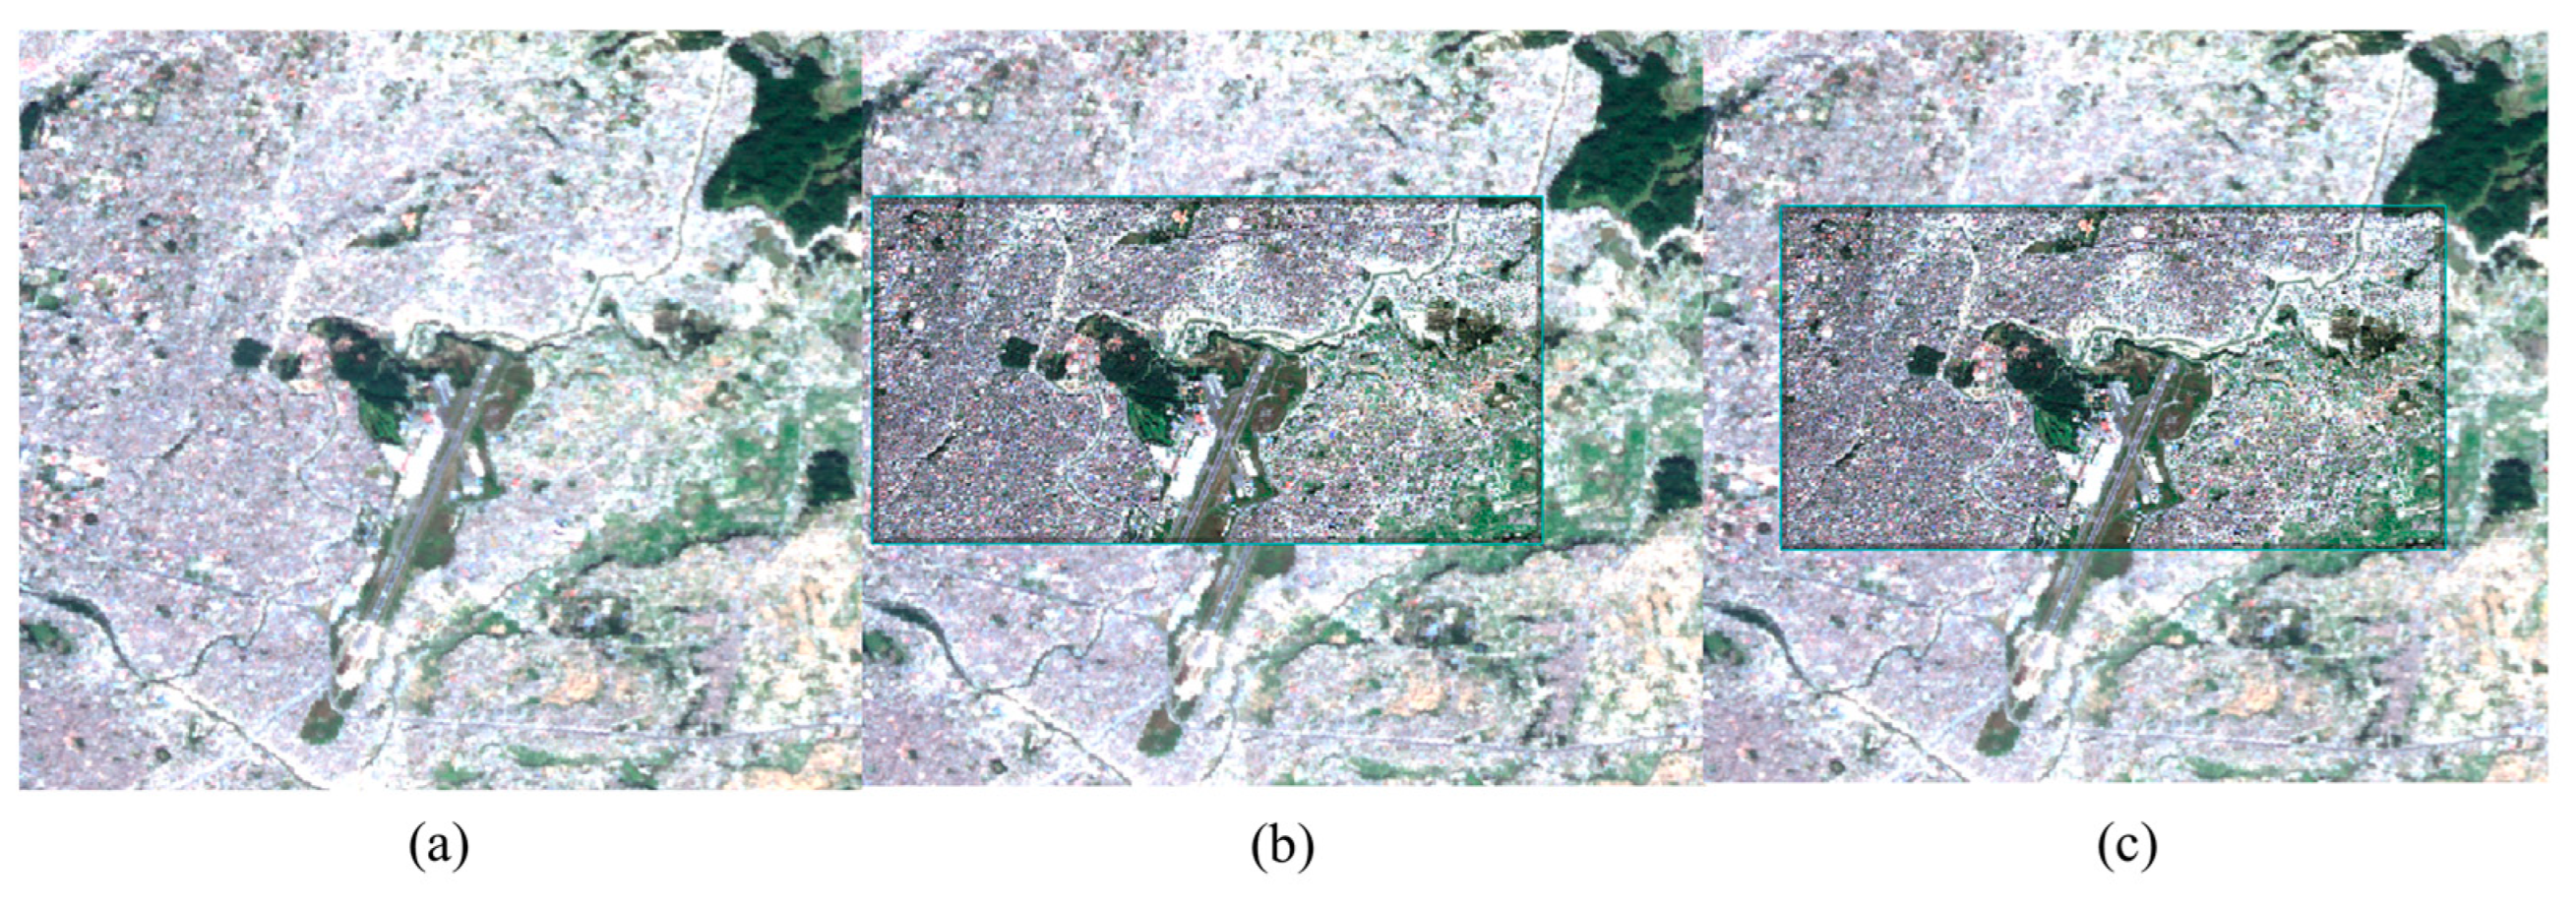
5.3. Effects of Geographic Alignment

The effect of the geographic alignment on the validation results was significant [63,64]. There is a deviation in the geo-location of the GF-1 WFV in mountainous areas, and this part of the deviation will have a large impact on the quality evaluation, which will affect the joint application of the GF-1 WFV with other similar sensors on a global scale. For example, in Area 2 of the WFV and MSI, the positional deviation of the two datasets before calibration was extremely large, as shown in Figure 13, selecting part of the images in Area 2. The validation results before and after alignment are shown in Table 5 and Figure 14. Before alignment, the bias between the two images was below 0.01; however, the precision and RMSE were above 0.03, and the linear relationship between the two datasets was not obvious. After alignment, the bias remained basically unchanged, the precision decreased by 9% to 32%, the RMSE decreased by 9% to 31%, and the linear relationship between the two datasets improved significantly. Geographic alignment significantly affects the results of the quality assessment, particularly in areas with large differences in landcover types and distinct feature demarcation lines, resulting in an increase in precision and RMSE. This is because the bias describes the overall deviation of the two-scene image; therefore, it is largely unaffected by geographic alignment, whereas precision and RMSE describe the range of data variation.

5.4. Limitations and Future Prospects

In this study, WFV data were compared with MSI, OLI, and MODIS surface reflectance data to investigate the quality of the data outside China. Although it was demonstrated that there was no significant difference between the WFV and the three datasets for most landcover types, we still need to continuously improve the inversion accuracy of the WFV surface reflectance in our future studies. To validate the surface reflectance, it is best to collect spectral data in the field for experiments based on the WFV transit time. In addition, the accuracy of the geometric alignment of WFV outside China remains a problem to be solved. The NIR bands of WFV and other sensors differ greatly, and a simple linear spectral adjustment is not sufficient to eliminate the differences between WFV, OLI, and MODIS.

6. Conclusions

In this study, eight areas with typical landcover types, including Nepal, Azerbaijan, Kenya, and Sri Lanka, were selected to evaluate the surface reflectance data of GF-1 WFV outside China using Sentinel-2 MSI, Landsat-8 OLI, and MODIS surface reflectance data as references. We proposed a method for obtaining high-accuracy GF-1 WFV surface reflectance data, including radiometric calibration, geometric correction, atmospheric correction, and cross-radiation calibration. Considering the large observation angle range of the WFV, the BRDF correction of the WFV surface reflectance was completed with MCD43A1. Quality assessment considers the differences in sensor performance and begins with the spectral transformation of the MSI, OLI, and MOIDS surface reflectance. For differences in spatial resolution, we chose to compare WFV with MSI, OLI, and MODIS at 16 m, 30 m, and 500 m. To quantify the variation between the WFV surface reflectance and other data, the bias, precision, and RMSE were selected as the evaluation indicators in this study. The results of the study showed that there was a high level of agreement between the WFV and MSI, OLI, and MODIS surface reflectance data, with differences only when the landcover types were forest and water. The quality of reference images can have a large impact on quality evaluation. Furthermore, the GF-1 WFV data from mountainous areas outside of China were found to have large geographic alignment errors when compared with the MSI and OLI, which could affect the global application of the GF-1. The GF-1 WFV preprocessing method proposed in this study was able to obtain accurate and reliable surface reflectance data, and the quality of the GF-1 WFV data was verified outside China. The quality evaluation of the dataset improves the credibility of the WFV surface reflectance data, which can meet the needs of practical applications. At present, this provides a reliable basis for the global use of GF-1 WFV, which will make global users aware of the usefulness of Chinese satellite data.

Author Contributions

Conceptualization, Y.D., Y.L. and H.Z.; methodology, Y.D., X.G. and H.Z.; code, Y.D.; validation, Y.D. and Y.L.; writing—review and editing, Y.D., Y.L., X.G., T.C., J.L., X.W., M.G., M.L. and Q.Z. All authors have read and agreed to the published version of the manuscript.

Funding

This work was supported in part by the National Key Research and Development Program of China under Grant 2019YFE0127300, in part by the National Natural Science Foundation of China under Grant 41901367, and in part by the Major Project of High Resolution Earth Observation System (Grant No. “30-Y60B01-9003-22/23”).

Data Availability Statement

Not applicable.

Acknowledgments

The authors would like to thank their colleagues for their company and help. The authors would like to thank the anonymous reviewers for their constructive comments and suggestions.

Conflicts of Interest

The authors declare no conflict of interest.

Appendix A

We validated GF-1 WFV with Sentinel-2 MSI and Landsat-8 OLI based on the IGBP feature classes in MCD12Q1. We only enumerated feature classes with pixel counts greater than 10,000 and added the results as an appendix. Because the spatial resolution of MCD12Q1 is 500 m, the results of the feature class validation are affected by this. We will discuss the specifics in future works.
Figure A1. Scatter plot of MSI and WFV surface reflectance, from left to right, blue, green, red, and NIR bands; the dashed line is the 1:1 reference line, while the solid line represents the regression line between MSI and WFV surface reflectance; the color change in the plot represents the density of the points; P stands for precision.
Remotesensing 15 05382 g0a1aRemotesensing 15 05382 g0a1b
Figure A2. Scatter plot of OLI and WFV surface reflectance, from left to right, blue, green, red, and NIR bands; the dashed line is the 1:1 reference line, while the solid line represents the regression line between MSI and WFV surface reflectance; the color change in the plot represents the density of the points; P stands for precision.
Remotesensing 15 05382 g0a2aRemotesensing 15 05382 g0a2b

References

  1. Feng, L.; Li, J.; Gong, W.S.; Zhao, X.; Chen, X.L.; Pang, X.P. Radiometric cross-calibration of Gaofen-1 WFV cameras using Landsat-8 OLI images: A solution for large view angle associated problems. Remote Sens. Environ. 2016, 174, 56–68. [Google Scholar] [CrossRef]
  2. Song, Q.; Hu, Q.; Zhou, Q.B.; Hovis, C.; Xiang, M.T.; Tang, H.J.; Wu, W.B. In-Season Crop Mapping with GF-1/WFV Data by Combining Object-Based Image Analysis and rRandom Forest. Remote Sens. 2017, 9, 1184. [Google Scholar] [CrossRef]
  3. Yang, N.; Liu, D.Y.; Feng, Q.L.; Xiong, Q.; Zhang, L.; Ren, T.W.; Zhao, Y.Y.; Zhu, D.H.; Huang, J.X. Large-Scale Crop Mapping Based on Machine Learning and Parallel Computation with Grids. Remote Sens. 2019, 11, 1500. [Google Scholar] [CrossRef]
  4. Lei, S.H.; Wu, D.; Li, Y.M.; Wang, Q.; Huang, C.C.; Liu, G.; Zheng, Z.B.; Du, C.G.; Mu, M.; Xu, J.; et al. Remote sensing monitoring of the suspended particle size in Hongze Lake based on GF-1 data. Int. J. Remote Sens. 2019, 40, 3179–3203. [Google Scholar] [CrossRef]
  5. Lu, X.M.; Situ, C.Y.; Wang, J.J.; Zhou, L.G.; Ma, W.C.; Li, L.N. Remote Estimation of the Chlorophyll-a Concentration in Lake Dianshan, China Using High-Spatial-Resolution Satellite Imagery. J. Indian Soc. Remote Sens. 2022, 50, 2465–2477. [Google Scholar] [CrossRef]
  6. Li, Z.; Yang, X.M. Fusion of High- and Medium-Resolution Optical Remote Sensing Imagery and GlobeLand30 Products for the Automated Detection of Intra-Urban Surface Water. Remote Sens. 2020, 12, 4037. [Google Scholar] [CrossRef]
  7. Li, H.; Chen, Z.X.; Jiang, Z.W.; Wu, W.B.; Ren, J.Q.; Liu, B.; Hasi, T. Comparative analysis of GF-1, HJ-1, and Landsat-8 data for estimating the leaf area index of winter wheat. J. Integr. Agric. 2017, 16, 266–285. [Google Scholar] [CrossRef]
  8. Li, W.; Niu, Z.; Wang, C.; Huang, W.J.; Chen, H.Y.; Gao, S.; Li, D.; Muhammad, S. Combined Use of Airborne LiDAR and Satellite GF-1 Data to Estimate Leaf Area Index, Height, and Aboveground Biomass of Maize During Peak Growing Season. IEEE J. Sel. Top. Appl. Earth Observ. Remote Sens. 2015, 8, 4489–4501. [Google Scholar] [CrossRef]
  9. Jia, K.; Liang, S.L.; Gu, X.F.; Baret, F.; Wei, X.Q.; Wang, X.X.; Yao, Y.J.; Yang, L.Q.; Li, Y.W. Fractional vegetation cover estimation algorithm for Chinese GF-1 wide field view data. Remote Sens. Environ. 2016, 177, 184–191. [Google Scholar] [CrossRef]
  10. Zhu, Q.L.; Xu, X.G.; Sun, Z.D.; Liang, D.; An, X.F.; Chen, L.P.; Yang, G.J.; Huang, L.S.; Xu, S.Z.; Yang, M. Estimation of Winter Wheat Residue Coverage Based on GF-1 Imagery and Machine Learning Algorithm. Agronomy 2022, 12, 1051. [Google Scholar] [CrossRef]
  11. Tao, G.F.; Jia, K.; Zhao, X.; Wei, X.Q.; Xie, X.H.; Zhang, X.W.; Wang, B.; Yao, Y.J.; Zhang, X.T. Generating High Spatio-Temporal Resolution Fractional Vegetation Cover by Fusing GF-1 WFV and MODIS Data. Remote Sens. 2019, 11, 2324. [Google Scholar] [CrossRef]
  12. Sun, K.; Chen, X.L.; Zhu, Z.M.; Zhang, T.H. High Resolution Aerosol Optical Depth Retrieval Using Gaofen-1 WFV Camera Data. Remote Sens. 2017, 9, 89. [Google Scholar] [CrossRef]
  13. Zhang, Y.M.; Chen, H.; Wang, Z.T. Terrestrial aerosol retrieval over Beijing from Chinese GF-1 data based on the blue/red correlation. Remote Sens. Lett. 2021, 12, 216–225. [Google Scholar] [CrossRef]
  14. Sun, K.; Chen, X.L.; Wang, J.L.; Zhang, T.H.; Zhu, Z.M. Investigation of air quality over the largest city in central China using high resolution satellite derived aerosol optical depth data. Atmos. Pollut. Res. 2018, 9, 584–593. [Google Scholar] [CrossRef]
  15. Bao, F.W.; Gu, X.F.; Cheng, T.H.; Wang, Y.; Guo, H.; Chen, H.; Wei, X.; Xiang, K.S.; Li, Y.N. High-Spatial-Resolution Aerosol Optical Properties Retrieval Algorithm Using Chinese High-Resolution Earth Observation Satellite I. IEEE Trans. Geosci. Remote Sens. 2016, 54, 5544–5552. [Google Scholar] [CrossRef]
  16. Zhong, B.; Yang, A.X.; Liu, Q.H.; Wu, S.L.; Shan, X.J.; Mu, X.H.; Hu, L.F.; Wu, J.J. Analysis Ready Data of the Chinese GaoFen Satellite Data. Remote Sens. 2021, 13, 1709. [Google Scholar] [CrossRef]
  17. Franch, B.; Vermote, E.F.; Sobrino, J.A.; Fedele, E. Analysis of directional effects on atmospheric correction. Remote Sens. Environ. 2013, 128, 276–288. [Google Scholar] [CrossRef]
  18. Barnsley, M.J.; Allison, D.; Lewis, P. On the information content of multiple view angle (MVA) images. Int. J. Remote Sens. 1997, 18, 1937–1960. [Google Scholar] [CrossRef]
  19. Schaaf, C.B.; Gao, F.; Strahler, A.H.; Lucht, W.; Li, X.W.; Tsang, T.; Strugnell, N.C.; Zhang, X.Y.; Jin, Y.F.; Muller, J.P.; et al. First operational BRDF, albedo nadir reflectance products from MODIS. Remote Sens. Environ. 2002, 83, 135–148. [Google Scholar] [CrossRef]
  20. Jin, Y.F.; Schaaf, C.B.; Woodcock, C.E.; Gao, F.; Li, X.W.; Strahler, A.H.; Lucht, W.; Liang, S.L. Consistency of MODIS surface bidirectional reflectance distribution function and albedo retrievals: 2. Validation. J. Geophys. Res.-Atmos. 2003, 108, D5. [Google Scholar] [CrossRef]
  21. Salomon, J.G.; Schaaf, C.B.; Strahler, A.H.; Gao, F.; Jin, Y.F. Validation of the MODIS Bidirectional Reflectance Distribution Function and Albedo retrievals using combined observations from the Aqua and Terra platforms. IEEE Trans. Geosci. Remote Sens. 2006, 44, 1555–1565. [Google Scholar] [CrossRef]
  22. Fang, H.; Liang, S.; Chen, M.; Walthall, C.; Daughtry, C. Statistical comparison of MISR, ETM plus and MODIS land surface reflectance and albedo products of the BARC land validation core site, USA. Int. J. Remote Sens. 2004, 25, 409–422. [Google Scholar] [CrossRef]
  23. Li, J.; Chen, X.L.; Tian, L.Q.; Huang, J.; Feng, L. Improved capabilities of the Chinese high-resolution remote sensing satellite GF-1 for monitoring suspended particulate matter (SPM) in inland waters: Radiometric and spatial considerations. ISPRS-J. Photogramm. Remote Sens. 2015, 106, 145–156. [Google Scholar] [CrossRef]
  24. Dwyer, J.L.; Roy, D.P.; Sauer, B.; Jenkerson, C.B.; Zhang, H.K.K.; Lymburner, L. Analysis Ready Data: Enabling Analysis of the Landsat Archive. Remote Sens. 2018, 10, 1363. [Google Scholar] [CrossRef]
  25. Vermote, E.; Justice, C.; Claverie, M.; Franch, B. Preliminary analysis of the performance of the Landsat 8/OLI land surface reflectance product. Remote Sens. Environ. 2016, 185, 46–56. [Google Scholar] [CrossRef]
  26. Claverie, M.; Vermote, E.F.; Franch, B.; Masek, J.G. Evaluation of the Landsat-5 TM and Landsat-7 ETM + surface reflectance products. Remote Sens. Environ. 2015, 169, 390–403. [Google Scholar] [CrossRef]
  27. Masek, J.G.; Vermote, E.F.; Saleous, N.E.; Wolfe, R.; Hall, F.G.; Huemmrich, K.F.; Gao, F.; Kutler, J.; Lim, T.K. A Landsat surface reflectance dataset for North America, 1990–2000. IEEE Geosci. Remote Sens. Lett. 2006, 3, 68–72. [Google Scholar] [CrossRef]
  28. Roy, D.P.; Wulder, M.A.; Loveland, T.R.; Woodcock, C.E.; Allen, R.G.; Anderson, M.C.; Helder, D.; Irons, J.R.; Johnson, D.M.; Kennedy, R.; et al. Landsat-8: Science and product vision for terrestrial global change research. Remote Sens. Environ. 2014, 145, 154–172. [Google Scholar] [CrossRef]
  29. Drusch, M.; Del Bello, U.; Carlier, S.; Colin, O.; Fernandez, V.; Gascon, F.; Hoersch, B.; Isola, C.; Laberinti, P.; Martimort, P.; et al. Sentinel-2: ESA’s Optical High-Resolution Mission for GMES Operational Services. Remote Sens. Environ. 2012, 120, 25–36. [Google Scholar] [CrossRef]
  30. Main-Knorn, M.; Pflug, B.; Louis, J.; Debaecker, V.; Muller-Wilm, U.; Gascon, F. Sen2Cor for Sentinel-2. In Proceedings of the Conference on Image and Signal Processing for Remote Sensing XXIII, Warsaw, Poland, 11–13 September 2017; Spie-Int Soc Optical Engineering: Warsaw, Poland, 2017. [Google Scholar]
  31. Louis, J.; Pflug, B.; Main-Knorn, M.; Debaecker, V.; Mueller-Wilm, U.; Iannone, R.Q.; Cadau, E.G.; Boccia, V.; Gascon, F. Sentinel-2 Global Surface Reflectance Level-2a Product Generated with Sen2cor. In Proceedings of the IEEE International Geoscience and Remote Sensing Symposium (IGARSS), Yokohama, Japan, 28 July–2 August 2019; IEEE: Yokohama, Japan, 2019; pp. 8522–8525. [Google Scholar]
  32. Paudel, B.; Zhang, Y.L.; Li, S.C.; Liu, L.S.; Wu, X.; Khanal, N.R. Review of studies on land use and land cover change in Nepal. J. Mt. Sci. 2016, 13, 643–660. [Google Scholar] [CrossRef]
  33. Mammadov, E.; Nowosad, J.; Glaesser, C. Estimation and mapping of surface soil properties in the Caucasus Mountains, Azerbaijan using high-resolution remote sensing data. Geoderma Reg. 2021, 26, 15. [Google Scholar] [CrossRef]
  34. Klisch, A.; Atzberger, C. Operational Drought Monitoring in Kenya Using MODIS NDVI Time Series. Remote Sens. 2016, 8, 267. [Google Scholar] [CrossRef]
  35. Giri, C.; Long, J.; Abbas, S.; Murali, R.M.; Qamer, F.M.; Pengra, B.; Thau, D. Distribution and dynamics of mangrove forests of South Asia. J. Environ. Manag. 2015, 148, 101–111. [Google Scholar] [CrossRef] [PubMed]
  36. Farr, T.G.; Rosen, P.A.; Caro, E.; Crippen, R.; Duren, R.; Hensley, S.; Kobrick, M.; Paller, M.; Rodriguez, E.; Roth, L.; et al. The shuttle radar topography mission. Rev. Geophys. 2007, 45, 2005RG000183. [Google Scholar] [CrossRef]
  37. Martins, V.S.; Lyapustin, A.; Wang, Y.J.; Giles, D.M.; Smirnov, A.; Slutsker, I.; Korkin, S. Global validation of columnar water vapor derived from EOS MODIS-MAIAC algorithm against the ground-based AERONET observations. Atmos. Res. 2019, 225, 181–192. [Google Scholar] [CrossRef]
  38. Long, D.; Gao, Y.C.; Singh, V.P. Estimation of daily average net radiation from MODIS data and DEM over the Baiyangdian watershed in North China for clear sky days. J. Hydrol. 2010, 388, 217–233. [Google Scholar] [CrossRef]
  39. Chander, G.; Markham, B.L.; Helder, D.L. Summary of current radiometric calibration coefficients for Landsat MSS, TM, ETM+, and EO-1 ALI sensors. Remote Sens. Environ. 2009, 113, 893–903. [Google Scholar] [CrossRef]
  40. Liu, L.; Gao, H.L.; Pan, Z.Q.; Qian, Y.G.; Han, Q.J.; Zhang, X.W.; Shi, T.T. Satellite-based time series calibration of GF-1 WFV sensors for large view zenith angle observations. Int. J. Remote Sens. 2018, 39, 8293–8316. [Google Scholar] [CrossRef]
  41. Fraser, C.S.; Dial, G.; Grodecki, J. Sensor orientation via RPCs. ISPRS-J. Photogramm. Remote Sens. 2006, 60, 182–194. [Google Scholar] [CrossRef]
  42. Fraser, C.S.; Hanley, H.B. Bias-compensated RPCs for sensor orientation of high-resolution satellite imagery. Photogramm. Eng. Remote Sens. 2005, 71, 909–915. [Google Scholar] [CrossRef]
  43. Yang, A.X.; Zhong, B.; Hu, L.F.; Wu, S.L.; Xu, Z.P.; Wu, H.B.; Wu, J.J.; Gong, X.S.; Wang, H.B.; Liu, Q.H. Radiometric Cross-Calibration of the Wide Field View Camera Onboard GaoFen-6 in Multispectral Bands. Remote Sens. 2020, 12, 1037. [Google Scholar] [CrossRef]
  44. Teillet, P.M.; Markham, B.L.; Irish, R.R. Landsat cross-calibration based on near simultaneous imaging of common ground targets. Remote Sens. Environ. 2006, 102, 264–270. [Google Scholar] [CrossRef]
  45. Liu, J.J.; Li, Z.; Qiao, Y.L.; Liu, Y.J.; Zhang, Y.X. A new method for cross-calibration of two satellite sensors. Int. J. Remote Sens. 2004, 25, 5267–5281. [Google Scholar] [CrossRef]
  46. Li, Z.W.; Shen, H.F.; Li, H.F.; Xia, G.S.; Gamba, P.; Zhang, L.P. Multi-feature combined cloud and cloud shadow detection in GaoFen-1 wide field of view imagery. Remote Sens. Environ. 2017, 191, 342–358. [Google Scholar] [CrossRef]
  47. Vermote, E.F.; Tanre, D.; Deuze, J.L.; Herman, M.; Morcrette, J.J. Second Simulation of the Satellite Signal in the Solar Spectrum, 6S: An overview. IEEE Trans. Geosci. Remote Sens. 1997, 35, 675–686. [Google Scholar] [CrossRef]
  48. Li, F.Q.; Jupp, D.L.B.; Reddy, S.; Lymburner, L.; Mueller, N.; Tan, P.; Islam, A. An Evaluation of the Use of Atmospheric and BRDF Correction to Standardize Landsat Data. IEEE J. Sel. Top. Appl. Earth Observ. Remote Sens. 2010, 3, 257–270. [Google Scholar] [CrossRef]
  49. Wanner, W.; Li, X.; Strahler, A.H. On the derivation of kernels for kernel-driven models of bidirectional reflectance. J. Geophys. Res.-Atmos. 1995, 100, 21077–21089. [Google Scholar] [CrossRef]
  50. Zhang, H.; Zhao, M.Z.; Jiao, Z.T.; Lian, Y.; Chen, L.; Cui, L.; Zhang, X.N.; Liu, Y.; Dong, Y.D.; Qian, D.; et al. Reflectance Anisotropy from MODIS for Albedo Retrieval from a Single Directional Reflectance. Remote Sens. 2022, 14, 3627. [Google Scholar] [CrossRef]
  51. Chander, G.; Hewison, T.J.; Fox, N.; Wu, X.Q.; Xiong, X.X.; Blackwell, W.J. Overview of Intercalibration of Satellite Instruments. IEEE Trans. Geosci. Remote Sens. 2013, 51, 1056–1080. [Google Scholar] [CrossRef]
  52. Chander, G.; Mishra, N.; Helder, D.L.; Aaron, D.B.; Angal, A.; Choi, T.; Xiong, X.X.; Doelling, D.R. Applications of Spectral Band Adjustment Factors (SBAF) for Cross-Calibration. IEEE Trans. Geosci. Remote Sens. 2013, 51, 1267–1281. [Google Scholar] [CrossRef]
  53. Teillet, P.M.; Fedosejevs, G.; Gauthier, R.P.; O’Neill, N.T.; Thome, K.J.; Biggar, S.F.; Ripley, H.; Meygret, A. A generalized approach to the vicarious calibration of multiple Earth observation sensors using hyperspectral data. Remote Sens. Environ. 2001, 77, 304–327. [Google Scholar] [CrossRef]
  54. Zhao, J.; Li, J.; Mu, X.; Zhang, Z.; Dong, Y.; Wu, S.; Zhong, B.; Liu, Q. Validation and analysis the fractional vegetation cover product from GF-1 satellite data in China. J. Remote Sens. 2023, 27, 689–699. [Google Scholar] [CrossRef]
  55. Zhang, Z.; Li, J.; Liu, Q.; Zhao, J.; Dong, Y.; Li, S.; Wen, Y.; Yu, W. Verification and analysis of high spatial-temporal resolution vegetation index product based on GF-1 satellite data. J. Remote Sens. 2023, 27, 665–676. [Google Scholar] [CrossRef]
  56. Zhang, H.; Li, J.; Liu, Q.; Zhang, Z.; Zhu, X.; Liu, C.; Zhao, J.; Dong, Y.; Xu, B.; Meng, J. GF-1 leaf area index product across China based on three-dimensional stochastic radiation transfer model. J. Remote Sens. 2023, 27, 677–688. [Google Scholar] [CrossRef]
  57. Zhang, F.; Li, J.; Wang, C.; Wang, S. Estimation of water quality parameters of GF-1 WFV in turbid water based on soft classification. J. Remote Sens. 2023, 27, 769–779. [Google Scholar] [CrossRef]
  58. Houborg, R.; McCabe, M.F. Impacts of dust aerosol and adjacency effects on the accuracy of Landsat 8 and RapidEye surface reflectances. Remote Sens. Environ. 2017, 194, 127–145. [Google Scholar] [CrossRef]
  59. Zhong, B.; Chen, W.H.; Wu, S.L.; Hu, L.F.; Luo, X.B.; Liu, Q.H. A Cloud Detection Method Based on Relationship Between Objects of Cloud and Cloud-Shadow for Chinese Moderate to High Resolution Satellite Imagery. IEEE J. Sel. Top. Appl. Earth Observ. Remote Sens. 2017, 10, 4898–4908. [Google Scholar] [CrossRef]
  60. White, M.A.; de Beurs, K.M.; Didan, K.; Inouye, D.W.; Richardson, A.D.; Jensen, O.P.; O’Keefe, J.; Zhang, G.; Nemani, R.R.; van Leeuwen, W.J.D.; et al. Intercomparison, interpretation, and assessment of spring phenology in North America estimated from remote sensing for 1982–2006. Glob. Chang. Biol. 2009, 15, 2335–2359. [Google Scholar] [CrossRef]
  61. Zeng, L.L.; Wardlow, B.D.; Xiang, D.X.; Hu, S.; Li, D.R. A review of vegetation phenological metrics extraction using time-series, multispectral satellite data. Remote Sens. Environ. 2020, 237, 20. [Google Scholar] [CrossRef]
  62. Morgan, B.E.; Chipman, J.W.; Bolger, D.T.; Dietrich, J.T. Spatiotemporal Analysis of Vegetation Cover Change in a Large Ephemeral River: Multi-Sensor Fusion of Unmanned Aerial Vehicle (UAV) and Landsat Imagery. Remote Sens. 2021, 13, 51. [Google Scholar] [CrossRef]
  63. Yang, K.; Pan, A.N.; Yang, Y.; Zhang, S.; Ong, S.H.; Tang, H.L. Remote Sensing Image Registration Using Multiple Image Features. Remote Sens. 2017, 9, 581. [Google Scholar] [CrossRef]
  64. Zavorin, I.; Le Moigne, J. Use of multiresolution wavelet feature pyramids for automatic registration of multisensor imagery. IEEE Trans. Image Process. 2005, 14, 770–782. [Google Scholar] [CrossRef] [PubMed]
Figure 1. Locations of the study areas and the types of surface cover. (a) Area 1 and 2, (b) Area 3 and 4, (c) Area 5 and 6, and (d) Area 7 and 8. Landcover types are derived from MCD12Q1 at a spatial resolution of 500 m and are classified into 17 categories as defined by the International Geosphere Biosphere Programme.
Remotesensing 15 05382 g001
Figure 2. Detailed information on landcover type and distribution for each experimental area. (ah) correspond to Areas 1–8. Data sources, feature classification, legend same as for Figure 1.
Remotesensing 15 05382 g002
Figure 3. GF-1 WFV images of each experimental area, using true color composites. (ah) correspond to Areas 1–8.
Remotesensing 15 05382 g003
Figure 4. GF-1 WFV surface reflectance data processing flows.
Remotesensing 15 05382 g004
Figure 5. Relative spectral response for GF-1 WFV2, Sentinel-2 MSI, Landsat-8 OLI, and MODIS. The shape of the line represents the sensor and the color of the line represents the band. The WFV relative spectral response function was obtained from the CRESDA. The MSI, OLI, and MODIS relative spectral response was obtained from https://sentinel.esa.int/web/sentinel/user-guides/document-library (accessed on 26 September 2023), https://www.usgs.gov/landsat-missions/landsat-satellite-missions (accessed on 26 September 2023), and https://modis.gsfc.nasa.gov/related/ (accessed on 26 September 2023).
Remotesensing 15 05382 g005
Figure 6. GF WFV and other sensors band conversion coefficients: row 1 WFV with MSI, row 2 WFV with OLI, and row 3 WFV with MODIS. The black dashed line is the 1:1 reference line and the red solid line is the regression line of the characteristic reflectance on the different sensors.
Remotesensing 15 05382 g006
Figure 7. Images of the experimental area from different sensors. (a) WFV surface reflectance with 16 m spatial resolution, (b) MSI surface reflectance with 10 m spatial resolution, (c) OLI surface reflectance with 30 m spatial resolution, and (d) MODIS surface reflectance with 500 m spatial resolution.
Remotesensing 15 05382 g007
Figure 8. Scatter plot of MSI and WFV surface reflectance, from left to right, blue, green, red, and NIR bands; the dashed line is the 1:1 reference line, while the solid line represents the regression line between MSI and WFV surface reflectance; the color change in the plot represents the density of the points; for plotting purposes, only 100,000 points have been extracted to be shown, and P stands for precision.
Remotesensing 15 05382 g008
Figure 9. Scatter plot of OLI and WFV surface reflectance, from left to right, blue, green, red, and NIR bands; the dashed line is the 1:1 reference line, while the solid line represents the regression line between OLI and WFV surface reflectance; the color change in the plot represents the density of the points; for plotting purposes, only 100,000 points have been extracted to be shown, and P stands for precision.
Remotesensing 15 05382 g009
Figure 10. Scatter plot of MODIS and WFV surface reflectance, from left to right, blue, green, red, and NIR bands; the dashed line is the 1:1 reference line, while the solid line represents the regression line between MODIS and WFV surface reflectance; the color change in the plot represents the density of the points; and P stands for precision.
Remotesensing 15 05382 g010aRemotesensing 15 05382 g010b
Figure 11. Scatter plot of statistical indicators for the three sensors, with colors representing the eight areas and shapes of the dots representing the different indicators.
Remotesensing 15 05382 g011
Figure 12. Spectral curves of plants in the United States Geological Survey spectral library. Data downloaded from https://crustal.usgs.gov/speclab/QueryAll07a.php (accessed on 26 September 2023).
Remotesensing 15 05382 g012
Figure 13. Images of the Kathmandu region of Nepal: (a) WFV image, (b) WFV and MSI before geometric alignment with MSI in the box, and (c) WFV and MSI after geometric alignment.
Remotesensing 15 05382 g013
Figure 14. Scatterplots before and after geographic alignment. Area 2.a shows the scatterplot of the pre-geographic alignment WFV with MSI along with statistical metrics, and Area 2.b shows the scatterplot of the post-geographic alignment WFV with MSI along with statistical metrics.
Remotesensing 15 05382 g014
Table 1. Surface cover types and corresponding GF-1 WFV imaging dates for each study area.
Area IDCountryLandcover TypeGF-1 WFV Imaging Date
1Nepalgrassland with some mixed evergreen forest27 October 2020
2Nepalimpermeable surface in the central area and forested grassland at the edges30 October 2020
3Azerbaijangrassland19 July 2020
4Azerbaijanagricultural land19 July 2020
5Kenyadominated by sparse shrubs with some grassland17 January 2020
6Kenyabare ground with essentially no vegetation cover17 January 2020
7Sri Lankaforested grassland11 December 2020
8Sri Lankamixed savanna and agricultural land11 December 2020
Table 2. Remote sensing data information.
DataPurpose of the DataSpatial Resolution (m)Source of Data
GF-1 WFVsurface reflectance inversion16CRESDA
MCD19A2Provide atmospheric calibration parameter AOD500GEE
MCD43A1Provide BRDF calibration parameters500GEE
SRTM 1DEM30USGS
Sentinel-2 MSISurface reflectance quality evaluation reference data10GEE
Landsat-8 OLISurface reflectance quality evaluation reference data30GEE
MCD43ASurface reflectance quality evaluation reference data500GEE
Table 3. Acquisition times for WFV, MSI, OLI, and MODIS images.
SensorsWFVMSIOLIMODIS
Area ID
127 October 202025 October 202025 October 202027 October 2020
230 October 20201 November 202020 October 202030 October 2020
319 July 202020 July 202020 July 202019 July 2020
419 July 202017 July 202013 July 202019 July 2020
517 January 202017 January 202017 January 202017 January 2020
617 January 202022 January 202017 January 202017 January 2020
711 December 202011 December 20207 December 202011 December 2020
811 December 202013 December 20207 December 202011 December 2020
Table 4. Summary of statistical indicators. Bolding indicates that the statistical indicator exceeds the standard.
Indicators BiasPrecisionRMSE
Area ID
SensorsMSIOLIMODISMSIOLIMODISMSIOLIMODIS
Band
1Blue/0.0−0.008/0.0170.019/0.0170.021
Green/−0.011−0.008 0.0240.024/0.0260.026
Red/−0.010.002 0.0310.03/0.0320.03
NIR/−0.003−0.014 0.0460.049/0.0460.051
2Blue0.011/−0.0090.022/0.0190.025/0.021
Green−0.003/−0.0040.024/0.0240.024/0.024
Red0.008/0.0060.026/0.0260.027/0.026
NIR0.007/−0.0140.067/0.0490.067/0.051
3Blue−0.0040.005−0.0070.020.0140.0190.0210.0150.02
Green0.013−0.0050.0030.0210.0170.0220.0240.0180.022
Red0.021−0.001−0.0020.0270.0220.0290.0340.0220.029
NIR0.008−0.010.0060.0250.020.0260.0260.0220.026
4Blue//0.019//0.018//0.026
Green//0.015//0.021//0.026
Red//0.003//0.031//0.031
NIR//−0.004//0.038//0.038
5Blue0.0020.002−0.0070.010.0070.0110.010.0070.014
Green0.007−0.0050.0030.0110.0080.0150.0130.0090.016
Red0.0090.004−0.010.0130.010.0190.0160.010.022
NIR−0.012−0.016−0.0030.0150.010.020.0190.0190.02
6Blue0.0090.0050.0040.0180.0130.0220.020.0140.022
Green00.0070.0170.0240.0160.0290.0240.0180.033
Red−0.0010.0020.0020.030.020.0370.030.020.037
NIR−0.001−0.013−0.0010.0180.0130.0250.0180.0180.025
7Blue0.026/0.0070.01/0.0120.028/0.014
Green0.015/0.0080.01/0.0130.018/0.015
Red0.006/−0.0040.01/0.0130.012/0.014
NIR−0.043/−0.0550.033/0.0310.054/0.063
8Blue/0.026−0.004/0.0190.019/0.0320.019
Green/0.0120.01/0.0210.02/0.0240.022
Red/−0.002−0.004/0.0210.021/0.0210.021
NIR/−0.04−0.055/0.0340.037/0.0530.067
Table 5. Statistical indicators before and after geographical alignment. Bolding indicates a higher statistical indicator.
IndicatorsBandBiasPrecisionRMSE
Area ID
Area 2.aBlue−0.010.030.032
Green−0.0030.0330.034
Red0.0080.0380.039
NIR0.0070.0740.074
Area 2.bBlue0.0110.0220.025
Green−0.0030.0240.024
Red0.0080.0260.027
NIR0.0070.0670.067
Disclaimer/Publisher’s Note: The statements, opinions and data contained in all publications are solely those of the individual author(s) and contributor(s) and not of MDPI and/or the editor(s). MDPI and/or the editor(s) disclaim responsibility for any injury to people or property resulting from any ideas, methods, instructions or products referred to in the content.

