
The LPR Instantaneous Centroid Frequency Attribute Based on the 1D Higher-Order Differential Energy Operator
by
 , , ,
, , ,
Xuebing Zhang
1,2 ,
,
Zhengchun Song
1,
Bonan Li
3,
Xuan Feng
1,2,*,
Jiangang Zhou
4,
Yipeng Yu
5 and
Xin Hu
1,5 1
School of Geomatics and Prospecting Engineering, Jilin Jianzhu University, Changchun 130118, China
2
College of Geo-Exploration Science and Technology, Jilin University, Changchun 130026, China
3
College of Transportation Engineering, Nanjing Tech University, Nanjing 211816, China
4
Qingdao Geological Exploration Institute, China Metallurgical Geology Bureau, Weifang 261021, China
5
Jiangxi Transportation Engineering Group Ltd., Nanchang 330038, China
*
Author to whom correspondence should be addressed.
Remote Sens. 2023, 15(22), 5305; https://doi.org/10.3390/rs15225305
Submission received: 20 September 2023
/
Revised: 5 November 2023
/
Accepted: 7 November 2023
/
Published: 9 November 2023
(This article belongs to the Special Issue Ground Penetrating Radar (GPR) Applications in Earth, Moon and Planetary Exploration)
Abstract
:In ground-penetrating radar (GPR) or lunar-penetrating radar (LPR) interpretation, instantaneous attributes (e.g., instantaneous energy and instantaneous frequency) are often utilized for attribute analysis, and they can also be integrated into a new attribute, i.e., the instantaneous centroid frequency. Traditionally, the estimation of instantaneous attributes calls for complex trace analysis or energy operator schemes (e.g., the Teager–Kaiser energy operator, TKEO). In this work, we introduce the 1D higher-order differential energy operator (1D-HODEO) to track instantaneous attributes with better localization. In collocation with the mode decomposition algorithms, the 1D-HODEO performs along each A-scan on the decomposed mode slices to form the final profile of instantaneous centroid frequency by using the piece-wise correlation coefficients. Both a numerical model for simulating two-layer lunar regolith and the LPR Yutu-2 data show that the proposed instantaneous centroid frequency profile on the 1D-HODEO has better resolution, in comparison with that of TKEO and the traditional time-varying centroid frequency. In this work, we present a new approach for extracting instantaneous centroid frequency attributes which provides more comprehensive information in lunar stratigraphic interpretation and LPR attribute analysis.
1. Introduction
On 3 January 2019, Chang’E-4 (CE-4) achieved a successful soft landing on the moon’s far side for the first time, which is significant progress in lunar exploration [1]. Because of its non-destructive capabilities [2], lunar-penetrating radar (LPR) has emerged as one of the most prominent exploration apparatuses for investigating lunar sub-surface structures [3]. The Yutu-2 lunar rover in the CE-4 mission carried two antenna channels (“CH-1” and “CH-2”) at central frequencies of 60 MHz and 500 MHz, respectively. In “CH-1”, there exists strong electromagnetic coupling with the rover body, whereas the high-frequency antenna (“CH-2”) undertook the main interpretation work [4]. The landing site of CE-4 is within the Von Kármán crater in the South Pole–Aitken basin, which is the largest impact structure on the moon, so related research may give evidence for the moon’s early evolution, the nature of impact basins, and their formation and modification processes [5]. In recent literature, some primary interpretation results of lunar stratigraphic architecture have been proposed. The overall terrain of the Von Kármán crater is relatively flat, and its floor was flooded by Imbrian-aged mare basalts [6,7]. The shallow geological units in the CE-4 landing site can be divided into three parts, i.e., a fine-grained regolith layer, the interactive layers of ejecta and local materials, and basalt [8]. In addition, some physical parameters for each geological unit have been estimated, such as average wave velocity, average density, and the loss tangent at different depths [4,6].
In ground-penetrating radar (GPR) interpretation, instantaneous attributes (e.g., instantaneous energy and instantaneous frequency) are often utilized for attribute analysis [2]. They can also be used for the delineation of lunar structures. For instance, the instantaneous energy profile can highlight the internal interface of the regolith layers more intuitively [9]. Generally, the calculation of instantaneous attributes calls for either complex trace analysis [10,11] or the differential energy operator (DEO). The latter scheme is known for its superb localization property. For instance, the Teager–Kaiser energy operator (TKEO) is the simplest form of DEO [8], and it can track the envelope by only employing three sample points. This is because the DEO calculation only relies on differentiation without involving any integral transforms. According to the different forms of DEO, the corresponding discrete-time energy separation algorithms (DESAs) are proposed for estimating the instantaneous envelope and instantaneous frequency [12,13].
The higher-order generalization of the TKEO was developed for energy measurements and termed the higher-order differential energy operator (1D-HODEO) [12]. It should be noted that either GPR or LPR A-scans are fundamentally non-stationary due to wave attenuation, and both the DEO-based schemes and conventional complex trace analysis only perform well on the quasi-harmonic or mono-component signals. Therefore, the above methods are always collocated with the mode decomposition algorithms (e.g., the empirical mode decomposition, EMD [14,15]) to generate quasi-harmonic sub-components (i.e., intrinsic mode functions, IMFs). However, some problems persist. For example, most of the EMD-like sifting process is adaptive, which means the number of IMFs and their bandwidth are not fixed so that some underground structures (e.g., layers, grain, or cracks) may be separated into different IMF-slices [16] as well as the corresponding instantaneous attribute profiles, which affect LPR instantaneous attribute analysis dramatically. To handle this problem, it is indicated that instantaneous frequency and instantaneous energy can be integrated into a new attribute, i.e., the instantaneous centroid frequency [17]. It is essentially the instantaneous form of the classic time-varying spectral centroid frequency [18] and can be interpreted as the approximation of the time-varying central frequency (or the most energetic frequency) of wavelets [19].
In this article, we use the improved complete ensemble empirical mode decomposition with adaptive noise (ICCEMDAN) to generate the IMF-slices, and the 1D-HODEO is introduced to derive the instantaneous attributes which are more localized and generate the instantaneous centroid frequency for each A-scan. Then, the final instantaneous centroid frequency profile can be constructed via the weighted correlation coefficients. The proposed scheme is evaluated using a benchmark test, FDTD Model data, and LPR Yutu-2 data. The proposed instantaneous centroid frequency based on the 1D-HODEO shows good performance for estimating instantaneous attributes and locating the layers and grain, which may benefit lunar regolith interpretation.
2. Methods
2.1. The Teager–Kaiser Energy Operator
The Teager–Kaiser energy operator (i.e., TKEO) of a continuous time series is defined as follows [20]:
After defining the sampling interval and the corresponding discrete series , the discrete version of the above TKEO form can be derived by using the backward differences , which yields
Assuming the input signal is a cosine () with constant amplitude and angular frequency , then , and the TKEO results can be derived as follows [21]:
and
Likewise, the narrow-bandwidth AM-FM signal proves to have similar results. Then, the discrete form of the instantaneous frequency in Hz can be estimated as
which is referred to as the discrete energy separation algorithm (“DESA-la”) [12]. Here, “a” represents “asymmetric”. The instantaneous energy (or envelope) is derived as
There are also some alternatives of Equations (5) and (6) when other discrete approximations of derivatives are employed, e.g., “DESA-1” and “DESA-2”, and these methods show similar results [22].
2.2. The Higher-Order Differential Energy Operator (1D-HODEO)
The kth-order continuous differential energy operator () is defined as follows:
which is also referred to as the higher-order DEO. It should be noted here that the second-order DEO (k = 2) corresponds to the TKEO (see Equation (1), in Section 2.1). The discrete form of the kth-order DEO is derived as
Like Equation (3), applying to the discrete cosines yields
For example, the discrete form of the third- and fourth-order DEO can be represented as
and
The time (or sample) alignment of takes a moving window of [n − 1, n + 2], which is asymmetry. To handle this misalignment, one can take once again and average them to generate the symmetric with a 5-point moving window [n − 2, n + 2] as follows:
The above is also termed as the “5-point modified Prony estimator” [23]. By using the discrete version of and , the corresponding DESA scheme for tracking the instantaneous frequency and instantaneous envelope can be derived as
and
It should be noted that the deduction of the DESA algorithms in the above sections requires the input to be closely stationary (say, the operator of TKEO and HODEO only performs well on the quasi-harmonic or mono-component frequency signals whose bandwidth is limited or narrow); this is why the DESA schemes are always used in conjunction with the IMFs via mode decomposition algorithms (like EMD, ICCEMDAN, etc.), and the results also depend on the results of mode decomposition.
2.3. Instantaneous Centroid Frequency Based on 1D-HODEO
The common frequency centroid is proposed as the time-varying frequency attribute which is energy-weighted [18,24]:
where represents frequency anddenotes the time–frequency distribution (e.g., S-transform). By employing ICEEMDAN trace by trace, each A-scan is decomposed intoIMFs. Based on Equations (13) and (14), the instantaneous energy and instantaneous frequency of theth IMF are derived based on the 1D-HODEO. Then, the discrete form of the instantaneous centroid frequency of theth IMFis given by [17,25]
To enhance the effectiveness of the instantaneous centroid frequency by suppressing noise, the weighted correlation coefficients between each IMF and the input signal can be used here. This implies that
where denotes the correlation coefficient between the th IMF and the input signal. In this work, we referred to the improved form as the instantaneous centroid frequency based on the 1D-HODEO, and its discrete representation can be defined as follows:
3. Results
3.1. Benchmark Test (Chirp)
We first test the 1D-HODEO on a simple benchmark from [26], see Figure 1a. It is a sweep-frequency cosine (chirp) around 30 Hz with no amplitude modulation (i.e., instantaneous amplitude = 1), and the ground truth instantaneous frequency is shown in Figure 1b. Based on the 1D-HODEO, the instantaneous amplitude and instantaneous frequency are well estimated, see Figure 2e,f. We also compared the results with the instantaneous attributes derived via classic complex trace analysis and TKEO in Figure 2. In contrast, the instantaneous amplitude (Figure 2a) and instantaneous frequency (Figure 2b) based on classic complex trace analysis show strong end effects. In Figure 2a, the more the instantaneous amplitude moves towards both ends, the more intense the amplitude modulation is, and compared with the ground truth, the instantaneous frequency in Figure 2b shows an obvious downward shift at both ends (see the arrows). By using the DESA-2 algorithm of TKEO, the derived instantaneous amplitude (Figure 2c) also shows obvious amplitude modulation, and there are obvious trembles in the estimated instantaneous frequency (marked by the arrows).
In this benchmark test, the introduced 1D-HODEO indicates a better performance in the estimation of instantaneous attributes than in the other two methods. The proposed instantaneous centroid frequency relies on the accuracy of estimation of instantaneous frequency and instantaneous amplitude, and the actual applications are detailed in the following parts.
3.2. FDTD Model Test
In this part, a two-layer lunar regolith model is applied to test the proposed 1D-HODEO-based instantaneous centroid frequency attribute. The size of the numerical model is 20 m 10 m. Based on stochastic media theory [27,28], the shallow lunar regolith (first layer, 0~4.5 m) and the bedrock (bottom layer, 4.5~10 m) are modeled and a set of grains is embedded randomly. The corresponding relative permittivity (i.e., dielectric constant) is illustrated in Figure 3, and the detailed electrical parameters of the constitutive components involved in the numerical model are shown in Table 1.
The parameters for the finite-difference time-domain (FDTD) simulation are further defined. We use a Ricker source to simulate the transmitting antenna and the center frequency fc = 500 MHz. The transmitting and receiving antennas are offset by 0.1 m from each other, and the B-scan is performed along the interface between the vacuum layer and lunar regolith with a starting position denoted by the red and yellow triangles in Figure 3. The spatial increment of the antennas’ positions along the profile (i.e., the trace spacing) is 0.1 m, and the time window is 100 ns. By using the FDTD simulation [29], the derived LPR B-scan is shown in Figure 4a. The B-scan after basic GPR signal processing workflows (e.g., background removal, band-pass filter, and gain) is shown in Figure 4b, where the surface reflections and the hyperbolas caused by the grains are preliminarily visible.
Using complex trace analysis, the general instantaneous attribute profiles are derived as shown in Figure 5. In the normalized instantaneous amplitude profile (i.e., Figure 5b), the shallow reflections and scattering can be seen more clearly, but the rapid attenuation of energy components makes it difficult to identify the interface between the regolith and the bedrock. Figure 5a is the instantaneous frequency profile, where most of the hyperbolic reflections can be roughly identified. However, there exist negative frequency components which have no “physical meaning”.
We decompose the B-scan data to derive the IMF-slices for matching the requirements of performing the energy operators (e.g., the narrow-bandwidth IMFs). In this example, we perform the ICCEMDAN algorithm, and Figure 6a–h are the first to eighth modes of IMF-slices. The first four modes of IMF-slices (i.e., Figure 6a–d) depict the high-frequency features of the radargram, e.g., the outline of hyperbolic reflections and the upper surface of the lunar regolith. The rest of the IMF-slices correspond to the low-frequency features and background. Based on the decomposition, we compute the instantaneous centroid frequency for each IMF using the 1D-HODEO (see Equations (13), (14), and (16)) and derive the corresponding attribute profile (Equations (17) and (18)) as shown in Figure 7c. According to the profile, one can identify the reflections and the upper interface clearly, and the interface between the regolith and the bedrock in the lower part (≥60 ns) is also revealed. For comparison, we also show the time-varying centroid frequency profile based on the S-transform and the instantaneous centroid frequency profile based on the 1D-TKEO, see Figure 7b,c. In Figure 7b, the resolution is lower than in the proposed 1D-HODEO scheme, and the lower interface is not visible. Because the time window in the S-transform is less localized than that of the energy operators, the resolution in Figure 7a is the lowest, where the interfaces and the reflections are hard to recognize. Therefore, it is concluded that the instantaneous centroid frequency profile based on the proposed 1D-HODEO scheme shows better performance for locating the layers and grain in lunar regolith interpretation.
3.3. LPR Data Results
In this part, we select the high-frequency channel of LPR data (CH-2, 500 MHz) of the first lunar day (see Figure 8) to further evaluate the application of the proposed 1D-HODEO-based instantaneous centroid frequency attribute. The LPR data were proceeded by basic signal processing workflows (e.g., background removal, band-pass filter, and gain). In the previous research literature, the CH-2 LPR data were initially interpreted, and they are mainly divided into three parts, i.e., the surface regolith layer (about 20–200 ns), the alternating layers of ejecta and local materials (about 200–500 ns), and the basalt bedrock (≥500 ns) [8].
The profiles of instantaneous frequency and instantaneous amplitude are shown in Figure 9a,b. Due to the complex composition of the surface materials and the different-sized ejecta, though the alternating layers in the former profile (Figure 9a) are highlighted, the variation in energy and frequency components with depth is not obvious. In particular, the latter profile (Figure 9b) is plagued by low resolution so that only the shallow part of the lunar soil is visible.
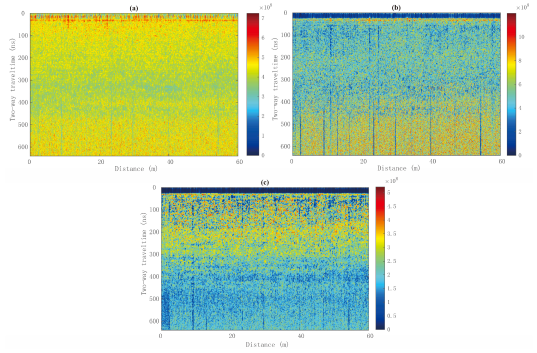
We derive the classic time-varying centroid frequency based on the S-transform, the instantaneous centroid based on the 1D-TKEO, and the proposed 1D-HODEO scheme, respectively, see Figure 10. In Figure 10a, the obvious end-point effects make the interpretation difficult. We remark here the reason for the interference in the shallow and bottom is the same as that of the FDTD Model test (see Figure 7a), i.e., the low localization of the time window used in traditional time–frequency decomposition algorithms (e.g., the S-transform and the wavelet transform). In Figure 10b, the variation in instantaneous centroid frequency is ambiguous due to the high-frequency interference (much more than 500 MHz) at the bottom.
Based on the proposed 1D-HODEO scheme, the derived instantaneous centroid frequency (Figure 10c) reveals the lunar stratigraphic architectures with no interference in both ends, and one can clearly observe the centroid frequency of the electromagnetic wave attenuates with depth. In the shallow part, the instantaneous centroid frequency maintains around 400–500 MHz, with no prominent decay. When the radar wave propagates into the alternating layers of ejecta and local materials, there is a significant decrease in the centroid frequency, which reflects a shift in central frequency from high frequency to low frequency. In addition, due to the different attenuation features, we can identify the ejecta and small craters from the alternating layers. There is no obvious interference in the bottom, so the upper surface of the bedrock can be observed. We concluded that the proposed instantaneous centroid frequency profile based on the 1D-HODEO scheme shows better resolution, which is beneficial to lunar stratigraphic interpretation and attribute analysis of LPR data.
4. Discussion
In practical workflows for GPR attribute analysis, the proposed 1D-HODEO scheme can be used to generate not only conventional instantaneous attributes but also the instantaneous centroid frequency profile. In the instantaneous centroid frequency, two important instantaneous attributes (the instantaneous amplitude and the frequency) are well integrated to further derive the time-varying centroid frequency. The original centroid frequency is defined as the energy-weighted frequency, and its computation is based on the Hilbert transform. In contrast, the TKEO-based scheme and the proposed scheme only rely on differentiation without involving any integral transforms, so they can track instantaneous attributes using fewer adjacent sampling points. The TKEO-based scheme and the proposed scheme employ a three-point moving window [n − 1, n + 1] and a five-point moving window [n − 2, n + 2], respectively (see Equations (2) and (12)). The results in Section 2.1 proved the proposed scheme can provide more stable and localized results.
From the perspective of “wavelet”, the instantaneous centroid frequency can be interpreted as an approximation of the changes in the central frequency (or the most energetic frequency) of the time-varying wavelets [30]. In an attribute profile of instantaneous centroid frequency, it is visible that the central frequency has obvious shifts to low frequency which can be viewed as an indicator of electromagnetic attenuation and dispersion. As for the LPR data, the instantaneous centroid frequency profile can be used to not only interpret lunar stratigraphic structures but also identify the ejecta and small craters from the alternating layers due to their different attenuation features. In future work, the instantaneous centroid frequency profile can be used to measure the quality factor Q* [31] of lunar soil or observe the possible lava tubes on the moon.
However, the differentiation-based energy operator including the TKEO and the HODEO only performs well on the quasi-harmonic signal whose bandwidth is limited, which matches the definition of an IMF. If the EMD-like algorithms do not separate the modes well (e.g., there exists the mode-mixing phenomenon), the derived instantaneous attributes may cause a lot of interference and then affect the final instantaneous centroid frequency. So, the performance of the proposed scheme still relies on the results of the mode decomposition in actual applications.
5. Conclusions
In this article, we review the evolution of one-dimensional energy operators from the 1D-TKEO to its high-order generalization (1D-HODEO), and the corresponding DESA schemes for estimating instantaneous attributes are also discussed. We evaluate the 1D-HODEO by employing a simple benchmark test and show its effectiveness on instantaneous attribute estimation. Then, we integrate the derived instantaneous amplitude and the instantaneous frequency using the 1D-HODEO into a new attribute of instantaneous centroid frequency. We illustrate the effectiveness of the proposed attribute via a simulated B-scan for a two-layer lunar regolith model and the LPR Yutu-2 data. From the results, the target body and structures in the lunar regolith (reflections, interface, grains, etc.) can be well revealed. The results using the proposed scheme show better localization and higher resolution in comparison with the TKEO-based instantaneous centroid frequency and the traditional time-varying centroid frequency. These are beneficial to lunar stratigraphic interpretation and attribute analysis of LPR data.
Aside from lunar stratigraphic interpretation, the proposed instantaneous centroid frequency attribute based on the 1D-HODEO can also reveal wave attenuation in LPR data. From the LPR data results in Section 2.3, we can observe that there exists an obvious shift from high frequency to low frequency in the central frequency of the electromagnetic wave. The proposed scheme can be used to measure the quality factor Q* of electromagnetic waves in the GPR or LPR attenuation imaging. However, it should be noted that the performance of the proposed scheme still relies on the results of the mode decomposition in actual applications.
In future research, the results and corresponding implications of this work can be researched in a broader context. For example, the proposed scheme can be applied to structure monitoring and non-destructive testing (NDT) in civil engineering. It also can be applied to other fields, such as environmental monitoring, archaeological and military exploration, etc., and future research interests can also be highlighted.
Author Contributions
Conceptualization, X.Z. and X.F.; methodology and scripts coding, X.Z.; validation, J.Z., Y.Y. and B.L.; formal analysis, X.Z. and X.F.; investigation, X.H.; resources and data curation, X.Z.; writing—original draft preparation, X.Z. and B.L.; writing—review and editing, X.Z. and Z.S.; visualization, X.Z.; supervision and project administration, X.Z. and X.F.; funding acquisition, X.Z. and B.L. All authors have read and agreed to the published version of the manuscript.
Funding
This research was funded by the National Natural Science Foundation of China (Grant No. 42004129), National Key Research and Development Program of China (No. 2022YFC3003402) and the Scientific Research Programs granted by the Jiangsu Education Department (Grant No. 20KJB170005).
Acknowledgments
The authors would like to thank Haoqiu Zhou (Jilin University) and Yuan Chai (Jilin Jianzhu University) for inspiring discussions. Additionally, we thank four anonymous reviewers for the time and effort in revision.
Conflicts of Interest
The authors declare no conflict of interest. Yipeng Yu and Xin Hu promise to avoid conflicts of interest (even superficial conflicts) with the company (Jiangxi Transportation Engi-neering Group Ltd), its shareholders and its customers.
References
- Dong, Z.; Feng, X.; Zhou, H.; Liu, C.; Liang, W. Properties Analysis of Lunar Regolith at Chang’E-4 Landing Site Based on 3D Velocity Spectrum of Lunar Penetrating Radar. Remote Sens. 2020, 12, 629. [Google Scholar] [CrossRef]
- Liu, Z.; Yeoh, J.K.; Gu, X.; Dong, Q.; Chen, Y.; Wu, W.; Wang, L.; Wang, D. Automatic pixel-level detection of vertical cracks in asphalt pavement based on GPR investigation and improved mask R-CNN. Autom. Constr. 2023, 146, 104689. [Google Scholar] [CrossRef]
- Li, C.; Xing, S.; Lauro, S.E.; Su, Y.; Dai, S.; Feng, J.; Cosciotti, B.; Di Paolo, F.; Mattei, E.; Xiao, Y.; et al. Pitfalls in GPR Data Interpretation: False Reflectors Detected in Lunar Radar Cross Sections by Chang’e-3. IEEE T. Geosci. Remote 2018, 56, 1325–1335. [Google Scholar] [CrossRef]
- Li, C.; Su, Y.; Pettinelli, E.; Xing, S.; Ding, C.; Liu, J.; Ren, X.; Lauro, S.E.; Soldovieri, F.; Zeng, X.; et al. The Moon’s farside shallow subsurface structure unveiled by Chang’E-4 Lunar Penetrating Radar. Sci. Adv. 2020, 6, eaay6898. [Google Scholar] [CrossRef] [PubMed]
- Zhou, H.; Feng, X.; Ding, C.; Dong, Z.; Liu, C.; Zhang, Y.; Meng, Z. Yutu-2 Radar Sounding Evidence of a Buried Crater at Chang’E-4 Landing Site. IEEE T. Geosci. Remote 2021, 60, 1–19. [Google Scholar] [CrossRef]
- Lai, J.; Xu, Y.; Zhang, X.; Xiao, L.; Yan, Q.; Meng, X.; Zhou, B.; Dong, Z.; Zhao, D. Comparison of Dielectric Properties and Structure of Lunar Regolith at Chang’e-3 and Chang’e-4 Landing Sites Revealed by Ground-Penetrating Radar. Geophys. Res. Lett. 2019, 46, 12783–12793. [Google Scholar] [CrossRef]
- Zhang, L.; Zeng, Z.; Li, J.; Ling, H.; Huo, h.; Zhang, J.; Huai, N. A Story of Regolith Told by Lunar Penetrating Radar. Icarus 2018, 321, 148–160. [Google Scholar] [CrossRef]
- Zhang, L.; Li, J.; Zeng, Z.; Xu, Y.; Liu, C.; Chen, S. Stratigraphy of the Von Kármán Crater Based on Chang’E-4 Lunar Penetrating Radar Data. Geophys. Res. Lett. 2020, 47, e2020GL088680. [Google Scholar] [CrossRef]
- Cheng, S.; Zhang, L.; Jia, Z.; Zhao, X.; Lu, Q.; Liu, S. Stratification of Lunar Regolith Based on Attribute Analysis. IOP Conf. Ser. Earth Environ. Sci. 2021, 660, 012031. [Google Scholar] [CrossRef]
- Yurasov, N.I. Energy Level Quantization in the 1D Quantum Well in Case of Instantaneous Stationary State with the Non-Relativistic Wall and Particle Motion. Her. Bauman Mosc. State Tech. Univ. 2023, 4, 108–122. [Google Scholar] [CrossRef]
- Barnes, A. The calculation of instantaneous frequency and instantaneous bandwidth. Geophysics 1992, 57, 1520–1524. [Google Scholar] [CrossRef]
- Maragos, P.; Kaiser, J.F.; Quatieri, T.F. Energy separation in signal modulations with application to speech analysis. IEEE Trans. Signal Process. 1993, 41, 3024–3051. [Google Scholar] [CrossRef]
- Maragos, P.; Potamianos, A. Higher order differential energy operators. IEEE Signal Process. Lett. 1995, 2, 152–154. [Google Scholar] [CrossRef]
- Huang, N.E.; Shen, Z.; Long, S.R.; Wu, M.C.; Shih, H.H.; Zheng, Q.; Yen, N.-C.; Tung, C.C.; Liu, H.H. The empirical mode decomposition and the Hilbert spectrum for nonlinear and non-stationary time series analysis. Proc. R. Soc. London. Ser. A Math. Phys. Eng. Sci. 1998, 454, 903–995. [Google Scholar] [CrossRef]
- Colominas, M.A.; Schlotthauer, G.; Torres, M.E. Improved complete ensemble EMD: A suitable tool for biomedical signal processing. Biomed. Signal Process. Control 2014, 14, 19–29. [Google Scholar] [CrossRef]
- Zhang, X.; Nilot, E.; Feng, X.; Ren, Q.; Zhang, Z. IMF-Slices for GPR Data Processing Using Variational Mode Decomposition Method. Remote Sens. 2018, 10, 476. [Google Scholar] [CrossRef]
- Xue, Y.; Du, H.; Cao, J.; Jin, D.; Chen, W.; Zhou, J. Application of a Variational Mode Decomposition-Based Instantaneous Centroid Estimation Method to a Carbonate Reservoir in China. IEEE Geosci. Remote Sens. Lett. 2018, 15, 364–368. [Google Scholar] [CrossRef]
- Quan, Y.; Harrist, J.M. Seismic attenuation tomography using the frequency shift method. Geophysics 1997, 62, 895–905. [Google Scholar] [CrossRef]
- Liu, G.; Fomel, S.; Chen, X. Time-frequency analysis of seismic data using local attributes. Geophysics 2011, 76, P23–P34. [Google Scholar] [CrossRef]
- Boudraa, A.O.; Salzenstein, F.; Cexus, J.C. Two-dimensional continuous higher-order energy operators. Opt. Eng. 2005, 44, 117001. [Google Scholar]
- Kaiser, J.F. On a simple algorithm to calculate the ‘energy’ of a signal. In Proceedings of the International Conference on Acoustics, Speech, and Signal Processing, Albuquerque, NM, USA, 3–6 April 1990; pp. 381–384. [Google Scholar]
- Bouchikhi, A.; Boudraa, A.-O. Multicomponent AM–FM signals analysis based on EMD–B-splines ESA. Signal Process. 2012, 92, 2214–2228. [Google Scholar] [CrossRef]
- Fertig, L.B.; McClellan, J.H. Instantaneous frequency estimation using linear prediction with comparisons to the DESAs. IEEE Signal Process Lett. 1996, 3, 54–56. [Google Scholar] [CrossRef]
- Liu, L.; Lane, J.W.; Quan, Y. Radar attenuation tomography using the centroid frequency downshift method. J. Appl. Geophys. 1998, 40, 105–116. [Google Scholar] [CrossRef]
- Zhang, X.; Hu, X.; Qiu, Z.; Feng, X.; Qin, Y. Extraction of the GPR instantaneous centroid frequency based on the envelope derivative operator and ICEEMDAN. Remote Sens. Lett. 2023, 14, 469–478. [Google Scholar] [CrossRef]
- Hou, T.Y.; Shi, Z. Data-driven time–frequency analysis. Appl. Comput. Harmon. Anal. 2013, 35, 284–308. [Google Scholar] [CrossRef]
- Zeng, Z.-F.; Chen, X.; Li, J.; Chen, L.-N.; Lu, Q.; Liu, F.-S. Recursive impedance inversion of ground-penetrating radar data in stochastic media. Appl. Geophys. 2015, 12, 615–625. [Google Scholar] [CrossRef]
- Li, J.; Zeng, Z.; Liu, C.; Huai, N.; Wang, K. A Study on Lunar Regolith Quantitative Random Model and Lunar Penetrating Radar Parameter Inversion. IEEE Geosci. Remote Sens. Lett. 2017, 14, 1953–1957. [Google Scholar] [CrossRef]
- Irving, J.; Knight, R. Numerical modeling of ground-penetrating radar in 2-D using MATLAB. Comput. Geosci. 2006, 32, 1247–1258. [Google Scholar] [CrossRef]
- Zhang, X.; Liu, C.; Feng, X.; Li, B.; Li, K.; You, Q. The attenuated Ricker wavelet basis for seismic trace decomposition and attenuation analysis. Geophys. Prospect. 2020, 68, 371–381. [Google Scholar] [CrossRef]
- Irving, J.D.; Knight, R.J. Removal of wavelet dispersion from ground-penetrating radar data. Geophysics 2003, 68, 960–970. [Google Scholar] [CrossRef]
Figure 1.
The benchmark test. (a) The sweep-frequency cosine (chirp) with no amplitude modulation, (b) the corresponding instantaneous frequency (ground truth).
Figure 1.
The benchmark test. (a) The sweep-frequency cosine (chirp) with no amplitude modulation, (b) the corresponding instantaneous frequency (ground truth).
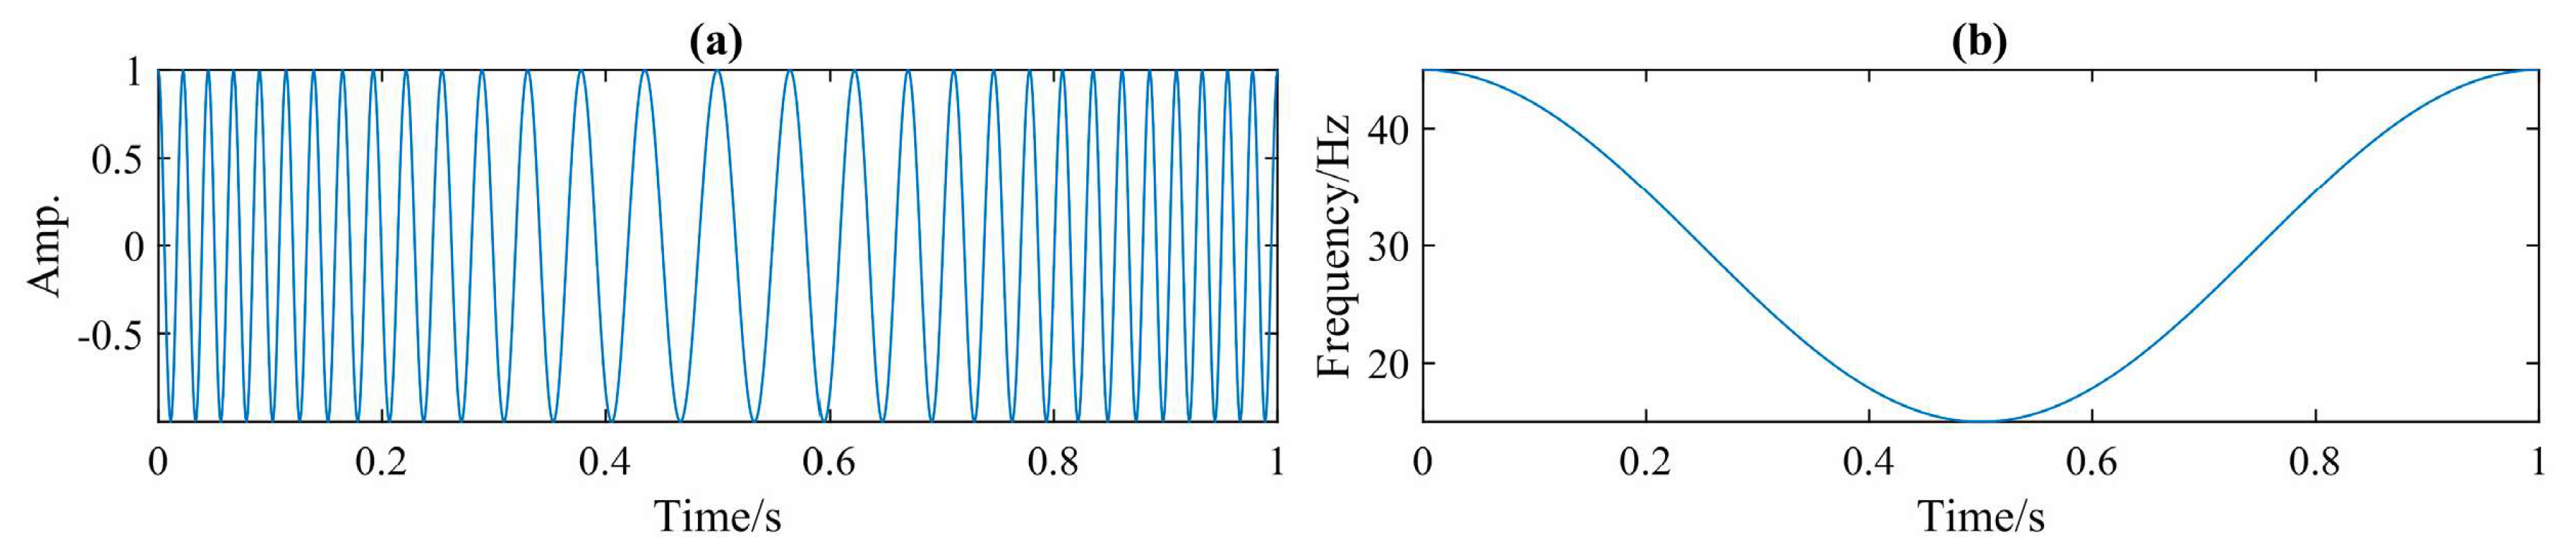
Figure 2.
The instantaneous attributes estimation. The instantaneous amplitude (a) and instantaneous frequency (b) based on classic complex trace analysis. The instantaneous amplitude (c) and instantaneous frequency (d) based on the TKEO. The instantaneous amplitude (e) and instantaneous frequency (f) based on the 1D-HODEO.
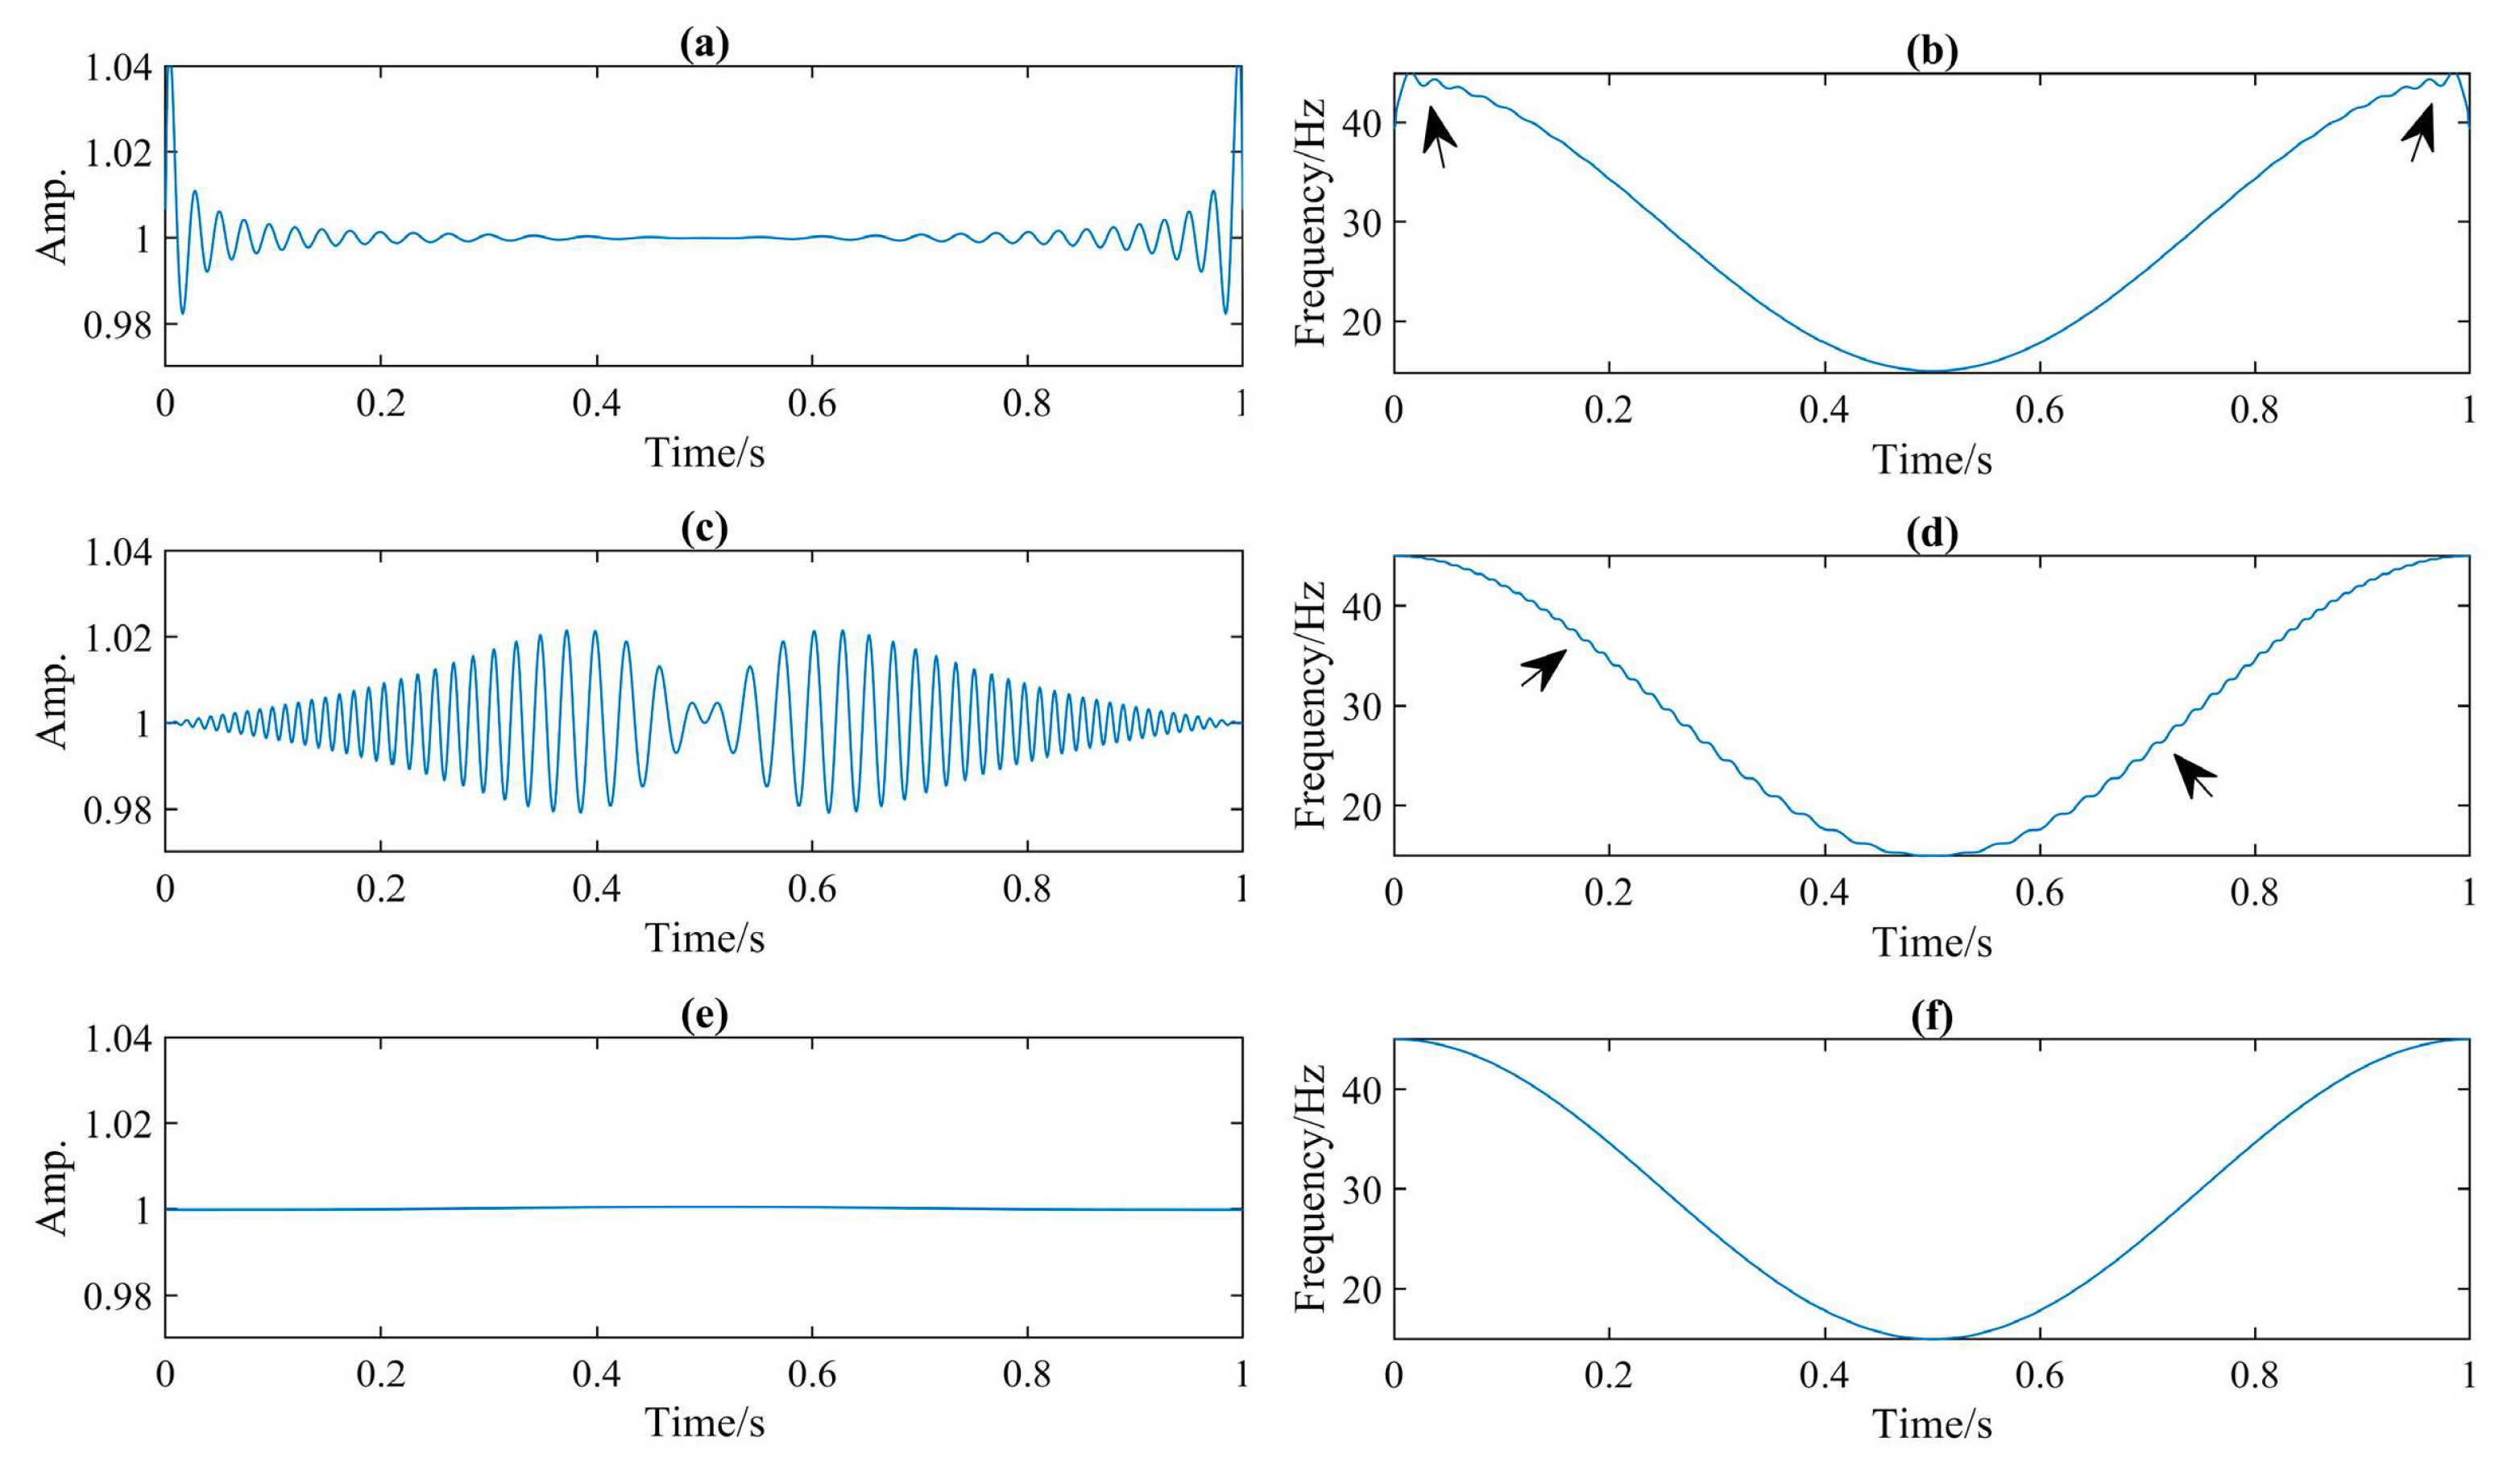
Figure 3.
The relative permittivity model of the lunar regolith. The red and yellow triangle denote the transmitting and receiving antenna, and the orange squares denote the grains embedded randomly in the first layer.
Figure 3.
The relative permittivity model of the lunar regolith. The red and yellow triangle denote the transmitting and receiving antenna, and the orange squares denote the grains embedded randomly in the first layer.
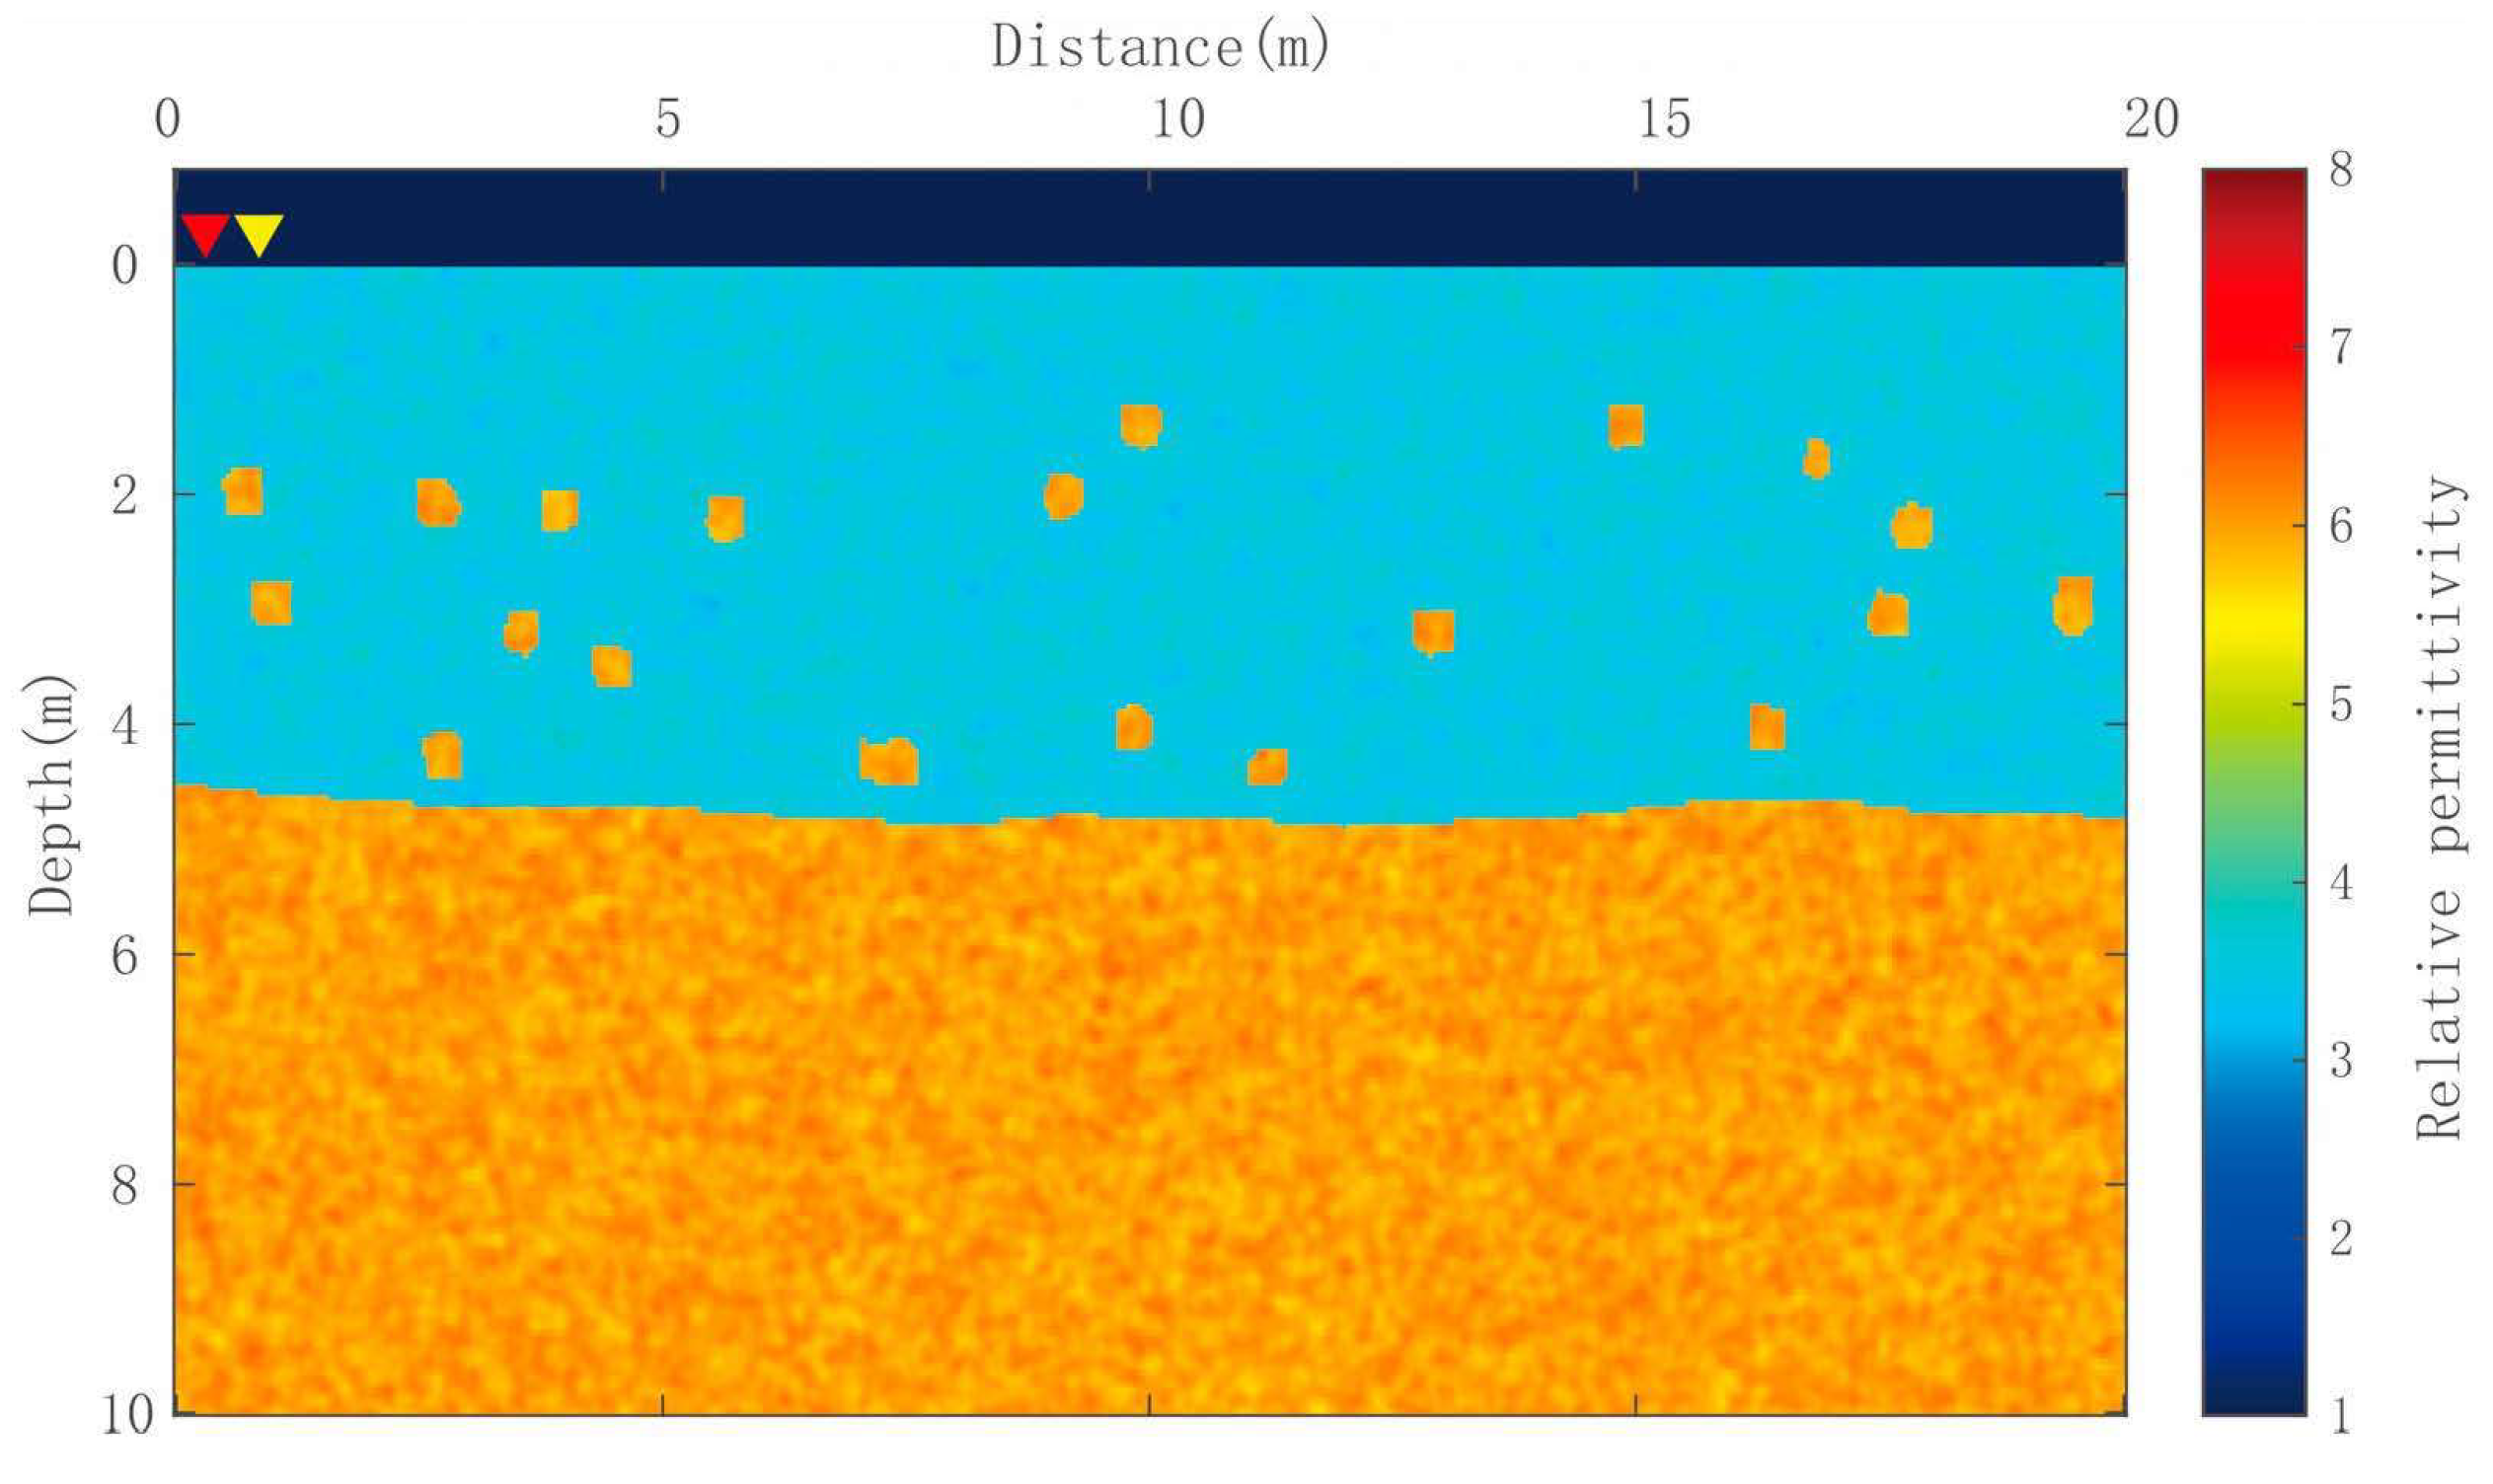
Figure 4.
The simulated LPR radargram. (a) The initial B-scan data using FDTD simulation; (b) the B-scan after basic signal processing (e.g., background removal, band-pass filter, and gain).
Figure 4.
The simulated LPR radargram. (a) The initial B-scan data using FDTD simulation; (b) the B-scan after basic signal processing (e.g., background removal, band-pass filter, and gain).
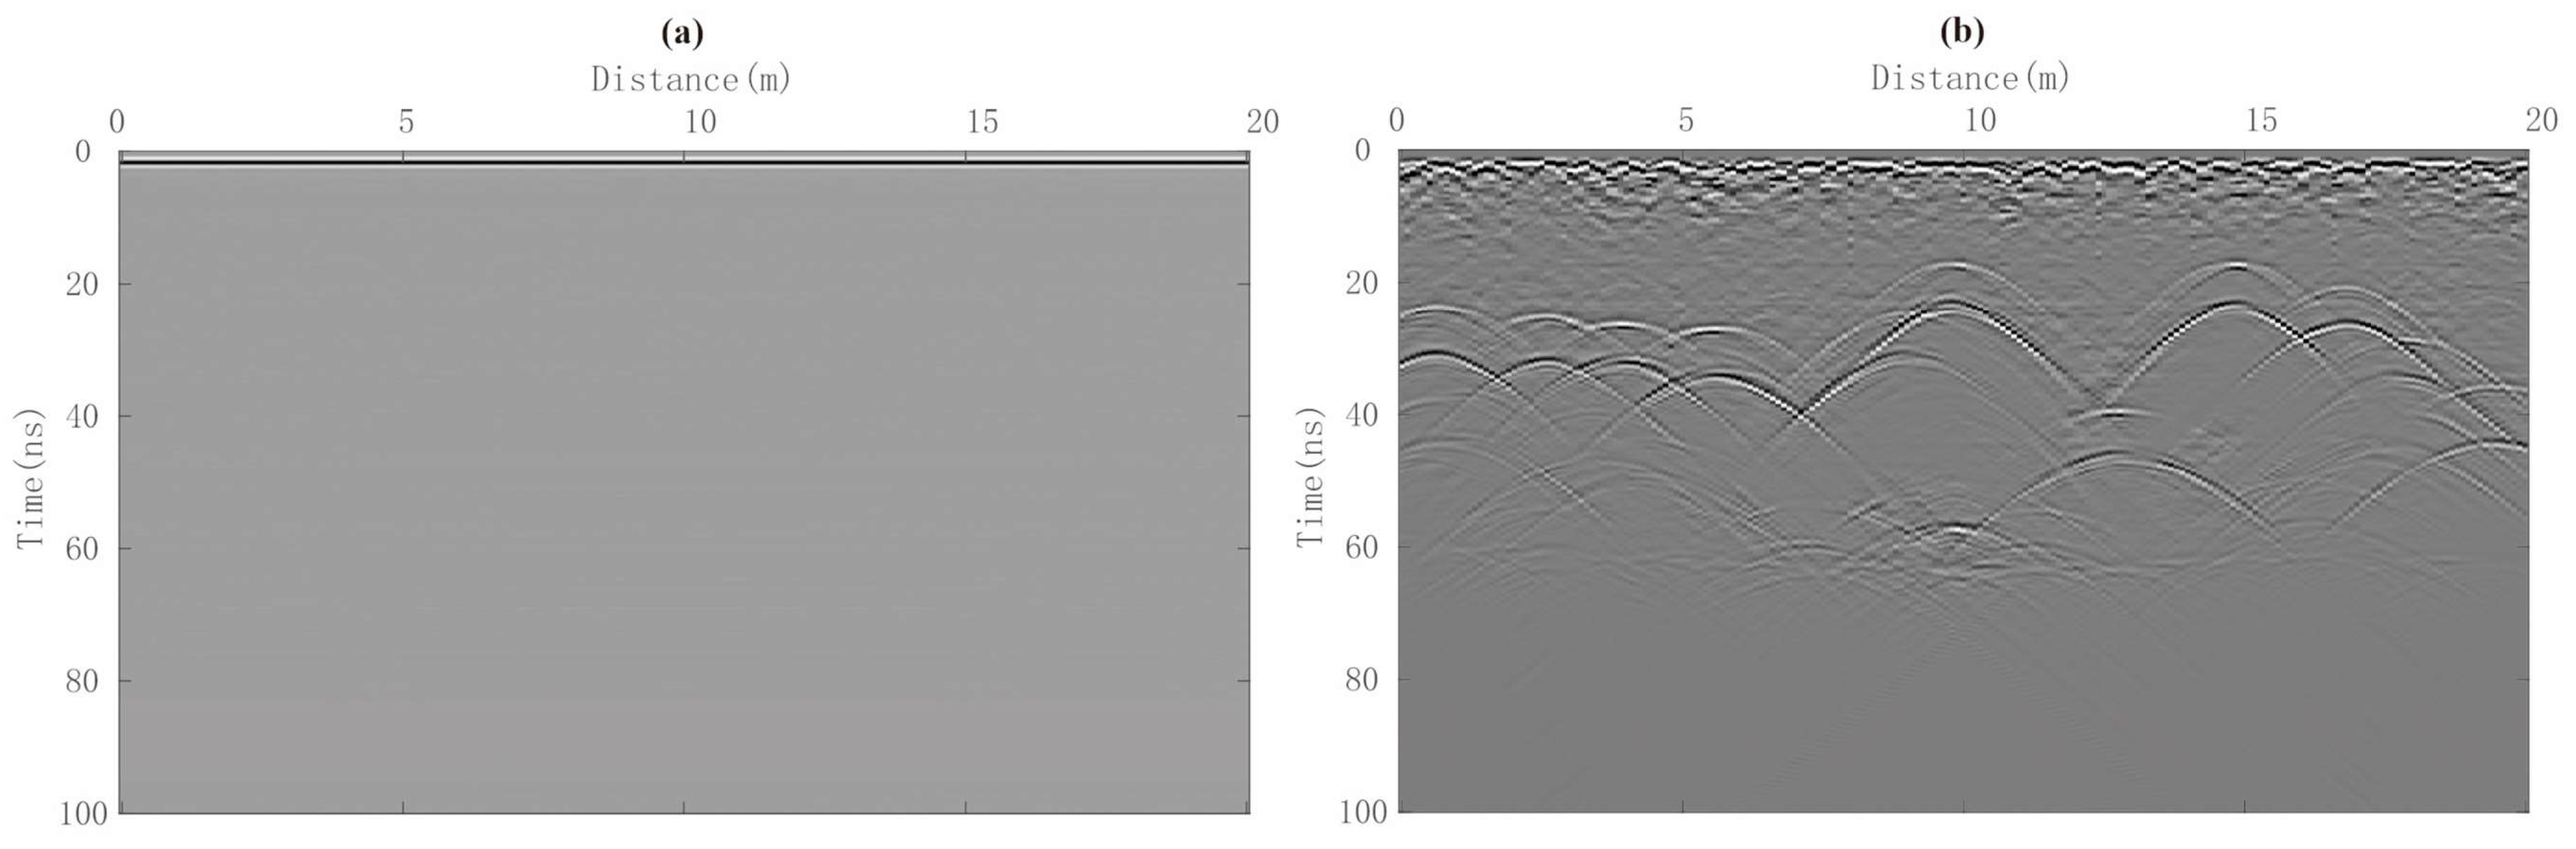
Figure 5.
General instantaneous attribute profiles. Instantaneous amplitude (a) and instantaneous frequency (b).
Figure 5.
General instantaneous attribute profiles. Instantaneous amplitude (a) and instantaneous frequency (b).
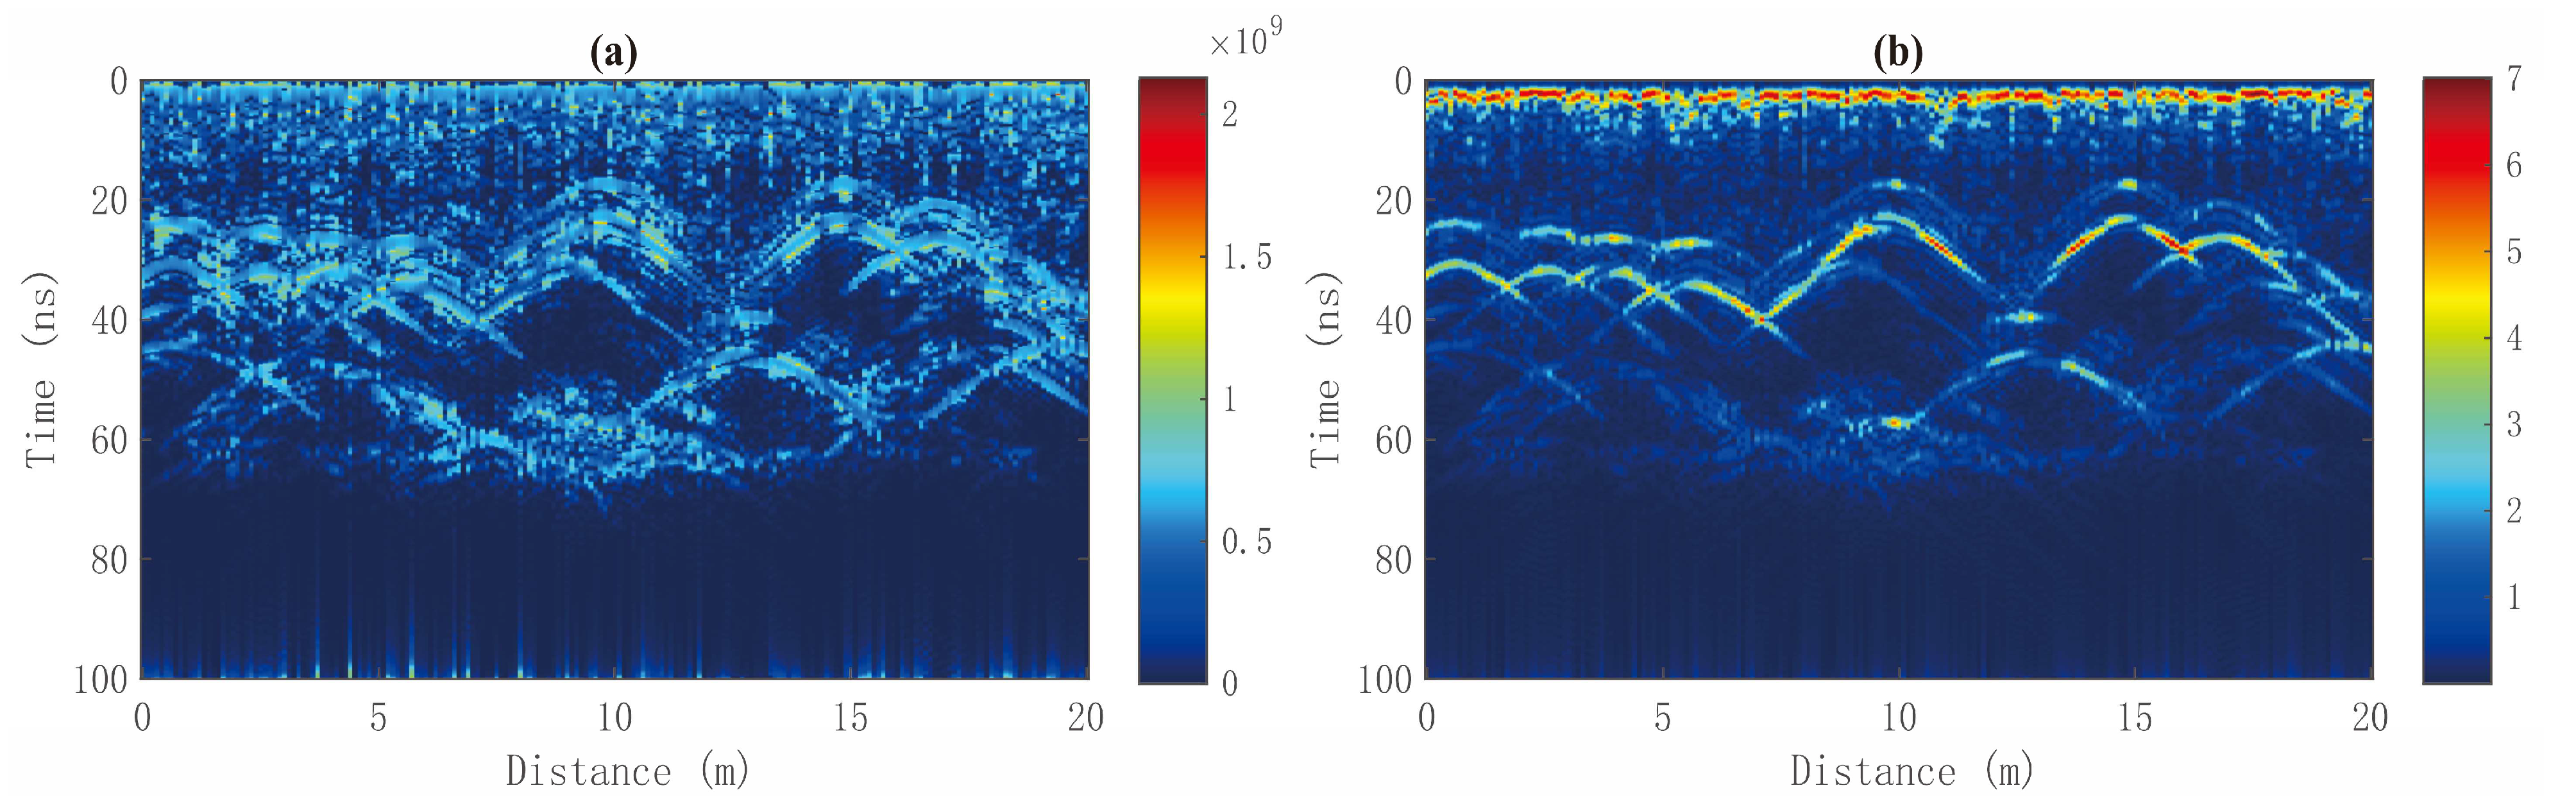
Figure 6.
The IMF-slices generated by ICCEMDAN. (a–d) are the first four modes of IMF-slices, which depict the high-frequency events of the radargram, e.g., the outline of hyperbolic reflections and the upper surface of the lunar regolith. The rest of the IMF-slices (e–h) correspond to the low-frequency features and background.

Figure 7.
The instantaneous centroid frequency profile of the simulated B-scan. (a) The classic time-varying centroid frequency based on S-transform; the instantaneous centroid based on (b) the 1D-TKEO and (c) the 1D-HODEO.
Figure 7.
The instantaneous centroid frequency profile of the simulated B-scan. (a) The classic time-varying centroid frequency based on S-transform; the instantaneous centroid based on (b) the 1D-TKEO and (c) the 1D-HODEO.
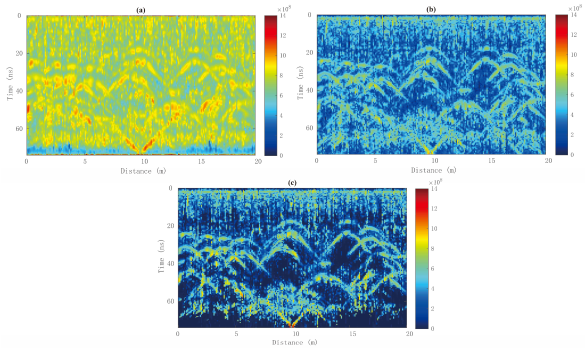
Figure 8.
The profile plot depicts the pre-processed LPR within the range of 0–600 ns (background removal, band-pass filtering, gain, etc.).
Figure 8.
The profile plot depicts the pre-processed LPR within the range of 0–600 ns (background removal, band-pass filtering, gain, etc.).

Figure 9.
The instantaneous attribute profiles. Instantaneous frequency (a) and instantaneous amplitude (b).
Figure 9.
The instantaneous attribute profiles. Instantaneous frequency (a) and instantaneous amplitude (b).
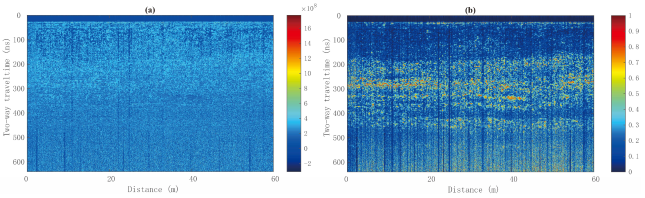
Figure 10.
The instantaneous centroid frequency profile of LPR Data. (a) The classic time-varying centroid frequency based on S-transform; the instantaneous centroid based on (b) the 1D-TKEO and (c) the 1D-HODEO.
Figure 10.
The instantaneous centroid frequency profile of LPR Data. (a) The classic time-varying centroid frequency based on S-transform; the instantaneous centroid based on (b) the 1D-TKEO and (c) the 1D-HODEO.

Table 1.
The electrical properties of each component in the numerical model.
| Electrical Properties Components | Vacuum (≤0 m) | Lunar Regolith Layer (0~4.5 m) | Bedrock Layer (4.5~10 m) | Grains |
|---|---|---|---|---|
| 1 | 3~4 | 5.5~6.5 | 5.5~6.5 | |
| (S/m) | 0 | 0.001 | 0.01 | 0.01 |
Disclaimer/Publisher’s Note: The statements, opinions and data contained in all publications are solely those of the individual author(s) and contributor(s) and not of MDPI and/or the editor(s). MDPI and/or the editor(s) disclaim responsibility for any injury to people or property resulting from any ideas, methods, instructions or products referred to in the content. |
© 2023 by the authors. Licensee MDPI, Basel, Switzerland. This article is an open access article distributed under the terms and conditions of the Creative Commons Attribution (CC BY) license (https://creativecommons.org/licenses/by/4.0/).
Share and Cite
MDPI and ACS Style
Zhang, X.; Song, Z.; Li, B.; Feng, X.; Zhou, J.; Yu, Y.; Hu, X. The LPR Instantaneous Centroid Frequency Attribute Based on the 1D Higher-Order Differential Energy Operator. Remote Sens. 2023, 15, 5305. https://doi.org/10.3390/rs15225305
AMA Style
Zhang X, Song Z, Li B, Feng X, Zhou J, Yu Y, Hu X. The LPR Instantaneous Centroid Frequency Attribute Based on the 1D Higher-Order Differential Energy Operator. Remote Sensing. 2023; 15(22):5305. https://doi.org/10.3390/rs15225305
Chicago/Turabian StyleZhang, Xuebing, Zhengchun Song, Bonan Li, Xuan Feng, Jiangang Zhou, Yipeng Yu, and Xin Hu. 2023. "The LPR Instantaneous Centroid Frequency Attribute Based on the 1D Higher-Order Differential Energy Operator" Remote Sensing 15, no. 22: 5305. https://doi.org/10.3390/rs15225305
Note that from the first issue of 2016, this journal uses article numbers instead of page numbers. See further details here.