
Impacts of Thermal Differences in Surfacing Urban Heat Islands on Vegetation Phenology


1
Department of Geographic Information Science, Central South University of Forestry and Technology, Changsha 410004, China
2
Key Laboratory for Digital Dongting Lake of Hunan Province, Changsha 410004, China
3
School of Geographical Sciences, Hunan Normal University, Changsha 410081, China
4
Korea Research Institute on Climate Change, Chuncheon 24239, Republic of Korea
*
Author to whom correspondence should be addressed.
Remote Sens. 2023, 15(21), 5133; https://doi.org/10.3390/rs15215133
Submission received: 20 July 2023
/
Revised: 19 September 2023
/
Accepted: 24 October 2023
/
Published: 27 October 2023
Abstract
:Urbanization has significantly changed thermal environments and vegetation phenology. However, the effects of spatially different land surface temperatures (LST) on vegetation phenology, rather than differences between urban areas and rural areas, remain unclear. In this study, four cities with similar vegetation types located in temperate monsoon climate zones were selected to map vegetation phenological metrics and discuss their responses to spatially heterogeneous LST within urban areas. First, Sentinel 2-A and 2-B data were used to estimate phenological metrics by combining Savitzky–Golay filtering, and Landsat 8 TIRS data was used to obtain LST. Second, buffer zones (from the urban center to the urban edge at 1 km intervals) were used to extract the averaged phenological metrics and LST. The response of the phenological metrics to LST from the urban center to the urban edge was then analyzed. Results show that spatial differences in LST and vegetation phenology exist inside urban regions as well as between urban and peri-urban areas. In addition, the response of phenology to LST within urban areas is also obvious. SOS is negatively related to spring LST from the urban center to the urban edge, whereas EOS is positively related to autumn LST.
1. Introduction
Vegetation phenology refers to the periodic changes in the growth and developmental rhythms of plants adapted to local environments [1,2], which are sensitive to changes in temperature, air humidity, light, and other conditions [3,4,5,6]. For natural vegetation (such as forest and grassland), many studies have reported that the start of the growing season (SOS) is advanced, whereas the end of the growing season (EOS) is delayed by increasing temperature [7,8,9,10]. Over the past few decades, urbanization has significantly changed thermal patterns both at the surface and in the atmosphere [11,12,13,14]. For instance, land surface temperature (LST) is typically used to measure the surface urban heat island (SUHI) effects, which are only one facet of urban heat islands. In recent years, the effects of SUHI on urban vegetation phenology have become a popular topic [15,16,17,18,19,20,21,22].
Numerous studies have demonstrated that higher LST in urban areas than in rural areas extends the length of the growing season [23,24,25,26]. For instance, in 32 cities in China, the growing season started 11.9 days earlier and ended 5.4 days later in urban areas than in their rural counterparts [3]. However, the effects of SUHI on vegetation phenology are complex. First, the effects of SUHI on phenology vary across climate regions [27,28,29], and the magnitude of SOS advance and EOS delay (relative to rural zones) in warmer regions is lower than that in colder regions [3]; vegetation phenology at higher latitudes is more sensitive to SUHI effects than that at lower latitudes in the northern hemisphere [30]. Second, for cities located in the same or similar climate zones, the effects of UHI on vegetation phenology are positive for the amplitudes of urbanization. The ten-fold increase in urban size can lead to an advancement of SOS by 1.3 days and a delay of EOS by 2.4 days because larger urban areas lead to higher LST differences [31]. Third, some studies have reported that nighttime lighting in urban areas can advance the SOS of urban vegetation and that the effect of nighttime light on SOS is relatively weaker than that of temperature [32,33,34,35]. Fourth, the effect of enhanced CO2 on vegetation phenology is also obvious, and it has been indicated that the delayed end of the season is mainly attributed to CO2 enrichments [36,37,38].
Although scholars have performed many great studies to discuss the effect of SUHI on vegetation phenology and some exciting findings have been reported, the spatial heterogeneity of LST within urban areas and its effects on vegetation phenology have not been considered until now. For example, previous studies have examined differences in phenology related to LST across gradients in peri-urban areas and indicated that the effect of urbanization on phenology is strongest in urban centers and decreases gradually toward rural areas. However, urban areas were considered entireties, and SUHI’s effects on phenology were determined by comparing LST and phenological metrics between urban areas and peri-urban areas [4,39,40,41,42]. Because the remote sensing data (e.g., MODIS data) that were commonly used in previous studies were too coarse to capture detailed information within urban areas, the effect of mixed pixels of vegetation and non-vegetation on the estimation accuracy of phenological metrics cannot be ignored [43,44]. Ideally, high spatial resolution and high temporal resolution are both necessary for phenological studies within urban areas. In recent years, the benefits of Sentinel 2-A and 2-B (launched in 2015 and 2017, respectively) with a spatial resolution of 20 m and temporal resolution of 5 days have enabled mapping vegetation phenological metrics accurately within urban areas [45,46] to evaluate the effects of urbanization on phenology.
A hypothesis that has not been proven is that the effect of SUHIs on phenology within urban areas (excluding peri-urban aeras) also decreases gradually from urban center to urban edge. Thus, in this study, four cities with similar vegetation types located in temperate monsoon climate zones were selected to map vegetation phenological metrics and discuss their responses to spatially heterogeneous LST within urban areas. First, Sentinel 2-A and 2-B data were used to estimate phenological metrics (SOS, EOS, and LOS) by combining Savitzky–Golay (S–G) filtering and Landsat 8 TIRS data to obtain the LST. Second, buffer zones (from the urban center to the urban edge at 1 km intervals) were used to extract the averaged phenological metrics and LST. Then, the response of phenological metrics to LST from the urban center to the urban edge was analyzed.
2. Materials and Methods
2.1. Study Area
Four cities located in a temperate monsoon climate zone were selected to map vegetation phenological metrics and discuss their responses to spatial heterogeneity within urban areas (Figure 1). The major vegetation types were similar in these four cities, including deciduous forests, shrublands, and grasses, and we can assume that the uncertainty caused by vegetation type could be ignored to some extent. The urban sizes of these four cities differ significantly: 1469, 805, 670, and 290 km2 for Beijing, Xi’an, Zhengzhou, and Xuzhou, respectively [47,48]. Thus, the effect of urban size on vegetation phenology may be evident across these cities. Third, although these four cities are located in a temperate monsoon climate zone, air humidity also exists in the spring. The seasonal average air humidity values in spring (obtained from the China Mereological Data Service Center) are 37.4, 39.1, 46.8, and 57.4% for Beijing, Xi’an, Zhengzhou, and Xuzhou, respectively.
2.2. Data and Processing
2.2.1. Sentinel-2 Data
Sentinel-2 (S2) is a high-resolution, wide-field, multispectral imaging mission that provides global coverage with a 5 day revisit frequency. The S2 multispectral instrument captures data from 13 spectral bands at spatial resolutions of 10, 20, and 60 m for visible light and NIR, red-edge and SWIR, and atmospheric bands, respectively. By uploading the shapefile (vector) of the research area to the Google Earth Engine (GEE), we used the cloud control band (QA60) to control the cloud quantity of the image and obtained S2 data.
2.2.2. Landsat 8 Data
Landsat 8 TIRS data have the advantages of higher resolution, long time series, and ease of acquisition and are widely applied in the investigation of urban heat islands. Therefore, Landsat 8 data were used to extract the temperature of the study region and obtain the LST. The retrieval of LST data was performed using Landsat 8 TIRS-1 data with a spatial resolution of 30 m via a single-window algorithm. All data were downloaded from the official USGS website (https://www.usgs.gov/, accessed on 15 September 2022).
2.3. Methodology
2.3.1. Extraction of Urban Vegetation
Urban vegetation areas were identified using the vegetation index of the study area. By obtaining the sentinel data of a few clouds in the vegetation growth season of the study area, the enhanced vegetation index (EVI) of the study area was calculated using ENVI 5.3 software. Mask analysis was then carried out to extract the area with a vegetation index of 0.2–0.8, designated as urban vegetation [49].
Compared to the commonly used normalized difference vegetation index (NDVI), EVI has the advantage of effectively reducing the reflection effect of the atmosphere and soil, reducing the influence of vegetation canopy background changes, and maintaining sensitivity to plant activities, making it more suitable for monitoring the urban vegetation dynamics of sparse vegetation [50,51,52]. Therefore, the EVI was applied to extract the urban vegetation area and vegetation phenology parameters. The EVI value is calculated as:
where red, blue, and NIR refer to the red, blue, and near-infrared bands, respectively.
2.3.2. Reconstruction of the EVI Time Series
Common methods for the reconstruction of EVI time series include double-logistic function fitting, S–G filtering, and asymmetric Gaussian fitting [53,54]. Compared with the other two methods, the S–G filter method has a great advantage in retaining the original trend of time-series vegetation index data, which is helpful for regions with stronger interference from human activity, such as urban areas [55]. Therefore, the S–G filter method was employed in this study to fit the trend of the time series of EVI data for the four cities. The S–G filter uses a local polynomial regression model to obtain smooth time-series data. Based on higher-order polynomials, the least squares method was used to optimize the data in the sliding window to achieve the best fit. The formula used was as follows:
where Yj + 1 denotes the original EVI data, Yj∗ denotes the fitting EVI, Ci denotes the fit coefficient for the i-th EVI, and N denotes the fitting order that is equal to the size of the sliding window (2n + 1).
2.3.3. Extraction of Vegetation Phenological Metrics
The dynamic threshold method was applied to extract vegetation phenological metrics based on the EVI time series smoothed using the S–G filter method. Phenological metrics were calculated based on the physiological characteristics of vegetation growth. Specifically, SOS and EOS were defined by time nodes when the vegetation index curve reached a certain proportion of the curve amplitude in the rising and falling stages, respectively. To obtain phenological parameters of urban vegetation, the threshold is usually set to 0.2 or 0.25 [3,56], and here, we adopted 0.25.
where EVI(SOS) is the EVI threshold for extracting SOS, EVImax denotes the maximum value of EVI, EVImin1 denotes the minimum value of EVI in the rising stage of the curve, EVI(EOS) is the EVI threshold for extracting EOS, and EVImin2 is the minimum value of EVI in the descending stage of the curve.
EVI time-series reconstruction was realized by coding on the GEE platform, and vegetation phenology information for each study area was calculated using the dynamic threshold method. The average number of phenological days in each study area was determined using ArcGIS 10.8 software.
2.3.4. Extraction of Land Surface Temperature Data
A single-window algorithm was applied to derive LST based on the thermal infrared band and brightness temperature band (TIRS-1) in Landsat 8 data and specific emissivity correction [57]. The seasonal average temperature was calculated, designating March to May as spring and September to November as autumn, and their average temperatures were used.
- (1)
- Vegetation cover (PV):
- (2)
- Land surface emissivity is calculated as:
- (3)
- Land surface temperature (LST):
2.3.5. Spatial Variation Trends in Urban Thermal Environment and Phenology
To reveal the spatial variation trend of the urban thermal environment and vegetation phenology in each study area, a circular buffer zone was established at the center point of each urban center area, 1 km outward. The number of buffer zones was determined according to the size of the city: Beijing, 12 × 1 km; Xi’an and Zhengzhou, 10 × 1 km; and Xuzhou, 6 × 1 km. The average vegetation phenology and seasonal mean temperature of each urban area and buffer zone were calculated, and their trend analysis for each buffer zone was conducted to reflect the spatial variations. The expressions are as follows:
where x represents the distance from the city center; and y represents the vegetation phenological metric; coefficients a, b, c, and k, are used in the calculation. When fitting the SOS curve, if k > 0, the beginning of the vegetation phenology growth season will be delayed with the increase of the distance from the city center; if k < 0, the beginning of the vegetation phenology growing season advances with the increase of the distance from the city center. When fitting the EOS curve, if k > 0, the end of the vegetation phenology growth season will be delayed with the increase of the distance from the city center; if k < 0, the beginning of the vegetation phenology end season will be advanced with the increase of the distance from the city center. When fitting the temperature curve, if k > 0, the urban surface temperature increases as the distance from the city center increases, and if k < 0, the urban surface temperature decreases as the distance from the city center increases.
3. Results
3.1. SOS, EOS, and LST in Spring and Autumn
The SOS, EOS, and LST values obtained for the four cities are listed in Table 1. In terms of the average spring LST, the cities can be ordered from highest to lowest temperatures as follows: Beijing (28.84 °C) > Zhengzhou (25.11 °C) > Xi’an (23.92 °C) > Xuzhou (23.30 °C). SOS was the earliest in Zhengzhou (DOY 95.92), followed by Xi’an (DOY 105.68) and Beijing (DOY 120.05). The most recent SOS event was recorded in Xuzhou (DOY 122.93). The SOS values were measured within 12 km of the center of Beijing, 10 km from the centers of Zhengzhou and Xi’an, and 6 km from the center of Xuzhou.
The trends in autumn LST were as follows: Zhengzhou (28.64 °C) > Xi’an (26.68 °C) > Beijing (24.93 °C) > Xuzhou (19.83 °C). The EOS was the latest in Zhengzhou (DOY 294.44), followed by Xi’an (DOY 281.95) and Beijing (DOY 272.36). The earliest EOS were recorded in Xuzhou (DOY 264.05). Thus, Zhengzhou, having the earliest SOS and the latest EOS, experienced the longest growing season among the four cities, 198.62 days, followed by Xi’an (176.27 days), Beijing (152.31 days), and Xuzhou (140.45 days).
The Pearson correlation coefficients between the vegetation phenological metrics and LST in the study area (Table 2) revealed a negative correlation between the SOS and spring LST in each of the four cities, indicating that the higher LST in spring contributed to an earlier SOS in all four cities; a stronger negative correlation (p < 0.05) was observed for Beijing, Zhengzhou, and Xi’an. The EOS and autumn LST were positively correlated in each city, indicating that a higher LST in autumn led to a later EOS, with the strongest correlation (p < 0.01) occurring in Beijing and Xi’an. Finally, LOS exhibited a positive correlation with LST in spring and autumn (the strongest correlations occurring in Beijing, Zhengzhou, and Xi’an), indicating that a higher LST in spring and autumn resulted in a longer growth period. The correlation coefficients were not statistically significant for Xuzhou, which may be explained by the small number of samples in the buffer zones. In addition, the small city scale, irregular urban morphology, variations in vegetation coverage, and impervious surface distribution among different buffer zones resulted in fluctuations in the LST and phenological metrics in Xuzhou.
Although the LST was higher in spring, the SOS in Beijing was delayed compared to that in Zhengzhou (Figure 2a). This may be affected by the difference in air humidity between the two cities; the average spring air humidity in Beijing (31.1%) is lower than that in Zhengzhou (42.55%), and a higher air humidity is favorable for vegetation germination. Low humidity is expected to hinder vegetative growth and delay the SOS. However, Xuzhou, located in a coastal area with a higher average relative humidity (65.90%), had the latest SOS values. Xuzhou also had the lowest LST in spring among all cities. This indicates that although LST and humidity are both factors that affect the onset of the growing season, LST exerts a stronger impact on the SOS than humidity. In autumn, the average relative humidity in the four cities showed no significant differences, ranging from 58.1 to 64.3%. Xuzhou had the earliest EOS and lowest LST in autumn, whereas Zhengzhou had the latest EOS and the highest LST in autumn, indicating that LST has a considerable effect on the growing season.
3.2. Relationship between LST and Urban Vegetation Phenology
Linear fitting was performed between the average spring LST and SOS, average autumn LST and EOS, and average spring–autumn LST and LOS in each buffer zone for all the study areas (Figure 3). A linear relationship was observed between LST and vegetation phenology, providing a quantitative description of the influence of LST on vegetation phenology. Results show that in Beijing, the SOS is advanced by 0.71 days and the EOS delayed by 3.28 days for every 1 °C increase in LST in spring and autumn, respectively, resulting in an extension of the LOS by 3.9 days per 1 °C increase in LST in spring–autumn. In the case of Zhengzhou, SOS was advanced by 1.14 days and EOS delayed by 1.47 days per 1 °C rise of LST in spring and autumn, respectively, resulting in a 2.36 day extension of LOS per 1 °C increase of LST in spring–autumn. In Xi’an, SOS was advanced by 2.82 days and EOS was delayed by 5.17 days per 1 °C increase of LST in spring and autumn, respectively, resulting in an extension of LOS by 7.88 days per 1 °C increase of LST in spring–autumn. Lastly, in Xuzhou, SOS was advanced by 3.59 days and EOS was delayed by 0.72 days for every 1 °C increase of LST in spring and autumn, respectively, with the result that the LOS was extended by 3.94 days per 1 °C increase of LST in spring–autumn. The correlation coefficient between autumn LST and EOS was higher than that between spring LST and SOS, and the number of EOS delay days contributed by LST was higher than that of SOS advance days, indicating that LST has a higher influence on EOS than on SOS.
3.3. Spatial Patterns in LST and Vegetation Phenological Metrics
Pearson correlation coefficients (Table 3) revealed a significant negative correlation between the distance from the urban center and the spring and autumn LST, indicating that certain LST differences occur inside the city; the higher the distance from the urban center, the lower the LST in either spring or autumn. The SOS has a positive correlation with distance, indicating that a higher distance from the urban center contributes to a delay in the SOS. Correspondingly, the EOS has a negative correlation with distance, indicating that a higher distance leads to an advanced EOS. LOS and distance were negatively correlated, indicating that a longer distance leads to a shorter LOS. Overall, when considering the spatial distribution, the urban center exhibited a higher LST than its surrounding areas, along with an earlier SOS, later EOS, and larger LOS. As the distance from the urban center increased, the LST decreased, SOS was delayed, EOS occurred earlier, and the growing period was shortened.
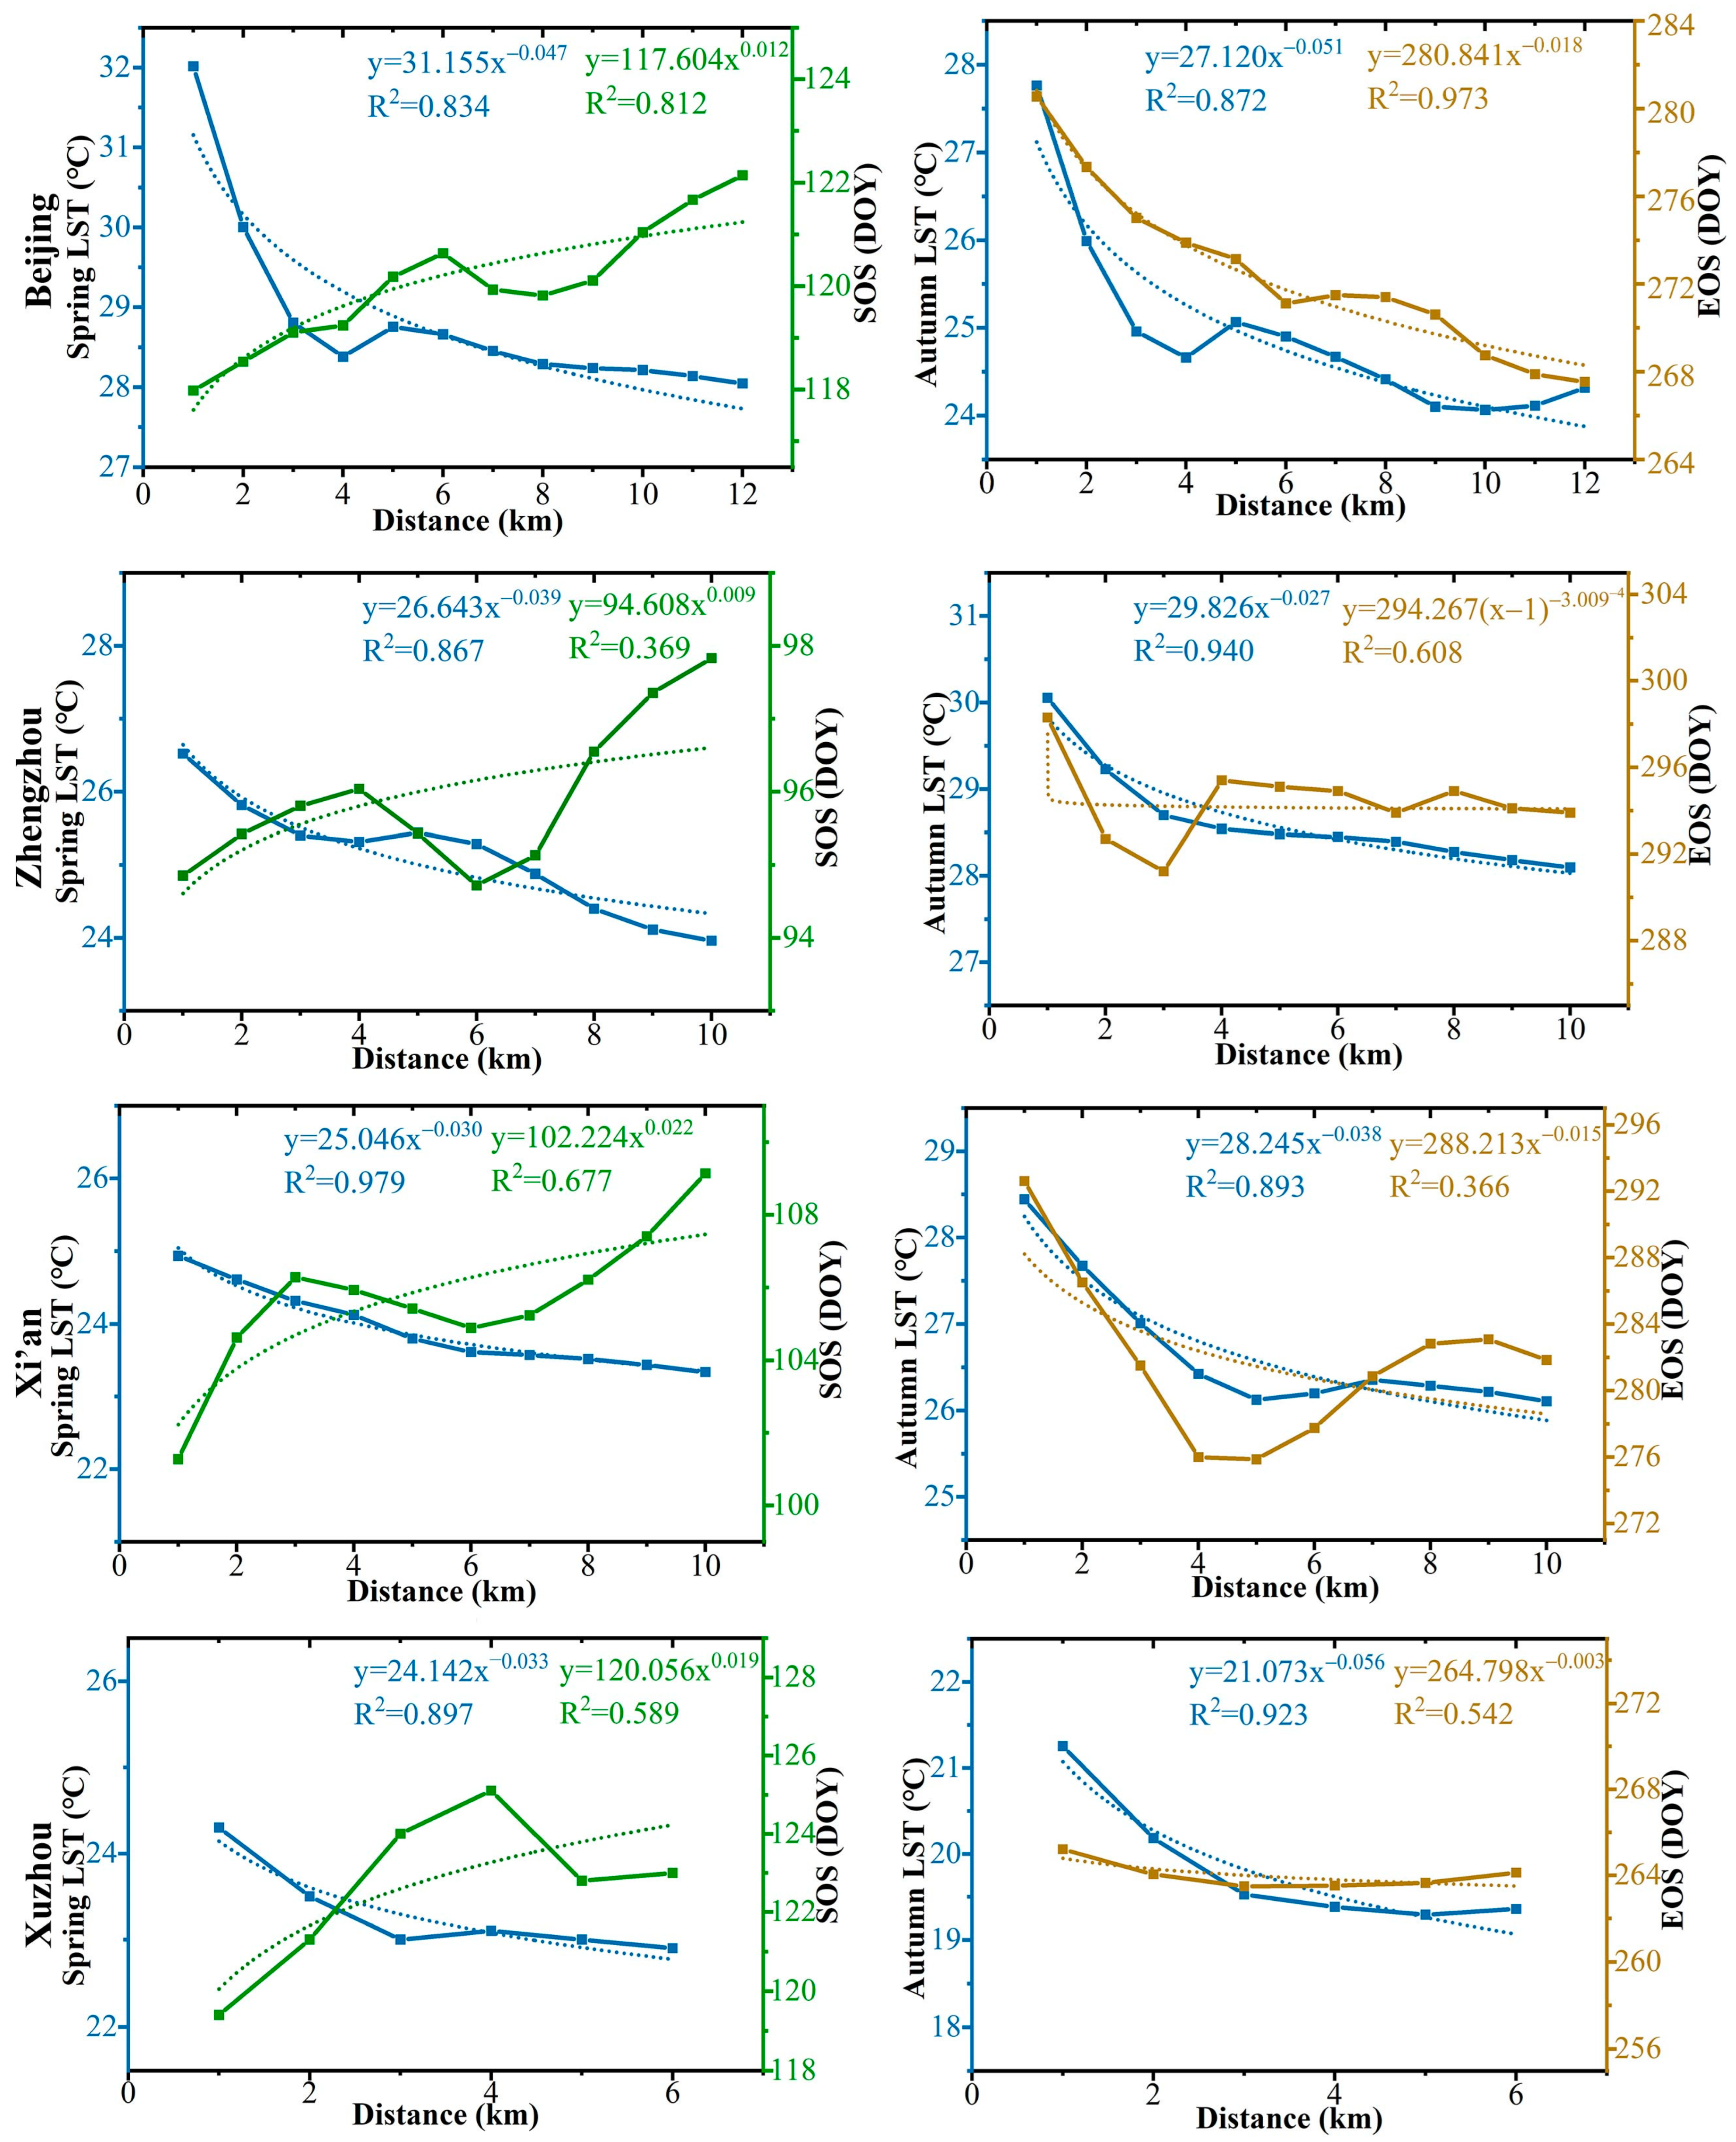
Results show that there is a nonlinear relationship between the distance from the city center and spring and autumn LST, SOS, and EOS for all cities (Figure 4). The LST in all four cities showed a nonuniform decline with an increase in distance from the urban center, which is in accordance with the distribution law of urban heat islands. The rate of temperature drop in the first five buffer zones was significantly higher than that in the latter, indicating that the temperature difference in each buffer zone was closer to the urban center. With an increase in distance from the city center, the SOS is delayed, whereas the EOS advances. The growing season of vegetation was similar to that of the corresponding LST, where the rate of change was larger in the first few buffer zones and tended to flatten with increasing distance. Changes in vegetation phenology were more obvious in the spring than in the autumn. Larger cities and more regular urban layouts have higher impacts on vegetation phenology.
The results revealed substantial variances in the intra-urban LST and vegetation phenology in the four cities. In spring (Table 4), the highest LST in the urban center is 31.8 °C (Beijing), 26.52 °C (Zhengzhou), 25.02 °C (Xi’an), and 24.3 °C (Xuzhou). As the distance from the urban center increased, the LST decreased, and the maximum temperature difference reached 3.8, 2.56, 1.67, and 1.4 °C, respectively. The maximum rate of decrease occurs in the first 4, 4, 5, and 3 km, respectively; the earliest SOS occurs in the urban center, where the maximum advance difference in SOS reaches 4.8 days (Beijing), 3.2 days (Zhengzhou), 7.2 days (Xi’an), and 5.7 days (Xuzhou), and the maximum delay rate was observed at the first 6, 4, 3, and 4 km, respectively.
In autumn (Table 5), the highest LST in the urban center was 27.6 °C (Beijing), 30.12 °C (Zhengzhou), 28.48 °C (Xi’an), and 21.3 °C (Xuzhou). As the distance from the urban center increases, the LST decreases, and the maximum temperature difference reaches 3.7, 2.02, 2.51, and 2.0 °C, respectively. With the maximum rate of decrease occurring in the first 4 km, 3 km, 5 km, and 3 km, respectively, the latest EOS occurs in the urban center, where the maximum delay difference in the EOS reaches 13.5 days (Beijing), 7.1 days (Zhengzhou), 15.3 days (Xi’an), and 2.2 days (Xuzhou), and the maximum delay rate was observed at the first 6, 3, 4, and 3 km.
Results show that although the climates of Beijing, Zhengzhou, Xi’an, and Xuzhou have different characteristics, there are similar trends in the LST and vegetation phenology changes from the urban center to a certain area in the surroundings. Specifically, vegetation phenology is affected by variations in urbanization between urban centers and surrounding areas. The area closer to the urban center had a higher LST, and the rise in LST was more beneficial to the advancement of SOS and the delay of EOS.
In terms of geographical location, compared with Beijing (northernmost) and Zhengzhou (southernmost), the difference in LST between the urban center of Beijing and its surrounding areas is 1.24 °C higher than that of Zhengzhou in spring, and SOS is advanced by 4.8 days, compared to a 3.2 days advance in Zhengzhou’s urban center. This indicates that the vegetation phenology in northern cities is more affected by LST than that in southern cities and is more obvious in autumn. The difference in LST between Beijing’s urban center and its surrounding areas is 1.68 °C higher than that of Zhengzhou in autumn, and EOS is delayed by 12.9 days in Beijing compared with the 4.4 days delay of EOS in the urban center of Zhengzhou. In addition to the impact of LST, relative humidity also accounts for vegetation phenology changes, as a higher relative humidity in the south is usually more suitable for vegetation growth. In the east–west direction, the temperature difference in the center of Xi’an is 0.27 °C higher than that in Xuzhou in spring, and the SOS is 7.2 days earlier, whereas the SOS in the center of Xuzhou is 3.6 days earlier. In autumn, the temperature difference in the center of Xi’an is 0.51 °C higher than that in Xuzhou, and the EOS is delayed by 9.2 days, whereas in the center of Xuzhou, the EOS is delayed by 1.2 days. Vegetation phenology in the central part of the mainland was more affected by LST than in the eastern coastal cities, mainly because the spring and autumn LST in Xi’an were relatively higher, leading to a longer growing period of vegetation.
In terms of city scale, Beijing, as a metropolitan city, had the largest temperature and phenological differences between its center and surrounding areas. Compared with values obtained in the 12 km buffer zone, the LOS of the urban center is extended by 17.7 days, whereas the LST and vegetation phenological metrics were found to be significantly correlated with distance (as indicated by the Pearson correlation coefficient). Beijing is a large city in Xi’an and Zhengzhou, where the LOS in the urban center was extended by 16.4 and 7.6 days, respectively, compared with the 10 km buffer zone, and LST and SOS were both significantly correlated with the distance from the center. In the center of Xuzhou, LOS was extended by 4.8 days, compared to the 6 km buffer zone; however, there were no clear correlations between vegetation phenological metrics and distance from the center. This can be explained by the different urbanization levels of the cities. The urbanization of Beijing and Xi’an is at a relatively higher level than that of other cities, and the thermal environment is more complex; thus, there is a stronger heat island effect compared to that of Xuzhou. The differences in phenology within urban areas indicate that differences in the thermal environment within a city have a significant impact on vegetation phenology.
4. Discussion
The factors that affect vegetation phenology are complex; the estimation of phenological metrics contains some uncertainties; and there are some limitations to the results of this study.
First, the effects of nighttime light on vegetation phenology were not considered. Although some previous studies have indicated that the effect of nighttime light on vegetation phenology is weaker than that of temperature [32,33,34,35,58], and we can assume that the spatial difference in nighttime light intensity within urban areas is lower than that between urban and rural areas, the phenomenon of nighttime light intensity differs within urban areas. In addition, the low spatial resolution of nighttime light data, such as that of the Suomi National Polar-Orbiting Partnership (VIIRS), at a spatial resolution of 500 m, is not sufficient to capture detailed information within urban areas. It will be useful in the future if new satellites can provide nighttime light data with a higher spatial resolution.
Second, as an important factor affecting photosynthesis, the effects of CO2 on vegetation were also not considered in this study. Some existing studies have reported that the increase in CO2 in urban areas caused by human activity is important for the advancement of SOS, whereas the delayed EOS was mainly attributed to CO2 enrichment [36,37,38]. However, the availability of CO2 data is limited. Additionally, for the same city, we can assume that the CO2 difference within urban areas is lower than that between urban and rural areas.
Third, ideally, higher spatial and temporal resolutions are required for the estimation of urban vegetation phenological metrics. However, the quantity of available remote-sensing data is significantly reduced by rainy weather in most parts of the world, thus decreasing the estimation accuracy of phenological metrics. For example, the availability of remote-sensing data is very poor in Southern China, which is affected by rainy weather, particularly in spring and summer. Although the number of rainy days for cities located in Northern China is smaller than that in Southern China, its effect on data availability is also evident, which inevitably introduces some uncertainties into the results of this study.
This study has some limitations. First, in addition to LST, meteorological factors such as humidity, light intensity, nighttime lighting, soil nutrients, concentrations of CO2, and atmospheric conditions also influence urban vegetation phenology. These factors can cause variations in the degree to which phenology in different cities is affected by LST. However, because of the difficulty in obtaining data, especially urban internal spatial data, this study used only relative humidity data. In future studies, more relevant meteorological factors should be introduced to explore their effects on vegetation phenology. In addition, because of the limitations of remote-sensing image data, this study used only remote-sensing images from 2019 onwards. Future research could use spatiotemporal fusion algorithms to overcome the impacts of weather and the spatiotemporal resolution of remote-sensing images, thereby improving the accuracy of LST and vegetation phenology data. Finally, because of the relatively irregular distribution of the Zhengzhou and Xuzhou urban areas, using buffer zones to extract LST and vegetation phenology information inside cities may result in the extraction of certain buffer zones that do not entirely pertain to urban data but may contain some suburban or agricultural areas. In future studies, cities with a more regular distribution should be selected to analyze the vegetation phenology of cities at different scales in different climatic zones.
5. Conclusions
In this study, four cities with similar vegetation types located in temperate monsoon climate zones were selected to map vegetation phenological metrics and discuss their responses to spatially differing LST within urban areas. First, Sentinel 2-A and 2-B data were used to estimate phenological metrics (SOS, EOS, and LOS) by combining S–G filtering methods and utilizing Landsat 8 TIRS data to obtain LST. Second, buffer zones (from the urban center to the urban edge at 1 km intervals) were used to extract the averaged phenological metrics and LST. Then, the response of phenological metrics to LST from the urban center to the urban edge was analyzed. The main conclusions are as follows:
(1) LST and vegetation phenology differ significantly from urban centers to urban edges, and not only from urban areas to rural areas. Phenological differences in vegetation within urban areas increase with urban size. The spatial difference of LST from urban centers to urban edges within Beijing, Xi’an, Zhengzhou, and Xuzhou ranges from 1.4 °C to 3.8 °C from urban centers to urban edges. The advance of the SOS within Beijing, Xi’an, Zhengzhou, and Xuzhou was 5.16, 6.15, 3.24, and 1.25 days from the urban center to the urban edge, respectively, and the delay of the EOS within Beijing, Xi’an, Zhengzhou, and Xuzhou ranged from 2.2 to 15.3 days;
(2) The response of vegetation phenology to spatially differing LST is obvious within urban areas and not only between urban and rural areas. For all four cities, the variation curves of the SOS from the urban center to the urban edge were negatively related to those of the spring LSTs, whereas the variation curves of the EOS from the urban center to the urban edge were positively related to those of the autumn LSTs. In other words, the advance of the SOS in urban centers is higher than that at urban edges, and the delay of the EOS in urban centers is higher than that at urban edges.
Author Contributions
Conceptualization, review, and editing, Y.Y.; methodology, validation, writing—original draft, and visualization, X.Q.; investigation, formal analysis, and software, L.Y.; writing—review and editing, D.L. All authors have read and agreed to the published version of the manuscript.
Funding
This research was funded by the National Natural Science Foundation of China (grant number: 42001275) and the Natural Science Foundation of Hunan Province (grant number: 2020JJ5980).
Data Availability Statement
Landsat and Sentinel-2 images were downloaded from the official USGS website (https://www.usgs.gov/, accessed on 6 May 2021).
Acknowledgments
We are grateful to USGS for supplying the remote-sensing datasets.
Conflicts of Interest
The authors declare no conflict of interest.
References
- Fenner, M. The phenology of growth and reproduction in plants. Perspect. Plant Ecol. Evol. Syst. 1998, 1, 78–91. [Google Scholar] [CrossRef]
- Fenner, M. Seed Ecology; Springer Science+Business Media: Berlin/Heidelberg, Germany, 2012. [Google Scholar]
- Zhou, D.; Zhao, S.; Zhang, L.; Liu, S. Remotely sensed assessment of urbanization effects on vegetation phenology in China’s 32 major cities. Remote Sens. Environ. 2016, 176, 272–281. [Google Scholar] [CrossRef]
- Han, G.; Xu, J. Land surface phenology and land surface temperature changes along an urban–rural gradient in Yangtze River Delta, China. Environ. Manag. 2013, 52, 234–249. [Google Scholar] [CrossRef]
- Piao, S.; Liu, Q.; Chen, A.; Janssens, I.A.; Fu, Y.; Dai, J.; Liu, L.; Lian, X.; Shen, M.; Zhu, X. Plant phenology and global climate change: Current progresses and challenges. Glob. Change Biol. 2019, 25, 1922–1940. [Google Scholar] [CrossRef] [PubMed]
- Liu, Q.; Fu, Y.H.; Zeng, Z.; Huang, M.; Li, X.; Piao, S. Temperature, precipitation, and insolation effects on autumn vegetation phenology in temperate China. Glob. Change Biol. 2016, 22, 644–655. [Google Scholar] [CrossRef]
- Zhao, J.; Wang, Y.; Zhang, Z.; Zhang, H.; Guo, X.; Yu, S.; Du, W.; Huang, F. The variations of land surface phenology in Northeast China and its responses to climate change from 1982 to 2013. Remote Sens. 2016, 8, 400. [Google Scholar] [CrossRef]
- Yu, L.; Liu, T.; Bu, K.; Yan, F.; Yang, J.; Chang, L.; Zhang, S. Monitoring the long term vegetation phenology change in Northeast China from 1982 to 2015. Sci. Rep. 2017, 7, 14770. [Google Scholar] [CrossRef]
- Ren, S.; Yi, S.; Peichl, M.; Wang, X. Diverse responses of vegetation phenology to climate change in different grasslands in Inner Mongolia during 2000–2016. Remote Sens. 2017, 10, 17. [Google Scholar] [CrossRef]
- Kabano, P.; Lindley, S.; Harris, A. Evidence of urban heat island impacts on the vegetation growing season length in a tropical city. Landsc. Urban Plan. 2021, 206, 103989. [Google Scholar] [CrossRef]
- Chen, M.; Zhou, Y.; Hu, M.; Zhou, Y. Influence of urban scale and urban expansion on the urban heat island effect in metropolitan areas: Case study of Beijing–Tianjin–Hebei urban agglomeration. Remote Sens. 2020, 12, 3491. [Google Scholar] [CrossRef]
- Cui, Y.; Yan, D.; Hong, T.; Ma, J. Temporal and spatial characteristics of the urban heat island in Beijing and the impact on building design and energy performance. Energy 2017, 130, 286–297. [Google Scholar] [CrossRef]
- Li, H.; Wang, G.; Tian, G.; Jombach, S. Mapping and analyzing the park cooling effect on urban heat island in an expanding city: A case study in Zhengzhou city, China. Land 2020, 9, 57. [Google Scholar] [CrossRef]
- Han, L.; Lu, L.; Fu, P.; Ren, C.; Cai, M.; Li, Q. Exploring the seasonality of surface urban heat islands using enhanced land surface temperature in a semi-arid city. Urban Clim. 2023, 49, 101455. [Google Scholar] [CrossRef]
- Dallimer, M.; Tang, Z.; Bibby, P.R.; Brindley, P.; Gaston, K.J.; Davies, Z.G. Temporal changes in greenspace in a highly urbanized region. Biol. Lett. 2011, 7, 763–766. [Google Scholar] [CrossRef]
- Melaas, E.K.; Sulla-Menashe, D.; Gray, J.M.; Black, T.A.; Morin, T.H.; Richardson, A.D.; Friedl, M.A. Multisite analysis of land surface phenology in North American temperate and boreal deciduous forests from Landsat. Remote Sens. Environ. 2016, 186, 452–464. [Google Scholar] [CrossRef]
- Piao, S.; Fang, J.; Zhou, L.; Ciais, P.; Zhu, B. Variations in satellite-derived phenology in China’s temperate vegetation. Glob. Change Biol. 2006, 12, 672–685. [Google Scholar] [CrossRef]
- Cong, N.; Wang, T.; Nan, H.; Ma, Y.; Wang, X.; Myneni, R.B.; Piao, S. Changes in satellite-derived spring vegetation green-up date and its linkage to climate in China from 1982 to 2010: A multimethod analysis. Glob. Change Biol. 2013, 19, 881–891. [Google Scholar] [CrossRef]
- Melaas, E.K.; Wang, J.A.; Miller, D.L.; Friedl, M.A. Interactions between urban vegetation and surface urban heat islands: A case study in the Boston metropolitan region. Environ. Res. Lett. 2016, 11, 054020. [Google Scholar] [CrossRef]
- Oke, T.R. The energetic basis of the urban heat island. Q. J. R. Meteorol. Soc. 1982, 108, 1–24. [Google Scholar] [CrossRef]
- Zhao, L.; Lee, X.; Smith, R.B.; Oleson, K. Strong contributions of local background climate to urban heat islands. Nature 2014, 511, 216–219. [Google Scholar] [CrossRef]
- Zhao, S.; Liu, S.; Zhou, D. Prevalent vegetation growth enhancement in urban environment. Proc. Natl. Acad. Sci. USA 2016, 113, 6313–6318. [Google Scholar] [CrossRef] [PubMed]
- Fintikakis, N.; Gaitani, N.; Santamouris, M.; Assimakopoulos, M.; Assimakopoulos, D.; Fintikaki, M.; Albanis, G.; Papadimitriou, K.; Chryssochoides, E.; Katopodi, K. Bioclimatic design of open public spaces in the historic centre of Tirana, Albania. Sustain. Cities Soc. 2011, 1, 54–62. [Google Scholar] [CrossRef]
- Jochner, S.; Menzel, A. Urban phenological studies–Past, present, future. Environ. Pollut. 2015, 203, 250–261. [Google Scholar] [CrossRef] [PubMed]
- Yuan, M.; Wang, L.; Lin, A.; Liu, Z.; Li, Q.; Qu, S. Vegetation green up under the influence of daily minimum temperature and urbanization in the Yellow River Basin, China. Ecol. Indic. 2020, 108, 105760. [Google Scholar] [CrossRef]
- Roetzer, T.; Wittenzeller, M.; Haeckel, H.; Nekovar, J. Phenology in central Europe–differences and trends of spring phenophases in urban and rural areas. Int. J. Biometeorol. 2000, 44, 60–66. [Google Scholar] [CrossRef]
- Wang, X.; Du, P.; Chen, D.; Lin, C.; Zheng, H.; Guo, S. Characterizing urbanization-induced land surface phenology change from time-series remotely sensed images at fine spatio-temporal scale: A case study in Nanjing, China (2001–2018). J. Clean. Prod. 2020, 274, 122487. [Google Scholar] [CrossRef]
- Li, F.; Song, G.; Liujun, Z.; Yanan, Z.; Di, L. Urban vegetation phenology analysis using high spatio-temporal NDVI time series. Urban For. Urban Green. 2017, 25, 43–57. [Google Scholar] [CrossRef]
- Chakraborty, T.; Hsu, A.; Manya, D.; Sheriff, G. A spatially explicit surface urban heat island database for the United States: Characterization, uncertainties, and possible applications. ISPRS J. Photogramm. Remote Sens. 2020, 168, 74–88. [Google Scholar] [CrossRef]
- Li, D.; Stucky, B.J.; Baiser, B.; Guralnick, R. Urbanization delays plant leaf senescence and extends growing season length in cold but not in warm areas of the Northern Hemisphere. Glob. Ecol. Biogeogr. 2022, 31, 308–320. [Google Scholar] [CrossRef]
- Li, X.; Zhou, Y.; Asrar, G.R.; Mao, J.; Li, X.; Li, W. Response of vegetation phenology to urbanization in the conterminous United States. Glob. Change Biol. 2017, 23, 2818–2830. [Google Scholar] [CrossRef]
- Zheng, Q.; Teo, H.C.; Koh, L.P. Artificial light at night advances spring phenology in the United States. Remote Sens. 2021, 13, 399. [Google Scholar] [CrossRef]
- Škvareninová, J.; Tuhárska, M.; Škvarenina, J.; Babálová, D.; Slobodníková, L.; Slobodník, B.; Středová, H.; Minďaš, J. Effects of light pollution on tree phenology in the urban environment. Morav. Geogr. Rep. 2017, 25, 282–290. [Google Scholar] [CrossRef]
- Bennie, J.; Davies, T.W.; Cruse, D.; Bell, F.; Gaston, K.J. Artificial light at night alters grassland vegetation species composition and phenology. J. Appl. Ecol. 2018, 55, 442–450. [Google Scholar] [CrossRef]
- Bennie, J.; Davies, T.W.; Cruse, D.; Gaston, K.J. Ecological effects of artificial light at night on wild plants. J. Ecol. 2016, 104, 611–620. [Google Scholar] [CrossRef]
- Wang, S.; Ju, W.; Peñuelas, J.; Cescatti, A.; Zhou, Y.; Fu, Y.; Huete, A.; Liu, M.; Zhang, Y. Urban–rural gradients reveal joint control of elevated CO2 and temperature on extended photosynthetic seasons. Nat. Ecol. Evol. 2019, 3, 1076–1085. [Google Scholar] [CrossRef]
- Reyes-Fox, M.; Steltzer, H.; LeCain, D.R.; McMaster, G.S. Five years of phenology observations from a mixed-grass prairie exposed to warming and elevated CO2. Sci. Data 2016, 3, 160088. [Google Scholar] [CrossRef]
- Pereyda-González, J.M.; De-la-Peña, C.; Tezara, W.; Zamora-Bustillos, R.; Andueza-Noh, R.H.; Noh-Kú, J.G.; Carrera-Marín, M.; Garruña, R. High Temperature and Elevated CO2 Modify Phenology and Growth in Pepper Plants. Agronomy 2022, 12, 1836. [Google Scholar] [CrossRef]
- Zhang, X.; Friedl, M.A.; Schaaf, C.B.; Strahler, A.H.; Schneider, A. The footprint of urban climates on vegetation phenology. Geophys. Res. Lett. 2004, 31, 179–206. [Google Scholar] [CrossRef]
- Zhang, X.; Friedl, M.A.; Schaaf, C.B.; Strahler, A.H.; Hodges, J.C.; Gao, F.; Reed, B.C.; Huete, A. Monitoring vegetation phenology using MODIS. Remote Sens. Environ. 2003, 84, 471–475. [Google Scholar] [CrossRef]
- Reed, B.C.; Schwartz, M.D.; Xiao, X. Remote sensing phenology: Status and the way forward. In Phenology of Ecosystem Processes: Applications in Global Change Research; Springer: New York, NY, USA, 2009; pp. 231–246. [Google Scholar]
- Ahmed, G.; Zan, M.; Helili, P.; Kasimu, A. Responses of Vegetation Phenology to Urbanisation and Natural Factors along an Urban-Rural Gradient: A Case Study of an Urban Agglomeration on the Northern Slope of the Tianshan Mountains. Land 2023, 12, 1108. [Google Scholar] [CrossRef]
- Zhou, J.; Chen, J.; Chen, X.; Zhu, X.; Qiu, Y.; Song, H.; Rao, Y.; Zhang, C.; Cao, X.; Cui, X. Sensitivity of six typical spatiotemporal fusion methods to different influential factors: A comparative study for a normalized difference vegetation index time series reconstruction. Remote Sens. Environ. 2021, 252, 112130. [Google Scholar] [CrossRef]
- Rao, Y.; Zhu, X.; Chen, J.; Wang, J. An improved method for producing high spatial-resolution NDVI time series datasets with multi-temporal MODIS NDVI data and Landsat TM/ETM+ images. Remote Sens. 2015, 7, 7865–7891. [Google Scholar] [CrossRef]
- Bolton, D.K.; Gray, J.M.; Melaas, E.K.; Moon, M.; Eklundh, L.; Friedl, M.A. Continental-scale land surface phenology from harmonized Landsat 8 and Sentinel-2 imagery. Remote Sens. Environ. 2020, 240, 111685. [Google Scholar] [CrossRef]
- Amin, E.; Belda, S.; Pipia, L.; Szantoi, Z.; El Baroudy, A.; Moreno, J.; Verrelst, J. Multi-Season Phenology Mapping of Nile Delta Croplands Using Time Series of Sentinel-2 and Landsat 8 Green LAI. Remote Sens. 2022, 14, 1812. [Google Scholar] [CrossRef]
- Ministry of Housing and Urban-Rural Development, People’s Republic of China. China Urban Construction Statistical Yearbook; Ministry of Housing and Urban-Rural Development: Beijing, China, 2019. [Google Scholar]
- Ministry of Housing and Urban-Rural Development, People’s Republic of China. China Urban Construction Statistical Yearbook; Ministry of Housing and Urban-Rural Development: Beijing, China, 2021. [Google Scholar]
- Stöckli, R.; Vidale, P.L. European plant phenology and climate as seen in a 20-year AVHRR land-surface parameter dataset. Int. J. Remote Sens. 2004, 25, 3303–3330. [Google Scholar] [CrossRef]
- Zeng, Y.; Hao, D.; Huete, A.; Dechant, B.; Berry, J.; Chen, J.M.; Joiner, J.; Frankenberg, C.; Bond-Lamberty, B.; Ryu, Y. Optical vegetation indices for monitoring terrestrial ecosystems globally. Nat. Rev. Earth Environ. 2022, 3, 477–493. [Google Scholar] [CrossRef]
- Jiang, Z.; Huete, A.R.; Didan, K.; Miura, T. Development of a two-band enhanced vegetation index without a blue band. Remote Sens. Environ. 2008, 112, 3833–3845. [Google Scholar] [CrossRef]
- Somvanshi, S.S.; Kumari, M. Comparative analysis of different vegetation indices with respect to atmospheric particulate pollution using sentinel data. Appl. Comput. Geosci. 2020, 7, 100032. [Google Scholar] [CrossRef]
- Cai, Z.; Jönsson, P.; Jin, H.; Eklundh, L. Performance of smoothing methods for reconstructing NDVI time-series and estimating vegetation phenology from MODIS data. Remote Sens. 2017, 9, 1271. [Google Scholar] [CrossRef]
- Hird, J.N.; McDermid, G.J. Noise reduction of NDVI time series: An empirical comparison of selected techniques. Remote Sens. Environ. 2009, 113, 248–258. [Google Scholar] [CrossRef]
- Tian, Y.; Bai, X.; Wang, S.; Qin, L.; Li, Y. Spatial-temporal changes of vegetation cover in Guizhou Province, Southern China. Chin. Geogr. Sci. 2017, 27, 25–38. [Google Scholar] [CrossRef]
- Yang, C.; He, X.; Wang, R.; Yan, F.; Yu, L.; Bu, K.; Yang, J.; Chang, L.; Zhang, S. The effect of urban green spaces on the urban thermal environment and its seasonal variations. Forests 2017, 8, 153. [Google Scholar] [CrossRef]
- Wang, F.; Qin, Z.; Song, C.; Tu, L.; Karnieli, A.; Zhao, S. An improved mono-window algorithm for land surface temperature retrieval from Landsat 8 thermal infrared sensor data. Remote Sens. 2015, 7, 4268–4289. [Google Scholar] [CrossRef]
- Massetti, L. Assessing the impact of street lighting on Platanus × acerifolia phenology. Urban For. Urban Green. 2018, 34, 71–77. [Google Scholar] [CrossRef]
Figure 1.
Study area.
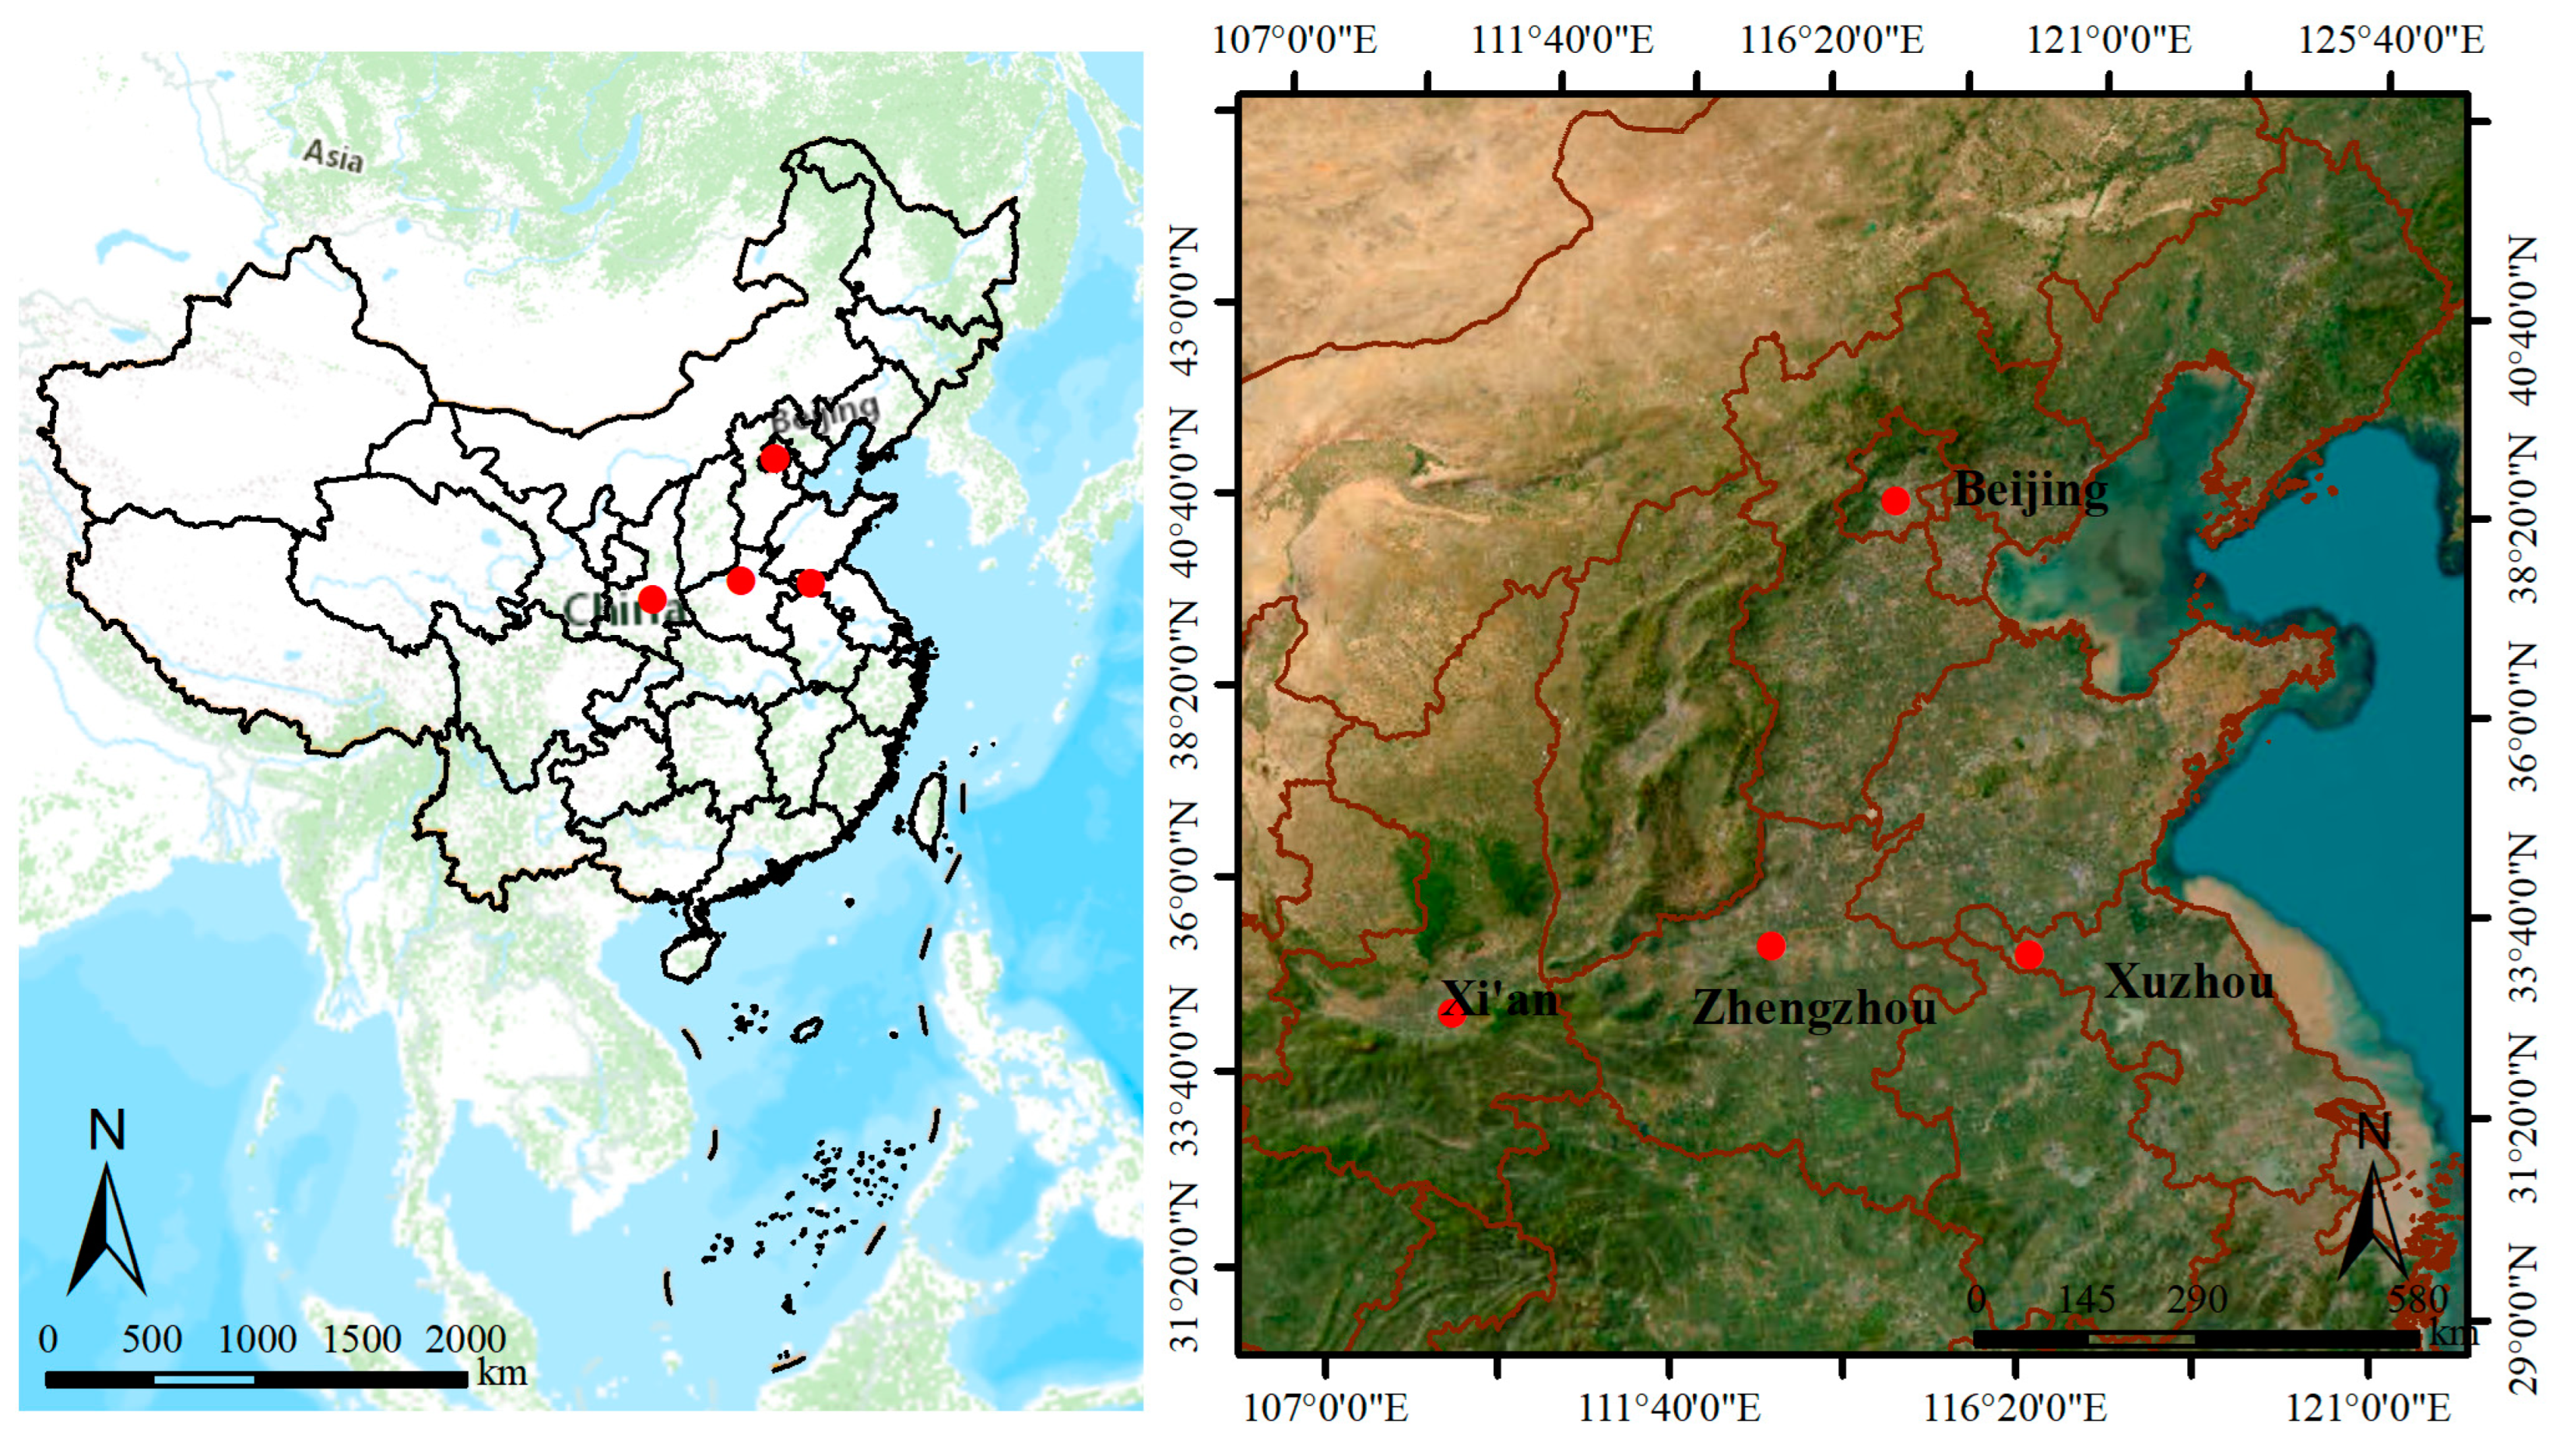
Figure 2.
Vegetation phenological metrics, LST, and relative humidity (a) SOS, spring LST, and spring relative humidity. (b) EOS, autumn LST, and autumn relative humidity.
Figure 2.
Vegetation phenological metrics, LST, and relative humidity (a) SOS, spring LST, and spring relative humidity. (b) EOS, autumn LST, and autumn relative humidity.
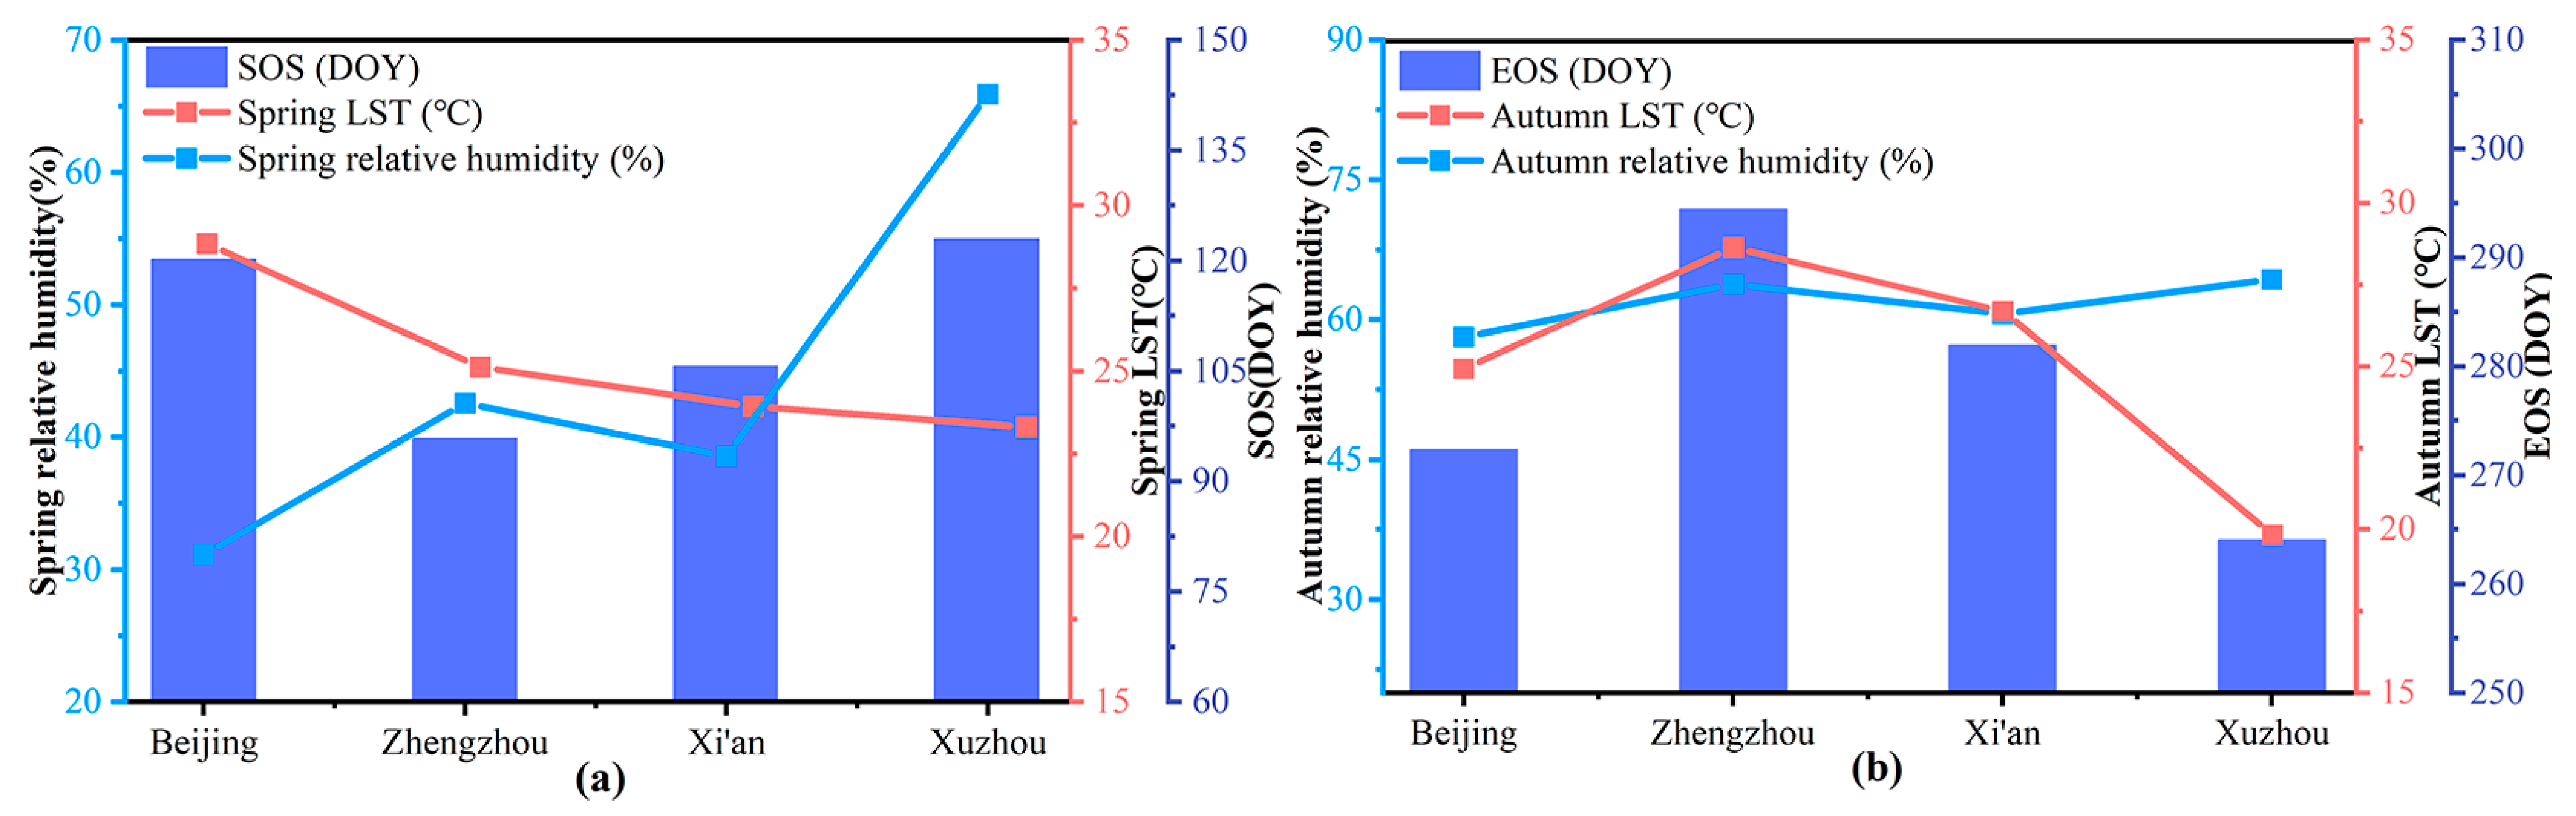
Figure 3.
Relationship between LST and SOS, EOS, and LOS.
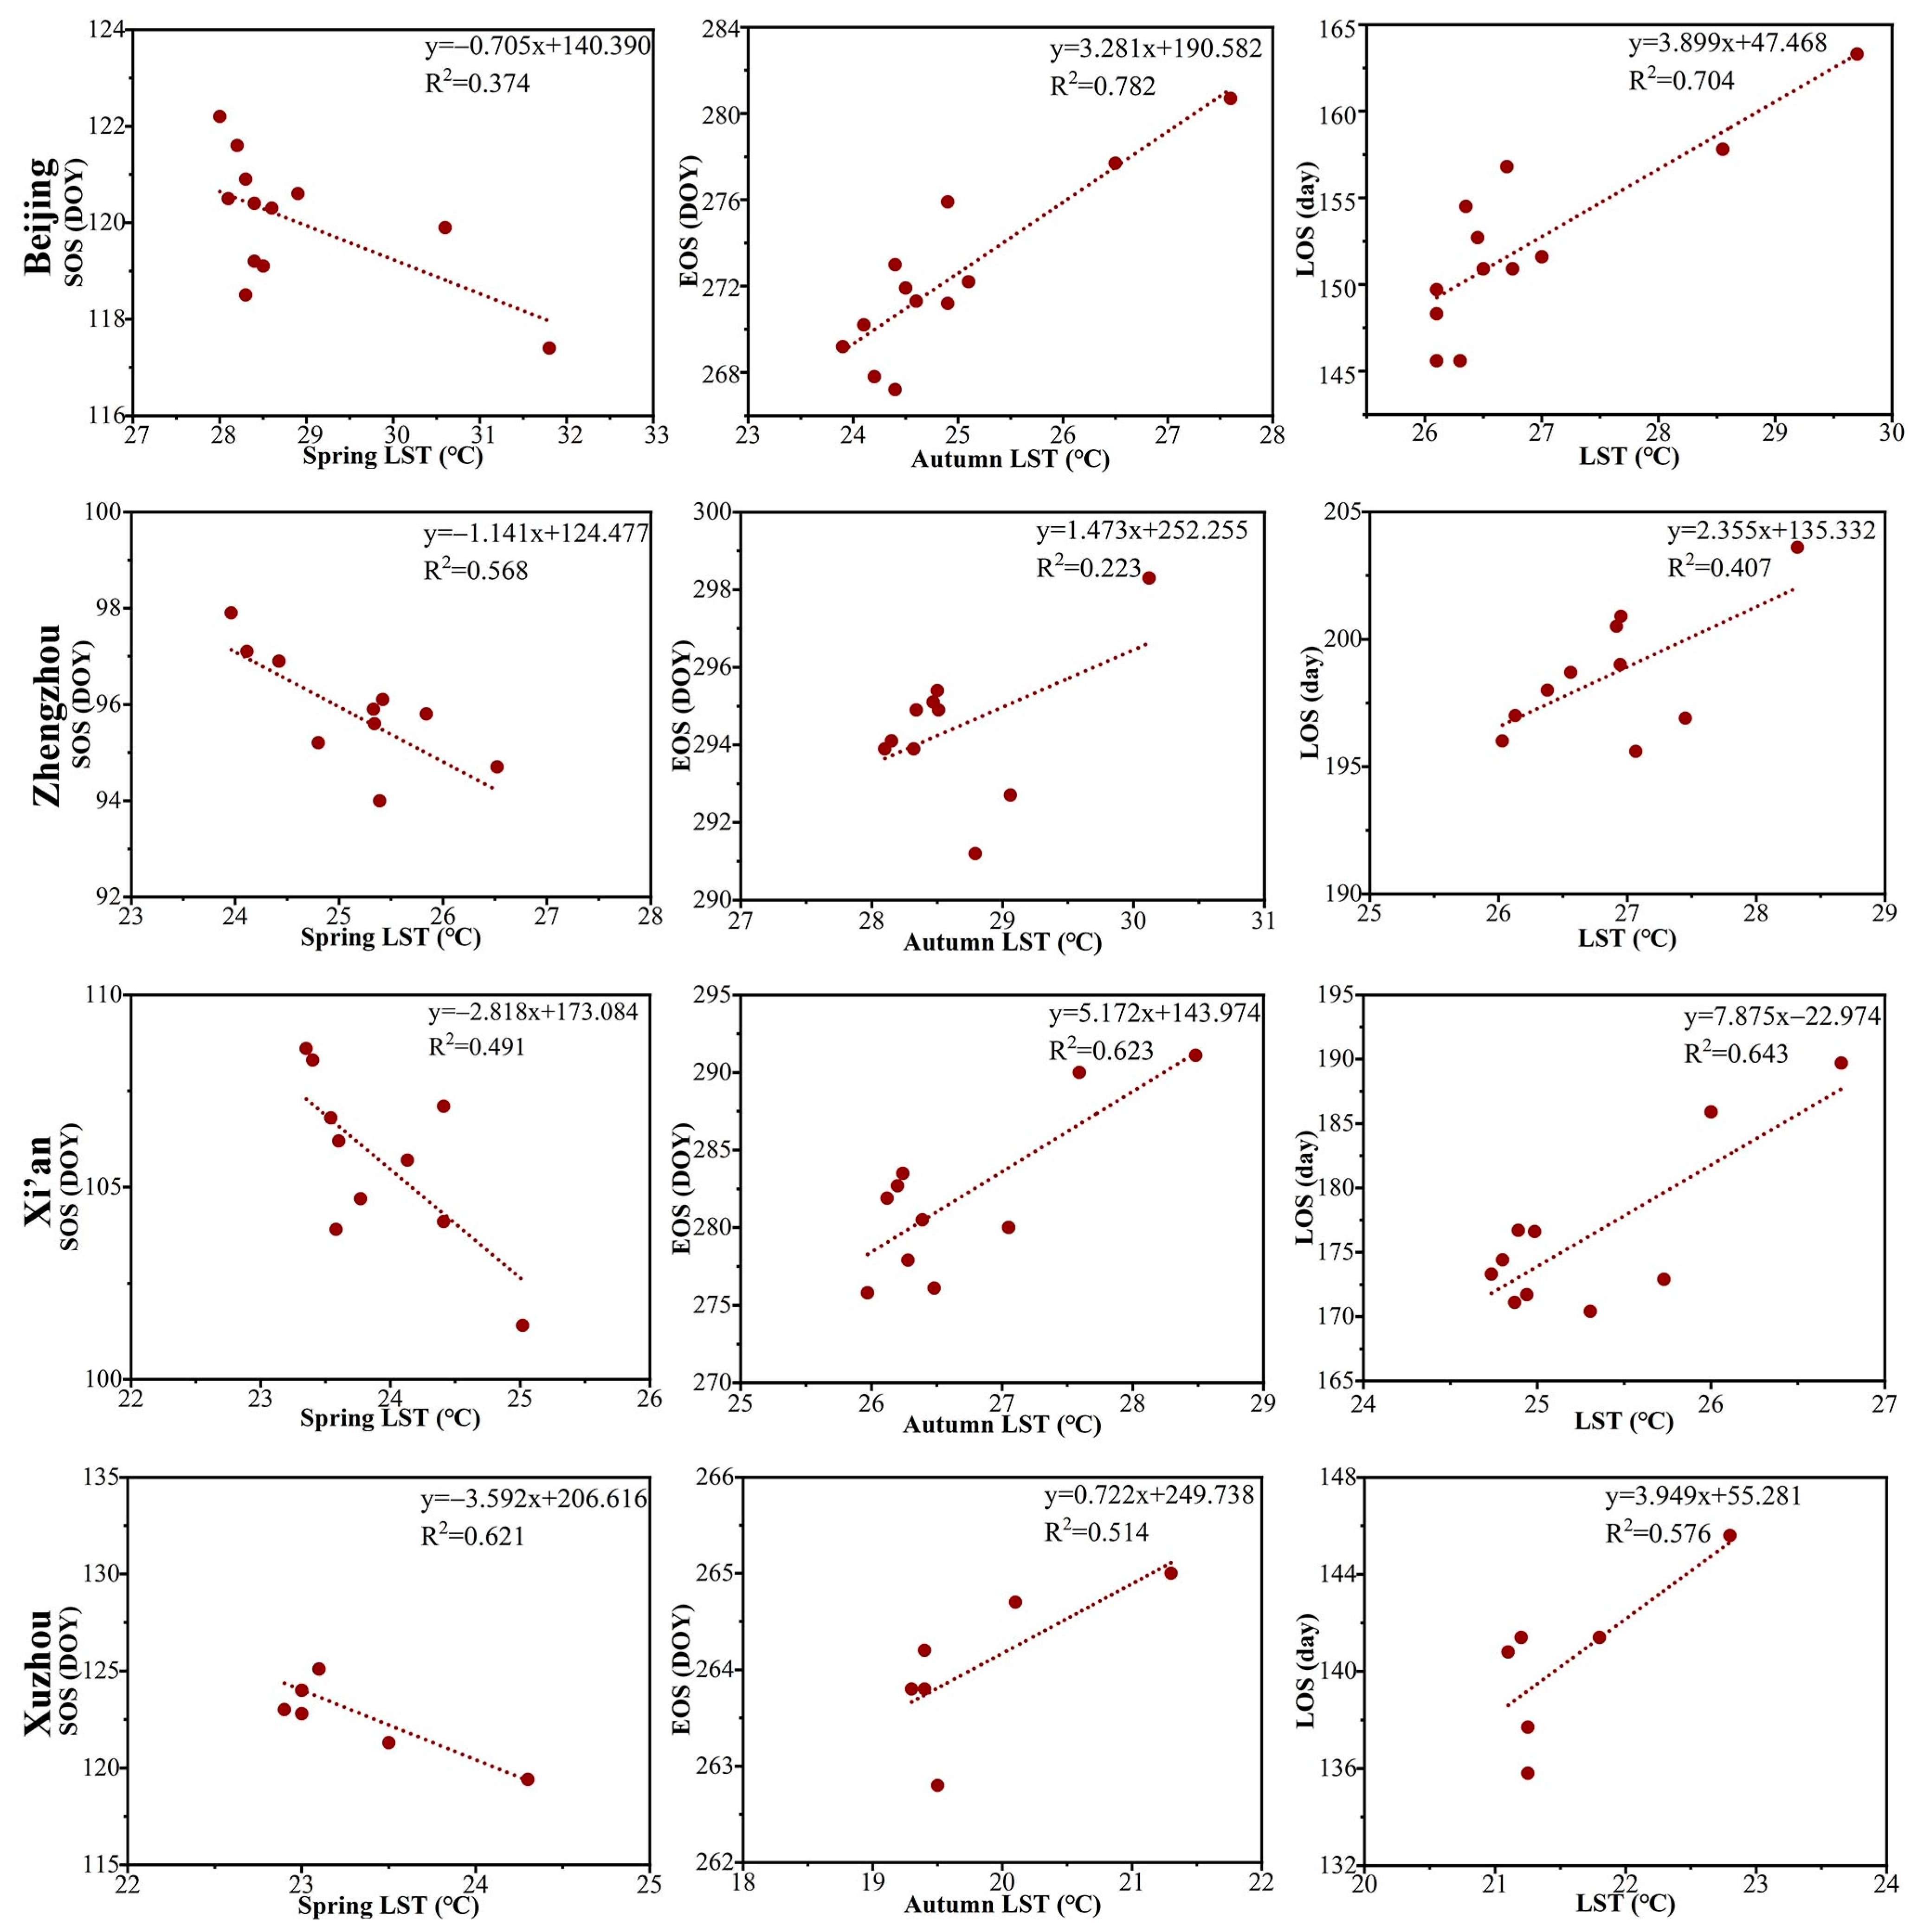
Figure 4.
Relationship between spring LST, SOS, autumn LST, EOS, and the distance from the urban center. The solid line represents the smoothed LST or the starting or ending day of phenology in each buffer zone, whereas the dashed line represents the nonlinear fitting results of the corresponding solid line.

Table 1.
Average land surface temperature and vegetation phenological metrics.
| City | Spring LST (°C) | Spring Humidity (%) | Autumn LST (°C) | Autumn Humidity (%) | SOS (DOY) | EOS (DOY) | LOS (Days) |
|---|---|---|---|---|---|---|---|
| Beijing | 28.84 | 31.10 | 24.93 | 58.10 | 120.05 | 272.36 | 152.31 |
| Zhengzhou | 25.11 | 42.55 | 28.64 | 63.80 | 95.82 | 294.44 | 198.62 |
| Xi’an | 23.92 | 38.55 | 26.68 | 60.61 | 105.68 | 281.95 | 176.27 |
| Xuzhou | 23.30 | 65.90 | 19.83 | 64.30 | 122.93 | 264.05 | 140.45 |
LST: land surface temperature; SOS: start of season; EOS: end of season; LOS: length of season.
Table 2.
Pearson correlation coefficients between vegetation phenological metrics and LST values.
| Beijing | Zhengzhou | Xi’an | Xuzhou | |
|---|---|---|---|---|
| SOS and LST in spring | –0.6115 * | –0.7534 * | –0.7009 * | –0.7883 |
| EOS and LST in autumn | 0.8840 ** | 0.4725 | 0.7896 ** | 0.7166 |
| LOS and average LST in spring and autumn | 0.8388 ** | 0.6377 * | 0.8016 ** | 0.7589 |
* p < 0.05; ** p < 0.01.
Table 3.
Pearson correlation coefficient between SOS, EOS, LOS, spring LST, autumn LST, and distance.
Table 3.
Pearson correlation coefficient between SOS, EOS, LOS, spring LST, autumn LST, and distance.
| Beijing | Zhengzhou | Xi’an | Xuzhou | |
|---|---|---|---|---|
| SOS and distance | 0.8311 ** | 0.6581 * | 0.7380 * | 0.5196 |
| EOS and distance | –0.9218 ** | –0.1584 | –0.3549 | –0.4459 |
| LOS and distance | –0.9278 ** | –0.4369 | –0.5369 | –0.3479 |
| Spring LST and distance | –0.7325 ** | –0.9546 ** | –0.9445 ** | –0.8425 * |
| Autumn LST and distance | –0.7713 ** | –0.8429 ** | –0.8044 ** | –0.8428 * |
* p < 0.05; ** p < 0.01.
Table 4.
Intra-urban vegetation phenological metrics and LST in spring.
| Earliest SOS (DOY) | Latest SOS (DOY) | SOS Difference (Day) | Highest Spring LST (°C) | Lowest Spring LST (°C) | LST Difference (°C) | |
|---|---|---|---|---|---|---|
| Beijing | 117.40 | 122.20 | 4.8 | 31.80 | 28.00 | 3.80 |
| Zhengzhou | 94.70 | 97.90 | 3.2 | 26.52 | 23.96 | 2.56 |
| Xi’an | 101.40 | 108.60 | 7.2 | 25.02 | 23.35 | 1.67 |
| Xuzhou | 119.40 | 125.10 | 5.7 | 24.30 | 22.90 | 1.40 |
Note: the SOS difference is the difference between the latest and earliest SOS in the intra-urban area, which represents the advance days in the earliest SOS areas compared to the latest SOS areas; the LST difference is the maximum difference between the highest and lowest LST.
Table 5.
Intra-urban vegetation phenological metrics and LST in autumn.
| Earliest EOS (DOY) | Latest EOS (DOY) | EOS Difference (Day) | Highest Autumn LST (°C) | Lowest Autumn LST (°C) | LST Difference (°C) | |
|---|---|---|---|---|---|---|
| Beijing | 267.20 | 280.70 | 13.50 | 27.60 | 23.90 | 3.70 |
| Zhengzhou | 291.20 | 298.30 | 7.10 | 30.12 | 28.10 | 2.02 |
| Xi’an | 275.80 | 291.10 | 15.30 | 28.48 | 25.97 | 2.51 |
| Xuzhou | 262.80 | 265.00 | 2.20 | 21.30 | 19.30 | 2.00 |
Note: the EOS difference is the difference between the latest EOS and earliest EOS in the intra-urban area, which represents the delay days in the latest EOS areas compared to the earliest EOS areas; the LST difference is the maximum difference between the highest and lowest LST.
Disclaimer/Publisher’s Note: The statements, opinions and data contained in all publications are solely those of the individual author(s) and contributor(s) and not of MDPI and/or the editor(s). MDPI and/or the editor(s) disclaim responsibility for any injury to people or property resulting from any ideas, methods, instructions or products referred to in the content. |
© 2023 by the authors. Licensee MDPI, Basel, Switzerland. This article is an open access article distributed under the terms and conditions of the Creative Commons Attribution (CC BY) license (https://creativecommons.org/licenses/by/4.0/).
Share and Cite
MDPI and ACS Style
Yang, Y.; Qiu, X.; Yang, L.; Lee, D. Impacts of Thermal Differences in Surfacing Urban Heat Islands on Vegetation Phenology. Remote Sens. 2023, 15, 5133. https://doi.org/10.3390/rs15215133
AMA Style
Yang Y, Qiu X, Yang L, Lee D. Impacts of Thermal Differences in Surfacing Urban Heat Islands on Vegetation Phenology. Remote Sensing. 2023; 15(21):5133. https://doi.org/10.3390/rs15215133
Chicago/Turabian StyleYang, Yongke, Xinyi Qiu, Liuming Yang, and Dohyung Lee. 2023. "Impacts of Thermal Differences in Surfacing Urban Heat Islands on Vegetation Phenology" Remote Sensing 15, no. 21: 5133. https://doi.org/10.3390/rs15215133
Note that from the first issue of 2016, this journal uses article numbers instead of page numbers. See further details here.