
Estimation of Lightning Activity of Squall Lines by Different Lightning Parameterization Schemes in the Weather Research and Forecasting Model


1
Key Laboratory of Middle Atmosphere and Global Environment Observation (LAGEO), Institute of Atmospheric Physics, Chinese Academy of Sciences, Beijing 100029, China
2
Collaborative Innovation Center on Forecast and Evaluation of Meteorological Disaster (CICFEMD), Nanjing University of Information Science & Technology, Nanjing 210044, China
3
College of Earth and Planetary Science, University of Chinese Academy of Sciences, Beijing 100049, China
*
Author to whom correspondence should be addressed.
Remote Sens. 2023, 15(20), 5070; https://doi.org/10.3390/rs15205070
Submission received: 6 September 2023
/
Revised: 11 October 2023
/
Accepted: 19 October 2023
/
Published: 23 October 2023
(This article belongs to the Special Issue Advancements in Thunderstorm Nowcasting and Atmospheric Electricity Monitoring by Remote Sensing)
Abstract
:Based on three-dimensional lightning data and an S-band Doppler radar, a strong relationship was identified between lightning activity and the radar volume of squall lines. A detailed analysis of the squall line investigates the relationship following an exponential relationship. According to the correlation between lightning and the radar volume, three radar-volume-based lightning parameterization schemes, named the V30dBZ, V35dBZ, and V40dBZ lightning schemes, have been established and introduced into the weather research and forecasting (WRF) model. The performance of lightning precondition by different lightning parameterization schemes was evaluated, including the radar-volume-based schemes (V30dBZ, V35dBZ, and V40dBZ), as well as existing lightning schemes (PR92_1, PR92_2, and the Lightning Potential Index (LPI)). The evaluation shows that the simulated spatial lightning density and temporal lightning frequency by the radar-volume-based lightning schemes are more consistent with the observations. While the two PR_92 lightning schemes significantly underestimated the magnitude of lightning density. The radar-volume-based lightning parameterization schemes are proven to be more reliable in estimating lightning activity than other lightning schemes.
1. Introduction
Lightning hazards not only bring damage to industries and agriculture but also threaten human life. Accurate forecasting and nowcasting of lightning are essential for mitigating these risks and ensuring public safety. Furthermore, lightning serves as a valuable tool for investigating scientific insights into severe convective weather, as well as improving thunderstorms and precipitation forecasts [1,2,3,4]. Lightning frequency indicate disastrous weather events associated with thunderstorms, such as hail, wind gusts, and heavy rainfall [5,6].
Lightning activity is intimately related to the dynamical and microphysical processes of thunderstorms [7,8,9]. Related studies have established robust quantitative relationships between the lightning flash rate and different convective parameters representative of thunderstorm intensity, such as temperature, convective available potential energy (CAPE) [2,10], wind shear [11,12], relative humidity [13,14,15], cloud bottom height [16], the volume of graupel and ice [17,18,19], and updraft [7,20]. In addition, the relationships among lightning, dynamics, and microphysics are complicated, and exhibit distinct characteristics in different geographical regions.
Generally, thunderstorms with high radar reflectivity tend to have longer lifetimes and a more extensive convective zone accompanied by higher amounts of IC (intra-cloud) and CG (cloud-to-ground) lightning as compared to storms with moderate radar reflectivity [21]. The relationship between radar echo and lightning activity has been firmly established in numerous studies [18,20,22,23,24]. Most lightning flashes concentrate in the convective region with strong radar echo greater than 30 dBZ. Different lightning parameterization schemes have been established based on the relationship between lightning frequency and dynamical factors, such as cloud-top height (CTH), the maximum updraft velocity [25], the volume of ice particles, and the radar echo volume in the mixed-phase region [26,27].
According to the charge transfer after the collision between different categories of hydrometeor particles, electrical parameters can be directly obtained based on the simulation by different models coupled with the electrification charging mechanism and lightning discharge parameterization [26,28,29,30,31]. Mansell et al. [29] simulated the electrical parameters, including charge structure, electric field and lightning frequency by lightning discharge parameterization, and different non-inductive charging schemes. Different types of thunderstorms demonstrated different charge structures and lightning characteristics based on various charging mechanisms and lightning parameterization [32,33,34]. In addition, the electric potential and the intra-cloud electric field are calculated directly based on the WRF model coupled with the charging mechanism [35].
Furthermore, different lightning parameterization schemes relying on the relationship between lightning activity and convective parameters have been proposed for lightning prediction by different numerical models [36]. Cloud-resolving numerical models have the capability to simulate the spatiotemporal dynamics and microphysics of thunderstorms. Table 1 lists some simulation studies on lightning prediction by different convective parameters. Price and Rind [37] incorporated lightning parameterization schemes into the weather research and forecasting (WRF) model based on the relationship between lightning frequency with CTH and the maximum updraft velocity, respectively. McCaul et al. [38] proposed two lightning parameterization schemes in the WRF model based on upward fluxes of precipitating ice hydrometeors in the mixed-phase region at the level of −15 °C and the vertically integrated amounts of ice hydrometeors in each model grid column. The results showed that the first method can capture much of the temporal variability of the lightning threat. In contrast, the second method does a better job of depicting the overall coverage of the threat. Li et al. [39] proposed a method to predict lightning density based on the masses of sinkable and non-sinkable ice in a mesoscale model. A combination of weight sets of sinkable and non-sinkable ice contribution for the lightning parameterization is provided. Furthermore, six convective parameters obtained from the WRF model, including precipitation ice mass, ice water path, ice mass flux, updraft volume, maximum vertical velocity, and CTH, are selected to predict lightning activity [40]. They point out that the maximum vertical velocity is a better indicator of lightning activity in severe convective storms. The mass flux of ice-phase particles can characterize the trend of lightning activity. In addition, the ice–water channel is more accurate for estimating the lightning activity of severe thunderstorms, while CTH is good at predicting isolated thunderstorms. However, the updraft volume is not practical in lightning forecasting of thunderstorms. The predicted lightning activity simulated by different single lightning parameterization schemes has its own different advantages and disadvantages.
In addition, lightning prediction and forecasting have been improved by employing combined lightning parameterization schemes rather than relying on a single scheme. Bright et al. [41] developed a multi-parameter lightning parameterization scheme that combines parameters such as lift condensation height (LCL), middle-level convective available potential energy (CAPE), and equilibrium layer temperature. Furthermore, the lightning potential index (LPI) and the index of potential electrical energy index (EP) have been introduced into convection-permitting regional climate models, which integrate the dynamics and microphysics factors to predict lightning activity associated with thunderstorms [8,42,43]. However, Mortelmans et al. [44] pointed out that there is no single best method to predict lightning, but a finer model resolution improves the accuracy of the models. Different numerical models on a global scale can predict a wide range and long periods of lightning activity and its change. For example, Tost et al. [45] used four lightning parameterization schemes, including updraft velocity, CTH, updraft volume flux, and surface convective precipitation with a global atmospheric chemistry general circulation model ECHAM5/MESSy, to predict the lightning frequency, with each combination requiring a scaling factor to improve the simulation accuracy. It is important to note that different convective and environmental factors have varying effects on the accuracy of lightning forecasts. Using global climate model, Romps et al. [46] highlighted the importance of CAPE×P (CAPE times precipitation) as an indicator for accurate lightning forecasting. Subsequently, Finney et al. [47] used the flux of cloud–ice parameters from a UK Chemistry and Aerosols model (UKCA) coupled with the atmosphere model (UM-UKCA) to predict lightning activity under climate change scenarios. Different thunderstorm cases are accompanied by distinct environmental conditions, typically resulting in different lightning flash rates. Therefore, it is uncertain whether lightning parameterization schemes can universally estimate lightning activity for thunderstorms in different environments.

Table 1.
The related studies of lightning prediction scheme and parameters by different models.
| Reference | Parameters | Model |
|---|---|---|
| Price and Rind [37] | CTH, updraft | WRF |
| McCaul et al. [38] | upward fluxes of precipitating ice, vertically integrated amounts of ice | WRF |
| Li et al. [39] | masses of sinkable and non-sinkable ice | WRF |
| Barthe et al. [40] | precipitation ice mass, ice–water path, ice mass flux, updraft volume, w, CTH, updraft volume | WRF |
| Bright et al. [41] | combine LCL, middle-level CAPE and equilibrium layer temperature | WRF |
| Yair et al. [42] | LPI | WRF |
| Lynn et al. [8] | EP | WRF |
| Tost et al. [45] | updraft velocity, CTH, updraft volume flux, and surface convective precipitation | ECHAM5/MESSy |
| Romps et al. [46] Finney et al. [47] | CAPE × P flux of cloud–ice parameters | global climate model (GCM) UM-UKCA |
This study aims to evaluate and verify the ability to predict lightning activity by different lightning parameterizations based on the WRF model, focusing on the type of squall line during the comprehensive coordinated field project [2]. Based on lightning data, Doppler radar and meteorological data, the relationship between lightning activity and the radar echo volume was quantified, and radar-based lightning parameterization schemes were established and implemented into the WRF model. Furthermore, the lightning activity of typical squall lines was thoroughly examined to evaluate the performance of the existing different lightning schemes and the established radar-volume-based schemes in the WRF model. The results will provide the response of lightning prediction to different lightning schemes in thunderstorms over the study region and enhance our understanding of the relationship between convective factors and lightning activity. Effective lightning schemes are crucial for improving our understanding of lightning predictions and improving lightning forecasting.
2. Materials and Methods
2.1. Data
2.1.1. Lightning Data
Lightning data, including IC and CG lightning, are obtained from the Beijing Broad Lightning Network (BLNET), which is a regional, multi-frequency band integrated lightning detection and location network that covers the entire Beijing area and parts of Hebei and Tianjin provinces, as shown in Figure 1. The BLNET consists of 16 stations covering 110 km in the west–east direction and 120 km in the north–south direction, each station is equipped with a fast antenna, a slow antenna, a low-frequency (LF) antenna, and some stations are equipped with a very high-frequency (VHF) antenna. In this study, the LF lightning signal is used to provide three-dimensional lightning radiation sources with high spatial and temporal lightning location information [48]. The time-to-arrival (TOA) positioning algorithm is adopted to locate the lightning position according to the time difference of the lightning arriving at different stations by LF signal. The Chan algorithm [49,50] and the Levenberg–Marquardt methods [51] are combined to accurately determine the location of the lightning radiation source. The evaluation of the detection performance of the BLNET shows that the detection efficiency of the network for the total lightning frequency reached 93.2%, with theoretical horizontal errors of <200 m and vertical errors of <500 m [52]. Details of the location algorithm and the lightning efficiency of BLNET are provided by Wang et al. [48]. In addition, the horizontal location error of the BLNET is determined between 52.9 and 250 m by the lightning location results of the lightning hitting the high tower, which is captured by high-speed cameras. In brief, the BLNET could provide reasonably decent lightning location information.
To locate accurate lightning, the lightning radiation sources are grouped by specific rules. Firstly, only the lightning radiation sources detected by at least four stations are considered. Secondly, the lightning radiation sources are grouped as one single lightning within a time of less than 400 ms (millisecond) and a distance of less than 15 km [2,24]. Meanwhile, isolated locations are excluded to eliminate the possible background noise. To identify the IC and CG lightning, the lightning radiation sources containing the return stroke were identified as the CG lightning with the first return stroke serving as its location and timing information. On the other hand, the first position of the lightning radiation source represents the location of IC lightning. In addition, return strokes with positive and negative polarities are determined as positive CG (PCG) and negative CG (NCG) lightning, respectively. However, it should be noted that intense or long-distance IC lightning could be incorrectly recognized as PCG lightning, and thus, PCG lightning with a current less than 10 kA is identified as IC lightning, according to Cummins et al. [53].
2.1.2. Radar Data
The radar reflectivity used in this study is obtained from the Beijing S-band Doppler radar located at coordinates (39.8°N, 116.4°E). Nine elevation angles are scanned every 6 min from 0.5° to 14.5° with a radius of 230 km. The composited radar reflectivity represents the maximum reflectivity at each angle utilized in this study, which is interpolated into 0.01° (latitude) × 0.01° (longitude) × 1 km (height).
2.1.3. Metrological Data
In addition, the reanalysis data of ERA-Interim from the ECMWF (European Centre for Medium-Range Weather Forecasts), with a resolution of 0.25° × 0.25°, are used to analyze the synoptic background of the squall line. The 1° × 1° reanalysis data of the NCEP (National Centers for Environment Prediction)-FNL (Final Analysis) are used as the initial field of the WRF model to investigate the dynamical and microphysical characteristics of the squall line. Sounding data are acquired from the Beijing Meteorology Administration.
2.1.4. WRF Model Configuration
In this study, the WRF model is used to simulate the lighting activity using different lightning schemes. Two domain nested grids within the resolutions of 3 km and 1 km are set in the mode. The main model configurations and physical parameterization schemes are shown in Table 2. The simulation period is from 0000 UTC to 2400 UTC on three squall lines, 20170707, 20170808, and 20150727, with a spin-up time of 6 h.
2.2. Lightning Parameterization Schemes in the WRF Model
A total of four lightning parameterization schemes for lightning prediction are currently available in the WRF numerical model. Three of them, named in order based on PR92, are based on the findings of Price and Rind [37]. As lightning is closely related to the updraft velocity and CTH of a thunderstorm, Price and Rind [37] established a relationship between lightning frequency and CTH based on observations. The empirical formula for lightning frequency () and CTH () is shown as follows:
The strength of the updraft is tightly correlated with the CTH of a thunderstorm [54]; therefore, the relationship between the lightning frequency and the maximum updraft velocity is modified as follows:
As a result, the PR92_1 scheme mainly relies on the maximum vertical speed to reflect the lightning frequency via Formula (2). The PR92_2 scheme mainly depends on the 20 dBZ height, with Formula (1) establishing the correlation between the lightning frequency and the CTH. This follows, as the PR92 3 scheme is not used in this study because it requires a specific cumulus convection parameterization scheme and a simulated resolution that is between 10 and 50 km.
In addition to the two PR92 lightning parameterization schemes, the LPI scheme as an energy index, which is an integrated influence of the vertical wind velocity and different hydrometer particles, is also considered. The LPI is defined as the vertical integral of the hydrometer particles mass flux in the electrification region (0~−20 °C), and calculated by the mixing ratio of the different types of hydrometer particles and the updraft velocity. The formula is described as follows:
where V represents the cloud volume between the 0 and −20 °C temperature layers, w represents the velocity in the vertical direction in m/s, the triple integral ranges from 0 °C to −20 °C based on the temperature layer, and ε is a dimensionless number ranging between 0 and 1. More details can be seen in the reference of Yair et al. [42].
In the formula, represents the total liquid water mixing ratio, represents the ice-phase particle mixing ratio, including snow, ice crystal and graupel particles. The unit of and is kg/kg. The following is the specific formula for :
where represents the mixing ratio of snow particles, represents the mixing ratio of ice crystal particles, represents the graupel particles in kg/kg. The value of reaches the maximum as the mixing ratio of total liquid water is equal to the mixing ratio of total ice-phase particles.
3. Results
3.1. The Study Case
Squall lines are considered one of the most severe thunderstorms in the study region [2]. Related studies of the concerned region found that convective cells usually initiated along the mountain slope and gradually intensified in the south plain area, forming a morphology with a linear convective zone and a larger-scale stratiform region [19,55]. Table 3 presents the characteristics of lightning activity in seven squall lines. It demonstrates that squall lines are primarily influenced by cold vortexes and deep troughs at 500 hPa. Under the influence of cold- and warm-moisture airflow, the convective cells are generated along the mountain edge and propagated from northwest to southeast gradually. With the convective cells intensified and merged, the convective region formed linearly following the stratiform region. Typically, the squall line is generated in the late afternoon (local time UTC+8 h) and has a long lifetime of 5–16 h. The average lightning frequency of different squall lines fluctuated significantly, with a maximum of 284 fl 6 min−1 and a minimum of 8.5 fl 6 min−1. Some squall lines have high lightning frequency, with the maximum lightning frequency reaching 1256 fl 6 min−1, while some squall lines generate low lightning frequency with a maximum value of only 96 fl 6 min−1 during the whole lifetime. The squall line, which is referred to as squall line 20170707 occurred in the study region and is being investigated deeply. It lasts for more than 5 h, generating frequent lightning, strong wind with a maximum wind speed of 32 m/s, and hailstones with a diameter of 1–5 cm. The synoptic background of the squall line is primarily influenced by a cold vortex with a low-pressure center at Inner Mongolia at 500 hPa, which increased to 850 hPa. The CAPE value reaches 2955 J kg−1 and the convective inhibition (CIN) is relatively small, measuring only 82 J kg−1 at 1200 UTC (figure not shown here). There is a substantial accumulation of unstable energy, making it favorable for the initiation of convection.
At the initial stage, a convective cell formed in the western mountains of the study region. As the convective cells moved eastward, the intensity and scale of the squall line increased and further expanded, eventually forming linear convection (Figure 2a). During the early stage, lightning mainly concentrated in the strong radar echo with a radar reflectivity greater than 35 dBZ. At 1312 UTC (Figure 2b), as the squall line entered its mature stage, the convective line presented an obvious bow echo with frequent lightning densely distributed in the area with high radar reflectivity greater than 45 dBZ. Meanwhile, some lightning concentrated at the edge of strong radar echo with a larger gradient. At 1348 UTC (Figure 2c), the intensity of radar reflectivity gradually weakened, coinciding with a decrease in lightning frequency. As the convection moved out of the study region, the number of lightning flashes decreased significantly. Some lightning occurred in the trailing stratiform region. Due to the consumption of water vapor and the cold pool by the squall line, a new convection cell was initiated in the western mountain area and gradually strengthened (Figure 2d). As the convective system moved easterly to the plain area, the convective cells formed a linear morphology accompanied by active lightning. However, the intensity of convection and the lightning frequency performed notably weaker than the first squall line. After that, as the convective system moved out of the study region, the lightning frequency decreased sharply. Throughout the entire lifetime of the squall line, most of the lightning flashes were concentrated in the areas within high radar reflectivity exceeding 30 dBZ, while only a small fraction of lightning occurred in the trailing stratiform region.
3.2. The Establishment of Radar-Based Lightning Parameterization Schemes
The radar echo volume (V30dBZ, V35dBZ, and V40dBZ) within the temperature layer of 0 °C to −40 °C serves as indicators to reflect the intensity of thunderstorms. The radar volumes not only represent the strength of the convective structure but also provide insights into the distribution of different hydrometeor particles. The charge separation of thunderstorms primarily occurs in the mix-phase region, where both ice-phase and liquid-phase hydrometer particles coexist. The radar volumes are calculated by the radar area (30 dBZ, 35 dBZ, and 40 dBZ composite reflectivity region) in the horizontal level and extend through all vertical levels of the grid. Using temperature levels interpolated from the sounding data, the radar echo volume is constrained to vertical levels within the mixed-phase region with the temperature of 0 °C to −40 °C.
The temporal lightning frequency and radar echo volumes (V30dBZ, V35dBZ, and V40dBZ) within the 0 °C to −40 °C temperature layer demonstrated a bi-modal distribution (Figure 3). The lightning frequency exhibited a double-peak distribution, corresponding to the occurrence of two separate squall lines with a maximum of 416 fl 6 min−1. With the radar echo volumes gradually expanding in the mixed-phase region, the lightning frequency progressively increased. The peak values of V30dBZ, V35dBZ, and V40dBZ occurred at approximately the same time, reaching maximum values of 38,000 km³; 25,000 km; and 14,000 km³, respectively. The maximum lightning frequency preceded the peak radar echo volume, which was greater than 30 dBZ of the first squall line, while there existed a lag of approximately 20 min behind V35dBZ and V40dBZ. Similarly, the maximum lightning frequency led the volume of the strong radar echo (V30dBZ, V35dBZ, and V40dBZ) for the second squall line by approximately 18 min. The increase of lightning frequency is faster than the strengthen of the radar echo volume, which indicates that lightning can reflect the intensity of convection in advance. For the volume of radar echo with a greater than 35 dBZ (V35dBZ and V40dBZ) lag behind peak lightning frequency, the lightning discharge is highly consistent with the charge region where most of the noninductive charging processes occur. With the strong radar echo volume reaching the maximum, the electrification and discharge of thunderstorms are severe and frequent, leading to high lightning frequency.
In order to explore the specific relationship between lightning activity and radar echo volumes, the correlation was investigated. Using the case of 20170707 as an example, lightning frequencies and radar echo volumes greater than 30 dBZ, 35 dBZ, and 40 dBZ were analyzed for every 6 min period during the lifetime of the squall line (Figure 4). Comparing other nonlinear fitting findings, the revealed exponential function between the lightning frequency and the volume of radar echo shows the best-fit relationship, as shown in Figure 4. In addition, the lightning frequency and the radar echo volume of seven squall lines all present as an exponent relationship. The function is as follows:
where F represents the lightning frequency in fl 6 min−1; represents the V30dBZ, V35dBZ, and V40dBZ in km3; and and represent fitting parameters. The highest fit degree R2 is 0.87 with a fitting parameter of 0.91 and of 1.48 × 10⁻⁴ in the lightning parameterization scheme of V30dBZ, as shown in Table 4. For the scheme of V35dBZ, the fit degree R2 is 0.83 with a fitting parameter a of 1.51 and b of 2.03 × 10⁻⁴, and R2 is 0.76 for the scheme of V40dBZ with a fitting parameter a of 2.74 and b of 2.91 × 10⁻⁴. The fitting findings passed a 99% significance test, suggesting that the exponential formula is capable of accurately reflecting the relationship between radar echo and lightning frequency. Based on this relationship, three radar-volume-based lightning parameterization schemes are established.
3.3. The Comparative Verification of Dynamical and Microphysical Characteristics of the Squall Line
According to the observed relationship between radar echo volume and lightning frequency, three radar-volume-based lightning parameterization schemes are introduced into the WRF model. To verify the reliability of simulation results, the convective structure, the morphology of radar echo, and the intensity of radar reflectivity at several typical moments of squall lines were compared with the observations. However, it should be noted that the simulation results showed a time deviation of 72 min earlier than the observations. As depicted in Figure 5a,e, the simulated propagation direction and morphology of the squall line matched with the observations during the developing stage. The simulated maximum radar reflectivity reached 50 dBZ, which performed weaker than the observation with the reflectivity of 60 dBZ. However, the simulation failed to capture the strong radar echo in the northern part of the squall line, possibly because of the effect on mountain topography or the local circulation preventing convection in that area. At the mature stage, the convective region presented apparent linear morphology from the northeast that extended to the southwest with a maximum radar reflectivity of 60 dBZ. The simulation reproduced the convective structure of the squall line. However, the northward convective cells along the convective line were not captured (Figure 5h). With the convection further developed (Figure 5c), the intensity of the squall line reached its maximum, with strong radar echoes concentrated in the urban area. The main convective structure of the simulation matched well with the observation, in which the center was located in the metropolitan area. However, the simulated magnitude of radar reflectivity was relatively weaker than the actual situation. While the westward convective cell along the leading line could not be reproduced (Figure 5g). In the subsequent development of the squall line, the position of the convection region drifted slightly southward, and the intensity of radar reflectivity dissipated faster than the observation. At the dissipating stage (Figure 5d), the simulated convective leading line broke apart and diminished, whereas the observed radar echo s maintained its linear structure. The simulated convective structure of the squall line dissipated and disappeared relatively faster than observation. Related studies pointed out that the underlying surface played an important role in the convection, and local circulation might influence the initiation and intensification of the squall line [56,57]. Despite a difference between the simulation and observations, the convective structure and propagation pathway of the squall line were generally consistent with the observations, indicating that the model effectively reproduced the convective structure of the squall line.
The simulated and observed vertical cross-section of the radar echo and the updraft were compared (Figure 6). The vertical cross-section of radar echo with three-dimensional lightning radiation sources showed at 1254 UTC (corresponding to the simulation of 1148 UTC). The squall line developed directly into a high level one with a radar reflectivity of 60 dBZ reaching 6 km and 50 dBZ at 12 km. Lightning radiation sources are mainly concentrated in the strong radar echo greater than 30 dBZ, with only a small number of lightning radiation sources distributed in the weak echo region (less than 30 dBZ). The height of lightning radiation sources is mainly concentrated between 6 km and 11 km, indicating that the main charge region located within this range. The intensity of the simulated radar echoes was relatively weaker than the observation, with the height of a strong radar echo greater than 45 dBZ below the observation. The increased inclination of the vertical airflow and the lower convective region downdraft suggested that the strong vertical wind shear played a crucial role in maintaining the development of organizational convection. Despite the intensity of the simulated convection being weaker than the observation, the overall convective structure and the morphology of squall lines are basically reproduced.
The vertical distributions of the mixing ratio of graupel particles, ice crystals, and snow particles at two moments of squall line are depicted in Figure 7. At 1124 UTC (Figure 7a), corresponding to the formation of a convective line, graupel particles were primarily distributed in a level between 4 km and 13 km with a concentration between 6 km and 11 km, which is associated with high radar reflectivity. Ice crystals and snow particles concentrated at a higher level of squall line, with the ice crystals located between 9 and 12 km (Figure 7b) and the snow particles distributed from 7 km to 13 km (Figure 7c). With the rearward slope of the squall line increased (Figure 7e), the maximum mixing ratio of graupel particles dropped from 2.0 g/kg to 1.6 g/kg, and the corresponding height decreased from 12 km to 8 km. The presence of abundant ice-phase particles, especially graupel-sized particles, facilitated electrification, as indicated by a value greater than 30 dBZ, which represents the content and distribution of different categories of ice-phase particles in the mixed phase region. The distribution of hydrometeor particles further verified that the simulation could reflect the convective structure of the squall line. Therefore, the lightning activity could be estimated with reasonable accuracy.
3.4. The Comparison by Different Lightning Parameterization Schemes
The vigorous period of the squall line occurred from 1248 UTC to 1348 UTC, corresponding to 1136 UTC–1236 UTC at simulation time, which was selected to verify the simulated lightning activity by different lightning parameterization schemes. Figure 8 demonstrated the spatial distribution of simulated lightning density within one hour by different lightning parameterization schemes, including the PR92_1 scheme, the PR92_2 scheme, LPI, and the volume of strong radar echo (V30dBZ, V35dBZ, and V40dBZ) lightning schemes during this period. The observed lightning density presented a trend distribution from northeast to southwest, with the center of lightning density concentrating in the middle of the study region, basically corresponding to the strong radar echo of the squall line. The average observed lightning density is 0.6 flashes km−2, with a maximum of 5.4 flashes km−2 (Figure 8g). The simulated lightning density by two of the PR92 schemes is an order of magnitude lower than the observed value (Figure 8a,b). The lightning density simulated by LPI demonstrated a dispersed distribution but was basically concentrated in the middle of the study region, corresponding to the high-value area of observation (Figure 8c). The spatial distribution of lightning density simulated by the V30dBZ scheme approached the actual situation, with a maximum lightning density of 3.5 flashes km−2 (Figure 8d). Based on the V35dBZ lightning scheme, the center of lightning density shifted northwestward compared to the observations, with a peak value of 4.5 flashes km−2 (Figure 8e). The magnitude of maximum lightning density simulated by V40dBZ scheme reaches 5.0 flashes km−2 which is closer to the observed value (Figure 8f). Compared to the observations, the center of lightning density shifted northeasterly based on radar-volume-based lightning schemes, but the overall distribution of lightning density simulated by radar volume schemes is more consistent with the observation.
Figure 9 presented the observed and simulated spatial distribution of lightning density by different lightning parameterization schemes during the whole lifetime of the squall line with simulation time from 1024 UTC to 1324 UTC, corresponding to observation time of 1136 UTC–1436 UTC. The observed lightning density exhibited a northwest-to-southeast orientation distribution, primarily concentrated in the south plain area, with an average lightning density of 1.2 flash km−2 and a maximum of 6.2 flashes km−2 (Figure 9g). For the two PR92 lightning schemes, the center of lightning density was mainly concentrated in the north mountain-to-plain area. Similar to the one-hour lightning prediction, the magnitude of lightning density obtained from two PR92 schemes is 10 times smaller than the observation (Figure 9a,b). The high-value energy simulated by the LPI scheme region corresponded to the higher probability of lightning density. Although the simulated scale of lightning energy is larger than the observations, the LPI scheme has the ability to capture the general lightning locations but with discontinuous distribution. The distribution of lightning density by the V30dBZ scheme is aligned with the propagated path of the squall line, and the magnitude of lightning density is closely consistent with the observations with a maximum value of approximately 4.5 flashes km−2 and an average lightning density of 1.1 flash km−2 (Figure 9d). However, the center of lightning density, as predicted by the V30dBZ scheme, exhibited a deviation shifting to the northeast compared to the actual observations. The spatial distribution of lightning density estimated by the V35dBZ scheme resembled that of the V30dBZ but also shifted to the northwest with the maximum reaching 4.8 flashes km−2 (Figure 9e). Notably, the spatial distribution and the magnitude of lightning density reproduced by the V40dBZ scheme are in good agreement with the observations. In addition, the maximum lightning density reaches 5.2 flashes km−2, which is highest among five lightning schemes and closer to the observation (Figure 9f). To a certain extent, all of the lightning parameterization schemes have the ability to describe the spatial distribution of lightning activity. But the magnitude and spatial distribution of lightning density are better reproduced by lightning schemes based on radar volumes. The V40dBZ scheme simulated the better spatial distribution of lightning density which matched the observation, while the V30dBZ lightning scheme reproduced the better magnitude of lightning density to the actual scenario. It indicates that each lightning scheme has its own advantages for lightning prediction.
In addition, the temporal evolution of lightning frequency by six lightning parameterization schemes and the observation are also investigated (Figure 10). To facilitate a clear comparison between the simulated and observed lightning frequency, the simulation was normalized to the same observation period. Both the observed lightning frequency and the simulated lightning frequency by different lightning schemes (PR92_1, PR92_2, V30dBZ, V35dBZ, and V40dBZ) basically demonstrated a unimodal distribution. The lightning frequency gradually increased and reached a peak value at the mature stage, and then decreased as the squall line gradually weakened. With regard to the PR92_1 scheme, the timing of peak lightning frequency occurrence appeared earlier than the observation, in which the magnitude accounted for only about one-sixth of the observed value (Figure 10a). By the PR92_2 scheme, the multiple peaks demonstrated a similar magnitude but accounted for only about one-twenty-sixth of the observation (Figure 10b). The LPI scheme showed an earlier occurrence of the peak lightning frequency compared to the observation (Figure 10c). On the other hand, the lightning frequency simulated by three lightning schemes relied on radar echo volume, which exhibited a consistent temporal trend with the observation, and the magnitudes of the lightning frequencies were closer to the observed values (Figure 10d). Nevertheless, the maximum of lightning frequencies by three radar echo volume-based lightning parameterization schemes (V30dBZ, V35dBZ, and V40dBZ) are all higher than the observation. The timing of peak lightning frequency simulated by the V40dBZ scheme was in good agreement with the observation. However, the maximum lightning frequency simulated by the V30dBZ and V35dBZ performed a delay feature compared to the observation.
The discrepancies between two PR92 schemes and three lightning parameterization schemes (V30dBZ, V35dBZ, and V40dBZ) resulted in variations in the lightning estimation. The PR92_1 lightning scheme mainly relied on the relationship between lightning frequency and the updraft in thunderstorms. Previous studies have suggested that lightning activity increases rapidly when the updraft is strong and the downdrafts begin to appear [56]. Consequently, the simulated lightning by the PR92_1 scheme occurred earlier than the observation. The intensity of the simulated convection performed weaker than the observation, in addition, the convection of the squall line dissipated faster than the actual situation. Due to the lightning activity calculated by the PR92_2 scheme mainly relying on the height of 20 dBZ radar echo, the predicted lightning density was smaller than observation. The calculation of the LPI scheme relied on the hydrometer particles and the updraft velocity in the mix-phase region with the temperature from 0 to approximately −20 °C, but the electrification basically occurred in the region with the temperature ranging from 0 °C to approximately −40 °C. This also led to LPI preceding the peak lightning frequency of observation.
In contrast, lightning parameterization schemes based on the volume of strong radar echo (V30dBZ, V35dBZ, and V40dBZ) considered the influence of larger-sized particles and strong updrafts in the mix-phase region, which played crucial roles in the non-inductive electrification of the squall line. The non-inductive charge mechanism, primarily relying on collisions between different sizes of ice-phase particles, is considered the most significant electrification mechanism [58,59]. Therefore, the lightning activity simulated by three radar volume-based lightning parameterization schemes (V30dBZ, V35dBZ, and V40dBZ) is more accurate than the other two PR92 schemes. However, it is worth noting that the lightning prediction reproduced by the three different radar volume-based schemes still overestimated the actual lightning frequency. The mismatch in the intensity of convection likely contributed to the discrepancy in lightning activity between the simulation and the observation.
3.5. The Verification of Lightning Prediction in Different Squall Line Cases
In order to evaluate the effectiveness of the V30dBZ, V35dBZ, and V40dBZ lightning schemes, the lightning prediction for two squall lines (named 20150727 and 20170808) was validated by the six different abovementioned lightning schemes (Figure 11). Compared to the observation, the simulation of squall line 20170808 delayed a time deviation of approximately 48 min. However, the convective structure and propagation pathway of the squall line were generally reproduced, moving from west to east. The lightning density concentrated in the south plain area, with a peak value of 9.36 flashes km−2 corresponding to the distribution of a strong radar echo (greater than 30 dBZ). It is important to note that the entire evolution of lightning activity on a large scale of the squall line cannot be captured due to the limitations of lightning detection. The spatial lightning density predicted by two PR92 lightning parameterization schemes is generally consistent with the influenced areas by squall line. The lightning density is mainly located in the south plain area, which corresponded well with the observation.
Additionally, a high-value region occurred in the western area by the PR92_1 scheme, but the magnitude of lightning density is one order of magnitude smaller than the observation (Figure 11(d1)). The maximum lightning density estimated by the PR92_2 scheme only accounted for 1/4 of the observation (Figure 11(e1)). In contrast, the distribution of LPI performed similarly to the actual lightning density (Figure 11(f1)). In addition, the spatial lightning density predicted by the V30dBZ lightning scheme is closely consistent with the observation, with a maximum value of 8.9 flashes km−2. On the other hand, the predicted lightning densities by lightning schemes of V35dBZ and V40dBZ are in good agreement with the observation but with a more considerable peak value of 9.7 flashes km−2 by the V35dBZ scheme and 10.5 flashes km−2 by the V40dBZ scheme (Figure 11(h1–i1)).
Regarding the squall line of 20150727, which is a large-scale convective system, the convective merger, splitting, and reorganization processes occur alternately during the evolution of convection. The simulated intensity of convection and spatial scale of the squall line was less than the observation and delayed for 42 min. It is not expected to accurately capture the convective structure, especially the interaction mechanisms between different convective cells in the linear convective region. As a result, the estimated lightning activities by different lightning parameterization schemes were not as accurate as was desired. The radar-volume-based lightning schemes and LPI scheme performed better than the two PR92 schemes. The magnitude of lightning density simulated by three Vradar lightning schemes is larger than observation, while that of V30dBZ matches well with the observation (Figure 11(g2)). Due to the scale-limitation of lightning detection, the observed lightning only covered the Beijing and surrounding area, and could not capture the complete lightning evolution characteristics. Therefore, the temporal lightning frequency by different parameterization schemes is not discussed in this paper. The analysis also indicated that lightning predictions based on reliable lightning parameterization schemes could supplement the areas lacking lightning information.
4. Summary and Discussion
Based on the three-dimensional lightning data, S-band Doppler radar, sounding, and reanalysis data, the relationships between strong radar echo and the lightning frequency of typical squall lines are investigated. Additionally, radar-volume-based fitting lightning parameterization schemes, named V30dBZ, V35dBZ, and V40dBZ, have been established based on well-organized squall lines. The lightning activities predicted by six lightning parameterization schemes are evaluated in typical squall lines. The main findings of the study are as follows:
(1) Statistical analysis of squall lines revealed there exists a strong correlation with an exponential correlation between lightning frequency and the volume of radar echoes. The lightning parameterization schemes, including V30dBZ, V35dBZ, and V40dBZ, have been established and introduced into the WRF model.
(2) The simulations successfully reproduced the evolution and convective structure of different cases of squall lines, and they are basically consistent with the observations. However, there is a time deviation ranging from 42 min to 72 min between the simulation and observation of squall lines. Two PR92 schemes showed a relatively similar spatial distribution of lightning density to the observations but significantly underestimated the magnitude of lightning density. Although the LPI scheme could not obtain the lightning activity directly, the lightning energy matched well with lightning distribution to some extent. The spatiotemporal lightning activity predicted by the V30dBZ, V35dBZ, and V40dBZ lightning schemes agrees with the observations but with an overestimated magnitude. Each radar volume-based scheme has advantages on the spatial distribution or magnitude of lightning prediction.
(3) The lightning estimation on two different squall lines by the six lightning schemes is verified. The radar-volume-based lightning schemes demonstrated that the lightning prediction in the well-organized squall line performed better than that with complicated convective processes involving convective merger, split, and reorganization. The LPI scheme performed well in predicting the spatial distribution of lightning. Additionally, the spatial and temporal lightning predictions estimated by radar-volume-based lightning schemes performed better than those of other schemes.
Under the unique terrain with three directional surrounding mountains and the southeast ocean, convective cells are initiated along the mountain edge, forming a linear convective system as it develops. Squall lines occurred frequently during warm seasons over the study area. Therefore, the Vradar lightning schemes are established based on the relationship between lightning frequency and different thresholds of radar echo volume in the type of squall lines. In this study, the lightning predictions are estimated by six different lightning schemes in well-organized thunderstorms. Different lightning parameterization schemes relied on the physical connections between lightning activity and distinguished convective factors. The verification of lightning activity by different lightning schemes shows some discrepancies between lightning estimations and observations. The lightning frequency simulated by the PR92_1 and PR92_2 schemes is underestimated with one order less than the actual lightning activity. The lightning prediction strongly relied on the simulated CTH and maximum updraft (PR92 schemes), which reflected the intensity of convection to some extent. However, PR92 schemes are unable to predict high flash rates. In order to produce significant lightning, the simulated storm must extensively develop vertically and extend to a high level. The LPI scheme and Vradar schemes have a good performance on the spatial lightning estimation, which is basically consistent with observations. However, LPI represents an energy parameter that cannot directly obtain the lightning activity. The lightning prediction estimated by V30dBZ, V35dBZ, and V40dBZ lightning schemes showed slight differences demonstrating similar spatiotemporal characteristics in different squall lines. Additionally, the temporal evolution of lightning estimation using three Vradar schemes is closer to the observations, which performed better than LPI. The LPI scheme represents the hydrometer particles and the updraft velocity in the mix-phase region with the temperature from 0 to approximately −20 °C. While the radar-volume-based lightning schemes of V30dBZ, V35dBZ, and V40dBZ primarily depended on ice-phase particles associated with the updraft in the mix-phase region between the layer with the temperature of 0~−40 °C. Usually, the electrification occurred in the mixed-phase region from the temperature level of 0~−40 °C. Therefore, lightning activity simulated by the Vradar scheme outperformed the LPI scheme. Basarab et al. [27] evaluated lightning activity using seven lightning parameterization schemes and found that the most successful updated scheme predicted lightning based on the radar-derived mixed-phase 35 dBZ echo volume. It indicated lightning schemes considering the interaction between dynamics and microphysics that are more suitable for lightning prediction. Three Vradar schemes reflect the spatial and temporal distribution advantages of lightning estimation. It verified that the Vradar scheme is an effective parameter for forecasting lightning activity.
It must be admitted that the accuracy of lightning prediction is highly dependent on the simulation of convection. Mortelmans et al. [44] emphasized that there is no single best method to predict lightning activity. Lightning prediction by model simulation greatly depends on complicated reasons, such as the different model resolutions, model settings, mathematical equations, and initial field. It is vital to note that the success of all lightning schemes strongly relied on the model’s ability to appropriately describe the required input parameters for the given lightning scheme. In this study, only the reanalysis data was used, which means that the dynamics and microphysics simulated by the model may have yet to fully capture the complexity of convective evolution. As a result, the convective structure of the squall line exhibited apparent variations under different microphysical parameterization, and the estimation of lightning activity was also influenced by multiple factors during the simulation. Data assimilation incorporating additional data, such as radar, sounding, and other meteorological data, will enhance the ability of the initial field and improve the estimation of lightning activity. Although only squall lines were evaluated in this study, more validation across different types of thunderstorm cases by different lightning parameterization schemes in predicting lightning activity will supplement in the following work. The radar-volume-based lightning parameterization schemes established in this study offered a referenceable method to estimate the lightning activity without lightning detection. Furthermore, the proposed lightning parameterization schemes based on V30dBZ, V35dBZ, and V40dBZ presented a promising avenue for advancing lightning data assimilation.
Author Contributions
Conceptualization, D.L. and H.Y.; software, C.S. and H.Y.; validation, D.L. and C.S.; formal analysis, D.L. and H.Y.; investigation, D.L. and H.Y.; resources, H.Y. and D.L.; writing—original draft preparation, D.L.; writing—review and editing, D.L. All authors have read and agreed to the published version of the manuscript.
Funding
This research was funded by National Natural Science Foundation of China, Grant number (Grant No.42230609, No.41875007) and the Open Grants of the State Key Laboratory of Severe Weather (2023LASW-B22).
Data Availability Statement
Not applicable.
Acknowledgments
The Beijing Meteorological Administration is appreciated for providing the radar data, sounding data, and auto weather station. The authors are thankful for the effort of all the people participated in the coordinated observations of Dynamic–Microphysical–Electrical processes in severe thunderstorms and lightning hazards.
Conflicts of Interest
The authors declare no conflict of interest.
References
- Metzger, E.; Nuss, W.A. The relationship between total cloud lightning behavior and radar-derived thunderstorm structure. Weather Forecast. 2013, 28, 237–253. [Google Scholar] [CrossRef]
- Qie, X.; Yuan, S.; Chen, Z.; Wang, D.; Liu, D.; Sun, M.; Sun, Z.; Srivastava, A.; Zhang, H.; Lu, J.; et al. Understanding the dynamical-microphysical-electrical processes associated with severe thunderstorms over the Beijing metropolitan region. Sci. China Earth Sci. 2020, 64, 10–26. [Google Scholar] [CrossRef]
- Zheng, D.; Zhang, Y.J.; Meng, Q.; Chen, L.W.; Dan, J.R. Climatological Comparison of Small- and Large-Current Cloud-to-Ground Lightning Flashes over Southern China. J. Clim. 2016, 29, 2831–2848. [Google Scholar] [CrossRef]
- Harel, M.; Price, C. Thunderstorm Trends over Africa. J. Clim. 2020, 33, 2741–2755. [Google Scholar] [CrossRef]
- Schultz, C.J.; Carey, L.D.; Schultz, E.V.; Blakeslee, R.J. Kinematic and microphysical significance of lightning jumps versus nonjump increases in total flash rate. Weather Forecast. 2017, 32, 275–288. [Google Scholar] [CrossRef]
- Tian, Y.; Qie, X.; Sun, Y.; Wang, D.; Yuan, S.; Sun, Z.; Lu, G.; Yu, L.; Sun, H.; Li, L.; et al. Total lightning signatures of thunderstorms and lightning jumps in hailfall nowcasting in the Beijing area. Atmos. Res. 2019, 230, 104646. [Google Scholar] [CrossRef]
- Deierling, W.; Petersen, W.A.; Latham, J.; Ellis, S.; Christian, H.J. The relationship between lightning activity and ice fluxes in thunderstorms. J. Geophys. Res. 2008, 113, 1–20. [Google Scholar] [CrossRef]
- Lynn, B.H.; Yair, Y.; Shpund, J.; Levi, Y.; Qie, X.; Khain, A. Using factor separation to elucidate the respective contributions of desert dust and urban pollution to the 4 January 2020 Tel Aviv lightning and flash flood disaster. J. Geophys. Res. 2020, 125, e2020JD033520. [Google Scholar] [CrossRef]
- Stough, S.M.; Carey, L.D.; Schultz, C.J.; Cecil, D.J. Examining conditions supporting the development of anomalous charge structures in supercell thunderstorms in the Southeastern United States. J. Geophys. Res. 2021, 126, e2021JD034582. [Google Scholar] [CrossRef]
- Stolz, D.C.; Rutledge, S.A.; Pierce, J.R.; van den Heever, S.C. A global lightning parameterization based on statistical relationships among environmental factors, aerosols, and convective clouds in the TRMM climatology. J. Geophys. Res. 2017, 122, 7461–7492. [Google Scholar] [CrossRef]
- Fan, J.T.; Yuan, J.M.; Comstock, S.; Ghan, A.; Khain, L.R.; Leung, Z.; Li, V.J. Martins, and M. Ovchinnikov. Dominant role by vertical wind shear in regulating aerosol effects on deep convective clouds. J. Geophys. Res. 2009, 114, D22206. [Google Scholar] [CrossRef]
- Liu, D.; Sun, M.; Su, D.; Xu, W. A five-year climatological lightning characteristics of linear mesoscale convective systems over North China. Atmos. Res. 2021, 256, 105580. [Google Scholar] [CrossRef]
- Grant, L.D.; van den Heever, S.C. Microphysical and dynamical characteristics of low-precipitation and classic supercells. J. Atmos. Sci. 2014, 71, 2604–2624. [Google Scholar] [CrossRef]
- Fan, J.; Zhang, R.; Li, G.; Tao, W.K. Effects of aerosols and relative humidity on cumulus clouds. J. Geophys. Res. 2007, 112, D14204. [Google Scholar] [CrossRef]
- Li, J.; Wu, X.; Yang, J.; Jiang, R.; Yuan, T.; Lu, J.; Sun, M. Lightning activity and its association with surface thermodynamics over the Tibetan Plateau. Atmos. Res. 2020, 245, 105118. [Google Scholar] [CrossRef]
- Williams, E.R.; Mushtak, T.V.; Rosenfeld, D.; Goodman, S.; Boccippio, D. Thermodynamic conditions favorable to superlative thunderstorm updraft, mixed phase microphysics and lightning flash rate. Atmos. Res. 2005, 76, 288–306. [Google Scholar] [CrossRef]
- Petersen, W.A.; Christian, H.J.; Rutledge, S.A. TRMM observations of the global relationship between ice water content and lightning. Geophys. Res. Lett. 2005, 32, L14819. [Google Scholar] [CrossRef]
- Carey, L.D.; Schultz, E.V.; Schultz, C.J.; Deierling, W.; Petersen, W.A.; Bain, A.L.; Pickering, K.E. An Evaluation of Relationships between Radar-Inferred Kinematic and Microphysical Parameters and Lightning Flash Rates in Alabama Storms. Atmosphere 2019, 10, 796. [Google Scholar] [CrossRef]
- Lu, J.; Qie, X.; Xiao, X.; Jiang, R.; Mansell, E.R.; Fierro, A.O.; Liu, D.; Chen, Z.; Yuan, S.; Sun, M.; et al. Effects of convective mergers on evolution of microphysical and electrical activity in a severe squall line simulated by WRF coupled with explicit electrification scheme. J. Geophys. Res. 2022, 127, e2021JD036398. [Google Scholar] [CrossRef]
- Zipser, E.J.; Lutz, K.R. The Vertical Profile of Radar Reflectivity of Convective Cells: A Strong Indicator of Storm Intensity and Lightning Probability? Mon. Weather Rev. 1994, 122, 1751–1759. [Google Scholar] [CrossRef]
- Boussaton, M.P.; Soula, S.; Coquillat, S. Total lightning activity in thunderstorms over Paris. Atmos. Res. 2007, 84, 221–232. [Google Scholar] [CrossRef]
- Wang, Y.; Yang, Y.; Wang, C. Improving forecasting of strong convection by assimilating cloud-to-ground lightning data using the physical initialization method. Atmos. Res. 2014, 150, 31–41. [Google Scholar] [CrossRef]
- Chen, Z.; Qie, X.; Yair, Y.; Liu, D.; Xiao, X.; Wang, D.; Yuan, S. Electrical evolution of a rapidly developing MCS during its vigorous vertical growth phase. Atmos. Res. 2020, 246, 105201. [Google Scholar] [CrossRef]
- Lu, J.; Qie, X.; Jiang, R.; Xiao, X.; Liu, D.; Li, J.; Yuan, S.; Chen, Z.; Wang, D.; Tian, Y.; et al. Lightning activity during convective cell mergers in a squall line and corresponding dynamical and thermodynamical characteristics. Atmos. Res. 2021, 256, 105555. [Google Scholar] [CrossRef]
- Price, C.; Rind, D.A. Simple Lightning Parameterization for Calculating Global Lightning Distributions. J. Geophys. Res. 1992, 97, 9919–9933. [Google Scholar] [CrossRef]
- Wiens, K.C.; Rutledge, S.A.; Tessendorf, S.A. The 20 June 2000 supercell observed during STEPS. Part II: Lightning and charge structure. J. Atmos. Sci. 2005, 62, 4151–4177. [Google Scholar] [CrossRef]
- Basarab, B.M.; Rutledge, S.A.; Fuchs, B.R. An improved lightning flash rate parameterization developed from Colorado DC3 thunderstorm data for use in cloud-resolving chemical transport models. J. Geophys. Res. 2015, 120, 9481–9499. [Google Scholar] [CrossRef]
- Mansell, E.R.; Ziegler, C.L.; Bruning, E.C. Simulated Electrification of a Small Thunderstorm with Two-Moment Bulk Microphysics. J. Atmos. Sci. 2010, 67, 171–194. [Google Scholar] [CrossRef]
- Mansell, E.R.; MacGorman, D.R.; Ziegler, C.L.; Straka, J.M. Charge structure and lightning sensitivity in a simulated multicell thunderstorm. J. Geophys. Res. 2005, 110, D12101. [Google Scholar] [CrossRef]
- Tan, Y.; Tao, S.; Zhu, B. Fine-resolution simulation of the channel structures and propagation features of intracloud lightning. Geophys. Res. Lett. 2006, 33, L09809. [Google Scholar] [CrossRef]
- Fierro, A.; Mansell, E.R.; MacGorman, D.R.; Ziegler, C.L. The Implementation of an Explicit Charging and Discharge Lightning Scheme within the WRF-ARW Model: Benchmark Simulations of a Continental Squall Line, a Tropical Cyclone, and a Winter Storm. Mon. Weather Rev. 2013, 141, 2390–2415. [Google Scholar] [CrossRef]
- Zhao, P.; Yin, Y.; Xiao, H. The effects of aerosol on development of thunderstorm electrification: A numerical study. Atmos. Res. 2015, 153, 376–391. [Google Scholar] [CrossRef]
- DiGangi, E.A.; Ziegler, C.L.; MacGorman, D.R. Lightning and secondary convection in the anvil of the May 29, 2012 Oklahoma supercell storm observed by DC3. J. Geophys. Res. 2021, 126, e2020JD033114. [Google Scholar] [CrossRef]
- Sun, M.; Liu, D.; Qie, X.; Mansell, E.R.; Yair, Y.; Fierro, A.O. Aerosol effects on electrification and lightning discharges in a multicell thunderstorm simulated by the WRF-ELEC model. Atmos. Chem. Phys. 2021, 21, 14141–14158. [Google Scholar] [CrossRef]
- Dementyeva, S.; Shatalina, M.; Popykina, A.; Sarafanov, F.; Kulikov, M.; Mareev, E. Trends and Features of Thunderstorms and Lightning Activity in the Upper Volga Region. Atmosphere 2023, 14, 674. [Google Scholar] [CrossRef]
- Fierro, A.O.; Mansell, E.R. Relationships between Electrification and Storm-Scale Properties Based on Idealized Simulations of an Intensifying Hurricane-Like Vortex. J. Atmos. Sci. 2018, 75, 657–674. [Google Scholar] [CrossRef]
- Price, C.; Rind, D. Possible implications of global climate change on global lightning distributions and frequencies. Geophys. Res. Lett. 1994, 99, 10823–10831. [Google Scholar] [CrossRef]
- McCaul, E.W.; Goodman, S.J.; LaCasse, K.M.; Cecil, D.J. Forecasting Lightning Threat Using Cloud-Resolving Model Simulations. Weather Forecast. 2009, 24, 709–729. [Google Scholar] [CrossRef]
- Li, W.; Qie, X.; Fu, S. Simulation of quasi-linear mesoscale convective systems in northern China: Lightning activities and storm structure. Adv. Atmos. Sci. 2016, 33, 85–100. [Google Scholar] [CrossRef]
- Barthe, C.; Deierling, W.; Barth, M.C. Estimation of total lightning from various storm parameters: A cloud-resolving model study. J. Geophys. Res. 2010, 115, 1–17. [Google Scholar] [CrossRef]
- Bright, D.R.; Wandisin, M.S.; Jewell, R.E. A physically based parameter for lightning prediction and its calibration in ensemble forecasts. In Proceedings of the Conference on Meteorological Applications of Lightning Data, San Diego, CA, USA, 9–13 January 2005. [Google Scholar]
- Yair, Y.; Lynn, B.; Price, C. Predicting the potential for lightning activity in Mediterranean storms based on the Weather Research and Forecasting (WRF) model dynamic and microphysical fields. J. Geophys. Res. 2010, 115, 1–13. [Google Scholar] [CrossRef]
- Brisson, E.; Blahak, U.; Lucas-Picher, P.; Purr, C.; Ahrens, B. Contrasting lightning projection using the lightning potential index adapted in a convection-permitting regional climate model. Clim. Dyn. 2021, 57, 2037–2051. [Google Scholar] [CrossRef]
- Mortelmans, J.; Bechtold, M.; Brisson, E.; Lynn, B.; Kumar, S.; Lannoy, G.D. Lightning over central Canada: Skill assessment for various land-atmosphere model configurations and lightning indices over a boreal study area. J. Geophys. Res. 2022, 128, e2022JD037236. [Google Scholar] [CrossRef]
- Tost, H.; Joeckel, P.J.; Lelieveld, J. Lightning and convection parameterizations—Uncertainties in global modelling. Atmos. Chem. Phys. 2007, 7, 4553–4568. [Google Scholar] [CrossRef]
- Romps, D.M.; Seeley, J.T.; Vollaro, D.; Molinari, J. Projected Increase in lightning strikes in the United States due to global warming. Science 2014, 346, 851–854. [Google Scholar] [CrossRef]
- Finney, D.L.; Doherty, R.M.; Wild, O.; Stevenson, D.S.; MacKenzie, I.A.; Blyth, A.M. A projected decrease in lightning under climate change. Nat. Clim. Chang. 2018, 8, 210–213. [Google Scholar] [CrossRef]
- Wang, Y.; Qie, X.; Wang, D.; Liu, M. Beijing Lightning Network (BLNET): A research and operational system for comprehensive lightning detection. Atmos. Res. 2016, 171, 121–132. [Google Scholar]
- Chan, Y.T.; Ho, K.C. A simple and efficient estimator for hyperbolic location. IEEE Trans Signal Process 1994, 42, 1905–1915. [Google Scholar] [CrossRef]
- Levenberg, K. A Method for the Solution of Certain Problems in Least Squares. Q. Appl. Math. 1944, 2, 164–168. [Google Scholar] [CrossRef]
- Marquardt, D.W. An algorithm for least-squares estimation of nonlinear parameters. J. Soc. Ind. Appl. Math. 1963, 11, 431–441. [Google Scholar] [CrossRef]
- Srivastava, A.; Tian, Y.; Qie, X. Performance assessment of Beijing Lightning Network (BLNET) and comparison with other lightning location networks across Beijing. Atmos. Res. 2017, 197, 76–83. [Google Scholar] [CrossRef]
- Cummins, K.L.; Murphy, M.J.; Bardo, E.A.; Hiscox, W.L.; Pyle, R.B.; Pifer, A.E. A combined TOA/MDF technology upgrade of the U.S. national lightning detection network. J. Geophys. Res. 1998, 103, 9035–9044. [Google Scholar] [CrossRef]
- Michalon, N.; Nassif, A.; Saouri, T.; Royer, J.F.; Pontikis, C.A. Contribution to the climatological study of lightning. Geophys. Res. Lett. 1999, 26, 3097–3100. [Google Scholar] [CrossRef]
- Xiao, X.; Sun, J.; Qie, X.; Ying, Z.; Ji, L.; Chen, M.; Zhang, L. Lightning Data Assimilation Scheme in a 4DVAR System and its Impact on Very-Short-Term Convective Forecasting. Mon. Weather Rev. 2021, 149, 353–373. [Google Scholar] [CrossRef]
- Carey, L.D.; Murphy, M.J.; McCormick, T.L.; Nicholas, W.S. Lightning location relative to storm structure in a leading-line, trailing-stratiform mesoscale convective system. J. Geophys. Res. 2005, 110, D03105. [Google Scholar] [CrossRef]
- Chen, Z.; Qie, X.; Liu, D.; Xiong, Y. Lightning data assimilation with comprehensively nudging water contents at cloud-resolving scale using WRF model. Atmos. Res. 2019, 221, 72–87. [Google Scholar] [CrossRef]
- Takahashi, T. Riming Electrification as a Charge Generation Mechanism in Thunderstorms. J. Atmos. Sci. 1978, 35, 1536–1548. [Google Scholar] [CrossRef]
- Saunders, C.P.R.; Keith, W.D.; Mitzeva, R.P. The effect of liquid water on thunderstorm charging. J. Geophys. Res. 1991, 96, 11007–11017. [Google Scholar] [CrossRef]
Figure 1.
Layout of the lightning detection network (BLNET) and Doppler radar platform. Sixteen triangles represent the substations of BLNET equipped with slow/fast/LF antenna. The red star indicates the operational S-band radar. The red polygon shows the boundary of the Beijing metropolitan region, and the color shadings indicate the terrain height above sea level.

Figure 2.
Composited radar reflectivity and corresponding lightning within 6 min of squall line. Black “·” represents lightning. (a) 12:36, (b) 13:12, (c) 13:48, and (d) 14:48 during the period of the squall line.
Figure 2.
Composited radar reflectivity and corresponding lightning within 6 min of squall line. Black “·” represents lightning. (a) 12:36, (b) 13:12, (c) 13:48, and (d) 14:48 during the period of the squall line.
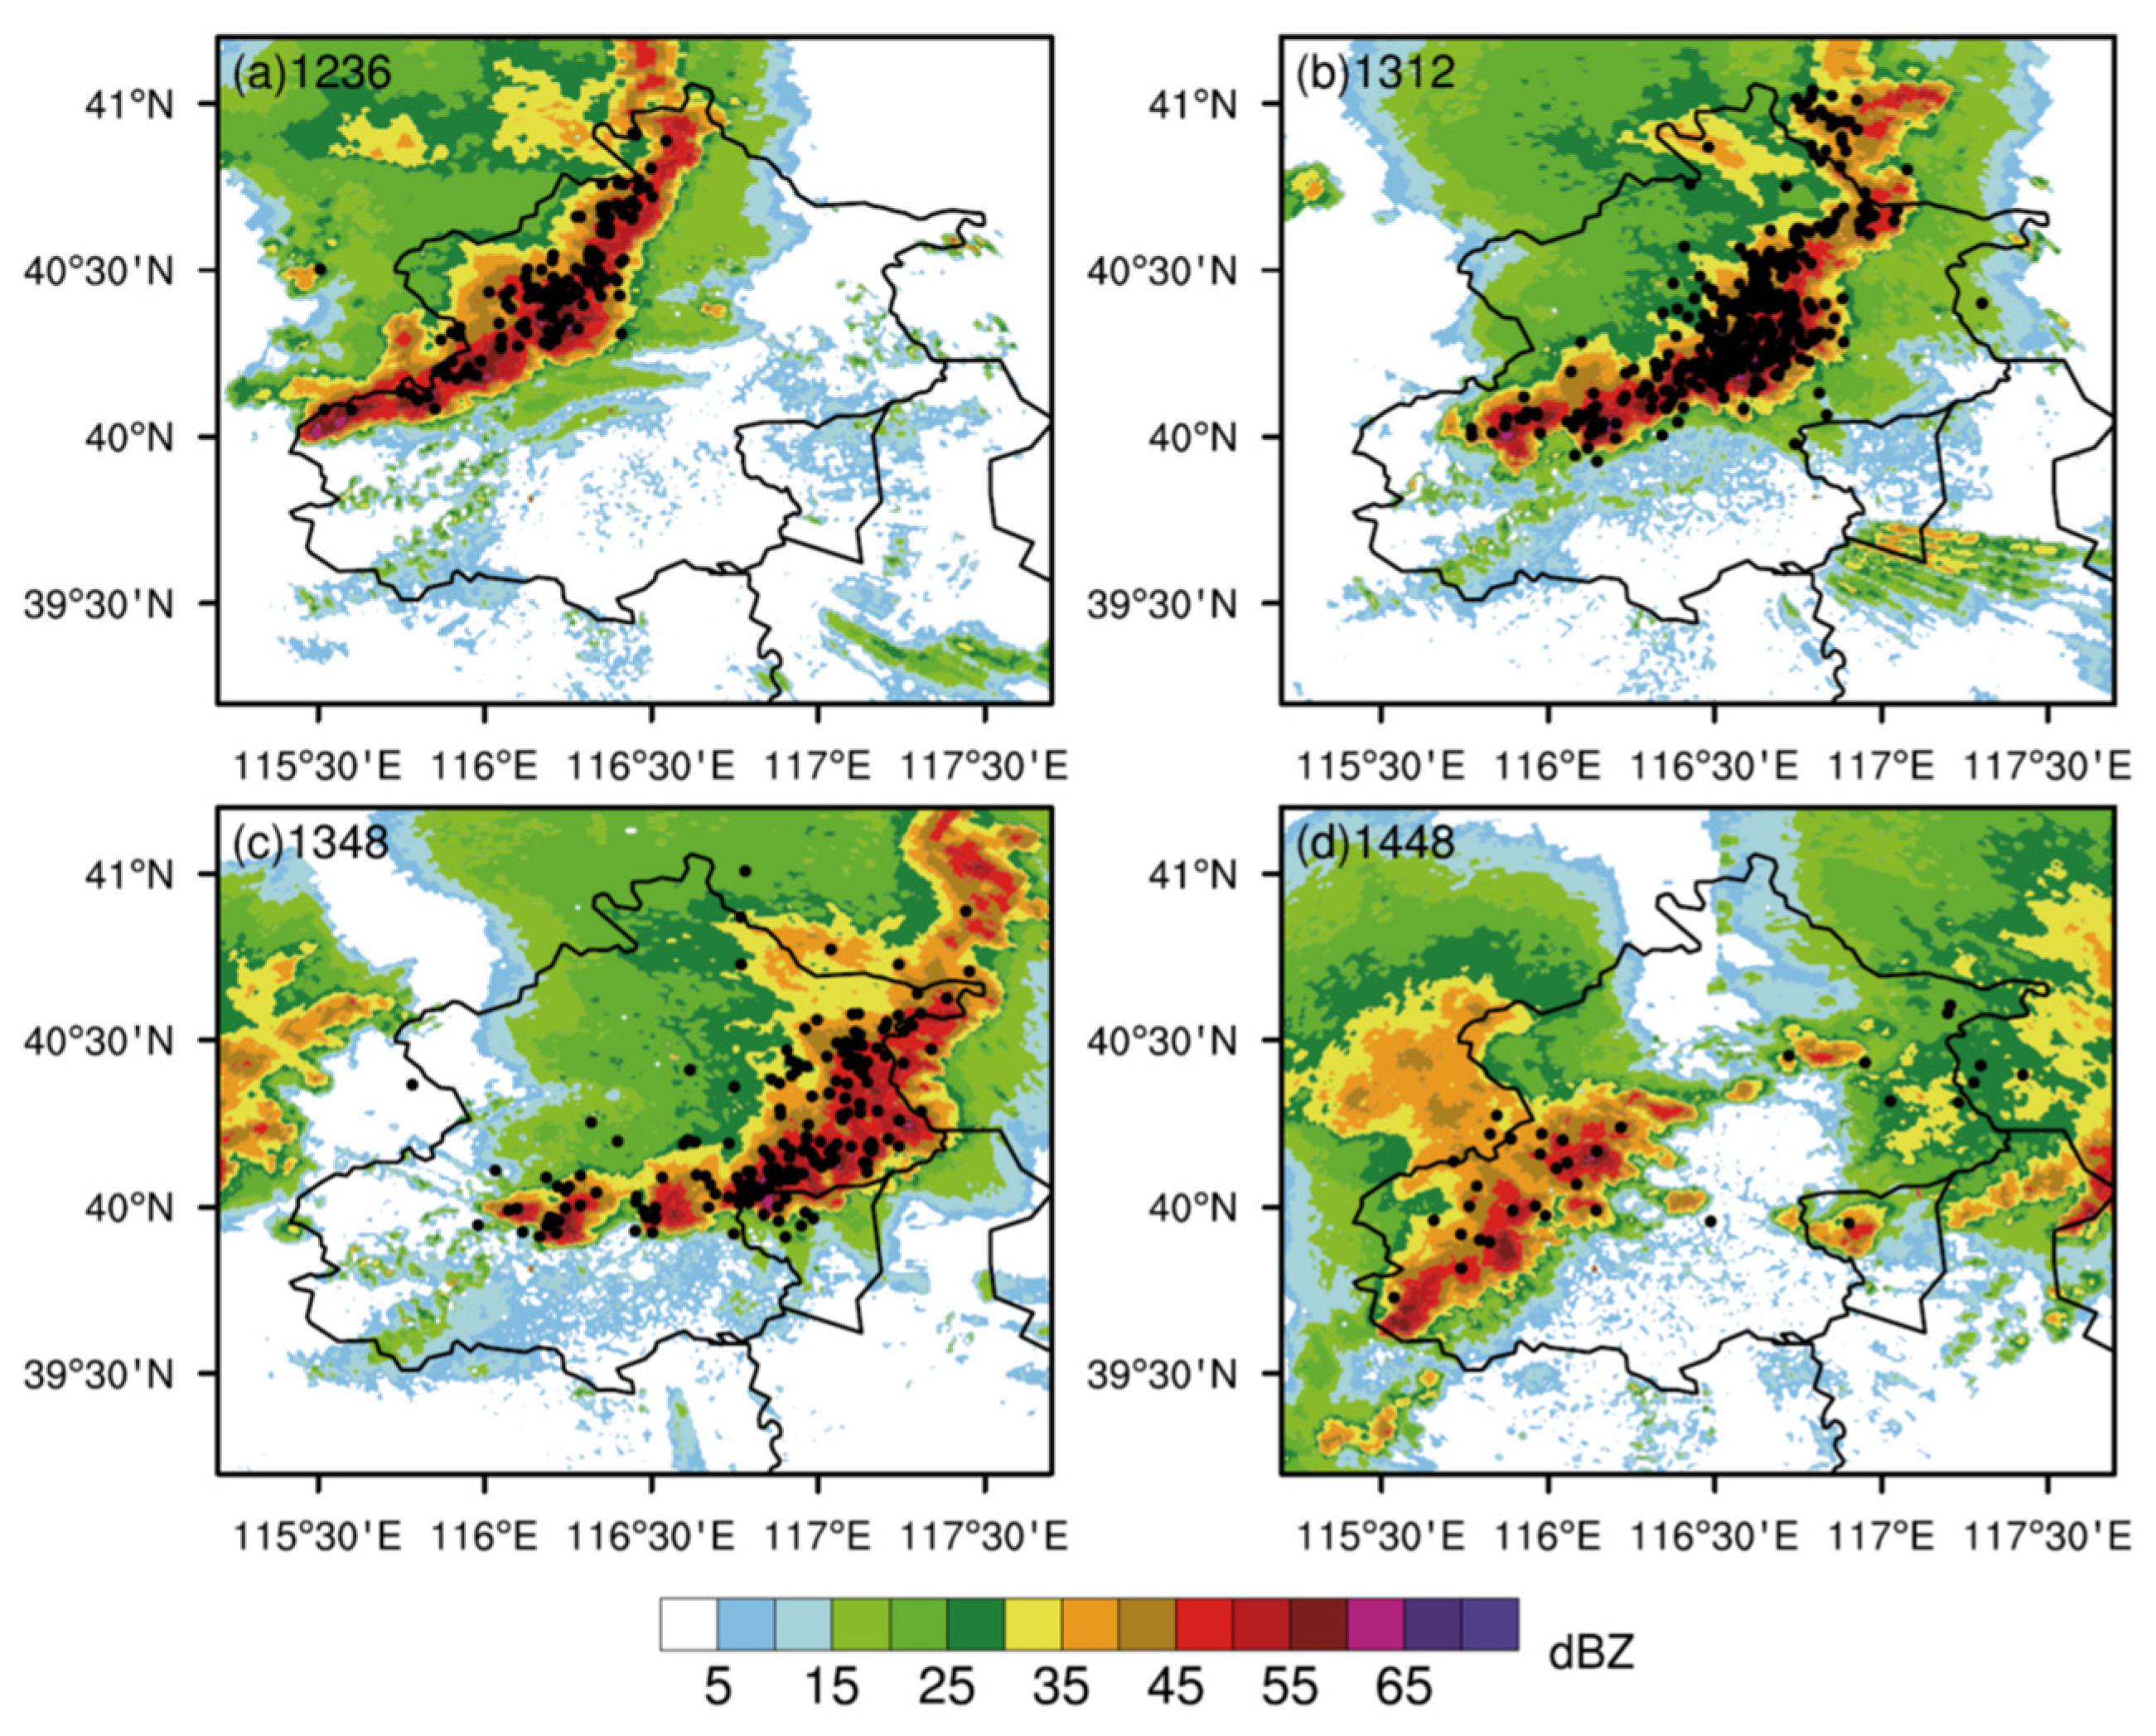
Figure 3.
The evolution of total lightning frequency and the radar echo volume. The solid line represents total lightning frequency (fl 6 min−1), the dashed line represents radar echo volume which greater than 30 dBZ (V30dBZ), the dash dotted line represents 35 dBZ (V35dBZ), and the dotted line represents 40 dBZ (V40dBZ) between 0 and −40 °C level (km3).
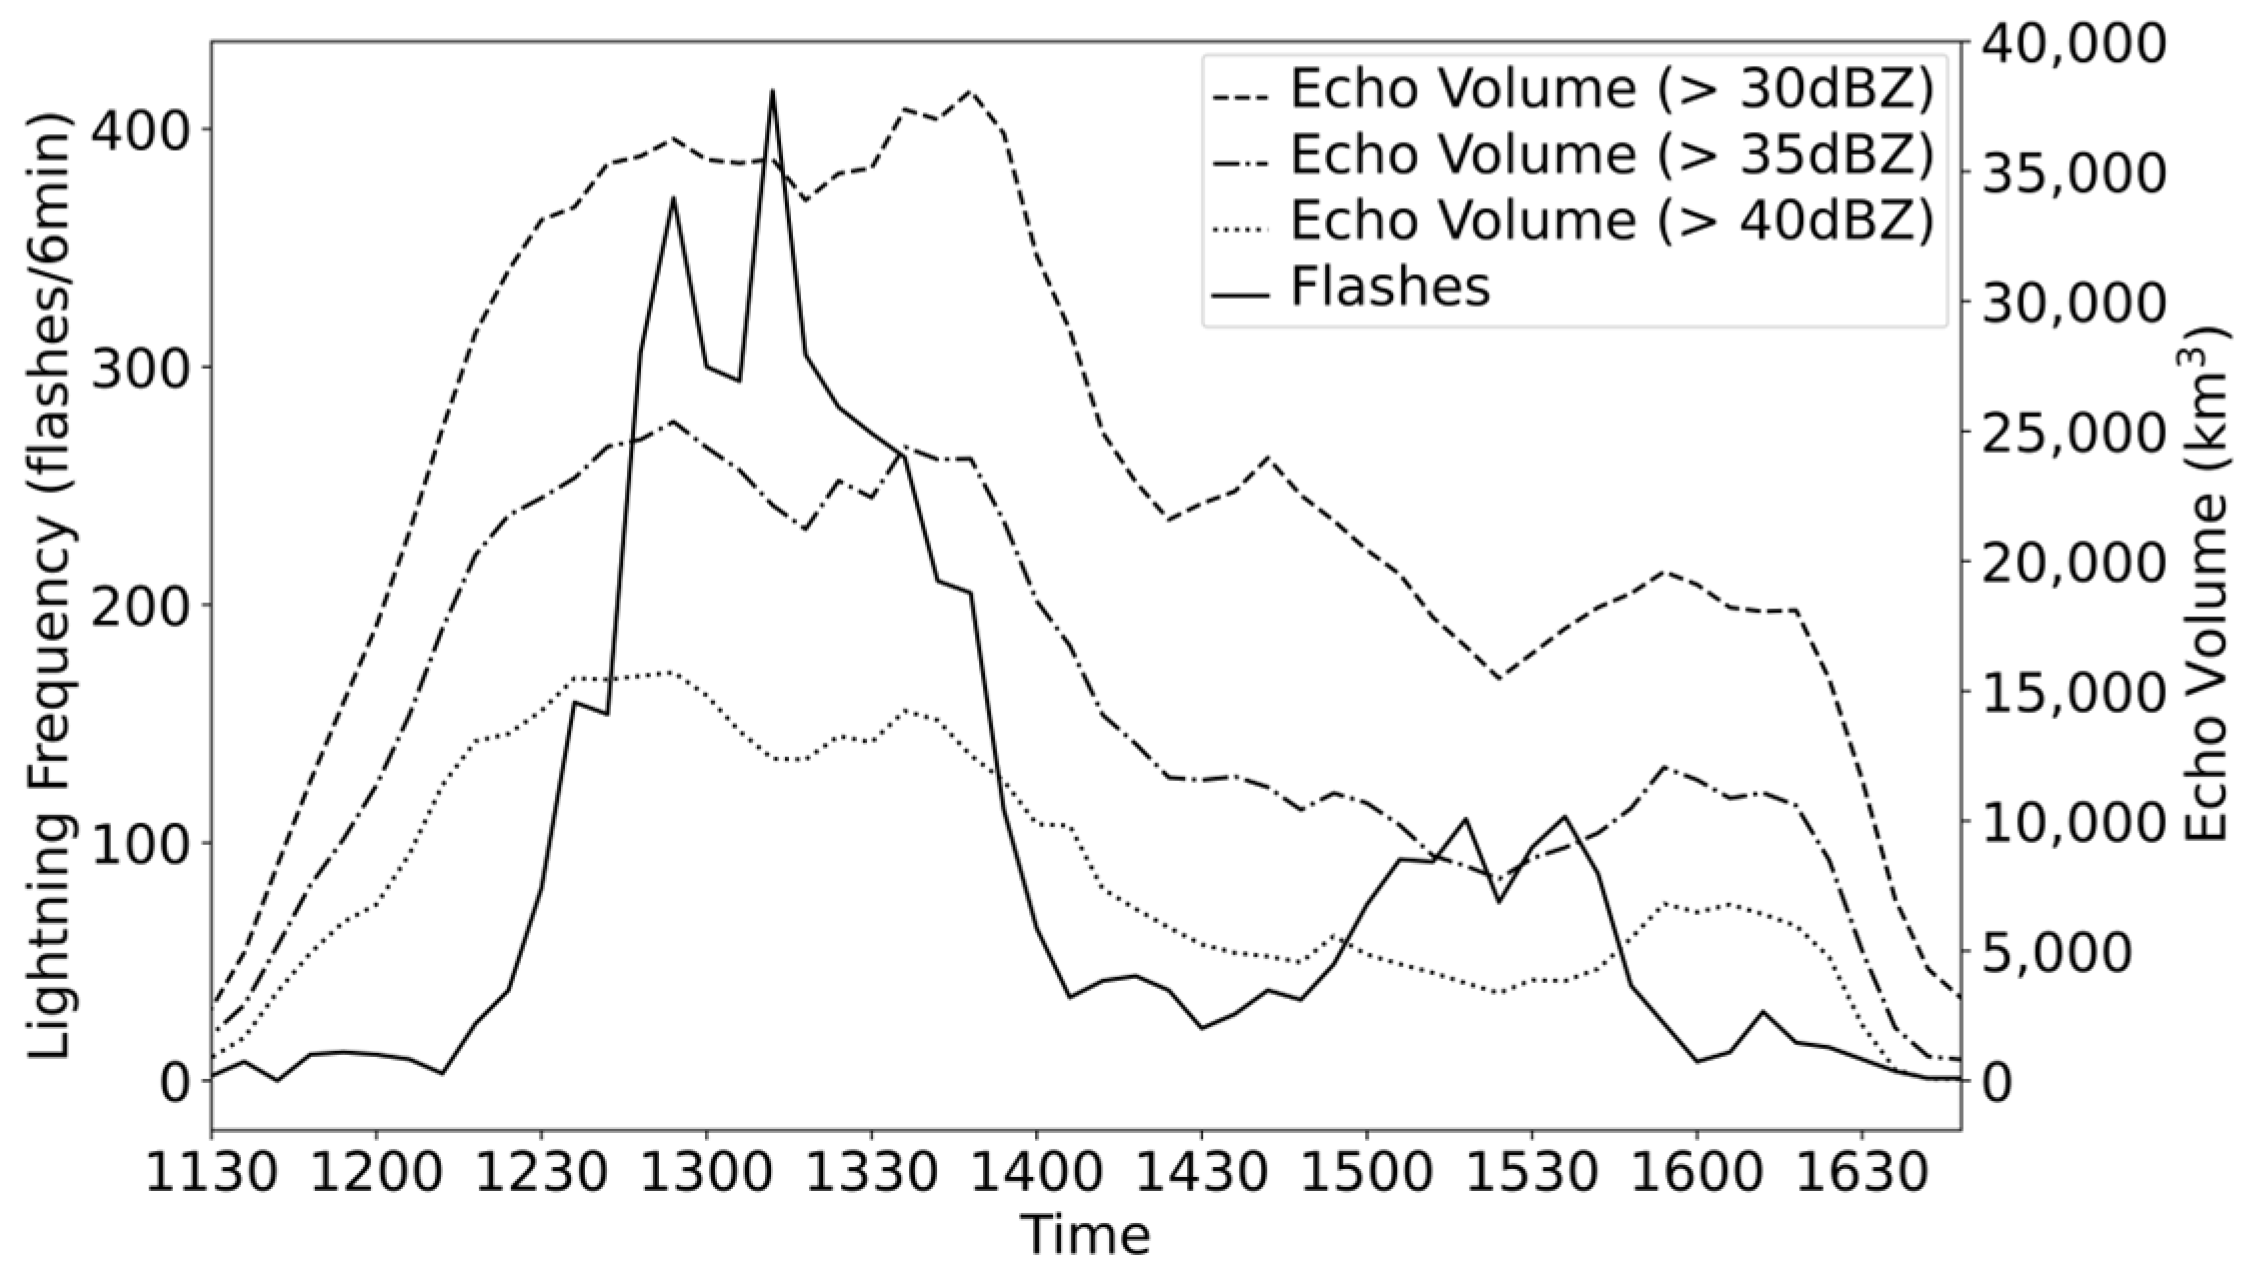
Figure 4.
Different fitting curves between the lightning frequency and the radar volumes, (a) V30dBZ, (b) V35dBZ, and (c) V40dBZ, of the case 20170707.
Figure 4.
Different fitting curves between the lightning frequency and the radar volumes, (a) V30dBZ, (b) V35dBZ, and (c) V40dBZ, of the case 20170707.

Figure 5.
Observed and simulated radar reflectivity of the squall line: (a) 1218, (b) 1236, (c) 1318, (d) 1418 correspond to observation; (e) 1106, (f) 1124, (g) 1206, (h) 1306 corresponding to simulation.
Figure 5.
Observed and simulated radar reflectivity of the squall line: (a) 1218, (b) 1236, (c) 1318, (d) 1418 correspond to observation; (e) 1106, (f) 1124, (g) 1206, (h) 1306 corresponding to simulation.

Figure 6.
The observed (a) and simulated radar reflectivity (c) at 12:54 of the squall line, (b) the vertical cross-section of radar reflectivity along the dotted black line shown in (a) and the distribution of lightning radiation sources within 0.1° latitude around the profile within 6 min superimposed. The vertical cross-section of radar reflectivity with the vertical wind w. (d) The vertical cross-section of radar reflectivity along the dotted line shown in (c), respectively. The shaded area represents the radar echo (dBZ). The solid line represents the updrafts, and the dotted line indicates the downdrafts (m s−1).
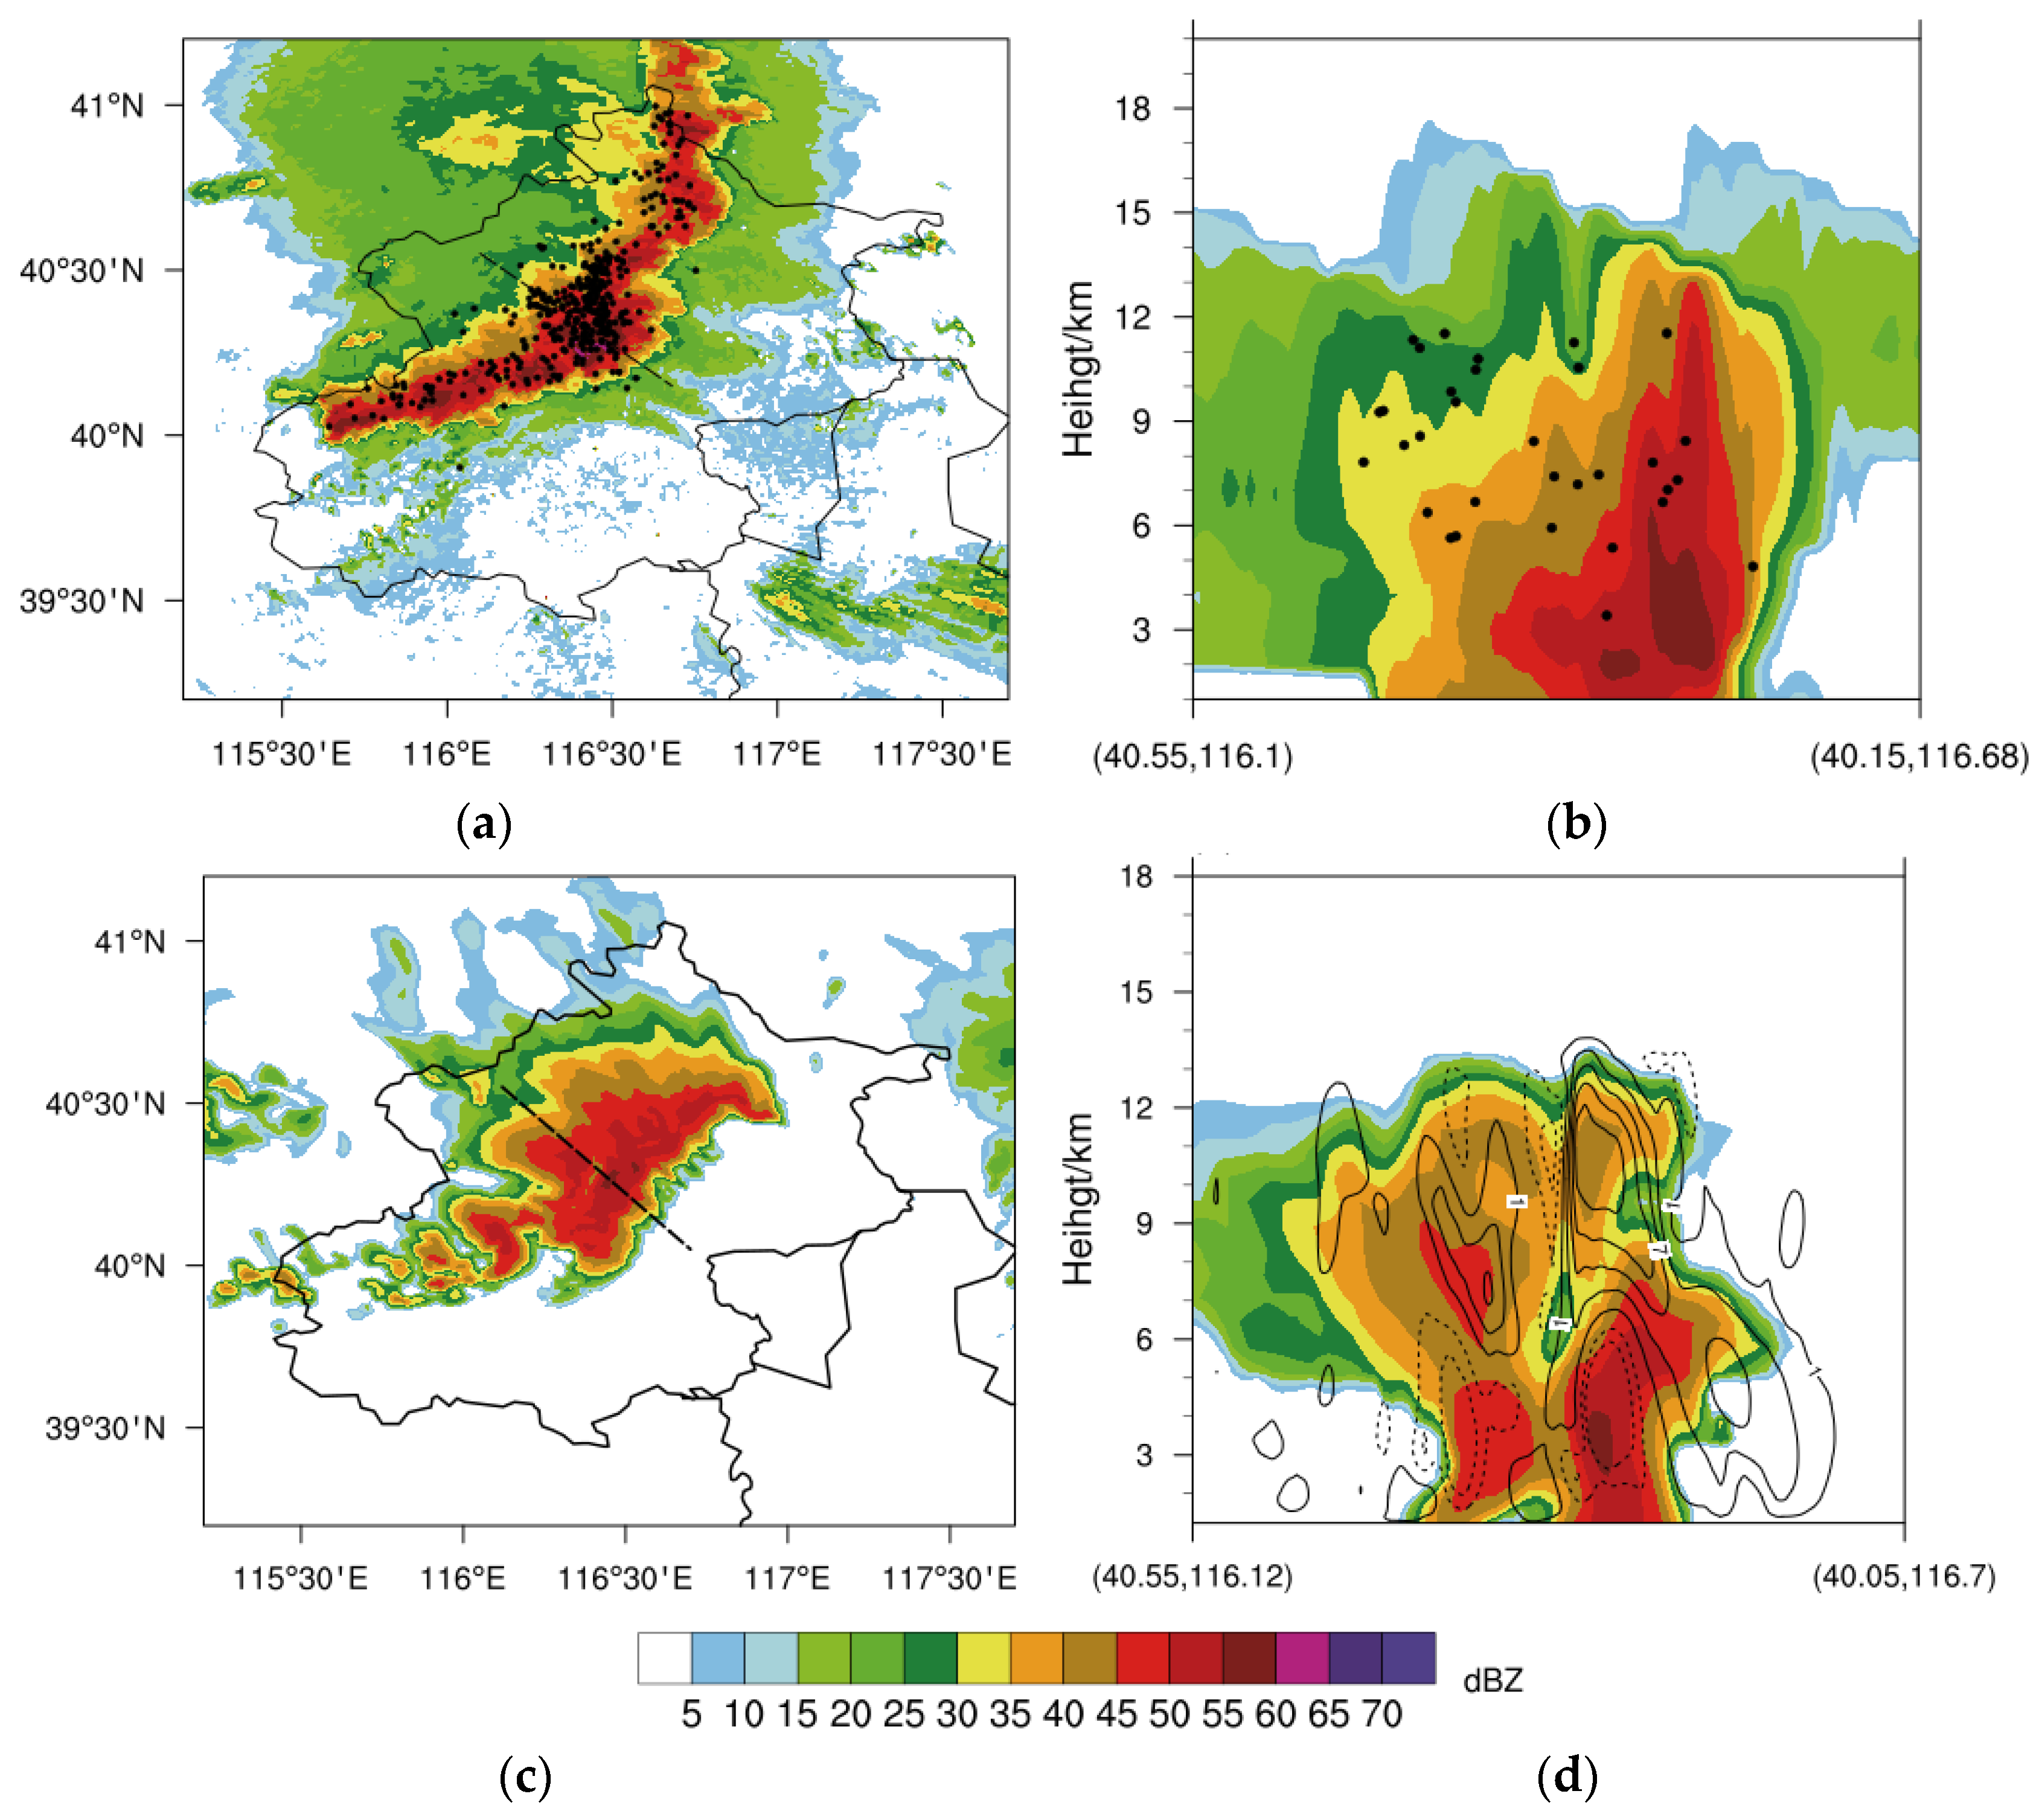
Figure 7.
The vertical distribution of the mixing ratio of graupel, ice, and snow of the squall line. The gray shaded area indicates the vertical cross-section of the radar reflectivity with a radar echo of 5 dBZ. (a–c) shows at 1124 UTC, and (d–f) shows at 1148 UTC (g kg−1).
Figure 7.
The vertical distribution of the mixing ratio of graupel, ice, and snow of the squall line. The gray shaded area indicates the vertical cross-section of the radar reflectivity with a radar echo of 5 dBZ. (a–c) shows at 1124 UTC, and (d–f) shows at 1148 UTC (g kg−1).
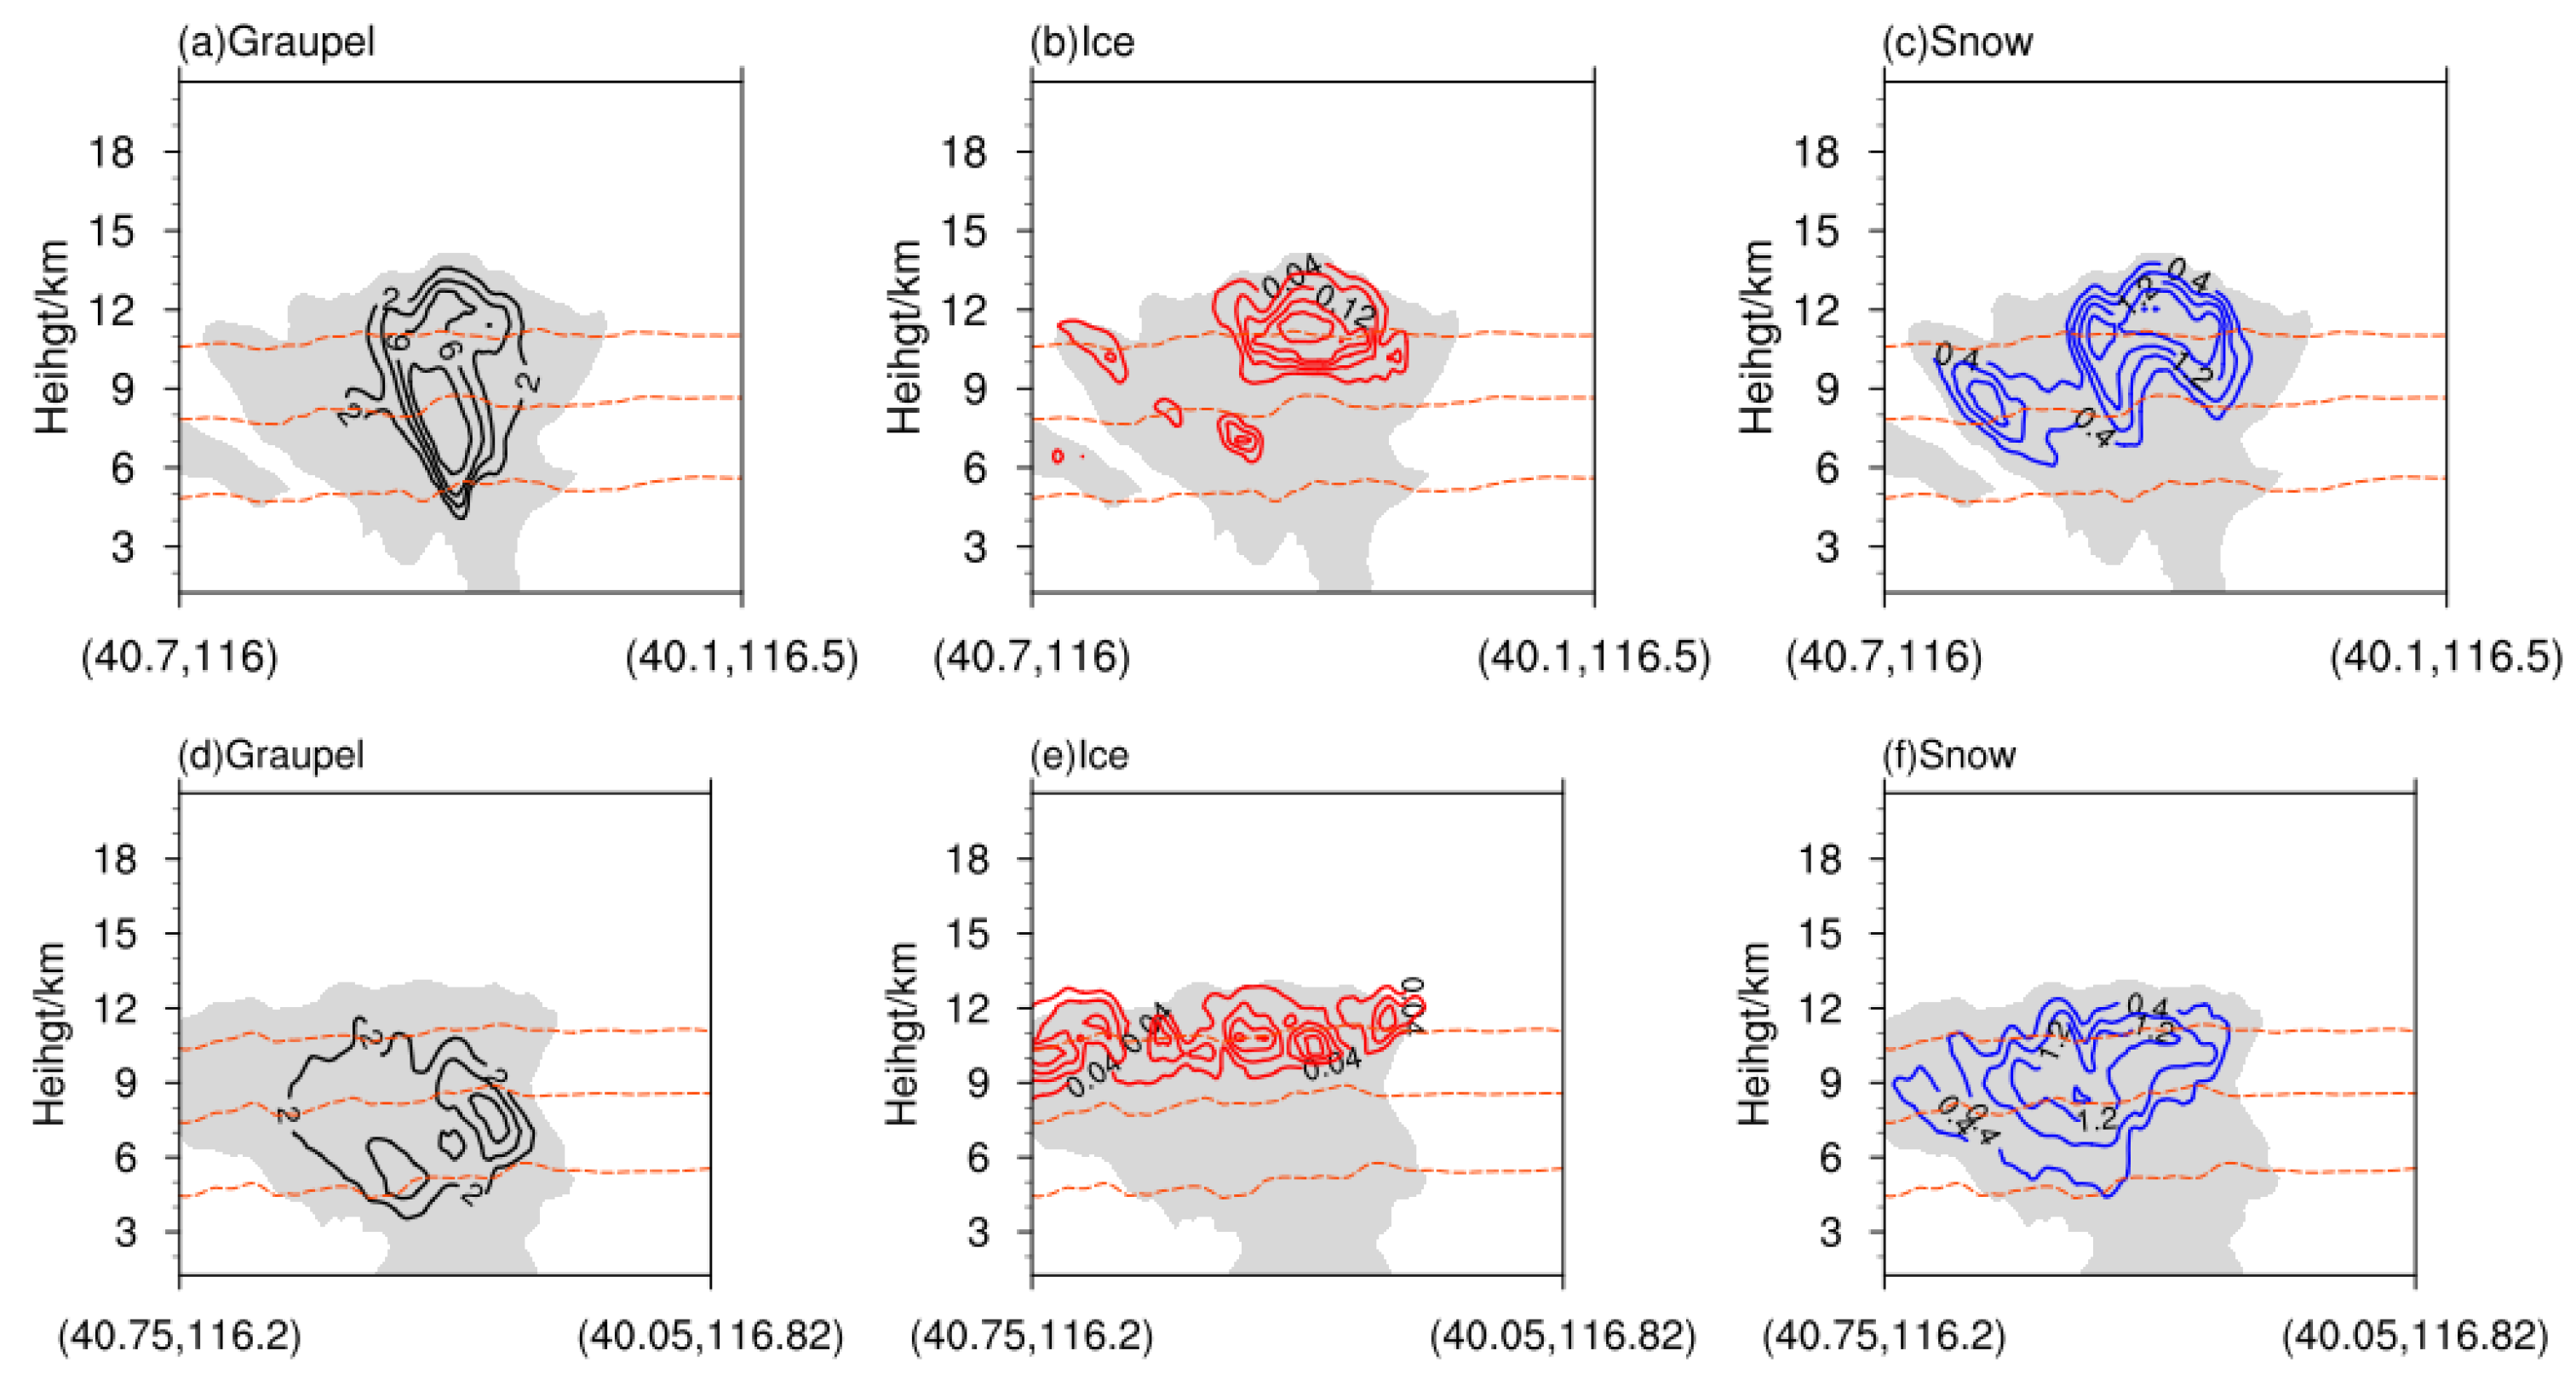
Figure 8.
The lightning density of squall line by different lightning parameterization schemes during 1136 UTC-1236 UTC simulation time. (a) PR92_1 scheme, (b) PR92_2 scheme, (c) LPI scheme, (d) V30dBZ scheme, (e) V35dBZ scheme, (f) V40dBZ scheme, and (g) observation. The color shade represents the lightning density. The solid backline in the shade represents the value of lightning density. The unit for (a,b,d–g) is fl km−2, and for (c), it is J kg−1.
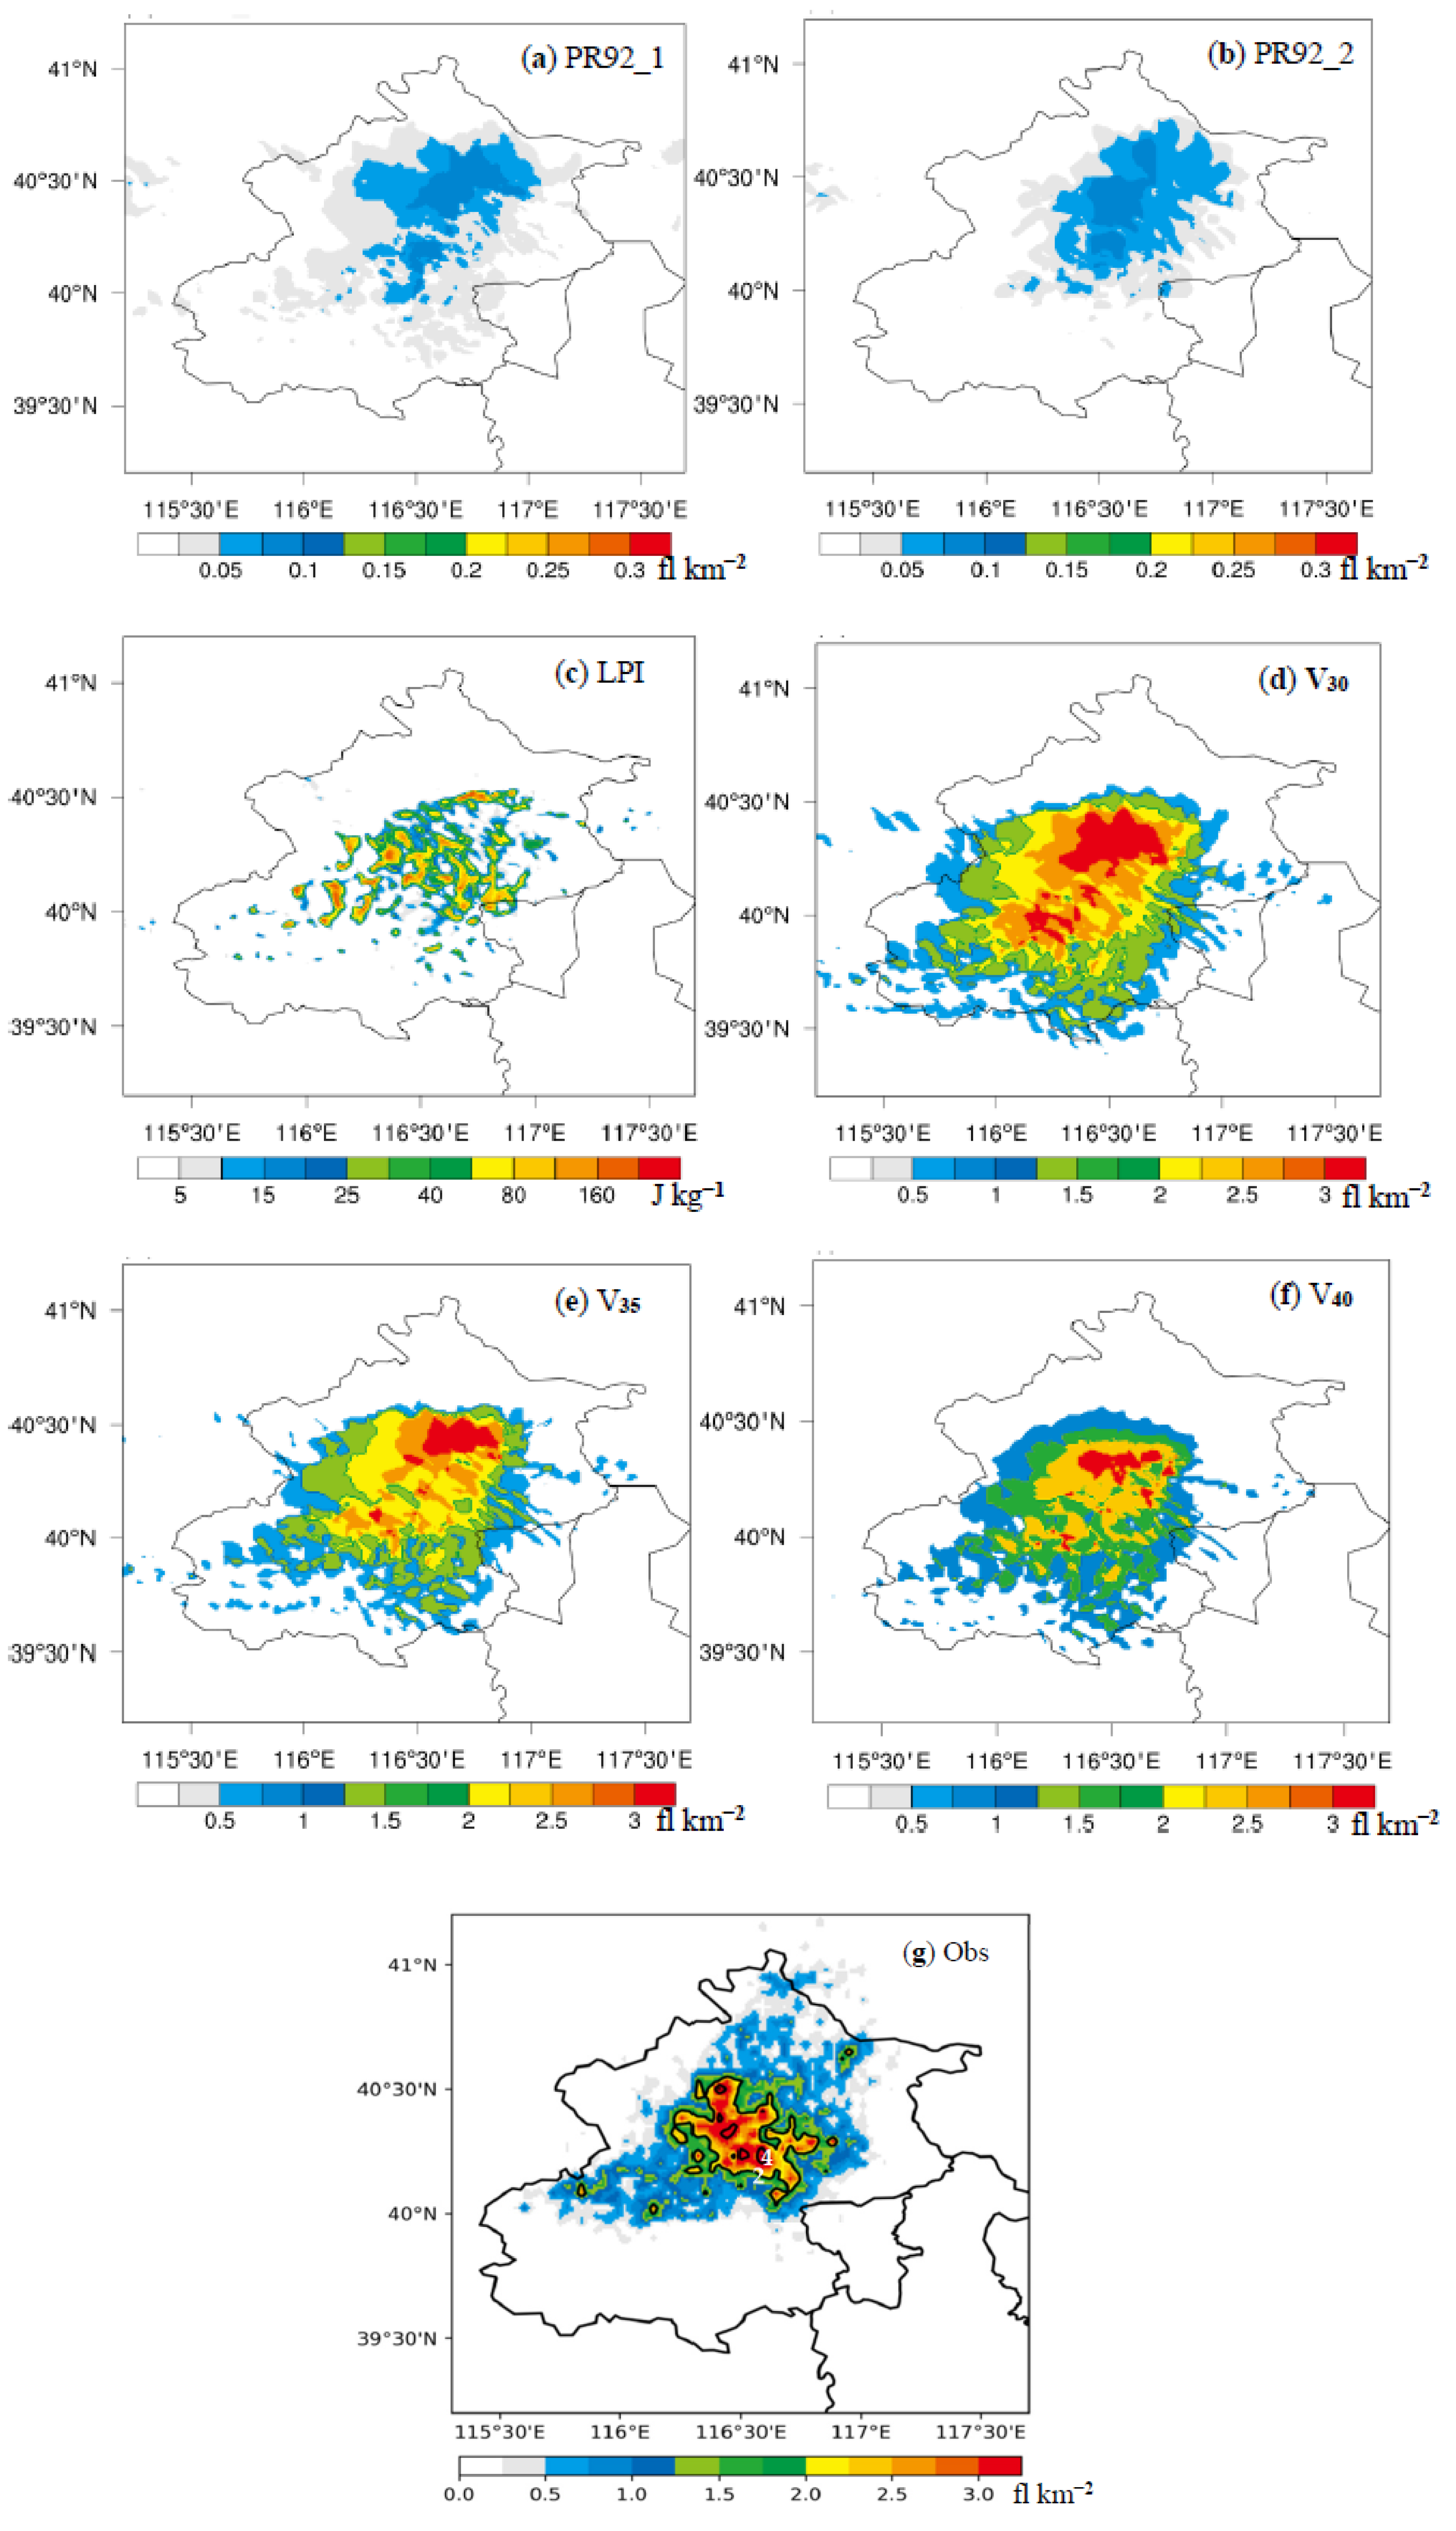
Figure 9.
The spatial distribution of lightning density in the squall line (1136–1436 UTC). (a) PR92_1 scheme, (b) PR92_2 scheme, (c) LPI scheme, (d) V30dBZ scheme, (e) V35dBZ scheme, (f) V40dBZ scheme, (g) observation. The units for (a,b,d–g) are fl km−2, and for (c), it is J kg−1.
Figure 9.
The spatial distribution of lightning density in the squall line (1136–1436 UTC). (a) PR92_1 scheme, (b) PR92_2 scheme, (c) LPI scheme, (d) V30dBZ scheme, (e) V35dBZ scheme, (f) V40dBZ scheme, (g) observation. The units for (a,b,d–g) are fl km−2, and for (c), it is J kg−1.
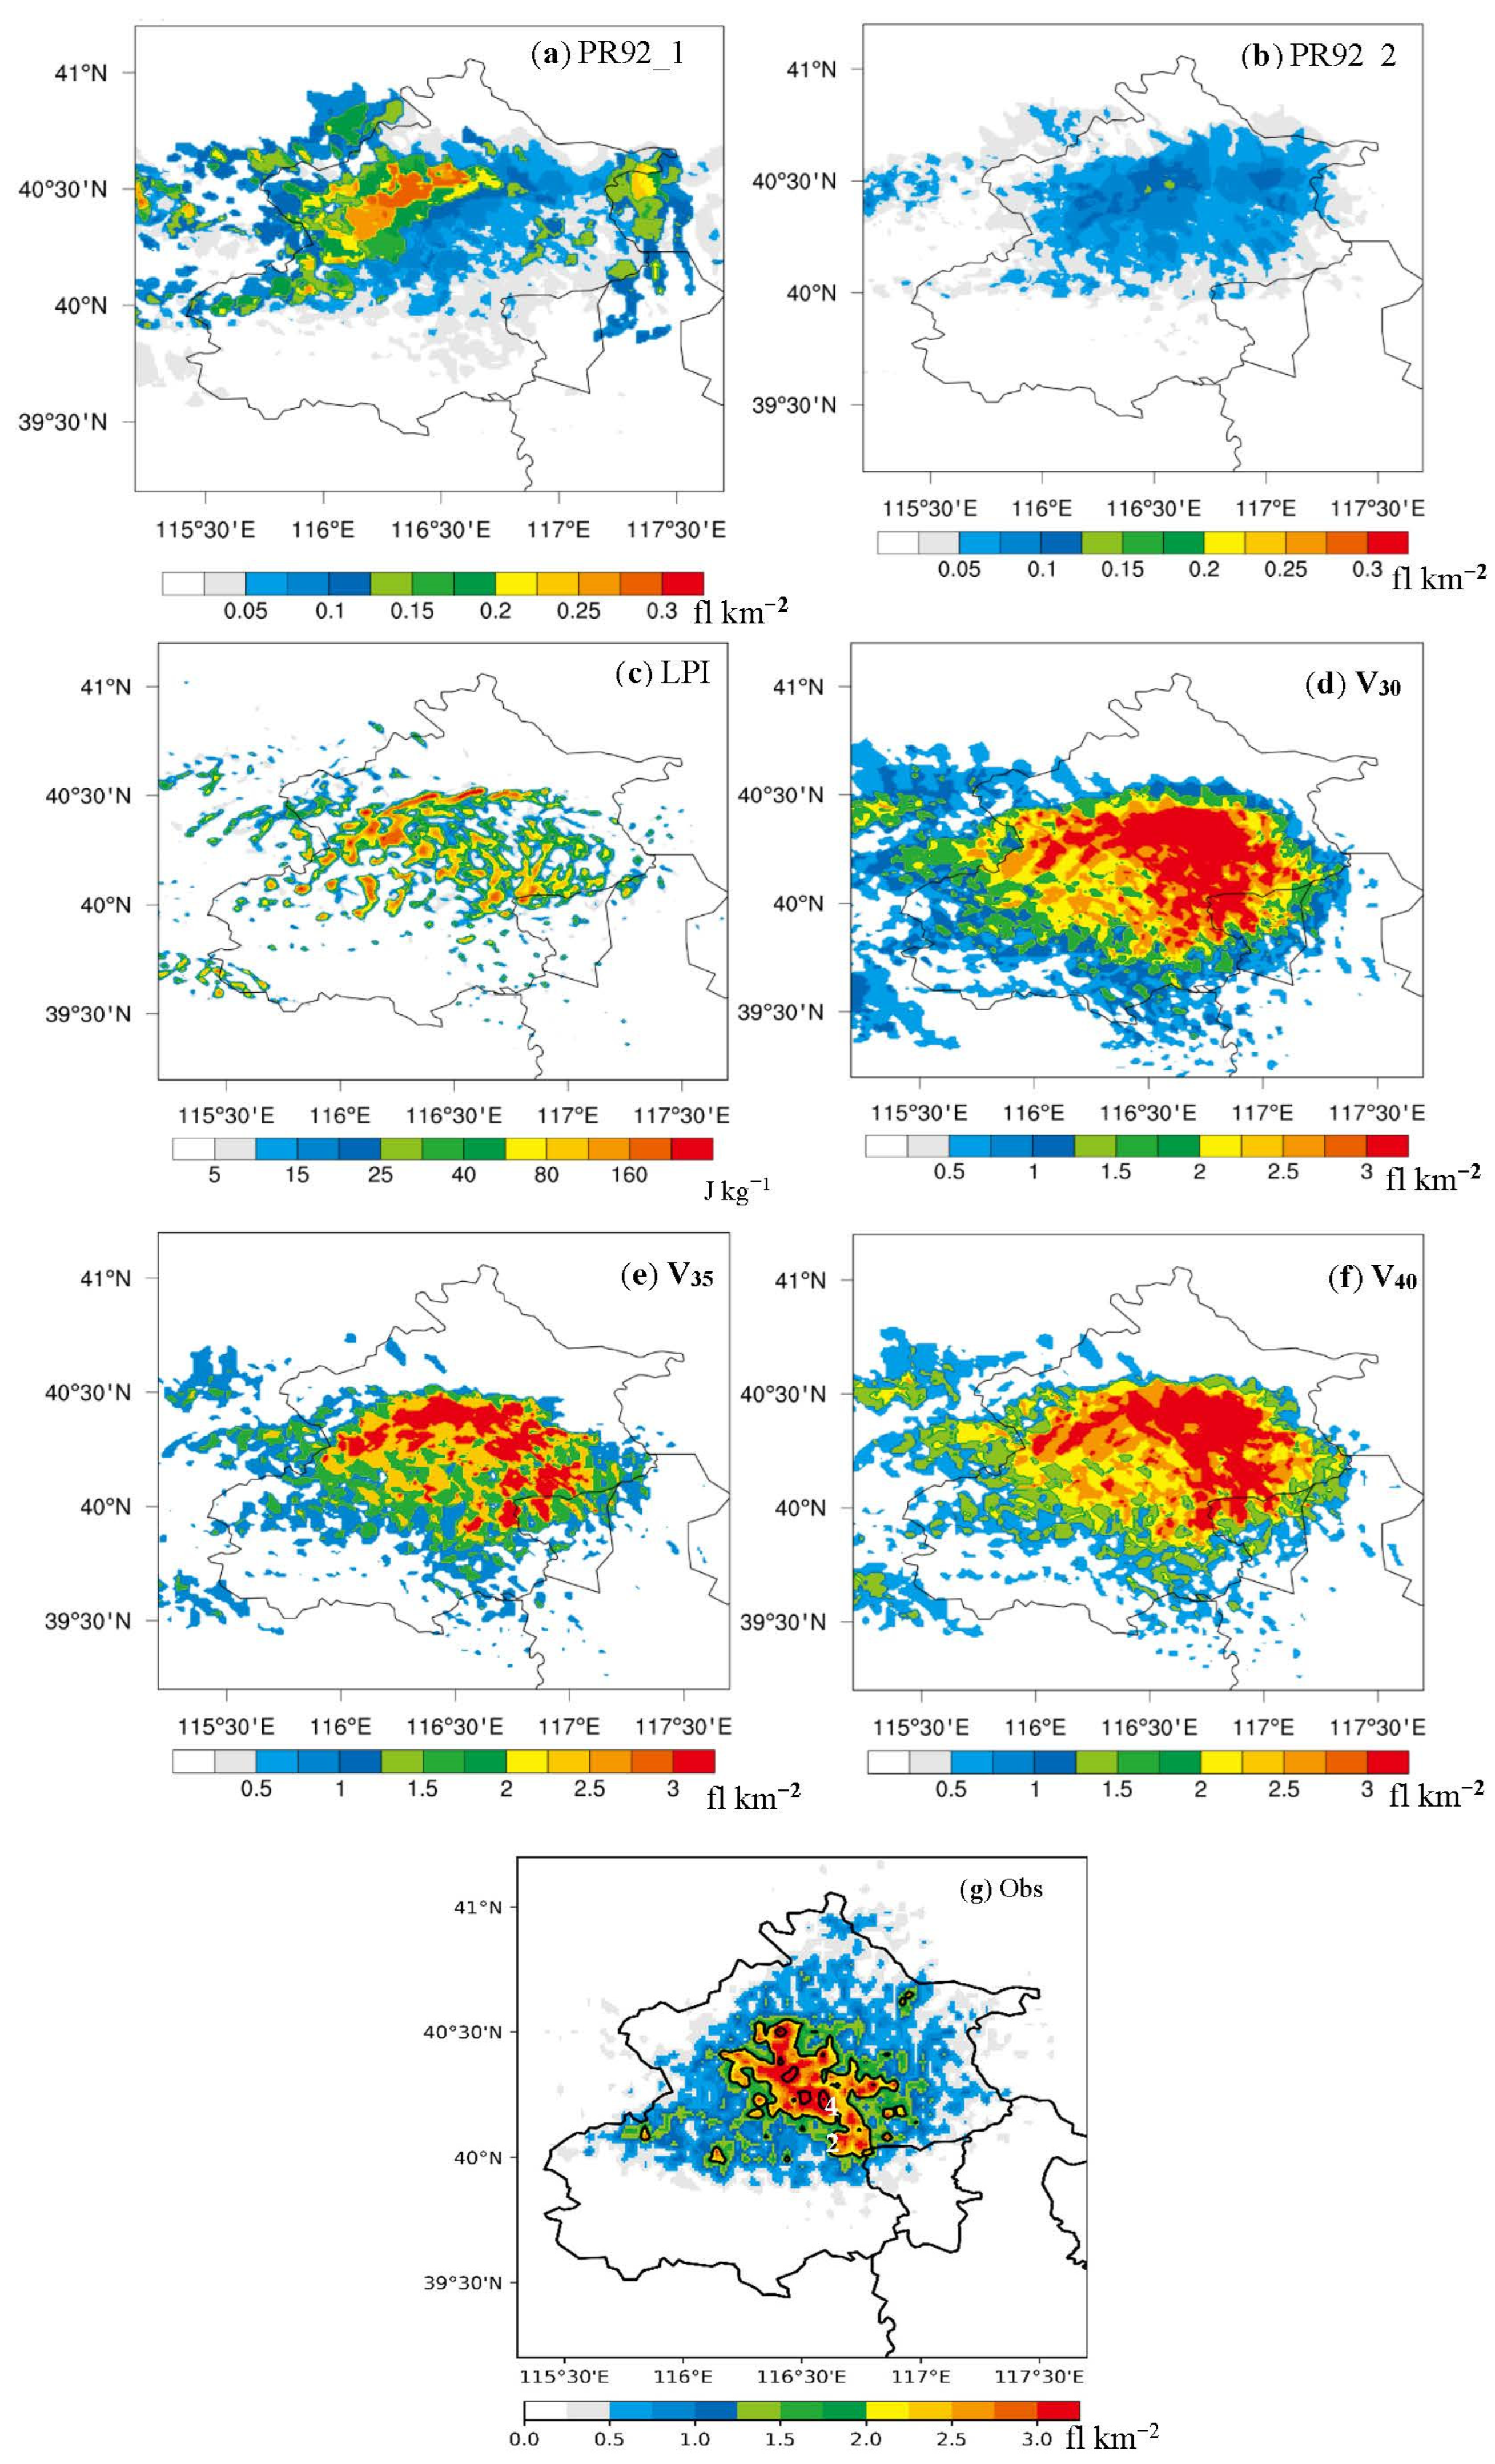
Figure 10.
The temporal of the simulated lightning frequency within 12 min and observed lightning activity within 6 min of the squall line. (a) PR92_1 scheme, (b) PR92_2 scheme, (c) LPI scheme, (d) V30dBZ scheme, V35dBZ scheme, and V40dBZ scheme. The red solid lines represent the simulated lightning frequency, and the black dotted line represents the observed lightning frequency in (a,b).
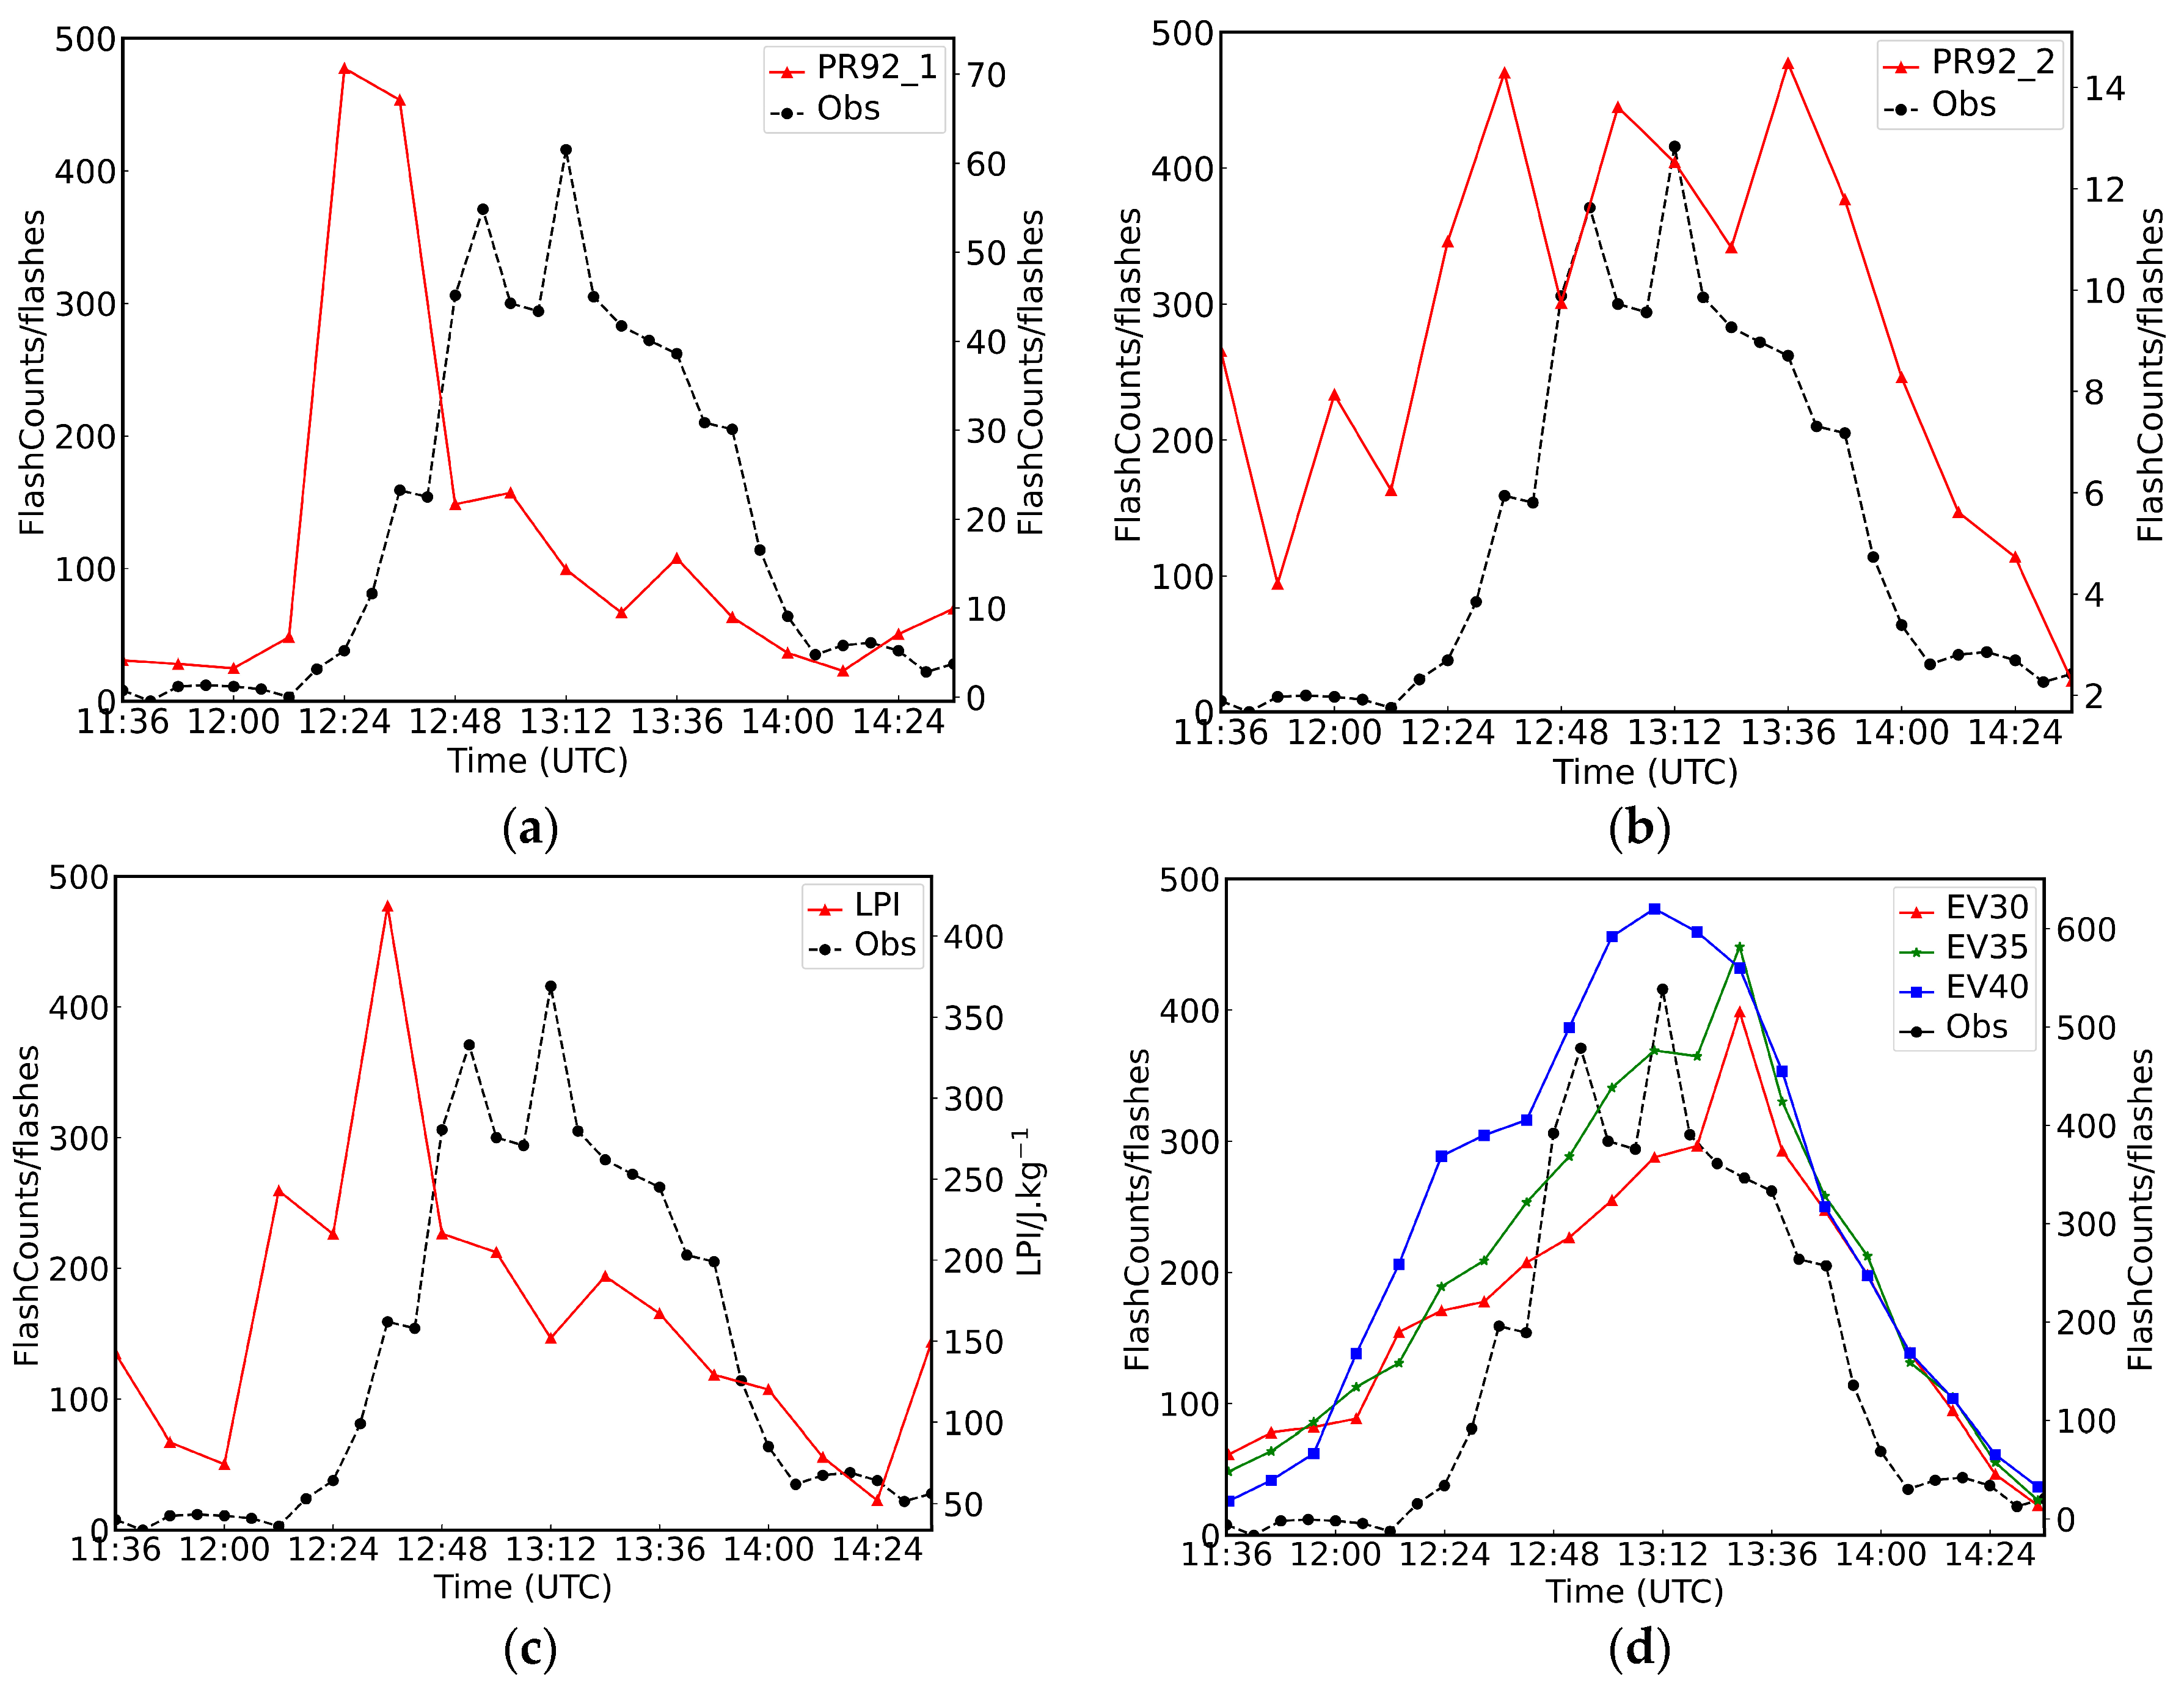
Figure 11.
The observed and simulated radar echo and lightning density by different parameterization schemes of two squall line cases. The simulated radar reflectivity (a1,a2), observed radar echo (b1,b2), observed lightning density (c1,c2), PR92_1 scheme (d1,d2), PR92_2 scheme (e1,e2), LPI scheme (f1,f2), V30dBZ scheme (g1,g2), V35dBZ scheme (h1,h2), and V40dBZ scheme (i1,i2). 1 represents case 20170808, and 2 represents case 20150727.
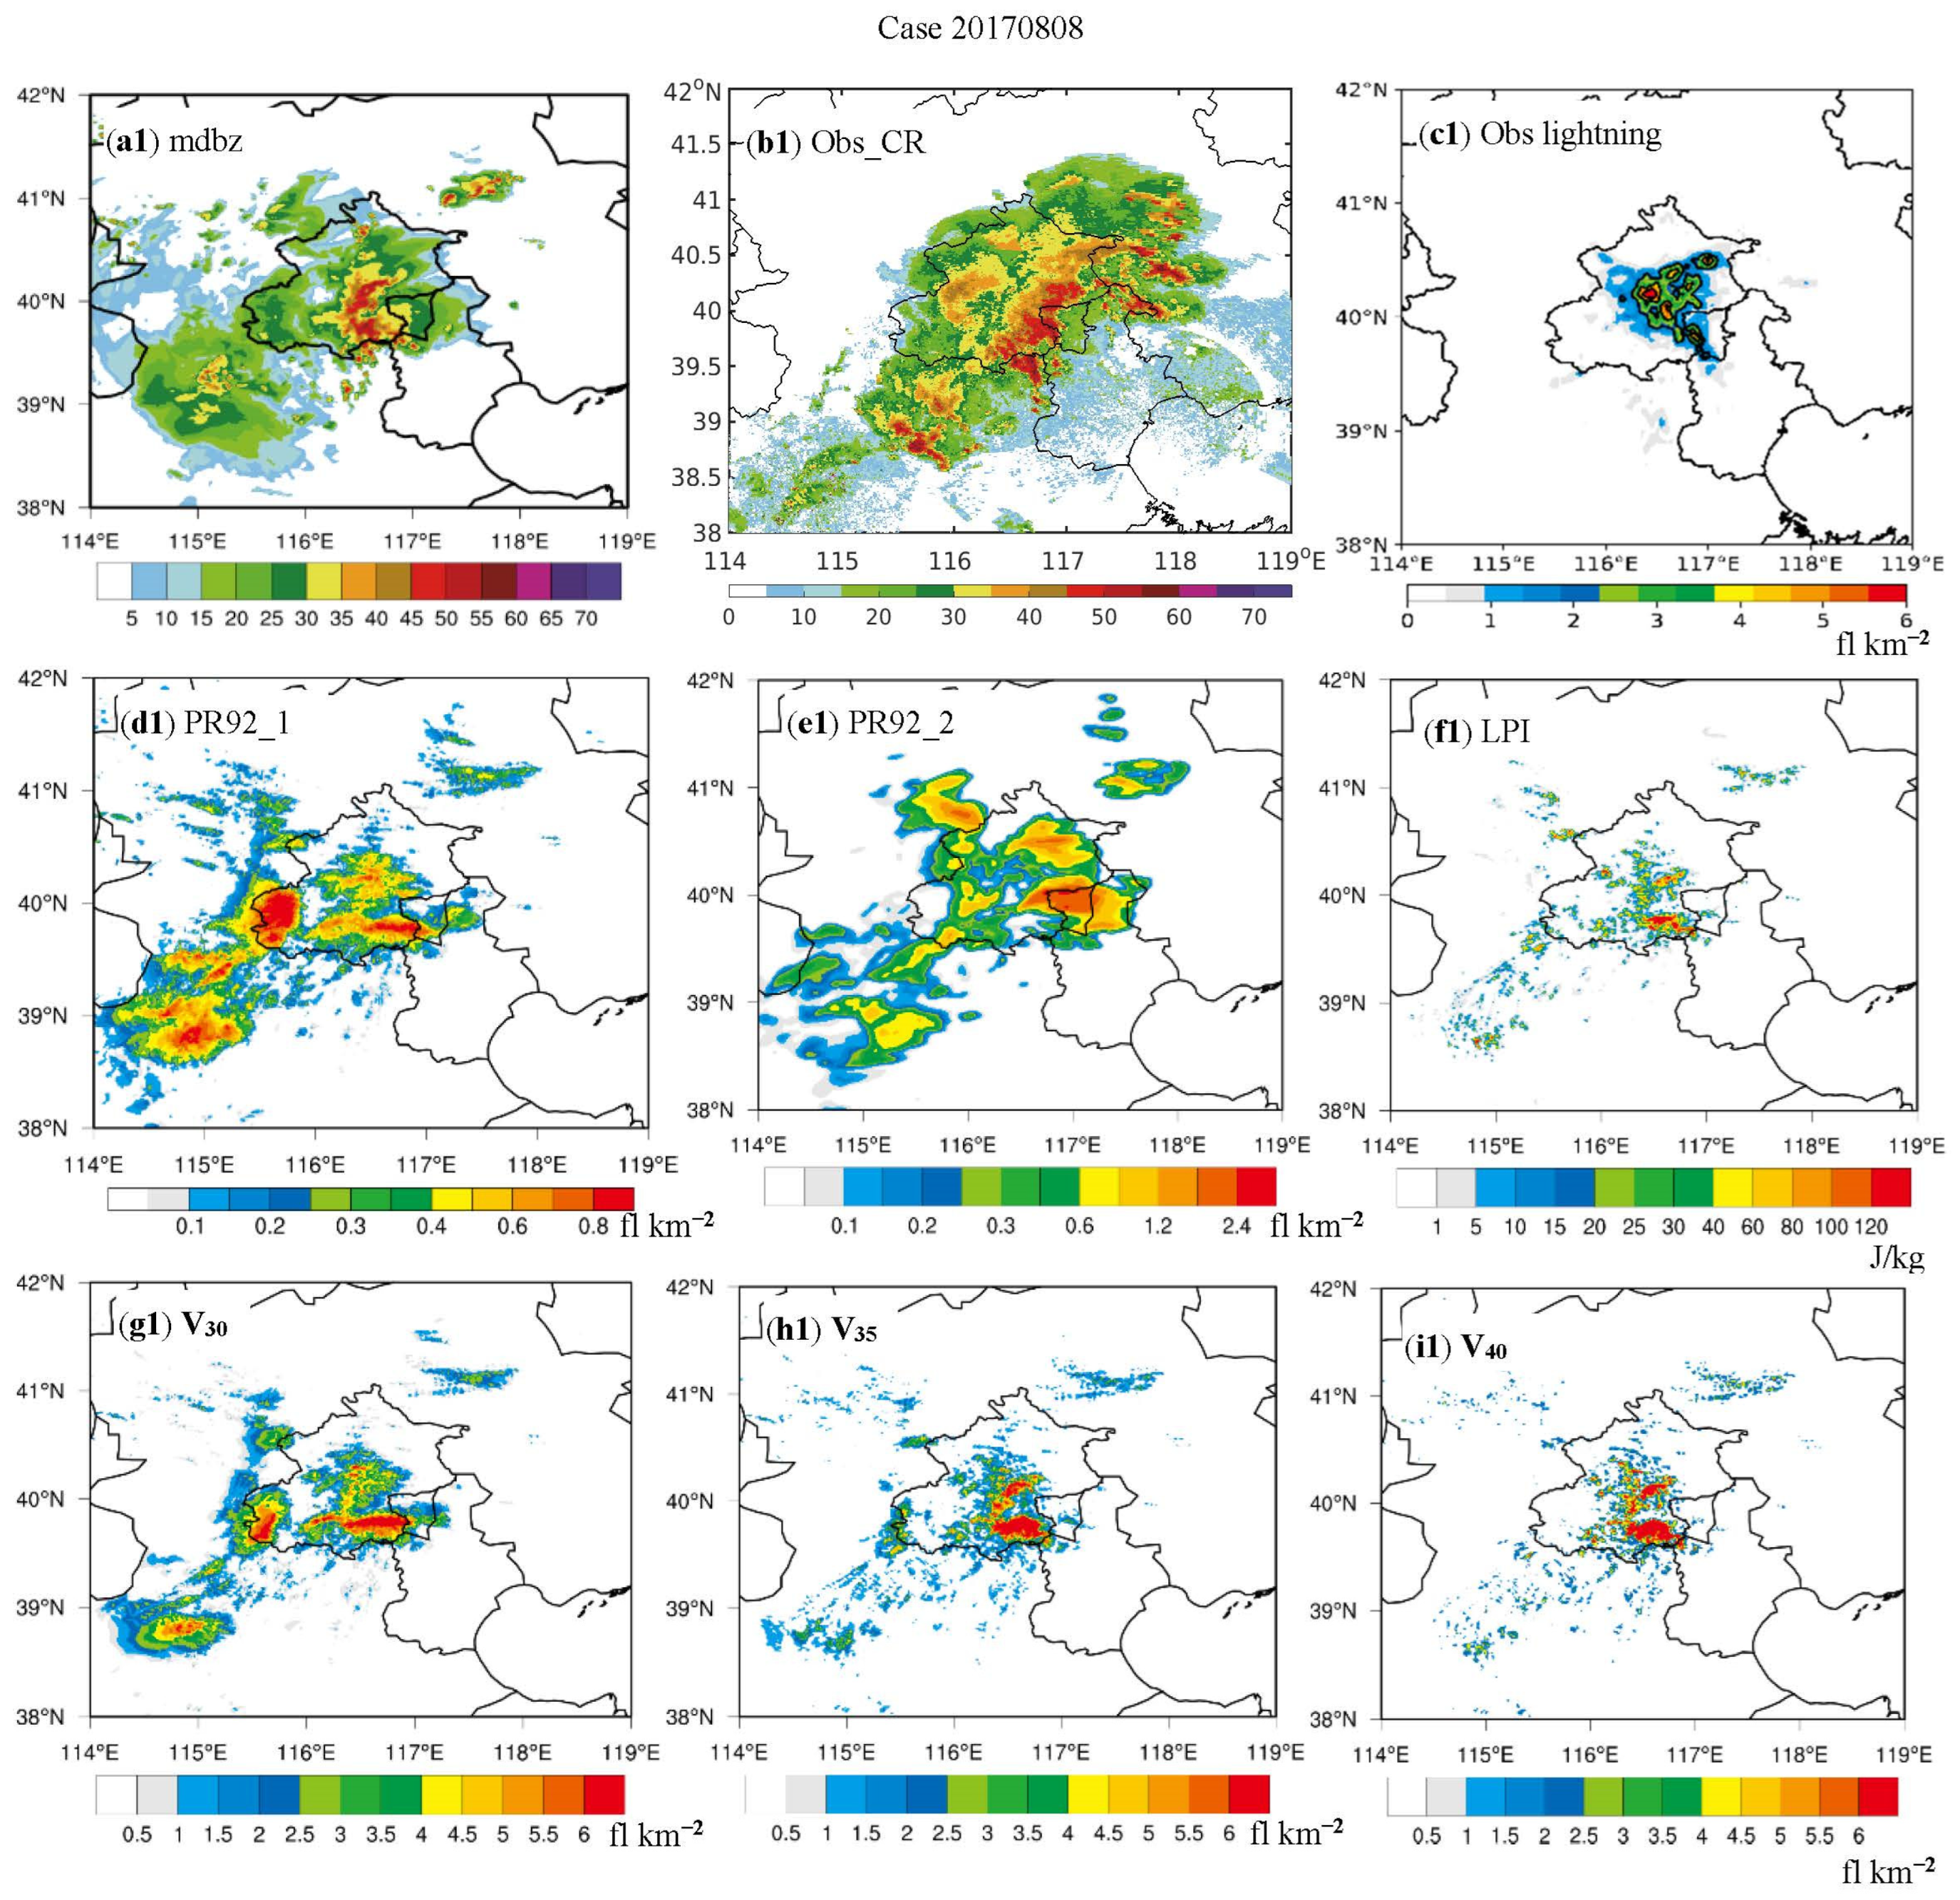

Table 2.
The WRF model settings.
| Model Settings | Outer Domain 1 | Inner Domain 2 |
|---|---|---|
| Resolution | 3 km | 1 km |
| Area grid | 398 × 396 | 601 × 484 |
| Time step | 12 s | 12 s |
| Microphysics | WDM6 | WDM6 |
| Longwave radiation | RRTM | RRTM |
| Shortwave radiation | Dudhia | Dudhia |
| Boundary layer | BouLac | BouLac |
| Land surface | Noah Land Surface | Noah Land Surface |
| Cumulus parameterization | Kain–Fritsch | (Closed) |
Table 3.
Lightning activity of seven squall lines during five warm seasons.
| Cases | Time (UTC) | Average LF * (fl 6 min−1) | Maximum LF * (fl 6 min−1) | Synoptic Background (500 hPa) |
|---|---|---|---|---|
| 20150727 | 08:00~13:36 | 284.2 | 1256 | cold vortex |
| 20160609 | 07:00~23:12 | 35.3 | 118 | trough |
| 20160621 | 08:00~14:54 | 85.8 | 429 | trough |
| 20170707 | 11:30~16:48 | 95.2 | 416 | cold vortex |
| 20170713 | 10:00~19:36 | 115.1 | 617 | trough |
| 20170802 | 09:48~20:06 | 8.5 | 96 | trough |
| 20170808 | 09:42~19:54 | 51.2 | 328 | cold vortex |
* Represents lightning frequency.
Table 4.
The parameters and coefficients in equations for the exponent fittings of lightning activity and radar echo volume in the squall line of 20170707.
Table 4.
The parameters and coefficients in equations for the exponent fittings of lightning activity and radar echo volume in the squall line of 20170707.
| Fitting Model | R-Squared | a | b (10−4) |
|---|---|---|---|
| V30dBZ | 0.87 | 0.91 | 1.48 |
| V35dBZ | 0.83 | 1.51 | 2.03 |
| V40dBZ | 0.76 | 2.74 | 2.91 |
Disclaimer/Publisher’s Note: The statements, opinions and data contained in all publications are solely those of the individual author(s) and contributor(s) and not of MDPI and/or the editor(s). MDPI and/or the editor(s) disclaim responsibility for any injury to people or property resulting from any ideas, methods, instructions or products referred to in the content. |
© 2023 by the authors. Licensee MDPI, Basel, Switzerland. This article is an open access article distributed under the terms and conditions of the Creative Commons Attribution (CC BY) license (https://creativecommons.org/licenses/by/4.0/).
Share and Cite
MDPI and ACS Style
Liu, D.; Yu, H.; Sun, C. Estimation of Lightning Activity of Squall Lines by Different Lightning Parameterization Schemes in the Weather Research and Forecasting Model. Remote Sens. 2023, 15, 5070. https://doi.org/10.3390/rs15205070
AMA Style
Liu D, Yu H, Sun C. Estimation of Lightning Activity of Squall Lines by Different Lightning Parameterization Schemes in the Weather Research and Forecasting Model. Remote Sensing. 2023; 15(20):5070. https://doi.org/10.3390/rs15205070
Chicago/Turabian StyleLiu, Dongxia, Han Yu, and Chunfa Sun. 2023. "Estimation of Lightning Activity of Squall Lines by Different Lightning Parameterization Schemes in the Weather Research and Forecasting Model" Remote Sensing 15, no. 20: 5070. https://doi.org/10.3390/rs15205070
Note that from the first issue of 2016, this journal uses article numbers instead of page numbers. See further details here.