
The Use of a Stable Super-Resolution Generative Adversarial Network (SSRGAN) on Remote Sensing Images

1
State Key Laboratory for Infrared Physics, Shanghai Institute of Technical Physics, Chinese Academy of Sciences, Shanghai 200083, China
2
University of Chinese Academy of Sciences, Beijing 100049, China
*
Author to whom correspondence should be addressed.
Remote Sens. 2023, 15(20), 5064; https://doi.org/10.3390/rs15205064
Submission received: 28 September 2023
/
Revised: 18 October 2023
/
Accepted: 19 October 2023
/
Published: 22 October 2023
(This article belongs to the Topic Hyperspectral Imaging and Signal Processing)
Abstract
:Because of the complicated imaging conditions in space and the finite imaging systems on satellites, the resolution of remote sensing images is limited. The process of increasing an image’s resolution, image super-resolution, aims to obtain a clearer image. High-resolution (HR) images are affected by various input conditions, such as motion, imaging blur, down-sampling matrix, and various types of noise. Changes in these conditions seriously affect low-resolution (LR) images, so if the imaging process is a pathological problem, super-resolution reconstruction is a pathological anti-problem. To optimize the imaging quality of satellites without changing the optical system, we chose to reconstruct images acquired by satellites using deep learning. We changed the original super-resolution generative adversarial nets network, upgraded the generator’s network part to ResNet-50, and inserted an additional fully connected (FC) layer in the network of the discriminator part. We also modified the loss function by changing the weight of regularization loss from 2 × 10⁻⁸ to 2 × 10⁻⁹, aiming to preserve more detail. In addition, we carefully and specifically chose remote sensing images taken under low-light circumstances from GF-5 satellites to form a new dataset for training and validation. The test results proved that our method can obtain good results. The reconstruction peak signal-to-noise ratio (PSNR) at the scaling factors of 2, 3, and 4 reached 32.6847, 31.8191, and 30.5095 dB, respectively, and the corresponding structural similarity (SSIM) reached 0.8962, 0.8434, and 0.8124. The super-resolution speed was also satisfactory, making real-time reconstruction more probable.
1. Introduction
The technology of remote sensing image acquisition is continually being developed and facing new challenges and demands.
Demands for higher resolution remote sensing image applications are increasing, including agricultural production analysis, coastal waterline monitoring, detailed land monitoring, infrastructure project surveying, and military target detection and tracking. Generally, the spatial resolution of an image is mainly determined using optical sensors and other hardware systems on satellites [1]. Complex imaging conditions, such as lighting and occlusion, also pose limitations for image resolution. In addition, the influence of deformation, motion (rotation, translation, zoom, etc.), blurring (sensor blur, motion blur, optical blur, etc., often modeled into various point spread functions (PSFs)), down-sampling matrix, various types of noise, and many other factors in the actual imaging process decrease the resolution of the images further.
Fortunately, thanks to the rapid and continuous development of information processing and computer vision technology, several super-resolution methods have been proposed in recent years, which can be roughly classified into three categories: interpolation, reconstruction, and example-based learning (i.e., deep learning) methods. Additionally, other methods can predict high-resolution hyperspectral images based on low-resolution information, achieving excellent results.
Despite these achievements, the performance of image super-resolution methods on remote sensing images is still far from satisfactory. Moreover, because of the multiple limitations of remote sensing data products, only the bicubic interpolation method is currently widely used on satellites as it is more stable and efficient in catering to the requirements of real-time imaging. Therefore, a practical method is urgently needed for the super-resolution of remote sensing images that can be used on satellites.
In this paper, we propose a Stable Super-Resolution Generative Adversarial Network (SSRGAN), a more stable network for super-resolution tasks. We made modifications to the SSRGAN as follows:
- (1)
- We upgraded the generator’s network to ResNet-50, in which the basic residual blocks were switched to bottleneck blocks, so the generator can process more channels of information better and faster.
- (2)
- We added an additional fully connected (FC) layer in the discriminator part to further blend the features extracted, so the modified discriminator can work more steadily as a classifier.
- (3)
- We modified the loss function by changing the weight of regularization loss from 2 × 10⁻⁸ to 2 × 10⁻⁹, aiming to preserve more details.
We also used the unique data obtained by GF-5 satellite for training, validation, and testing. The test results show that our proposed SSRGAN has a fairly satisfactory effect, and we assume that it can be further applied to more scenarios.
This paper is arranged as follows. In Section 2, we demonstrate the demand of super-resolution in low-light remote sensing systems and discuss the development of super-resolution and technology. In Section 3, we present and explain the proposed method. Section 4 describes the details of our experiment. The Results are shown and compared in Section 5, and the Discussion is carried out in Section 6. Section 7 shows our Conclusions and discusses possible future work.
2. Related Work
2.1. Remote Sensing Imaging Systems under Low-Light Conditions
On dark nights, the sky is still full of light, called “nocturnal radiation”. Nocturnal radiation comes from natural sources of radiation, such as the Sun, the Earth, the Moon, other planets, clouds, and the atmosphere. However, the luminosity is too weak for visual perception by human eyes (below the eye’s visual threshold). Enhancing the weak radiation to the level required for normal vision is a key task of low-light remote sensing technology.
Low-light remote sensing technology aims to acquire, convert, enhance, record, and display target image information at night and under other low-light conditions. Its achievements are concentrated on the effective expansion of remote sensing vision in the time, space, and frequency domains.
In terms of the time domain, low-light remote sensing technology overcomes the “night blindness” barrier, doubling the range of qualifying periods. In terms of the space domain, it enables remote sensing vision to achieve normal observations in low-light spaces. In terms of the frequency domain, it extends the visual frequency band to the shortwave region.
In the military field, low-light remote sensing technology has been used in night reconnaissance and other battlefield operations, and it can be combined with infrared, laser, radar, and other technologies to form a complete photoelectric reconnaissance, measurement, and alarm system. Low-light remote sensing imaging has become essential in the weapons and equipment available to troops. Furthermore, it has been applied in aerospace reconnaissance [2].
With the continuous development of low-light remote sensing technology, the design and implementation of low-light imaging systems face many challenges. First, the system design is difficult to optimize, and in the case of high-performance requirements, the analysis and matching design of the system opto-electro-mechanical indicators are challenging. Additionally, the information acquisition and processing capacity of the low-light imaging system is expected to become a technical bottleneck.
Assuming that the satellite orbital height is H, the surface pixel spatial resolution is Dg, the camera focal length is f, and the detector cell size is d, then . Figure 1 shows the imaging principle of the spaceborne remote sensing camera.
According to the above equation, when given the system orbital height H, if we want to increase the system spatial resolution Dg (that is, make Dg smaller), we must increase the focal length f of the camera or use a detector with a smaller cell size d. In a spaceborne ground-to-ground push-broom imaging system, the speed at which a satellite platform moves relative to the ground is
where μ is the Earth’s gravitational constant, R is the Earth’s radius, and H is the satellite’s orbital altitude relative to the surface. Thus, the operating frequency of the probe ffrm and the working period Tfrm are
Therefore, in an imaging system with a given orbital height, the higher the spatial resolution, the higher the system operating frame rate (line frequency), the shorter the system operating cycle, and consequently, the shorter the cell integration time.
Assuming that the target characteristics satisfy Lambert’s law, the low-light imaging system receives a faint light signal reflected by the target, and the number of photogenerated electrons generated on the cell is Ns:
where Tint is the integration time of the imaging system; L(λ) is the brightness of the spectrum on the target by night sky or sunlight; F is the F-number of the optical system; Apix is the single-cell area of the detector; τo(λ) is the spectral transmittance of the optical system; τa(λ) is the atmospheric spectral transmittance, η(λ) is the quantum efficiency of the detector; ρ(λ) is the target reflectivity; h and c are Planck’s constant and vacuum speed of light, respectively; and λ1 and λ2 are the cutoff wavelengths of the system response. The equivalent aperture of the optical system is D. The F-number of the optical system satisfies the equation . The three-dimensional instantaneous field of view of the imaging system, Ω, is related to the cell size, system focal length, ground resolution, and orbital height:
In Equation (4), Dg is the resolution size of a target on the ground, H is the orbital height of the camera, d is the cell size of the imaging system, and f is the system focal length.
Assuming that the total number of electrons in the system noise is ntotal, the system signal-to-noise ratio RSN can be obtained as .
In low-light imaging, when the imaging system works in a low-illumination region, the target receives a spectral radiation brightness L(λ), which is 108–109 orders lower than the visible light panchromatic remote sensing imaging system working in the insolation region. To obtain a sufficient system signal-to-noise ratio, a large cell size detector is needed to improve the detector integration time and reduce the optical system’s F-number. However, to maintain the spatial resolution of the imaging system, increasing the cell size increases the focal length of the optical system. To improve the system signal-to-noise ratio, the F-number in the optical system needs to be maintained or reduced, and the optical system aperture increases.
Therefore, solving the contradiction between a high resolution and system signal-to-noise ratio by only adjusting the detector cell size and the F-number of the optical system leads to a very large scale of the imaging optical system. This brings challenges to optical design, processing, and assembly, and the excessive volume and weight of the optical system cannot adapt to the spaceborne platform.
2.2. Super-Resolution in Remote Sensing Images
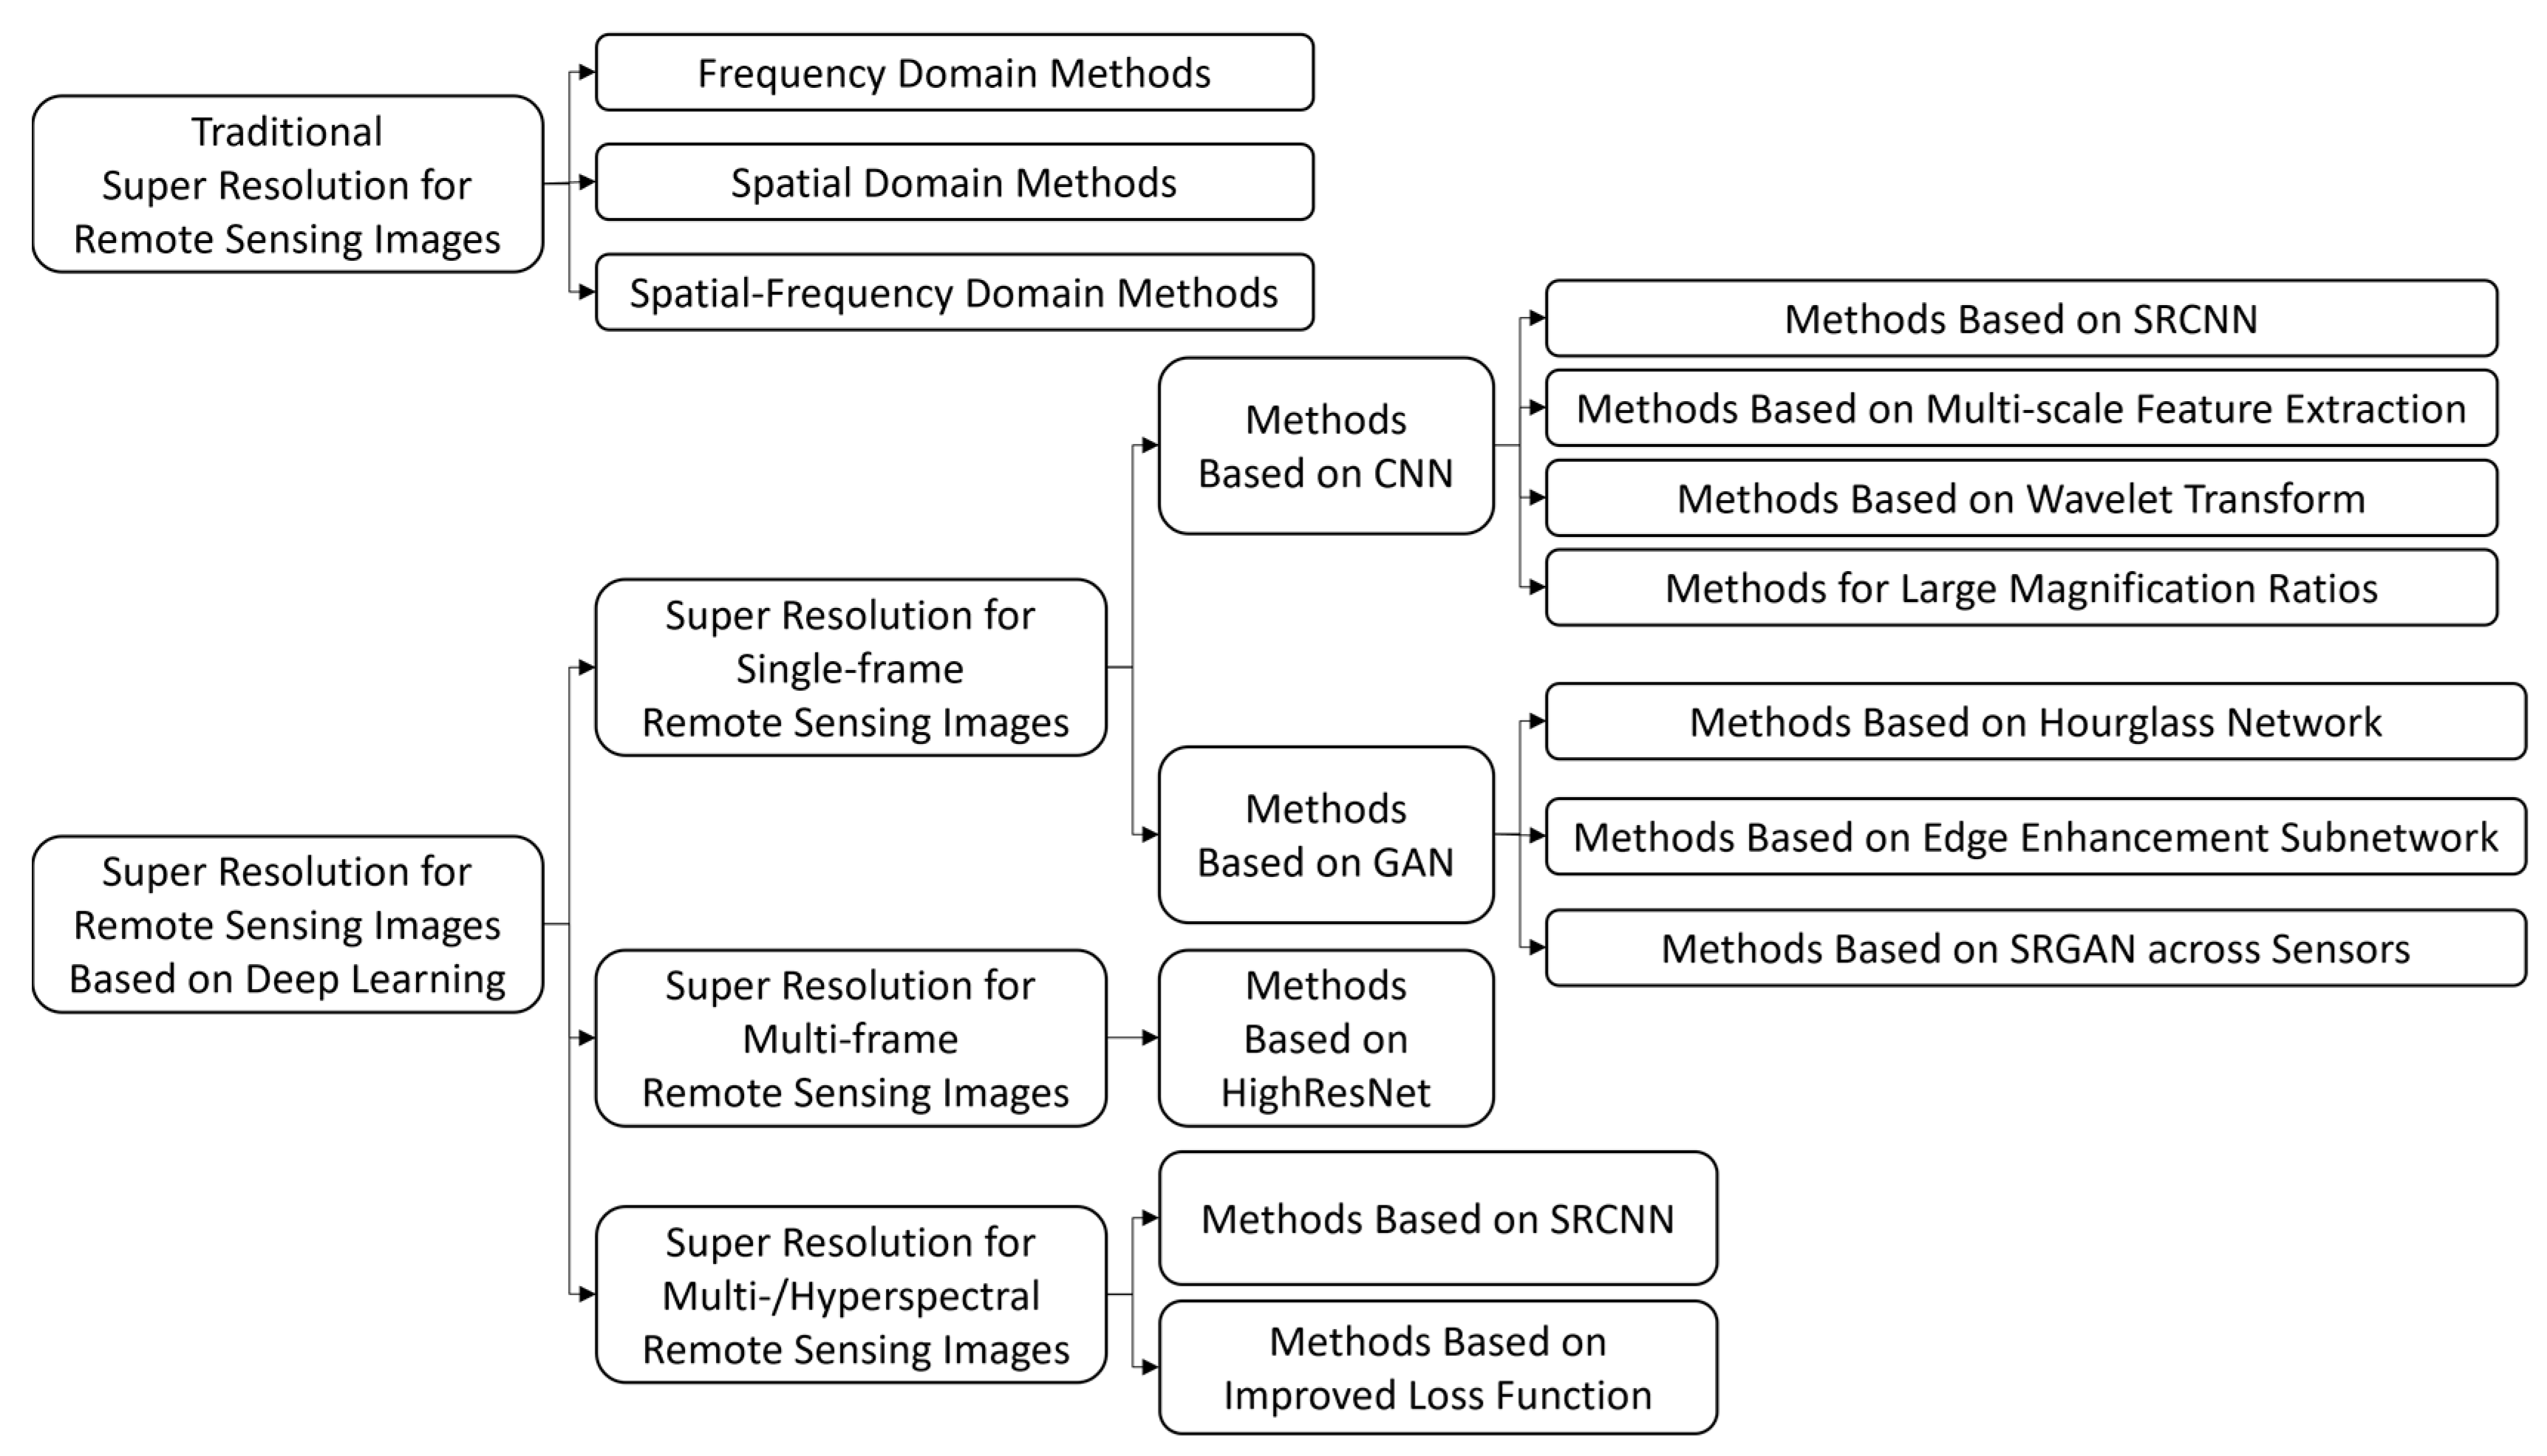
In remote sensing image processing, single- and multi-image super-resolution methods have been proposed in the past few decades [5]. A brief overview of different methods is shown in Figure 2.
In 1955, Toraldo di Francia defined the concept of super-resolution in the field of optical imaging, using optical knowledge to recover data information beyond the diffraction limit. Around 1964, Harris and Goodman applied image super-resolution to the process of synthesizing a single-frame image with richer detail information by extrapolating the spectrum. In 1984, based on predecessors, Tsai, Huang, and others designed a method of reconstructing high-resolution images using multi-frame low-resolution images, and the super-resolution reconstruction technology began to receive widespread attention and research interest from academia and industry [6,7].
For the super-resolution process on single-frame remote sensing images, the statistical sparsity prior of ordinary images [10,11] is most utilized. In 2013, inspired by the theory of compressive sensing and self-structural similarity, Pan [12] increased the resolution of a remote sensing image merely based on raw pixels. Discrete wavelet transform and sparse representation also proved useful [13] for super-resolution reconstruction when combined. For hyperspectral images, sparse properties in the spatial and spectral domains have been well researched, playing a vital role in super-resolution reconstruction.
Although the above approaches have had an important role in the field of remote sensing image super-resolution, their defects remain obvious. First, these methods were proposed on the basis of features on lower levels [14,15]. The performance of machine learning algorithms is determined based on how the features of the images are represented [16]. Low-level features, such as raw pixels [11], are far from satisfactory. So far, the most popular scheme has been to extract high-level features via deep convolutional neural networks (CNNs). The results of CNNs used in image classification and object detection also demonstrate their possibility for more complex applications, such as image classification [17] and object detection [18]. The spatial distribution of remote sensing images is more complicated than that of natural images, making higher-level features vital to obtain and yield a better representation of the data. CNN-based [19,20,21] methods are useful for learning end-to-end mapping directly between low- and high-resolution images, achieving state-of-the-art performance on natural image super-resolution reconstruction.
Second, unlike in natural images, objects on the ground in remote sensing images usually share a wider range of scales; the object (e.g., airplane) and its surrounding environment (e.g., airport) are mutually coupled in the joint distribution of their image patterns. However, most of the methods mentioned above learn data priors on a limited single-object scale, which means the information of the surroundings is usually neglected. Moreover, the process of super-resolution requires the inference of missing pixels, resulting in a more challenging problem.
3. Methodology
The network prototype used in this paper was the generative adversarial network (GAN). The original Super-Resolution Generative Adversarial Network (SRGAN), proposed by Ian J. Goodfellow in [23]., used basic residual blocks with batch normalization layers in its generator model and the first 16 layers of a pre-trained VGG-19 network in its discriminator model to calculate the loss function. In this paper, the generator model was updated to ResNet-50, where the basic blocks were replaced by bottleneck blocks, and the discriminator model was updated to a VGG-19 network truncated by its first 16 layers with an additional fully connected (FC) layer.
3.1. General Architecture: Generative Adversarial Network
In [22], researchers proposed an inspiring framework for estimating generative models via an adversarial process, in which they simultaneously trained two models: a generative model G that captured the data distribution and generated images and a discriminative model D that estimated the probability that a sample came from the training data rather than G. Such nets are named GANs.
By decomposing the optimization process of GANs, the authors of [22] rigorously proved the convergence of GANs from the following mathematical deduction: under the condition that both G and D have sufficient capacity, if at each step in the iterative process, D can reach the optimal value at a given G and G is then updated, then the final Pg converges on Pdata. They also theorized that the original article prioritizes D in each iteration to ensure that D is optimal given the current G, and then G is updated to the optimal so that the loop iteration completes the training. This proof laid a solid foundation for the subsequent development of GANs so that, compared to many other deep learning models, GANs have gained much more attention, receiving more improvements and extensive applications. A brief evolutional history of GANs is shown in Figure 3.
SRGAN [23] takes advantage of the adversarial nature of GANs combined with deep neural networks to learn how to generate magnified images [5] (up to four times the native resolution). The generator uses a combination of CNNs and ResNets, as well as batch normalization layers, pixel-shuffle layers, and activation functions (e.g., Parametric ReLU). It first down-samples the image and then up-samples it to produce a super-resolution image.
Similarly, the discriminator uses a series of CNNs, along with dense layers, Leaky ReLU, and sigmoid activations, to determine whether the image is the original high-resolution image or a super-resolution image output by the generator. Details are shown in Figure 4.
In all, SRGANs have shown a remarkable performance when enlarging an image while restoring or preserving fine-grained, high-fidelity details. Remote sensing images contain richer spatial detail information, richer high-frequency information, more color, shape, and texture features, and more target edge structures than ordinary images, and the SRGAN has a relatively better ability to extract and learn deep, fine, and complicated features to reconstruct remote sensing images. So, in this paper, we used SRGAN as our general architecture to realize remote sensing image super-resolution.
3.2. Generator Model: ResNet-50
The deep residual network (ResNet), a milestone in the history of CNN image processing, was first proposed by He Kaiming [24], Zhang Xiangyu, Ren Shaoqing, Sun Jian, and others at the Microsoft Research Academy, winning the ILSVRC competition in 2015.
The main contribution of ResNet was the discovery of “degradation” and “shortcut connection”, the latter of which helps avoid the degradation phenomenon, addressing the difficulty in training neural networks with excessive depth. Before ResNet, it was widely believed that, theoretically, by increasing the number of network layers, the network could extract more complex feature patterns, so better results could be obtained with deeper structures of the model. However, VGG, GoogLeNet, and other networks that simply increase the number of layers were faced with bottlenecks: by simply stacking the convolutional layers on top of one another, the training error unexpectedly increased. This was mainly because deep networks usually have the problem of gradient disappearance or explosion. Therefore, the more layers a model has, the more difficult it is to train.
Fortunately, the introduction of residual block by ResNet, also known as a shortcut connection, shown in Figure 5, addressed this problem and achieved a good balance between linear and nonlinear transformation. The shortcut connection between the layers sums the output of the previous layers with the output of the stacked layers. This feature improves the training efficiency of deeper networks and mitigates the problem of the vanishing gradient by allowing the gradient to flow through an alternate path.
In this paper, ResNet-50 was utilized. The main difference between ResNet-34 and ResNet-50 is that ResNet-34 uses basic blocks, while ResNet-50 uses bottleneck blocks; both are shown in Figure 6. Note that for both basic and bottleneck blocks, when stride = 1, no down-sampling occurs; when stride = 2, down-sampling happens before add-up. The main function of this convolution kernel is to reduce the number of channels that need to be processed later in the module, allowing for more channel inputs with fewer parameters in a deeper network. It also addresses the problem of the large required computing power mentioned above.
The structure of the generator network is shown in Figure 7. The first building layer is composed of a normal convolutional layer and a max pooling layer. The second building layer consists of three residual bottleneck blocks. The third, fourth, and fifth building layers all start with down-sampling residual bottleneck blocks, followed by three, five, and two residual bottleneck blocks, respectively.
After processing through 16 bottlenecks to extract features, the resolution increases by two pixel-shuffle layers. Here, the image only increases at the back of the network layers, enhancing the resolution while reducing the consumption of computing resources.
3.3. Discriminator Model: Truncated and Modified VGG-19
The VGG model, a CNN well suited to classification and localization tasks, was proposed by Karen Simonyan and Andrew Zisserman of the Visual Geometry Group (VGG) at Oxford University. The VGG architecture also won the first runner-up in the 2014 ILSVRC competition. The architecture of VGG-19 is shown in Figure 8.
Using the pooling layer as the demarcation, VGG-19 has a total of six block structures, each with the same number of channels within each block structure. Since both the convolutional layer and the fully connected (FC) layer have weight coefficients, they are also known as the weight layers. There are 16 convolutional layers and 3 fully connected layers, and the pooling layers do not include weights, totaling 19 layers. The discriminator uses the first 16 layers to generate the feature map.
The image is first input to the first convolution block, with a kernel size of 3 × 3 and stride = 1. This operation extracts features from the image and generates feature maps to store them. After the max pooling has been carried out, the dimensions of the convolved image are halved to reduce the computational complexity and the probability of overfitting. The image is then passed through the second, third, fourth, and fifth blocks, where convolutions are performed, finally passing through the FC layers. In the FC block, the vector of the image is fed to dense layers of 1024 neural units, during which stage Leaky ReLU is utilized as the activation function. The output dimension of the final dense layer is two, namely true or false (only in our experiment). The final dense layer uses sigmoid as the activation function, whose output is 0 or 1, determined based on the classification results.
In this paper, another dense FC7 layer with 1024 neural units is added before the sigmoid layer to further combine the features of HR images. The influence of feature locations on classification results is further weakened, thus better discriminating if the input image is a ground truth image or a super-resolution image. The added dense FC7 layer also improves the robustness of the entire network. The modified network is given in Figure 9.
3.4. Loss Function
The loss lSSR can be divided into two parts: perceptual loss and regularization loss:
In Equation (5), is the content loss based on VGG structure, is the adversarial loss of GAN network, and is the regularization loss.
The perceptual loss is made up of VGG-based content loss and adversarial loss.
Here, we introduce VGG loss.
The author of [23] first applied the feature vector of the pre-trained VGG-19 network to obtain the result of the generator. Then, they calculated the loss between the feature map generated at a certain layer of VGG-19 and the feature map generated by ground truth (GT). This loss can better reflect the perceived similarity between pictures.
In Equation (6), is the feature map obtained by the j-th convolution after activation and before the i-th maxpooling layer of the VGG-19; and are the dimension parameters of the feature maps.
In this paper, we use the network before the fourth convolutional layer and the fifth maximum pooling for feature extraction and calculate the mean squared error (MSE) in false and true high-resolution images, yielding the output of the first 16 layers of the VGG network.
For adversarial loss, we aim to minimize the equation below to maximize the probability that the discriminator indicates that the image generated by the generator is true.
In Equation (7), is the probability that the reconstructed image is a natural HR image.
The regularization loss is expressed below:
In [23], the authors selected 2 × 10⁻⁸ as the weight of regularization loss. They argued that the regularization loss tends to preserve the smoothness of the image and prevent the image from becoming too pixelated. For remote sensing images, however, the preservation and subsequent analysis of real details are more important than the perception of human eyes. This explains why, compared with the loss function of SRGAN, our weight of regularization loss in the loss function is relatively reduced. We carefully experimented with exponents from −8 to −10. The experimental results showed that when the exponent was −9, the reconstruction could best prevent the edges from being too smooth and losing texture details.
3.5. Optimizers: SGD and AdaGrad
In the stochastic gradient descent (SGD) algorithm [26,27], the direction of the maximum value of directional derivatives represents the direction of the gradient. Therefore, when performing gradient descent, by updating the weights along the opposite direction of the gradient, the global optimal solution can be effectively found.
The following equation shows how the weights and bias are updated by SGD:
where wt and bt are the weight and bias at time t, respectively; L is the loss function, and is the preset learning rate.
The adaptive gradient algorithm (AdaGrad) can adjust different learning rates corresponding to different parameters, update frequently changing parameters in smaller strides, and update sparse parameters in larger strides. AdaGrad uses the “sum of squares of historical gradients” to measure the sparsity of the gradients of different parameters. The smaller the sum of squares of historical gradient, the sparser the gradient.
The specific formulas used to update parameters are
Unlike other optimizers such as SGD, in which the learning rate is constant, AdaGrad makes use of flexible learning rates, thus avoiding the manual tuning of the learning rate and increasing the convergence speed, making it an ideal option for our algorithm and achieving more reliable results.
4. Experimental Settings
4.1. Dataset
In this paper, a new dataset was generated in which all images were obtained by the GF-5 satellite launched by China. Successfully launched on 9 May 2018, the Gaofen-5 satellite (GF-5) is the world’s first satellite to make integrated observations of land and atmosphere simultaneously.
At a width of 60 km and spatial resolution of 30 m, 330 spectral color channels can be obtained from a spectral color range of visible light to shortwave infrared (400–2500 nm), a range nearly nine times wider than that of general cameras. The number of color channels is nearly 100 times more than that of general cameras, and the spectral resolution of the visible spectral band is 5 nm.
The source images of GF-5 are all hyperspectral. Among the channels, only the 700/545/435 nm (RGB) channels were selected for training. The original images obtained by the GF-5 satellite had a pixel resolution of 2008 × 2083; they were then randomly cropped to the size of 96 × 96 to form the training datasets and validation datasets. These images were down-sampled by a factor of four, a small amount of noise was fused, and the image degradation was processed to obtain a low-resolution image group, which was formed together with the original image group to form an LR–HR training pair. In addition, operations such as rotation and staggering were performed to expand the amount of data.
4.2. Evaluation Criteria
4.2.1. PSNR
The peak signal-to-noise ratio (PSNR) is used to express the ratio between the maximum possible power of a signal and the power of the destruction noise that affects the fidelity it represents. Because many signals have a very wide dynamic range, the PSNR is often expressed as the number of pairs using a decibel scale. The PSNR is mainly used in image processing to quantify the reconstruction quality of images and videos affected by lossy compression. The PSNR is defined by the MSE.
Given a noise-free m × n monochrome image I and its noise approximation K, MSE can be defined as
PSNR is then defined as , where MAXI is the maximum possible pixel value in the image. Typically, for an image in which the pixel value is represented by B-bit binary, MAXI = 2B − 1. In general, for uint8 data, the maximum pixel value is 255; for floating-point data, the maximum pixel value is 1.
For hyperspectral images, we needed to calculate the PSNR separately for different bands and then take the average.
4.2.2. SSIM
Structural similarity (SSIM) is used as a measure of similarity between two given images. SSIM extracts three key features from an image: luminance, contrast, and structure. Figure 10 offers a diagram of how the comparison between the two images based on these three features is carried out.
where μ is the mean value, σ2 is the variance, and σxy is the covariance; c1 and c2 are two given constants that are set beforehand to avoid the probability of dividing by zero; and x and y stand for two different input images.
For hyperspectral images, we needed to calculate the SSIM separately for different bands and then take the average.
4.2.3. Time
The time consumed in the executing process to reconstruct a high-resolution remote sensing image from a low-resolution one indicates the speed of the algorithm. Sometimes, an algorithm can achieve excellent results but take too much time, which is a shortcoming in the field of remote sensing because most remote sensing satellites have a high demand for real-time performance. An ideal algorithm for satellites should achieve a balance between resolution and speed.
5. Results
The training process was carried out as follows. The experiment results were satisfactory, showing that our improved GAN could achieve a better and more practical outcome compared with other introduced networks.
5.1. Training Process
We set the learning rate to 0.001 and the batch size to 32, and we trained 400 times on a GTX3060 graphics card. The training process of GAN-like networks has always been challenging. Since the training process is a game process, the training stopping point is difficult to determine. An inappropriate stopping point can lead to pattern collapse.
In this paper, we set the threshold of loss to be 0.001 and the number of training epochs to be 400. We also made comparisons between losses after each training epoch and saved the model with a smaller loss as a checkpoint for comparison with the next epoch. In this way, we ensured that our saved model achieved the best effect through the entire training process and that the training process would stop spontaneously when the loss was under 0.001.
The loss function in the training process is shown in Figure 11, showing that the loss function fluctuated and decreased, and the fluctuation amplitude was large, which also confirmed the shortcomings of the instability of the original GAN network and the potential for the collapse of training. Fortunately, our SSRGAN model was more stable, and no pattern collapses occurred.
A brief visualization of the training process is given in Figure 12.
During the training process, the image was enlarged by four times. A comparison with the original image shows that, although some noise was introduced and some details were slightly blurred, the texture was clear, and the main structure was basically restored. After 150 training iterations, the results of the validation test are shown in Figure 12.
5.2. Ablation Study
In order to demonstrate the effectiveness of our proposed generator and discriminator, we conducted an ablation study.
We tested four models in all: the original SRGAN, the SRGAN modified by the generator only, the SRGAN modified by the discriminator only, and our SSRGAN equipped with both the modified generator and discriminator. The four models were tested on five GF-5 remote sensing images with a 2×, 3×, and 4× magnification ratio. We calculated and recorded the PSNR and SSIM for each model on each image separately and calculated the mean for every single model using five images.
The results are shown in Figure 13 and Table 1, Table 2 and Table 3. In the figure and the tables, the SRGAN modified by the generator only is written as SRGAN + G and the SRGAN modified by the discriminator only is written as SRGAN + D for convenience.
From the tables, we can see that both the modified generator and the modified discriminator have a contribution to the improvement in the reconstruction of the LR images, which proves the effectiveness of our proposed generator and discriminator.
5.3. General Results Comparison
Next, the quantitative index comparison of mainstream algorithms is given, among which bicubic linear interpolation can be considered a representative of traditional algorithms, e.g., SRCNN, VDSR, DRRN, and DCSCN, which are all excellent representatives of deep learning-based algorithms from recent years.
Under magnification ratios of 2×, 3×, and 4×, the modified SRGAN algorithm achieved a good performance, and at 4× magnification, a PSNR of more than 30 dB could still be obtained, and the SSIM reached more than 0.8, an obvious improvement. Results are shown and listed in Figure 14, Figure 15 and Figure 16 and Table 4, Table 5 and Table 6. The histograms of PSNR comparisons are shown in part (a) in Figure 14, Figure 15 and Figure 16, and the histograms of SSIM comparisons are shown in part (b) in Figure 14, Figure 15 and Figure 16. Table 4, Table 5 and Table 6 give the quantitative comparisons of the PSNR, SSIM, and speed of the algorithms.
Here, we only compared how much time it takes to reconstruct an image with a 2×, 3×, and 4× magnification ratio. We cannot give an exact criterion to tell if an algorithm is efficient enough to be performed on satellites, yet, because the imaging conditions and processing conditions on satellites are difficult to conduct simulations with. So far, however, bicubic linear interpolation is most used as an on-satellite data processing method for its almost immediate response. So, we make the assumption that when an algorithm can give its result within one second in our experiment, it shows the potential to be equipped on satellites.
5.4. Comparison of Details
The figures and tables in Section 5.2 show that, among the methods, VDSR achieved the most similar effect to that of the algorithm proposed in this paper. We selected VDSR as a representative of other deep learning neural networks to undertake comparisons with the traditional bicubic linear interpolation algorithm and our network.
We chose some images with either more complex contour lines or smaller targets to test the bicubic linear interpolation algorithm, VDSR, and our algorithm and assessed their performance in the reconstructions of various details. The test results are shown in Figure 17 and Figure 18.
Figure 17 and Figure 18 show that, compared with the bicubic linear interpolation, VDSR and SSRGAN achieved better super-resolution processing effects.
However, as Figure 17 shows, in terms of detail, super-resolution images processed by VDSR may have some “dead pixels” when reconstructing finer and more complex contour lines. Additionally, Figure 18 indicates that sometimes, with the pursuit of higher PSNR, VDSR handles details too smoothly, resulting in sticking or even loss of tiny targets, and our algorithm improved this problem to some extent.
6. Discussion
Under experimental conditions where the magnification ratios were set to 2, 3, and 4, the PSNR and SSIM of the method proposed by this paper were significantly improved, and the reconstruction speed was much faster. The image resolution increased by four times in 1 s, achieving high reconstruction efficiency.
For remote sensing images, especially infrared remote sensing images, in addition to common minor issues, such as blurred edges, the most significant problem is the loss of detail.
The SSRGAN in this paper used ResNet-50 in the generator, and the network has many bypass branches, called shortcuts, that connect the input directly to the later layers, which can directly learn the residuals. The traditional convolutional layer or fully connected layer can have various problems, such as information loss and loss when transmitting information. ResNet solves this issue to some extent by directly detouring input information to the output, protecting the integrity of the information, and the entire network only needs to learn the difference between the input and output, simplifying the learning objectives and difficulty. Moreover, the visualization of the training process shows that it converged quickly.
A modified VGG-19 network was used in the discriminator, and a total of 34 layers of the network were truncated and intercepted for feature extraction and learning. On this basis, another fully connected layer was added to enhance the extraction and identification of gradient features to compensate for lost detail. Moreover, the extra FC layer also helped to stabilize the entire network.
The comparison presented in Figure 17 and Figure 18 shows that the results obtained by the SSRGAN had a slight color cast. This may have been because SSRGAN uses multichannel direct inputs. The original SRGAN uses an integer input, split into three channel (RGB or YcrCb) signals, reconstructed separately, and fused to a fixed scale. SSRGAN’s multichannel input could increase the proportion of one of the channels (wavelength or band) to obtain an enhanced reconstruction image within the specified band for better results. Color casts can be a minor drawback of the above n-to-1 input method.
Furthermore, because of the smaller weight of regularization loss, the outcome was sharpened. Although for some images with more low-frequency information, the reconstruction can be somehow over-pixeled and a little pixelation could be observed by human eyes, more texture details were recovered and preserved for further analysis, such as target detection and identification, which is critical in the field of remote sensing. We plan to improve this problem later.
7. Conclusions
To address the contradiction between high resolutions and the limited scale of the imaging optical system, an effective method to improve the system performance via the information processing system is urgently needed. Super-resolution reconstruction is a good choice.
Given the rapid development of deep learning and CNNs, GAN architecture proves to be a potential candidate, and SRGAN is trained based on the GAN method. It comprises a generator and a discriminator; the main body of the discriminator uses VGG-19, and the generator is a series of residual block connections. At the back of the model, we also added a subpixel module, borrowing the idea from Subpixel Network [23], to increase the resolution while reducing computing resource consumption.
For better applications using remote sensing images, we made various modifications. First, we upgraded the basic residual blocks in the original model to bottleneck blocks, in which 1 × 1 to 3 × 3 to 1 × 1 convolution kernel sizes reduced the calculation parameters while maintaining accuracy. Then, we modified the discriminator in the original model from the plain VGG-19, and the deepened network structure could make the feature extraction more comprehensive and improve the model’s accuracy. On top of the original VGG-19, we added a fully connected layer before SoftMax, making the network more stable. Because of the tandem structure of the network, the amount of computation was not increased significantly.
Secondly, since our focus was on remote sensing images, the weight of regularization loss in the entire loss function was reduced, with the aim of preserving more texture details rather than smoothing them. Lastly, our unique dataset of GF-5 images also made our algorithm more targeted relative to remote sensing images. The “n to 1” mode also helped to obtain a better outcome in terms of detail recovery.
Therefore, our modified network, SSRGAN, has a superior super-resolution effect for remote sensing images. It shows great advantages in our test; we believe that the process is also applicable to already degraded and low-resolution images but needs further modification and polishing in order to have results. In the future, we plan to conduct experiments using our proposed method on raw images obtained by satellites to see how it will perform. If the performance is not ideal as we assumed, we plan to establish new image degradation models and adjust the related parameters in our SSRGAN accordingly, thus enhancing its applicability and flexibility to process remote sensing images under diverse circumstances.
Author Contributions
Conceptualization, B.P. and Y.L.; Methodology, B.P.; Software, B.P.; Validation, B.P.; Formal analysis, B.P.; Investigation, B.P. and S.Z.; Resources, B.P.; Data curation, B.P.; Writing—original draft, B.P.; Writing—review & editing, B.P., S.Z. and Y.L.; Visualization, B.P.; Supervision, B.P. and Y.L.; Project administration, Y.L.; Funding acquisition, Y.L. All authors have read and agreed to the published version of the manuscript.
Funding
This project was supported by the Major Program of the National Natural Science Foundation of China (Grant No. 42192582) and the National Key R&D Program of China (Grant No. 2022YFB3902000).
Data Availability Statement
Not applicable.
Conflicts of Interest
The authors declare no conflict of interest.
References
- Gleyzes, M.A.; Perret, L.; Kubik, P. Pleiades System Architecture and Main Performances. ISPRS-Int. Arch. Photogramm. Remote-Sens. Spat. Inf. Sci. 2012, XXXIX-B1, 537–542. [Google Scholar] [CrossRef]
- Kubik, P.; Pascal, V.; Latry, C.; Baillarin, S. Pleiades Image Quality: From Users’ Needs to Products Definition. Proc. Spie Int. Soc. Opt. Eng. 2005, 20, 59780L. [Google Scholar]
- Chen, S.; Rice, C.; Philbrick, B.; Boyle, C.; Hauser, E.W. Integrated Remote Sensing and Visualization (Irsv) System for Transportation Infrastructure Operations and Management, Phase One, Volume 6. High Resolut. Aer. Photogr. 2009, 109, 42–45. [Google Scholar]
- Aoran, X.; Zhongyuan, W.; Lei, W.; Yexian, R. Super-resolution for “Jilin-1” Satellite Video Imagery via a Convolutional Network. Sensors 2018, 18, 1194. [Google Scholar] [CrossRef]
- Agustsson, E.; Timofte, R. NTIRE 2017 Challenge on Single Image Super-Resolution: Dataset and Study. In Proceedings of the 2017 IEEE Conference on Computer Vision and Pattern Recognition Workshops (CVPRW), Honolulu, HI, USA, 21–26 July 2017; IEEE: Piscataway, NJ, USA, 2017. [Google Scholar]
- Yang, D.; Li, Z.; Xia, Y.; Chen, Z. Remote sensing image super-resolution: Challenges and approaches. In Proceedings of the 2015 IEEE International Conference on Digital Signal Processing, Singapore, 21–24 July 2015; IEEE: Piscataway, NJ, USA, 2015. [Google Scholar]
- Dong, C.; Loy, C.; He, K.; Tang, X. Image super-resolution using deep convolutional networks. IEEE Trans. Pattern Anal. Mach. Intell. 2016, 38, 295–307. [Google Scholar] [CrossRef] [PubMed]
- Haut, J.; Fernandez-Beltran, R.; Paoletti, M.; Plaza, J.; Plaza, A.; Pla, F. A new deep generative network for unsupervised remote sensing single-image super-resolution. IEEE Trans. Geosci. Remote Sens. 2018, 56, 6792–6810. [Google Scholar] [CrossRef]
- Jiang, K.; Wang, Z.; Yi, P.; Wang, G.; Lu, T.; Jiang, J. Edge-enhanced GAN for remote sensing image super resolution. IEEE Trans. Geosci. Remote Sens. 2019, 57, 5799–5812. [Google Scholar] [CrossRef]
- Yue, L.; Shen, H.; Li, J.; Yuanc, Q.; Zhang, H.; Zhang, L. Image super resolution: The techniques, applications, and future. Signal. Proc. 2016, 128, 389–408. [Google Scholar] [CrossRef]
- Li, F.; Jia, X.; Fraser, D.; Lambert, A. Super resolution for remote sensing images based on a universal hidden Markov tree model. IEEE Trans. Geosci. Remote Sens. 2010, 48, 1270–1278. [Google Scholar]
- Pan, Z.; Yu, J.; Huang, H.; Hu, S.; Zhang, A.; Ma, H.; Sun, W. Super-resolution based on compressive sensing and structural self-similarity for remote sensing images. IEEE Trans. Geosci. Remote Sens. 2013, 51, 4864–4876. [Google Scholar] [CrossRef]
- Chavez-Roman, H.; Ponomaryov, V. Super resolution image generation using wavelet domain interpolation with edge extraction via a sparse representation. IEEE Geosci. Remote Sens. Lett. 2014, 11, 1777–1781. [Google Scholar] [CrossRef]
- Li, J.; Yuan, Q.; Shen, H. Hyperspectral image super-resolution by spectral mixture analysis and spatial–spectral group sparsity. IEEE Geosci. Remote Sens. Lett. 2016, 13, 1250–1254. [Google Scholar] [CrossRef]
- Yang, J.; Wright, J.; Huang, T.S.; Ma, Y. Image super-resolution via sparse representation. IEEE Trans. Image Proc. 2010, 19, 2861–2873. [Google Scholar] [CrossRef] [PubMed]
- Dong, W.; Zhang, L.; Shi, G.; Wu, X. Image deblurring and super-resolution by adaptive sparse domain selection and adaptive regularization. IEEE Trans. Image Proc. 2011, 20, 1838–1857. [Google Scholar] [CrossRef] [PubMed]
- Bengio, Y.; Courville, A.; Vincent, P. Representation learning: A review and new perspectives. IEEE Trans. Pattern Anal. Mach. Intell. 2013, 35, 1798–1828. [Google Scholar] [CrossRef] [PubMed]
- Krizhevsky, A.; Sutskever, I.; Hinton, G.E. ImageNet classification with deep convolutional neural networks. Proc. Adv. Neural Inf. Proc. Syst. 2012, 25, 1097–1105. [Google Scholar] [CrossRef]
- Girshick, R.; Donahue, J.; Darrell, T.; Malik, J. Rich feature hierarchies for accurate object detection and semantic segmentation. In Proceedings of the IEEE Conference on Computer Vision and Pattern Recognition (CVPR), Columbus, OH, USA, 23–28 June 2014; pp. 580–587. [Google Scholar]
- Zou, Z.; Shi, Z. Ship detection in spaceborne optical image with SVD networks. IEEE Trans. Geosci. Remote Sens. 2016, 54, 5832–5845. [Google Scholar] [CrossRef]
- Dong, C.; Loy, C.C.; Tang, X. Accelerating the super-resolution convolutional neural network. In Proceedings of the Computer Vision–ECCV 2016: 14th European Conference, Amsterdam, The Netherlands, 11–14 October 2016; pp. 391–407. [Google Scholar]
- Goodfellow, I.J.; Pouget-Abadie, J.; Mirza, M.; Xu, B.; Warde-Farley, D.; Ozair, S.; Courville, A.; Bengio, Y. Generative adversarial nets. In Proceedings of the 27th International Conference on Neural Information Processing Systems, Montreal, QC, Canada, 8–13 December 2014; Volume 1, pp. 2672–2680. [Google Scholar] [CrossRef]
- Ledig, C.; Theis, L.; Huszár, F.; Caballero, J.; Cunningham, A.; Acosta, A.; Aitken, A.; Tejani, A.; Totz, J.; Wang, Z.; et al. Photo-realistic single image super-resolution using a generative adversarial network. In Proceedings of the 2017 IEEE Conference on Computer Vision and Pattern Recognition (CVPR), Honolulu, HI, USA, 21–26 July 2017; pp. 105–114. [Google Scholar] [CrossRef]
- He, K.; Sun, J. Deep Residual Learning for Image Recognition. In Proceedings of the IEEE Conference on Computer Vision and Pattern Recognition, Las Vegas, NV, USA, 27–30 June 2016; pp. 770–778. [Google Scholar]
- Li, B.; Member, S.; He, Y. An Improved ResNet Based on the Adjustable Shortcut Connections. IEEE Access 2018, 6, 18967–18974. [Google Scholar] [CrossRef]
- Karras, T.; Laine, S.; Aittala, M.; Hellsten, J.; Lehtinen, J.; Aila, T. Analyzing and improving the image quality of stylegan. In Proceedings of the IEEE Computer Society Conference on Computer Vision and Pattern Recognition, Seattle, WA, USA, 13–19 June 2020; pp. 8107–8116. [Google Scholar] [CrossRef]
- Karras, T.; Laine, S.; Aila, T. A Style-Based Generator Architecture for Generative Adversarial Networks. IEEE Trans. Pattern Anal. Mach. Intell. 2021, 43, 4217–4228. [Google Scholar] [CrossRef] [PubMed]
Figure 1.
A diagram of ground imaging of spaceborne remote sensing.

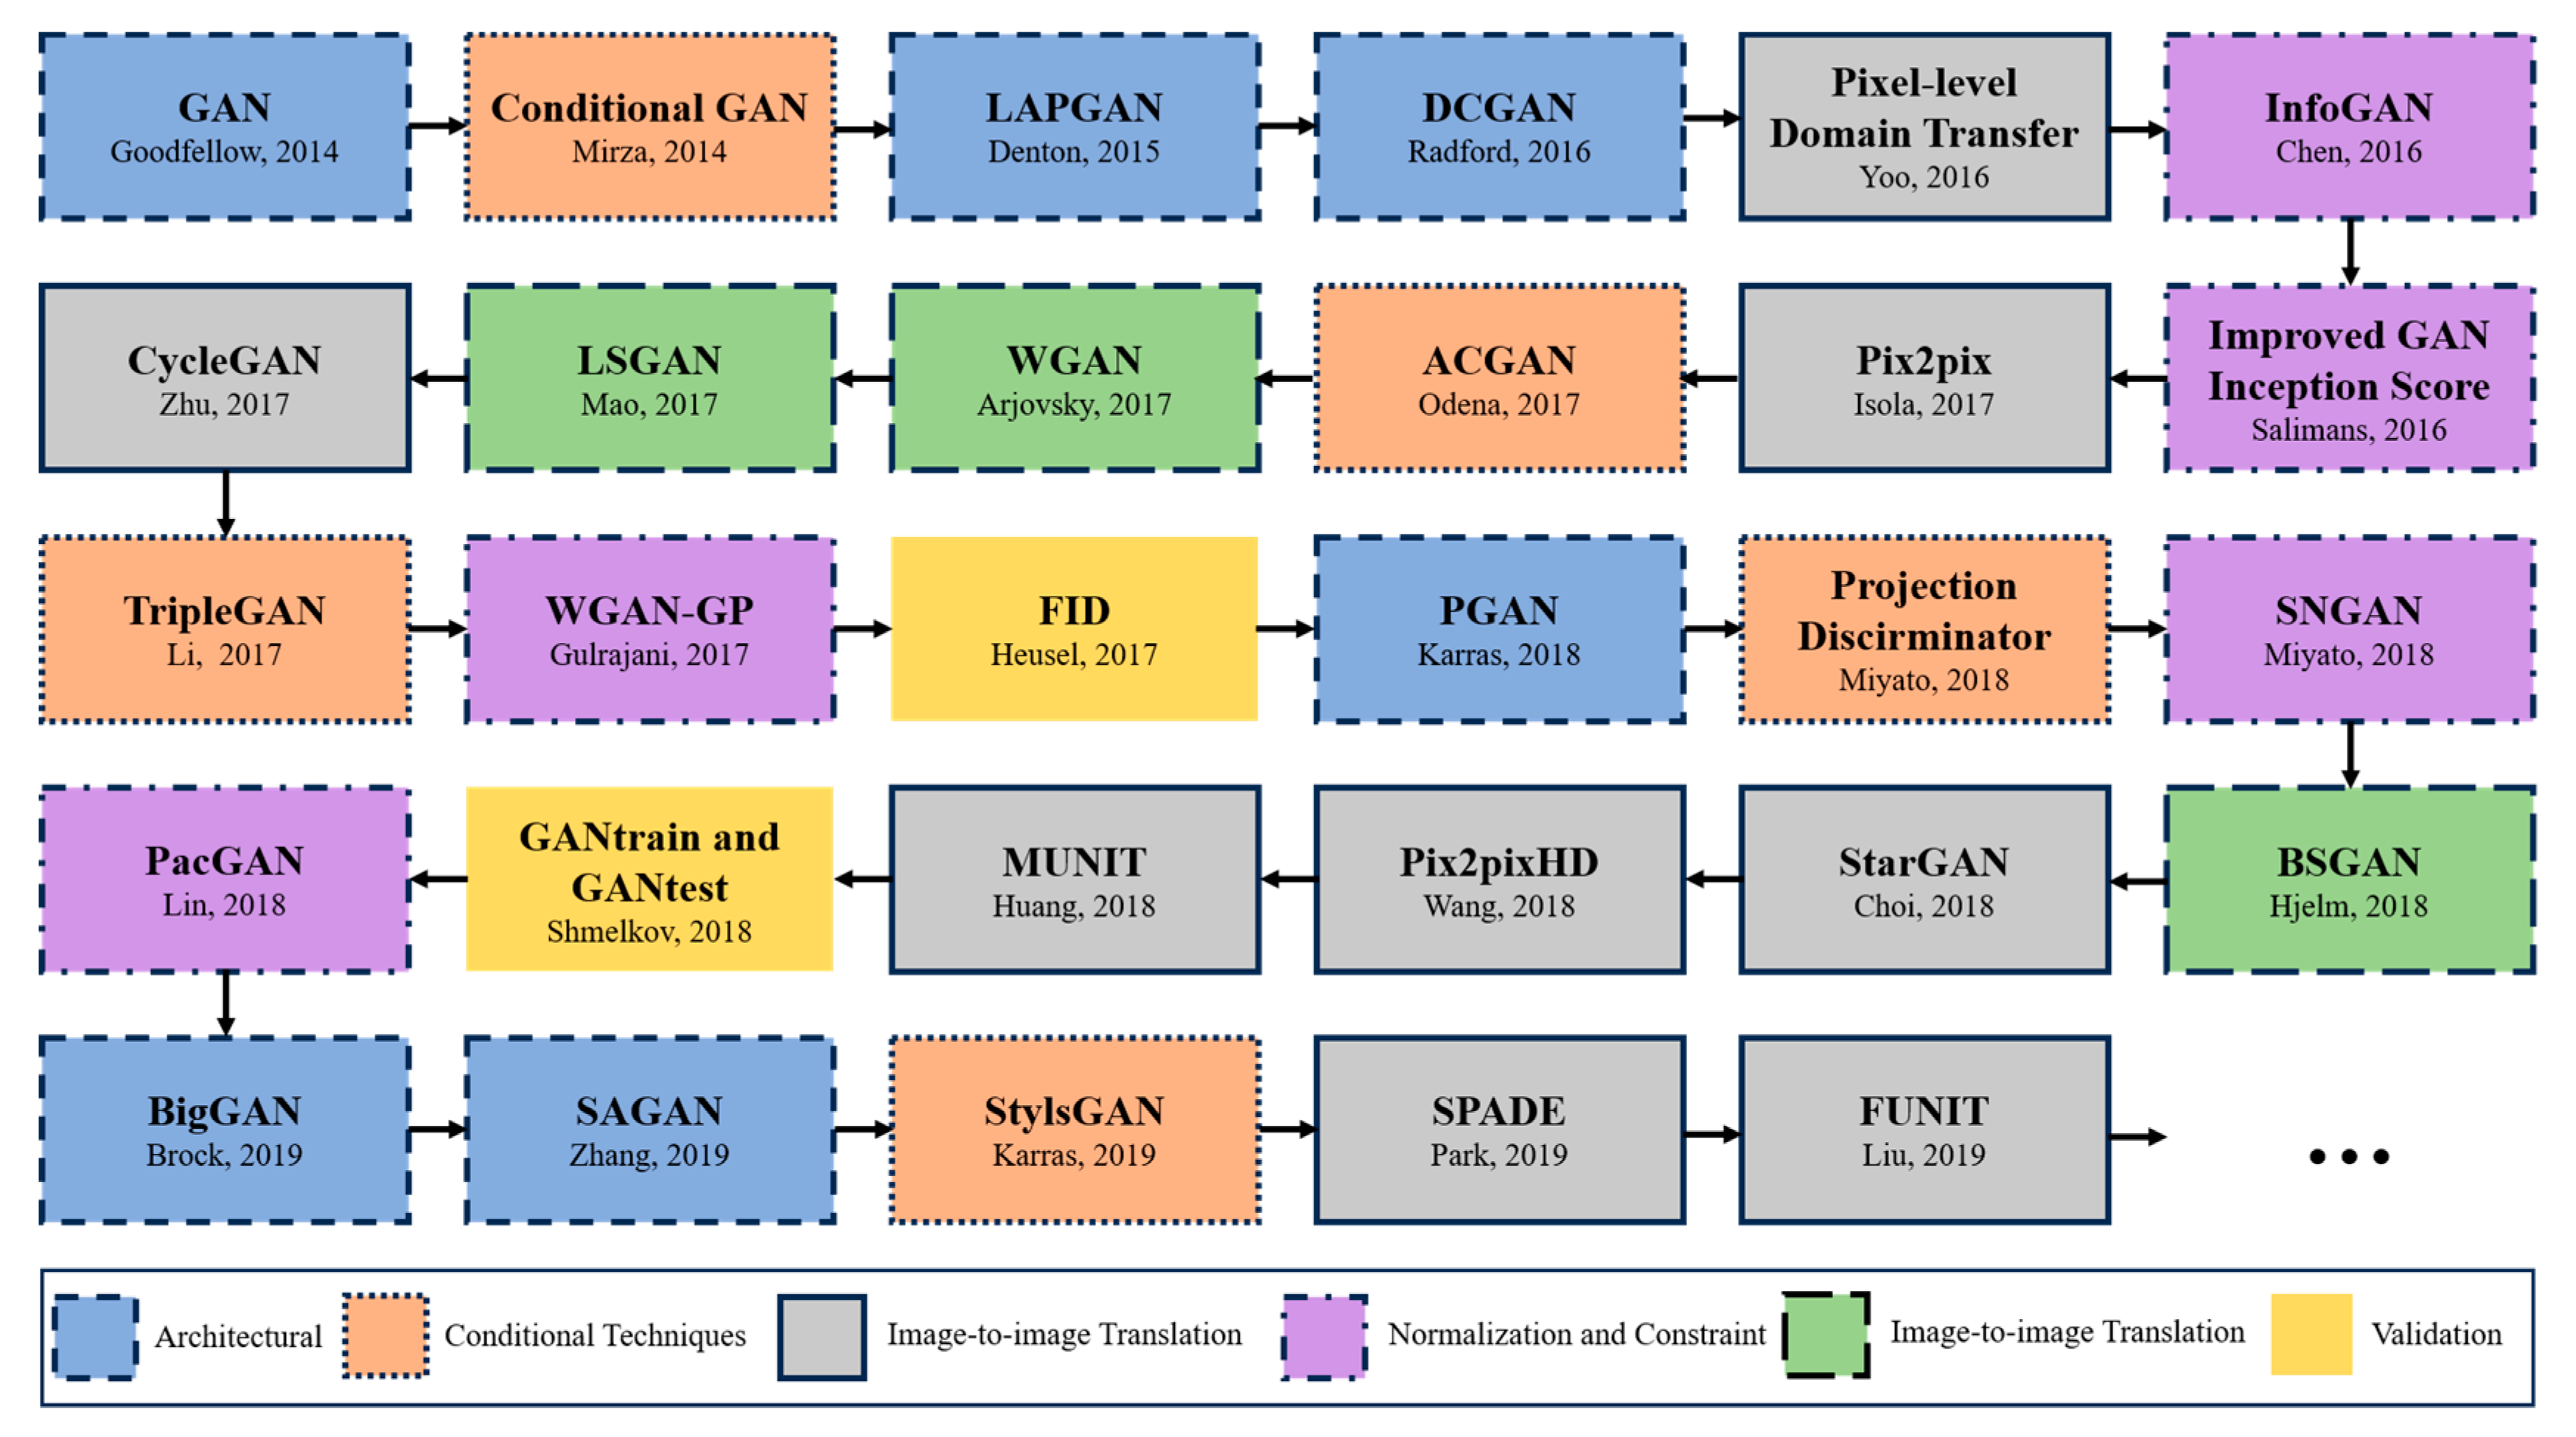
Figure 4.
Architecture of generator and discriminator networks with corresponding kernel size (k), number of feature maps (n), and strides (s) for each convolutional layer in the original model [23].
Figure 4.
Architecture of generator and discriminator networks with corresponding kernel size (k), number of feature maps (n), and strides (s) for each convolutional layer in the original model [23].
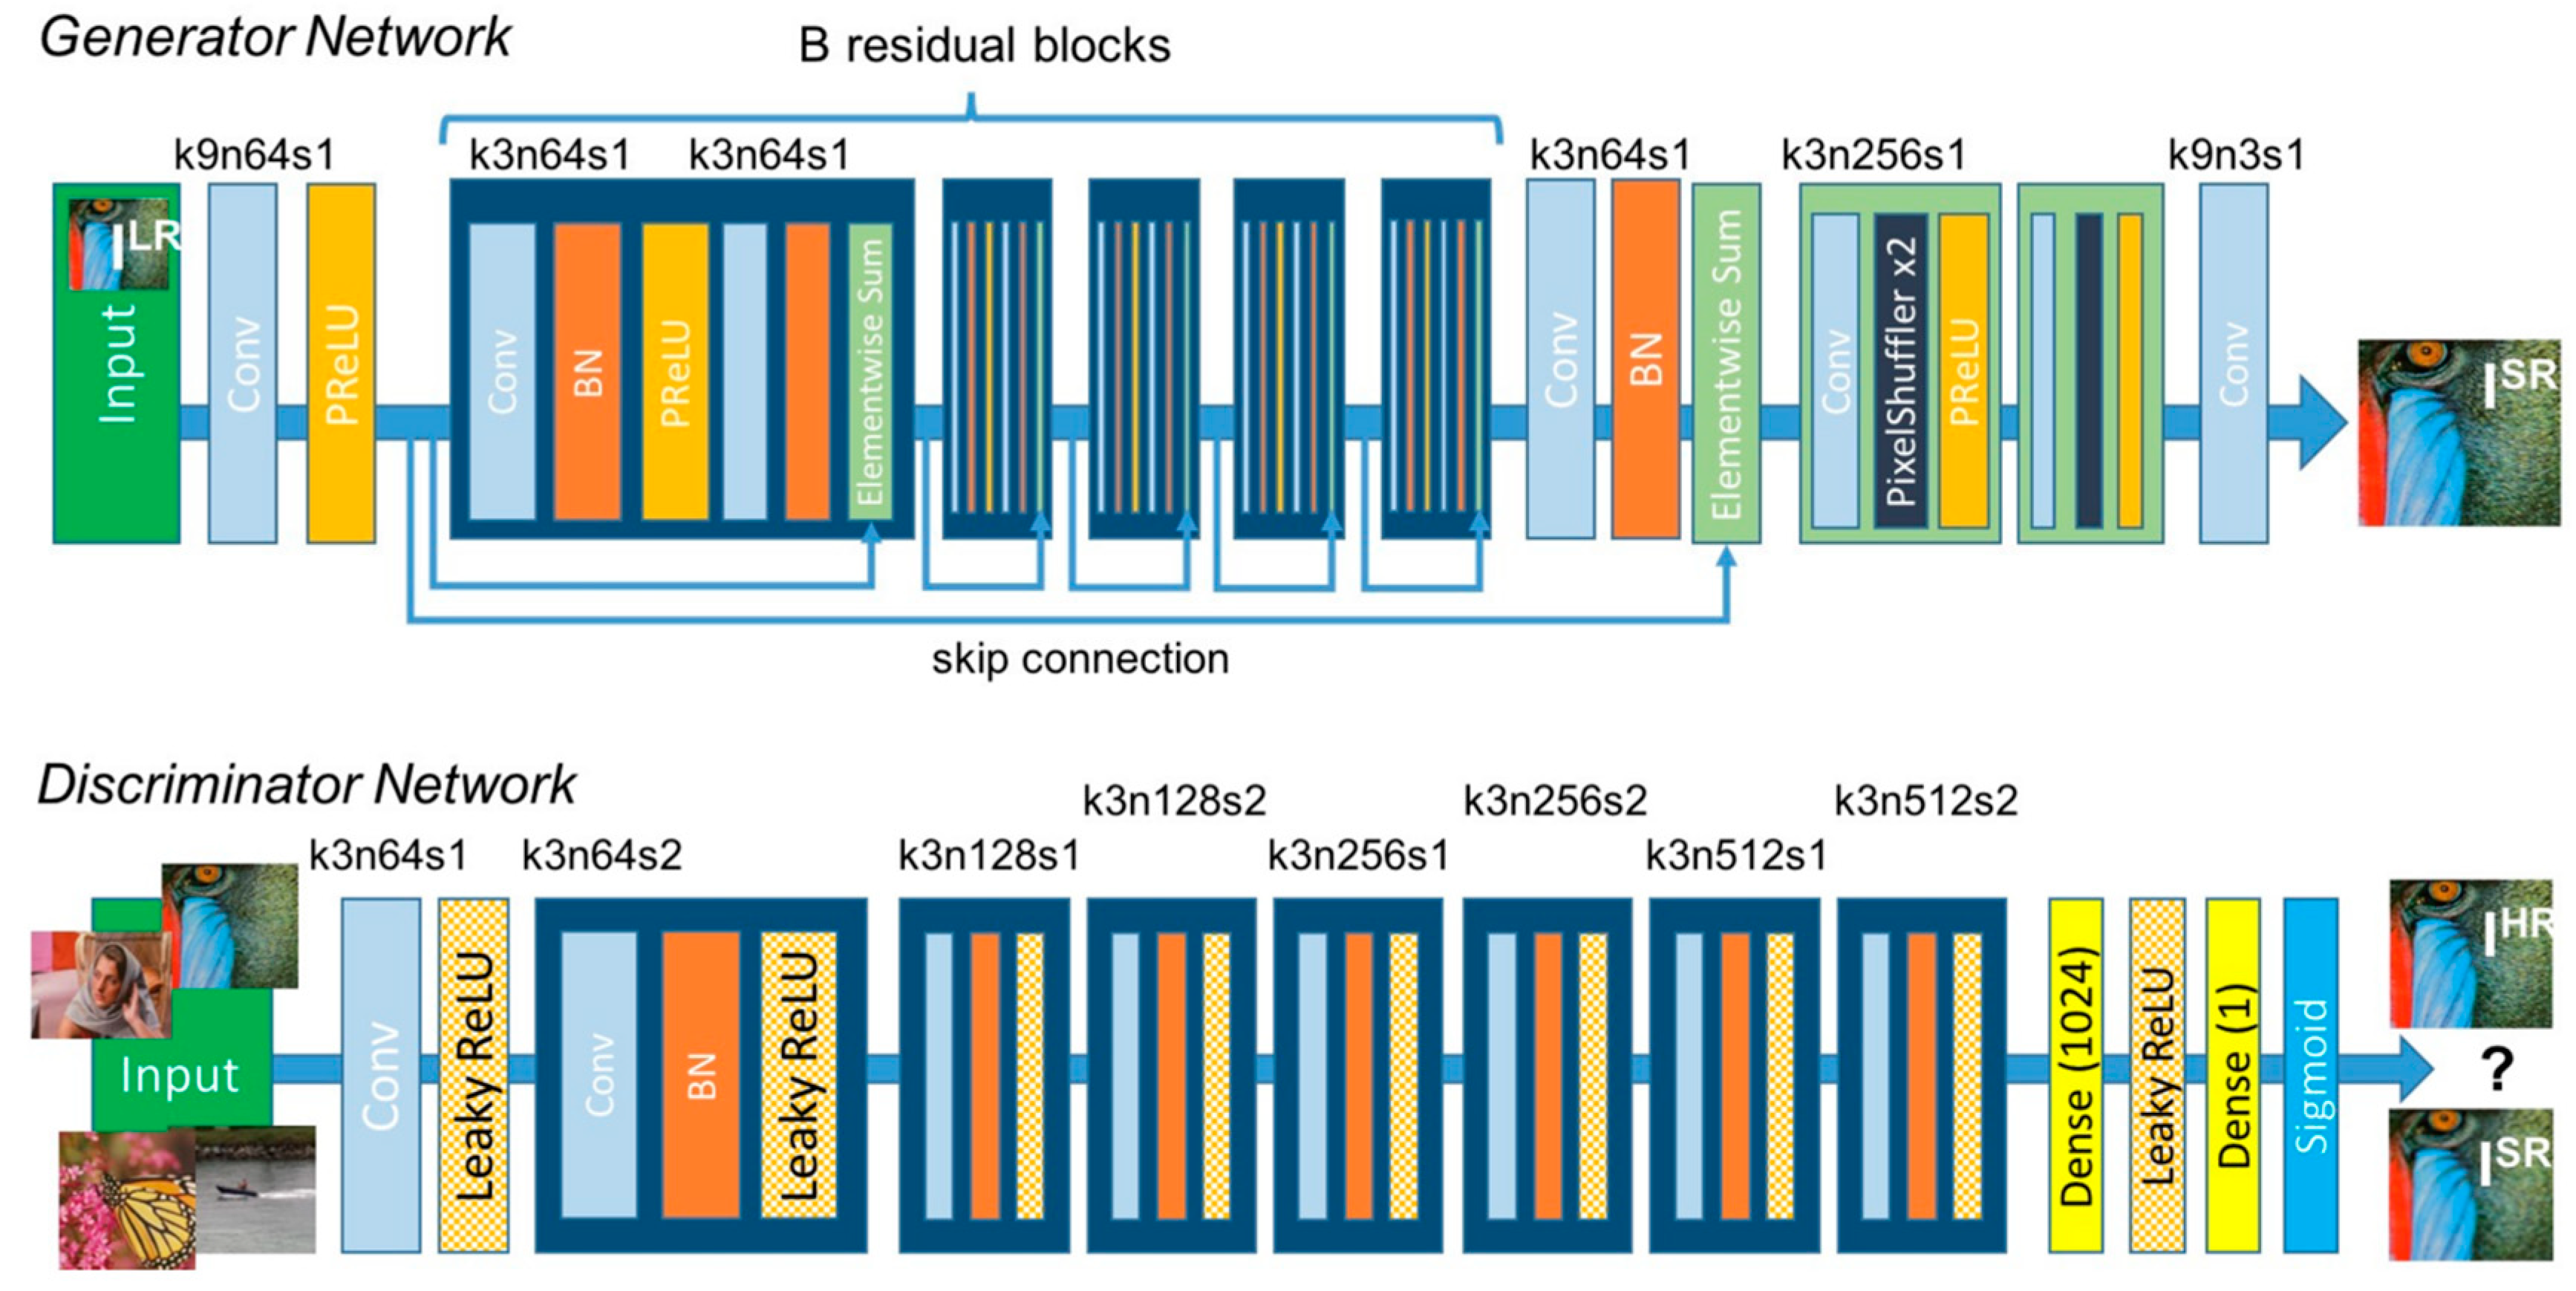
Figure 5.
A building block of residual learning.
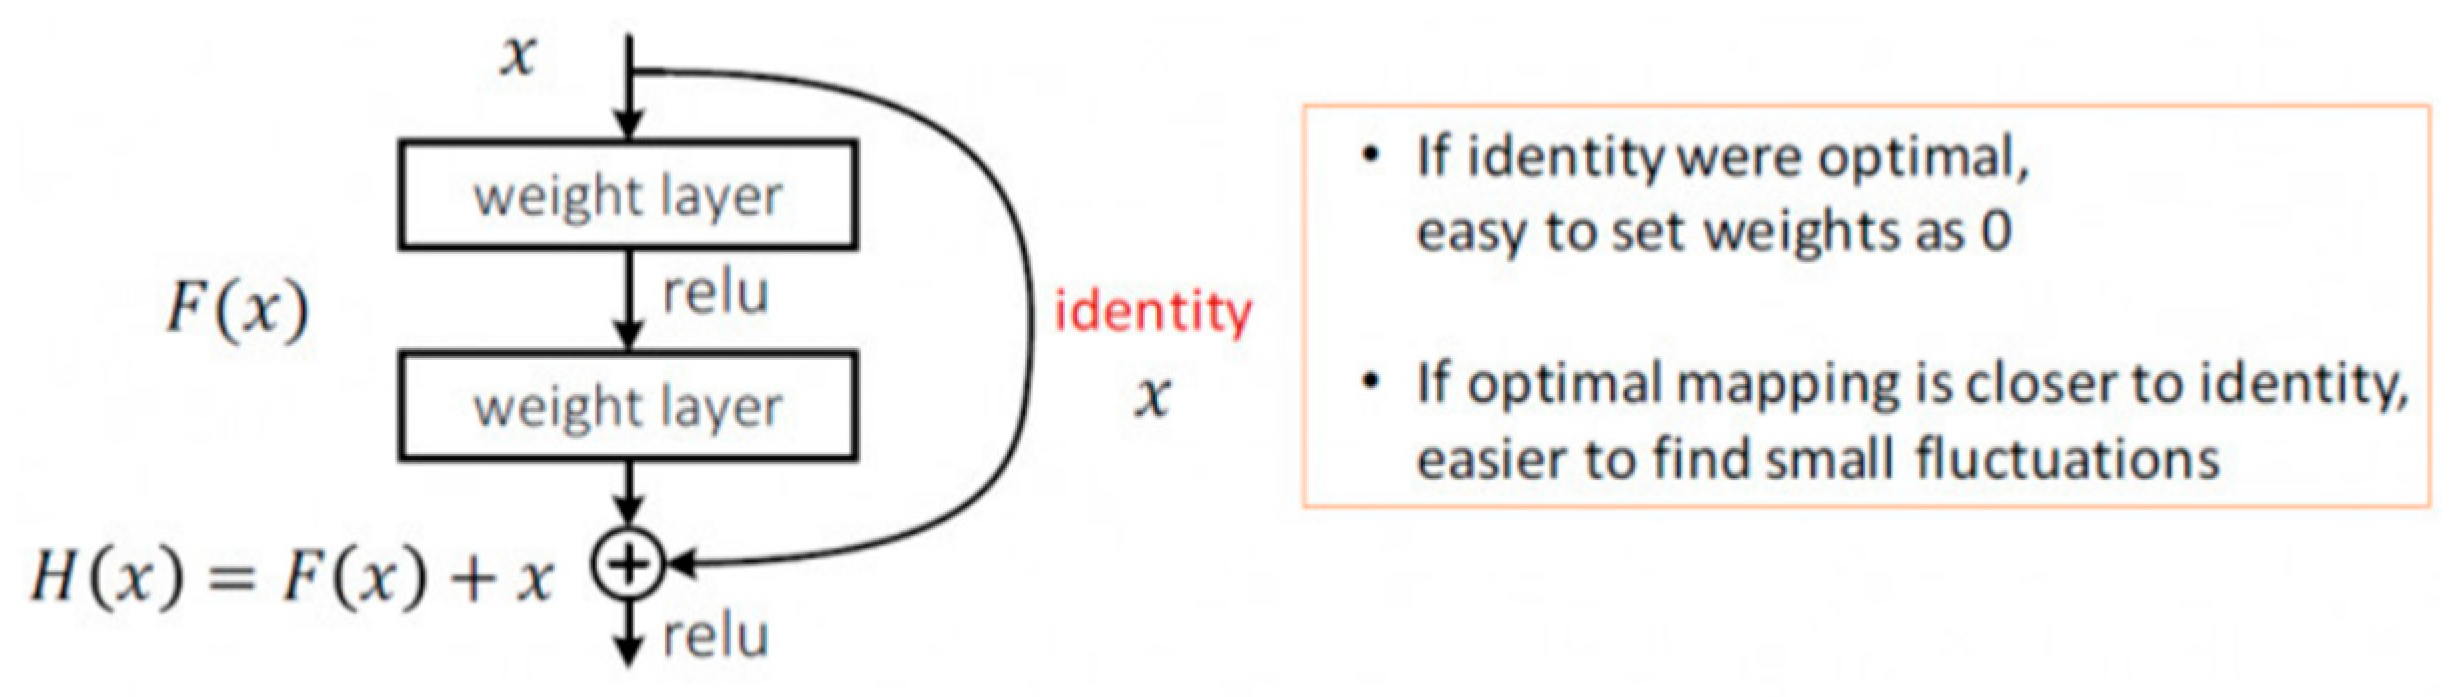
Figure 6.
Comparison of two types of residual blocks. The (left) is a basic block, and the (right) is a bottleneck block [25].
Figure 6.
Comparison of two types of residual blocks. The (left) is a basic block, and the (right) is a bottleneck block [25].

Figure 7.
Architecture of our generator, ResNet-50, which form a high-resolution image from a given one.
Figure 7.
Architecture of our generator, ResNet-50, which form a high-resolution image from a given one.

Figure 8.
VGG-19 architecture. Parameters in the charts include the size of convolutional kernels (e.g., 3 × 3), the input or output size of the layer (e.g., 224, 112, and 56, etc.), the number of channels in the layer (e.g., 64, 128, and 256, etc.), and different types of layers (e.g., convolutional layer, pooling layer, and fully connected layer).

Figure 9.
Architecture of our truncated VGG-19 with an additional FC layer, which learns to indicate whether a given image is a high-resolution (HR) image or a ground truth (GT) image.
Figure 9.
Architecture of our truncated VGG-19 with an additional FC layer, which learns to indicate whether a given image is a high-resolution (HR) image or a ground truth (GT) image.

Figure 10.
Comparison between the two images based on three features.
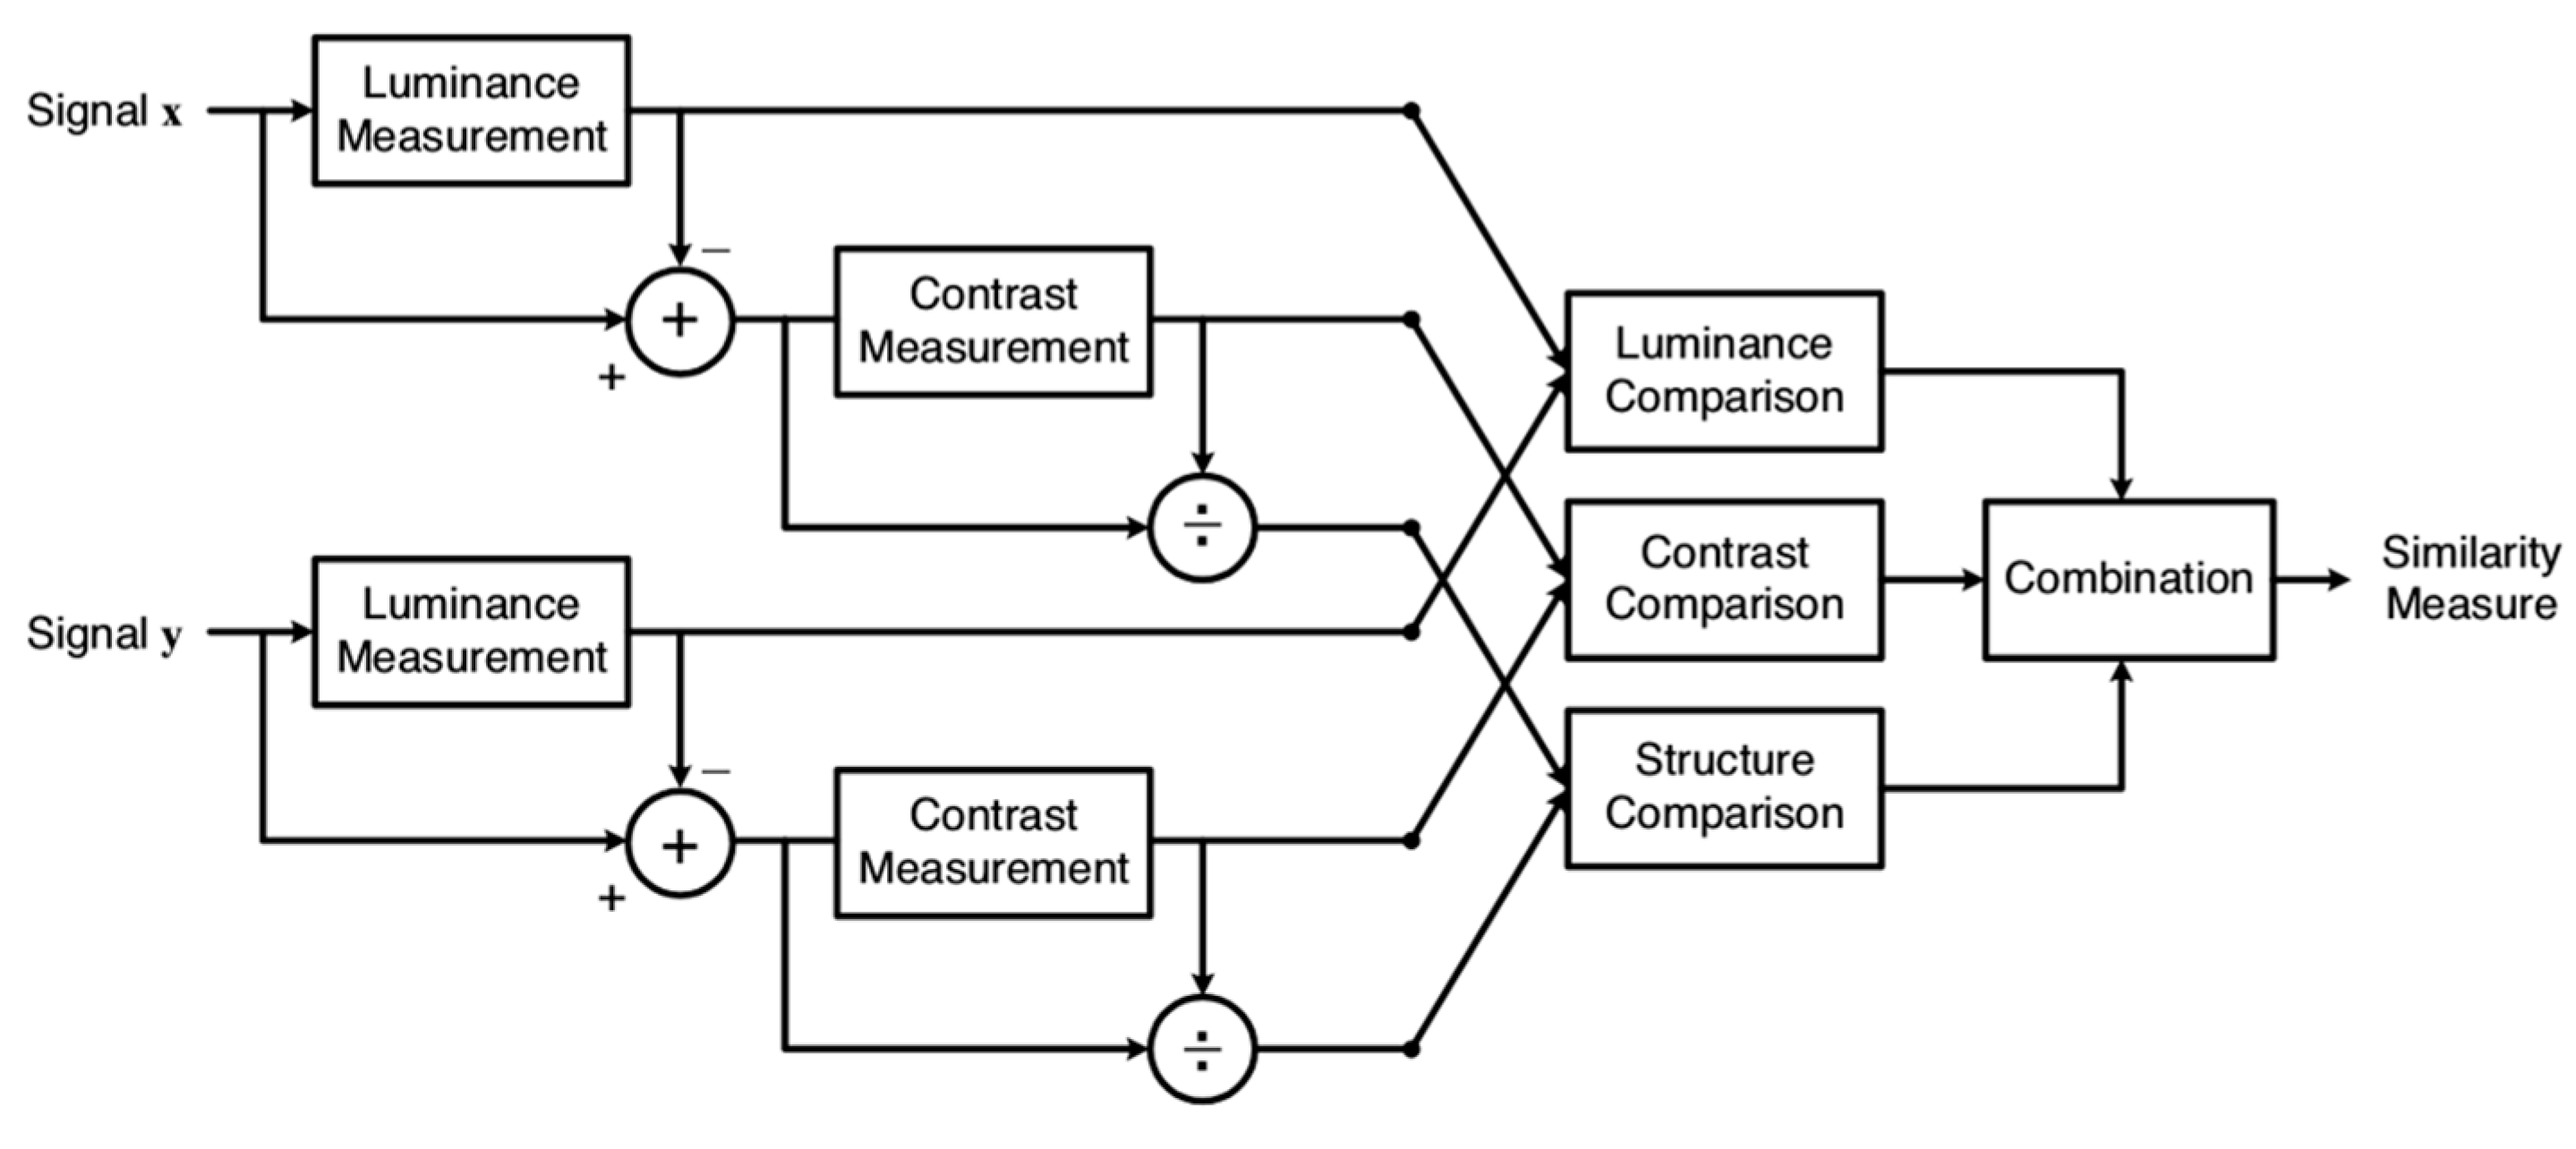
Figure 11.
Loss function in the training process on a scale of 4. The horizontal and vertical coordinates are the number of training and loss functions, respectively. The model was trained for a total of 400 times, and the loss function converges slowly and fluctuates greatly.
Figure 11.
Loss function in the training process on a scale of 4. The horizontal and vertical coordinates are the number of training and loss functions, respectively. The model was trained for a total of 400 times, and the loss function converges slowly and fluctuates greatly.

Figure 12.
Visualization of the training process (enlarged by four times) after 150 iterations. (a) The ground truth images; (b) the degraded low-resolution images, and (c) the images reconstructed by our training method.
Figure 12.
Visualization of the training process (enlarged by four times) after 150 iterations. (a) The ground truth images; (b) the degraded low-resolution images, and (c) the images reconstructed by our training method.

Figure 13.
Average super-resolution results on five GF-5 remote sensing images with or without our modification with a 2×, 3×, and 4× magnification ratio. (a) A histogram of PSNR comparisons and (b) a histogram of SSIM comparisons.
Figure 13.
Average super-resolution results on five GF-5 remote sensing images with or without our modification with a 2×, 3×, and 4× magnification ratio. (a) A histogram of PSNR comparisons and (b) a histogram of SSIM comparisons.

Figure 14.
Super-resolution results of different methods on five GF-5 remote sensing images with a 2× magnification ratio. (a) A histogram of PSNR comparisons and (b) a histogram of SSIM comparisons.
Figure 14.
Super-resolution results of different methods on five GF-5 remote sensing images with a 2× magnification ratio. (a) A histogram of PSNR comparisons and (b) a histogram of SSIM comparisons.

Figure 15.
Super-resolution results of different methods on five GF-5 remote sensing images with a 3× magnification ratio. (a) A histogram of PSNR comparisons and (b) a histogram of SSIM comparisons.
Figure 15.
Super-resolution results of different methods on five GF-5 remote sensing images with a 3× magnification ratio. (a) A histogram of PSNR comparisons and (b) a histogram of SSIM comparisons.

Figure 16.
Super-resolution results of different methods on five GF-5 remote sensing images with 4× magnification ratio. (a) A histogram of PSNR comparisons and (b) a histogram of SSIM comparisons.
Figure 16.
Super-resolution results of different methods on five GF-5 remote sensing images with 4× magnification ratio. (a) A histogram of PSNR comparisons and (b) a histogram of SSIM comparisons.


Figure 17.
Comparison of reconstructed contour lines: (1) and (2) are two images containing different types of contour lines; (a) original image; (b) image down-sampled by a factor of four; (c) image reconstructed using the bicubic algorithm; (d) image reconstructed using VDSR; and (e) image reconstructed using our algorithm.

Figure 18.
Comparison of reconstructed small target details: (1) and (2) are two images containing different small targets; (a) original image; (b) image down-sampled by a factor of four; (c) image reconstructed using the bicubic algorithm; (d) image reconstructed using VDSR; and (e) image reconstructed using our algorithm.


Table 1.
Super-resolution results for ablation study with a 2× magnification ratio.
| Criteria | Methods | |||
|---|---|---|---|---|
| SRGAN | SRGAN + G | SRGAN + D | Ours | |
| PSNR/dB | 32.5216 | 32.5815 | 32.5411 | 32.6847 |
| SSIM | 0.8776 | 0.8815 | 0.8903 | 0.8962 |
Table 2.
Super-resolution results for ablation study with a 3× magnification ratio.
| Criteria | Methods | |||
|---|---|---|---|---|
| SRGAN | SRGAN + G | SRGAN + D | Ours | |
| PSNR/dB | 31.6962 | 31.7209 | 31.7341 | 31.8191 |
| SSIM | 0.8224 | 0.8299 | 0.8354 | 0.8434 |
Table 3.
Super-resolution results for ablation study with a 4× magnification ratio.
| Criteria | Methods | |||
|---|---|---|---|---|
| SRGAN | SRGAN + G | SRGAN + D | Ours | |
| PSNR/dB | 30.3971 | 30.4547 | 30.4382 | 30.5095 |
| SSIM | 0.7912 | 0.8017 | 0.8065 | 0.8124 |
Table 4.
Super-resolution results with a 2× magnification ratio.
| Criteria | Methods | |||||
|---|---|---|---|---|---|---|
| Bicubic | SRCNN | VDSR | DRRN | DCSCN | Ours | |
| PSNR/dB | 30.0797 | 31.5459 | 31.8755 | 31.9316 | 32.0908 | 32.6847 |
| SSIM | 0.7794 | 0.8182 | 0.8759 | 0.8865 | 0.8392 | 0.8962 |
| Time/s | 0.1150 | 1.5595 | 0.5928 | 5.3689 | 4.1281 | 1.5223 |
Table 5.
Super-resolution results with a 3× magnification ratio.
| Criteria | Methods | |||||
|---|---|---|---|---|---|---|
| Bicubic | SRCNN | VDSR | DRRN | DCSCN | Ours | |
| PSNR/dB | 29.7451 | 30.6497 | 30.9601 | 31.0332 | 31.3711 | 31.8191 |
| SSIM | 0.7141 | 0.7558 | 0.8211 | 0.8293 | 0.7819 | 0.8434 |
| Time/s | 0.1097 | 1.4638 | 0.5967 | 5.2896 | 2.5328 | 1.0897 |
Table 6.
Super-resolution results with a 4× magnification ratio.
| Criteria | Methods | |||||
|---|---|---|---|---|---|---|
| Bicubic | SRCNN | VDSR | DRRN | DCSCN | Ours | |
| PSNR/dB | 28.6978 | 29.4622 | 30.0998 | 30.2242 | 30.3636 | 30.5095 |
| SSIM | 0.7232 | 0.7338 | 0.7927 | 0.7823 | 0.7711 | 0.8124 |
| Time/s | 0.1065 | 1.5107 | 0.9524 | 5.3167 | 2.3535 | 0.9947 |
Disclaimer/Publisher’s Note: The statements, opinions and data contained in all publications are solely those of the individual author(s) and contributor(s) and not of MDPI and/or the editor(s). MDPI and/or the editor(s) disclaim responsibility for any injury to people or property resulting from any ideas, methods, instructions or products referred to in the content. |
© 2023 by the authors. Licensee MDPI, Basel, Switzerland. This article is an open access article distributed under the terms and conditions of the Creative Commons Attribution (CC BY) license (https://creativecommons.org/licenses/by/4.0/).
Share and Cite
MDPI and ACS Style
Pang, B.; Zhao, S.; Liu, Y. The Use of a Stable Super-Resolution Generative Adversarial Network (SSRGAN) on Remote Sensing Images. Remote Sens. 2023, 15, 5064. https://doi.org/10.3390/rs15205064
AMA Style
Pang B, Zhao S, Liu Y. The Use of a Stable Super-Resolution Generative Adversarial Network (SSRGAN) on Remote Sensing Images. Remote Sensing. 2023; 15(20):5064. https://doi.org/10.3390/rs15205064
Chicago/Turabian StylePang, Boyu, Siwei Zhao, and Yinnian Liu. 2023. "The Use of a Stable Super-Resolution Generative Adversarial Network (SSRGAN) on Remote Sensing Images" Remote Sensing 15, no. 20: 5064. https://doi.org/10.3390/rs15205064
Note that from the first issue of 2016, this journal uses article numbers instead of page numbers. See further details here.