
Ensemble Learning for Blending Gridded Satellite and Gauge-Measured Precipitation Data

Department of Topography, School of Rural, Surveying and Geoinformatics Engineering, National Technical University of Athens, Iroon Polytechniou 5, 157 80 Zografou, Greece
*
Author to whom correspondence should be addressed.
Remote Sens. 2023, 15(20), 4912; https://doi.org/10.3390/rs15204912
Submission received: 17 August 2023
/
Revised: 22 September 2023
/
Accepted: 5 October 2023
/
Published: 11 October 2023
(This article belongs to the Special Issue Signal Processing and Machine Learning for Space Geodesy Applications)
Abstract
:Regression algorithms are regularly used for improving the accuracy of satellite precipitation products. In this context, satellite precipitation and topography data are the predictor variables, and gauged-measured precipitation data are the dependent variables. Alongside this, it is increasingly recognised in many fields that combinations of algorithms through ensemble learning can lead to substantial predictive performance improvements. Still, a sufficient number of ensemble learners for improving the accuracy of satellite precipitation products and their large-scale comparison are currently missing from the literature. In this study, we work towards filling in this specific gap by proposing 11 new ensemble learners in the field and by extensively comparing them. We apply the ensemble learners to monthly data from the PERSIANN (Precipitation Estimation from Remotely Sensed Information using Artificial Neural Networks) and IMERG (Integrated Multi-satellitE Retrievals for GPM) gridded datasets that span over a 15-year period and over the entire contiguous United States (CONUS). We also use gauge-measured precipitation data from the Global Historical Climatology Network monthly database, version 2 (GHCNm). The ensemble learners combine the predictions of six machine learning regression algorithms (base learners), namely the multivariate adaptive regression splines (MARS), multivariate adaptive polynomial splines (poly-MARS), random forests (RF), gradient boosting machines (GBM), extreme gradient boosting (XGBoost) and Bayesian regularized neural networks (BRNN), and each of them is based on a different combiner. The combiners include the equal-weight combiner, the median combiner, two best learners and seven variants of a sophisticated stacking method. The latter stacks a regression algorithm on top of the base learners to combine their independent predictions. Its seven variants are defined by seven different regression algorithms, specifically the linear regression (LR) algorithm and the six algorithms also used as base learners. The results suggest that sophisticated stacking performs significantly better than the base learners, especially when applied using the LR algorithm. It also beats the simpler combination methods.
1. Introduction
Precipitation data are needed for solving a large variety of water resource engineering problems (e.g., those investigated in [1,2,3,4,5,6,7]) and can be obtained through either ground-based gauge or satellite networks [8]. The former networks are known to offer more accurate data, while the latter are in general more spatially dense because of their lower cost ([9,10,11,12]). In this view, the widely adopted strategy of blending satellite and gauge-measured precipitation data for forming new precipitation products, with higher accuracy than the purely satellite ones and higher spatial density than the gauge-measured ones, is reasonable. Besides, the importance of the more general problem of merging gridded satellite and gauge-measured data for earth observation is well recognised, as proven by both the number and the diversity of the relevant studies (see, e.g., [13,14,15]). Moreover, as noted in [16], even products that already rely on both gridded satellite and gauge-measured precipitation data could be further improved in terms of their accuracy by using gauge-measured precipitation data in post-processing frameworks. Therefore, in what follows, data from such products and data from purely satellite products will not be explicitly distinguished, as the focus herein will be on their merging with gauge-measured data.
Machine learning regression algorithms ([17,18,19]) are regularly used for blending multiple precipitation datasets with differences in terms of spatial density and accuracy (see the relevant reviews by [20,21], as well as examples of such studies in [16,22,23,24,25,26,27,28,29,30]). In such spatial downscaling (and, more generally, spatial interpolation) settings, satellite precipitation data and topography factors are the predictor variables, and gauged-measured precipitation data are the dependent variables. Alongside these, it is increasingly recognized in many hydrological disciplines that combining individual algorithms through ensemble learning, a concept from the machine learning field that is alternatively referred to as “forecast combinations” in the forecasting field, can lead to considerable improvements in terms of predictive performance (see, e.g., the relevant discussions in the review by [31]). Detailed reviews on ensemble learning methods can be found in [32,33].
Aside from the applications of a few individual (ready-made) algorithms that rely on the construction of ensemble learning, such as the random forecast (RF; [34]) and boosting ([35,36]) ones, this concept has not spread in the literature that fuses gridded satellite products and ground-based precipitation datasets. Indeed, ensemble learning methods, such as the simple ones appearing in [37,38,39,40], and the more sophisticated ones appearing in [41,42,43,44,45,46,47,48], have not been proposed and extensively compared with each other in this literature. An exception to this can be found in the study by [49], who introduced a sophisticated ensemble learning algorithm. This algorithm adopts a stacking strategy [41] and the least absolute shrinkage and selection operator (LASSO; [50]) algorithm to combine the independent predictions of three individual algorithms. The latter are the multilayer perceptron neural networks, support vector machines ([51]) and RF. Still, many more ensemble learners and large-scale comparisons of them using gauge-measured data and multiple satellite products for an extensive time period and a large geographical region are needed in the field for reaching higher accuracy levels. In this study, we work towards filling in this specific gap. More precisely, our objectives are to propose a large number of new ensemble learners in the field, as well as to extensively compare them.
The remainder of this paper is structured as follows: Section 2 lists and describes the ensemble learning methods introduced and compared in the field by this work. Section 3 presents the data and the framework that facilitated the comparison. Section 4 presents the results. Section 5 discusses the importance of the findings in light of the literature and provides ideas for exploiting the proposed framework for future research. The manuscript concludes with Section 6. For the sake of completeness, Appendix A lists and briefly describes the machine and statistical learning regression algorithms on which the comparison relied, and Appendix B provides statistical software information, ensuring the reproducibility of the work and its methods.
2. Ensemble Learners and Combiners
2.1. Ensemble Learners
In this work, 11 ensemble learners (see Figure 1) were compared for improving the accuracy of satellite precipitation datasets. Each of these learners combined predictions that were delivered independently by six regression algorithms. The latter are referred to as “base learners” throughout the work and include the multivariate adaptive regression splines (MARS), multivariate adaptive polynomial splines (poly-MARS), RF, gradient boosting machines (GBM), extreme gradient boosting (XGBoost) and Bayesian regularized neural networks (BRNN), which are briefly described in Appendix A. These learners are regularly applied in hydrology (see, e.g., the applications by [52,53,54,55]). Also notably, they are largely diverse with each other and exhibit considerably good performances for the task of interest according to [30]. Therefore, their use as base learners is reasonable. While the base learners were the same for all the 11 ensemble learners, the procedures followed for the combination of the independent predictions were different. These procedures are known as “combiners” in the literature of ensemble learning and, in this work, they included the mean combiner (else referred to as the “equal-weight combiner” in the literature and throughout this work; see Section 2.2), the median combiner (see Section 2.3), two best learners (see Section 2.4) and seven variants of a sophisticated stacked generalization method (see Section 2.5).
2.2. Mean Combiner
The mean combiner performs simple averaging of the independent predictions delivered by the base learners. Thus, it does not require training.
2.3. Median Combiner
The median combiner computes the median of the independent predictions delivered by the base learners. Similar to the mean combiner, it does not require training.
2.4. Best Learners
The best learners are ensemble learners that select one base learner, specifically the one that scores the best in a predictive performance comparison on a training dataset, and then adopt the predictions of the selected base learner as their own for all the new problems that are set. In this work, we applied two best learners, one that bases the identification of the best base learner on the mean squared error (MSE) and another that bases this identification on the median squared error (MdSE).
2.5. Stacking of Regression Algorithms
The strategy of stacking a regression algorithm on top of others facilitates more sophisticated combinations than the mean combiner, median combiner and best learners. In this ensemble learning strategy, the base learners produce predictions independently of each other for a dataset. This dataset plays the role of a training dataset for a selected regression algorithm, which is hereafter referred to as the “meta-learner”. More precisely, the predictions of the base learners for this dataset are used together with their corresponding true values for training the meta-learner. The trained meta-learner is then given predictions of the base learners for new problems and delivers its own predictions based on them. For facilitating an extensive comparison between ensemble learners, as well as between combiners, seven variants of this stacking methodology were applied in this work, with each of these variants relying on a different meta-learner. The meta-learners were the linear regression (LR) algorithm and the six algorithms also used as base learners (see their brief descriptions in Appendix A).
3. Data and Application
3.1. Data
We applied the methods to open data. The gauge-measured precipitation data are described in Section 3.1.1, the satellite precipitation data are described in Section 3.1.2 and the elevation data are described in Section 3.1.3.
3.1.1. Gauge-Measured Precipitation Data
We used data from the Global Historical Climatology Network monthly database, version 2 (GHCNm; [56]). From this database, we extracted total monthly precipitation data in the time period 2001–2015 from 1 421 stations in the contiguous United States (CONUS). The locations of these stations are depicted in Figure 2. The data were sourced from the National Oceanic and Atmospheric Administration (NOAA) data repository (https://www.ncei.noaa.gov/pub/data/ghcn/v2; accessed on 24 September 2022).
3.1.2. Satellite Precipitation Data
Satellite precipitation data from the CONUS and for the same time period (i.e., 2001−2015) were also used. We sourced these data from two repositories. The first of them is the current operational PERSIANN (Precipitation Estimation from Remotely Sensed Information using Artificial Neural Networks) database ([57,58,59]), which was created by the Centre for Hydrometeorology and Remote Sensing (CHRS) at the University of California, Irvine (UCI). The grid extracted from this database has a spatial resolution of 0.25 degree x 0.25 degree and covers the region of interest entirely (see Figure 3a). In particular, the PERSIANN precipitation data are daily and can be extracted from the Center for Hydrometeorology and Remote Sensing (CHRS) repository (https://chrsdata.eng.uci.edu; accessed on 7 March 2022). We transformed the daily data into total monthly precipitation data to be consistent with the gauge-measured data.
The second gridded satellite precipitation dataset used in this work is the GPM IMERG (Integrated Multi-satellitE Retrievals) late Precipitation L3 1 day 0.1 degree x 0.1 degree V06 dataset, which was developed by the NASA (National Aeronautics and Space Administration) Goddard Earth Sciences (GES) Data and Information Services Center (DISC) [60] and is available at the repository of NASA Earth Data (https://doi.org/10.5067/GPM/IMERGDL/DAY/06; assessed on 10 December 2022). After its extraction, the original GPM IMERG daily data were transformed to the CMORPH0.25 grid with a spatial resolution of 0.25 degree x 0.25 degree (see Figure 3b) with a bilinear interpolation procedure. The IMERG data covers the region of interest entirely. Similar to the PERSIANN data, we transformed the daily data into total monthly precipitation data to be consistent with the gauge-based measurements.
Notably, both the PERSIANN and IMERG families of gridded satellite precipitation products are extensively used and examined in the literature (see the relevant examples of studies by [58,61,62,63,64,65,66,67]). Therefore, we believe that the above-outlined data can effectively support the comparison of this study.
3.1.3. Elevation Data
As it is highlighted by [68], elevation is a useful predictor variable for many hydrological processes. Thus, its value was estimated at all the gauged geographical locations presented in Figure 2 by extracting point elevation data from the Amazon Web Services (AWS) Terrain Tiles (https://registry.opendata.aws/terrain-tiles; accessed on 25 September 2022).
3.2. Regression Settings and Validation Procedure
The dependent variable is the gauge-measured total monthly precipitation at a point of interest. According to procedures proposed in [16,30,69], we formed the regression settings by finding, separately for the PERSIANN and IMERG grids (see Figure 3a and Figure 3b, respectively), the four closest grid points to each of the geographical locations of the precipitation ground-based stations (see Figure 2) and by computing the respective distances di, i = 1, 2, 3 and 4 (in meters). We also indexed these four grid points Si, i = 1, 2, 3 and 4, according to their distance from the stations, where d1 < d2 < d3 < d4 (see Figure 4). Hereinafter, the distances di, i = 1, 2, 3 and 4 will be called “PERSIANN distances 1, 2, 3 and 4” or “IMERG distances 1, 2, 3 and 4” and the total monthly precipitation values at the grid points 1, 2, 3 and 4 will be called “PERSIANN values 1, 2, 3 and 4” or “IMERG values 1, 2, 3 and 4”. We formulated and used three sets of predictor variables, which will be simply called “predictor sets 1, 2 and 3” throughout this work and correspond to three different regression settings. These settings facilitated three different comparisons between the learners. Predictor sets 1, 2 and 3 are, respectively, defined as follows: {PERSIANN values 1, 2, 3 and 4, PERSIANN distances 1, 2, 3 and 4, station elevation}, {IMERG values 1, 2, 3 and 4, IMERG distances 1, 2, 3 and 4, station elevation}, and {PERSIANN values 1, 2, 3 and 4, IMERG values 1, 2, 3 and 4, PERSIANN distances 1, 2, 3 and 4, IMERG distances 1, 2, 3 and 4, station elevation}.
Each regression setting consisted of 91 623 samples and was divided into three datasets of equal length (hereafter referred to as “datasets 1, 2 and 3”). The division was made randomly; therefore, the various different hydroclimatic and topographic conditions are represented equally well in all the three datasets of each regression setting. The same holds for possible biases in the gridded satellite products. We first trained the six base learners on dataset 1 and applied them to obtain predictions for dataset 2. These predictions were then used by the best learners and the stacking variants (as described in Section 2.4 and Section 2.5, respectively) for selecting a best base learner and training the meta-learner, respectively. Then, we trained the base learners on {dataset 1, dataset 2} and applied them to obtain predictions for dataset 3. These latter predictions were used by the mean combiner, the median combiner, the best learners and the stacking variants (as described in Section 2.2, Section 2.3, Section 2.4 and Section 2.5, respectively) for forming their predictions for dataset 3. They were additionally used for assessing the base learners, as these are also used as benchmarks for the ensemble learners.
3.3. Predictive Performance Comparison
To compare the 17 learners (i.e., the six base learners and the 11 ensemble learners), we first computed the squared error scoring function, which is defined as
where y is the materialization of the spatial process and x is the respective prediction. The squared error scoring function is consistent for the mean functional of the predictive probability distribution [70]. The performance criterion takes the form of MSE, which is defined as
where and , i ∈ {1, …, n} are the predictions and materialization of the process, respectively. MSE is computed separately for each set {learner, predictor set}.
S(x, y) := (x − y)2,
Subsequently, skill scores were computed for each set {learner, predictor set}, according to Equation (3). More precisely, type-1 skill scores were computed by using as the reference case (benchmark) the MARS algorithm when run with the same predictor set as the modelling approach to which the relative score referred. On the other hand, type-2 skill scores were computed by considering the set {MARS, predictor set 1} as the reference case (benchmark) for all the sets {learner, predictor set}. Type-1 and type-2 skill scores were used to rank the learners from the best-performing to the worst-performing. The results of the predictive performance comparison are presented in Section 4.1.
RS{learner, predictor set} := 100 (1 − MSE{learner, predictor set}/MSEbenchmark)
3.4. Additional Investigations
Aside from comparing the 11 ensemble learners of this work in terms of their predictive performance in the context of interest, we also recorded and compared the computational time required for their application. The results of this comparison are available in Section 4.2. Moreover, we applied explainable machine learning (see the relevant reviews by [71,72,73]) to rank the base learners based on their contribution in ensemble learning using stacking. More precisely, we implemented procedures of the RF algorithm to compute the permutation importance score for the predictions produced by the base learners for dataset 2 (on which the training of the regression algorithm that combines the base learners is made; see Section 3.2) and ranked them based on this score. We additionally implemented procedures of the XGBoost algorithm to compute the gain score for the predictions produced by the base learners for dataset 2 and then determined the corresponding rankings. The results of these two comparisons of the base learners are available in Section 4.3. Lastly, we implemented the above-outlined explainable machine learning procedures to compare the total of the predictor variables (see the predictor set 3 in Section 3.2) in terms of their relevance in solving the regression problem investigated. The results of the comparisons of the predictor variables are available in Section 4.4.
4. Results
4.1. Predictive Performance
Figure 5 presents a comparison based on MSE between the learners. According to this comparison, the six base learners (i.e., MARS, polyMARS, RF, GBM, XGBoost and BRNN) exhibit notable differences in their performance, with RF and XGBoost being the most accurate and MARS being the least accurate for all three predictor sets investigated. Moreover, ensemble learning using the mean combiner gave more accurate predictions than ensemble learning using the median combiner. The latter ensemble learning approach produced less accurate predictions than both RF and XGBoost (with a single exception concerning predictor set 2). Ensemble learning using the mean combiner was also more accurate than all the base learners for predictor sets 2 and 3. The same, however, was not the case for predictor set 1. Indeed, for this predictor set, both the simple combination approaches investigated in this work were found to be less accurate than both RF and XGBoost.
Furthermore, the best learners performed exactly the same with RF, XGBoost or BRNN (as these three base learners were identified as the best on dataset 2) and, thus, better than the median combiner (with one single exception; see above) and worse than the mean combiner for predictor sets 2 and 3, but not for predictor set 1. The best among all the ensemble learning methods that use regression algorithms as meta-learners were stacking with LR and stacking with polyMARS, while the worst was stacking with XGBoost (probably due to the importance of parametrization in the implementation of this latter regression algorithm) for predictor sets 1 and 2, and stacking with BRNN for predictor set 3 due to outliers. The remaining ensemble learning methods using regression algorithms as meta-learners were more accurate than or at least as accurate as the base learners, the simple combination methods and the best learners, with a few exceptions concerning stacking with MARS and stacking with GBM for predictor set 1, and stacking with RF for predictor set 2.
Figure 6 additionally allows us to compare the three predictor sets investigated in this work in terms of their usefulness, as they are based on the type-2 skill score. Overall, we can state that predictor set 2 (for which the type-2 skill scores ranged from 17.27% to 30.73% and the respective rankings ranged from 12 to 33) is more useful than predictor set 1 (for which the type-2 skill scores ranged from 0 to 19.87% and the respective rankings ranged from 29 to 45). We can also state that combining predictor sets 1 and 2 into predictor set 3 leads to substantial performance improvements for both the base learners and the ensemble learning methods. Indeed, for predictor set 3, the type-2 skill scores ranged between 27.32% and 39.77%, and the respective rankings ranged between 1 and 21, with a single exception concerning stacking with BRNN (for which the type-2 skill score was 6.77 and the respective ranking was 40).
4.2. Computational Time
Figure 7 facilitates comparisons of the learners in terms of computational time. Notably, BRNN is by far the most computationally expensive algorithm used as both a base learner and a meta-learner in this work and, probably due to its Bayesian regularization procedure, its computational requirements can differ a lot from dataset to dataset even when the number of predictors is the same (see, e.g., the measured time for predictor sets 1 and 2) and especially when this number differs considerably (see, e.g., the measured time for predictor set 3 compared to the measured time for predictor sets 1 and 2). Simple combination methods simply require the sum of the computational time required by each of the base learners increased by a small amount, which is practically the time required for computing the mean or the median of the predictions for each data sample. The same, however, does not apply to the remaining ensemble learning methods, which are more computationally expensive, because they require two or three different trainings. As the time required to train the algorithms on the predictions of the base learners is much less than the time required for training the base learners, these methods have comparable computational requirements, with the ensemble learning method using BRNN for combining the predictions of the base learners being the most computationally expensive overall.
4.3. Contribution of Base Learners
Figure 8 presents the comparison of the base learners in terms of their contribution to ensemble learning using RF as the meta-learner. The rankings of the base learners based on permutation importance are not exactly the same across the predictor sets. Still, there are notable similarities, with XGBoost and RF being the most important and the second most important base learners, respectively, for all three predictor sets investigated in this study. This latter finding seems reasonable in light of the better predictive performance of XGBoost and RF compared to the remaining base learners (see Figure 5). In addition, Figure 9 presents the comparison of the base learners in terms of their contribution to ensemble learning using XGBoost as the meta-learner. Based on the gain scores (which are computed by taking each feature’s contribution to each tree in the model), the three most important base learners for generating a prediction are RF, BRNN and XGBoost. This result is again reasonable, as BRNN also exhibits a better predictive performance than MARS, polyMARS and GBM (see Figure 5), with a single exception concerning predictor set 1, for which polyMARS performed better.
4.4. Importance of Predictor Variables
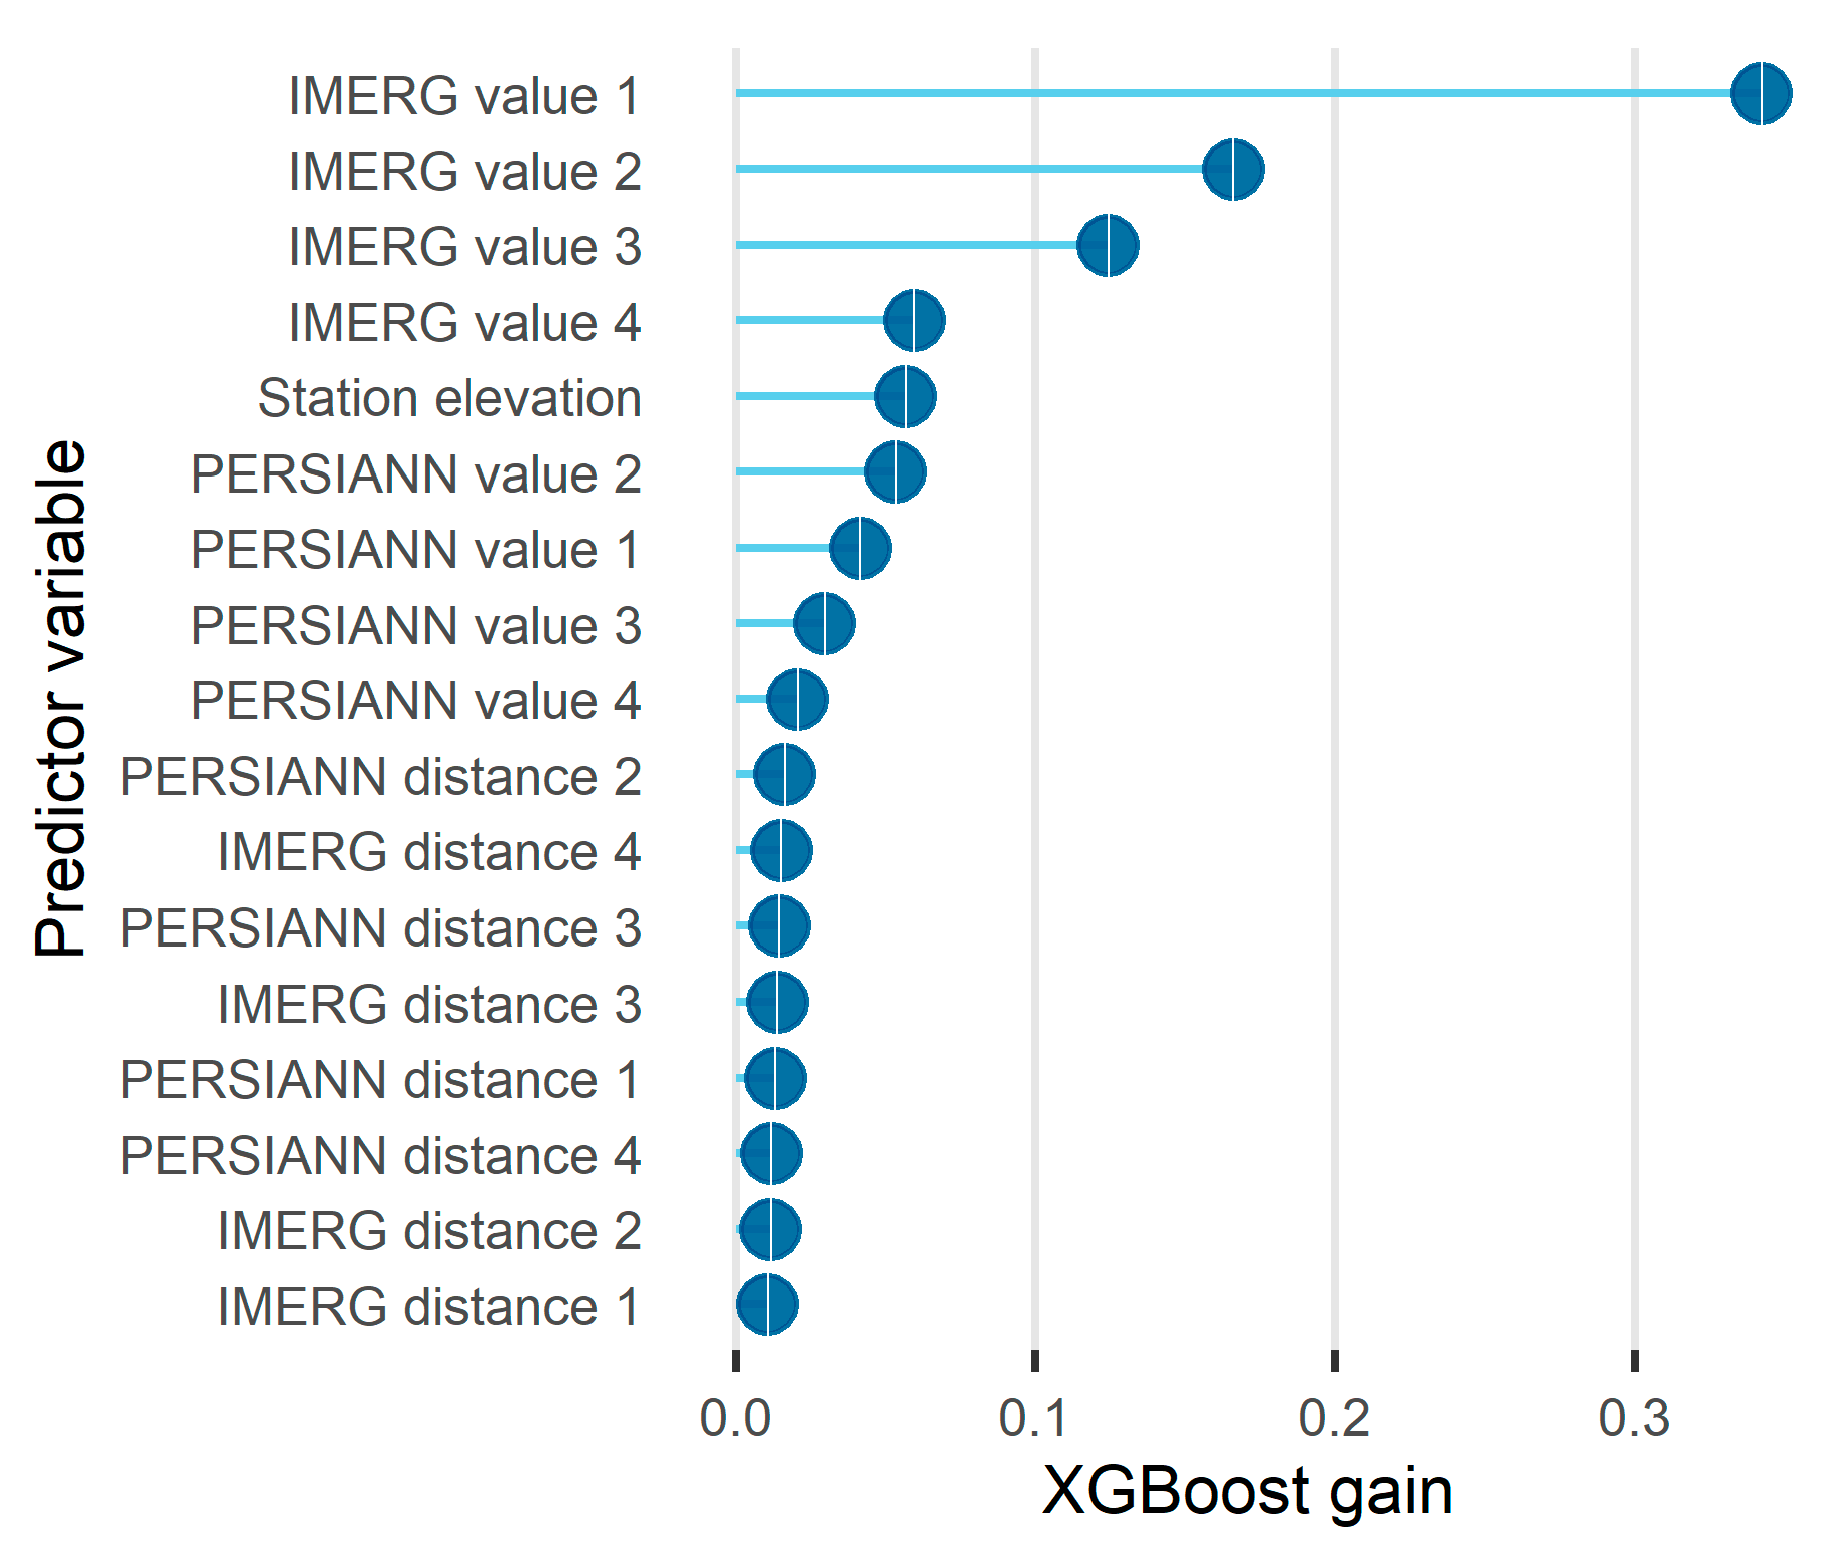
In brief, Figure 6 indicates that for the investigated problem: (a) both the PERSIANN and IMERG datasets offered useful predictors; and (b) the IMERG dataset offered more useful predictors than the PERSIANN dataset, to some extent. Additionally, Figure 10 and Figure 11 present more detailed investigations for predictor variable importance and, more precisely, the permutation importance score computed for the predictor variables using RF, the gain score computed for the same variables using XGBoost and the respective rankings. The comparison based on XGBoost indicates that the IMERG values are more important predictor variables than the PERSIANN values. It also indicates that elevation is more important than the PERSIANN values, and that the PERSIANN and IMERG distances are the least important. This latter finding is also supported by the comparison based on RF, which additionally supports the relatively large importance of elevation as a predictor variable for the problem of interest. On the other hand, the order of the PERSIANN and IMERG values varies a lot in the two comparisons, thereby reinforcing the outcome from Figure 6 that both satellite products offer useful predictors.
5. Discussion
This large-scale work is the first one that compares a large number of ensemble learners and combiners in the field of gridded satellite precipitation data correction. In summary, it suggests that stacking a regression algorithm on top of others can lead to large improvements in predictive performance in the context of interest and at the monthly temporal scale, beating the mean and other simple combiners. Such combiners can be “hard to beat in practice” ([74,75,76,77,78]); therefore, this important finding could not be assumed in advance. In fact, it could only stem from large-scale comparison studies involving both a large number of methods and large datasets.
The improvements in performance were found to be the largest when the combination was made using LR for two of the three predictor sets investigated and polyMARS for the third predictor set. Still, other regression algorithms also performed well as meta-learners, and RF and XGBoost additionally allowed the identification of the most useful base learners (i.e., RF, XGBoost and BRNN) when utilized in explainable machine learning settings. Also notably, the RF and XGBoost algorithms also allowed us to compare the relevance of five categories of predictor variables (i.e., the PERSIANN values, PERSIANN distances, IMERG values, IMERG distances and ground-based station elevation) in solving the problem of interest. Contrary to what applies to the daily time scale (see [69]), in the monthly temporal resolution, the utilization of both the PERSIANN and IMERG datasets leads to substantial predictive performance improvements with respect to using the IMERG dataset only.
Although this work already produced a large amount of large-scale results on the use of ensemble learning in the context of improving the accuracy of gridded satellite precipitation products, additional benefits could stem from applying extensions of its methodological framework in the future. Perhaps the most notable among these extensions are the ones referring to the daily time scale (or even to finer time scales), which could additionally benefit from a much larger number of ground-based stations with sufficient record lengths (see, e.g., the number of stations in [16,69]) and, thus, could lead to comparisons on an even larger scale. Other notable extensions are those referring to probabilistic predictions, and they could comprise machine and statistical learning algorithms, such as those summarized in the reviews by [31,79]. Indeed, it would also be useful to know whether stacking a regression algorithm on top of others can lead to notable performance improvements in the context of assessing the predictive uncertainty in gridded satellite precipitation product correction.
The methodological framework proposed in this work could additionally be extended for investigating whether and how the relative predictive performance of various ensemble learning methods depends on the features of the time series datasets (see the relevant study by [80]). Such investigations would be relevant at various temporal scales, such as the monthly, daily and finer ones, and could eventually lead to the proposal of feature-based ensemble learning methods (see, e.g., those by [81,82]) for the task of interest. Lastly, it should be noted that, although this study focused on the precipitation domain of earth observation, the framework that it proposed is also applicable to other domains of earth observation. Indeed, the problem of merging gridded satellite and gauge-measured datasets holds a prominent position for earth observation in general.
6. Conclusions
To improve the accuracy of gridded satellite precipitation products (i.e., to perform the so-called “bias correction” of these products), machine learning regression algorithms and ground-based measurements are often used in spatial interpolation settings. In such settings, the ground-based measurements are the dependent variables and the gridded satellite data are the predictor variables. In previous studies, individual machine learning algorithms were compared in terms of their skill in performing bias correction of satellite precipitation products. The respective comparisons were conducted either within regional cases or at large spatial scales (i.e., at spatial scales of continental size). While there is value in both these methodological approaches, findings from studies that apply the latter can be considered more useful in the important endeavour of understanding the properties of the algorithms compared. In spite of the accuracy benefits that can stem from ensemble learners (i.e., methods that combine two or more individual machine and statistical learning algorithms to obtain predictive performance improvements), a large number of such learners and their comparison at a large spatial scale were absent from the literature of satellite precipitation product bias correction prior to this work. According to our results, the strategy of stacking a regression algorithm on top of others (which are referred to as “base learners” in the literature) for combining their independent predictions can offer significantly better predictions than the base learners in the context investigated. It also beats the equal-weight combiner, the median combiner and two best learners, one based on the mean squared error and one based on the median squared error.
Author Contributions
G.P. and H.T. conceptualized and designed the work with input from N.D. and A.D. G.P. and H.T. performed the analyses and visualizations, and wrote the first draft, which was commented on and enriched with new text, interpretations and discussions by N.D. and A.D. All authors have read and agreed to the published version of the manuscript.
Funding
This work was conducted in the context of the research project BETTER RAIN (BEnefiTTing from machine lEarning algoRithms and concepts for correcting satellite RAINfall products). This research project was supported by the Hellenic Foundation for Research and Innovation (H.F.R.I.) under the “3rd Call for H.F.R.I. Research Projects to support Post-Doctoral Researchers” (Project Number: 7368).
Data Availability Statement
The data used in the present study are available to download from repositories that were cited in the paper (see Section 3.1).
Acknowledgments
The authors are sincerely grateful to the Editor and the Reviewers for their constructive remarks.
Conflicts of Interest
The authors declare no conflict of interest.
Appendix A
Seven individual regression algorithms were included in the present work for proposing and assessing, in a comparative framework, multiple ensemble learners (see Section 2) for conducting spatial interpolation in the context of blending gridded satellite and gauge-measured precipitation data. In this appendix, we briefly document these regression algorithms by adapting previous materials by [30,69]. The interested reader can find detailed documentations of the same algorithms, for instance, in [17,18,19]. Such documentations are not provided in this work, as they are out of its scope, given that the algorithms are well known in the remote sensing community and that there are automatic software implementations for them. Herein, we used the R programming language [83] that includes several packages for implementing the selected algorithms. We list the utilized R packages in Appendix B.
The seven individual regression algorithms are the following:
- Linear regression (LR): In LR, the dependent variable is a function of a linear weighted sum of the predictors ([17], pp. 43–55). The weights are estimated by minimizing the mean squared error.
- Multivariate adaptive regression splines (MARS): In MARS ([84,85]), the dependent variable is a function of a weighted sum of basis functions. Important parameters are the product degree (i.e., the total number of basis functions) and the knot locations. These parameters are estimated in an automatic way. In our study, we used an additive model and hinge basis functions. We used the default parameters of the R package, as suggested in the respective R package implementation.
- Multivariate adaptive polynomial splines (poly-MARS): In poly-MARS ([86,87]), the dependent variable is a function of piecewise linear splines within an adaptive regression framework. MARS and poly-MARS differ in the sense that the latter necessitates the existence of linear terms of a predictor variable to be included in the model prior to adding predictor’s nonlinear terms, combined with including a univariate basis function in the model prior to including a tensor-product basis function that contains the univariate basis function [88]. The application was made with the default parameters, as suggested in the respective R package implementation.
- Random forests (RF): RF [34] is an ensemble learning algorithm. The ensemble is constructed by decision trees. The construction procedure is based on bootstrap aggregation (also termed as “bagging”) with some additional randomization. The latter is based on a random selection of predictors as candidates in the notes of the decision tree. A summary of the benefits of the algorithm can be found in [89], a study that also comments on the utility of the algorithm in hydrological sciences. The application was made with 500 trees. The remaining parameters of the algorithm were kept equal to their defaults in the respective R package implementation.
- Gradient boosting machines (GBM): GBM is an ensemble learning algorithm that trains iteratively new learners on the errors of previously trained learners ([35,90,91,92]). In our case, these learners were decision trees; yet, it is also possible to use other types of learners. The trained algorithm is practically the sum of the trained decision trees. A gradient descent algorithm was used for the optimization. As it is possible to tailor the loss function of GBM to the user’s needs, we selected the squared error loss function. We also used 500 trees to be consistent with the implementation of RF. The remaining parameters of GBM were kept equal to their defaults in the respective R package implementation.
- Extreme gradient boosting (XGBoost): XGBoost [36] is a boosting algorithm that improves over GBM in certain conditions. These conditions are mostly related to data availability. Furthermore, XGBoost is an order of magnitude faster compared to earlier boosting implementations and uses a type of regularization to control overfitting. In our study, we set the number of maximum boosting iterations equal to 500. The remaining parameters were kept equal to their defaults in the respective R package implementation.
- Feed-forward neural networks with Bayesian regularization (BRNN): Artificial neural networks model the dependent variable as a nonlinear function of features that were previously extracted through linear combinations of the predictors ([17], p 389). In this work, we applied BRNN ([93], pp 143–180, [94]) that are particularly useful to avoid overfitting. We set the number of neurons equal to 20 and kept the remaining parameters of the algorithm equal to their defaults in the respective R package implementation.
Appendix B
We used the R programming language [83] to process the data, to implement and combine the individual regression algorithms (see Appendix A), and to report and visualize the results of the comparison.
For data processing and data visualization, we used the R packages caret [95], data.table [96], elevatr [97], ncdf4 [98], rgdal [99], sf ([100,101]), spdep ([102,103,104]) and tidyverse ([105,106]).
References
- Kopsiaftis, G.; Mantoglou, A. Seawater intrusion in coastal aquifers under drought and transient conditions. In Environmental Hydraulics; Christodoulou, G.C., Stamou, A.I., Eds.; Two Volume Set; CRC Press: Boca Raton, FL, USA, 2010; pp. 637–642. [Google Scholar]
- Dogulu, N.; López López, P.; Solomatine, D.P.; Weerts, A.H.; Shrestha, D.L. Estimation of predictive hydrologic uncertainty using the quantile regression and UNEEC methods and their comparison on contrasting catchments. Hydrol. Earth Syst. Sci. 2015, 19, 3181–3201. [Google Scholar] [CrossRef]
- Granata, F.; Gargano, R.; De Marinis, G. Support vector regression for rainfall-runoff modeling in urban drainage: A comparison with the EPA’s storm water management model. Water 2016, 8, 69. [Google Scholar] [CrossRef]
- Széles, B.; Broer, M.; Parajka, J.; Hogan, P.; Eder, A.; Strauss, P.; Blöschl, G. Separation of scales in transpiration effects on low flows: A spatial analysis in the Hydrological Open Air Laboratory. Water Resour. Res. 2018, 54, 6168–6188. [Google Scholar] [CrossRef] [PubMed]
- Curceac, S.; Atkinson, P.M.; Milne, A.; Wu, L.; Harris, P. Adjusting for conditional bias in process model simulations of hydrological extremes: An experiment using the North Wyke Farm Platform. Front. Artif. Intell. 2020, 3, 565859. [Google Scholar] [CrossRef] [PubMed]
- Curceac, S.; Milne, A.; Atkinson, P.M.; Wu, L.; Harris, P. Elucidating the performance of hybrid models for predicting extreme water flow events through variography and wavelet analyses. J. Hydrol. 2021, 598, 126442. [Google Scholar] [CrossRef]
- Di Nunno, F.; Granata, F.; Pham, Q.B.; de Marinis, G. Precipitation forecasting in Northern Bangladesh using a hybrid machine learning model. Sustainability 2022, 14, 2663. [Google Scholar] [CrossRef]
- Sun, Q.; Miao, C.; Duan, Q.; Ashouri, H.; Sorooshian, S.; Hsu, K.-L. A review of global precipitation data sets: Data sources, estimation, and intercomparisons. Rev. Geophys. 2018, 56, 79–107. [Google Scholar] [CrossRef]
- Mega, T.; Ushio, T.; Matsuda, T.; Kubota, T.; Kachi, M.; Oki, R. Gauge-adjusted global satellite mapping of precipitation. IEEE Trans. Geosci. Remote Sens. 2019, 57, 1928–1935. [Google Scholar] [CrossRef]
- Salmani-Dehaghi, N.; Samani, N. Development of bias-correction PERSIANN-CDR models for the simulation and completion of precipitation time series. Atmos. Environ. 2021, 246, 117981. [Google Scholar] [CrossRef]
- Li, W.; Jiang, Q.; He, X.; Sun, H.; Sun, W.; Scaioni, M.; Chen, S.; Li, X.; Gao, J.; Hong, Y. Effective multi-satellite precipitation fusion procedure conditioned by gauge background fields over the Chinese mainland. J. Hydrol. 2022, 610, 127783. [Google Scholar] [CrossRef]
- Tang, T.; Chen, T.; Gui, G. A comparative evaluation of gauge-satellite-based merging products over multiregional complex terrain basin. IEEE J. Sel. Top. Appl. Earth Obs. Remote Sens. 2022, 15, 5275–5287. [Google Scholar] [CrossRef]
- Gohin, F.; Langlois, G. Using geostatistics to merge in situ measurements and remotely-sensed observations of sea surface temperature. Int. J. Remote Sens. 1993, 14, 9–19. [Google Scholar] [CrossRef]
- Journée, M.; Bertrand, C. Improving the spatio-temporal distribution of surface solar radiation data by merging ground and satellite measurements. Remote Sens. Environ. 2010, 114, 2692–2704. [Google Scholar] [CrossRef]
- Peng, J.; Tanguy, M.; Robinson, E.L.; Pinnington, E.; Evans, J.; Ellis, R.; Cooper, E.; Hannaford, J.; Blyth, E.; Dadson, S. Estimation and evaluation of high-resolution soil moisture from merged model and Earth observation data in the Great Britain. Remote Sens. Environ. 2021, 264, 112610. [Google Scholar] [CrossRef]
- Tyralis, H.; Papacharalampous, G.A.; Doulamis, N.; Doulamis, A. Merging satellite and gauge-measured precipitation using LightGBM with an emphasis on extreme quantiles. IEEE J. Sel. Top. Appl. Earth Obs. Remote Sens. 2023, 16, 6969–6979. [Google Scholar] [CrossRef]
- Hastie, T.; Tibshirani, R.; Friedman, J. The Elements of Statistical Learning; Springer: New York, NY, USA, 2009. [Google Scholar] [CrossRef]
- James, G.; Witten, D.; Hastie, T.; Tibshirani, R. An Introduction to Statistical Learning; Springer: New York, NY, USA, 2013. [Google Scholar] [CrossRef]
- Efron, B.; Hastie, T. Computer Age Statistical Inference; Cambridge University Press: New York, NY, USA, 2016. [Google Scholar] [CrossRef]
- Hu, Q.; Li, Z.; Wang, L.; Huang, Y.; Wang, Y.; Li, L. Rainfall spatial estimations: A review from spatial interpolation to multi-source data merging. Water 2019, 11, 579. [Google Scholar] [CrossRef]
- Abdollahipour, A.; Ahmadi, H.; Aminnejad, B. A review of downscaling methods of satellite-based precipitation estimates. Earth Sci. Inform. 2022, 15, 1–20. [Google Scholar] [CrossRef]
- Tao, Y.; Gao, X.; Hsu, K.; Sorooshian, S.; Ihler, A. A deep neural network modeling framework to reduce bias in satellite precipitation products. J. Hydrometeorol. 2016, 17, 931–945. [Google Scholar] [CrossRef]
- Baez-Villanueva, O.M.; Zambrano-Bigiarini, M.; Beck, H.E.; McNamara, I.; Ribbe, L.; Nauditt, A.; Birkel, C.; Verbist, K.; Giraldo-Osorio, J.D.; Xuan Thinh, N. RF-MEP: A novel random forest method for merging gridded precipitation products and ground-based measurements. Remote Sens. Environ. 2020, 239, 111606. [Google Scholar] [CrossRef]
- Chen, S.; Xiong, L.; Ma, Q.; Kim, J.-S.; Chen, J.; Xu, C.-Y. Improving daily spatial precipitation estimates by merging gauge observation with multiple satellite-based precipitation products based on the geographically weighted ridge regression method. J. Hydrol. 2020, 589, 125156. [Google Scholar] [CrossRef]
- Chen, C.; Hu, B.; Li, Y. Easy-to-use spatial random-forest-based downscaling-calibration method for producing precipitation data with high resolution and high accuracy. Hydrol. Earth Syst. Sci. 2021, 25, 5667–5682. [Google Scholar] [CrossRef]
- Shen, Z.; Yong, B. Downscaling the GPM-based satellite precipitation retrievals using gradient boosting decision tree approach over Mainland China. J. Hydrol. 2021, 602, 126803. [Google Scholar] [CrossRef]
- Zhang, L.; Li, X.; Zheng, D.; Zhang, K.; Ma, Q.; Zhao, Y.; Ge, Y. Merging multiple satellite-based precipitation products and gauge observations using a novel double machine learning approach. J. Hydrol. 2021, 594, 125969. [Google Scholar] [CrossRef]
- Chen, H.; Sun, L.; Cifelli, R.; Xie, P. Deep learning for bias correction of satellite retrievals of orographic precipitation. IEEE Trans. Geosci. Remote Sens. 2022, 60, 4104611. [Google Scholar] [CrossRef]
- Lin, Q.; Peng, T.; Wu, Z.; Guo, J.; Chang, W.; Xu, Z. Performance evaluation, error decomposition and tree-based machine learning error correction of GPM IMERG and TRMM 3B42 products in the Three Gorges reservoir area. Atmos. Res. 2022, 268, 105988. [Google Scholar] [CrossRef]
- Papacharalampous, G.A.; Tyralis, H.; Doulamis, A.; Doulamis, N. Comparison of machine learning algorithms for merging gridded satellite and earth-observed precipitation data. Water 2023, 15, 634. [Google Scholar] [CrossRef]
- Papacharalampous, G.; Tyralis, H. A review of machine learning concepts and methods for addressing challenges in probabilistic hydrological post-processing and forecasting. Front. Water 2022, 4, 961954. [Google Scholar] [CrossRef]
- Sagi, O.; Rokach, L. Ensemble learning: A survey. Wiley Interdiscip. Rev. Data Min. Knowl. Discov. 2018, 8, e1249. [Google Scholar] [CrossRef]
- Wang, X.; Hyndman, R.J.; Li, F.; Kang, Y. Forecast combinations: An over 50-year review. Int. J. Forecast. 2022, 39, 1518–1547. [Google Scholar] [CrossRef]
- Breiman, L. Random forests. Mach. Learn. 2001, 45, 5–32. [Google Scholar] [CrossRef]
- Friedman, J.H. Greedy function approximation: A gradient boosting machine. Ann. Stat. 2001, 29, 1189–1232. [Google Scholar] [CrossRef]
- Chen, T.; Guestrin, C. XGBoost: A scalable tree boosting system. In Proceedings of the 22nd ACM SIGKDD International Conference on Knowledge Discovery and Data Mining, San Francisco, CA, USA, 13–17 August 2016; pp. 785–794. [Google Scholar] [CrossRef]
- Bates, J.M.; Granger, C.W.J. The combination of forecasts. J. Oper. Res. Soc. 1969, 20, 451–468. [Google Scholar] [CrossRef]
- Petropoulos, F.; Svetunkov, I. A simple combination of univariate models. Int. J. Forecast. 2020, 36, 110–115. [Google Scholar] [CrossRef]
- Papacharalampous, G.; Tyralis, H.; Langousis, A.; Jayawardena, A.W.; Sivakumar, B.; Mamassis, N.; Montanari, A.; Koutsoyiannis, D. Probabilistic hydrological post-processing at scale: Why and how to apply machine-learning quantile regression algorithms. Water 2019, 11, 2126. [Google Scholar] [CrossRef]
- Papacharalampous, G.; Tyralis, H. Hydrological time series forecasting using simple combinations: Big data testing and investigations on one-year ahead river flow predictability. J. Hydrol. 2020, 590, 125205. [Google Scholar] [CrossRef]
- Wolpert, D.H. Stacked generalization. Neural Netw. 1992, 5, 241–259. [Google Scholar] [CrossRef]
- Divina, F.; Gilson, A.; Goméz-Vela, F.; García Torres, M.; Torres, J.F. Stacking ensemble learning for short-term electricity consumption forecasting. Energies 2018, 11, 949. [Google Scholar] [CrossRef]
- Yao, Y.; Vehtari, A.; Simpson, D.; Gelman, A. Using stacking to average Bayesian predictive distributions. Bayesian Anal. 2018, 13, 917–1003. [Google Scholar] [CrossRef]
- Alobaidi, M.H.; Meguid, M.A.; Chebana, F. Predicting seismic-induced liquefaction through ensemble learning frameworks. Sci. Rep. 2019, 9, 11786. [Google Scholar] [CrossRef]
- Cui, S.; Yin, Y.; Wang, D.; Li, Z.; Wang, Y. A stacking-based ensemble learning method for earthquake casualty prediction. Appl. Soft Comput. 2021, 101, 107038. [Google Scholar] [CrossRef]
- Tyralis, H.; Papacharalampous, G.; Langousis, A. Super ensemble learning for daily streamflow forecasting: Large-scale demonstration and comparison with multiple machine learning algorithms. Neural Comput. Appl. 2021, 33, 3053–3068. [Google Scholar] [CrossRef]
- Wu, T.; Zhang, W.; Jiao, X.; Guo, W.; Hamoud, Y.A. Evaluation of stacking and blending ensemble learning methods for estimating daily reference evapotranspiration. Comput. Electron. Agric. 2021, 184, 106039. [Google Scholar] [CrossRef]
- Hwangbo, L.; Kang, Y.J.; Kwon, H.; Lee, J.I.; Cho, H.J.; Ko, J.K.; Sung, S.M.; Lee, T.H. Stacking ensemble learning model to predict 6-month mortality in ischemic stroke patients. Sci. Rep. 2022, 12, 17389. [Google Scholar] [CrossRef] [PubMed]
- Zandi, O.; Zahraie, B.; Nasseri, M.; Behrangi, A. Stacking machine learning models versus a locally weighted linear model to generate high-resolution monthly precipitation over a topographically complex area. Atmos. Res. 2022, 272, 106159. [Google Scholar] [CrossRef]
- Tibshirani, R. Regression shrinkage and selection via the lasso. J. R. Stat. Soc. Ser. B (Methodol.) 1996, 58, 267–288. [Google Scholar] [CrossRef]
- Cortes, C.; Vapnik, V. Support-vector networks. Mach. Learn. 1995, 20, 273–297. [Google Scholar] [CrossRef]
- Rezaali, M.; Quilty, J.; Karimi, A. Probabilistic urban water demand forecasting using wavelet-based machine learning models. J. Hydrol. 2021, 600, 126358. [Google Scholar] [CrossRef]
- Granata, F.; Di Nunno, F.; Modoni, G. Hybrid machine learning models for soil saturated conductivity prediction. Water 2022, 14, 1729. [Google Scholar] [CrossRef]
- Quilty, J.M.; Sikorska-Senoner, A.E.; Hah, D. A stochastic conceptual-data-driven approach for improved hydrological simulations. Environ. Model. Softw. 2022, 149, 105326. [Google Scholar] [CrossRef]
- Kopsiaftis, G.; Kaselimi, M.; Protopapadakis, E.; Voulodimos, A.; Doulamis, A.; Doulamis, N.; Mantoglou, A. Performance comparison of physics-based and machine learning assisted multi-fidelity methods for the management of coastal aquifer systems. Front. Water 2023, 5, 1195029. [Google Scholar] [CrossRef]
- Peterson, T.C.; Vose, R.S. An overview of the Global Historical Climatology Network temperature database. Bull. Am. Meteorol. Soc. 1997, 78, 2837–2849. [Google Scholar] [CrossRef]
- Hsu, K.-L.; Gao, X.; Sorooshian, S.; Gupta, H.V. Precipitation estimation from remotely sensed information using artificial neural networks. J. Appl. Meteorol. 1997, 36, 1176–1190. [Google Scholar] [CrossRef]
- Nguyen, P.; Ombadi, M.; Sorooshian, S.; Hsu, K.; AghaKouchak, A.; Braithwaite, D.; Ashouri, H.; Thorstensen, A.R. The PERSIANN family of global satellite precipitation data: A review and evaluation of products. Hydrol. Earth Syst. Sci. 2018, 22, 5801–5816. [Google Scholar] [CrossRef]
- Nguyen, P.; Shearer, E.J.; Tran, H.; Ombadi, M.; Hayatbini, N.; Palacios, T.; Huynh, P.; Braithwaite, D.; Updegraff, G.; Hsu, K.; et al. The CHRS data portal, an easily accessible public repository for PERSIANN global satellite precipitation data. Sci. Data 2019, 6, 180296. [Google Scholar] [CrossRef]
- Huffman, G.J.; Stocker, E.F.; Bolvin, D.T.; Nelkin, E.J.; Tan, J. GPM IMERG Late Precipitation L3 1 day 0.1 degree × 0.1 degree V06, Edited by Andrey Savtchenko, Greenbelt, MD, Goddard Earth Sciences Data and Information Services Center (GES DISC). 2019. Available online: https://disc.gsfc.nasa.gov/datasets/GPM_3IMERGDL_06/summary (accessed on 12 October 2022).
- Wang, Z.; Zhong, R.; Lai, C.; Chen, J. Evaluation of the GPM IMERG satellite-based precipitation products and the hydrological utility. Atmos. Res. 2017, 196, 151–163. [Google Scholar] [CrossRef]
- Akbari Asanjan, A.; Yang, T.; Hsu, K.; Sorooshian, S.; Lin, J.; Peng, Q. Short-term precipitation forecast based on the PERSIANN system and LSTM recurrent neural networks. J. Geophys. Res. Atmos. 2018, 123, 12543–12563. [Google Scholar] [CrossRef]
- Jiang, S.; Ren, L.; Xu, C.Y.; Yong, B.; Yuan, F.; Liu, Y.; Yang, X.; Zeng, X. Statistical and hydrological evaluation of the latest Integrated Multi-satellitE Retrievals for GPM (IMERG) over a midlatitude humid basin in South China. Atmos. Res. 2018, 214, 418–429. [Google Scholar] [CrossRef]
- Tan, M.L.; Santo, H. Comparison of GPM IMERG, TMPA 3B42 and PERSIANN-CDR satellite precipitation products over Malaysia. Atmos. Res. 2018, 202, 63–76. [Google Scholar] [CrossRef]
- Moazami, S.; Na, W.; Najafi, M.R.; de Souza, C. Spatiotemporal bias adjustment of IMERG satellite precipitation data across Canada. Adv. Water Resour. 2022, 168, 104300. [Google Scholar] [CrossRef]
- Pradhan, R.K.; Markonis, Y.; Godoy, M.R.V.; Villalba-Pradas, A.; Andreadis, K.M.; Nikolopoulos, E.I.; Papalexiou, S.M.; Rahim, A.; Tapiador, F.J.; Hanel, M. Review of GPM IMERG performance: A global perspective. Remote Sens. Environ. 2022, 268, 112754. [Google Scholar] [CrossRef]
- Salehi, H.; Sadeghi, M.; Golian, S.; Nguyen, P.; Murphy, C.; Sorooshian, S. The Application of PERSIANN Family Datasets for Hydrological Modeling. Remote Sens. 2022, 14, 3675. [Google Scholar] [CrossRef]
- Xiong, L.; Li, S.; Tang, G.; Strobl, J. Geomorphometry and terrain analysis: Data, methods, platforms and applications. Earth-Sci. Rev. 2022, 233, 104191. [Google Scholar] [CrossRef]
- Papacharalampous, G.A.; Tyralis, H.; Doulamis, A.; Doulamis, N. Comparison of tree-based ensemble algorithms for merging satellite and earth-observed precipitation data at the daily time scale. Hydrology 2023, 10, 50. [Google Scholar] [CrossRef]
- Gneiting, T. Making and evaluating point forecasts. J. Am. Stat. Assoc. 2011, 106, 746–762. [Google Scholar] [CrossRef]
- Roscher, R.; Bohn, B.; Duarte, M.F.; Garcke, J. Explainable machine learning for scientific insights and discoveries. IEEE Access 2020, 8, 42200–42216. [Google Scholar] [CrossRef]
- Belle, V.; Papantonis, I. Principles and practice of explainable machine learning. Front. Big Data 2021, 4, 688969. [Google Scholar] [CrossRef]
- Linardatos, P.; Papastefanopoulos, V.; Kotsiantis, S. Explainable AI: A review of machine learning interpretability methods. Entropy 2021, 23, 18. [Google Scholar] [CrossRef]
- Smith, J.; Wallis, K.F. A simple explanation of the forecast combination puzzle. Oxf. Bull. Econ. Stat. 2009, 71, 331–355. [Google Scholar] [CrossRef]
- Lichtendahl, K.C., Jr.; Grushka-Cockayne, Y.; Winkler, R.L. Is it better to average probabilities or quantiles? Manag. Sci. 2013, 59, 1594–1611. [Google Scholar] [CrossRef]
- Winkler, R.L. Equal versus differential weighting in combining forecasts. Risk Anal. 2015, 35, 16–18. [Google Scholar] [CrossRef]
- Claeskens, G.; Magnus, J.R.; Vasnev, A.L.; Wang, W. The forecast combination puzzle: A simple theoretical explanation. Int. J. Forecast. 2016, 32, 754–762. [Google Scholar] [CrossRef]
- Winkler, R.L.; Grushka-Cockayne, Y.; Lichtendahl, K.C.; Jose, V.R.R. Probability forecasts and their combination: A research perspective. Decis. Anal. 2019, 16, 239–260. [Google Scholar] [CrossRef]
- Tyralis, H.; Papacharalampous, G. A review of probabilistic forecasting and prediction with machine learning. arXiv 2022, arXiv:2209.08307. [Google Scholar]
- Kang, Y.; Hyndman, R.J.; Smith-Miles, K. Visualising forecasting algorithm performance using time series instance spaces. Int. J. Forecast. 2017, 33, 345–358. [Google Scholar] [CrossRef]
- Montero-Manso, P.; Athanasopoulos, G.; Hyndman, R.J.; Talagala, T.S. FFORMA: Feature-based forecast model averaging. Int. J. Forecast. 2020, 36, 86–92. [Google Scholar] [CrossRef]
- Talagala, T.S.; Li, F.; Kang, Y. FFORMPP: Feature-based forecast model performance prediction. Int. J. Forecast. 2021, 38, 920–943. [Google Scholar] [CrossRef]
- R Core Team. R: A Language and Environment for Statistical Computing; R Foundation for Statistical Computing: Vienna, Austria, 2023; Available online: https://www.R-project.org (accessed on 17 August 2023).
- Friedman, J.H. Multivariate adaptive regression splines. Ann. Stat. 1991, 19, 1–67. [Google Scholar] [CrossRef]
- Friedman, J.H. Fast MARS. Stanford University, Department of Statistics. Technical Report 110. 1993. Available online: https://statistics.stanford.edu/sites/g/files/sbiybj6031/f/LCS%20110.pdf (accessed on 17 December 2022).
- Kooperberg, C.; Bose, S.; Stone, C.J. Polychotomous regression. J. Am. Stat. Assoc. 1997, 92, 117–127. [Google Scholar] [CrossRef]
- Stone, C.J.; Hansen, M.H.; Kooperberg, C.; Truong, Y.K. Polynomial splines and their tensor products in extended linear modeling. Ann. Stat. 1997, 25, 1371–1470. [Google Scholar] [CrossRef]
- Kooperberg, C. polspline: Polynomial Spline Routines. R Package Version 1.1.22. 2022. Available online: https://CRAN.R-project.org/package=polspline (accessed on 17 August 2023).
- Tyralis, H.; Papacharalampous, G.; Langousis, A. A brief review of random forests for water scientists and practitioners and their recent history in water resources. Water 2019, 11, 910. [Google Scholar] [CrossRef]
- Mayr, A.; Binder, H.; Gefeller, O.; Schmid, M. The evolution of boosting algorithms: From machine learning to statistical modelling. Methods Inf. Med. 2014, 53, 419–427. [Google Scholar] [CrossRef] [PubMed]
- Natekin, A.; Knoll, A. Gradient boosting machines, a tutorial. Front. Neurorobot. 2013, 7, 21. [Google Scholar] [CrossRef] [PubMed]
- Tyralis, H.; Papacharalampous, G. Boosting algorithms in energy research: A systematic review. Neural Comput. Appl. 2021, 33, 14101–14117. [Google Scholar] [CrossRef]
- Ripley, B.D. Pattern Recognition and Neural Networks; Cambridge University Press: Cambridge, UK, 1996. [Google Scholar] [CrossRef]
- MacKay, D.J.C. Bayesian interpolation. Neural Comput. 1992, 4, 415–447. [Google Scholar] [CrossRef]
- Kuhn, M. caret: Classification and Regression Training. R Package Version 6.0-94. 2023. Available online: https://CRAN.R-project.org/package=caret (accessed on 17 August 2023).
- Dowle, M.; Srinivasan, A. data.table: Extension of ‘data.frame’. R Package Version 1.14.8. 2023. Available online: https://CRAN.R-project.org/package=data.table (accessed on 17 August 2023).
- Hollister, J.W. elevatr: Access Elevation Data from Various APIs. R Package Version 0.4.2. 2022. Available online: https://CRAN.R-project.org/package=elevatr (accessed on 17 August 2023).
- Pierce, D. ncdf4: Interface to Unidata netCDF (Version 4 or Earlier) Format Data Files. R Package Version 1.21. 2023. Available online: https://CRAN.R-project.org/package=ncdf4 (accessed on 17 August 2023).
- Bivand, R.S.; Keitt, T.; Rowlingson, B. rgdal: Bindings for the ‘Geospatial’ Data Abstraction Library. R Package Version 1.6-6. 2023. Available online: https://CRAN.R-project.org/package=rgdal (accessed on 17 August 2023).
- Pebesma, E. Simple features for R: Standardized support for spatial vector data. R J. 2018, 10, 439–446. [Google Scholar] [CrossRef]
- Pebesma, E. sf: Simple Features for R. R Package Version 1.0-13. 2023. Available online: https://CRAN.R-project.org/package=sf (accessed on 17 August 2023).
- Bivand, R.S. spdep: Spatial Dependence: Weighting Schemes, Statistics. R Package Version 1.2-8. 2023. Available online: https://CRAN.R-project.org/package=spdep (accessed on 17 August 2023).
- Bivand, R.S.; Wong, D.W.S. Comparing implementations of global and local indicators of spatial association. TEST 2018, 27, 716–748. [Google Scholar] [CrossRef]
- Bivand, R.S.; Pebesma, E.; Gómez-Rubio, V. Applied Spatial Data Analysis with R, 2nd ed.; Springer: New York, NY, USA, 2013. [Google Scholar] [CrossRef]
- Wickham, H.; Averick, M.; Bryan, J.; Chang, W.; McGowan, L.D.; François, R.; Grolemund, G.; Hayes, A.; Henry, L.; Hester, J.; et al. Welcome to the tidyverse. J. Open Source Softw. 2019, 4, 1686. [Google Scholar] [CrossRef]
- Wickham, H. tidyverse: Easily Install and Load the ‘Tidyverse’. R Package Version 2.0.0. 2023. Available online: https://CRAN.R-project.org/package=tidyverse (accessed on 17 August 2023).
- Rodriguez, P.P.; Gianola, D. brnn: Bayesian Regularization for Feed-Forward Neural Networks. R Package Version 0.9.2. 2022. Available online: https://CRAN.R-project.org/package=brnn (accessed on 17 August 2023).
- Milborrow, S. earth: Multivariate Adaptive Regression Splines. R Package Version 5.3.2. 2023. Available online: https://CRAN.R-project.org/package=earth (accessed on 17 August 2023).
- Greenwell, B.; Boehmke, B.; Cunningham, J.; GBM Developers. gbm: Generalized Boosted Regression Models. R package version 2.1.8.1. 2022. Available online: https://CRAN.R-project.org/package=gbm (accessed on 17 August 2023).
- Ripley, B.D. nnet: Feed-Forward Neural Networks and Multinomial Log-Linear Models. R Package Version 7.3-19. 2023. Available online: https://CRAN.R-project.org/package=nnet (accessed on 17 August 2023).
- Venables, W.N.; Ripley, B.D. Modern Applied Statistics with S, 4th ed.; Springer: New York, NY, USA, 2002; ISBN 0-387-95457-0. [Google Scholar]
- Wright, M.N. Ranger: A Fast Implementation of Random Forests. R Package Version 0.15.1. 2023. Available online: https://CRAN.R-project.org/package=ranger (accessed on 17 August 2023).
- Wright, M.N.; Ziegler, A. ranger: A fast implementation of random forests for high dimensional data in C++ and R. J. Stat. Softw. 2017, 77, 1–17. [Google Scholar] [CrossRef]
- Chen, T.; He, T.; Benesty, M.; Khotilovich, V.; Tang, Y.; Cho, H.; Chen, K.; Mitchell, R.; Cano, I.; Zhou, T.; et al. xgboost: Extreme Gradient Boosting. R Package Version 1.7.5.1. 2023. Available online: https://CRAN.R-project.org/package=xgboost (accessed on 17 August 2023).
- Tyralis, H.; Papacharalampous, G. scoringfunctions: A Collection of Scoring Functions for Assessing Point Forecasts. 2022. Available online: https://CRAN.R-project.org/package=scoringfunctions (accessed on 17 August 2023).
- Wickham, H.; Hester, J.; Chang, W.; Bryan, J. devtools: Tools to Make Developing R Packages Easier. R Package Version 2.4.5. 2022. Available online: https://CRAN.R-project.org/package=devtools (accessed on 17 August 2023).
- Xie, Y. knitr: A Comprehensive Tool for Reproducible Research in R. In Implementing Reproducible Computational Research; Stodden, V., Leisch, F., Peng, R.D., Eds.; Chapman and Hall/CRC: Boca Raton, FL, USA, 2014. [Google Scholar]
- Xie, Y. Dynamic Documents with R and knitr, 2nd ed.; Chapman and Hall/CRC: Boca Raton, FL, USA, 2015. [Google Scholar]
- Xie, Y. knitr: A General-Purpose Package for Dynamic Report Generation in R. R Package Version 1.43. 2023. Available online: https://CRAN.R-project.org/package=knitr (accessed on 17 August 2023).
- Allaire, J.J.; Xie, Y.; McPherson, J.; Luraschi, J.; Ushey, K.; Atkins, A.; Wickham, H.; Cheng, J.; Chang, W.; Iannone, R. Rmarkdown: Dynamic Documents for R. R Package Version 2.21. 2023. Available online: https://CRAN.R-project.org/package=rmarkdown (accessed on 17 August 2023).
- Xie, Y.; Allaire, J.J.; Grolemund, G. R Markdown: The Definitive Guide; Chapman and Hall/CRC: Boca Raton, FL, USA, 2018; ISBN 9781138359338. Available online: https://bookdown.org/yihui/rmarkdown (accessed on 17 August 2023).
- Xie, Y.; Dervieux, C.; Riederer, E. R Markdown Cookbook; Chapman and Hall/CRC: Boca Raton, FL, USA, 2020; ISBN 9780367563837. Available online: https://bookdown.org/yihui/rmarkdown-cookbook (accessed on 17 August 2023).
Figure 1.
Plain language summary of the ensemble learners of this study. Linear regression, multivariate adaptive regression splines, multivariate adaptive polynomial splines, random forests, gradient boosting machines, extreme gradient boosting, Bayesian regularized neural networks, mean squared error and median squared error are referred to under their abbreviations (i.e., LR, MARS, poly-MARS, RF, GBM, XGBoost, BRNN, MSE and MdSE, respectively).
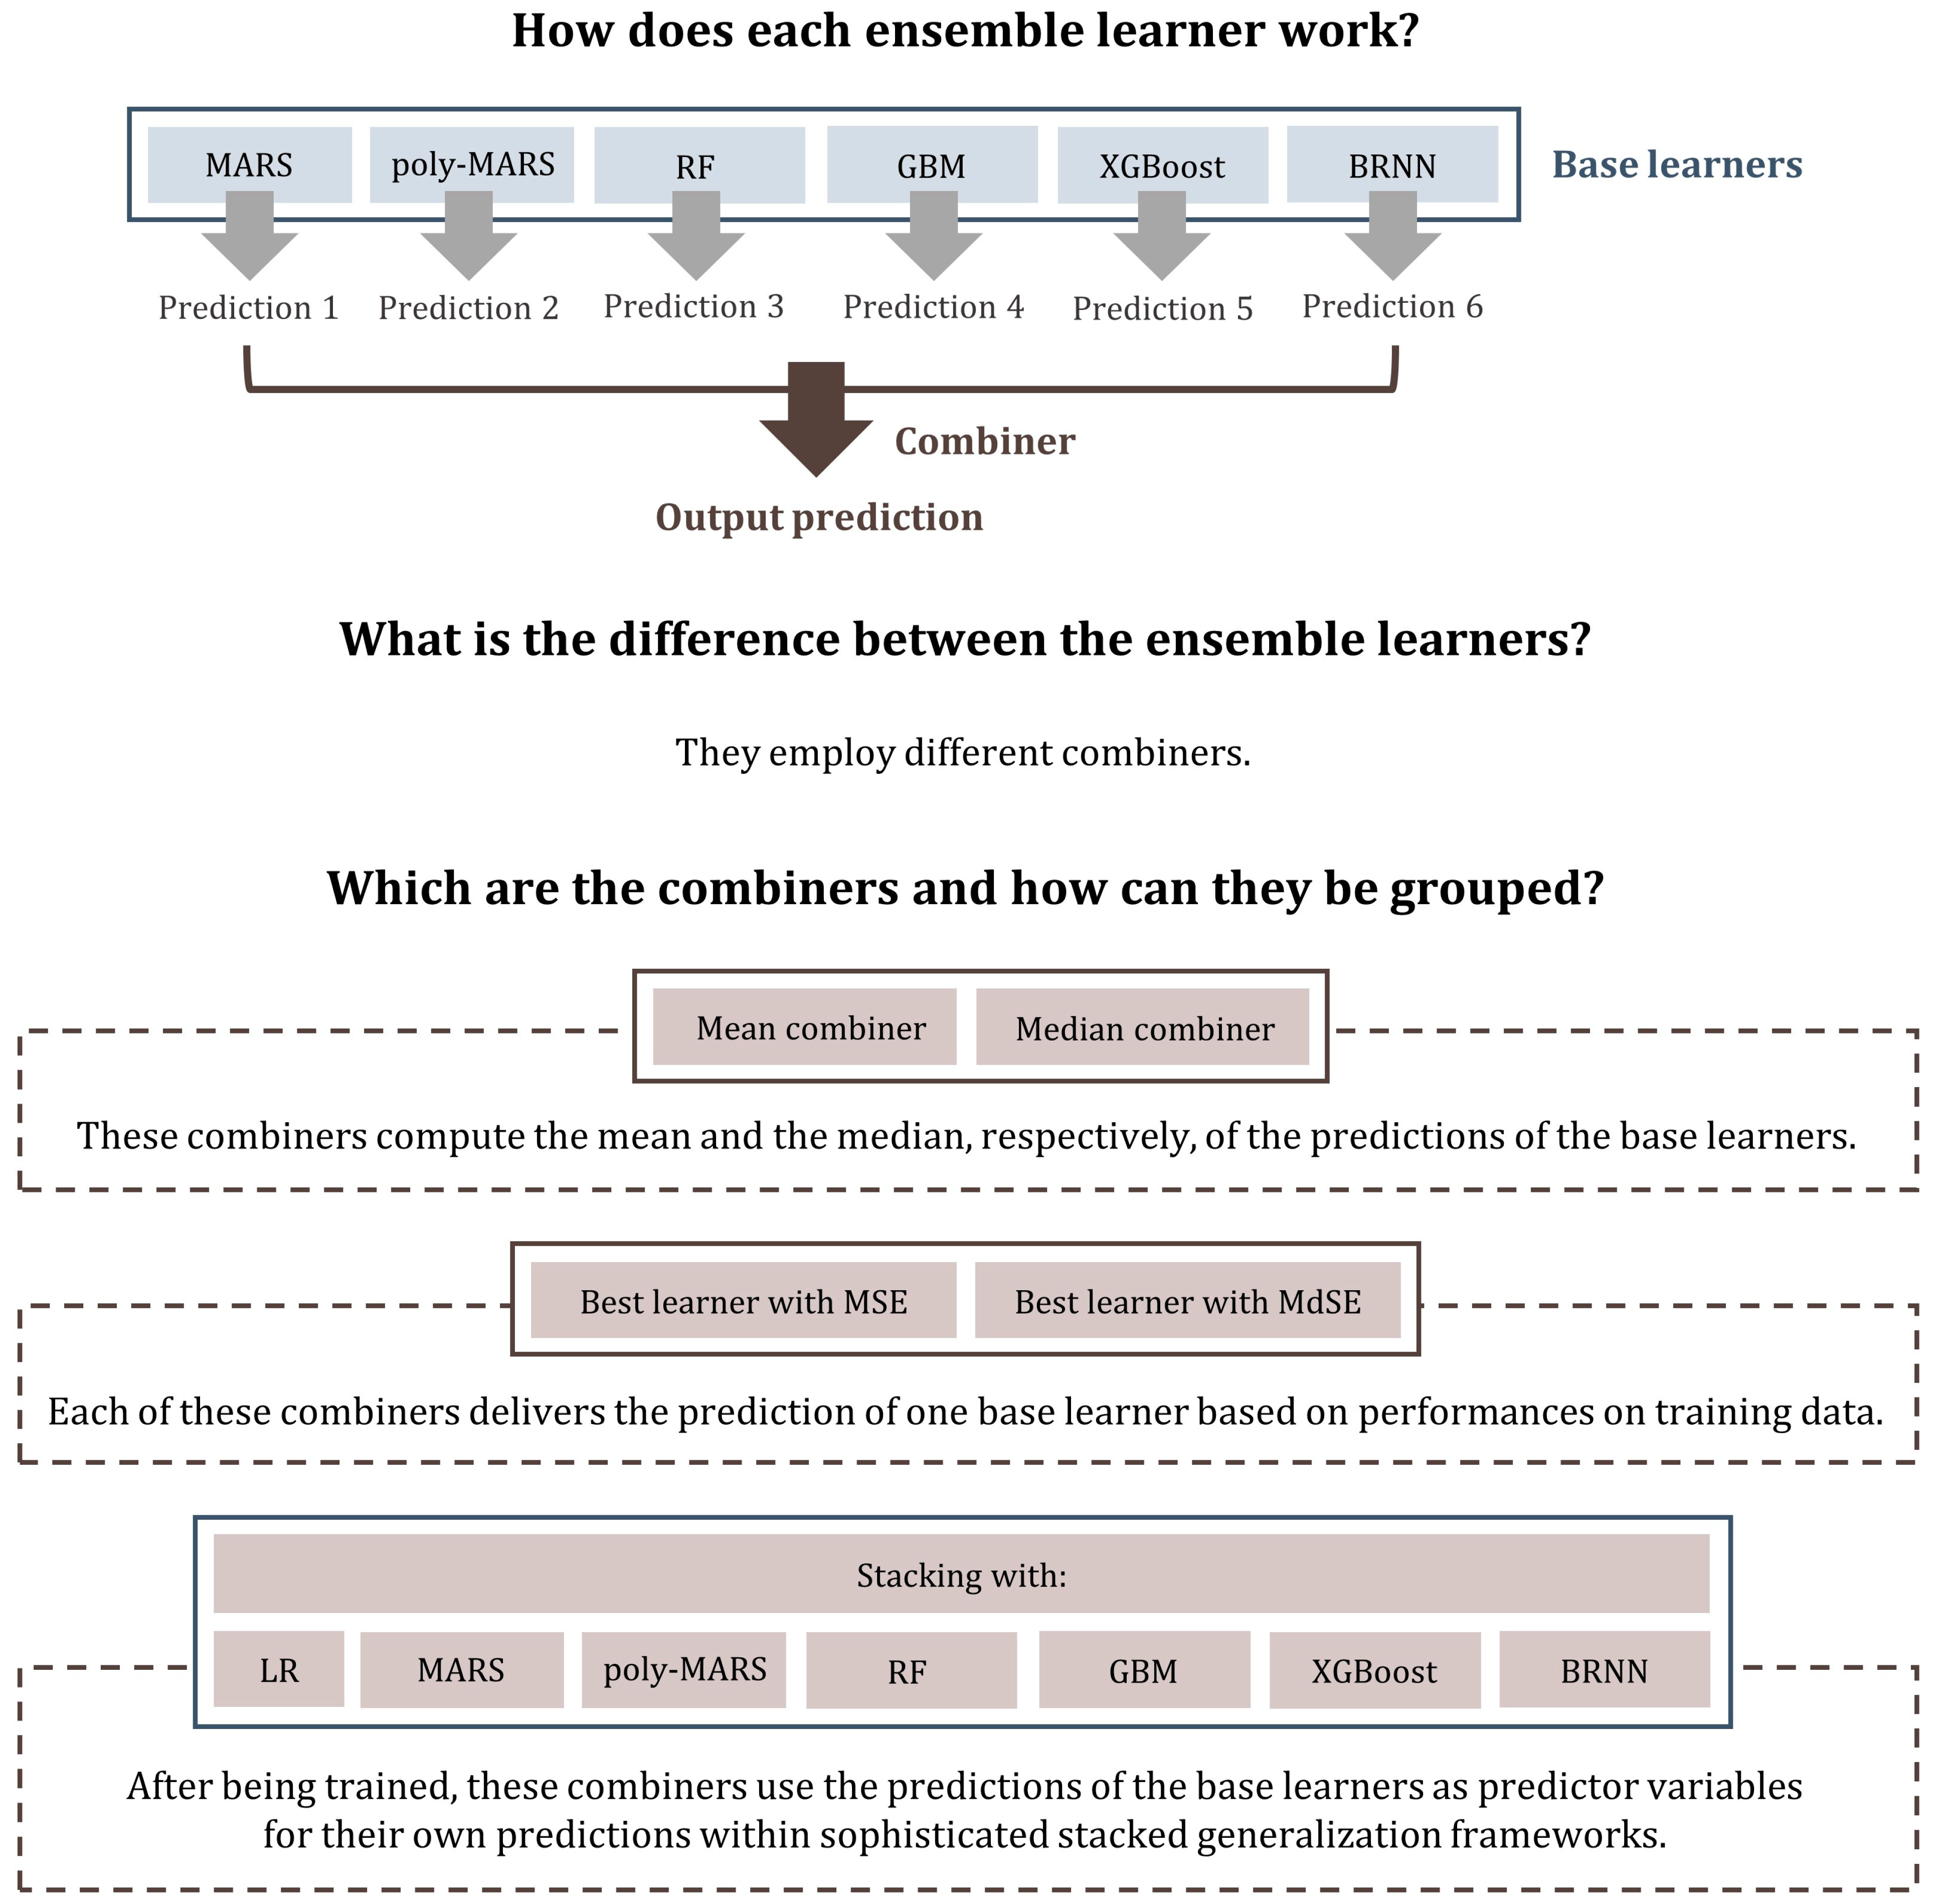
Figure 2.
Locations of the ground-based precipitation stations.
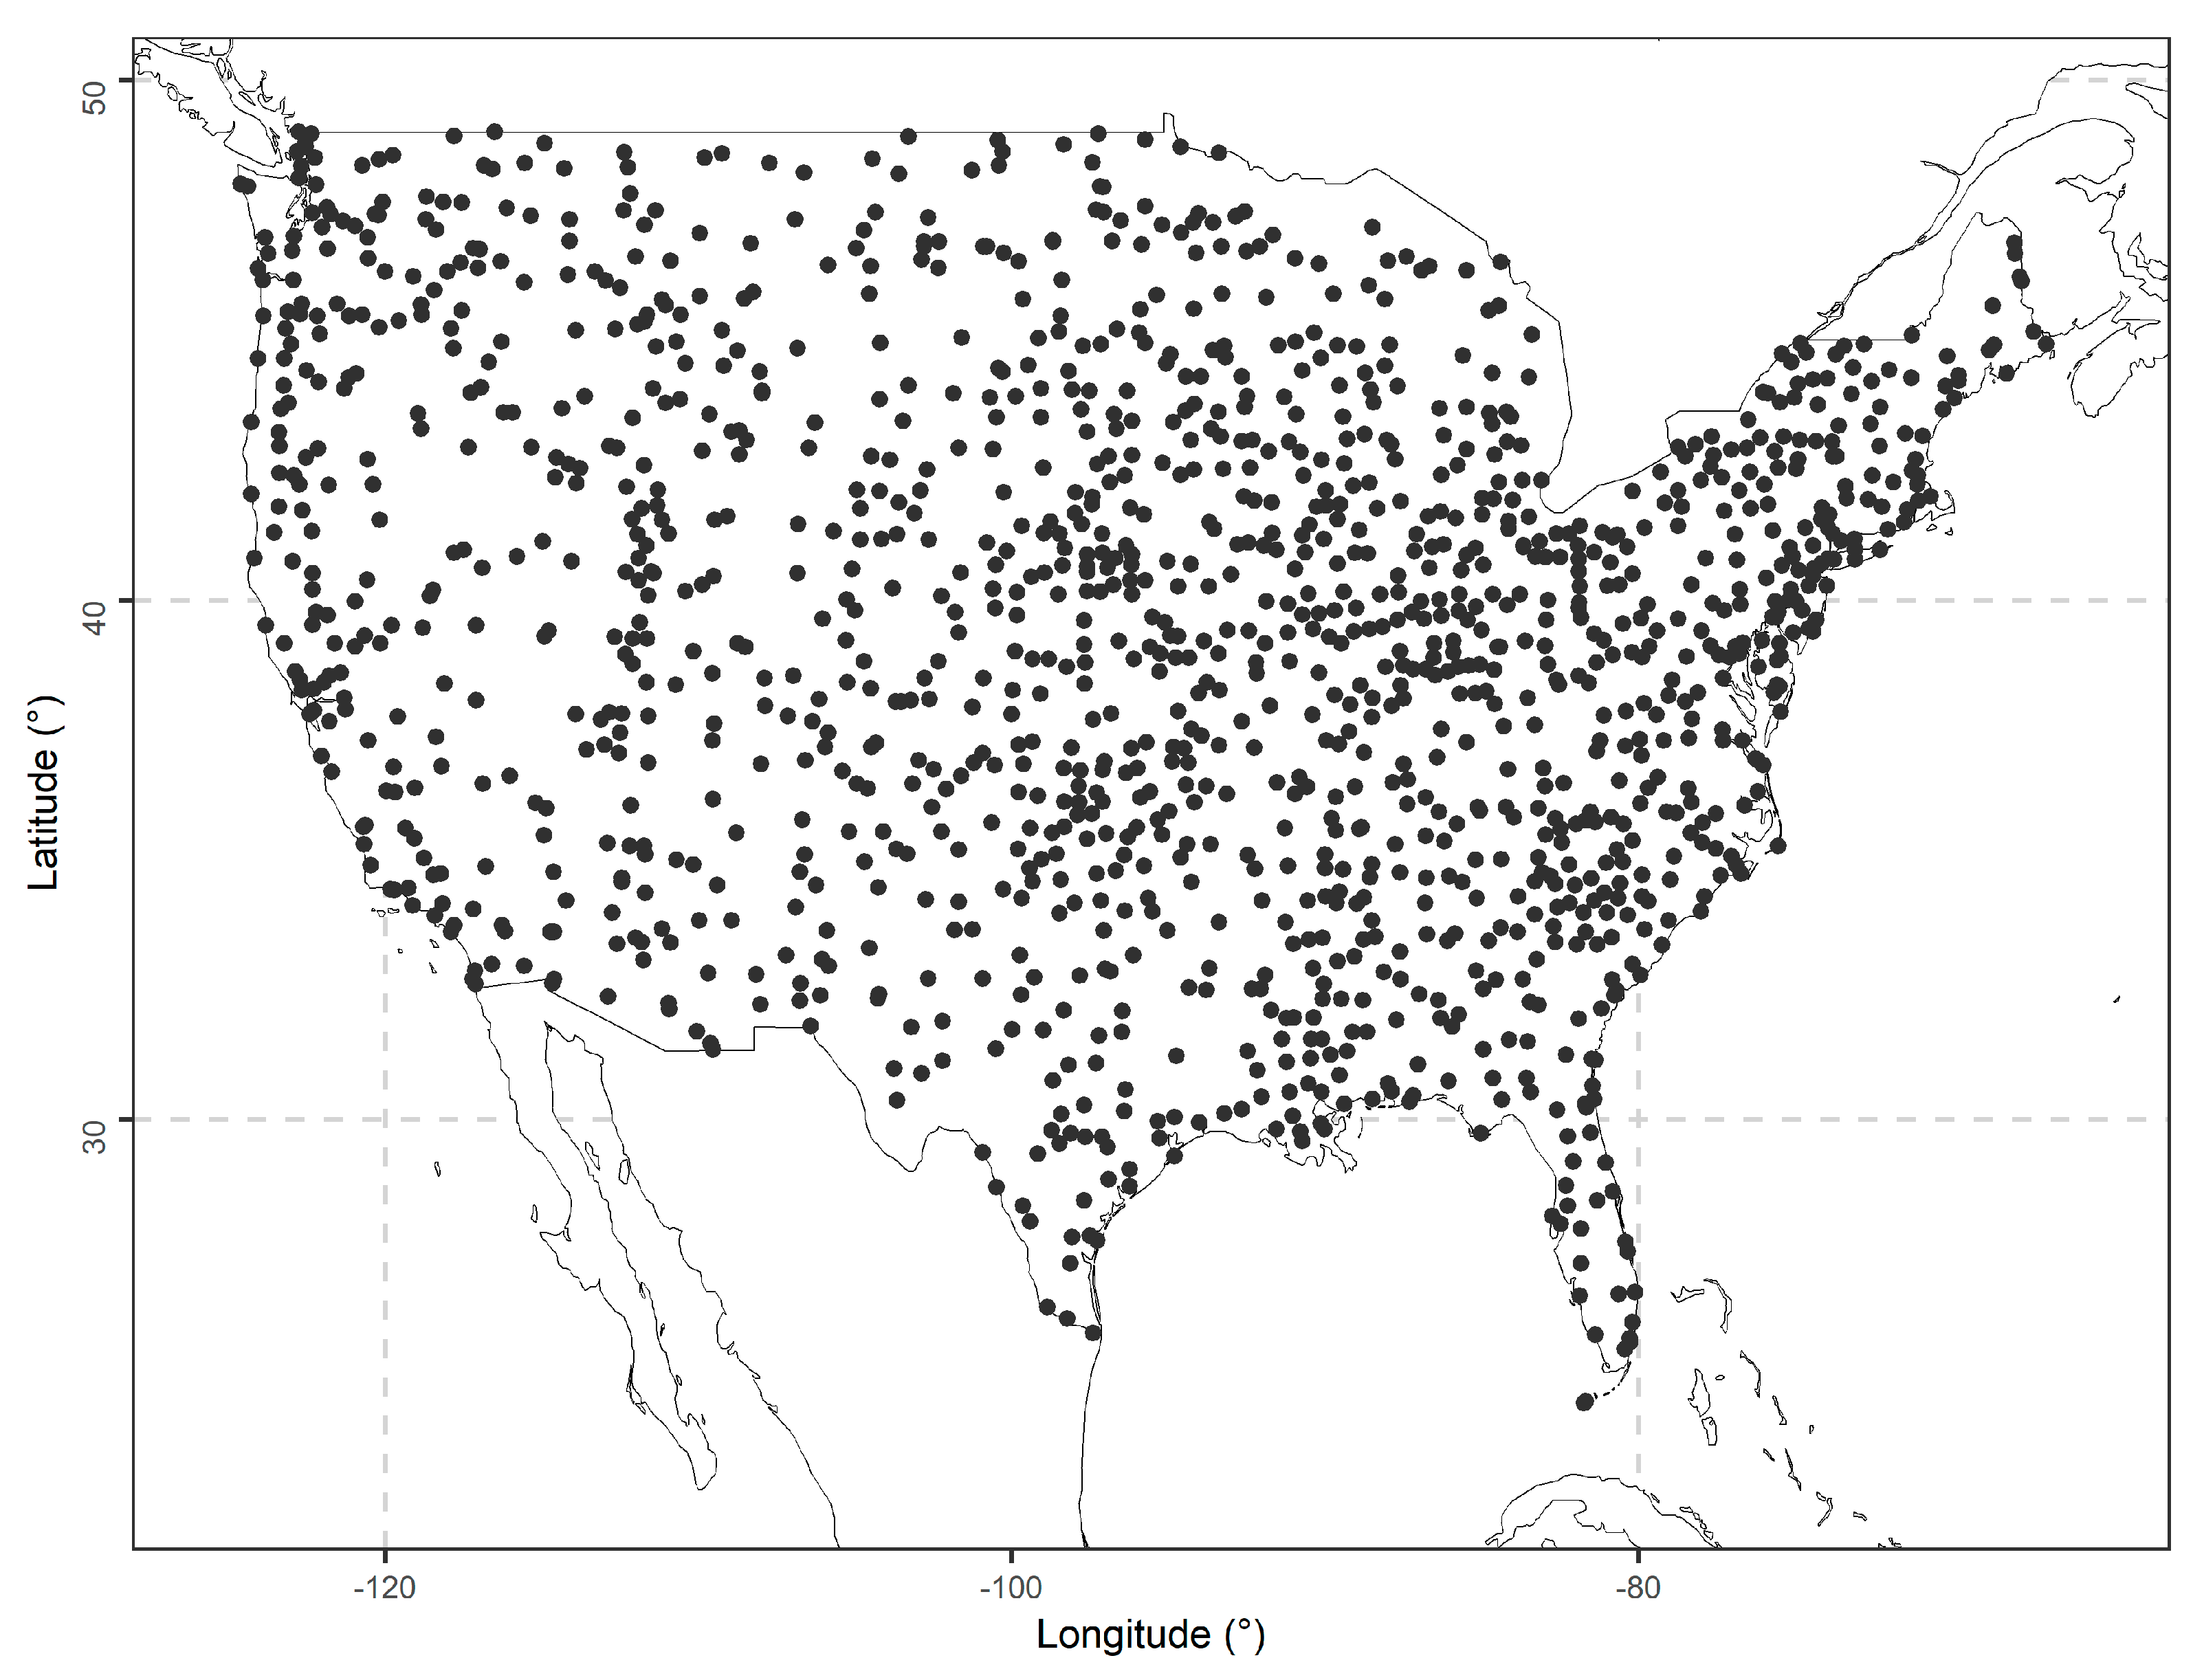
Figure 3.
Geographical locations of the (a) PERSIANN and (b) IMERG grid points.
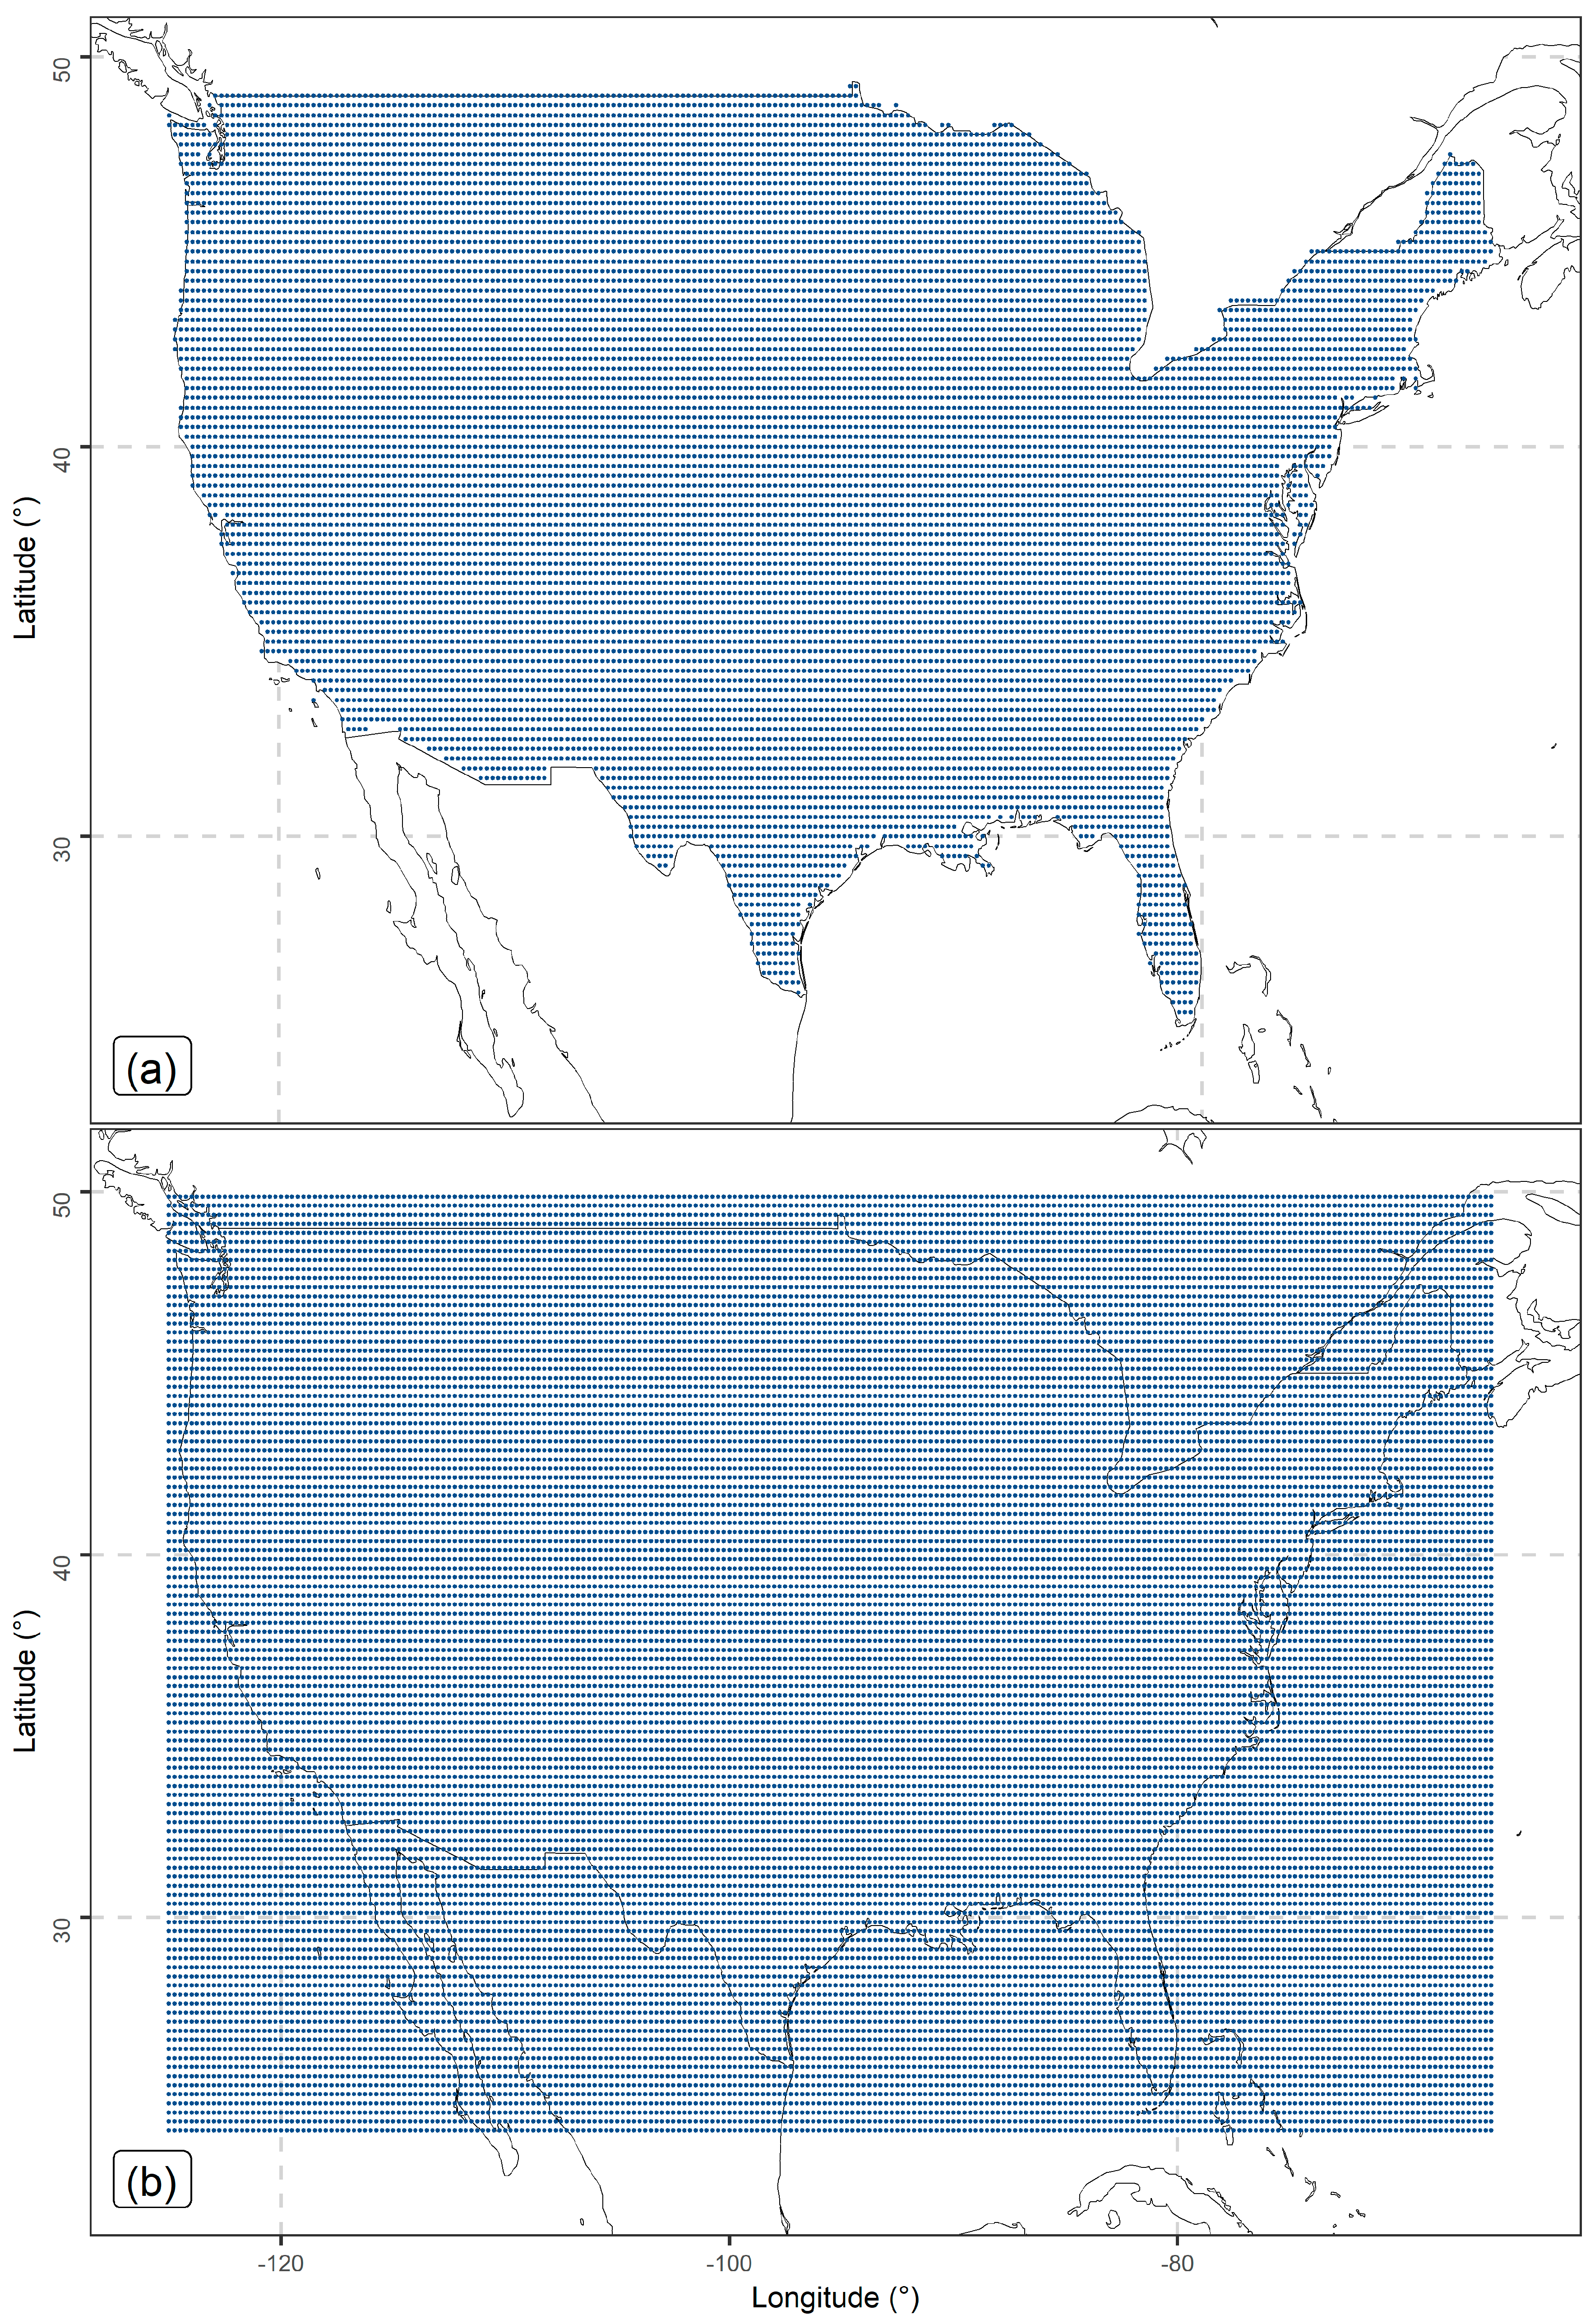
Figure 4.
Formulation of the spatial interpolation problem. The IMERG or PERSIANN precipitation data are measured at the grid points 1, 2, 3 and 4. The distances of these grid points from station 1 (i.e., the ground-based station that is surrounded by the same grid points) are denoted with di, i = 1, 2, 3 and 4.
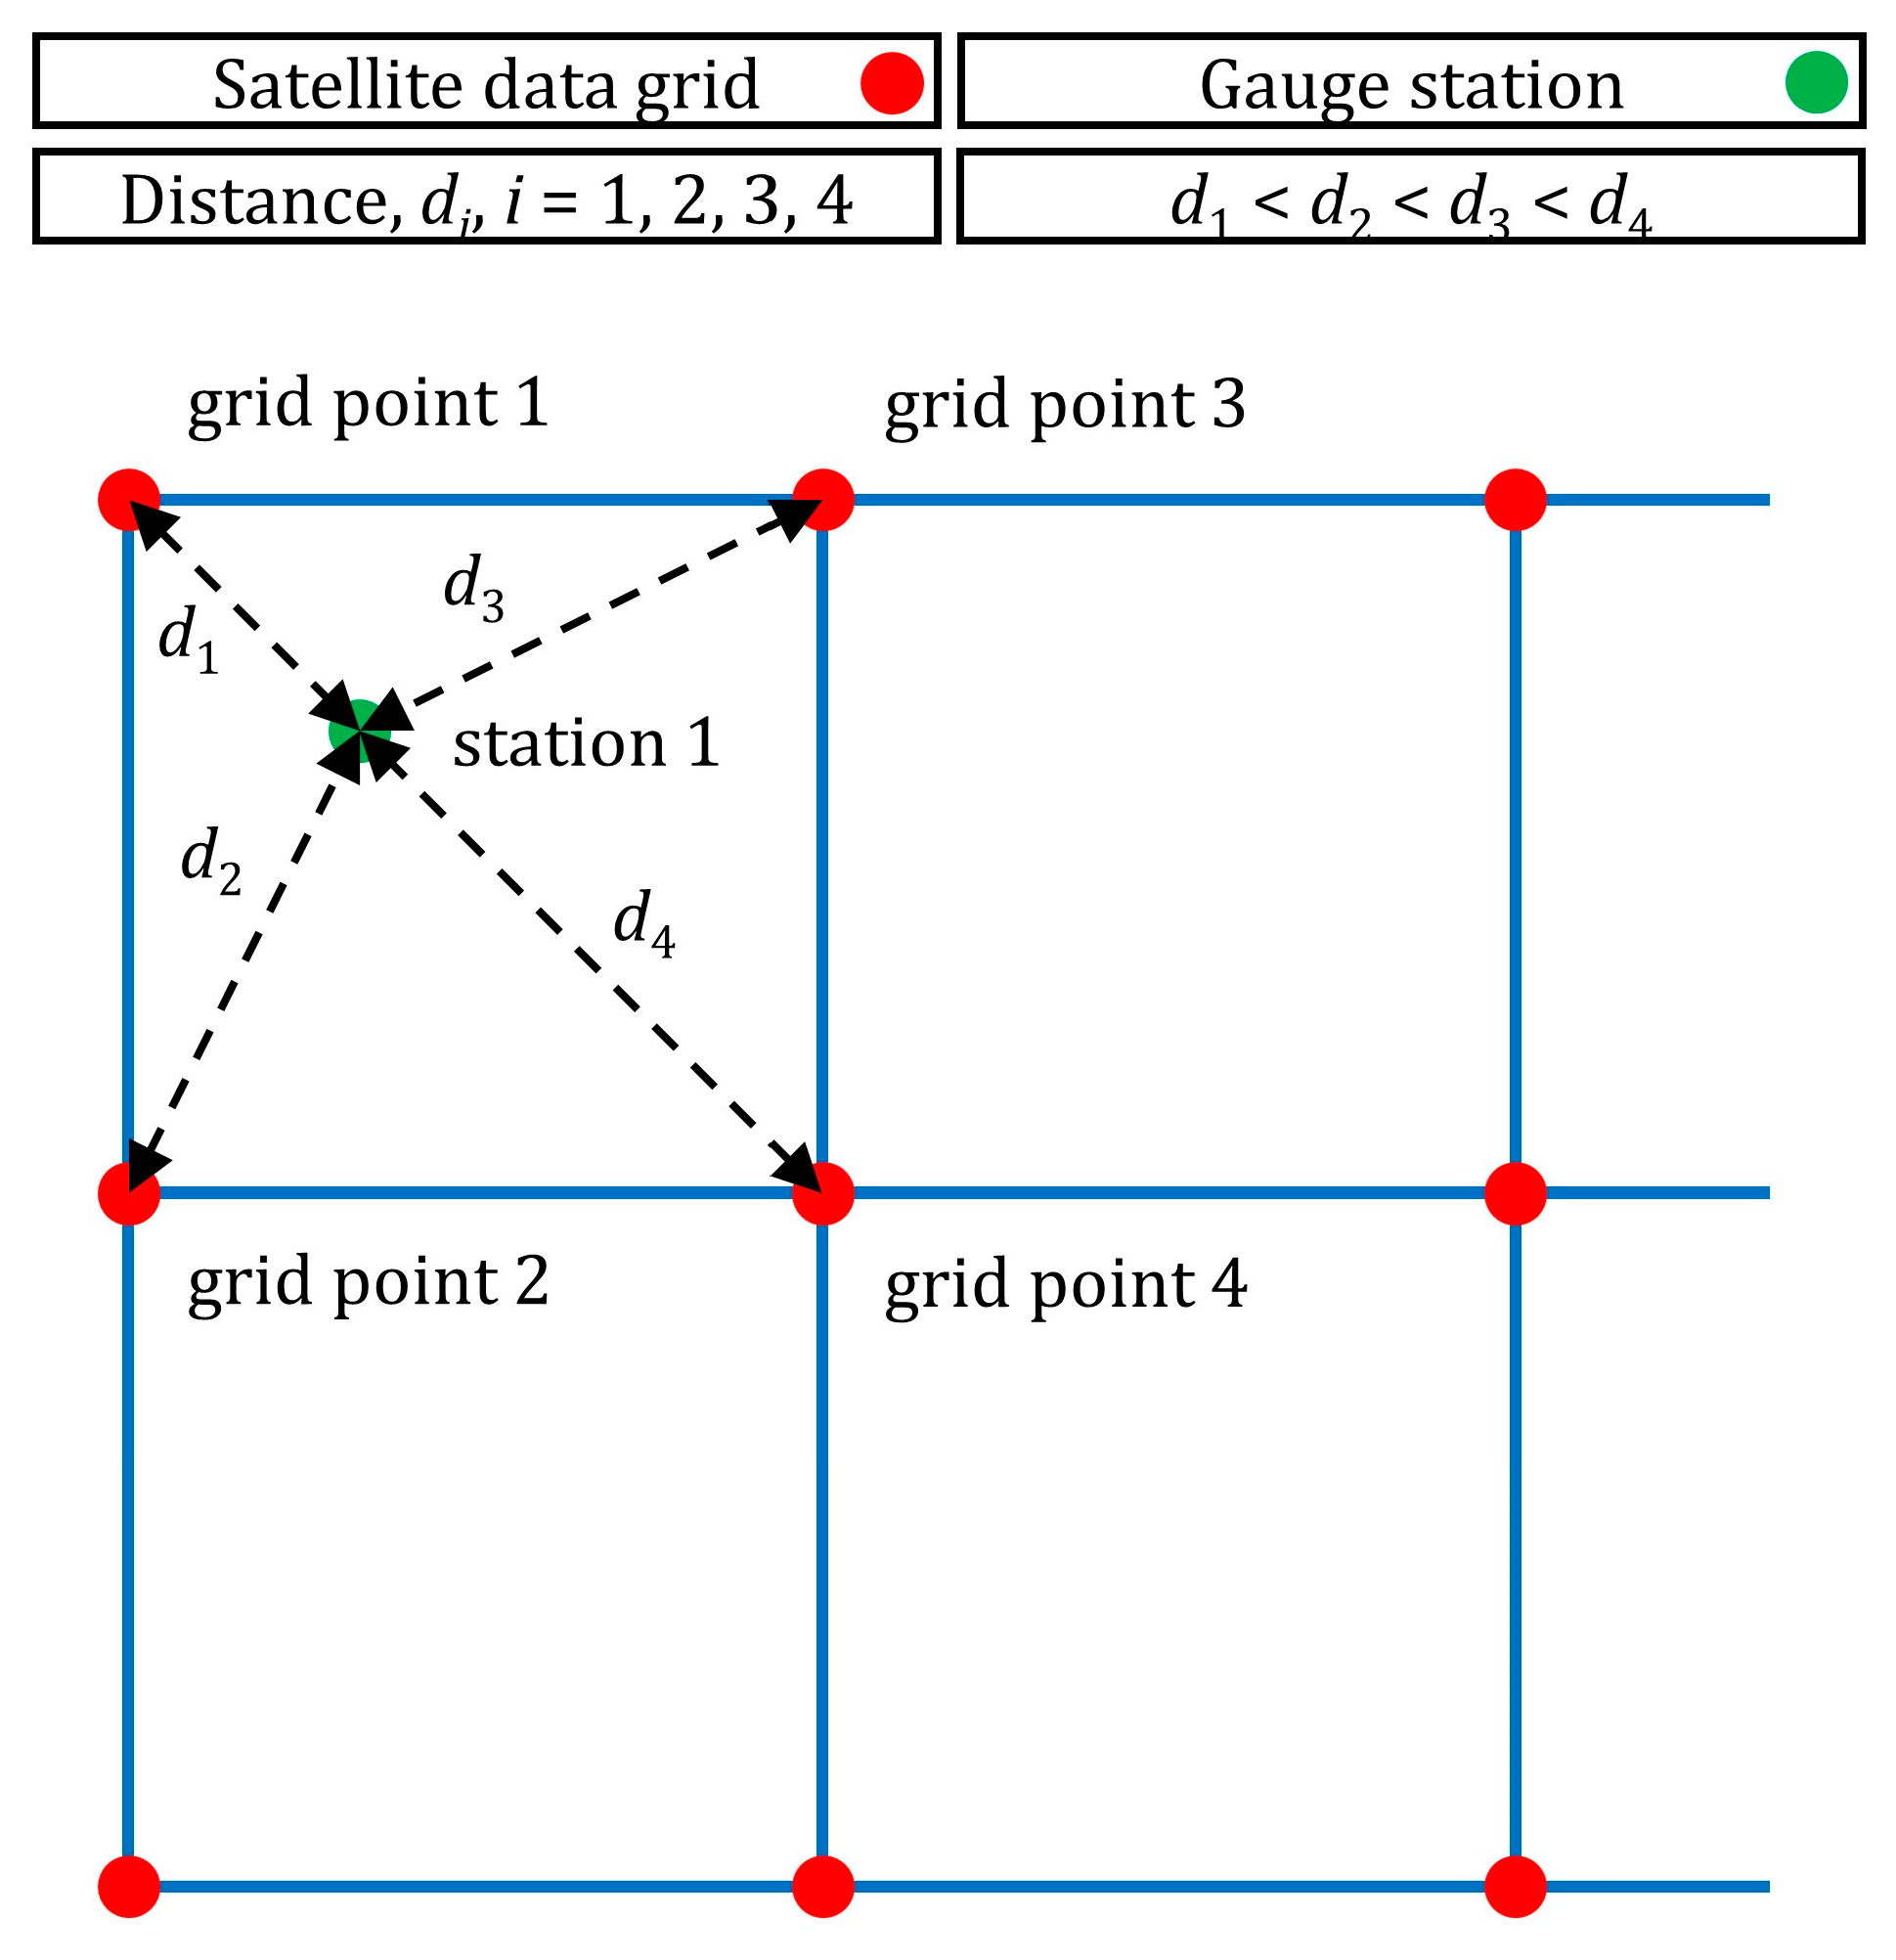
Figure 5.
Heatmaps of the (a) type-1 skill score using the MSE metric and (b) ranking of each learner according to the MSE metric. The darker the colour, the better the predictions.
Figure 5.
Heatmaps of the (a) type-1 skill score using the MSE metric and (b) ranking of each learner according to the MSE metric. The darker the colour, the better the predictions.

Figure 6.
Heatmaps of the (a) type-2 skill score using the MSE metric and (b) ranking of each set {learner, predictor set} according to the MSE metric. The darker the colour, the better the predictions.
Figure 6.
Heatmaps of the (a) type-2 skill score using the MSE metric and (b) ranking of each set {learner, predictor set} according to the MSE metric. The darker the colour, the better the predictions.

Figure 7.
Computational time on an Intel(R) Core(TM) i9-10900 CPU @ 2.80GHz 2.81 GHz with 128 GB RAM. The darker the colour, the lower the computational time.
Figure 7.
Computational time on an Intel(R) Core(TM) i9-10900 CPU @ 2.80GHz 2.81 GHz with 128 GB RAM. The darker the colour, the lower the computational time.
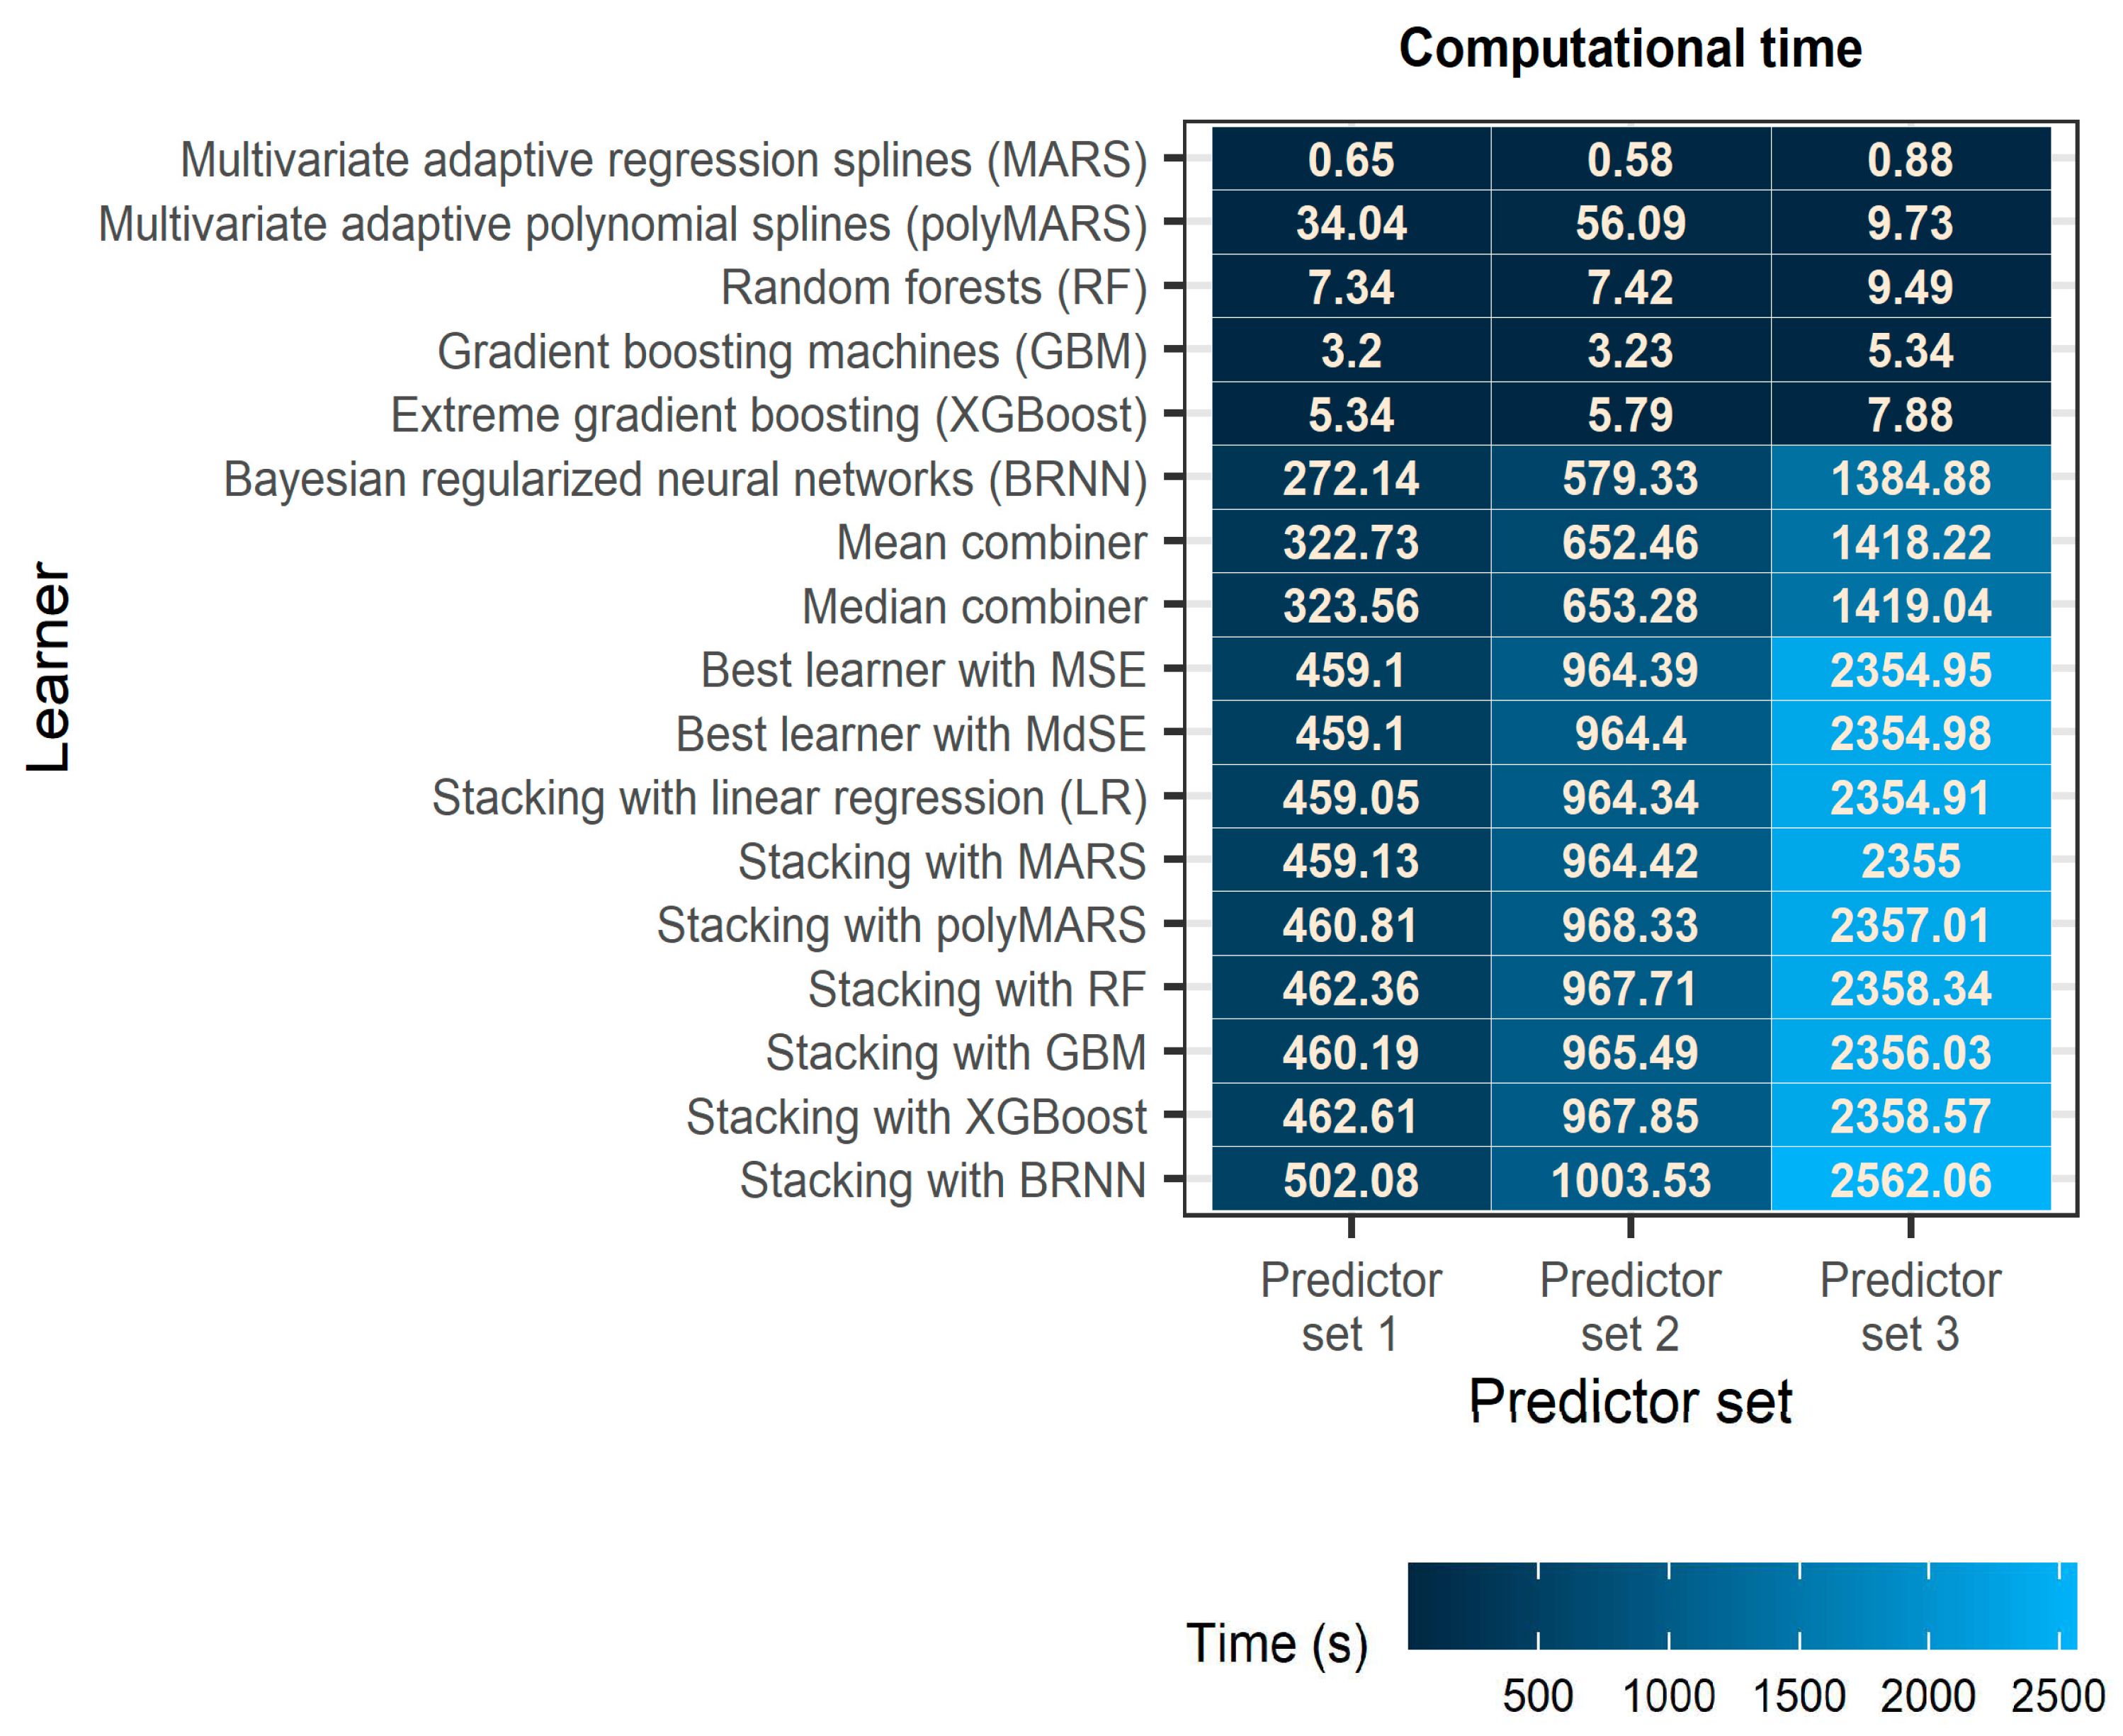
Figure 8.
Heatmaps of the (a) permutation importance score computed using the RF algorithm for the predictions produced by the base learners and (b) ranking of the base learners based on this score. The darker the colour, the larger the importance.
Figure 8.
Heatmaps of the (a) permutation importance score computed using the RF algorithm for the predictions produced by the base learners and (b) ranking of the base learners based on this score. The darker the colour, the larger the importance.

Figure 9.
Heatmaps of the (a) gain score computed using the XGBoost algorithm for the predictions produced by the base learners and (b) ranking of the base learners based on this score. The darker the colour, the larger the importance.
Figure 9.
Heatmaps of the (a) gain score computed using the XGBoost algorithm for the predictions produced by the base learners and (b) ranking of the base learners based on this score. The darker the colour, the larger the importance.
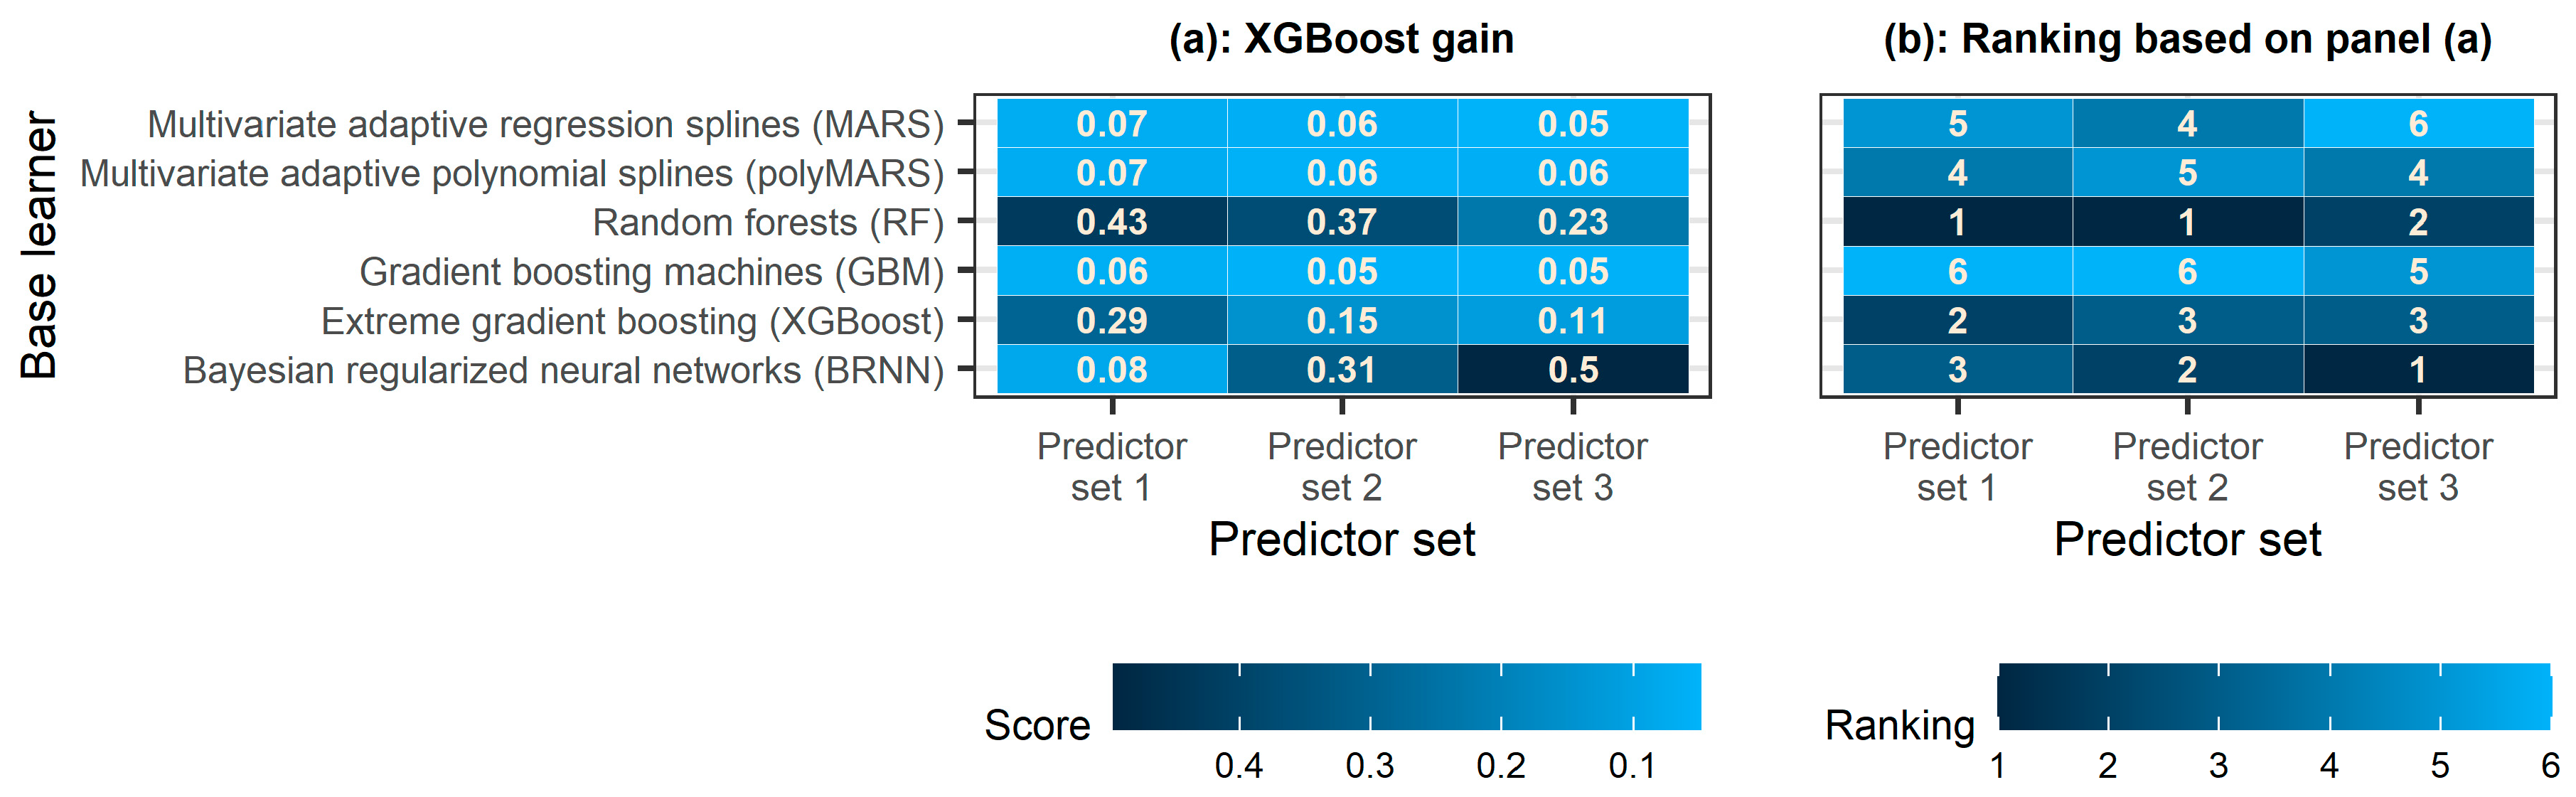
Figure 10.
Lollipop of the permutation importance score computed using the RF algorithm for the predictor variables. In the vertical axis, the predictor variables are presented from the most (top) to the least (bottom) important.
Figure 10.
Lollipop of the permutation importance score computed using the RF algorithm for the predictor variables. In the vertical axis, the predictor variables are presented from the most (top) to the least (bottom) important.

Figure 11.
Lollipop of the gain score computed using the XGBoost algorithm for the predictor variables. In the vertical axis, the predictor variables are presented from the most (top) to the least (bottom) important.
Figure 11.
Lollipop of the gain score computed using the XGBoost algorithm for the predictor variables. In the vertical axis, the predictor variables are presented from the most (top) to the least (bottom) important.
Disclaimer/Publisher’s Note: The statements, opinions and data contained in all publications are solely those of the individual author(s) and contributor(s) and not of MDPI and/or the editor(s). MDPI and/or the editor(s) disclaim responsibility for any injury to people or property resulting from any ideas, methods, instructions or products referred to in the content. |
© 2023 by the authors. Licensee MDPI, Basel, Switzerland. This article is an open access article distributed under the terms and conditions of the Creative Commons Attribution (CC BY) license (https://creativecommons.org/licenses/by/4.0/).
Share and Cite
MDPI and ACS Style
Papacharalampous, G.; Tyralis, H.; Doulamis, N.; Doulamis, A. Ensemble Learning for Blending Gridded Satellite and Gauge-Measured Precipitation Data. Remote Sens. 2023, 15, 4912. https://doi.org/10.3390/rs15204912
AMA Style
Papacharalampous G, Tyralis H, Doulamis N, Doulamis A. Ensemble Learning for Blending Gridded Satellite and Gauge-Measured Precipitation Data. Remote Sensing. 2023; 15(20):4912. https://doi.org/10.3390/rs15204912
Chicago/Turabian StylePapacharalampous, Georgia, Hristos Tyralis, Nikolaos Doulamis, and Anastasios Doulamis. 2023. "Ensemble Learning for Blending Gridded Satellite and Gauge-Measured Precipitation Data" Remote Sensing 15, no. 20: 4912. https://doi.org/10.3390/rs15204912
Note that from the first issue of 2016, this journal uses article numbers instead of page numbers. See further details here.