
Carrier Phase Ranging with DTMB Signals for Urban Pedestrian Localization and GNSS Aiding

State Key Laboratory of Information Engineering in Surveying, Mapping and Remote Sensing, Wuhan University, Wuhan 430079, China
*
Author to whom correspondence should be addressed.
Remote Sens. 2023, 15(2), 423; https://doi.org/10.3390/rs15020423
Submission received: 21 December 2022
/
Revised: 7 January 2023
/
Accepted: 9 January 2023
/
Published: 10 January 2023
(This article belongs to the Special Issue Advanced Technologies for Position and Navigation under GNSS Signal Challenging or Denied Environments II)
Abstract
:China developed its Digital Television (DTV) standard in 2006, known as Digital Television Terrestrial Multimedia Broadcasting (DTMB), which employs time-domain synchronous orthogonal frequency division multiplexing (TDS-OFDM) as the modulation method. In contrast to Global Navigation Satellite Systems (GNSSs), DTV signals have higher transmitting power, wider coverage, larger bandwidth, and fixed transmitter location. This paper explores the positioning performance of DTMB signals, and the potential to improve GNSS positioning accuracy in urban environments. Specifically, a solution is proposed, and a software-defined radio receiver is developed for wireless localization. Without changing the current signal structure, the pseudorandom noise (PN) sequences in the signal are used for signal acquisition and carrier phase ranging. The carrier phase of the first arrived path is extracted by the least squares matching pursuit method. Both static and dynamic field tests were conducted to verify the proposed ranging and positioning method. Centimeter-level ranging accuracy was achieved in the static scenario, while meter-level ranging accuracy was achieved in the dynamic scenario. As one possible application, the proposed ranging method was combined with GPS pseudorange measurements to achieve higher accuracy position results in an urban pedestrian scenario, especially when there is only a limited number of visible satellites.
1. Introduction
Although the Global Navigation Satellite Systems (GNSS) can meet the requirements of most outdoor activities, it still faces severe attenuation problems in indoor areas and urban canyons [1,2]. Normally, there are two ways to make GNSS available in those challenging environments. One way is to combine GNSS with other active systems, such as vision [3], inertial navigation system (INS) [4], and LiDAR [5]. The integration between GNSS and INS will inherit the advantages of GNSS’ long-term high precision and INS’ short-term high precision at the same time [6]. The other way is with passive systems, such as pseudolite [7], and signals of opportunity (SoP) [8]. The SoP includes Wi-Fi [9,10], 4G-LTE/5G [11,12,13,14], and digital television (DTV) [15,16]. One of the main challenges in opportunistic navigation is the unknown clock biases of the user equipment (UE) and the base stations [17]. Current approaches to overcome this challenge include: (1) estimating and removing the clock bias in a post-processing fashion by using the known position of the UE [18], or (2) estimating the difference of the clock biases of the UE and each transmitter in an extended Kalman filter (EKF) framework [19].
As one possible SoP, DTV refers to the transmission of television audiovisual signals using digital encoding, in contrast to the earlier television technologies that used analog signals. DTV signal transmission power is stronger, with a carrier frequency within 300~1000 MHz, as compared to GNSS signals in L-band around 1.5 GHz; thus, DTV outperforms GNSS in terms of urban propagation, building penetration, and diffraction. The nominal signal bandwidth of a DTV signal is usually between 6~8 MHz, which means sharper correlation peaks and thus more robust in multipath environments. The DTV signals are transmitted continuously, and the transmitters are fixed in a DTV network. Therefore, the signals have no Doppler frequency shifts that are caused by the transmitters, which can lead to easier signal acquisition and the possibility of integration over a longer period. All of the aforementioned advantages make DTV signal a promising SoP for positioning.
Different positioning methods are applied to different DTV signals. In general, the DTV signals can be classified into two categories, i.e., the single-carrier system and the multi-carrier orthogonal frequency division multiplexing (OFDM) system. The Advanced Television System Committee (ATSC) system versions 1.0 and 2.0 are single-carrier systems used in North America, which use eight-level vestigial sideband modulation for terrestrial broadcasting. A location system was constructed based on the pseudorandom noise (PN) sequence and the transmitter identification watermark embedded in ATSC [20], but there is no such watermark in current Digital Television Terrestrial Multimedia Broadcasting (DTMB) signals. The synchronization signal in ATSC was also used for positioning and shown to achieve rather reliable, accurate, and rapid results [21,22]. However, the single-carrier modulation method is vulnerable to multipath fading and high-speed movement [23]. The multi-carrier OFDM modulation technology is popular in DTV standards worldwide.
Generally, there are two main methods for ranging based on OFDM signals, one is based on a sliding correlator for the coarse timing acquisition by using the property of OFDM cyclic prefix [24], and the other is based on the super-resolution method such as multiple signal classification (MUSIC) [25], and matching pursuit (MP) [26]. The accuracy of the sliding correlator method is restricted by the sampling rate and number of samples used in correlation. To achieve a finer time delay estimation, a delay-locked loop (DLL) was used in [27,28]. The super-resolution methods have better positioning accuracy, but their complexity is high, which might be unacceptable for real-time implementations. A combination of MP and DLL for the time of arrival (TOA) estimation based on European Digital Video Broadcasting Terrestrial (DVB-T) signals was given in [26], it applied MP to the frequency-domain pilots, and achieved meter-level ranging accuracy in static scenarios, and the information-theoretic lower bound of TOA tracking error is derived in [16]. However, unlike DVB-T signal, there is no pilot subcarrier in the DTMB signal.
Different from DVB-T, the DTMB adopts time-domain synchronous OFDM (TDS-OFDM) modulation technology in the multi-carrier mode. The TDS-OFDM inserts a PN sequence in front of an OFDM block to serve as the guard interval (GI) as well as the training symbol. The PN sequence brings the benefits of fast channel acquisition since this can be performed directly in the time-domain as well as high spectrum efficiency as the PN sequence can also be used for the channel estimation, avoiding both continuous and scattered pilot insertions into the frame body by the cyclic prefix OFDM approach. For positioning with DTMB signals, a time–frequency positioning scheme utilizing the PN sequence and the transmission parameter signaling (TPS) in the DTMB signals was proposed in [29], which regarded TPSs as the frequency-domain pilots. Simulation results showed that a positioning accuracy within 1 m can be achieved in single-frequency network scenarios with the time–frequency scheme. However, that method has to demodulate the signal and require the transmitters to be synchronized. Normally, there are only one or two transmitters nearby, which are insufficient to derive a position fix for the receiver by DTMB alone. On one hand, the DTMB signal was combined with other sensors to obtain position results. The DTMB signals can be combined with a pedestrian dead reckoning system [30] or smartphone camera and IMU [31], using an EKF and improved positioning accuracy. On the other hand, the DTMB can be combined with GNSS signals. A combination of DTMB with Global Positioning System (GPS) and frequency modulation (FM) signals for positioning in a weak GPS scenario was shown to afford an accuracy improvement of 20–60% in urban canyons [32]. In GNSS, the positioning accuracy is affected mainly by either the range errors or the geometry of satellites [33]. An indicator of the quality of the geometry of satellites is the dilution of precision (DOP), which only depends on the position of the satellites. One direct improvement that the DTMB can bring to the GNSS is that the DTMB signal transmitters can be regarded as pseudolites to decrease the DOP. Generally, the position estimation accuracy increases inversely with an decrease in the DOP [33].
In this paper, the urban pedestrian positioning with DTMB and GPS signals is investigated, and the DTMB signal is used to assist GPS pseudorange-based positioning to achieve higher positioning accuracy. The contributions of this paper are as follows:
- (1)
- A carrier phase based ranging algorithm for the DTMB signals is proposed, without modification of the signal structure and with no need to demodulate the received signals. Compared with time-based ranging method in [32], higher ranging accuracy was achieved.
- (2)
- A complete software-defined radio (SDR) receiver for TOA estimation is developed, which includes acquisition, tracking, and carrier phase ranging.
- (3)
- The carrier phase ranging results from DTMB signals are combined with GPS pseudorange measurements to achieve higher accuracy positioning results, especially in the vertical direction. The improvement is also investigated under different GPS observation conditions.
The paper is organized as follows. Section 2 briefly describes the DTMB signal standard and the signal model. Section 3 details the proposed ranging and positioning method. Section 4 describes the test bench used for outdoor field tests and the conduction of outdoor experiments. The corresponding experiment results are presented with discussions in Section 5. The paper is concluded with a summary in Section 6.
2. DTMB Signal Structure and Signal Model
2.1. DTMB Signal Structure
One of the key features of the DTMB signal is the hierarchical frame structure, as shown in Figure 1. From the top to the bottom, there is a calendar day frame (starting from 00:00:00 every day and ending at 24:00:00, Beijing Time), a minute frame, a super frame, and a signal frame [34]. The signal frame is the basic unit of DTMB signal and is modulated by the TDS-OFDM method in the multi-carrier mode. Specifically, a signal frame consists of a frame header and a frame body. The frame body is an inverse discrete Fourier transform (IDFT) block with 3780 subcarriers. The header is 4-quadrature amplitude modulation (4QAM) with the same in-phase and quadrature-phase components. There are two different lengths of the PN sequence in the multi-carrier mode: 945 and 420 symbols at a 7.56 MHz symbol rate. The structure of both PN sequences is the same, which is composed of a pre-amble, an m-sequence, and a post-amble.
The difference lies in the length of each part. For PN945, the structure is shown on the left side of Figure 1, where one super frame is composed of 200 signal frames. The pre-amble is the copy of the last 217 samples of the m-sequence and the post-amble is the copy of the first 217 samples of the m-sequence. The generator polynomial for the m-sequence is , with a different initial condition for each signal frame as its index. When a signal frame is not indexed, the initial condition (index 0) is D1…D9 = 111011111. The average transmission power of the frame header is doubled, as compared to the frame body in multi-carrier mode. For PN420, the structure is shown on the right side of Figure 1, where one super frame is composed of 225 signal frames. The pre-amble is the copy of the last 82 samples of the m-sequence and the post-amble is the copy of the first 83 samples of the m-sequence [34]. The generator polynomial for the m-sequence is , with a different initial condition for each signal frame as its index. When a signal frame is not indexed, the initial condition (index 0) is D1…D8 = 00001101.
2.2. Signal Model
The transmitted time-domain data is denoted by , where n means the n-th sample. The transmitted signal is affected by multipath arising from reflection, frequency offset due to the mismatch between the transmitter and receiver oscillators, and relative motion-induced Doppler frequency shift. The frequency offset can be described in terms of carrier frequency offset and sampling clock offset. Since the sampling clock offset highlighted in [28] is not a major issue in our application, only carrier frequency offset (CFO) is considered in this paper. The received data can be written as:
where is the CFO (unit in Hz), and is the sample duration. is the initial phase of the baseband signal model, and is the total number of paths. and are the complex gain and delay of the l-th path, respectively. is a complex additive white Gaussian noise (AWGN) with zero-mean and variance .
In DTMB deployments, the transmitters are purportedly synchronized to the GPS time with the absolute timing embedded in the broadcast signals. This synchronization and timing mechanism significantly facilitates navigation applications since one only needs to estimate the TOA of the received signals for the purpose of ranging as the time of transmit (TOT) can be decoded from the signal structure. In the following section, the proposed TOA estimation method is described, which can lead to higher synchronization accuracy, alone with a positioning method based on DTMB signals and aiding to GNSS signals.
3. Method
Figure 2 shows the block diagram of the proposed ranging and positioning method. It has three main stages, namely, acquisition, carrier phase ranging, and finally positioning. The acquisition part searches for PN sequences in the frame header to find the start sample of each signal frame while calculating a CFO estimate. The DLL keeps track of the PN sequences and guarantees that the right PN sequence is sent into the carrier phase ranging part. Then, the LS-MP algorithm is applied to the received PN sequence after CFO compensation together with the local generated PN sequences, and only the first path is extracted for carrier phase ranging. Finally, DTMB-based positioning is performed if there are more than three measurements. Otherwise, DTMB measurements can be combined with GNSS pseudoranges to improve positioning accuracy. The method is detailed below.
3.1. Acquisition
The received baseband signal is first sent to correlation block to find the start sample of each super frame. Since the PN sequences are known to the receiver, the first out of the total PN sequences (e.g., = 5 over 3.125 ms in PN945 mode) can be used to form a local template with the frame body (the OFDM block) replaced by zeros. The received signal is cross-correlated with the local template, and the start sample at which the maximum correlation is achieved, denoted by , is taken as an estimate of the start location of one super frame:
where is the correlation lag as a search variable, is the number of samples in one super frame, and is the number of samples of the local template used in the correlation. The superscript * stands for complex conjugate, and takes the magnitude of a complex number.
After the start sample of a super frame is found, all the PN sequences in the whole super frame are used to estimate the CFO with the coherent auto frequency control (cAFC) method. In the cAFC method, the received PN sequences are correlated with their complex conjugated local replicas to produce (both multipath effect and noise terms are ignored when calculating CFO):
where m is the index of signal frame, is the length of the PN sequence, and is the length of the signal frame, where is the length of the frame body. Making cross-correlation between and , gives
and the CFO can be calculated as , where takes the argument of a complex number. The received signal samples are then corrected with the CFO estimates in CFO compensation block through
where is the received data after CFO compensation. Note that the estimate (5) provides an ambiguity-free estimate when CFO is with the range Hz for the case = 4725 (PN945 mode) and T = 1/(7.56 × , which is usually enough for a receiver with an oscillator stability better than 100 ppm (part per million). The PN generator block generates the corresponding local PN template according to the PN index derived from the PN correlation block. Since there often exists oscillators mismatch between the receiver and the transmitter, which may cause a sample shift at the receive side. On the one hand, the locally generated PN sequence and the received PN sequence are sent into the DLL to keep track of the received signal, which is implied in the frequency-domain by taking advantage of the time shift property of the Fourier transform [26]. On the other hand, the locally generated PN sequence and the received PN sequence are sent into LS-MP block for carrier phase ranging, which is implied in the time-domain.
3.2. Carrier Phase Ranging
In urban mobile scenarios, radio signals are subject to multipath and experience fading, sometimes very severe. As a result, we need to detect all multipath components and focus only on the first path to improve the timing accuracy for ranging and positioning applications. The LS-MP block operates on the received PN sequences, and only the first path is utilized. The extracted carrier phase of the first path is used for carrier phase-based ranging, and ultimately positioning.
3.2.1. Multipath Acquisition
The multipath estimation problem can be formulated to find () that minimizes the errors between the received signal and the replica
where is the Euclidean norm. There are two dominant methods to solve Equation (6). One is the synthesis method, while the other one is the analysis method [35]. We adopt the order-recursive LS-MP method which belongs to the second method, and previously shown to be effective in simultaneously estimate the delays and complex channel coefficients for European DVB-T signals [26]. Unlike [26], the order-recursive LS-MP algorithm is applied to the time-domain received PN sequence directly in this paper and there is no super-resolution procedure needed, which reduces the complex of the algorithm. In time-domain, after CFO compensation and ignore the initial phase, Equation (1) becomes
Supposing the channel is quasi-stationary during one signal frame (0.625 ms), and the channel can be written as
where K is the maximum sample delay that the multipath component can reach, and the superscript T means transposition. Note that, only L elements in are non-zero, which corresponds to () in Equation (7). Moreover, the path delay can be replaced by the continuous integer sample delay. Thus, Equation (7) can be written in a matrix-vector format as:
Note that in most situations, is sparse [26]. The principle of MP is to utilize the sparseness of and aims to find the lowest dimensional linear combination of delayed versions of the transmitted symbol sequences to represent the received signal. Due to the unknown order of , the order-recursive LS-MP algorithm is adapted to solve the problem of multipath acquisition.
A solution can be viewed as the coefficient vector associated with the representation of in terms of the column of . To apply the order-recursive LS-MP method, we assume that after the (q − 1)-th iteration, the set of the identified columns is , with each element in means a corresponding column in , and the corresponding column index are . The associated coefficient vector is obtained using the LS method, i.e.,
where
and the superscript means Hermitian transpose. The associated residual vector can be calculated as
At the q-th iteration, the algorithm finds a new column out of the set of remaining columns in , denoted by , where the column is selected according to
With the new column selected, the , , and are updated as
The iteration stops when no more path satisfying are detected in the searching region, where is a threshold. Compared with the basic MP algorithm, which picks the new column onto which the rank-one projection of the residual vector is maximized, the order-recursive LS-MP algorithm finds the new column which, together with all the previously selected columns, represents the received signal with the minimum squared residual error. As a result, the selected columns span a subspace onto which the projection of the received signal is maximized.
If there are multiple paths detected in the LS-MP algorithm, the first path is determined as the path with the smallest delay. The phase information in the complex-valued path coefficient will be used for carrier phase ranging, where is the estimated value of the first path’s coefficient.
3.2.2. Carrier Phase Ranging
The phase variation between the (m-1)-th and the m-th signal frame can be scaled into the displacement of the receiver relative to the transmitter (relative range) over a signal frame as
where is the carrier phase of the m-th signal frame, and is the carrier wavelength. The use of Equation (15) faces a potential phase ambiguity if the distance moved between two signal frames exceeds one wavelength. This ambiguity occurred only when the moving speed is larger than 480 m/s for a carrier frequency smaller than 1000 MHz in PN 945 mode, thus not an issue in pedestrian scenarios.
3.3. DTMB-Based Navigation, Positioning, and GNSS Aiding
When there are more than three transmitters around, the ranging results can be used for 3-D positioning based only on DTMB signals. While there are only 1 or 2 DTMB transmitters nearby, the ranging results can be used to aid GNSS to improve positioning accuracy. Navigation starts from a known location and keeps track of subsequent movements. Given the initial position, the initial distance between the transmitter and receiver g0 can be calculated. From that moment on, the geometric distance between the receiver and the transmitter can be accumulated for every signal frame, and the distances to more than three transmitters allow for absolute positioning in navigation.
The distance between the transmitter and receiver can also be calculated from the time of flight, which is the difference between the TOA measured at the receiver and the TOT decoded from the absolute timing embedded in each signal frame, scaled by the speed of light. The geometric distance between the receiver and the DTMB transmitter at every epoch can be written as:
where and are the position of the DTMB transmitter and the receiver, respectively. q means the time epoch, and is a timing error that accounts for the clock bias between the DTMB transmitter and the receiver. Different from GNSS satellites at 20,000 km altitude, the DTMB transmitters are fixed on the Earth. Therefore, DTMB signals do not experience ionospheric and tropospheric delay errors. The timing error is related to the oscillator mismatch, which can remain relatively stable for hours according to our experiments and can be calibrated. The calibration of for each DTV station can be made when stationary at a known position, which can be repeated for each test. Such calibrated results are used for the experiments presented below. The receiver position can be solved when there are more than three DTMB transmitters.
When there are only one or two DTMB transmitters nearby, the carrier phase ranging results from DTMB signals can be combined with GNSS pseudorange measurements to improve the single-point positioning (SPP) accuracy. In GNSS, the SPP derives the receiver’s position through trilateration with the help of pseudoranges and satellite positions. The pseudorange between the receiver and a satellite is expressed as:
where is the pseudorange between the receiver and the i-th satellite at the q-th epoch, is the position of the i-th satellite at the q-th epoch, and is the receiver clock offset (unit in m) at the q-th epoch. In Equation (17), there are four unknown parameters, i.e., , , , and at each epoch, at least four pseudorange measurements are needed to obtain a SPP solution. The iterative reweighted least squares (IRLS) method as used in RTKLIB, an open-source program package available in [36], can be applied to find the position solutions.
When the number of GNSS satellites is less than four, which often occurs in urban environments, each DTMB transmitter can be regarded as a pseudolite, and by combining Equations (16) and (17), extra observations provided by DTMB are made available to enable SPP. Besides, the position accuracy can be improved with the help of DTMB signals. Since the DTMB transmitters are fixed on the ground, they have a lower altitude as compared with GNSS satellites. Thus, the introduction of DTMB transmitters can improve the vertical positioning accuracy of SPP in terms of vertical DOP (VDOP) [37] in a favorable condition for GNSS, and in terms of the position DOP (PDOP) [38] in a difficult condition for GNSS, as shown later in the test results.
4. Test Equipment and Experiment Setup
Field tests were conducted to evaluate the proposed ranging and positioning algorithm using in-the-air signals in both static and dynamic scenarios in both Wuhan and Luoyang, China. Field tests in Luoyang was conducted on the rooftop of the teaching building of the Civil Aviation Flight University of China (Luoyang College), and the walking trajectory is shown on the left side of Figure 3. Three channels can be received at this place, and the details are shown in Table 1. Field tests were also conducted in Wuhan. Static tests took place on the roof of the Xinghu building at Wuhan University. Five frequency channels can be received at this place, and the details are shown in Table 1.
Dynamic tests were conducted in Lianhua Lake Park along a closed loop route, traced in yellow on the right side of Figure 3. For each static test, 60 s data was collected. For each dynamic test, the trajectory was walked twice under each channel with one clockwise and one counter-clockwise. The test data collected in Lianhua Lake park, Wuhan, were also used to verify the proposed DTMB-assisted GNSS positioning method. The surroundings of this walking route are shown in Figure 4, which includes two pavilions, a big one on the east side and a small one on the north side, and a stone wall on the southwest side, which may cause a multipath as we walk by. As shown in Figure 4, the starting point of the clockwise tour is near the brown point with a clear sky view, while the start point of the counter-clockwise tour is at the red point near the big pavilion. Due to the signal block and attenuation, only channel 26 can be received at this location.
A portable SDR test bench was built for data collection. As shown in Figure 5, it has two major parts:
(1) DTMB data collection. It consists of a consumer-grade DTMB active antenna, a Universal Software Radio Peripheral (USRP) X310 driven by a clock distribution accessory CDA-2990 to simultaneously down-mix and synchronously sample DTMB signals at 10 Msps, a laptop (Thinkpad p15v) to control the sampling and record data through the USRP hardware driver, and a GNSS antenna to synchronize CDA-2990 with GPS time to provide USRP with accurate external frequency reference (1 pps and 10 MHz).
(2) GNSS data collection. It consists of a GNSS antenna, a u-blox evaluation kit (EVK-M8U), which is used to provide the reference trajectory for accuracy evaluation, and a laptop (DELL xps13) to control the operation and store the data.
A custom-made battery set is used to power USRP while a 220 V portable power bank is used to power the CDA-2990. The EVK-M8U is an evaluation kit from u-blox that contains a M8 GPS receiver, and on-board IMU, which is capable of 3D untethered dead reckoning (UDR) [40]. The GNSS and IMU data collected by EVK-M8U were processed by the u-center software offline to generate the reference trajectory in the UDR navigation mode [41].
In our tests, the GPS pseudorange data from the u-blox evaluation kit, and the broadcast ephemeris download from the Crustal Dynamics Data Information System (CDDIS) [42] are combined with DTMB ranging measurements to derive an improved position solution to demonstrate the benefits of DTMB-aiding of GNSS, as described next.
5. Experimental Results and Discussion
The complex raw DTMB signal samples at 10 MHz are first resampled to the symbol rate of 7.56 MHz for further processing. Only the m-sequence portion of a signal frame is sent to the DLL and the LS-MP block, because the full m-sequence is preserved in the signal even in the presence of a large initial timing error and multipath thanks to the pre-amble and post-amble, which make the m-sequence periodic in the frame header.
5.1. Acquisition
In the following tests, the first five PN sequences () are used to construct the local template. The correlation results between the received signal and the local template of the center frequencies at channels 26 and 48 are shown in Figure 6a and Figure 6b, respectively, as an example of PN945 and PN420 mode, where the highest peak indicates the start sample of a super frame. Except for the highest peak, three to four levels of correlation peaks exist. Observation of different PN sequences reveals that the PN sequences with even numbers are different from those with odd numbers. For PN945 mode, the odd number in 0~100, the latter PN sequence is a right-shift version of the former one. As for the even number in 0~100, the latter PN sequence is a left-shift version of the former sequence. The second PN sequence is a left-shift version of the first PN sequence. The PN sequences in NO.101~199, are in symmetry to those in NO.0~100, that is PN sequence with NO.99 and NO.101 are identical, PN sequence with NO.98 is identical with NO.102 and so on. Since is used in the acquisition stage, there will be four levels of correlation peak other than the highest peak: (1) time epochs when the first, the third, and the fifth PN sequence in the local template match the received signal, leading to a magnitude of 3/5 of the highest peak; (2) time epochs when the second, and the fourth PN sequence in the local template match the received signal, leading to a magnitude of 2/5 of the highest peak; (3) time epochs when only one PN sequence in the local template matches the received signal, leading to a magnitude of 1/5 of the highest peak; (4) there are no matches between the received signal and the local template, leading to noise in the correlation results. Thus, there should be five levels of correlation peak in Figure 6. The same explanation holds for PN420, too.
Since the receiver antenna was on the roof of a tall building, the DTMB signals were clearly detected without obvious multipath components. Supposing the transmitters have the same transmitting power, the receiving power of the farther-away channel 48 was smaller than that of the close-by channel 26 signal. Once acquired, the DLL is used to keep track of the m-sequences and the m-sequences are extracted for carrier phase ranging.
5.2. Carrier Phase Ranging
In our tests, K = 10 was used in Equation (9), and the search region was expanded to [−10, 10] samples to guarantee that the first path falls into this region. In addition, the threshold value was taken as , which means the multipath component should at least have a magnitude of 0.1 of the first path.
5.2.1. Static Scenario
Figure 7 shows the results of multipath acquisition using the LS-MP algorithm in the form of a heat map representing the magnitude of the normalized channel impulse response (CIR) at the corresponding time epoch. Only the first (marked as the red dot) and the second (indicated by the green dot, which means a second path was detected at that epoch) path are depicted in Figure 7. Except for channel 24+2, the first path is always detected at zero for other data, which means the DLL tracked the m-sequences well. For channel 24+2, there exists fluctuations in the detected first path around 16 s, which means the DLL did not work well around those epochs. This is because transmitter Luoyang is located downtown, where there are many tall buildings which may reflect the transmitted signal, and the multipath component dominate at those epochs. Since the DLL used here always track the strongest path, causing that the wrong PN sequence is sent into the LS-MP block at those epochs. When the channel became stable and the direct path dominate again, the DLL tracked on the direct path and the detected first path went back to zero.
There is no second path detected in channel 17, 21, and 48, which means the receiving condition is quite clear and the channel is stable. For other channels, the second path was detected from time to time because of the variation of the channel. Because the resolution of LS-MP is only one sample, the multipath acquisition results may be different from the CIR results, i.e., the second path was not detected at the bright location of the CIR.
Through the LS-MP algorithm, we can also obtain carrier phase-based relative ranges from the detected first path, and the results are shown in Figure 8, where the output rate of the carrier phase ranging is 1600 Hz. There is clock drift in the original results, resulting bias in the carrier phase results, even when the receiver is stationary. For static tests, this bias can be removed by moving the mean value of the ranging results. For dynamic tests, there was a standstill for about 5 s at the beginning of each test to calibrate this bias. The results in Figure 8 are the ranging results after calibration. All the data collected in Luoyang achieved submeter-level ranging accuracy. However, there is a fluctuation around 16 s for channel 24+2, which was caused by the multipath effect. As shown in Figure 7c, the multipath component was regarded as the first path at those time epochs. In addition, there are also variations of the CIR around 54 s in Figure 7c, where the strongest part of CIR showed up at around 60 m, but the LS-MP algorithm still find the first path at zero, causing the small fluctuation in the carrier phase ranging results of channel 24+2 in Figure 8a.
For the data collected in Wuhan, the channel was accurately tracked and the first path was clearly detected. Thus, there are no such sudden fluctuations in Figure 8b. In addition, low-frequency time-correlated fluctuations are observed in the carrier phase ranging results. On one hand, these low-frequency fluctuations may be caused by the clock instability between the receiver and the transmitter. The slow varying oscillation is on the order of one minute per cycle, indicating long-term clock instability. On the other hand, this instability may be enlarged by the distance between the receiver and the transmitter, as the two farthest transmitters, i.e., Channel 17 and Channel 33, showed the biggest fluctuation.
The mean and the standard deviation of the carrier phase ranging results are given in Table 2. Except channel 17, the carrier phase ranging method achieved submeter-level ranging accuracy in all the other channels in static scenario.
5.2.2. Dynamic Scenario
Receiving conditions are more complicated in dynamic scenarios where radio channels are more volatile. The carrier phase-based relative ranging results are averaged into one value every 1600 values so as to match the output rate of the reference at 1 Hz. The carrier phase ranging results are shown in Figure 9 as the solid lines while the reference is shown in the dotted lines. Since the data were collected separately, the duration of each test is different. The proposed carrier phase ranging results match the reference walking trajectory effectively, because only the first path is extracted, which gets rid of most of the influence of the multipath components. Even the details of right-angle corners of each trajectory were depicted in the ranging results. However, large deviations occurred for channel 21, which we believe is because this transmitter is far from the test location and the transmitting power is low (Xinan is a transmitter for small city).
The corresponding error cumulative distribution function (CDF) is plotted in Figure 10, where the maximum ranging error is below 2.2 m for channel 24+2, 26, and 31. A large error occurred in channel 21 because of the deviation in 20~60 s in Figure 9a, and 40~80 s in Figure 9b. The reason for the large error in this channel was discussed before.
The ranging results can be used for standalone positioning and navigation when there is a sufficient number of independent measurements and/or to improve the positioning performance of GNSS SPP. The GNSS observation data were collected together with the DTMB data (channel 26) in Lianhua Lake park, Wuhan, to verify the improvement that DTMB can bring to the GNSS SPP.
5.3. DTMB Assisted GNSS SPP: Favorable Condition for GNSS
The GPS signal was collected in this paper as an example to show the positioning accuracy improvement that the DTMB can make to assist GNSS. For other GNSS constellations, the proposed positioning method can be easily applied without modification. The data output from GPS and u-blox are GPS timestamped, while the data output from USRP is UTC timestamped, so they can be easily aligned. At the beginning of each dynamic test, there was a standstill period of about 10 s for GPS to obtain its initial position, which is then used to find the initial geometric distance between the receiver and the DTMB transmitter. Since the GPS pseudorange observation output rate from u-blox is 1 Hz, the rate of SPP is 1 Hz as well. Only the satellites with an elevation bigger than 15° are used for positioning, and the number of visible satellites is shown in Figure 11. There are at least four satellites during the dynamic tests, and there are more than five satellites in 90% of the test epochs. Thus, the GPS can always derive SPP results. In addition, there are more visible satellites in the clockwise test than the counter-clockwise test. Even in this favorable condition for GPS, the DTMB carrier phase ranging can improve the GPS position accuracy.
The corresponding error time series are shown in Figure 12. For the clockwise walking test, the mean position errors decreased from 4.54 m to 3.85 m with the help of DTMB signals. For the counter-clockwise walking test, the mean position errors decreased from 6.02 m to 4.15 m. Since the start point of the counter-clockwise test was near the big pavilion, the GPS signal that came from the south side was attenuated, the initial signal receiving condition was poorer than the clockwise test, and there is one satellite less in the counter-clockwise test. Thus, the position error is larger than the clockwise one. In addition, there are large errors occurred at the end of the counter-clockwise test as we walked in the big pavilion and stopped. Consequently, the DTMB-assisted SPP offered larger improvement in the counter-clockwise test than the clockwise test.
The DTMB-assisted SPP results shown above are in the Earth-centered, Earth-fixed (ECEF) coordinate system. To quantify the improvement contributed by the DTMB signals, the position results are transformed into the local Cartesian coordinate system, i.e., the east-north-up (ENU) frame, and the start point is chosen as the origin point of the ENU frame. The position errors in the ENU frame after the average values removal are shown in Figure 13, along with the 95th percentile uncertainty ellipsoids. With the help of DTMB signals, the position errors decreased, more significantly in the vertical direction. Additionally, note that upon fusing the DTMB carrier phase ranging measurements with GPS pseudoranges, the volume of the combined navigation solution uncertainty ellipsoid is reduced to 78% and 42% of its original size in the clockwise and the counter-clockwise test, respectively.
Furthermore, the absolute position errors in terms of different directions in the ENU frame are shown in Figure 14, which is consistent with the observations in Figure 13. There is a little improvement in the east direction for both tests, and in the north direction for the counter-clockwise test. A significant improvement in the up direction for both tests, especially in the counter-clockwise walking test. Since the GPS position errors are larger in the counter-clockwise test, the DTMB-assisted GPS SPP improved more in the counter-clockwise test.
The VDOP results are shown in Figure 15, where a reduction can be observed in both tests with the help of DTMB signals. The fluctuations in VDOP results are related to the variation of the number of visible satellites. In addition, the mean value decreased from 0.99 to 0.98 in the clockwise test, and from 1.69 to 1.64 in the counter-clockwise test. This explains why larger improvements occurred in the vertical direction, since a smaller VDOP means a higher vertical positioning accuracy. Moreover, the VDOP is smaller in the clockwise test because there are more visible satellites in the clockwise test than the counter-clockwise test. Thus, the DTMB-assisted GPS SPP achieved higher VDOP improvement in the counter-clockwise test compared with the clockwise test.
As for the horizontal position accuracy, the satellite skyplots of both tests are shown in Figure 16, where the high elevation satellites are mostly in the north direction. Since the DTMB transmitter is also in the north direction of the test site, the introduction of DTMB transmitter did not improve much of the HDOP. That is why there is no obvious improvement in the north and east directions in Figure 13 and Figure 14.
5.4. DTMB Assisted GNSS SPP: Difficult Condition for GNSS
The receiving condition for GNSS is usually poor in urban environments because of the signal block caused by tall buildings, which leads to limited number of visible satellites. To find out the performance of the proposed DTMB-assisted GPS SPP in such a difficult condition, two scenarios are simulated. The first one is when only four satellites are visible, where GPS can do SPP by itself. The other one is when only three satellites are visible, where GPS cannot do SPP alone but can derive position results with the help of DTMB.
5.4.1. Four Visible Satellites
For the first scenario, at each epoch, the four satellites that with the highest elevation are chosen for SPP, and the PRN of the used satellites at each epoch are shown in Figure 17, where satellites with PRN 6, 17, 19, 28 are frequently selected because of the high elevation, while satellites with PRN 2 and 3 are selected from time to time when there is no pseudorange observation output from the high elevated satellites at that epoch due to the unlock or multipath effect or signal attenuation.
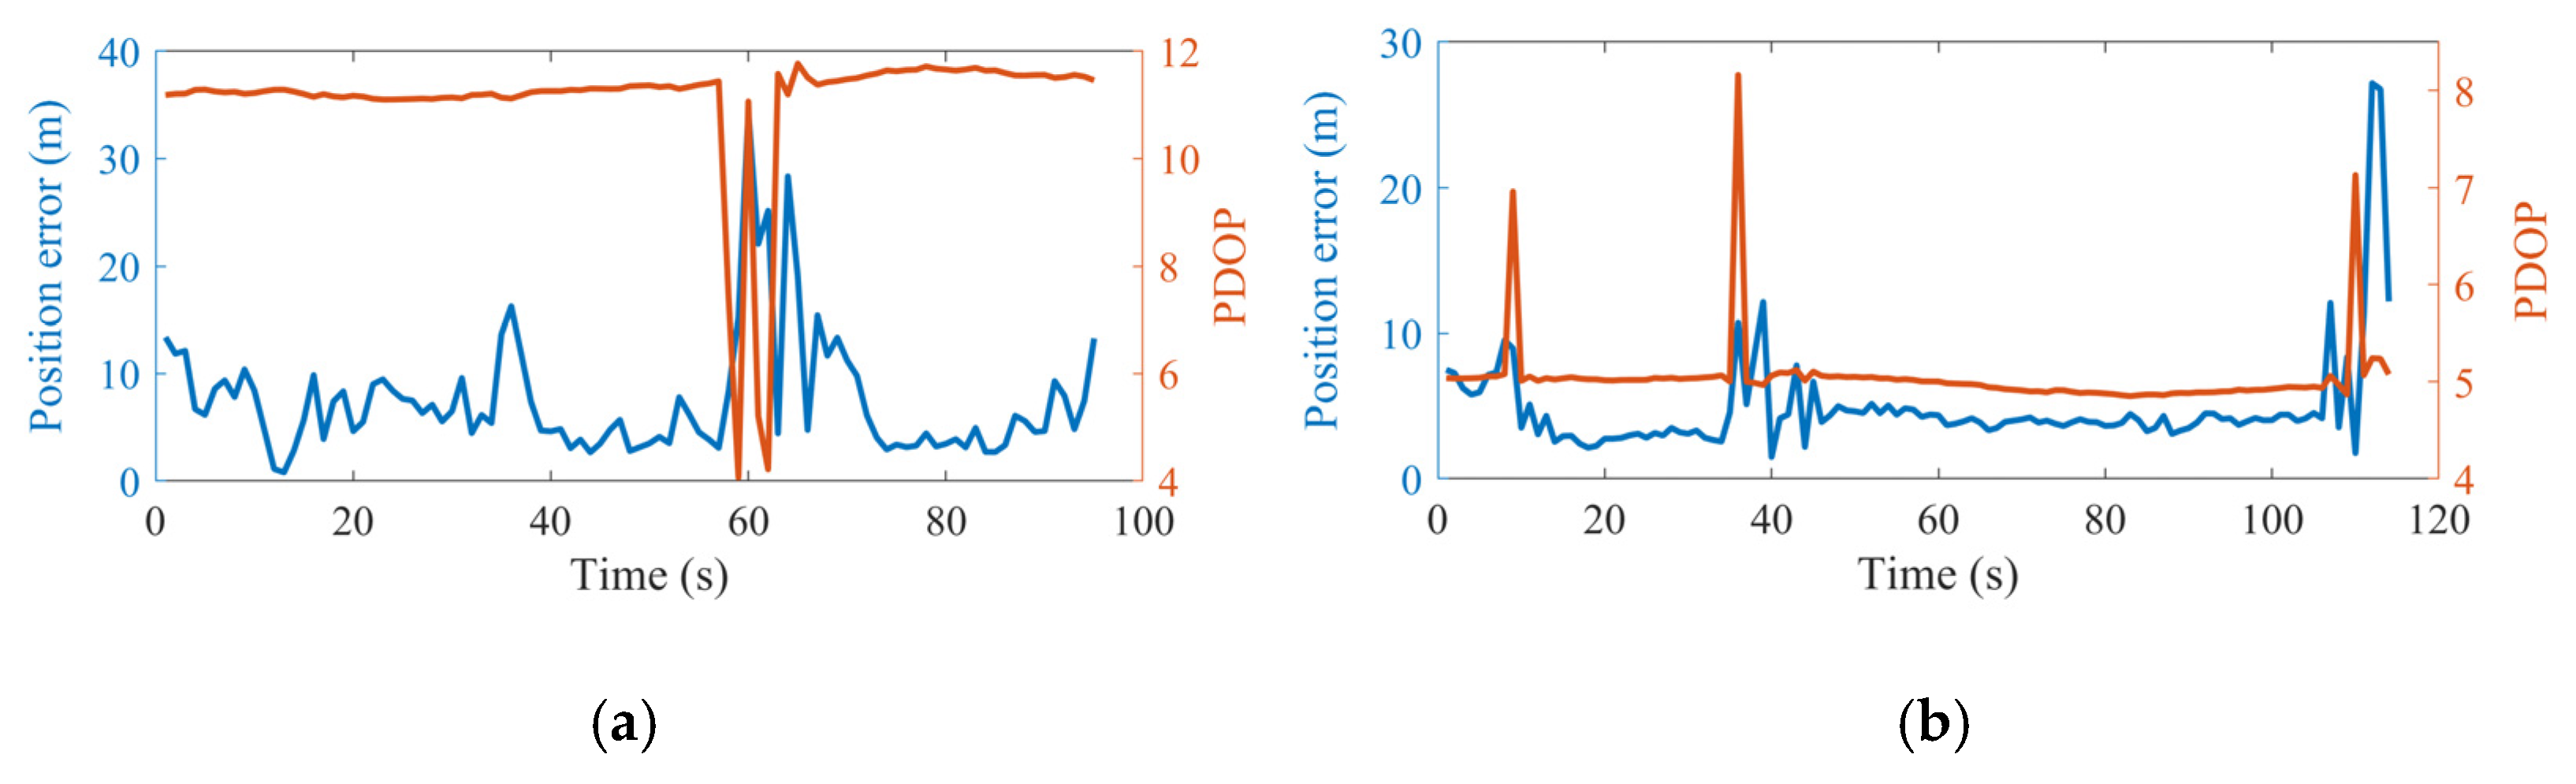
The corresponding error time series are shown in Figure 18, where there is a significant error decrease with the help of DTMB signals. For the clockwise test, the mean position errors decreased from 25.58 m to 6.75 m. For the counter-clockwise test, the mean position errors decreased from 22.34 m to 4.49 m. In addition, large errors occurred at around 60 s in the clockwise test, and 40 s in the counter-clockwise test, which is because of the switch of the visible satellites. Since there is no redundant observation in GPS SPP under such conditions, the position error is tens of meters. However, the position error decreased to several meters with the help of the DTMB transmitter. This is because the GPS satellites are all with high elevation, leading to large PDOP values, and the introduction of DTMB transmitter can decrease PDOP, the corresponding PDOP results are shown in Figure 19. The PDOP decreased from 34.65 to 3.78 in the clockwise test, and from 21.86 to 4.83 in the counter-clockwise test. The variation in PDOP results is because of the variation of the satellites selected for SPP. When a satellite with higher elevation is replaced by a satellite with lower elevation, the volume of the polyhedron that the satellites conducted is larger, which leads to smaller PDOP results. Since a large decrease is achieved in the PDOP results with the help of DTMB signals, the position accuracy should be improvement in every direction.
The position error in terms of different axes in ENU frame are shown in Figure 20, where improvements occurred in every direction, especially in the up direction with the help of DTMB signals. Since the elevation of most GPS satellites used in this scenario are larger than 45°, the vertical position accuracy is poor, resulting in large position errors in the up direction in Figure 20, which is about 20 m. However, with the help of DTMB ranging results, meter level position accuracy was also achieved in the up direction, which is in the same level compared with the horizontal directions.
The position errors in the ENU frame after the average values are removed are shown in Figure 21, alone with the 95th percentile uncertainty ellipsoids. In such a difficult condition for GPS, with the help of DTMB signals, the position errors decreased more significantly than the favorable condition mentioned in Section 5.3, and still, more significantly in the vertical direction. Additionally, note that upon fusing the DTMB carrier phase ranging measurements with GPS pseudoranges, the volume of the combined navigation solution uncertainty ellipsoid is reduced to 41% and 7% of its original size in clockwise and counter-clockwise test, respectively. A significant improvement is achieved in the counter-clockwise test, since there are large position errors occurred in the up direction in this test when only GPS is used.
5.4.2. Three Visible Satellites
For the second scenario, at each epoch, only three satellites with the highest elevation are chosen for SPP, and the satellites used at each epoch are shown in Figure 22. Satellites with PRN 6, 17, and 19 are frequently chosen in the clockwise test, while the satellites with PRN 6, 17, and 28 are frequently chosen in the counter-clockwise test. With the help of DTMB ranging results, the SPP results can be derived, and the corresponding position error and PDOP are given in Figure 23. Meter-level position accuracy was achieved in both tests, and the mean position errors are 7.52 m and 4.93 m in the clockwise test and the counter-clockwise test, respectively. The mean PDOP are 11.09 and 5.05 in the clockwise test and the counter-clockwise test, respectively. For the clockwise test, the selected satellites are all in the north direction (see Figure 16), while for the counter-clockwise test, two of the selected satellites are in the north direction while the other one is in the south direction. Thus, the geometrical distribution of satellites is better in the counter-clockwise test than the clockwise test, which leads to smaller PDOP values and higher position accuracy in the counter-clockwise test than the clockwise test. In addition, the variation of the selected satellites in the clockwise test enlarges the volume of the polyhedron that the satellites conducted (see Figure 16), leading to smaller PDOP. On the contrary, the variation of the selected satellites in the counter-clockwise test reduces the volume of the polyhedron, leading to a larger PDOP.
Compared with the favorable condition for GPS, the DTMB signals can offer more help in such a difficult condition. When the number of visible satellites is four, the DTMB signals can provide redundant measurements, and achieve meter-level position accuracy in every direction. When the number of visible satellites is three, the DTMB signals can help GPS to do SPP and obtain meter-level position results as well.
6. Conclusions
In this paper, a carrier phase ranging method is proposed based on DTMB signals for the application of positioning. The DLL is used to track the m-sequences and keeps the tracking error within half sample. The LS-MP algorithm is applied to the time-domain received m-sequence for multipath parameter extraction including path coefficient and path delay. With the extracted first arrived path from LS-MP algorithm, the carrier phase is utilized for accurate TOA estimation. Except for the PN sequences, no other prior knowledge is required, and there is no modification of the structure of the received DTMB signal. The proposed method was evaluated in practical field tests. The proposed carrier phase ranging method achieved higher ranging accuracy, where centimeter-level ranging accuracy (1) was achieved in the static scenario and meter-level ranging accuracy in the dynamic scenario. In addition, the proposed ranging method was combined with GPS pseudoranges to get SPP results. The performance was evaluated under different GPS conditions in terms of the number of visible satellites. Higher position accuracy was achieved in the dynamic scenario with the help of DTMB signals. The smaller the number of visible satellites is, the higher position accuracy improvement can be made with the help of DTMB signals. The mean position error of the proposed DTMB-assisted GPS SPP is 4.0 m, and 5.62 m when the number of visible satellites is bigger than 4, and equal to 4, respectively. When the number of visible satellites is three, the GPS cannot achieve SPP by itself, but can achieve a mean position error of 6.23 m with the help of DTMB signals.
The field tests were basically conducted in a LOS environment, and only a GPS signal was used. So, in the future, we will expand our research in a more complicated environment and will apply our method to other GNSS constellations such as the Chinese BeiDou Navigation Satellite System. In addition, the initial distance between the receiver and the transmitter were derived from GNSS in this paper. Since the DTMB signal is aligned with the GNSS time, this initial distance may be extracted by DTMB signal alone in the future.
Author Contributions
Conceptualization, L.C.; methodology, Z.J. and X.Z.; data curation, Z.J. and X.L.; writing—original draft preparation, Z.J.; writing—review and editing, L.C., Z.L., Y.Z. and G.G. All authors have read and agreed to the published version of the manuscript.
Funding
This work was supported in part by the National Natural Science Foundation of China under grant number 42171417, the Key Research and Development Program of Hubei Province under grant number 2021BAA166, the Special Fund of Hubei Luojia Laboratory under grant number 220100008, and the Central Guided Local Science and Technology Development Special Project under grant number 20222ZDH04090.
Data Availability Statement
Not applicable.
Acknowledgments
The authors would like to express their sincere gratitude to Chun Yang of QuNav company for his elaborate suggestions and reviews.
Conflicts of Interest
The authors declare no conflict of interest.
References
- Yao, H.; Dai, Z.; Chen, W.; Xie, T.; Zhu, X. GNSS Urban Positioning with Vision-Aided NLOS Identification. Remote Sens. 2022, 14, 5493. [Google Scholar] [CrossRef]
- Lu, X.; Chen, L.; Shen, N.; Wang, L.; Jiao, Z.; Chen, R. Decoding PPP Corrections From BDS B2b Signals Using a Software-Defined Receiver: An Initial Performance Evaluation. IEEE Sens. J. 2021, 21, 7871–7883. [Google Scholar] [CrossRef]
- Cao, S.; Lu, X.; Shen, S. GVINS: Tightly Coupled GNSS–Visual–Inertial Fusion for Smooth and Consistent State Estimation. IEEE Trans. Robot. 2022, 38, 2004–2021. [Google Scholar] [CrossRef]
- Li, T.; Zhang, H.; Gao, Z.; Chen, Q.; Niu, X. High-Accuracy Positioning in Urban Environments Using Single-Frequency Multi-GNSS RTK/MEMS-IMU Integration. Remote Sens. 2018, 10, 205. [Google Scholar] [CrossRef] [Green Version]
- Wen, W.W.; Hsu, L.T. 3D LiDAR Aided GNSS NLOS Mitigation in Urban Canyons. IEEE Trans. Intell. Transp. Syst. 2022, 23, 18224–18236. [Google Scholar] [CrossRef]
- Xu, Q.; Lv, J.; Gao, Z. Evaluation on Low-cost GNSS/IMU/Vision Integration System in GNSS-denied Environments. In Proceedings of the 2022 IEEE 12th International Conference on Indoor Positioning and Indoor Navigation (IPIN), Beijing, China, 5–8 September 2022; pp. 1–6. [Google Scholar]
- Liu, J.; Zhao, X.L.; Cai, B.G.; Wang, J. Pseudolite Constellation Optimization for Seamless Train Positioning in GNSS-Challenged Railway Stations. IEEE Trans. Intell. Transp. Syst. 2022, 23, 13636–13654. [Google Scholar] [CrossRef]
- Bai, L.; Sun, C.; Dempster, A.G.; Zhao, H.; Cheong, J.W.; Feng, W. GNSS-5G Hybrid Positioning Based on Multi-Rate Measurements Fusion and Proactive Measurement Uncertainty Prediction. IEEE Trans. Instrum. Meas. 2022, 71, 8501415. [Google Scholar] [CrossRef]
- Yu, Y.; Chen, R.; Chen, L.; Xu, S.; Li, W.; Wu, Y.; Zhou, H. Precise 3-D Indoor Localization Based on Wi-Fi FTM and Built-In Sensors. IEEE Internet Things J. 2020, 7, 11753–11765. [Google Scholar] [CrossRef]
- Wan, Q.; Duan, X.; Yu, Y.; Chen, R.; Chen, L. Self-Calibrated Multi-Floor Localization Based on Wi-Fi Ranging/Crowdsourced Fingerprinting and Low-Cost Sensors. Remote Sens. 2022, 14, 5376. [Google Scholar] [CrossRef]
- Shamaei, K.; Kassas, Z.M. LTE receiver design and multipath analysis for navigation in urban environments. Navigation 2018, 65, 655–675. [Google Scholar] [CrossRef]
- Chen, L.; Zhou, X.; Chen, F.; Yang, L.L.; Chen, R. Carrier Phase Ranging for Indoor Positioning With 5G NR Signals. IEEE Internet Things J. 2022, 9, 10908–10919. [Google Scholar] [CrossRef]
- Liu, Z.; Chen, L.; Zhou, X.; Ruan, Y.; Jiao, Z.; Chen, R. A Precise Ranging with Subcarrier Diversity for 5g NR Indoor Positioning. Int. Arch. Photogramm. Remote Sens. Spat. Inf. Sci. 2022, 46, 125–131. [Google Scholar] [CrossRef]
- Liu, Z.; Chen, L.; Zhou, X.; Jiao, Z.; Guo, G.; Chen, R. Machine Learning for Time-of-Arrival Estimation with 5G Signals in Indoor Positioning. IEEE Internet Things J. 2023. [Google Scholar] [CrossRef]
- Chen, L.; Yang, L.L.; Yan, J.; Chen, R. Joint Wireless Positioning and Emitter Identification in DVB-T Single Frequency Networks. IEEE Trans. Broadcast. 2017, 63, 577–582. [Google Scholar] [CrossRef] [Green Version]
- Chen, L.; Thevenon, P.; Seco-Granados, G.; Julien, O.; Kuusniemi, H. Analysis on the TOA Tracking With DVB-T Signals for Positioning. IEEE Trans. Broadcast. 2016, 62, 957–961. [Google Scholar] [CrossRef]
- Shamaei, K.; Kassas, Z.M. A Joint TOA and DOA Acquisition and Tracking Approach for Positioning With LTE Signals. IEEE Trans. Signal Process. 2021, 69, 2689–2705. [Google Scholar] [CrossRef]
- Driusso, M.; Babich, F.; Knutti, F.; Sabathy, M.; Marshall, C. Estimation and tracking of LTE signals time of arrival in a mobile multipath environment. In Proceedings of the 2015 9th International Symposium on Image and Signal Processing and Analysis (ISPA), Zagreb, Croatia, 7–9 September 2015; pp. 276–281. [Google Scholar]
- Shamaei, K.; Khalife, J.; Kassas, Z.M. Exploiting LTE Signals for Navigation: Theory to Implementation. IEEE Trans. Wirel. Commun. 2018, 17, 2173–2189. [Google Scholar] [CrossRef] [Green Version]
- Xianbin, W.; Wu, Y.; Caron, B. Transmitter identification using embedded pseudo random sequences. IEEE Trans. Broadcast. 2004, 50, 244–252. [Google Scholar]
- Cui, Z.; Huang, Y.; Wang, Y.E. High Accuracy Range Estimation for ATSC DTV Signal Based Positioning System. In Proceedings of the 2018 IEEE International Symposium on Antennas and Propagation, USNC/URSI National Radio Science Meeting, Boston, MA, USA, 8–13 July 2018; pp. 85–86. [Google Scholar]
- Yang, C.; Soloviev, A. Mobile positioning with signals of opportunity in urban and urban canyon environments. In Proceedings of the 2020 IEEE/ION Position, Location and Navigation Symposium (PLANS), Portland, OR, USA, 20–23 April 2020; pp. 1043–1059. [Google Scholar]
- Chen, L.; Piché, R.; Kuusniemi, H.; Chen, R. Adaptive mobile tracking in unknown non-line-of-sight conditions with application to digital TV networks. EURASIP J. Adv. Signal Process. 2014, 2014, 22. [Google Scholar] [CrossRef] [Green Version]
- Beek, J.J.v.d.; Sandell, M.; Borjesson, P.O. ML estimation of time and frequency offset in OFDM systems. IEEE Trans. Signal Process. 1997, 45, 1800–1805. [Google Scholar] [CrossRef] [Green Version]
- Xinrong, L.; Pahlavan, K. Super-resolution TOA estimation with diversity for indoor geolocation. IEEE Trans. Wirel. Commun. 2004, 3, 224–234. [Google Scholar]
- Chen, L.; Julien, O.; Thevenon, P.; Serant, D.; Peña, A.G.; Kuusniemi, H. TOA Estimation for Positioning With DVB-T Signals in Outdoor Static Tests. IEEE Trans. Broadcast. 2015, 61, 625–638. [Google Scholar] [CrossRef]
- Shamaei, K.; Kassas, Z.M. Receiver Design and Time of Arrival Estimation for Opportunistic Localization With 5G Signals. IEEE Trans. Wirel. Commun. 2021, 20, 4716–4731. [Google Scholar] [CrossRef]
- Baoguo, Y.; Letaief, K.B.; Cheng, R.S.; Zhigang, C. Timing recovery for OFDM transmission. IEEE J. Sel. Areas Commun. 2000, 18, 2278–2291. [Google Scholar] [CrossRef]
- Dai, L.; Wang, Z.; Pan, C.; Chen, S. Wireless Positioning Using TDS-OFDM Signals in Single-Frequency Networks. IEEE Trans. Broadcast. 2012, 58, 236–246. [Google Scholar] [CrossRef] [Green Version]
- Liu, X.; Jiao, Z.; Chen, L.; Pan, Y.; Lu, X.; Ruan, Y. An Enhanced Pedestrian Dead Reckoning Aided With DTMB Signals. IEEE Trans. Broadcast. 2022, 68, 407–413. [Google Scholar] [CrossRef]
- Pan, Y.; Chen, L.; Jiao, Z.; Liu, X.; Chen, Y. Positioning in Urban Scenarios Based on Smartphone Camera/IMU and Digital TV Signal. In Proceedings of the 2021 International Conference on Robotics Automation and Intelligent Control (ICRAIC 2021), Wuhan, China, 26-28 November 2021; p. 12028. [Google Scholar]
- Cong, L.; Wang, H.; Qin, H.; Liu, L. An environmentally-adaptive positioning method based on integration of GPS/DTMB/FM. Sensors 2018, 18, 4292. [Google Scholar] [CrossRef] [PubMed] [Green Version]
- Ansari, K.; Jamjareegulgarn, P. Effect of Weighted PDOP on Performance of Linear Kalman Filter for RTK Drone Data. IEEE Geosci. Remote Sens. Lett. 2022, 19, 3513504. [Google Scholar] [CrossRef]
- GB 20600-2006; Frame Structure, Channel Coding and Modulation for a Digital Television Terrestrial Broadcasting System. Chinese National Standard: Beijing, China, 2006.
- Yang, C.; Soloviev, A. Positioning with mixed signals of opportunity subject to multipath and clock errors in urban mobile fading environments. In Proceedings of the 31st International Technical Meeting of the Satellite Division of The Institute of Navigation (ION GNSS+ 2018), Miami, FL, USA, 24–28 September 2018; pp. 223–243. [Google Scholar]
- RTKLIB: An Open Source Program Package for GNSS Positioning. Available online: http://www.rtklib.com (accessed on 10 September 2022).
- Huihui, W.; Xingqun, Z.; Yanhua, Z. Geometric dilution of precision for GPS single-point positioning based on four satellites. J. Syst. Eng. Electron. 2008, 19, 1058–1063. [Google Scholar] [CrossRef]
- Guo, Y.; Li, W.; Yang, G.; Jiao, Z.; Yan, J. Combining Dilution of Precision and Kalman Filtering for UWB Positioning in a Narrow Space. Remote Sens. 2022, 14, 5409. [Google Scholar] [CrossRef]
- Inquiry of DTMB program in Wuhan. Available online: http://dtmb.saoing.com/hubei.htm (accessed on 5 September 2022).
- EVK-M8U Evaluation Kit. Available online: https://content.u-blox.com/sites/default/files/EVK-M8U_UserGuide_%28UBX-15023994%29.pdf (accessed on 8 December 2022).
- u-blox M8 Untethered Dead Reckoning Module Including 3D Inertial Sensors. Available online: https://www.u-blox.com/sites/default/files/NEO-M8U_DataSheet_UBX-15015679.pdf (accessed on 8 December 2022).
- NASA’s Archive of Space Geodesy Data. Available online: https://cddis.nasa.gov/archive/gnss/data/daily (accessed on 12 September 2022).
Figure 1.
The frame and PN sequence structure of DTMB signal in multi-carrier mode.
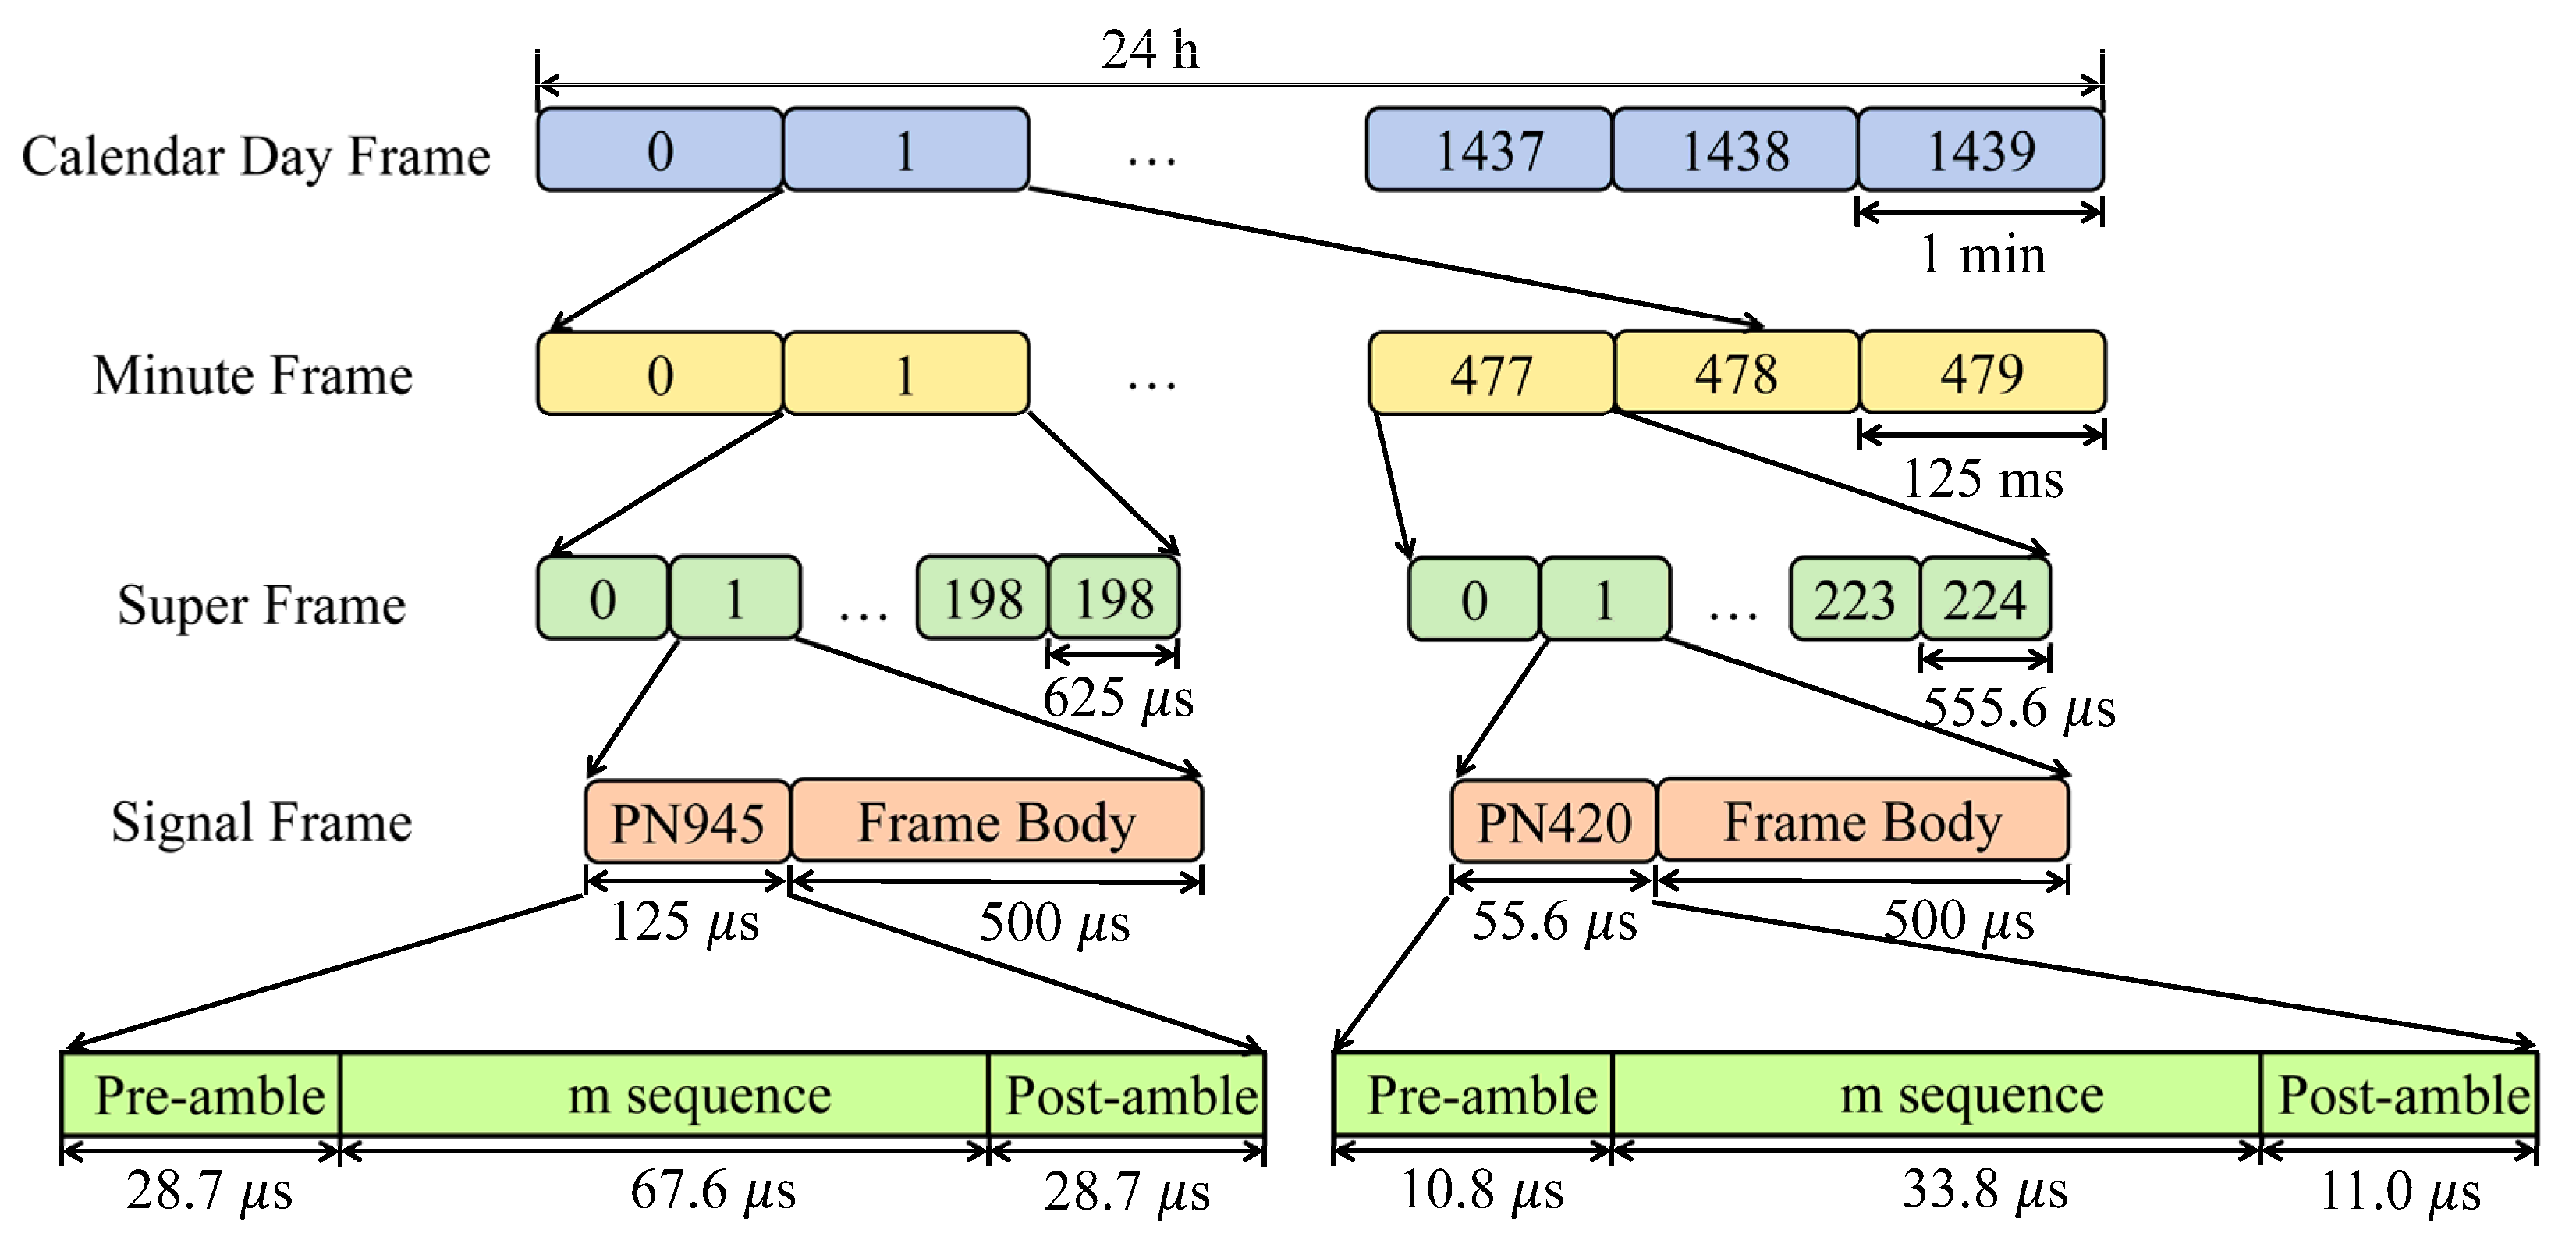
Figure 2.
Block diagram of the proposed ranging and positioning method.
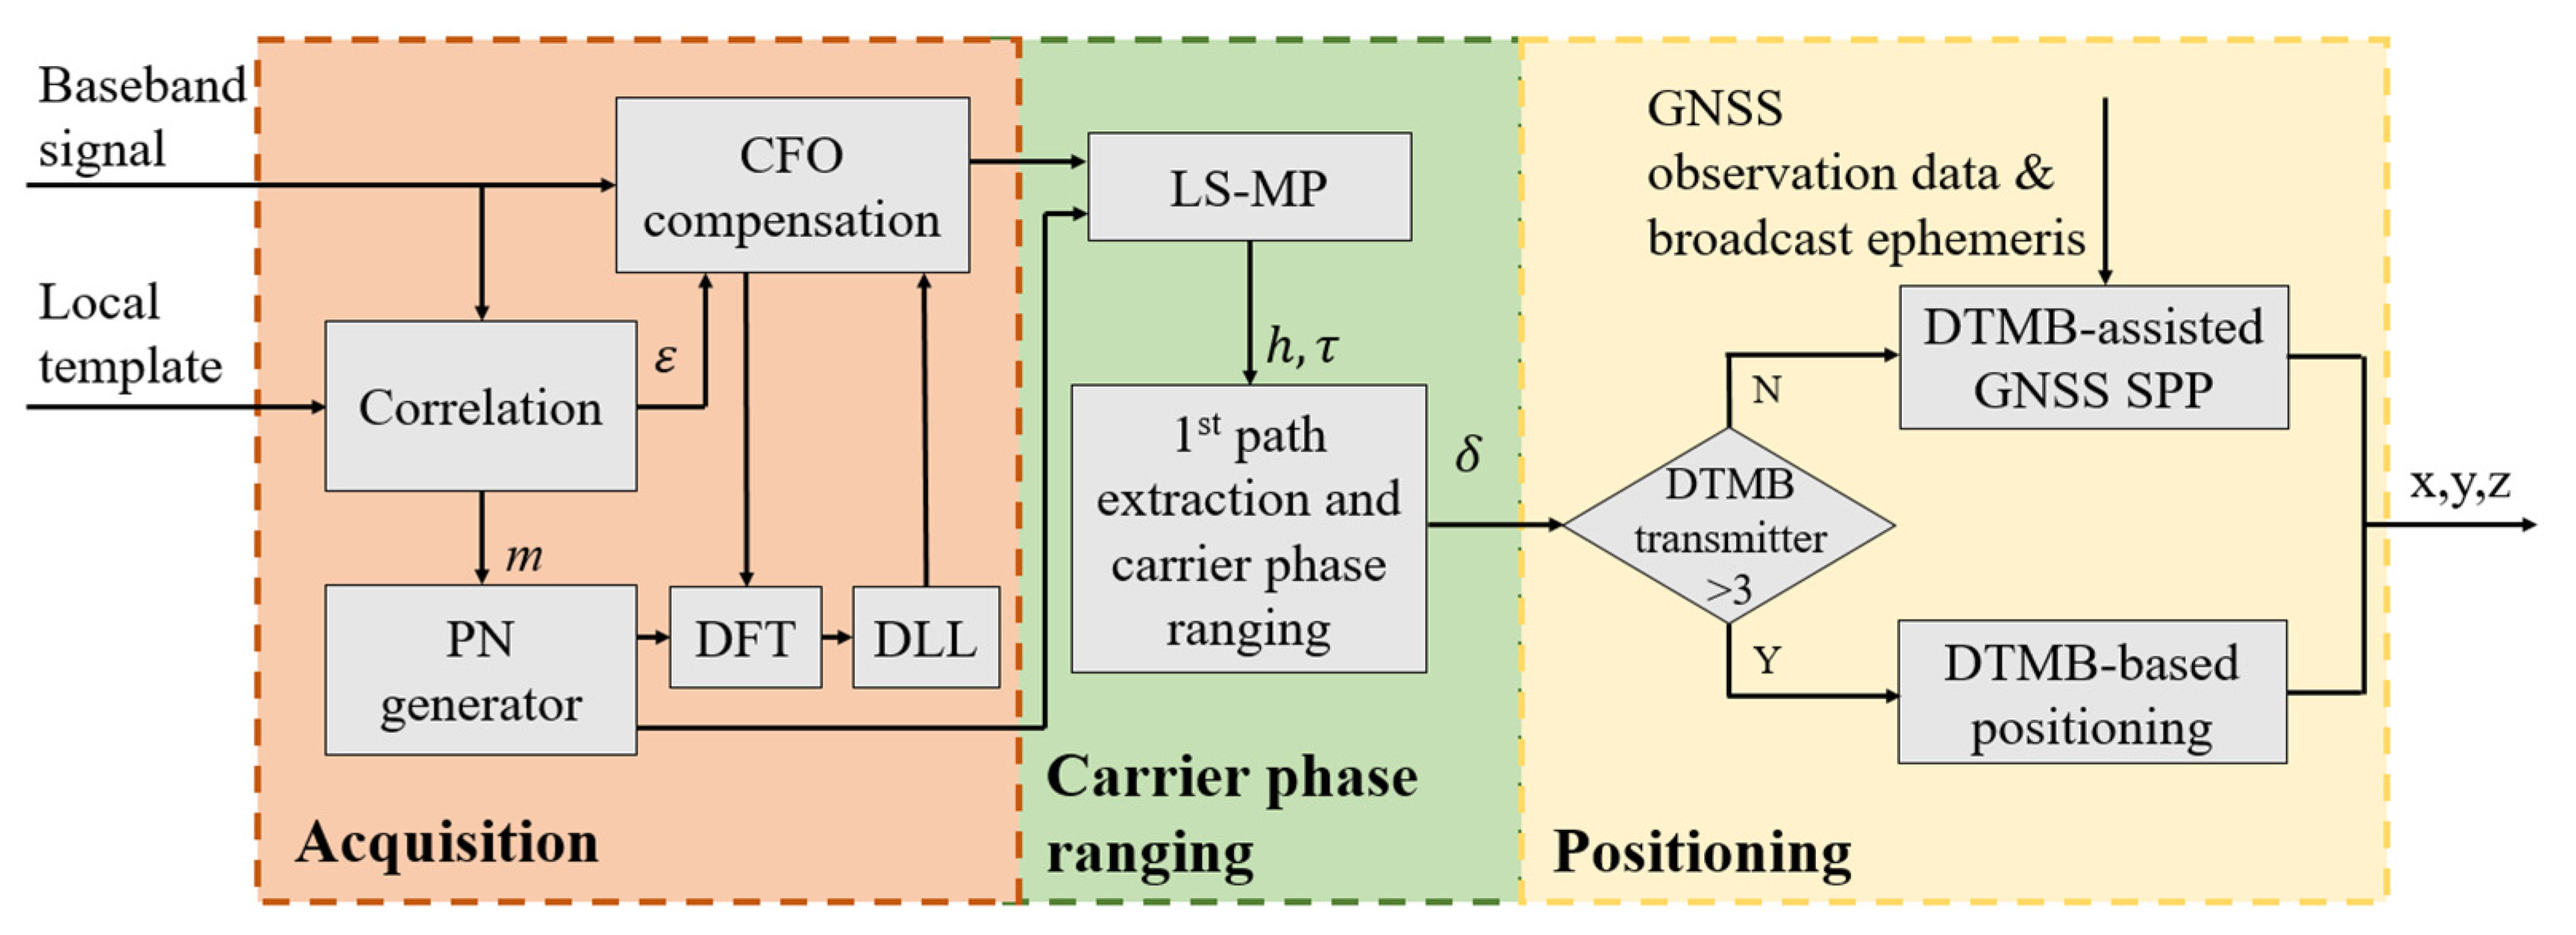
Figure 3.
Walking trajectory in Luoyang (left) and Wuhan (right).
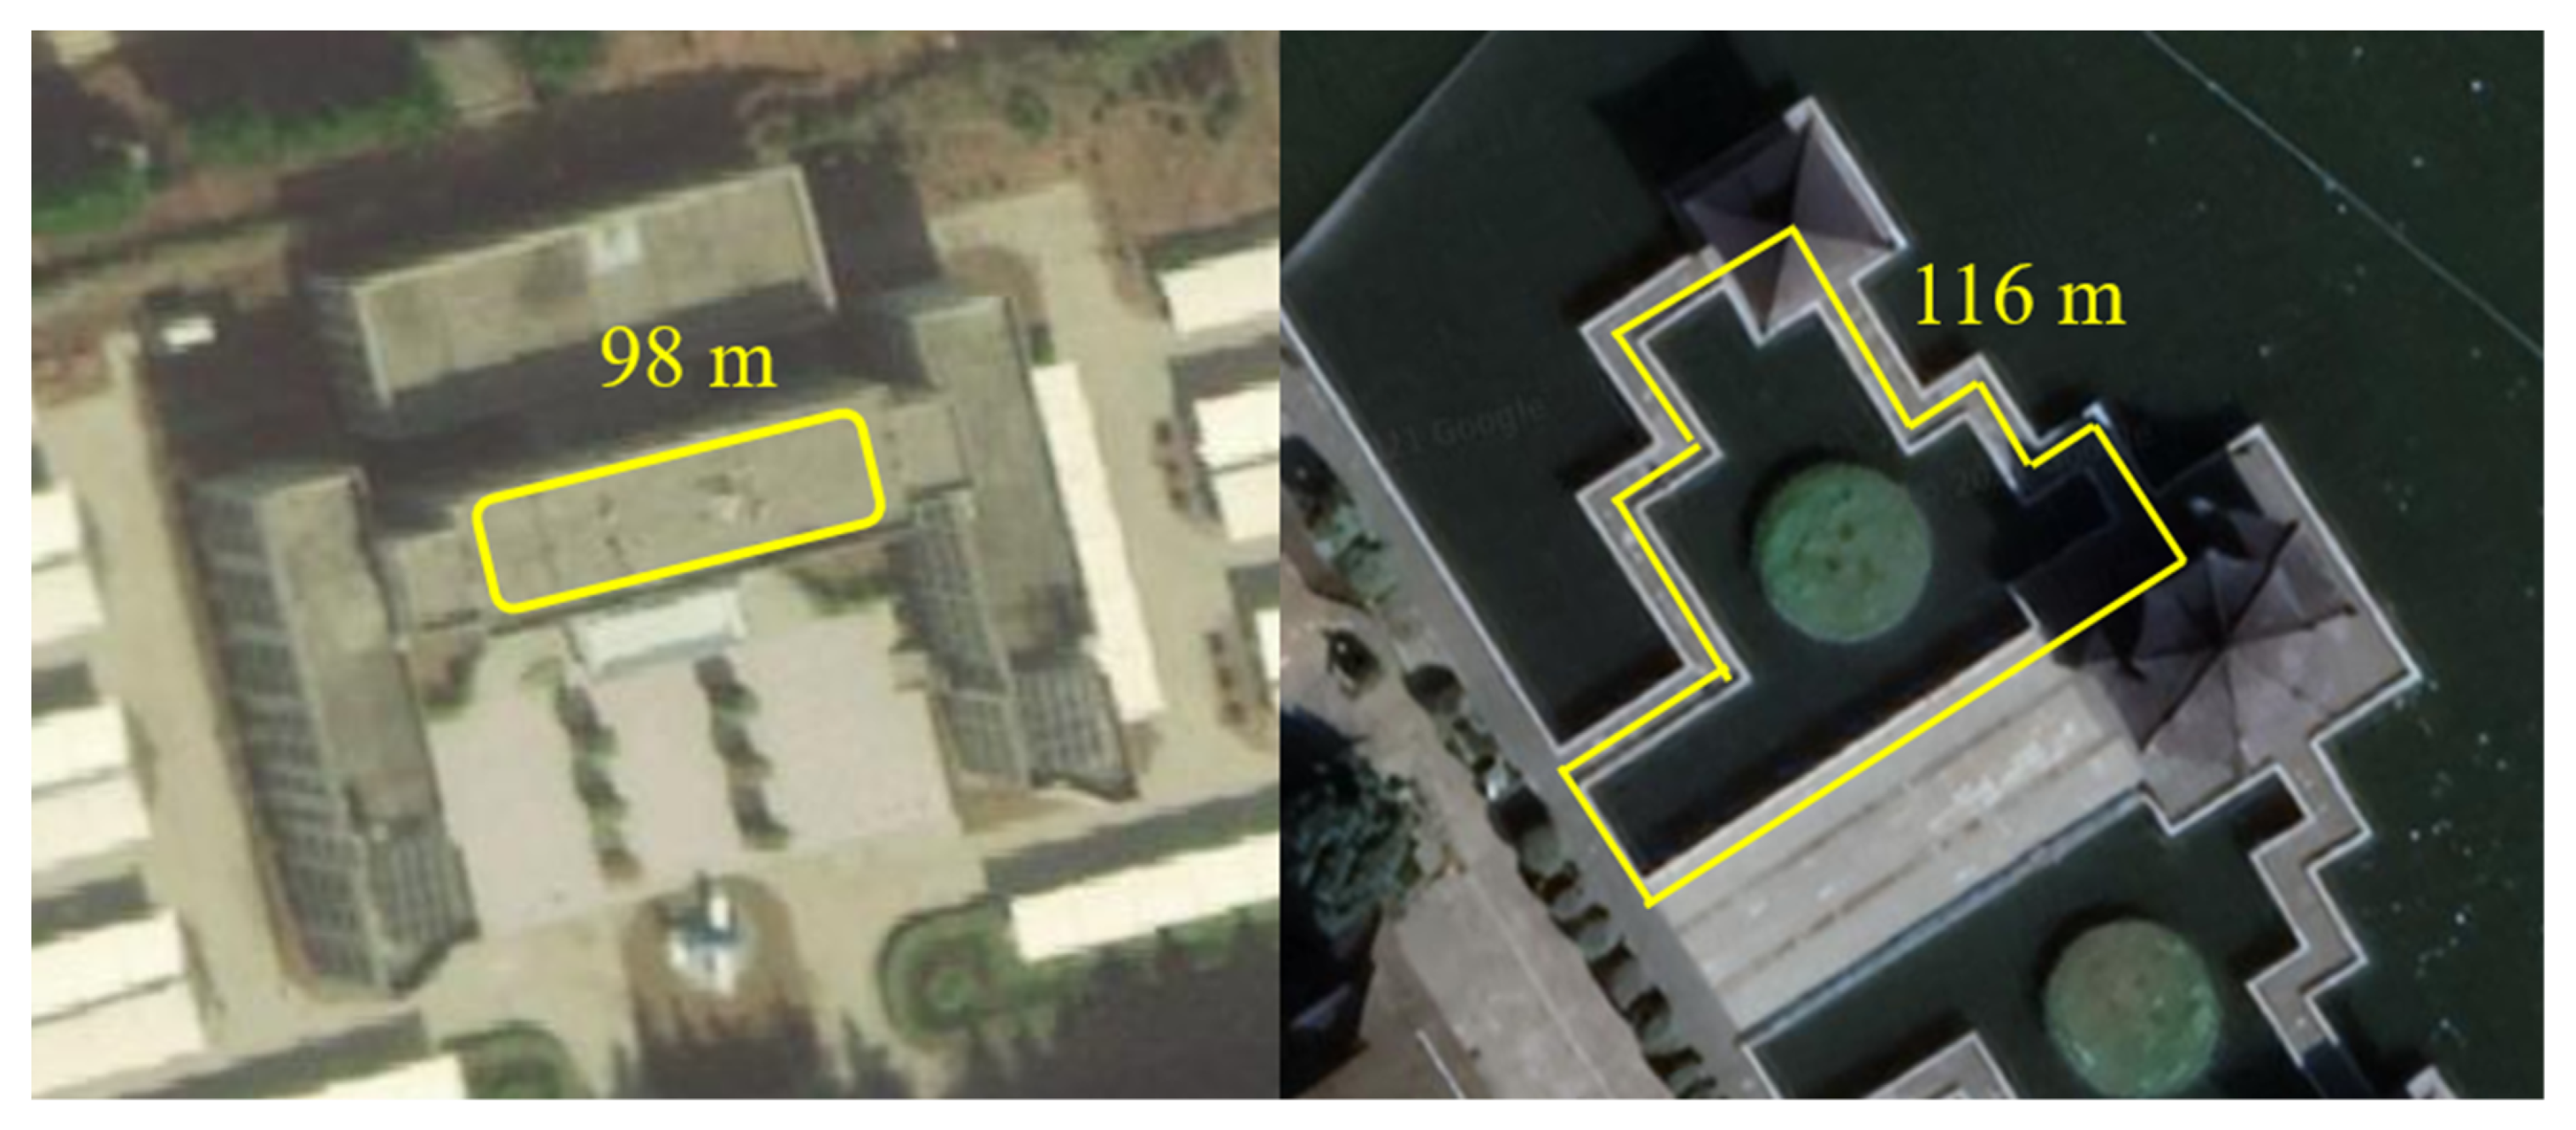
Figure 4.
Surroundings along the walking route in the dynamic test in Wuhan.
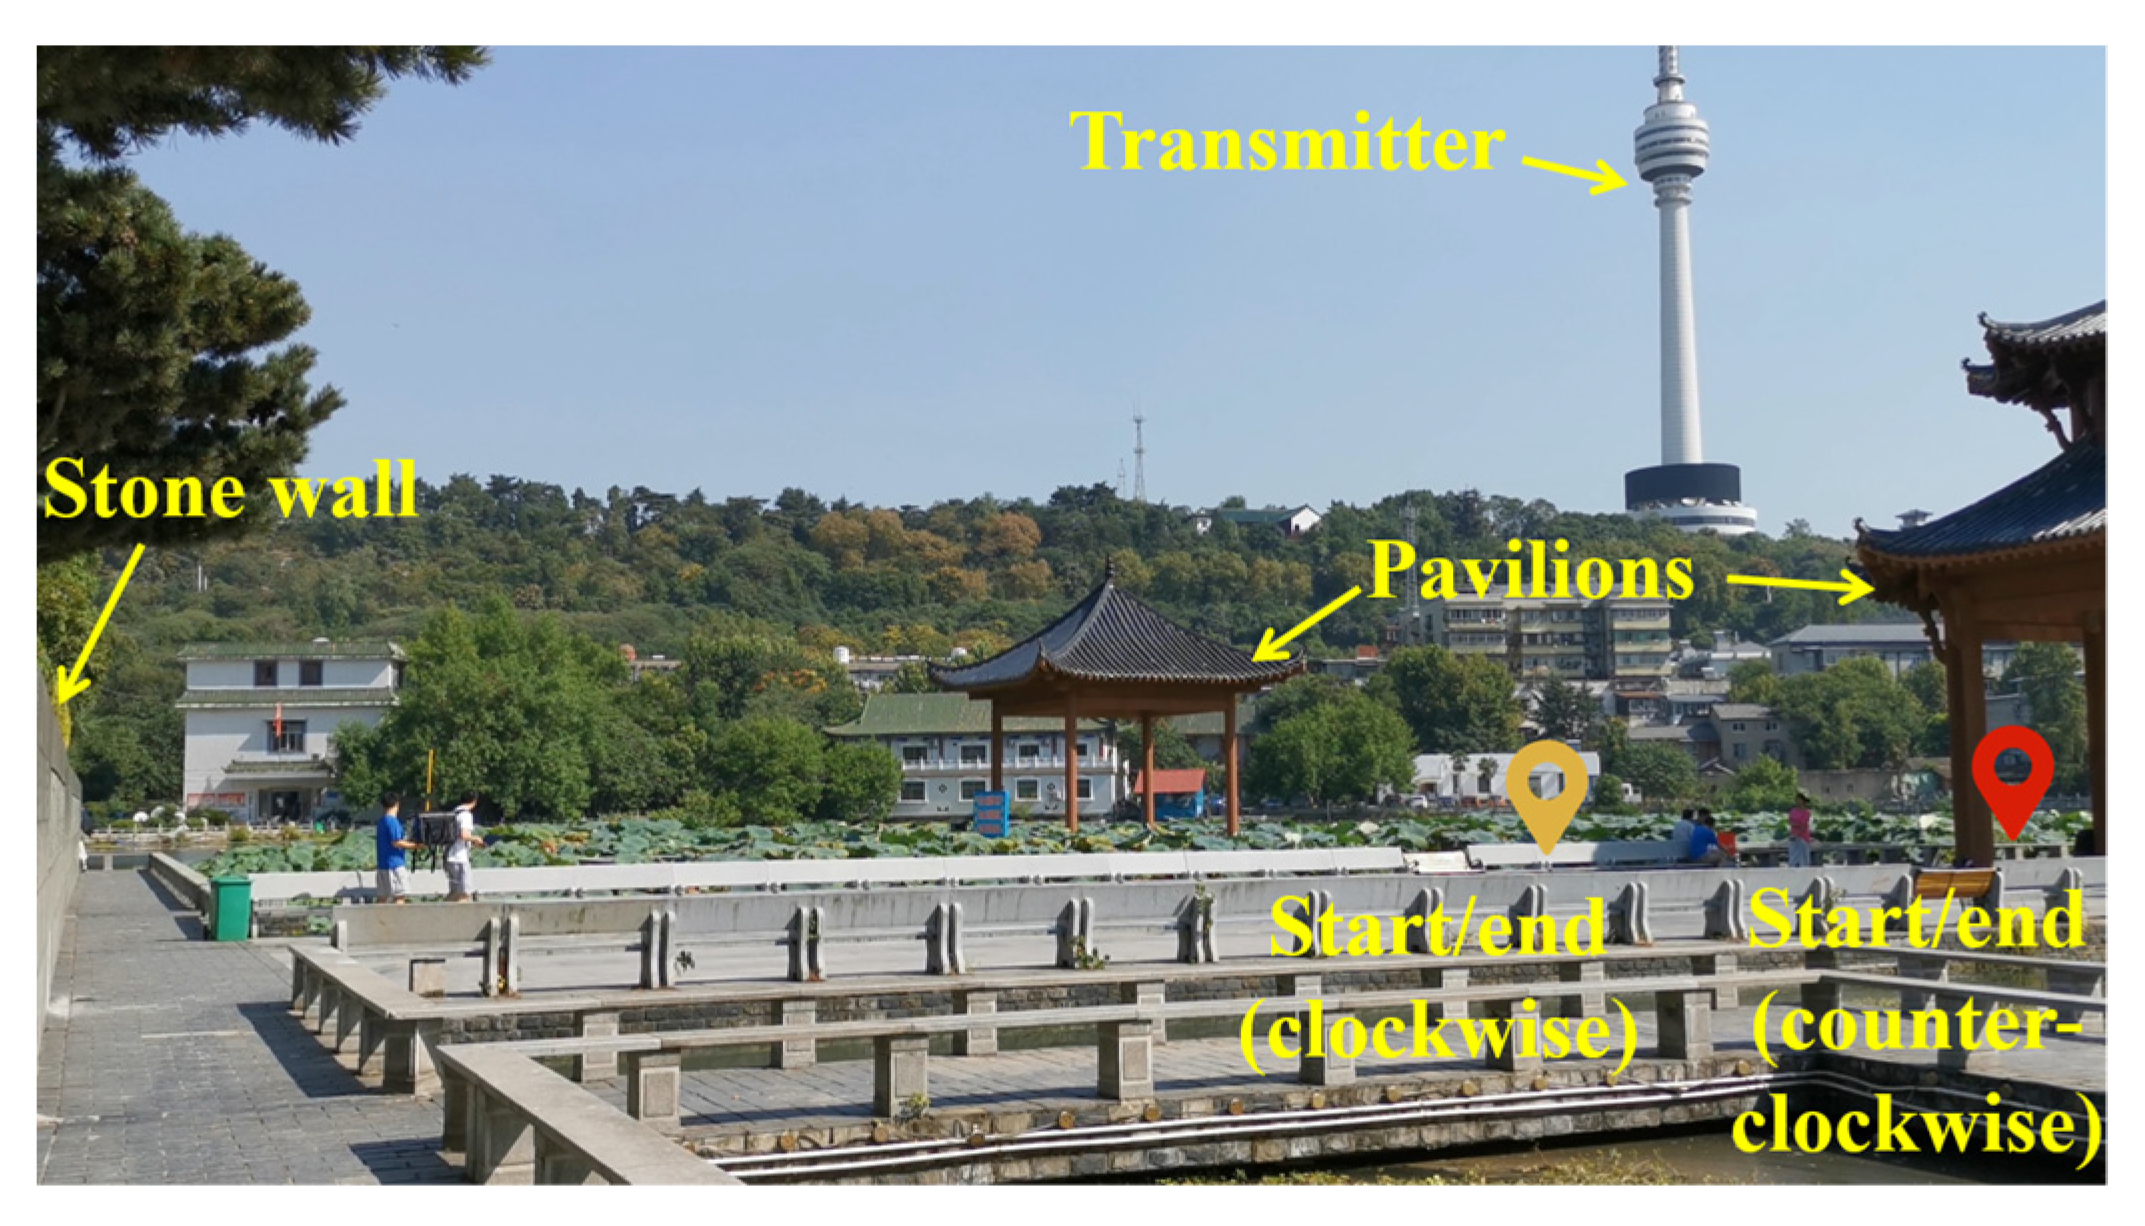
Figure 5.
Test bench.
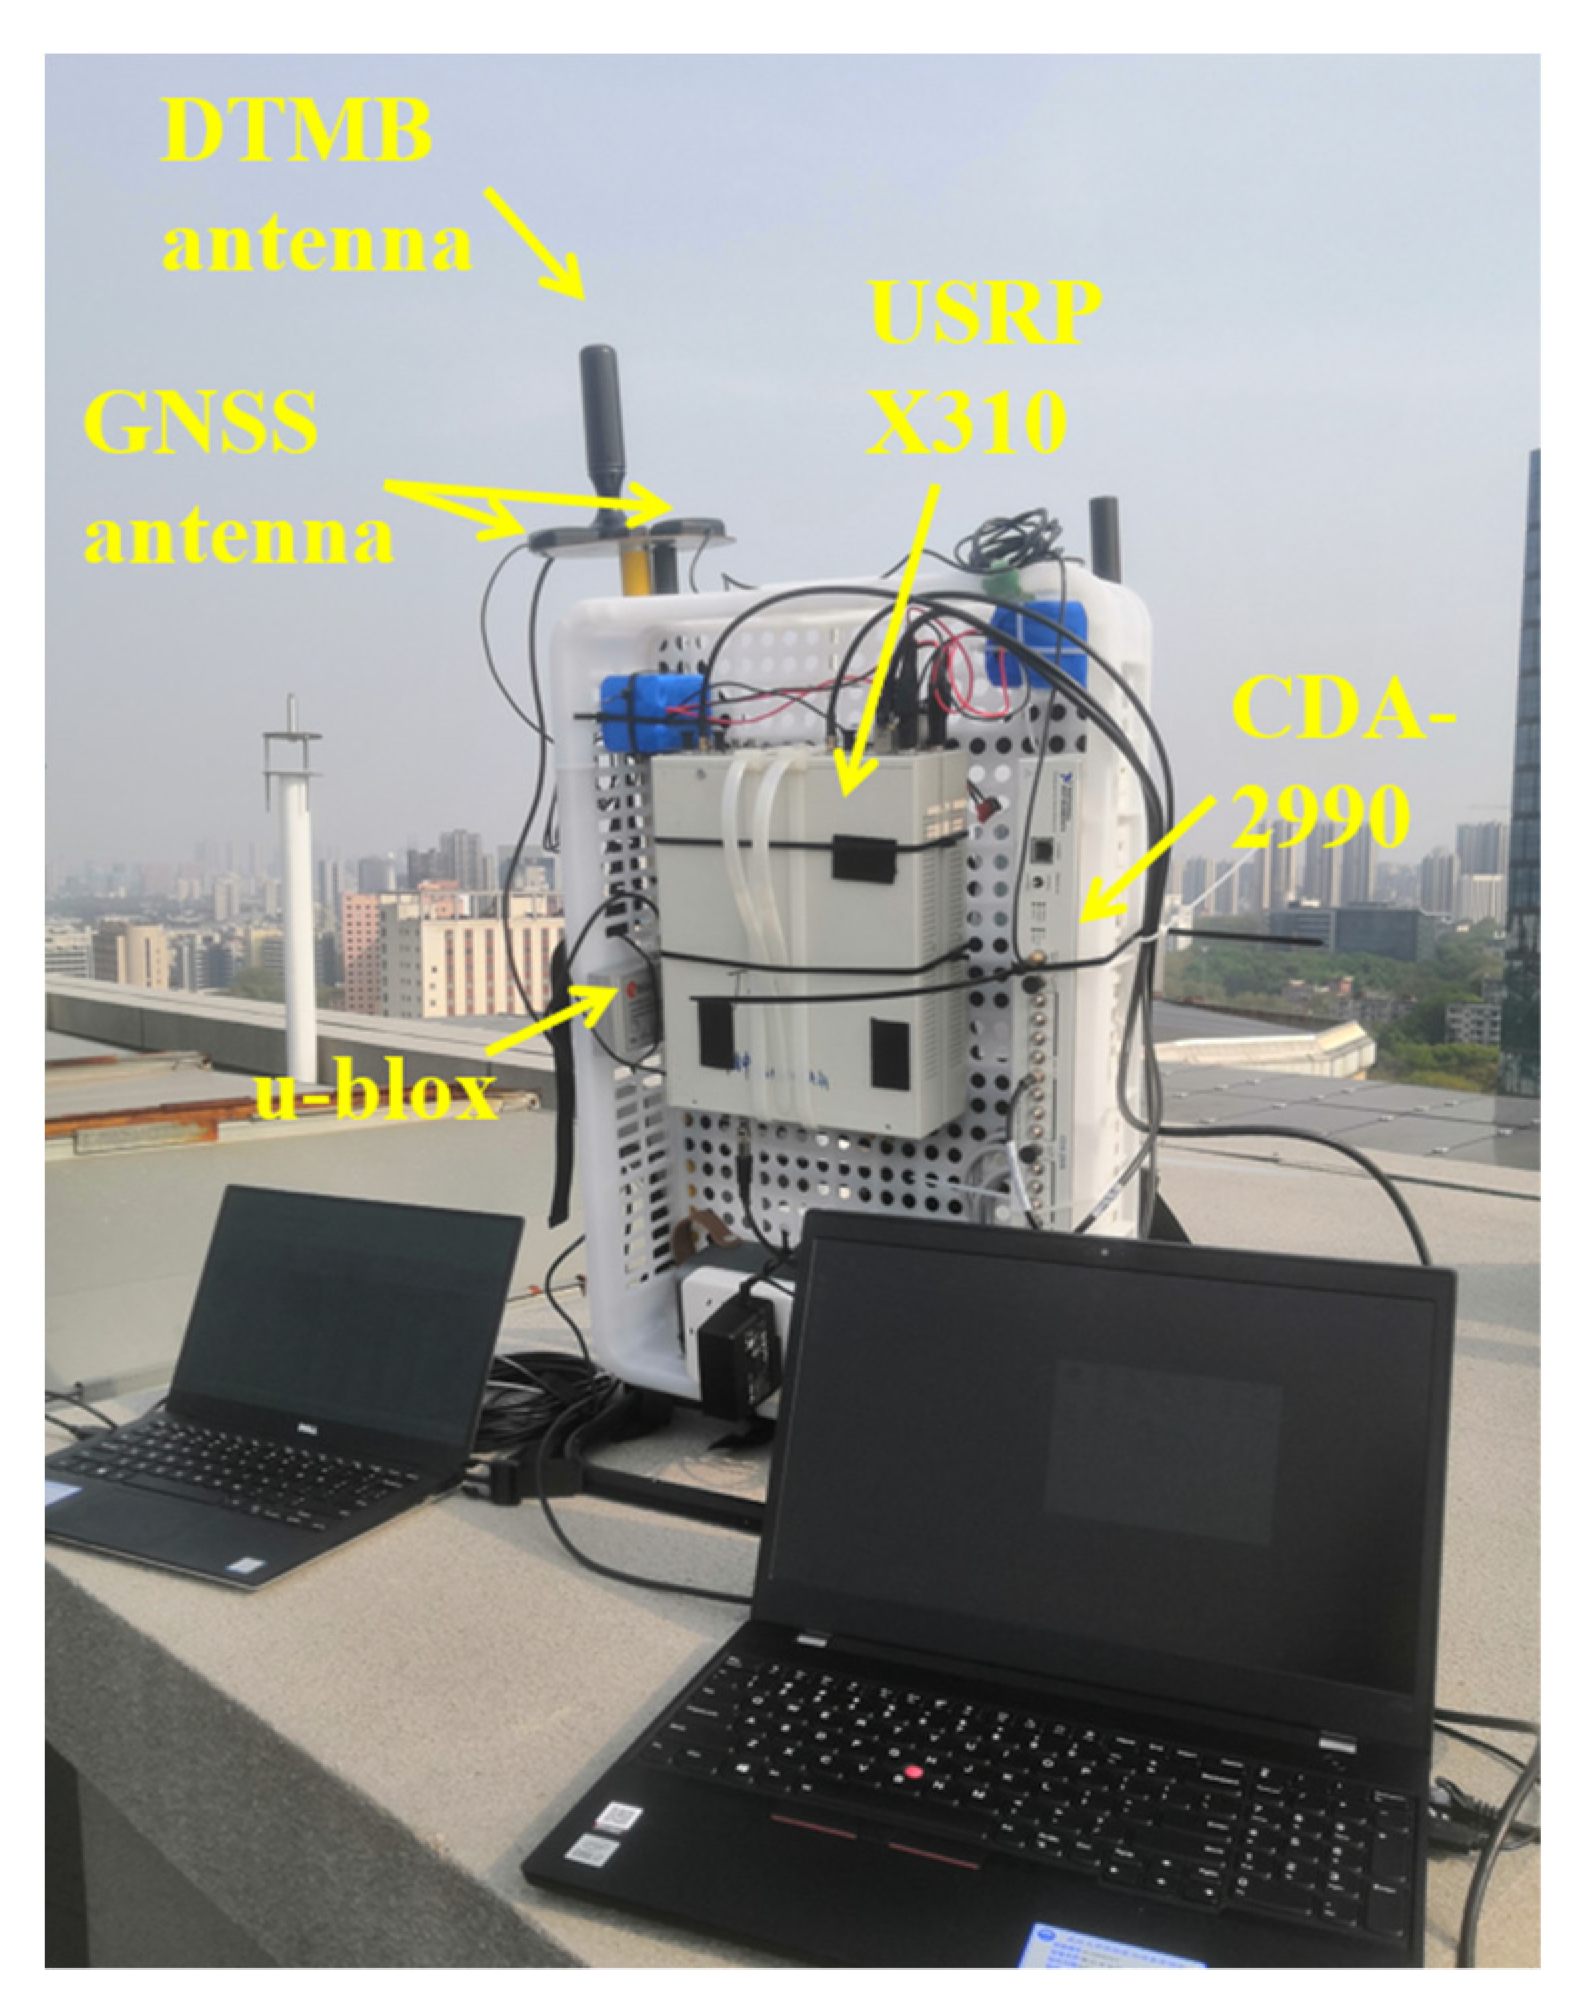
Figure 6.
Acquisition results in static tests. (a) channel 26. (b) channel 48.

Figure 7.
Multipath acquisition results in static tests. (a) channel 17, (b) channel 21, (c) channel 24+2, (d) channel 26, (e) channel 31, (f) channel 33, (g) channel 47, (h) channel 48.
Figure 7.
Multipath acquisition results in static tests. (a) channel 17, (b) channel 21, (c) channel 24+2, (d) channel 26, (e) channel 31, (f) channel 33, (g) channel 47, (h) channel 48.
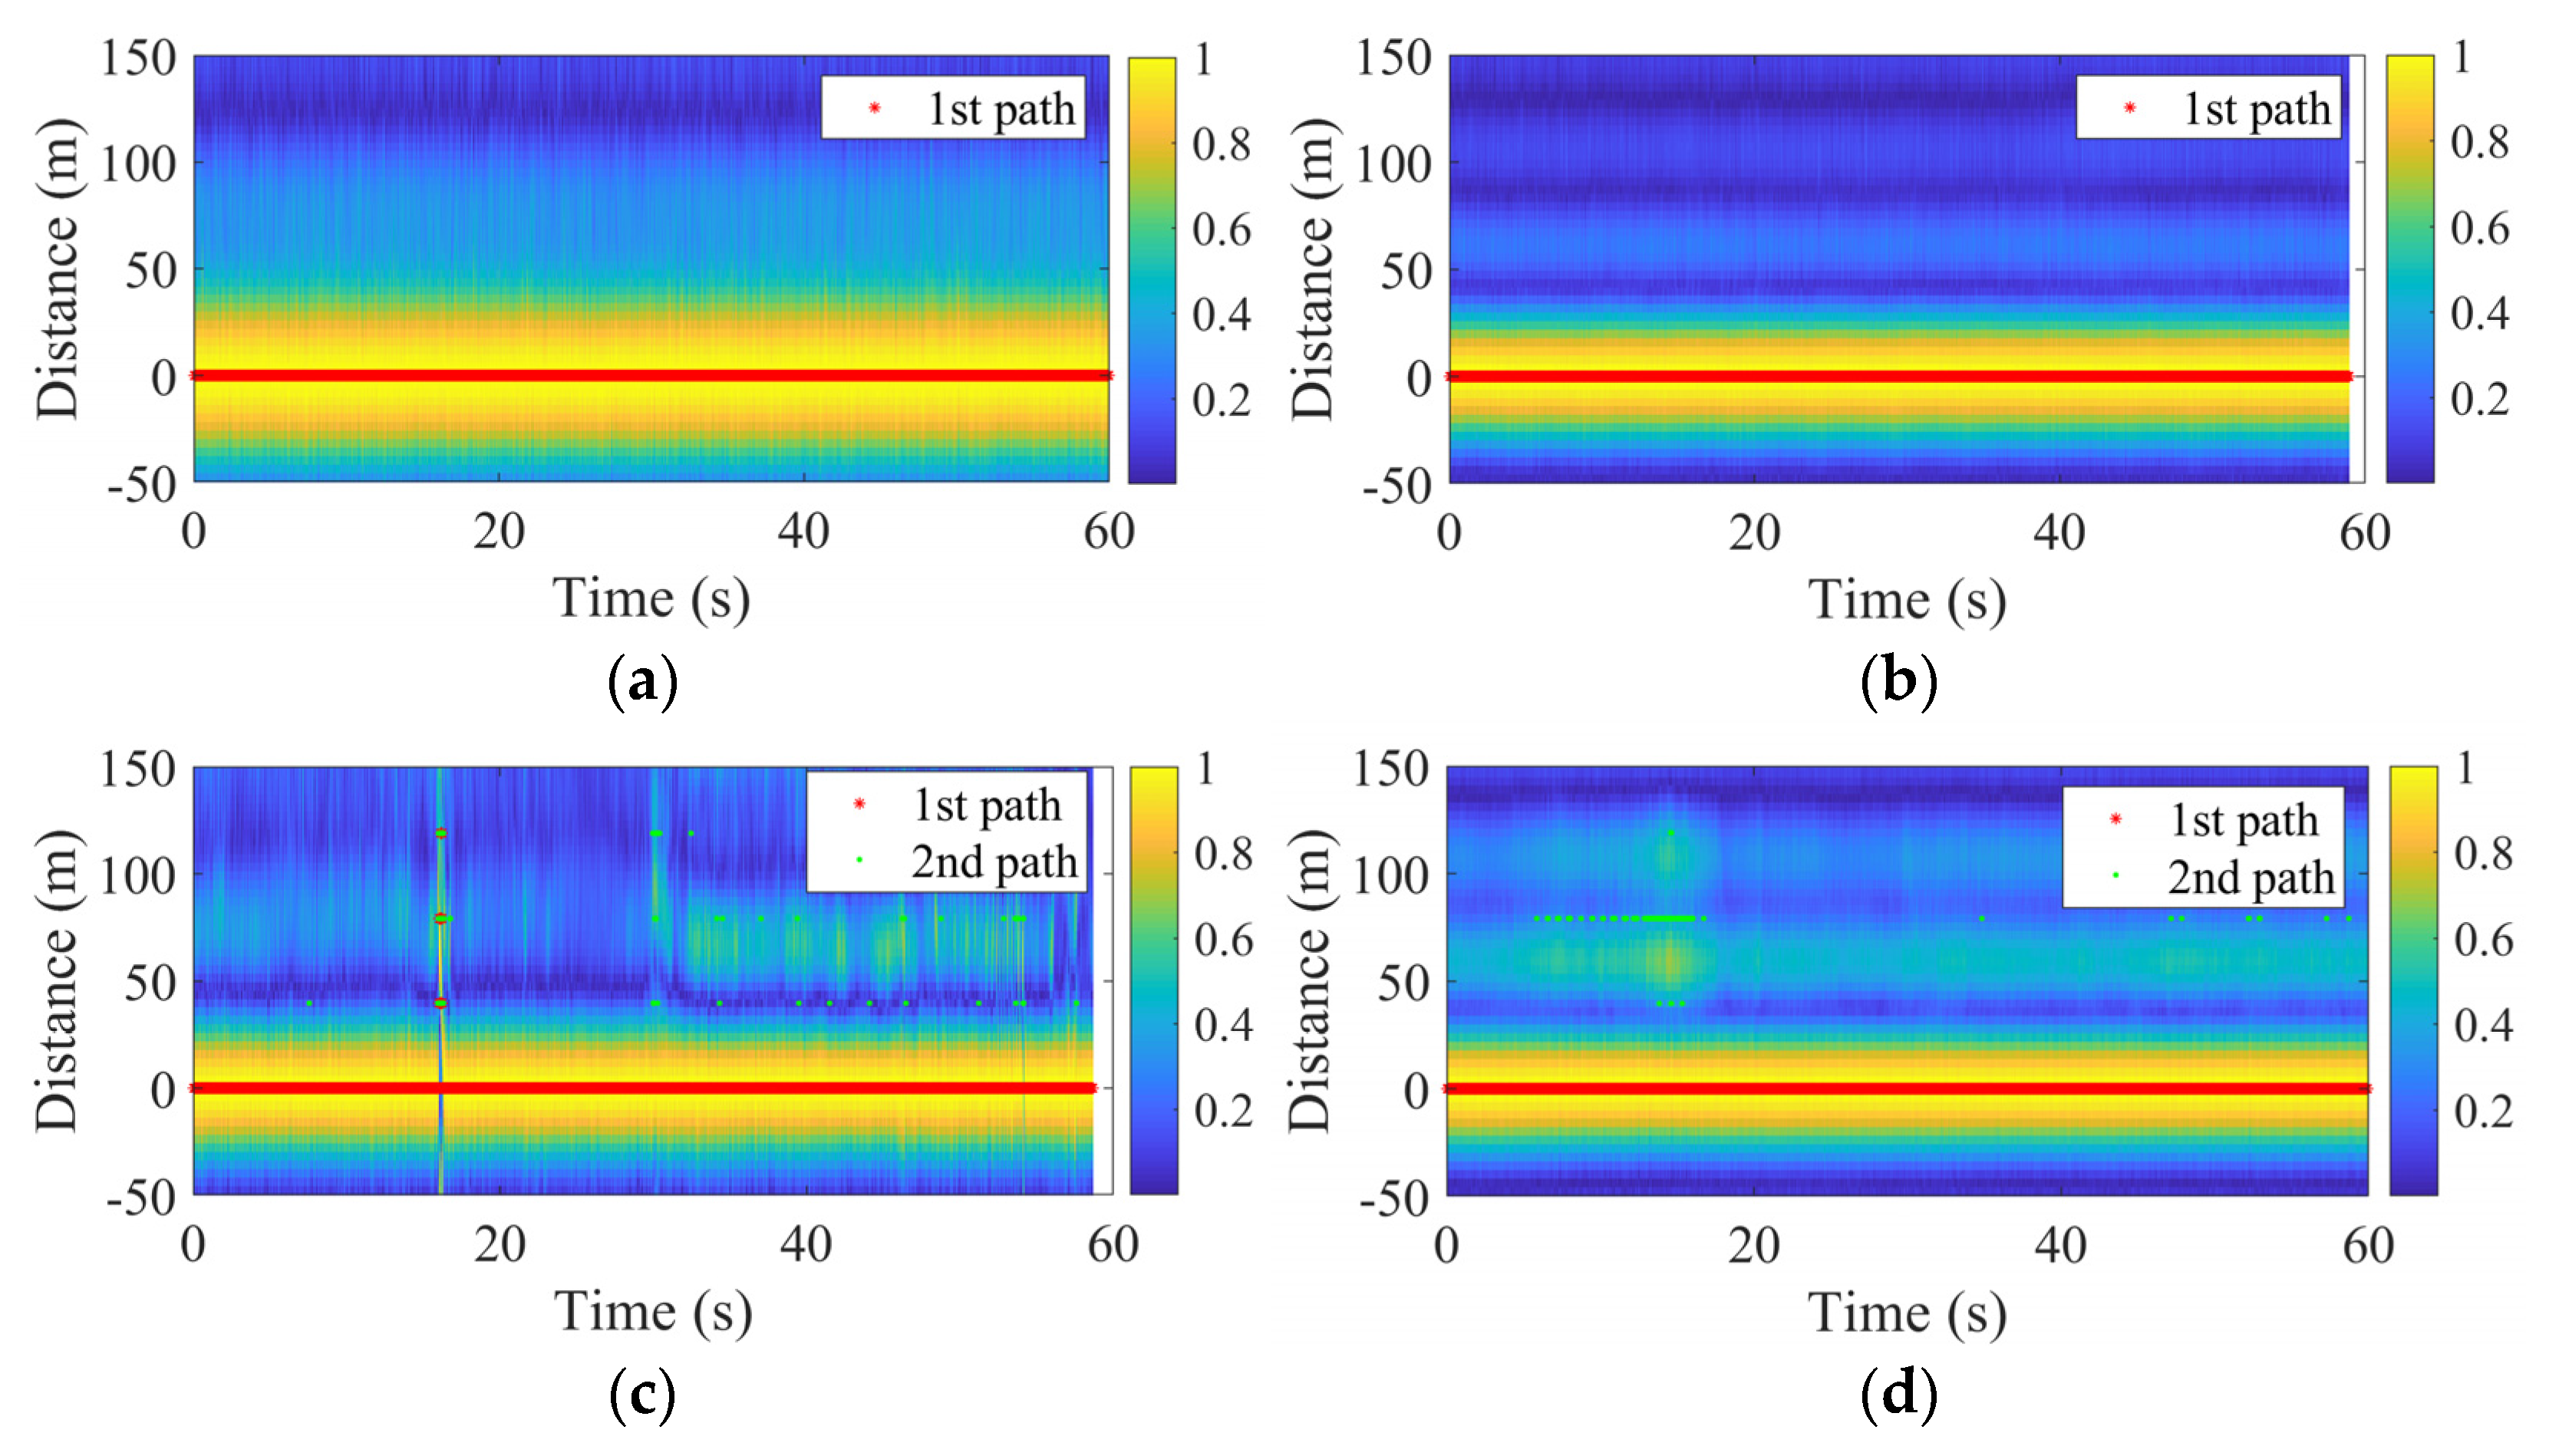
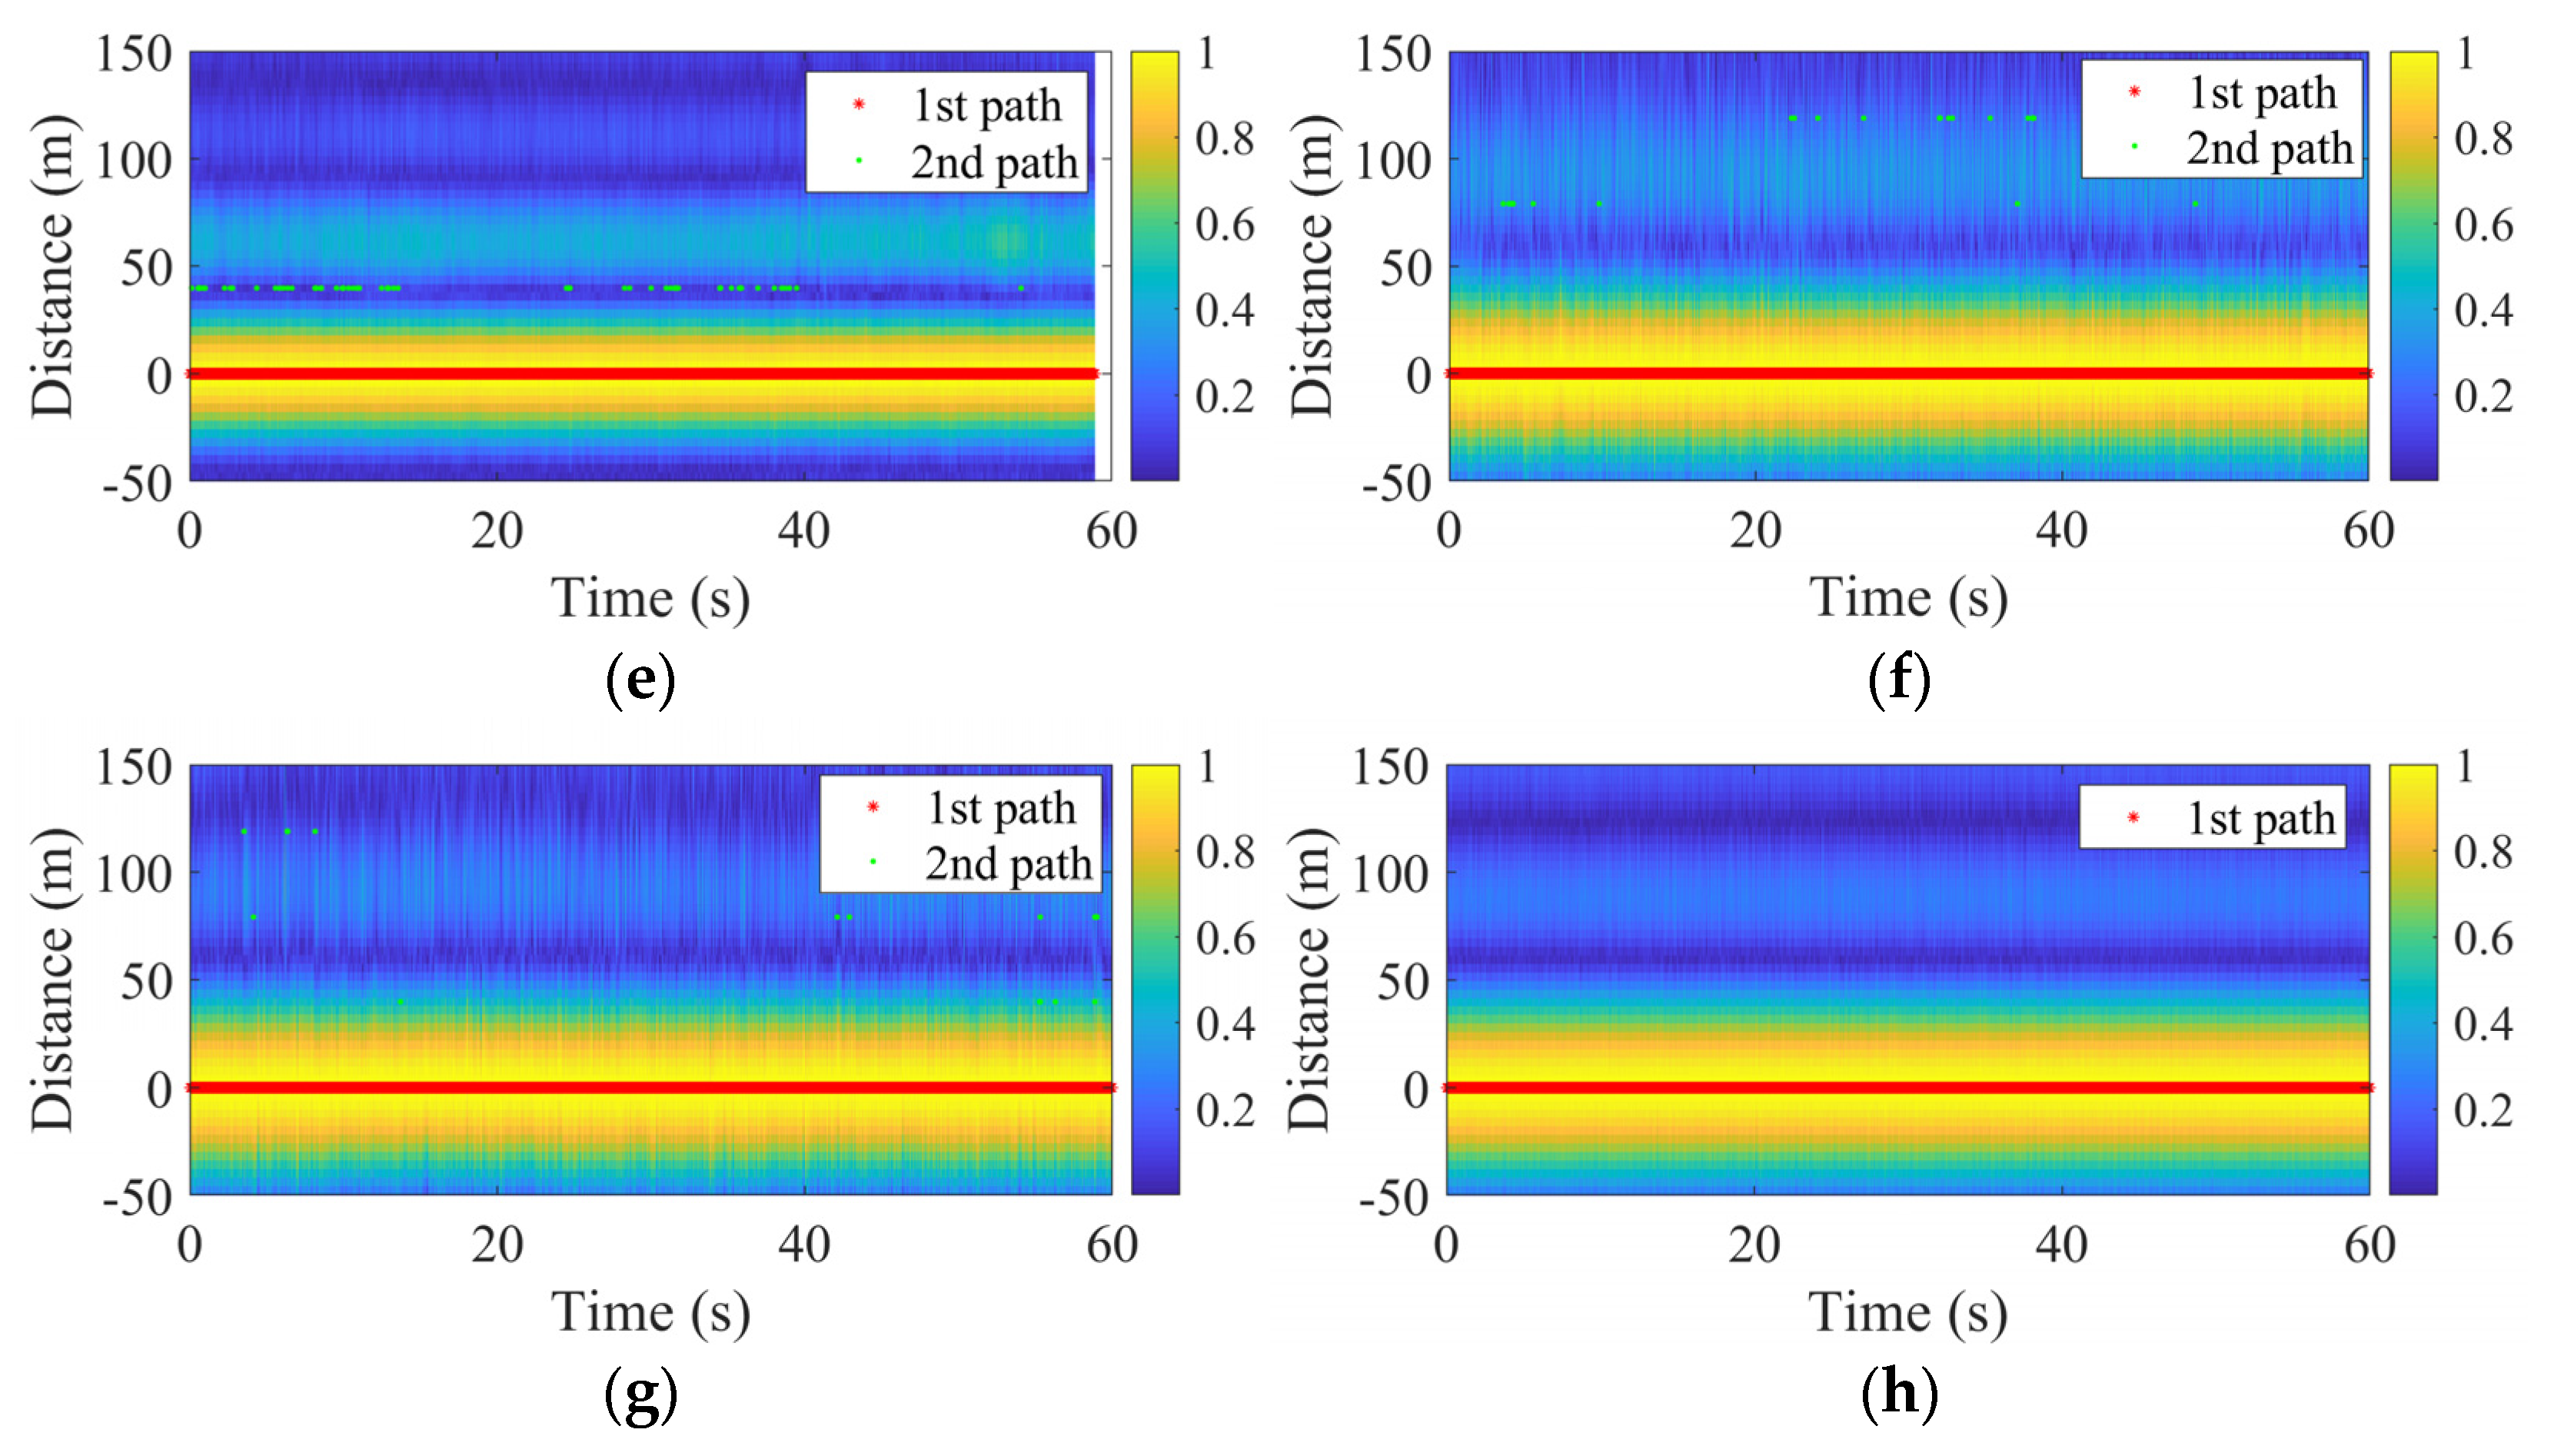
Figure 8.
Carrier phase ranging in static scenario, (a) Luoyang, (b) Wuhan.
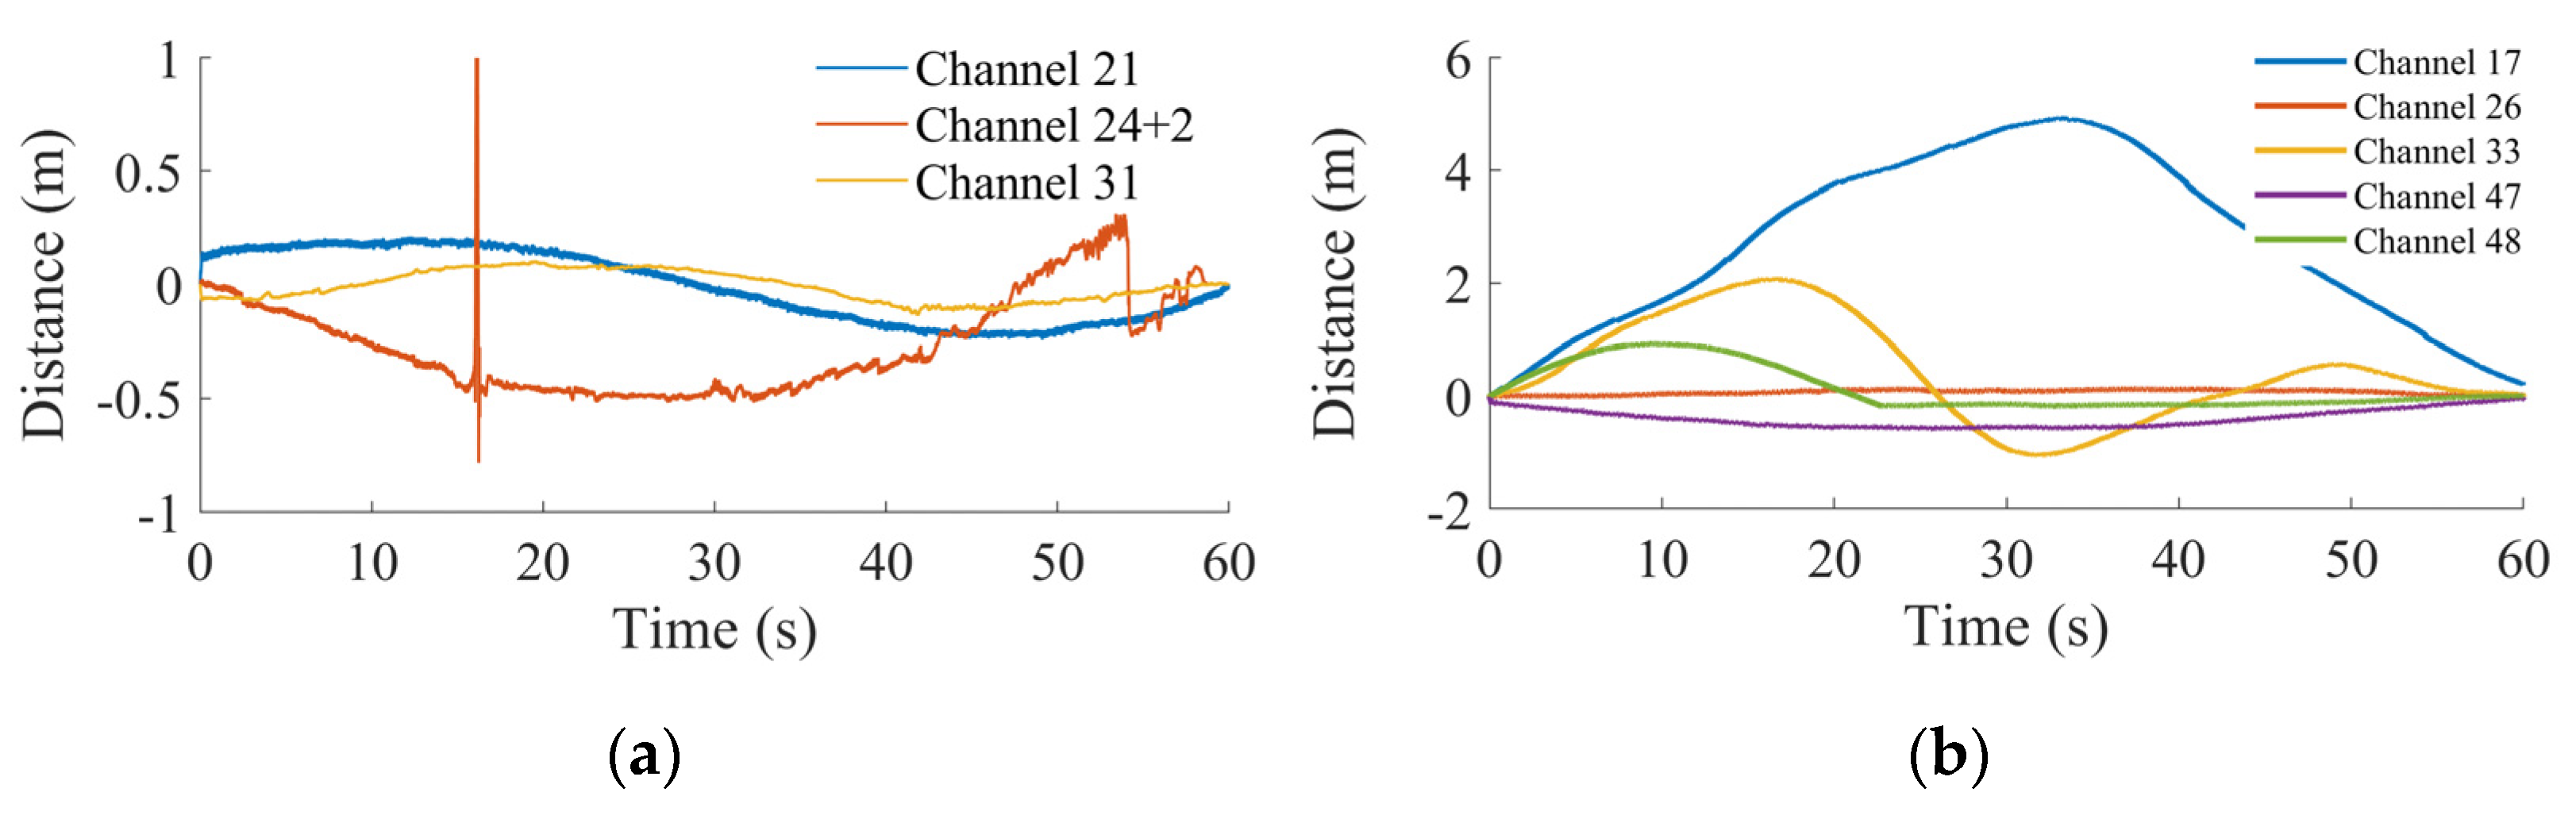
Figure 9.
Carrier phase ranging in dynamic scenario, (a) clockwise, (b) counter-clockwise.
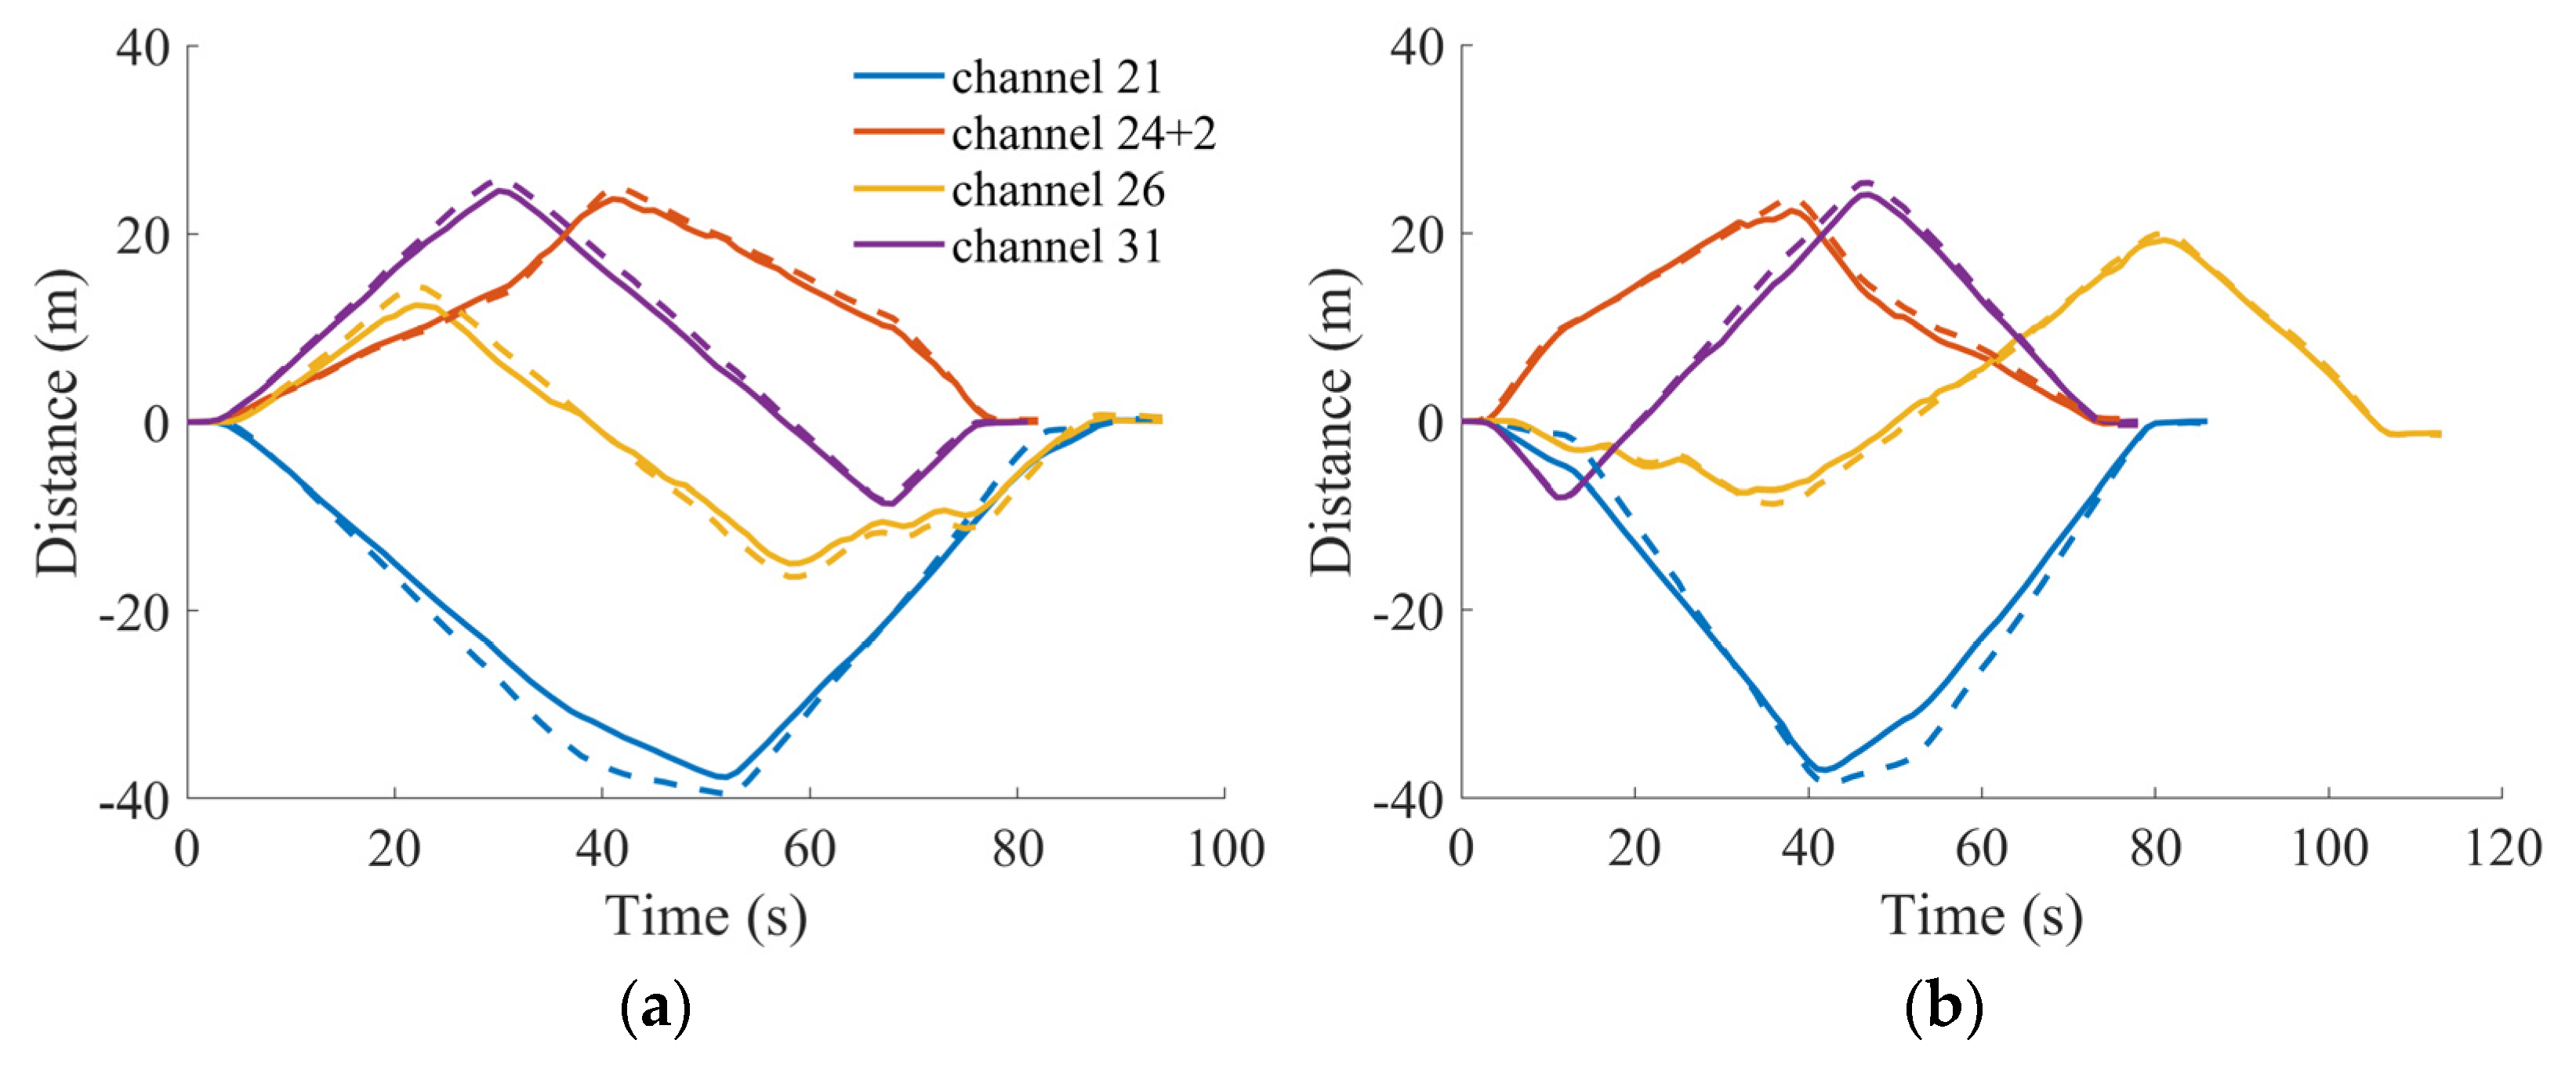
Figure 10.
Ranging error CDF in dynamic tests.
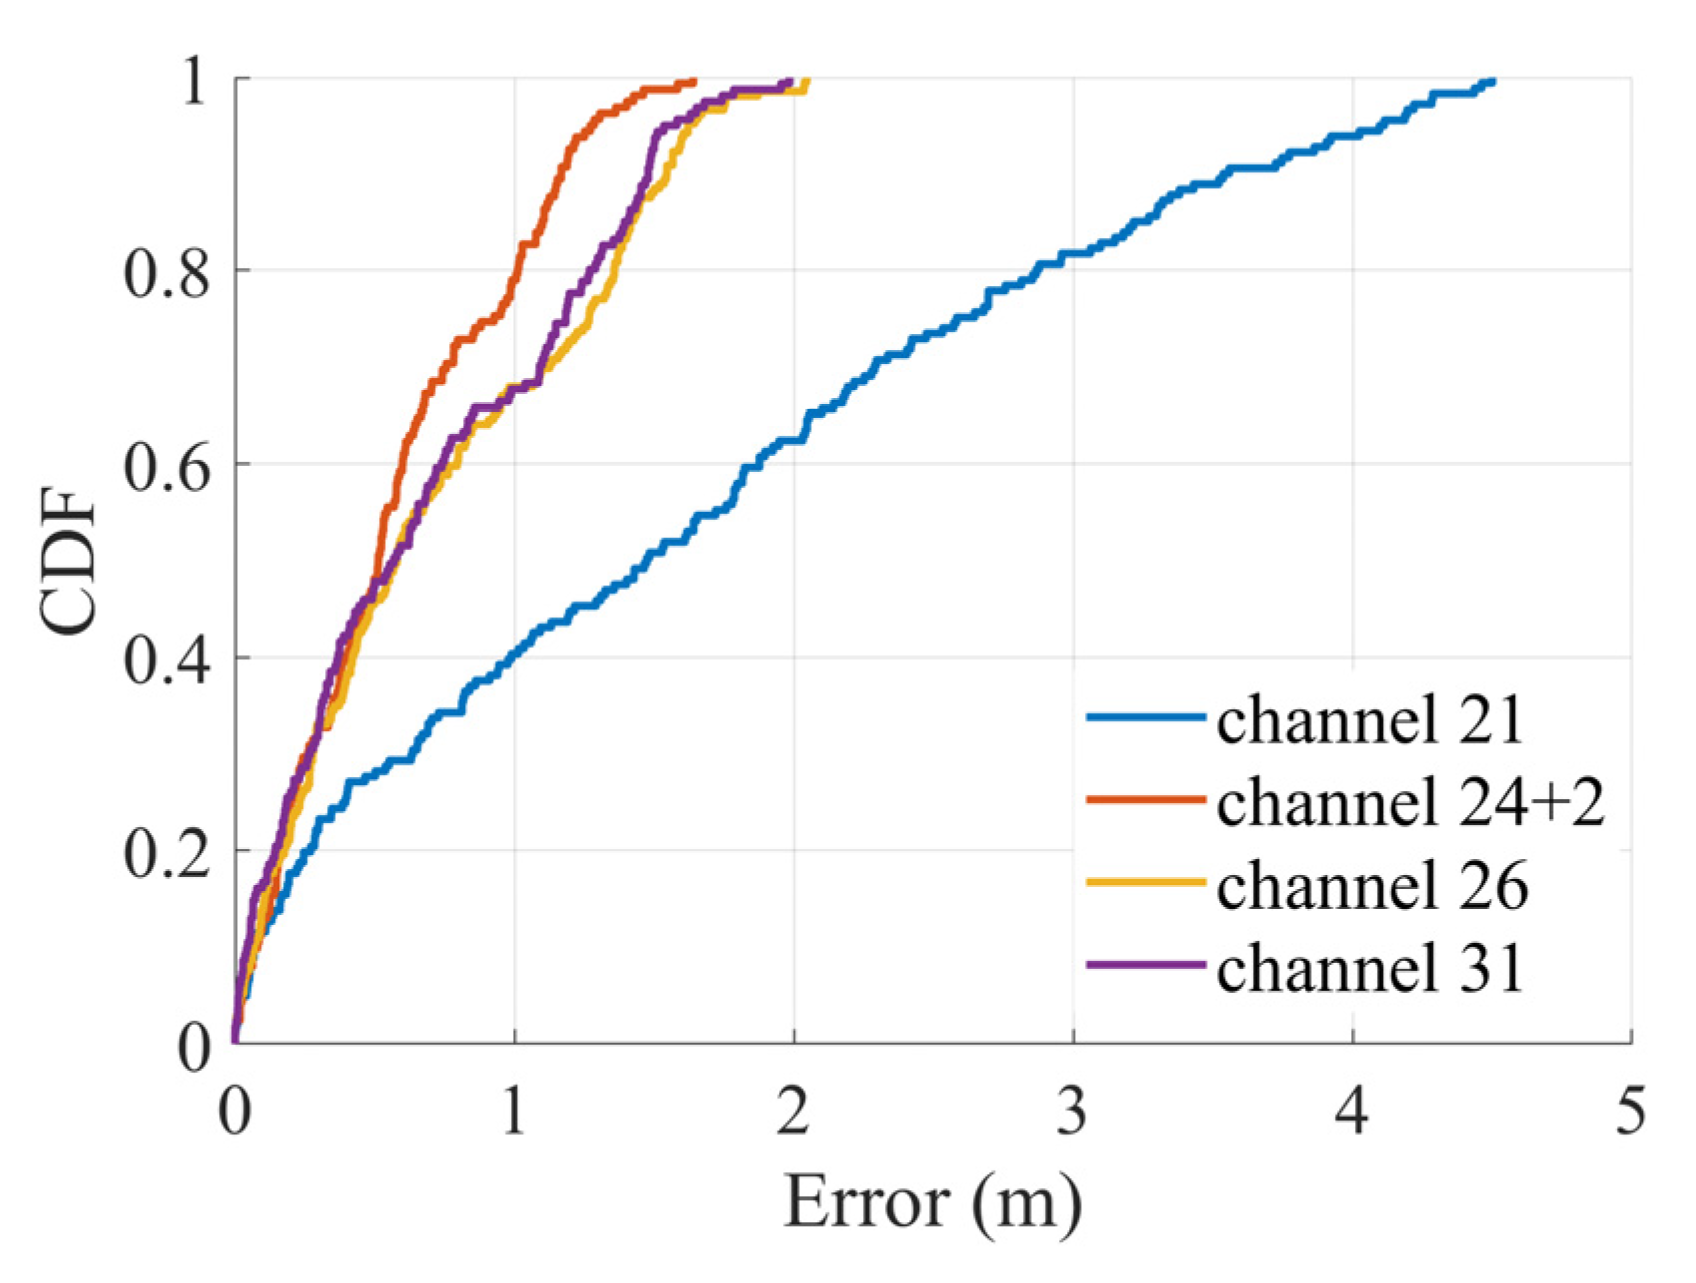
Figure 11.
Number of visible satellites in dynamic tests, Wuhan. (a) Clockwise. (b) Counter-clockwise.
Figure 11.
Number of visible satellites in dynamic tests, Wuhan. (a) Clockwise. (b) Counter-clockwise.

Figure 12.
Position error time series. (a) Clockwise. (b) Counter-clockwise.
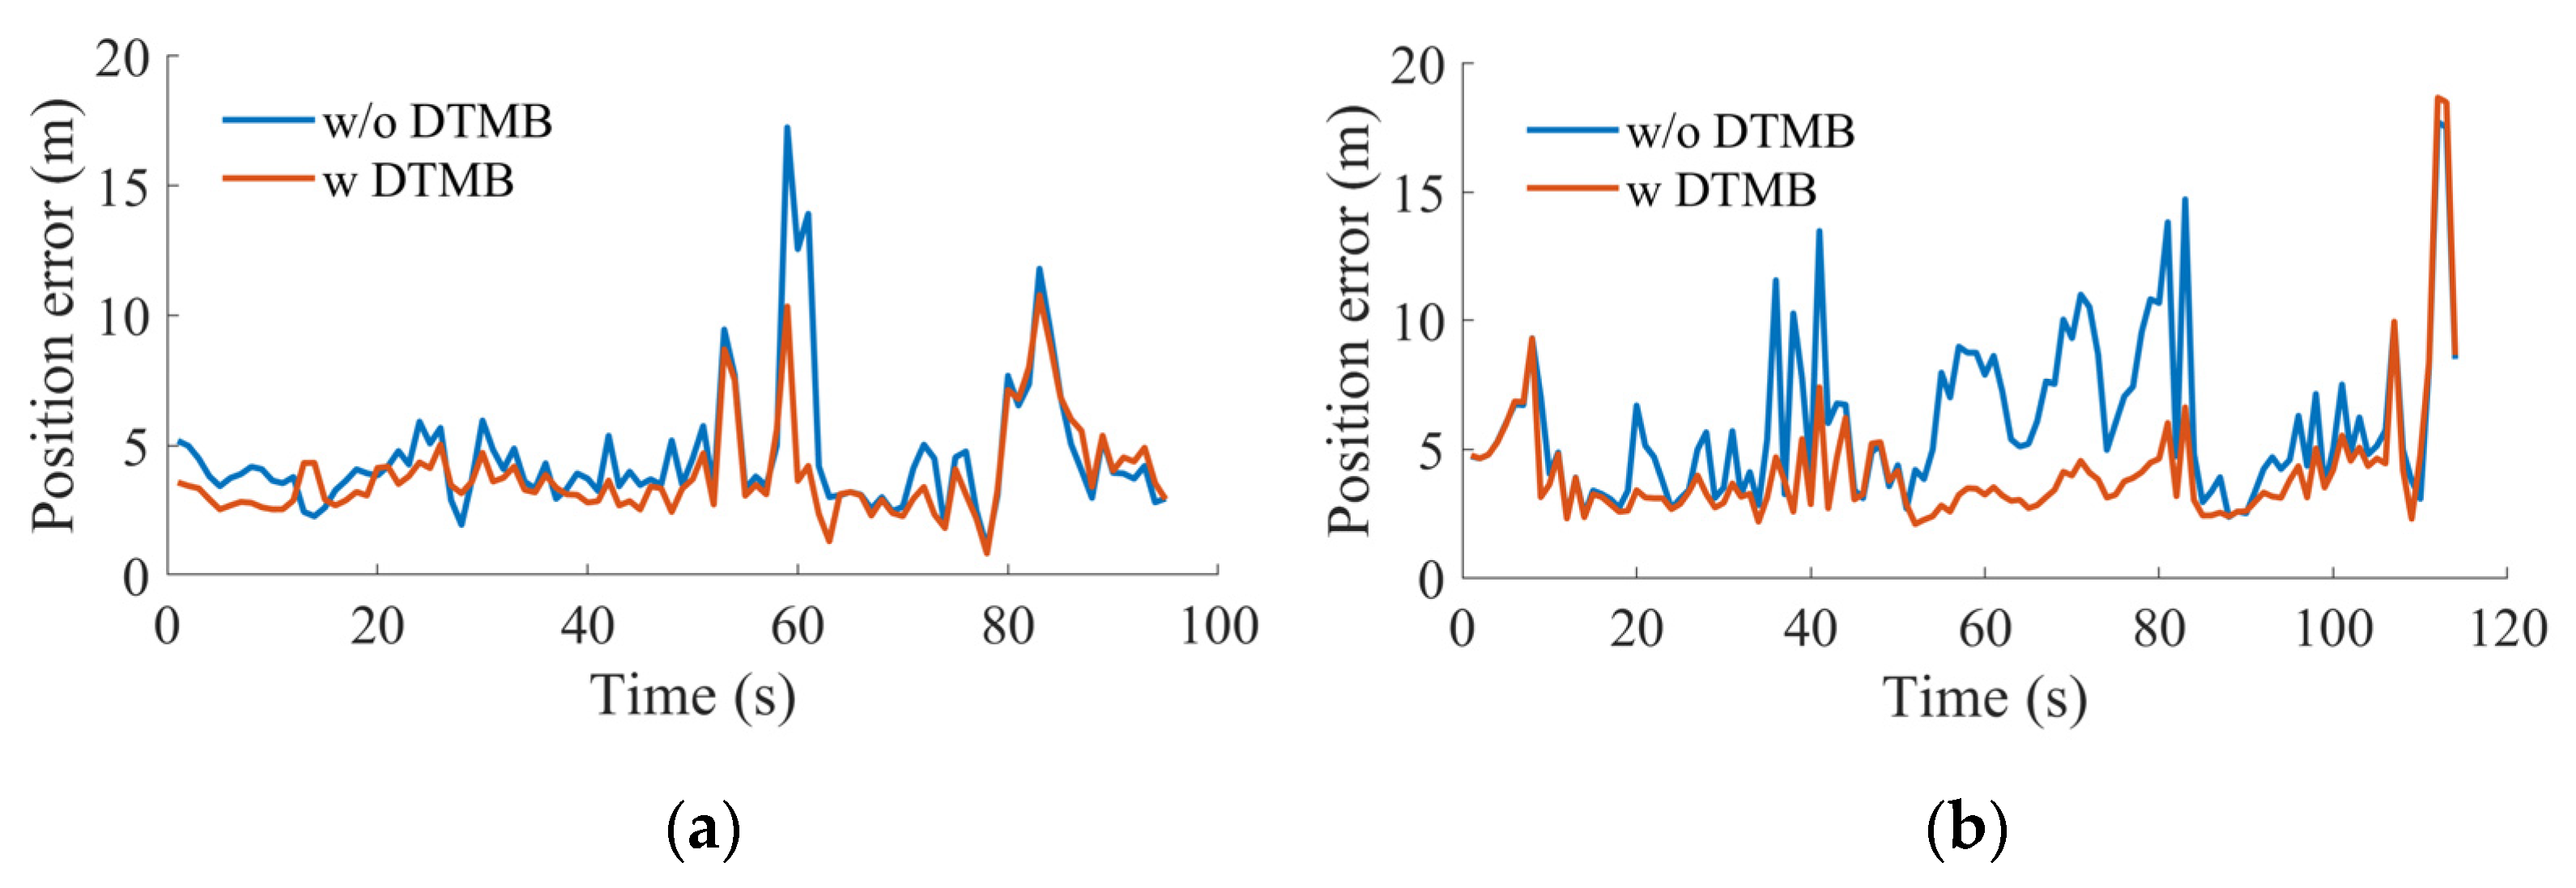
Figure 13.
Positioning error and corresponding 95th percentile uncertainty ellipsoid in ENU frame. (a) Clockwise. (b) Counter-clockwise.
Figure 13.
Positioning error and corresponding 95th percentile uncertainty ellipsoid in ENU frame. (a) Clockwise. (b) Counter-clockwise.
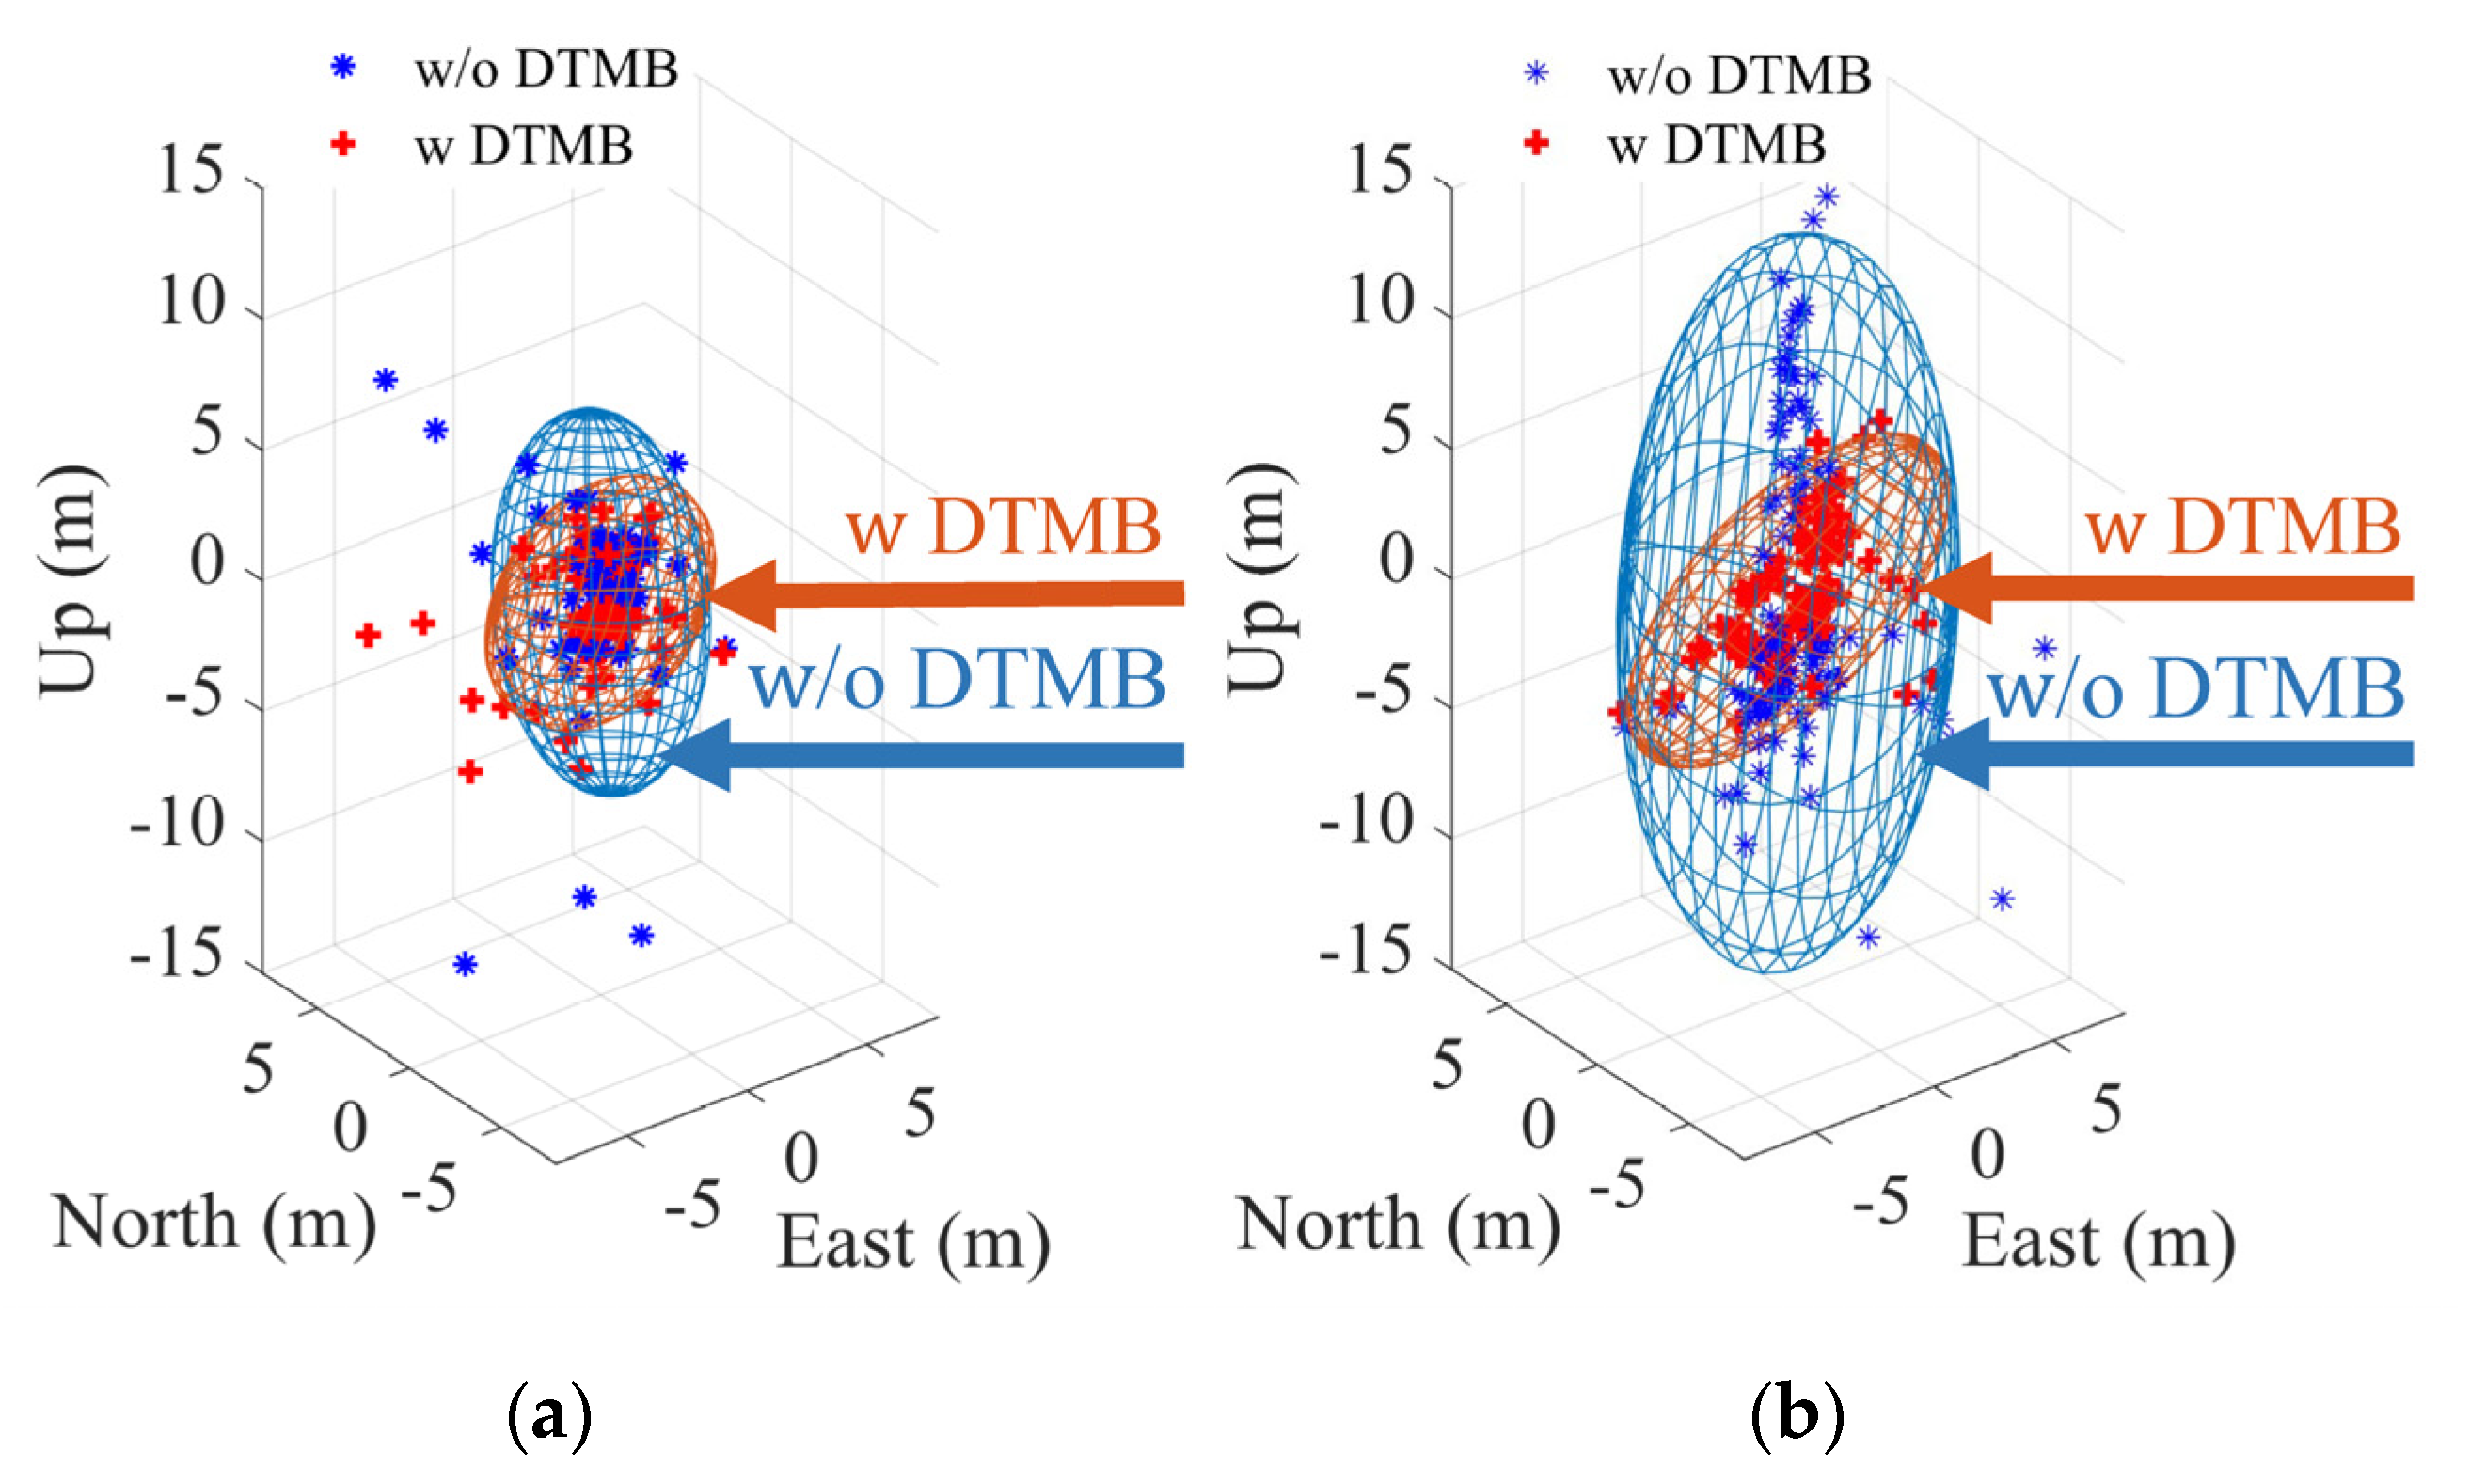
Figure 14.
Absolute position error in terms of different directions. (a) Clockwise, east direction. (b) Counter-clockwise, east direction. (c) Clockwise, north direction. (d) Counter-clockwise, north direction. (e) Clockwise, up direction. (f) Counter-clockwise, up direction.
Figure 14.
Absolute position error in terms of different directions. (a) Clockwise, east direction. (b) Counter-clockwise, east direction. (c) Clockwise, north direction. (d) Counter-clockwise, north direction. (e) Clockwise, up direction. (f) Counter-clockwise, up direction.
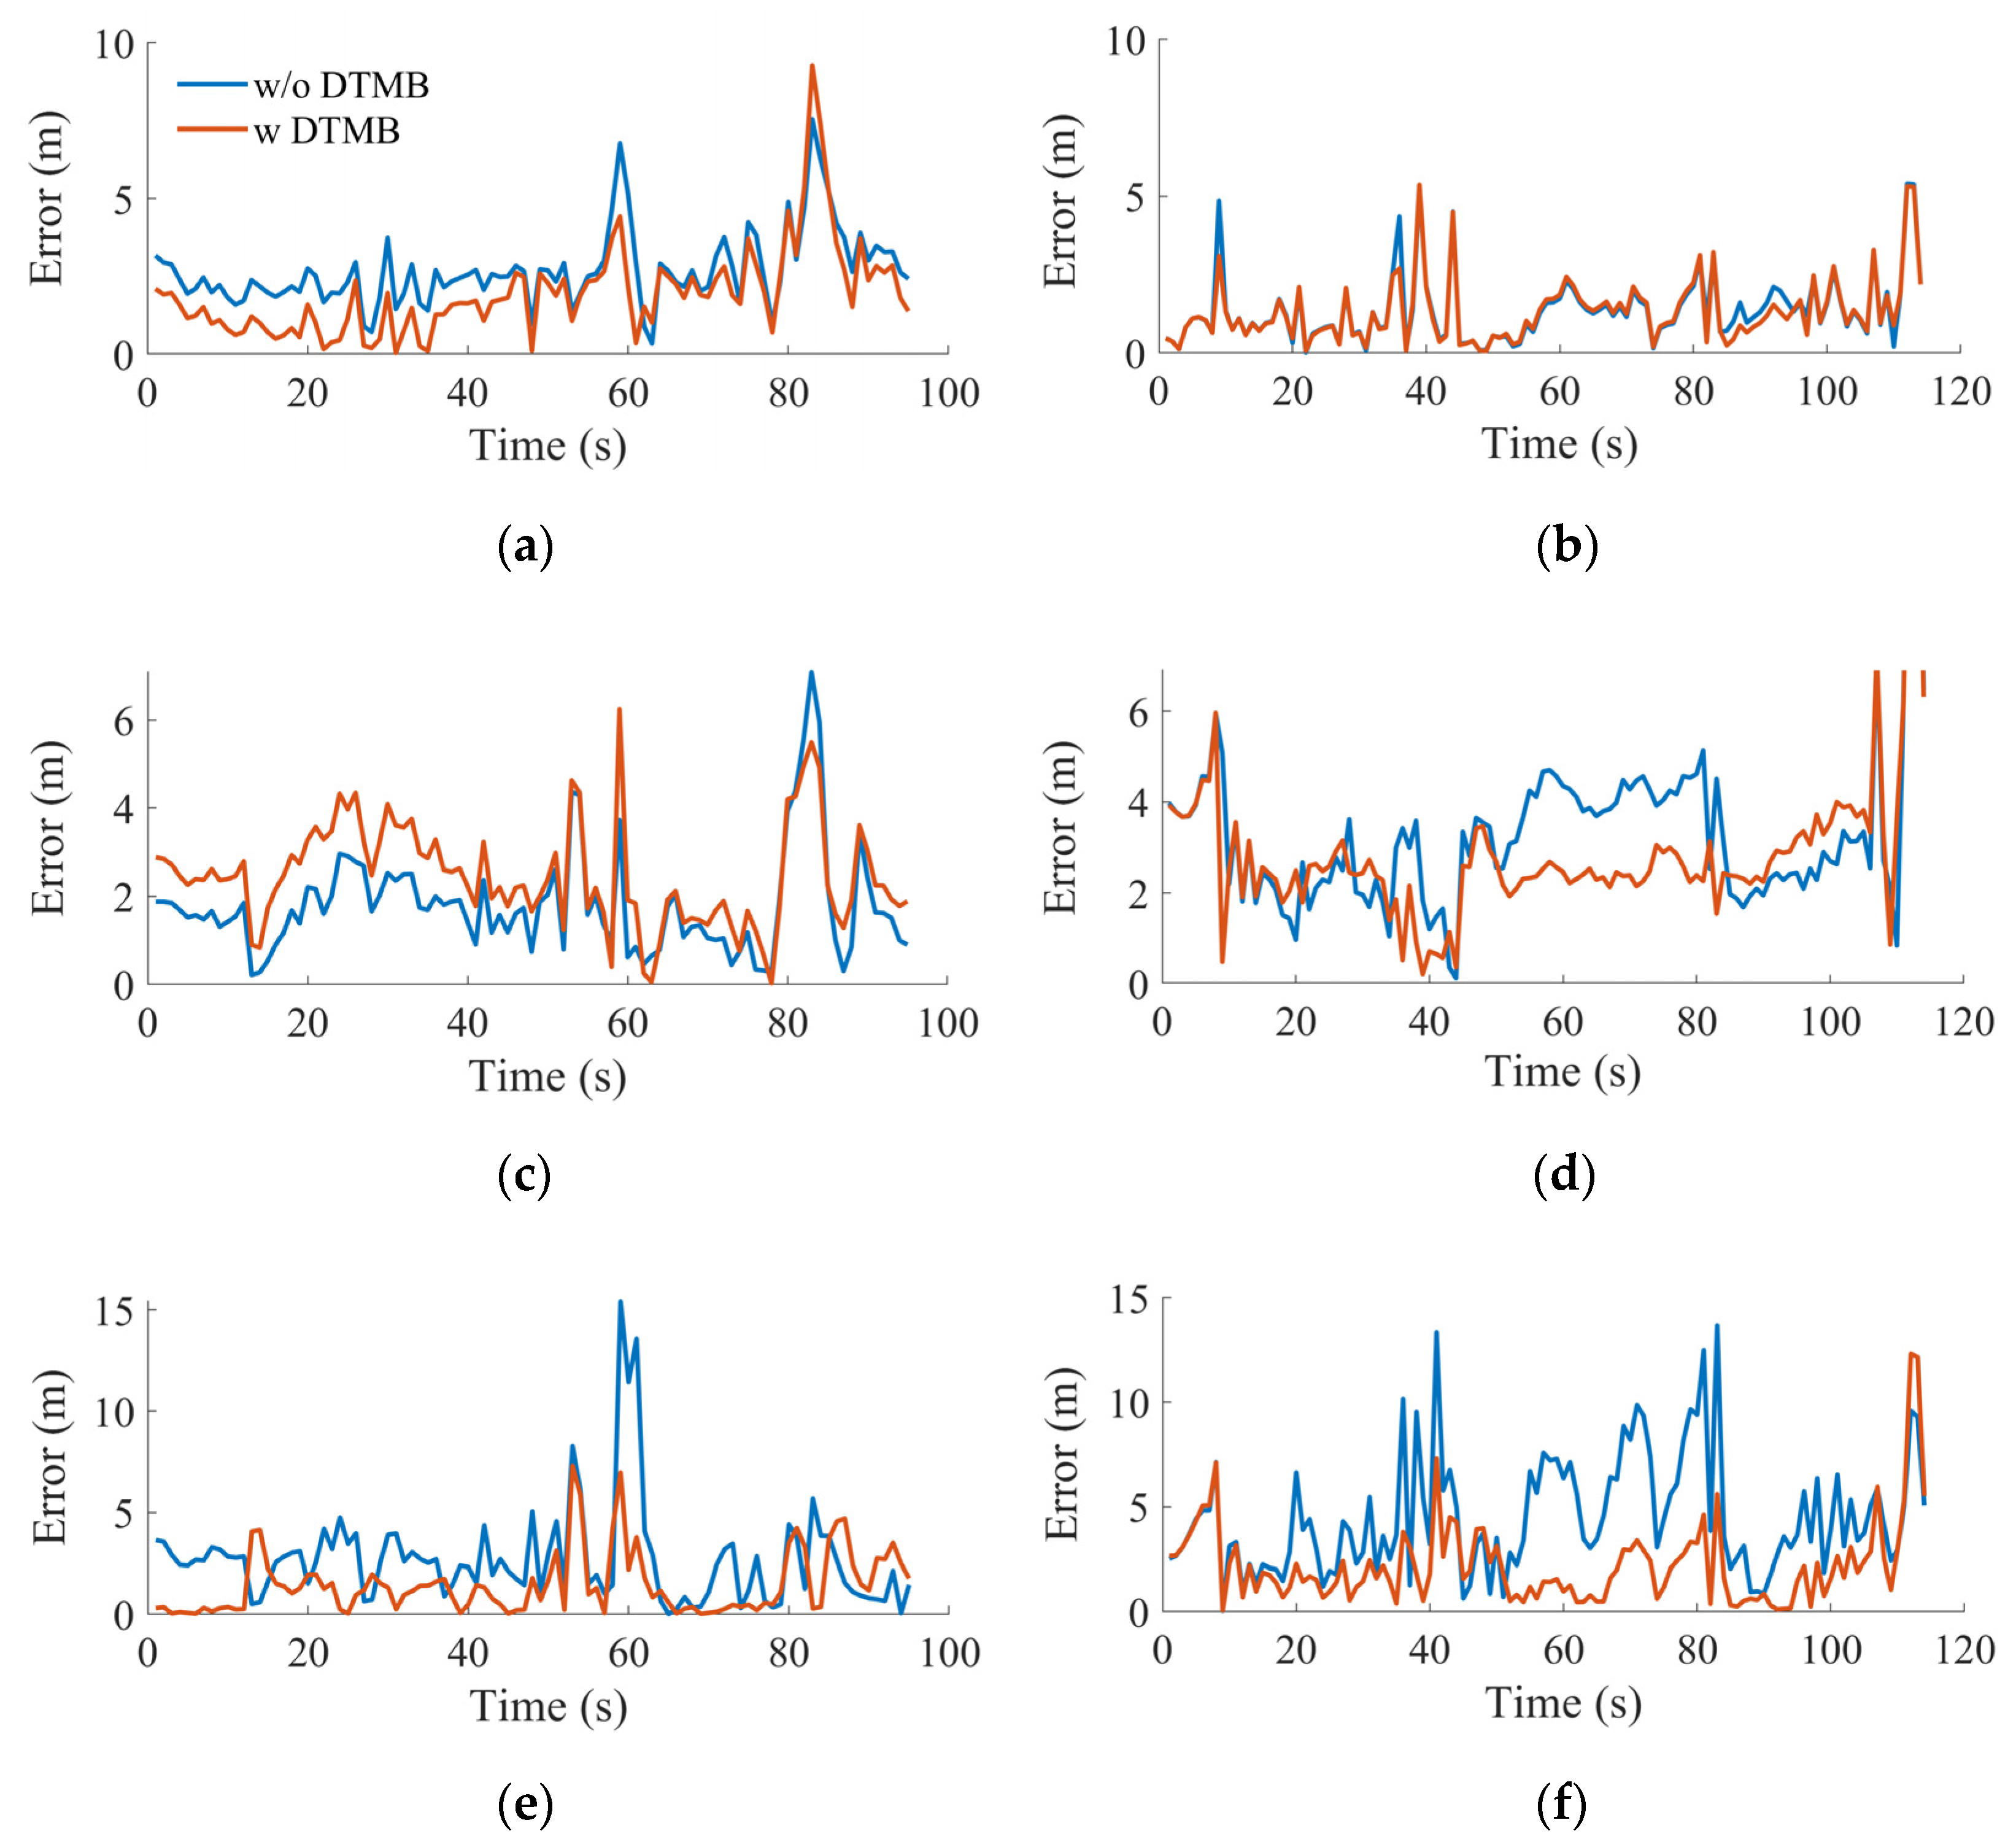
Figure 15.
VDOP results in dynamic scenario of Wuhan. (a) Clockwise. (b) Counter-clockwise.
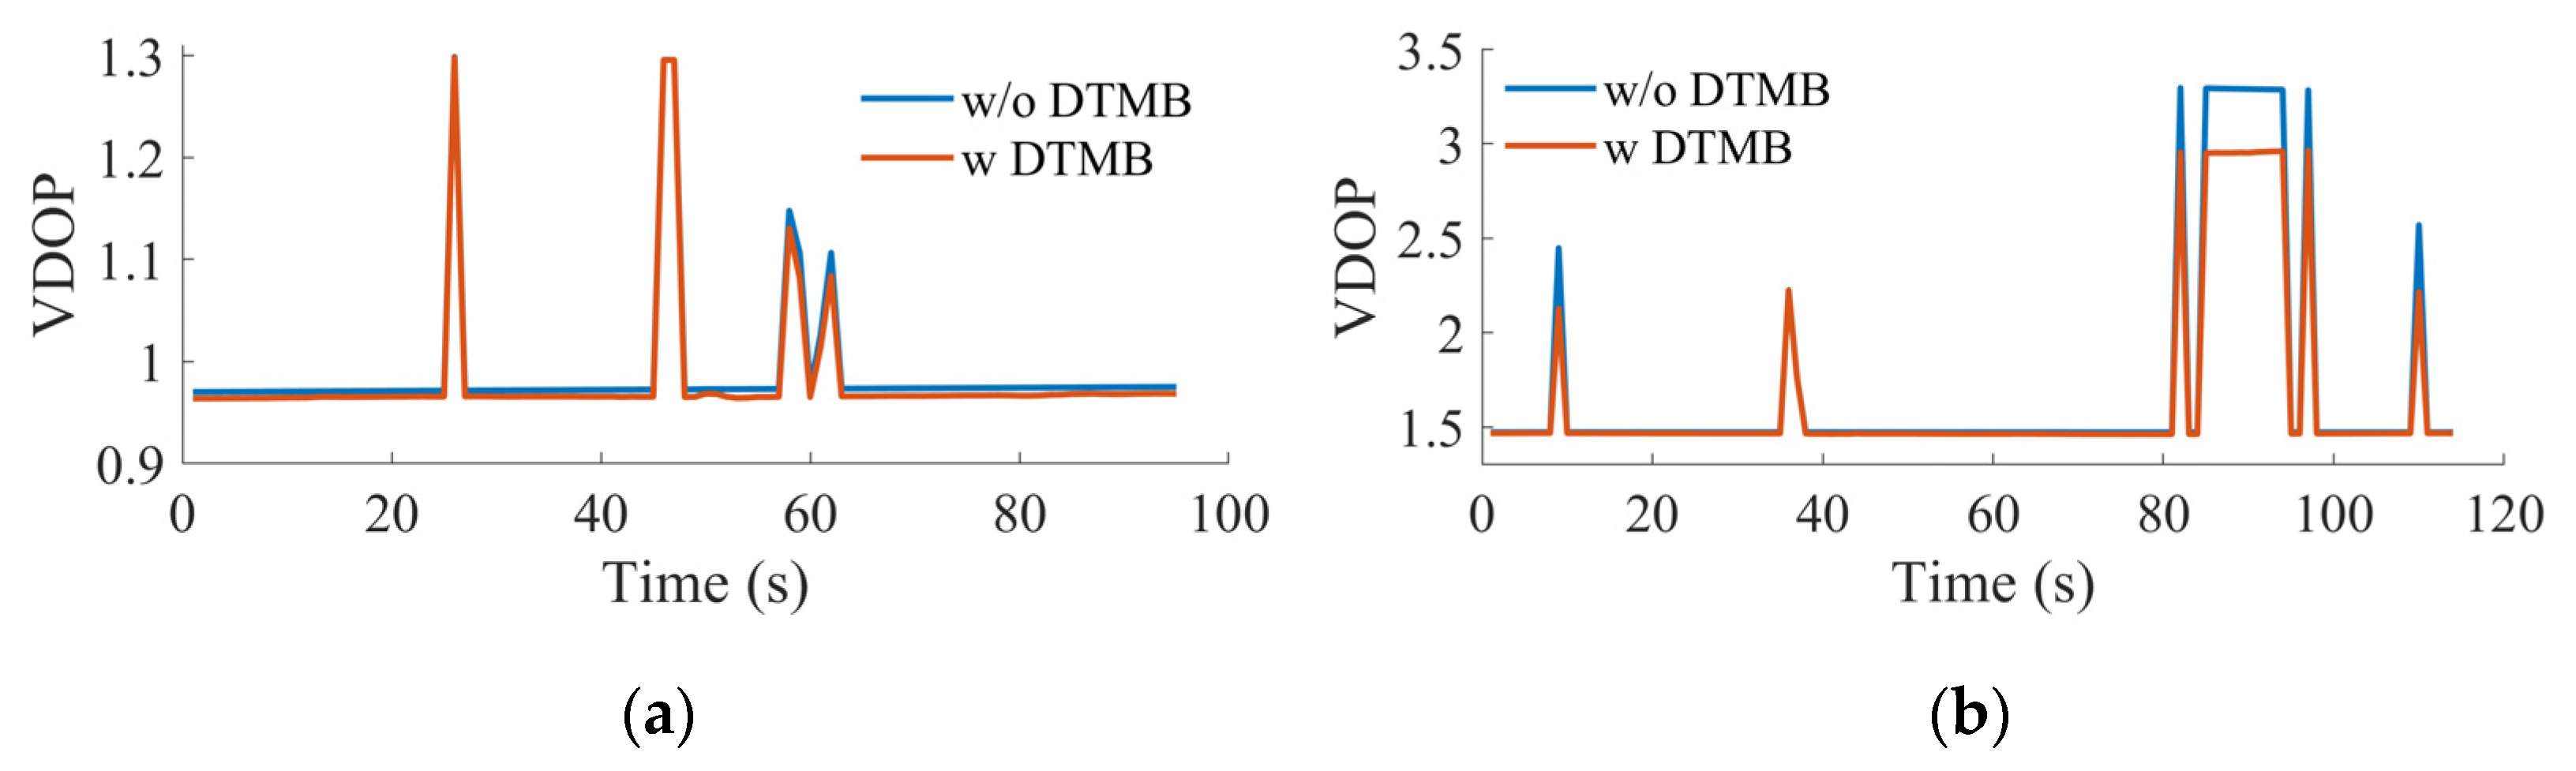
Figure 16.
Satellite skyplots in dynamic scenario of Wuhan. (a) Clockwise. (b) Counter-clockwise.
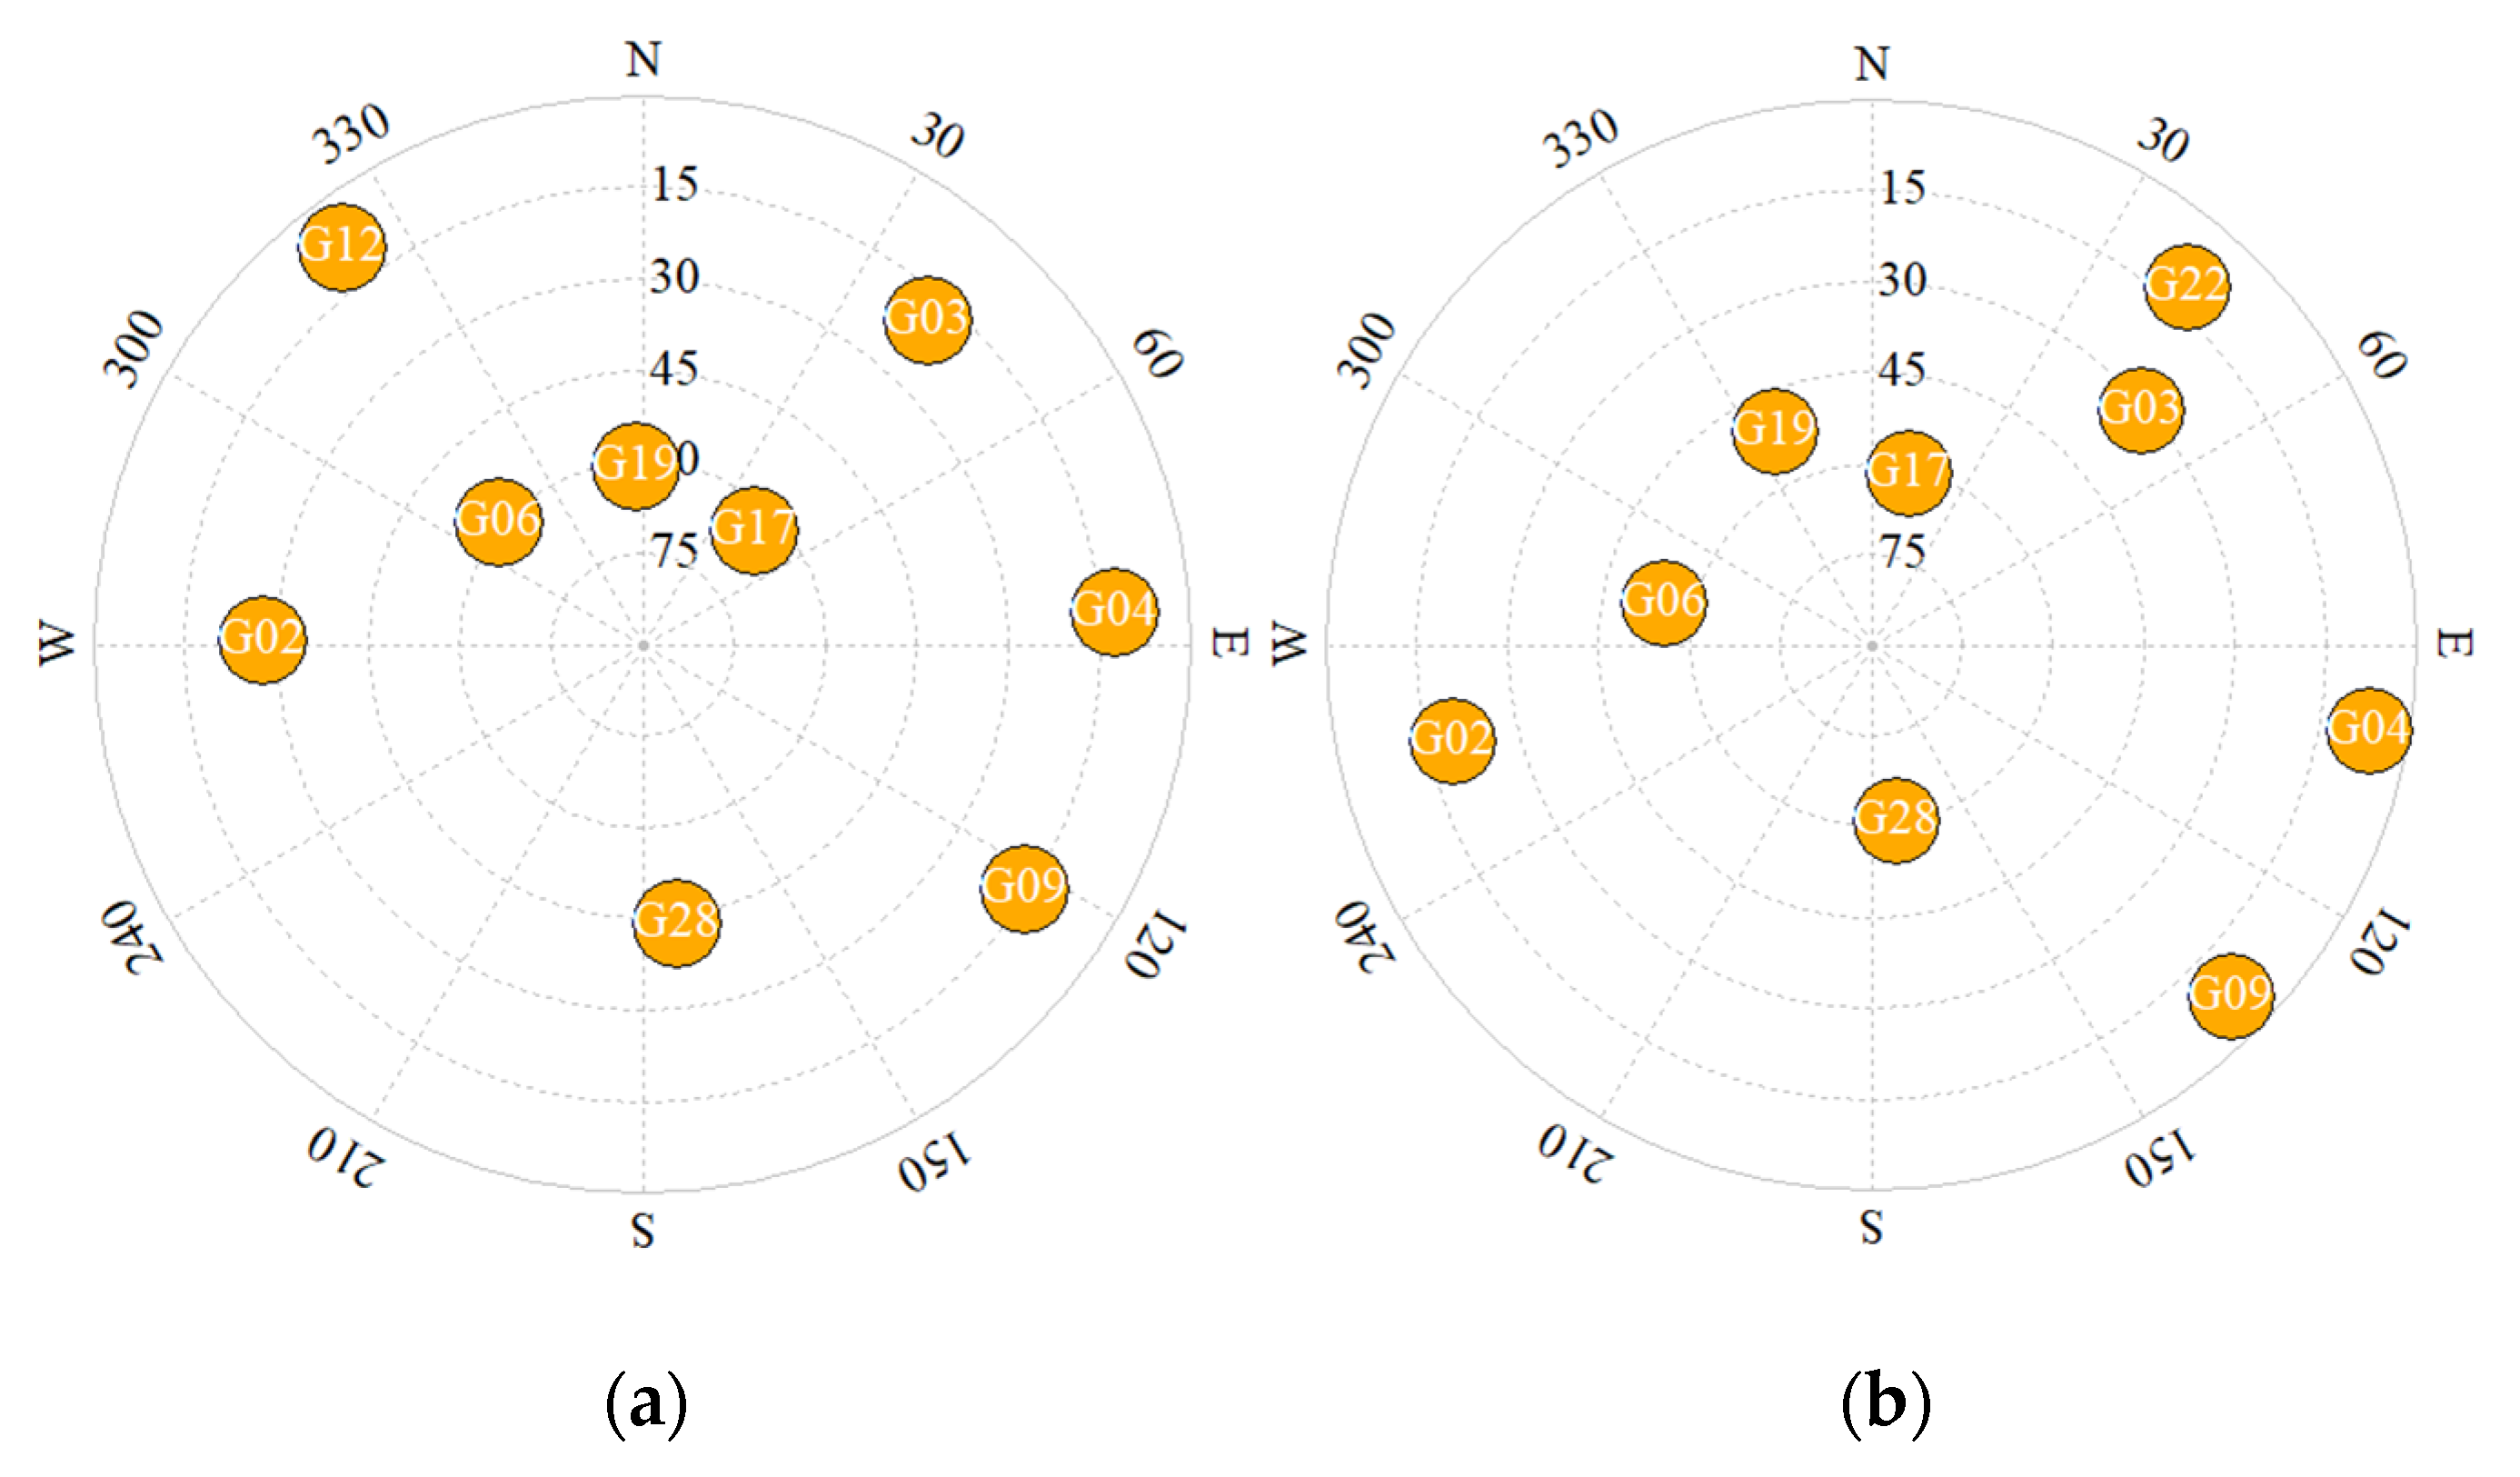
Figure 17.
Time series of selected GPS PRN when 4 satellites are visible. (a) Clockwise. (b) Counter-clockwise.
Figure 17.
Time series of selected GPS PRN when 4 satellites are visible. (a) Clockwise. (b) Counter-clockwise.
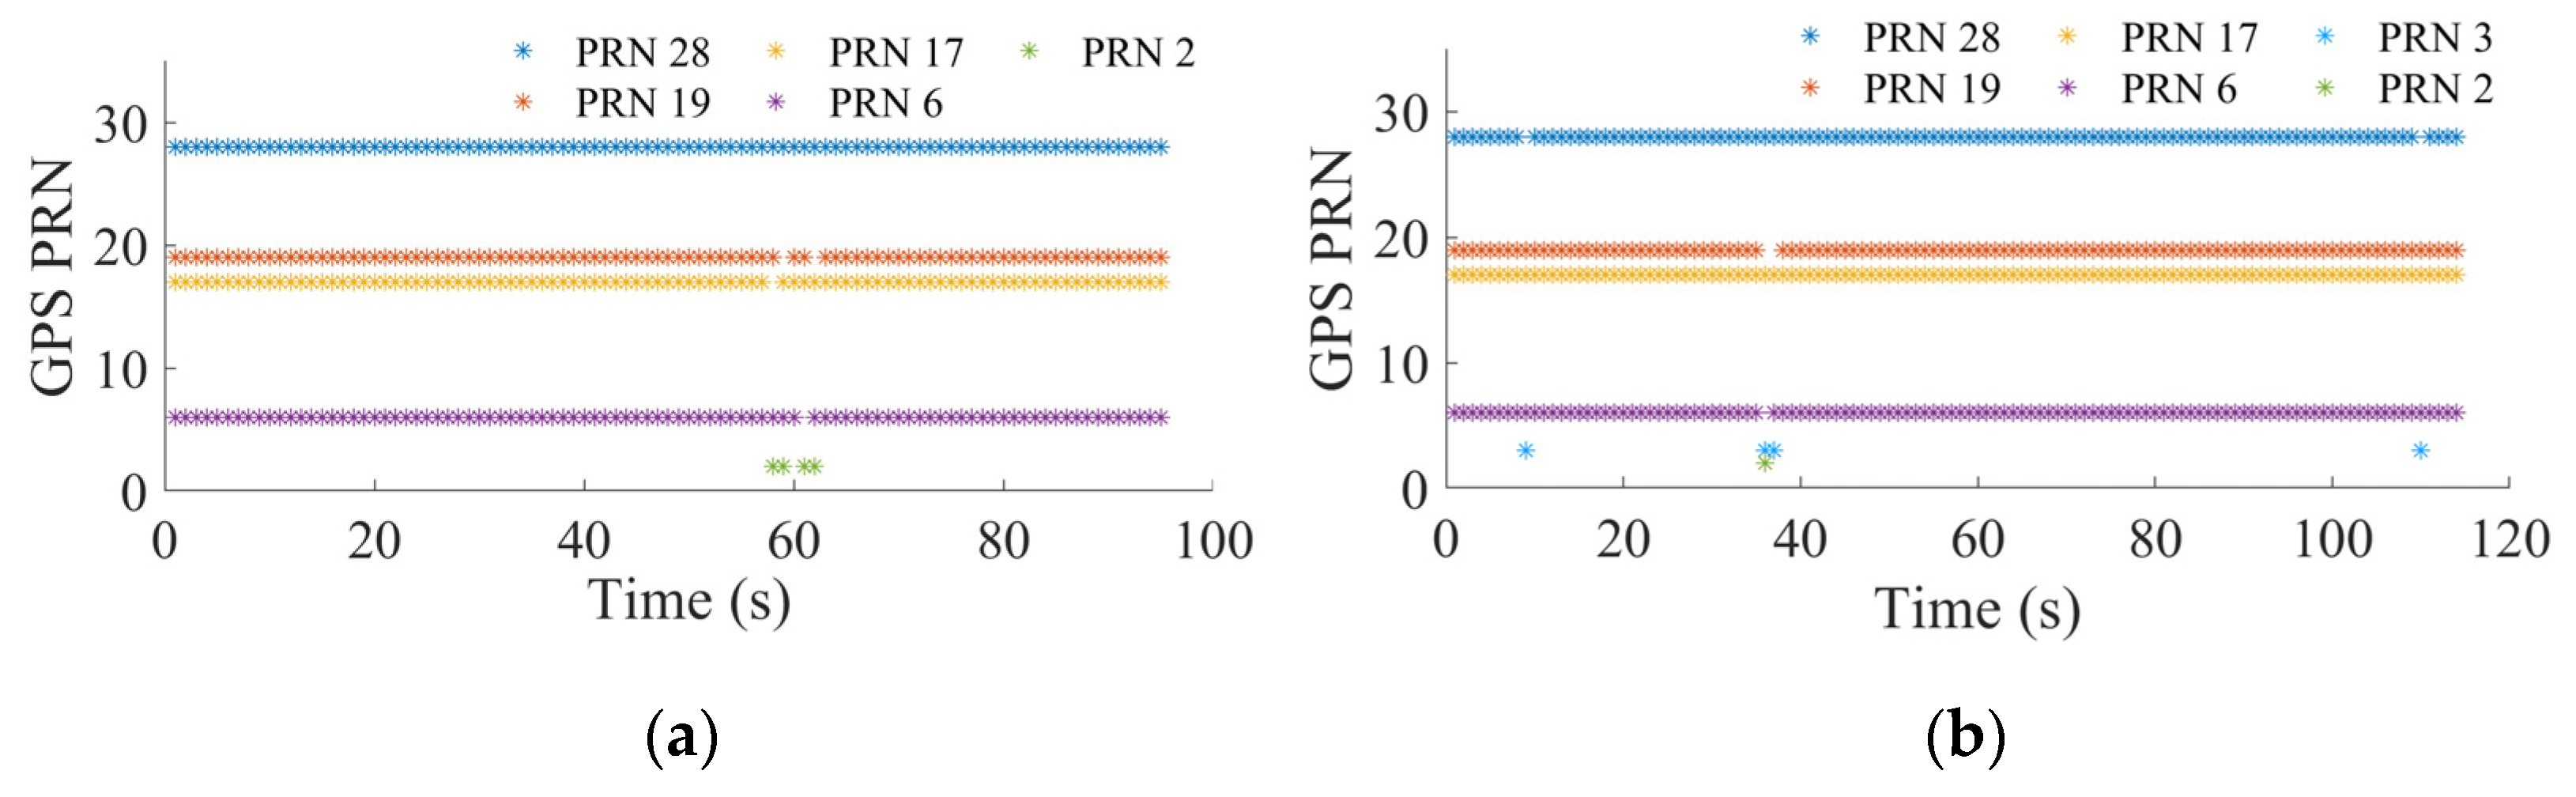
Figure 18.
Position error time series when 4 satellites are visible. (a) Clockwise. (b) Counter-clockwise.
Figure 18.
Position error time series when 4 satellites are visible. (a) Clockwise. (b) Counter-clockwise.
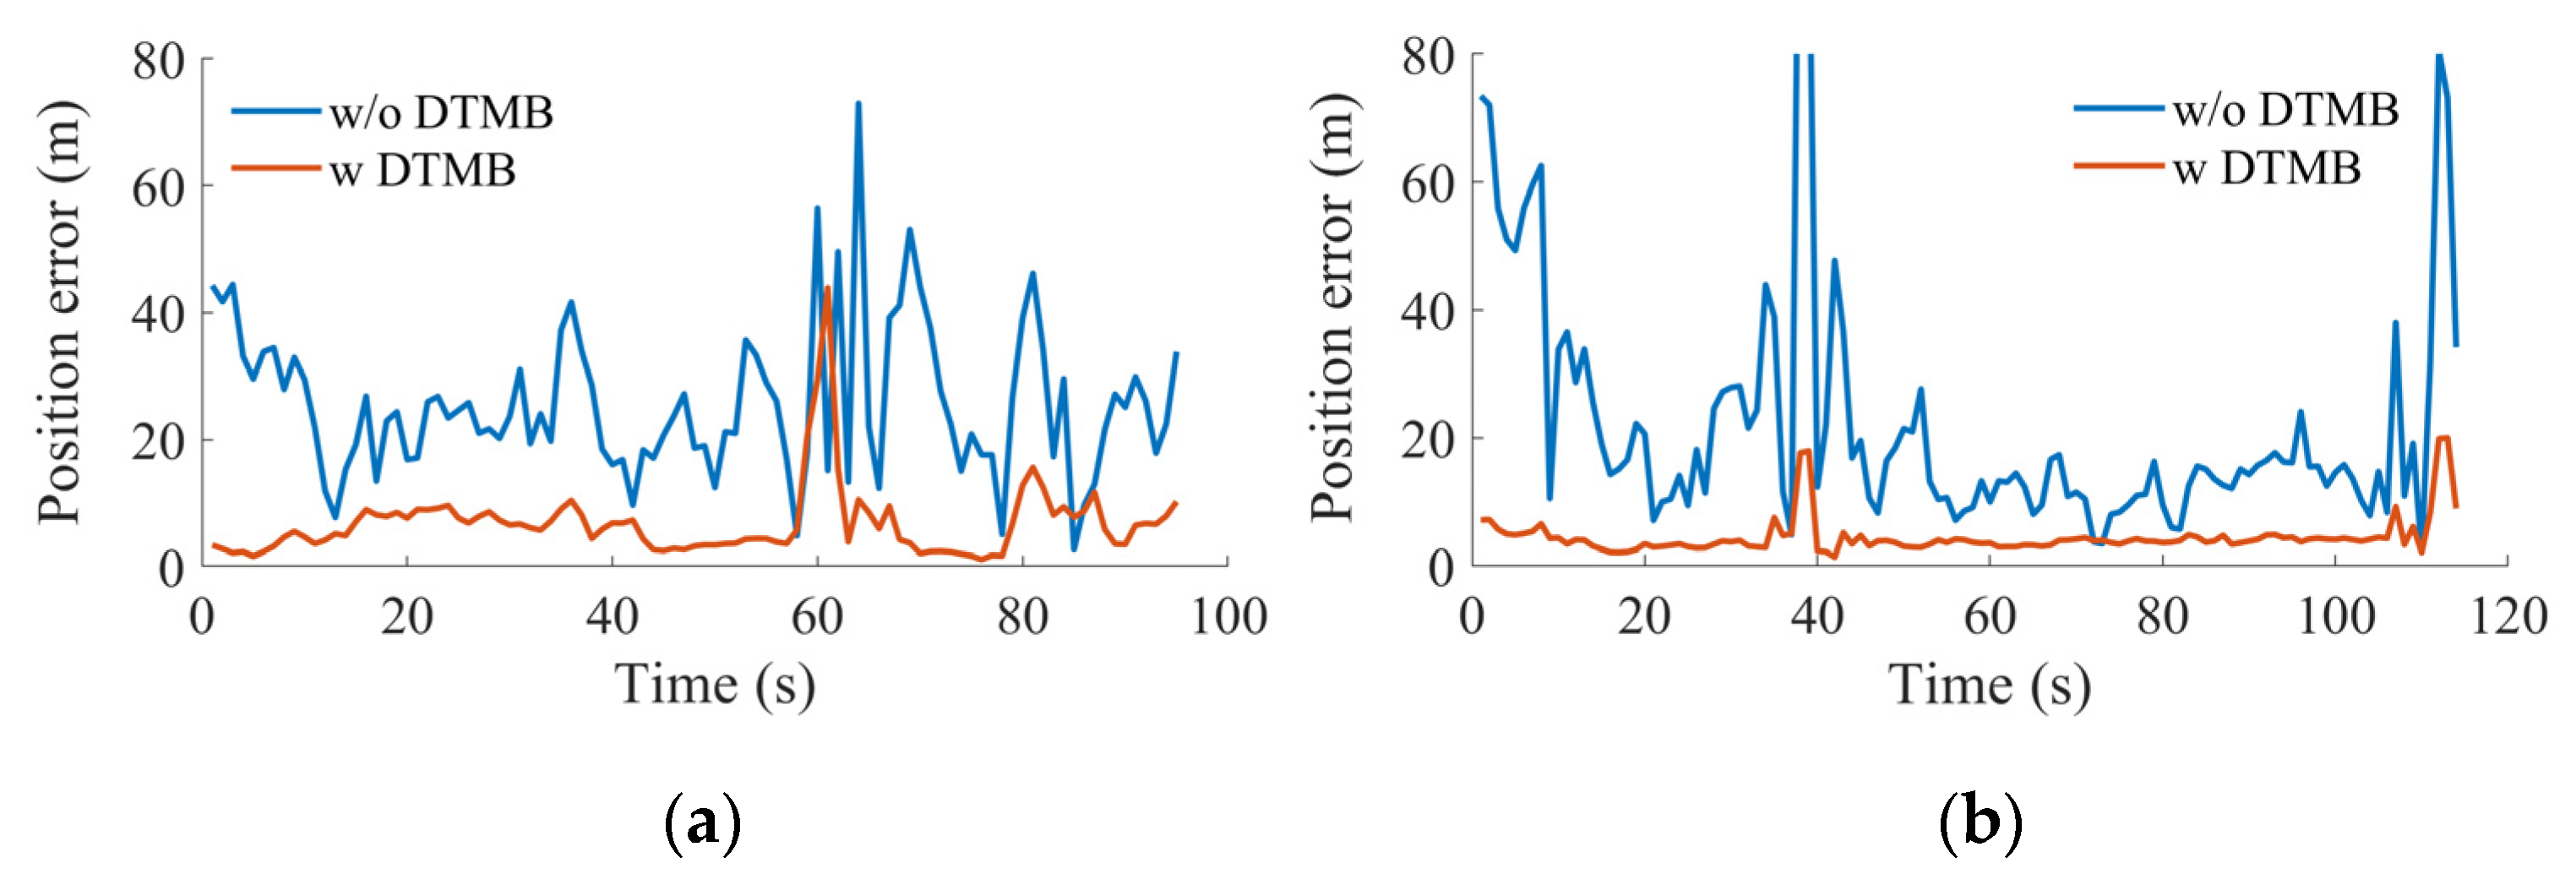
Figure 19.
PDOP results in dynamic scenario when 4 satellites are visible. (a) Clockwise. (b) Counter-clockwise.
Figure 19.
PDOP results in dynamic scenario when 4 satellites are visible. (a) Clockwise. (b) Counter-clockwise.
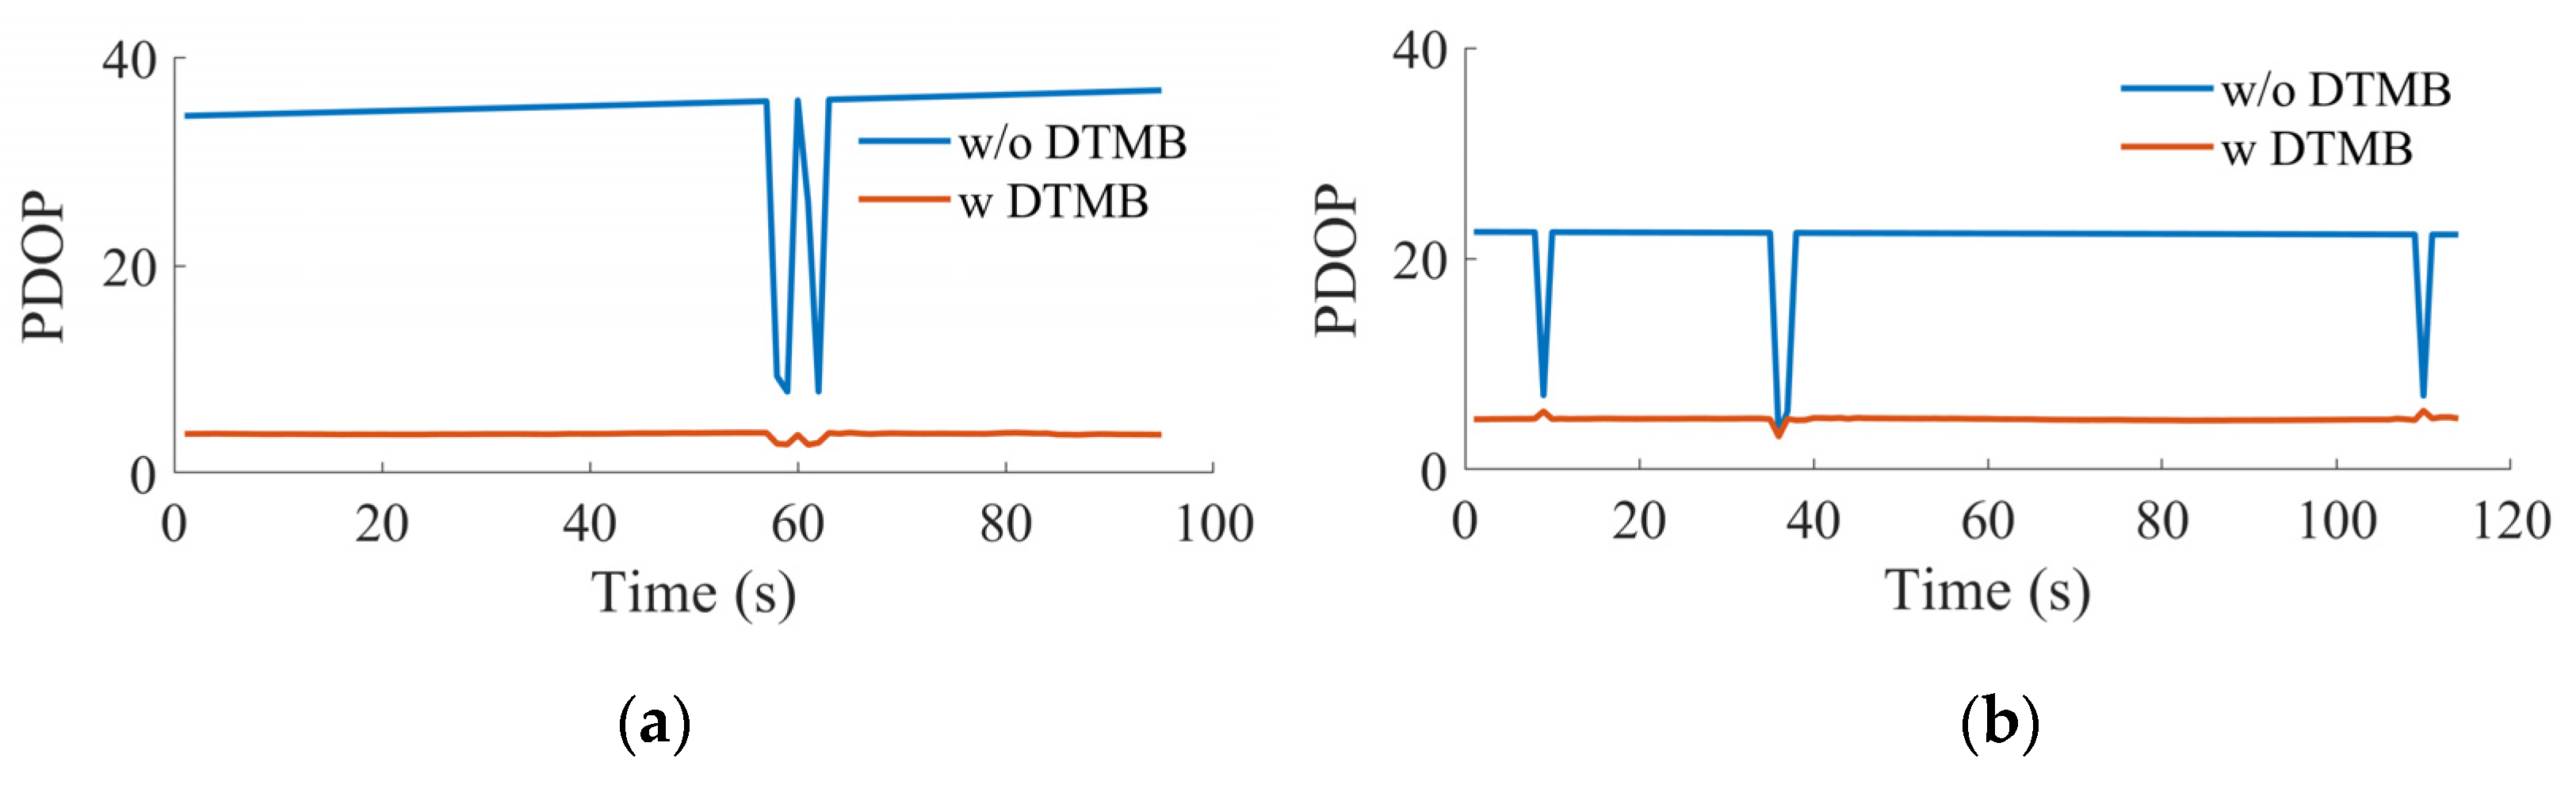
Figure 20.
Absolute position error in terms of different directions when 4 satellites are visible. (a) Clockwise, east direction. (b) Counter-clockwise, east direction. (c) Clockwise, north direction. (d) Counter-clockwise, north direction. (e) Clockwise, up direction. (f) Counter-clockwise, up direction.
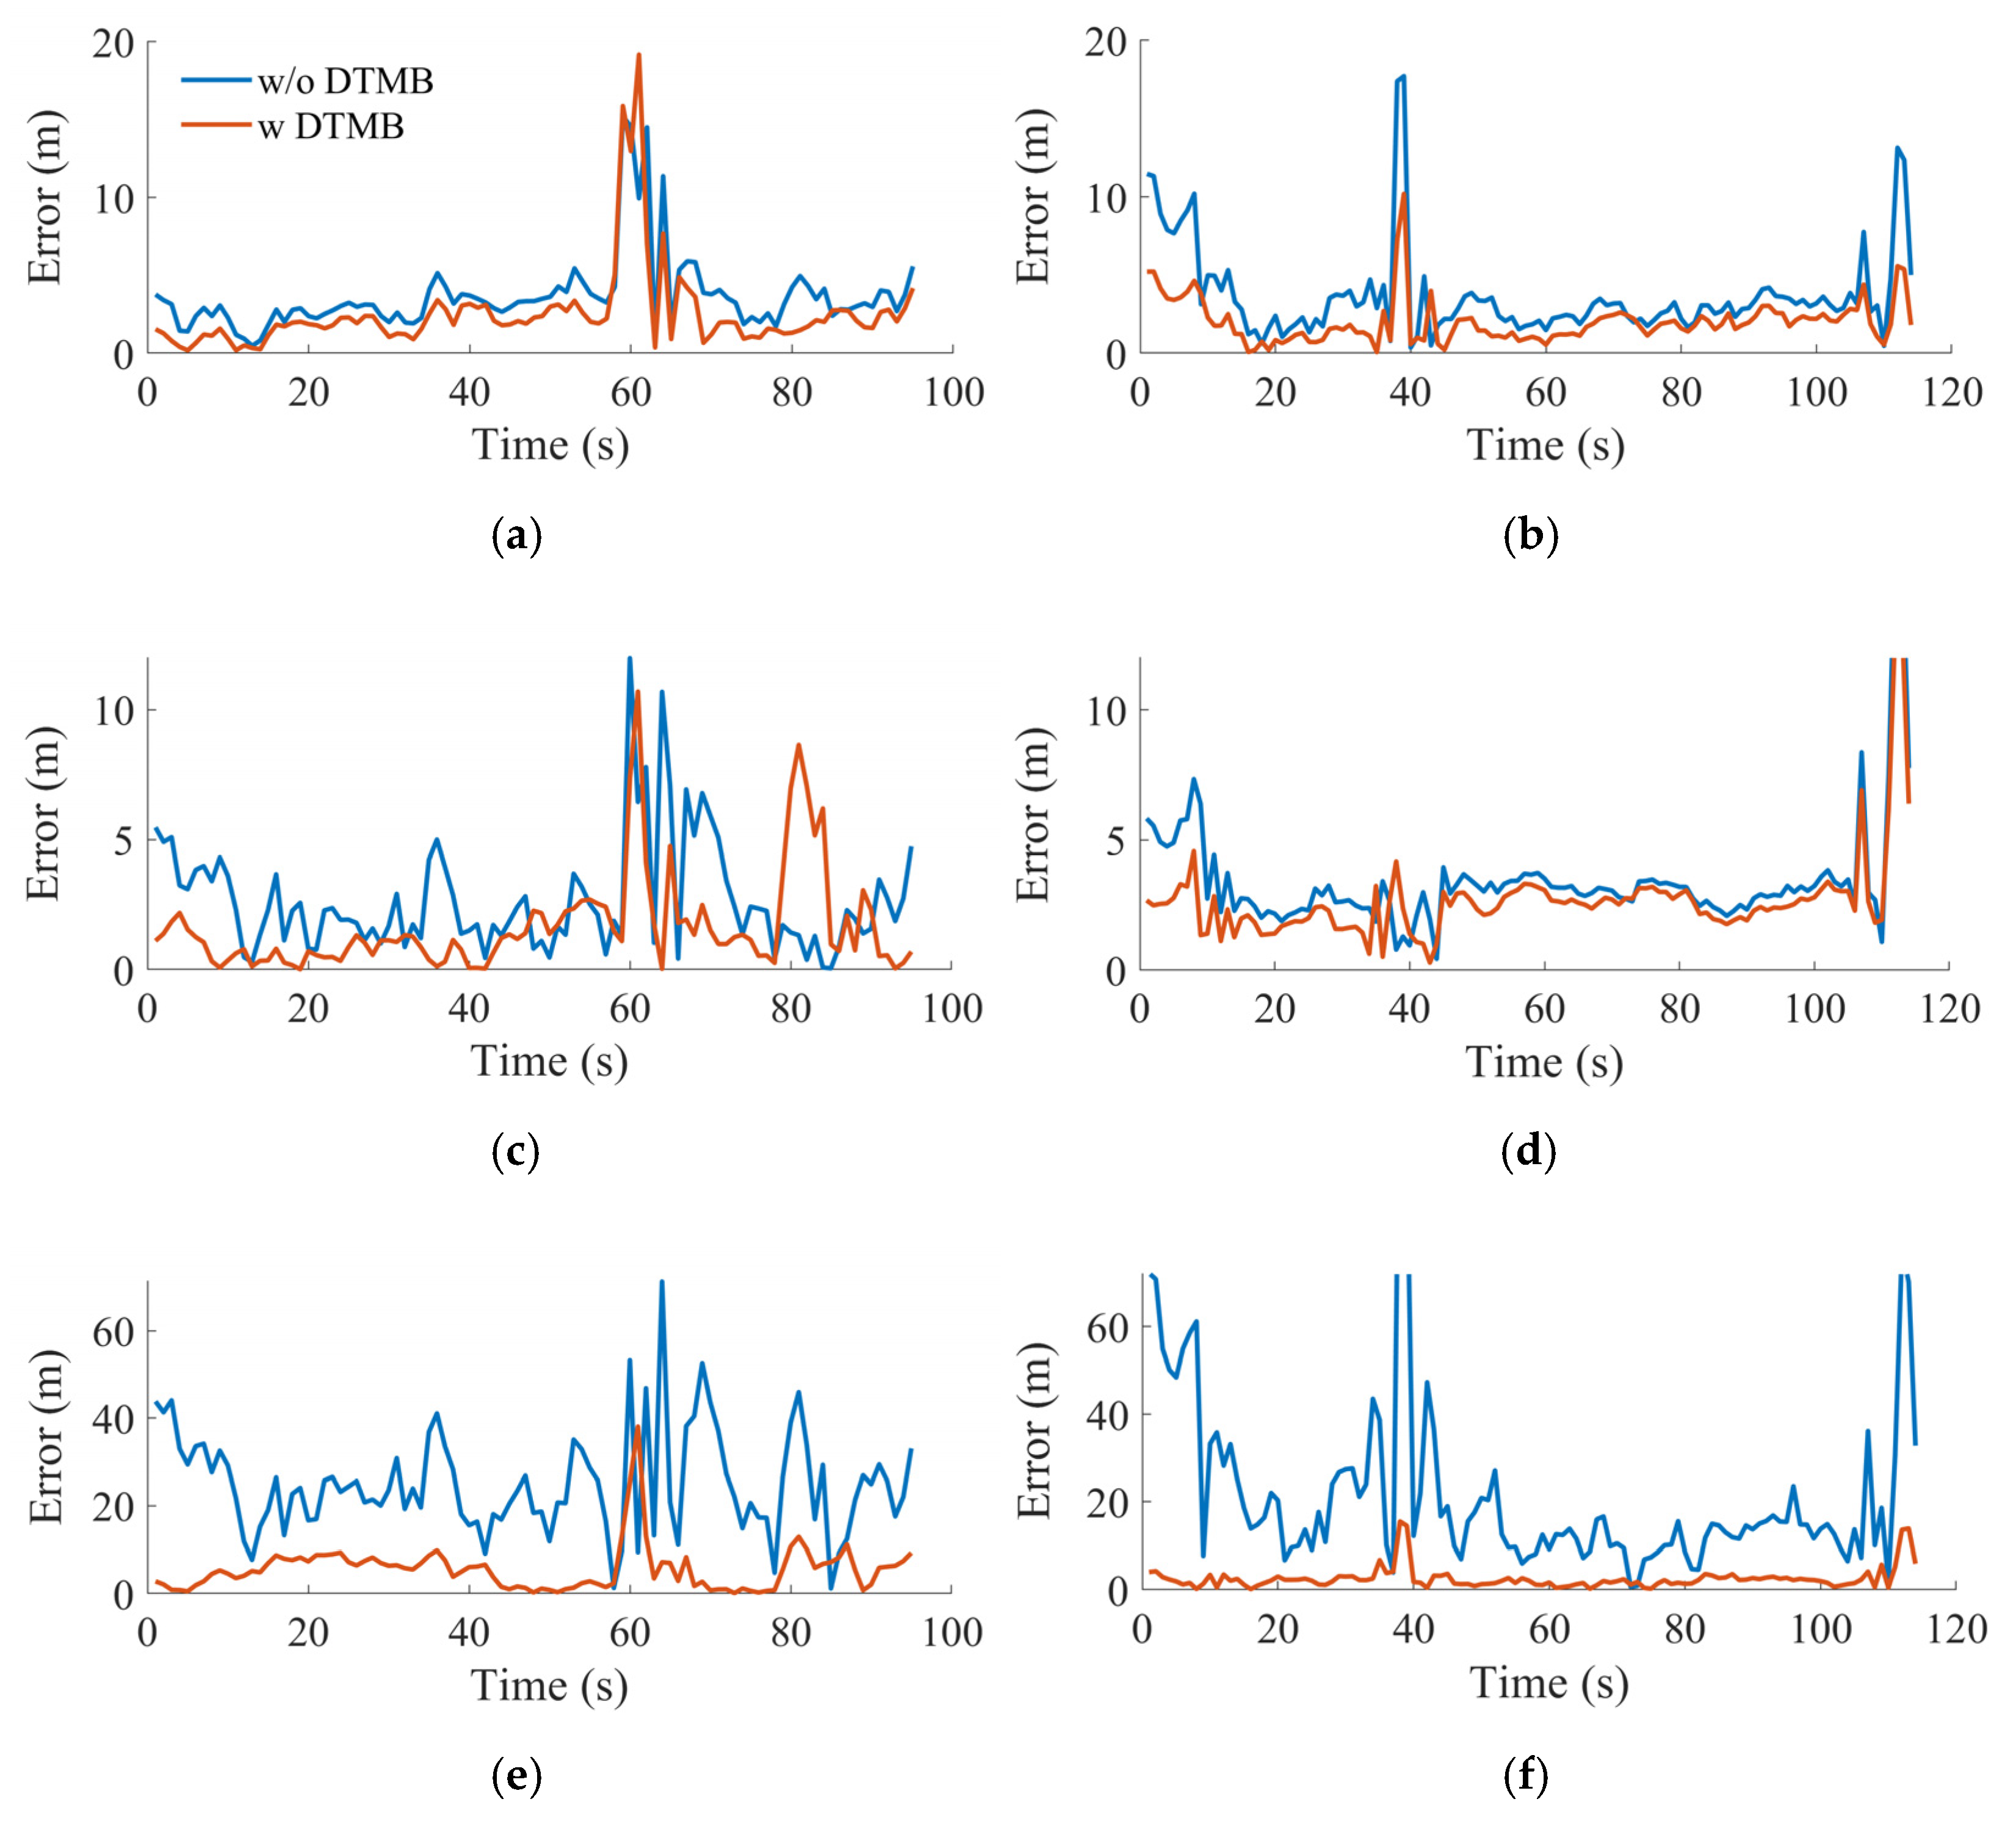
Figure 21.
Positioning error and corresponding 95th percentile uncertainty ellipsoid in ENU frame. (a) Clockwise. (b) Counter-clockwise.
Figure 21.
Positioning error and corresponding 95th percentile uncertainty ellipsoid in ENU frame. (a) Clockwise. (b) Counter-clockwise.

Figure 22.
Time series of selected GPS PRN when 3 satellites are visible. (a) Clockwise. (b) Counter-clockwise.
Figure 22.
Time series of selected GPS PRN when 3 satellites are visible. (a) Clockwise. (b) Counter-clockwise.
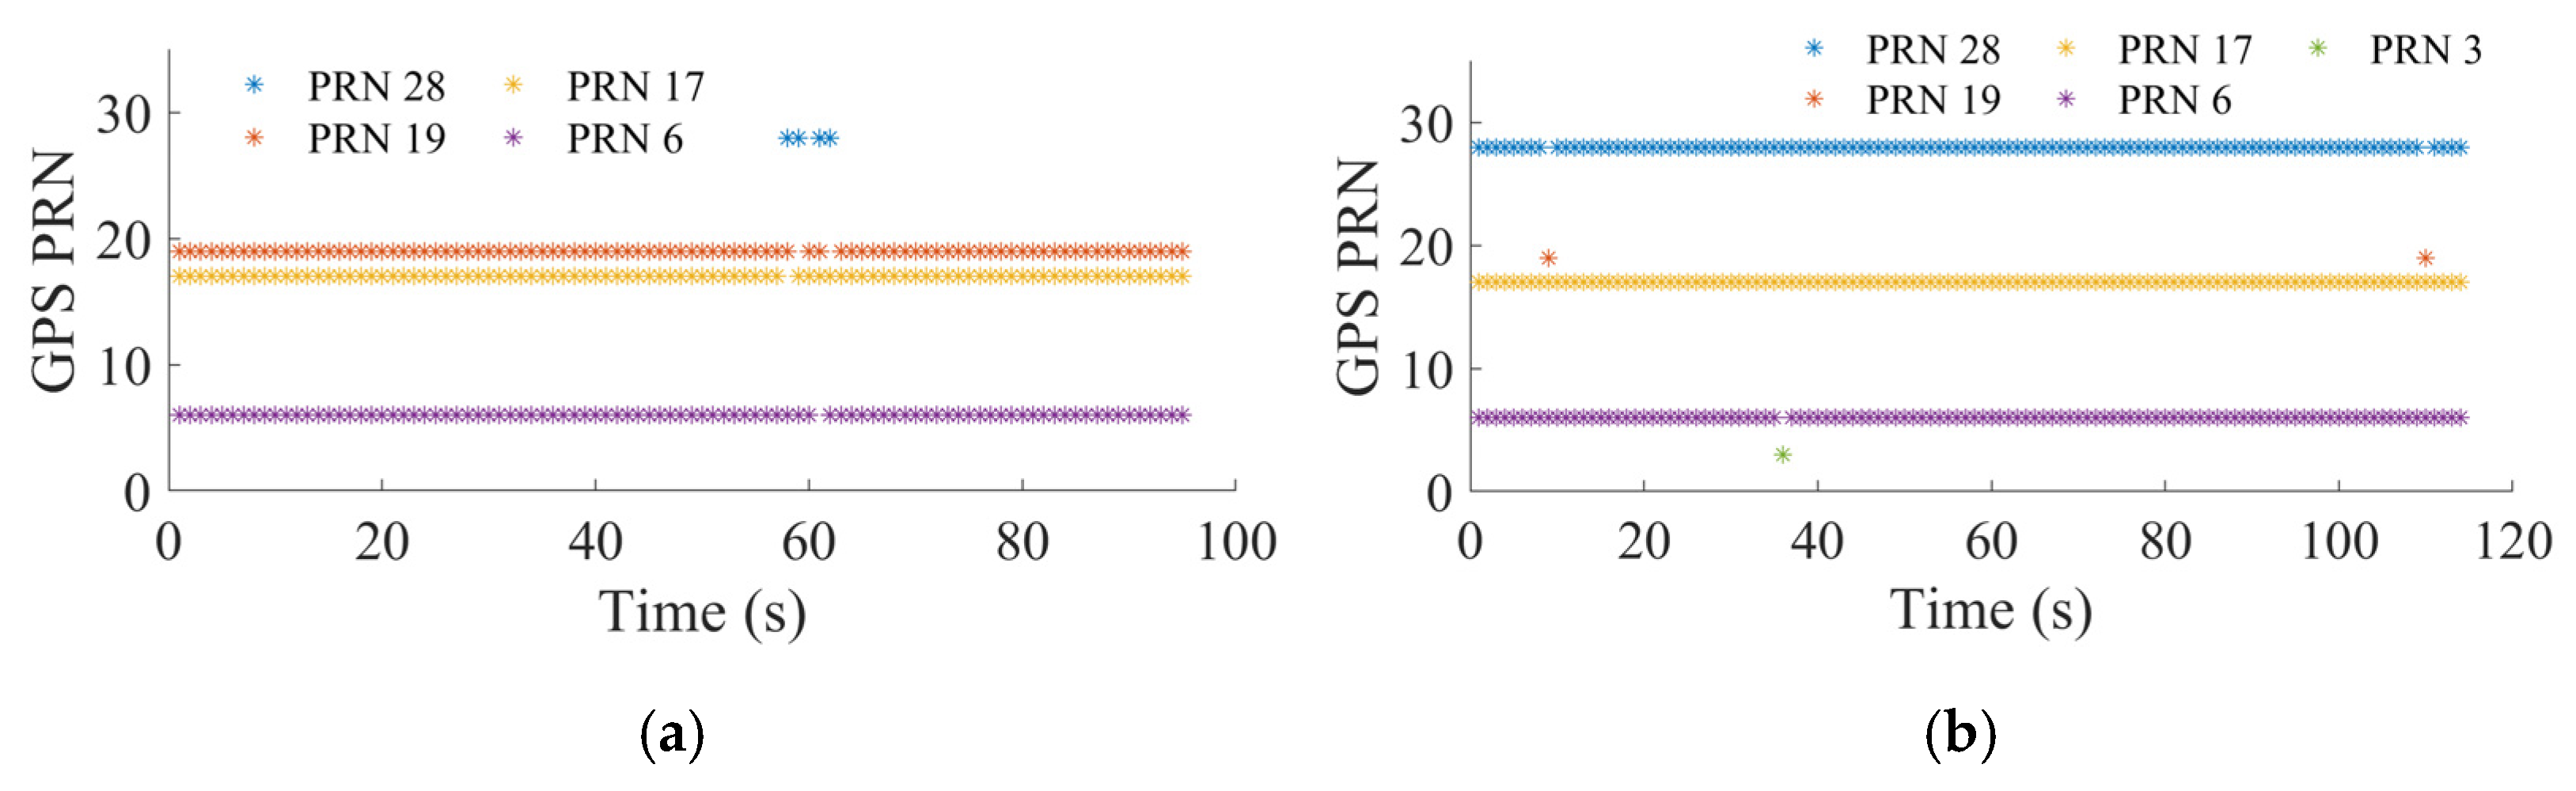
Figure 23.
Position error and PDOP when 3 satellites are visible. (a) Clockwise. (b) Counter-clockwise.
Figure 23.
Position error and PDOP when 3 satellites are visible. (a) Clockwise. (b) Counter-clockwise.

Table 1.
Receiving details of the signal channel in field tests.
| City | PN Mode | Channel | Central Frequency (MHz) | Transmitter [39] | Application |
|---|---|---|---|---|---|
| Luoyang | 420 | 21 | 538 | Xinan (22.9 km) | Static/Dynamic |
| 420 | 24+2 | 578 | Luoyang (10.2 km) | Static/Dynamic | |
| 420 | 31 | 658 | Mengjin (10.9 k) | Static/Dynamic | |
| Wuhan | 420 | 17 | 506 | Xishan (52.7 km) | Static |
| 945 | 26 | 618 | Guishan (7.9 km) | Static/Dynamic | |
| 420 | 33 | 674 | Macheng (95.8 km) | Static | |
| 945 | 47 | 786 | Huangpi (38.2 km) | Static | |
| 420 | 48 | 794 | Xishan | Static |
Table 2.
Error metrics of static field tests.
| Channel | Mean (m) | Std. (m) |
|---|---|---|
| 21 | −0.0052 | 0.1545 |
| 24+2 | −0.2627 | 0.2162 |
| 31 | −0.0071 | 0.0657 |
| 17 | 2.6519 | 1.5501 |
| 26 | 0.0703 | 0.0410 |
| 33 | 0.4391 | 0.8892 |
| 47 | −0.3871 | 0.1696 |
| 48 | 0.1134 | 0.3543 |
Disclaimer/Publisher’s Note: The statements, opinions and data contained in all publications are solely those of the individual author(s) and contributor(s) and not of MDPI and/or the editor(s). MDPI and/or the editor(s) disclaim responsibility for any injury to people or property resulting from any ideas, methods, instructions or products referred to in the content. |
© 2023 by the authors. Licensee MDPI, Basel, Switzerland. This article is an open access article distributed under the terms and conditions of the Creative Commons Attribution (CC BY) license (https://creativecommons.org/licenses/by/4.0/).
Share and Cite
MDPI and ACS Style
Jiao, Z.; Chen, L.; Lu, X.; Liu, Z.; Zhou, X.; Zhuang, Y.; Guo, G. Carrier Phase Ranging with DTMB Signals for Urban Pedestrian Localization and GNSS Aiding. Remote Sens. 2023, 15, 423. https://doi.org/10.3390/rs15020423
AMA Style
Jiao Z, Chen L, Lu X, Liu Z, Zhou X, Zhuang Y, Guo G. Carrier Phase Ranging with DTMB Signals for Urban Pedestrian Localization and GNSS Aiding. Remote Sensing. 2023; 15(2):423. https://doi.org/10.3390/rs15020423
Chicago/Turabian StyleJiao, Zhenhang, Liang Chen, Xiangchen Lu, Zhaoliang Liu, Xin Zhou, Yuan Zhuang, and Guangyi Guo. 2023. "Carrier Phase Ranging with DTMB Signals for Urban Pedestrian Localization and GNSS Aiding" Remote Sensing 15, no. 2: 423. https://doi.org/10.3390/rs15020423
Note that from the first issue of 2016, this journal uses article numbers instead of page numbers. See further details here.