Article

Accuracy Evaluation and Branch Detection Method of 3D Modeling Using Backpack 3D Lidar SLAM and UAV-SfM for Peach Trees during the Pruning Period in Winter

1
Research Center for Agricultural Robotics, National Agricultural Food Research Organization, Tsukuba 305-0856, Japan
2
Research Center for Agricultural Information Technology, National Agricultural Food Research Organization, Tsukuba 305-0856, Japan
3
Institute of Fruit Tree and Tea Science, National Agricultural Food Research Organization, Tsukuba 305-0856, Japan
*
Author to whom correspondence should be addressed.
Remote Sens. 2023, 15(2), 408; https://doi.org/10.3390/rs15020408
Submission received: 29 November 2022 / Revised: 4 January 2023 / Accepted: 5 January 2023 / Published: 9 January 2023
(This article belongs to the Special Issue 3D Modelling and Mapping for Precision Agriculture)

Abstract

:
In the winter pruning operation of deciduous fruit trees, the number of pruning branches and the structure of the main branches greatly influence the future growth of the fruit trees and the final harvest volume. Terrestrial laser scanning (TLS) is considered a feasible method for the 3D modeling of trees, but it is not suitable for large-scale inspection. The simultaneous localization and mapping (SLAM) technique makes it possible to move the lidar on the ground and model quickly, but it is not useful enough for the accuracy of plant detection. Therefore, in this study, we used UAV-SfM and 3D lidar SLAM techniques to build 3D models for the winter pruning of peach trees. Then, we compared and analyzed these models and further proposed a method to distinguish branches from 3D point clouds by spatial point cloud density. The results showed that the 3D lidar SLAM technique had a shorter modeling time and higher accuracy than UAV-SfM for the winter pruning period of peach trees. The method had the smallest RMSE of 3084 g with an R2 = 0.93 compared to the fresh weight of the pruned branches. In the branch detection part, branches with diameters greater than 3 cm were differentiated successfully, regardless of whether before or after pruning.

1. Introduction

The peach tree is planted widely in Japan as a fruit tree with high economic value. According to 2021 survey reports of Japan, the total planted area of peach trees is 9300 ha. and the harvest volume is 107,000 tons. However, the average age of those managing orchards is rapidly growing, from 61 in 2005 to 77 in 2015 within ten years [1]. The decrease in the number of professionals and the aging of the population is high; thus, with the increase in the cultivated area, the area that one person needs to manage is bound to increase significantly if the agricultural productivity of the orchard is to be maintained. An orchard takes a long time from planting to harvesting, and the adjustment of the trees and cultivation management during this period must be performed precisely. Compared to other crops, the barrier to fruit cultivation is high initially, and professional cultivation is not easy. Although using smart agriculture and tree improvement in recent years has accelerated the efficiency, the overall mechanical automation rate of important cash crops, such as fruit trees, from cultivation to harvest is quite low [2,3]. Therefore, it is important to develop fruit tree cultivation and management technology to be used by non-specialists.
The winter pruning of peach trees is the third most time-consuming task after bud picking and harvesting and accounts for approximately 25% of the total time spent on cultivation management [1]. The amount of pruning has a great influence on the future growth of the fruit tree and the harvest. It is difficult to change the shape of perennial branches, such as major and sub-major branches of peach trees, because they do not have new growth points to grow side buds or flower buds. Therefore, from the viewpoint of cultivation management, it is crucial to quickly grasping the status of major branches and subprincipal branches in the winter pruning of deciduous fruit trees such as peach trees [4,5,6]. In the current pruning operation, the cultivation management expert first determines the size of the entire tree and then determines the distribution of each branch in a small area. By observing the overall tree potential and predicting future growth trends, a pruning strategy is established to achieve sufficient branch density in each space. In this way, it is indispensable to quickly grasp the state of the tree potential and the distribution of major branches to reduce the overall workload effectively.
A nondestructive three-dimensional (3D) measurement technique can measure the growth parameters of plants, such as plant shape and biomass. Based on the type of technology used, there are two major techniques: passive unmanned aerial vehicle structure from motion (UAV-SfM) and active lidar [7]. UAV-SfM technology uses continuous and overlapping images obtained by a camera on the UAV to construct a 3D model. This method preserves the color information of the images in the 3D model, which makes it possible to be applied in different wavelengths, such as visible light, infrared, and thermal images [8,9,10,11,12,13,14]. Nevertheless, UAV-SfM technology requires more hardware resources and computing time to complete 3D matching and modeling. When the object of a model has complex structures and low reflectivity, such as plants, more shooting angles, and a good spatial resolution are required [15,16]. Considering the time constraints in a planting management schedule, it is often necessary to obtain and analyze the 3D information of a target in a short amount of time or in real time; therefore, UAV-SfM, which requires a long time for the modeling calculations, may not be an appropriate method. Therefore, developing a 3D plant measurement method that is quick and of high accuracy is an urgent issue in the agricultural field.
Another active nondestructive 3D measurement technique is terrestrial laser scanning (TLS) technology. Based on the time-of-flight principle, TLS can construct a centimeter-level high-precision 3D point cloud model by irradiating the target object and calculating the return time [7,17]. TLS has been widely used in the observation of trees, such as fruit trees and forests, over the last 2 decades. This technology can be used to measure the three-dimensional structural elements of trees, such as plant height, crown structure, leaf tilt angle, and branch distribution [17,18,19]. Despite TLS having many advantages, one of its problems is that the measurement must be completely still in a short amount of time. In addition, for the opposite side of the target object that cannot be scanned, TLS must be merged with the previous point cloud after changing the observation angle [17,19,20]. If the observation area is large, it must be observed by multiple measurement locations to completely model. Therefore, the maintenance of high-precision lidar observation effect and a reduction in observation time has always been an important research topic.
Thrun et al. [21] proposed a technique based on a mounted detector, with simultaneous localization and mapping (SLAM), which can explore its position and simultaneously construct a map of its surroundings, as proposed in [21,22]. Using 2D lidar as the sensor in SLAM technology can effectively grasp the position of its own sensor and construct the surrounding map information. If it is 3D lidar, the surrounding point cloud can be constructed during the movement process. The calculation methods of 3D lidar SLAM are distinguished simply by the traditional 3D direct pairing and image-based methods [23]. Among them, the lidar odometry and mapping (LOAM) method, proposed by Zhang and Singh in 2014, is the founding image-based method, which converts the original 3D point cloud data into two-dimensional (2D) depth images and divides the feature data into contours and surfaces for fast pairing calculation [24]. The image-based method has a faster computation time and smaller cumulative error than the 3D direct pairing method. LeGO LOAM SLAM (lightweight and ground-optimized lidar odometry and mapping on variable terrain), developed by Shan et al. [25] in 2018, is a technique that improves the LOAM method by first calculating the ground features through the lower laser beam, reducing the number of points that need to be paired. Therefore, it is not necessary to use advanced hardware resources, such as GPUs, to create 3D point cloud models at high speed in the vicinity, showing great application advantages. The odometer and pose record were introduced into the LeGO LOAM SLAM system, allowing for the loop closing problem and the failure of the self-location estimation, the most troubling problems in SLAM technology, to be solved. The high stability of LEGO LOAM SLAM was introduced as a standard method for image-based methods in a review paper by Huang, L. [23].
In the past, in lidar SLAM studied the focus was on environments such as autonomous driving and construction sites [23,26,27]. The objects detected were usually man-made objects with simple 3D constructions, and plants with complex constructions were relatively less discussed [23,28,29,30,31,32,33,34,35]. Among them, the iterative closest point (ICP) method, which mainly uses the 3D direct matching method, has been used to perform relevant studies on the structure of tree crowns, diameter at breast height, and plant parameters such as tree height. However, a review paper on SLAM indicated that the ICP method has a serious cumulative error loop closing problem, and the failure of its position projection in large-scale detection and model stability have been considered [23,26,27,36]. For the image-based method, it was confirmed that the detection of tree height and diameter at breast height had high accuracy, but there is a lack of discussion on branch distribution, extraction methods for small branches, and comparison of the tree potential for agricultural applications related to fruit trees [37,38,39,40,41]. There are few discussions on the effect of the 3D reconstruction of fruit trees or the effect on the model stability during winter pruning periods [42]. On the other hand, there has not been enough discussion on whether the 3D lidar SLAM method is better than the UAV-SfM method, which has been used widely in recent years concerning modeling, detection accuracy, and computation time [15,16,42,43,44].
Therefore, the main objective of this study was to evaluate the accuracy of backpack 3D lidar SLAM and UAV-SfM in the 3D modeling and major branch detection methods for peach trees during the winter pruning period. The results of the model accuracy evaluation were compared with the actual fresh pruning weights by measurements before and after winter pruning. In addition, the spatial density of the point cloud was proposed as the evaluation data for the detection method of the different thicknesses of branches for the 3D point cloud data without color (Figure 1).

2. Materials and Methods

2.1. Experiments

This experiment was conducted in a peach orchard (36.04892°N, 140.0775°E, area: 80 m × 40 m) located at the Institute of Fruit Tree and Tea Science, National Agriculture and Rood Research Organization (NARO) in Tsukuba, Ibaraki, Japan. The farm is surrounded by trees for windbreak isolation, with iron posts and support frames for peach trees set-up as supports for bird-protecting nets. The peach trees were 12 years old and were cultivated and managed normally. There were two varieties, Akatsuki and Kawanakajima Hakuto, and the average height of the peach trees was approximately 3 m. Winter pruning is performed every winter by cultivators of peach trees.
Pruning began in January 2022, and the pruning of the BCD column (shown in Figure 2) was completed by 4 February, and most of the pruning was completed by 25 February. In addition, experimental pruning was conducted from 25 February to 4 March for a few of the following trees: No. 1: A4; No. 2: B2; No. 3: B3; No. 4 and No. 5: C4. After the pruning, the axial width and fresh weights of the pruned branches were measured. The diameters of the branches were measured near the major branch and at the fork and the end of the major branch in the experimental area. The diameter at the center of the branch was recorded in a random sample of 25% of the cut branches in testing area B3.
The measurements using 3D lidar SLAM were performed on 24 December 2021, 4 and 24 February 2022, and 4 March 2022. The measurements using UAV-SfM were performed on 4 February 2022 and 4 March 2022. White pesticides were sprayed at the farm on 2 March to prevent disease, and the branches and buds became white after the spraying, and a few white spots could even be observed.

2.2. The Measurement of 3D Lidar SLAM

The 3D lidar photodetector used in this study was the Velodyne VLP-16 lidar Omnidirectional 3D Sensor, developed by Velodyne (San Jose, CA, USA), combined with the LeGO LOAM SLAM (lightweight and ground-optimized lidar), developed by Shan et al. [25]. The Velodyne VLP-16 lidar has a built-in IMU system to record the inclination and acceleration of the machine, and the machine has 16 laser-beam transceivers between plus and minus 15 degrees in the vertical direction, which rotate around the axis and scan the surrounding area. The laser-beams are reflected onto the receiver after encountering an obstacle, and the system calculates the travel time of each beam from the light source to the receiver to obtain the distance to the obstacle. The 3D lidar uses Class 1 eye-safe laser beams at a wavelength of 903 nm, considered to have a low impact on the human eye.
LeGO LOAM SLAM was modified according to 3D lidar-based LOAM SLAM technology. Considering the 16 lines of VLP16 lidar as an example, the seven lasers below were used for the ground detection. The horizontal angle of the adjacent lasers below 10 degrees were set as a ground point cloud and the rest as a nonground point cloud. After that, the point cloud projection segmentation was converted into a distance image, ensuring that each point P had a unique pixel correspondence, and the pixel value was the distance value from point P to the sensor. As the ground points are usually the main cause of noise, a column-wise evaluation was performed on the distance image to extract the ground points, after which the remaining distance images were clustered, the point clouds with less than 30 points were filtered, and the retained point clouds were assigned different labels. The ground point clouds were then clustered. Due to the special characteristics of the ground point clouds, separate processing improved operational efficiency and extracted more stable features. After that, the features were extracted separately for the ground point cloud and the segmented point cloud, mainly using the LOAM method. The original 360 degree point cloud was divided into six equal parts, and the accuracy of each part was 300 points/time (1800 points for one laser scan of VLP16) with 16 lasers, so that each rotation could obtain a depth image of 16 × 1800. The curvature or smoothness of each segment was recorded and sorted, and then the data were divided into edge point features and surface point features (Figure 3). Lidar odometry was used to estimate the subject pose of the sensor between two consecutive depth images. Similar convolutions between two consecutive depth images were matched to improve the accuracy and efficiency of the matching using two consecutive depth images as the matching conditions. Compared with the LOAM method, the LeGO LOAM approach uses a two-step LM optimization that synthesizes the original matching problem into a complex distance vector calculation problem and finally obtains the pose matrix with the corresponding feature matching at the shortest distance. Such an approach can reduce the computation time by approximately 35% while achieving a measurement accuracy equal to LOAM. On the other hand, to reduce the amount of stored data, the LeGO LOAM approach does not store the point cloud map model derived from each depth map but records the feature set, which is bound to the estimated pose of the lidar, and finally splices the feature set within 100 m of the current position into the final point cloud map model. This method has a significantly shorter processing time than other lidar SLAM methods and can realize the current cubic point cloud results presented while measuring.
In the actual field test, the controller, power supply, and other equipment were loaded in a backpack and carried by the operator, and the lidar body was set at approximately the same height as the head, nearly 170 m above the ground (Figure 1C). The data were linked to a laptop computer via an ethernet network, and the user moved while confirming the current 3D point cloud creation status. The moving speed was slightly slower than normal, approximately 0.5 m per step, walking through the farm. Turning was performed with a fixed-point turn at a slow speed of 30 degrees per second. The AC100V power supply required for the system was provided by a power supply (Ankers powerhouse 200 (Changsha, China)), which was capable of stable output even at low currents. Including the power supply, the total weight of the machine was 4.3 kg.

2.3. UAV-SfM

The aerial shots were captured using the DJI Inspire version 2 (DJI, Shenzhen, China) UAV model, which has a dedicated camera (ZenmuseX3). The flight speed of the aircraft was set at 0.5 m/s, and the altitude was 15 m. The maximum flight time was 15 min, and for safety reasons, all flight plans were set to be completed within 12.5 min. The flight path was calculated in advance, the rate of photo overlap for the ground was more than 80%, and the three flights were set to cover the entire farm. The wind speed during the flight was below 1.0 m/s. The flight time was between 10:30 and 13:00.
The camera resolution was set to 4000 × 3000 pixels and the camera shutter to 1/2000 s using automatic interval photography at a frequency of one image every 3 s. As the camera was integrated with the drone, the GPS coordinates of the aircraft were recorded automatically in the photos at the time of the shooting. The ground sample distance of a photo was 7 mm/pixel.
The automatic flight software was developed using the API provided by DJI and designed by the Robotics Research Institute of NARO. Before the flight, the data, including the latitude and longitude of the set path and the flight altitude, were entered into the aircraft and then the flight was performed. The images obtained from the aerial photography were sorted based on the photographic date and imported into Agisoft Metashape version 1.72 (formerly known as Agisoft PhotoScan) software to produce a 3D point cloud model and a 3D high-density point cloud model. The number of point clouds obtained and the time required to construct the model were recorded. In this study, we did not use markers as a reference for the UAV-SfM. The error in the GNSS coordinates on the UAV was 0.5 m.

2.4. Overlapping of Point Clouds

The data of the point clouds were collected using different methods and for different periods over more than two months, and the 3D point clouds did not have characteristic factors such as color and markers for the overlapping point cloud. Therefore, in this study, we used CloudCompare software (http://www.cloudcompare.org/, accessed on 20 July 2021), which has excellent point cloud editing and display functions, to fit the two different point cloud models using the ICP (iterative closest point). The algorithm was based on setting a one-point cloud model as the reference point cluster and the other point cluster model as the matching point cluster. The points of the matching point cloud were matched first with the nearest points of the reference point cloud. Then, we used the root mean square (RMS) to calculate the point-to-point distance to adjust the rotation, translation, and even scaling of the matched point cloud. The iterative process was performed using the transformed data until the amount of change reached a threshold value. This study set the threshold for randomly sampled points to 500,000 and for the RMS variation below 1 × 10⁷ to achieve high results (Figure 4).
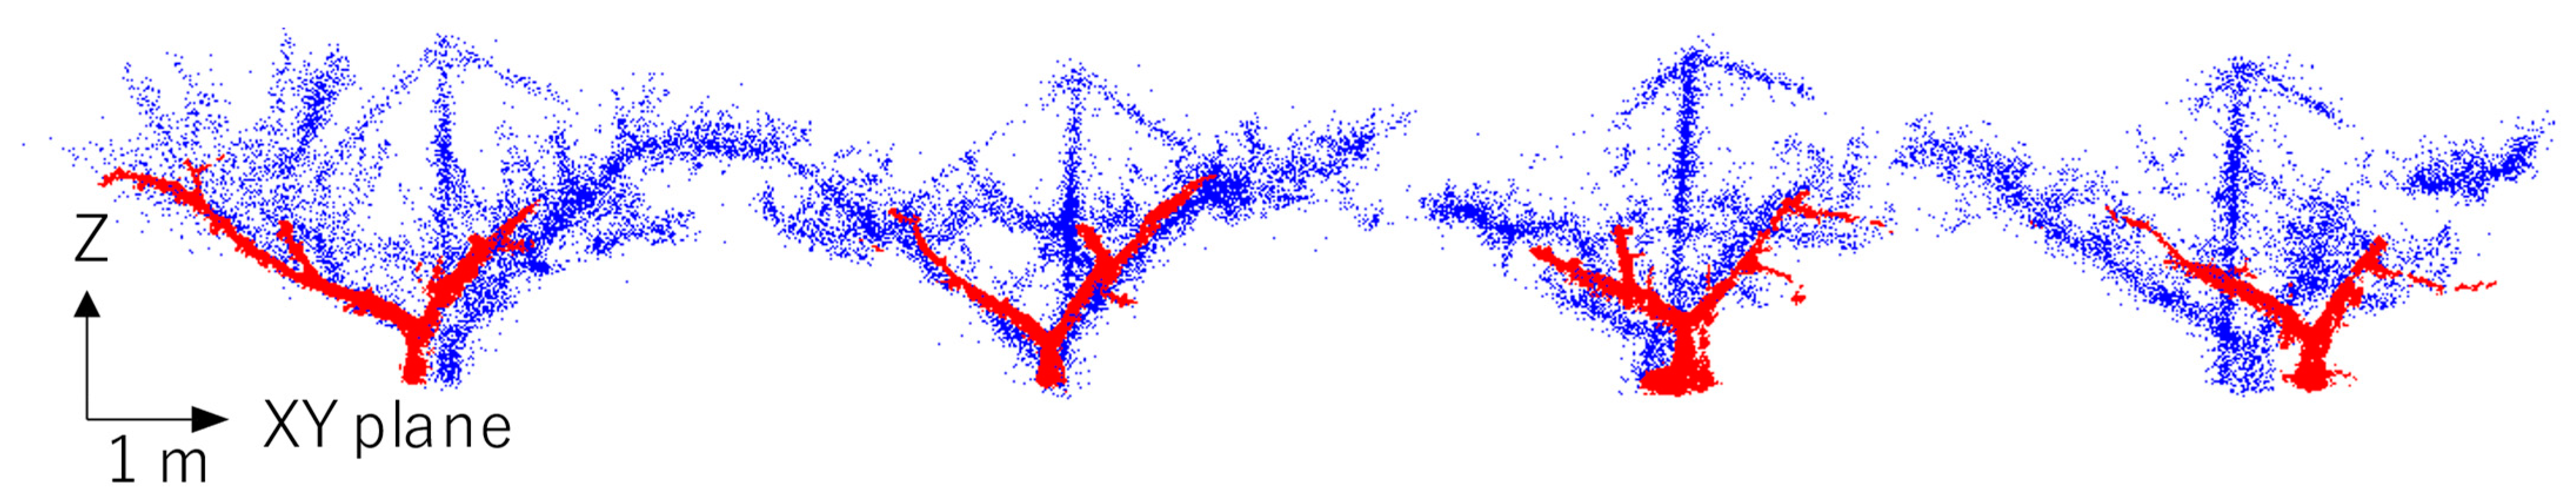
The point cloud was removed manually from the ground and the surrounding wire mesh after completing the point cloud iteration successfully. After that, point cloud fitting of the ICP was reperformed. The settings were the same as those described above. After the fitting, the point cloud data were cross-fitted, and the final RMS values were recorded. The differences between the 3D lidar and UAV-SfM were compared and analyzed using profile plots. The profile is the middle trunk part of the orange block in Figure 2.

2.5. Classification of Branches and Density Calculation

As the pruning operation is based on the lateral branches, such as small branches from the major and sub-major branches, it is quite necessary to classify the major and sub-major branches. Thus far, mainstream research has focused on classifying the branches based on their color using the photo information captured simultaneously. Most of the point clouds produced by lidar alone are visually labeled with attributes and then separated. In the point cloud models obtained by either UAV-SfM or 3D lidar SLAM, compared to the major branches, the branches below 5 cm in diameter were difficult to model, and the overall point cloud distribution was discrete. On the other hand, thicker branches with a diameter of 5 cm or more had a high density of point clouds around them, and the 3D contours could be seen with the naked eye. Therefore, this study proposed to use the number of dots in the space around the dots for classifying major branches and small branches. This study was conducted in spherical space.
The number of all points in the specified radius around each point was calculated (sphere space density; Equation (1)) and stored as the attribute of the point.
Number of points in sphere space = N/(4/3 × π × R3)
where N is the number of points, and R is the radius.
In addition, from the 3D point cloud model generated by 3D lidar SLAM, the circle generated by the diameter of each actual branch is the plane, and the cylindrical block with a height of 20 was calculated as the number of points in the internal space to evaluate the actual performance of the branch classification system.
Thereafter, the spatial density information of all points was represented as a histogram based on the number of points. If the graph was distributed normally, the points above μ arithmetic mean (2) + 1σ standard deviation (3) were defined as thick branches, such as major branches and sub-major branches, whereas the following points were regarded as small branches:
The   arithmetic   mean :   μ = i = 1 n x i n
Standard   deviation   σ = 1 n i = 1 n x i μ 2

2.6. Converting the Point Cloud Model to a Voxel Model

The distribution of point clouds in space is not even. Point clouds with different numbers of points cannot be effectively compared with the measured values. Here, we referred to the paper by Hosoi and Omasa [19] and used the voxel model to homogenize the values of the point clouds using the following coordinates conversion formula. The size of a voxel was set to 10 cm3, so Δx′, Δy′, and Δz′ were all 10 (Figure 5).
x′ = INT(X/Δx′)
 y′ = INT(Y/Δy′)
 z′ = INT(Z/Δz′)
Thereafter, the number of voxel points in each point cloud model was counted as the volume information of the point cloud. Comparisons of the voxel model of the trees in columns B–E were used for the different methods, which were built before pruning on 4 February and after pruning on 4 March. The number of voxel points in the different periods was subtracted to obtain the volume change, and we calculated the change in the estimation volume of the A4, B2, B3, and C4 trees as the estimation volume of the pruned branch No. 1–5. Finally, the pruned branch of the estimated volume value was compared with the actual fresh weight.

3. Results

3.1. Building the Point Cloud Model

The top view and the 45-degree viewing angle of the 3D point cloud model without ground surface on 4 February 2022, built using 3D lidar SLAM and UAV-SfM, are presented in Figure 6. The lower part is blue, the middle part is green, and the upper part is red. It is not possible to fully equate the DEM model, but it is possible to obtain a general idea of the height conditions. In addition to the major branches, many smaller branches are shown. Thus, the tree shape can roughly be seen. The image color provided by UAV-SfM was the color of the photo. The ground part was clear and unbroken, but the tree part was hardly visible, except for the major and small branches. In addition, the shadows of the branches could be seen on the ground, and the color of the shadows was close to the color of the branches.
The 3D model data of the different periods are presented statistically in Table 1. The lidar-based point cloud was created in approximately 10 min and can be viewed while doing so, which is helpful for the immediate understanding of the site. On the contrary, the UAV-SfM flight was conducted in three flights of at least 12 min each, and a total of approximately 660 photos were used for the SfM analysis to create the 3D point cloud model, but it took more than 5 h to create the point cloud model alone. It takes at least three times more time to produce a high-density point cloud before its completion. Moreover, aerial photography is affected by weather changes, and conditions such as strong wind or cloudy weather make it difficult to take pictures and obtain data smoothly [15,16]. The overall measurement time using 3D lidar SLAM was approximately one-tenth of the time taken by UAV-SfM, which is extremely fast.
In Table 1, the average number of points obtained by 3D lidar SLAM was 1.98 million, the average number of points obtained by the point cloud of UAV-SfM was 14.17 million, and the average number of points obtained by the high-density point cloud of UAV-SfM was 38.12 million, which is much higher than the number of points obtained using 3D lidar SLAM. However, after limiting the range and removing the ground and high-altitude wires, the 3D lidar SLAM obtained an average of 213,000 points, the UAV-SfM obtained an average of 50,000 points, and the UAV-SfM obtained an average of 243,000 points for the high-density point cloud. From this, the point cloud of the UAV-SfM had only a small number of points in the branches, and the overall number of points of the dense point cloud was comparable to that of the 3D lidar SLAM. Finally, after the voxel normalization process, the 3D lidar SLAM obtained an average of 87,000 points, the UAV-SfM obtained an average of 13,000 points, and the UAV-SfM obtained an average of 0.8 million points for the high-density point cloud. Although the dense point cloud model had many points before, after the voxel normalization process, it has fewer points than the point cloud model, and it was more difficult to reflect the overall tree condition than the point cloud. If we add the time factor, the dense point cloud that took the most time to calculate had the worst effect, while the almost instant 3D lidar SLAM presented the best effect.

3.2. Comparison of the Point Cloud Models

The voxel model resulting from the 3D lidar SLAM showed that the number of points decreased gradually as the pruning process proceeded, and the slight increase in the number of points on 4 March compared to 4 February was probably due to the white spray on 2 March, which increased the reflectivity of the laser beam. The number of measurement days for the SfM were too few to determine, and the white spray may also have affected the 3D modeling process, making the total number of points after pruning higher than before.
All the point clouds were manually removed from the surrounding obstacles and the ground and then subjected to ICP overlay processing. After the iterative processing, the root mean square error (RMSE) between the point clouds are shown in Table 2. The maximum RMSE of each model obtained by the 3D lidar SLAM did not exceed 0.12 m. As the maximum error of 0.12 was between the data from 24 December 2021 and 4 February 2022, as the pruning operation started in January, most of the trees were pruned during this period and, therefore, this difference can be regarded as the error caused by the pruning. Other errors may be caused by different feature points being sampled at different times.
The RMSE of each model produced by the UAV-SfM did not exceed a maximum of 0.6 m, and there was a maximum range of error in the data using high-density point clouds compared with each other for different periods. On the other hand, each point cloud had a higher error with the point cloud of 24 February 2022 high-density point cloud, inferring that the UAV-SfM was probably relatively poorer in modeling 4 February 2022, as the maximum RMSE between the 3D lidar SLAM and the UAV-SfM did not exceed 0.25 m, and the overall iterative effect was also worse for the UAV-SfM model of 4 February 2022 than that of 4 March 2022. The RMSE for the UAV-SfM model varied between high and low, even when comparing the point clouds of the same period, and with the high-density point cloud, the RMSE was 0.08–0.22 m. The point group of the 3D lidar SLAM and the UAV-SfM on 4 March 2022 had a higher iteration.
In the orange block shown in Figure 2, the 3D lidar model of the pruned trees on 4 March 2022 was iterated with the UAV-SfM point cloud model, and the cross-sectional view based on the center of the trunk of B3–E3 is shown in Figure 7. The 3D lidar is the blue point cloud, and the UAV-SfM is the red point cloud. The point cloud of the UAV-SfM was successfully modeled only in the thicker part of the major branch. On the other hand, the 3D lidar-based point cloud model was modeled successfully in the upper part of the smaller branches. In terms of overlap, if we take the 3D lidar SLAM point cloud as the base, the lidar point cloud of the second tree on the left (tree number C3) had a higher overlap with the UAV-SfM point cloud, but the first tree on the left of the UAV-SfM to be slightly on the left and the third tree to be slightly on the right afterwards was probably due to an error in the SfM modeling.

3.3. Detection of Branches

The data from the physical testing of the branches of the peach farm are shown in Table 3. The diameter of the major branches (trunk) in the testing area was between 19 and 25 cm, and the point tree of the cross-section was nearly 19–26 points. The part of sub-major branches near the major branch had a diameter of 8–17 cm, and the number of points in the cross-section was approximately 7–10 points. The end position of sub-major branches was approximately 4–8 cm, with a diameter below 5 cm or less; the thin branches far from the main branch could not effectively judge the orientation in the 3D point cloud, and there was no way to obtain the number of points in the cross-section exactly. Finally, 309 branches were cut from inspection area B3, and a random sample of 80 branches was selected for measurements to obtain an average branch diameter of 1.63 cm.
This study proposed using a spatial density relationship of point clouds as a detection method for branches. The original 3D lidar point cloud did not have color information, so it was difficult to effectively determine the location of the small branches and the major branches. According to the experimental method, we calculated the number of points, with a radius of 0.2 m around each point as a spatial density value. Then, the point cloud was colored using a spatial density value, which is shown in Figure 8.
Although the number of points from the 3D lidar SLAM was slightly different due to the movement rate, path, and pruning, the major branches and sub-major branches could be observed effectively in the nonblue colors after using the detection proposed in this study. The point cloud of the major branches over 10 cm in diameter had a different structure between the TLS and this study. In general, the point cloud of the major branches over 10 cm in diameter could be caused due to the internal hollow of the high-precision ground-based TLS. However, in this study, it showed an even distribution without the hollow. The structure of the main branches in this study greatly affected the point cloud density in space.
Finally, we made a histogram using the spatial density value of the point (Figure 9A). The point cloud model built using data from 24 December 2021 shows the classification of the branches by the spatial density value of the point (Figure 9B). The spatial density value of the point, which was above the average plus one standard deviation above, was set in the color bar as major branches and sub-major branches. Otherwise, the point set the small branches in gray. Even if there were many small branches before pruning, it also showed great results using our classification methods. In the inspection area, the branches from 3 to 25 cm in diameter were confirmed to be effectively detected. This method can effectively observe the growth status of branches in 3D and the corresponding major branch position, which can be regarded as an excellent contribution for field personnel in the prediction of pruning.
The trees in columns B–E are the voxel point clouds prepared using the different methods, and the difference between before pruning on 4 February 2022 and after pruning on 4 March 2022 is shown in Figure 10. The voxel point cloud for 4 February 2022, i.e., before pruning, is shown in the blue color and that for 4 March 2022, i.e., after pruning, is shown in the green color. It can be seen that the point cloud made using 3D lidar SLAM is dense and shows the difference between the voxel clouds before and after pruning. Column E, which was not pruned, and blocks No. 3–5 used for the experimental pruning can be seen as the difference between before and after pruning. The UAV-SfM point cloud and the UAV-SfM dense point cloud were mainly distributed in the major branches with a diameter of more than 8 cm, and the small branches, the main objects of pruning, cannot be effectively modeled. Specifically, using the dense point cloud method of the UAV-SfM, even in the E column, which was not pruned, point clouds other than the main branches are difficult to observe.
Using the before (4 February 2022) and after (4 March 2022) data of branch pruning to generate the voxel model based on a volume estimation value (10 cm3 = 1 voxel), models were created using the 3D lidar SLAM, UAV-SfM point cloud, and UAV-SfM dense point clouds. The number of voxel points in the blocks at the experimental site (No. 1–5) was calculated from the voxel model before and after pruning and was subtracted to obtain the estimated volume value of the pruned branches. Then, the estimated volume value was compared with the actual fresh pruning weight, and the data were obtained as shown in Table 4. The fresh weight of the pruned branches was correlated with the estimated volume value in the 3D lidar SLAM method with an R2 value of 0.93, negatively correlated with the estimated volume value in the UAV-SfM point cloud with an R2 value of 0.94, and less correlated with the estimated volume value in the UAV-SfM dense point cloud with an R2 value of 0.10. In terms of the root mean square error (RMSE), compared with the fresh pruning weight, the 3D lidar SLAM method had the smallest RMSE of 3084 g. The RMSE for the UAV-SfM point cloud method was 4496 g, and the RMSE for the UAV-SfM dense point cloud method was worst at 4554 g.
The spraying of white pesticide on 2 March 2022 increased the number of points because of the white spots on the branches for the 3D lidar and UAV-SfM methods. Specifically, the increase for the UAV-SfM is apparent (Figure 10). There was a positive correlation between the fresh weight and the estimated volume value in the 3D lidar method, as shown in Table 4. However, the number of the voxel points built by the UAV-SfM point cloud and the UAV dense point cloud increased substantially, even more than the number of voxel points before pruning on 4 February 2022.

4. Discussion

In terms of accuracy, the spatial resolution obtained by the UAV-SfM was 7 mm/pixel. The closest distance between the 3D lidar-based path and the center of the peach tree was approximately 4 m, and each laser had 1800 points per rotation, so ideally each of the 16 lasers produce 16 × 5 points per degree, totaling 80 points. If projected on a 4 m far away wall, the ideal projection is 1.64 points per square centimeter, slightly lower than the spatial resolution of the UAV-SfM. However, based on the results of this study, it is known that a ground-walking type of 3D lidar SLAM provides better point cloud modeling results than the UAV-SfM for peach tree branches without leaves in winter (Figure 9). Although the UAV-SfM provided better ground modeling results, it was more difficult to be modeled in the critical plant body, specifically in the fine branch parts (Figure 2). It should be noted that although the overall number of points was several times higher than the original point cloud, only a very small amount of voxel (approximately 3%) was constructed in the branch part of the voxel model, which reflects that it is not appropriate for use in branch detection. The overall experimental results also show that the 3D lidar SLAM has a huge advantage over the UAV-SfM technique in terms of point cloud production time.
The LeGO LOAM SLAM calculation method used in this study provides an almost real-time 3D point cloud construction method, allowing users to see the point cloud construction while they are moving. Even if there is an error problem, it can be corrected or restarted immediately. Compared with the complex operation and long calculation time of the UAV-SfM, 3D lidar SLAM presents a highly competitive advantage. The operation of the whole system can be performed by only one person, compared to the UAV flight, which may require special permits or unique licenses in different countries; backpack 3D lidar can be easily carried and moved, which is more widely used in general agricultural fields. In terms of the price, the current high-stability UAV unit price is approximately JPY 50,000–150,000, and the SfM analysis software also costs more than JPY 300,000, not including the price of a high-performance computer and computing costs. This time, the 3D lidar used a lightweight 16-bar laser-beam model with a unit cost of approximately JPY 600,000, using an ubuntu + ROS system, and used the publicly available LeGO LOAM SLAM technology and other software systems at no extra cost, so it clearly has a greater competitive advantage in terms of price. On the other hand, major Japanese agricultural machinery manufacturers, such as Kubota and Yammar, have been using lidar SLAM technology in their own agricultural machinery for autonomous driving technology, which makes it easier to introduce this technology to the market in the future.
Other studies on the 3D lidar SLAM technique discussed tilting the lidar ontology to achieve a higher density 3D point cloud model [13,38,39,40,41]. We also tried to tilt the lidar body, but the point cloud could not be modeled smoothly, resulting in a huge error. As the LeGO LOAM SLAM technology that constructs a 3D point cloud model using several laser-beams downward for ground detection was used to construct the 3D point cloud data, it might lead to the ground point cloud not being matched. According to the original report on LeGO LOAM SLAM, the lidar body could not be tilted during movement [25]. However, there are no known papers that use LeGO LOAM SLAM technology to discuss modeling issues such as tilt, so it is difficult to use for comparison and is a topic that must be explored in the future.
In this study, we simply walked in the peach tree orchard with the relevant equipment on our backs. Although the head might block some of the laser beams, there would be no effect on the point cloud modeling, because the minimum distance for modeling was set at over one meter. On the other hand, the branches of the trees were also mostly distributed in the range of 100–350 cm from the ground, and the height of the machine was approximately 170 m at an angle of 15 degrees above and below each position, so that the distribution of the branches of fruit trees could be grasped more effectively. For different heights of the lidar scanning method, the impact on the overall point cloud needs to be further explored.
Due to the limitation of the VLP-16 machine, each rotation could only obtain a depth graph of 1800 × 16 for matching, so there is still much room for enhancement of the spatial resolution. With a greater laser emission frequency and more laser beams, a better resolution during point cloud modeling should be achieved. According to the matching algorithm of the LEGO LOAM SLAM, point cloud clumping around fewer than 30 points is considered as an error that is deleted directly in the matching step. Then, the chances of the tiny branches being scanned again by the laser emitted by the constantly moving 3D lidar may not be sufficient during the matching step, so factors such as the moving speed and the relative distance of the small target in the modeling using 3D lidar SLAM technology should be discussed in more detail. This also explains why the point cloud density of the major branches was much higher than that of thin branches. However, it also shows that even with the LeGO LOAM SLAM approach, the problem of the difficult detection of fine branches still exists. Finally, the problem of the loop closing problem, which is common in SLAM, was not observed in this study. This may be because plants with only branches in winter have a relatively open space, and the surrounding windbreak forest also had the effect of establishing corresponding feature points. It is also possible that this is an improved effect of LeGO LOAM SLAM on the loop closing problem.
According to the review papers by Xu et al. [26] and Huang [23] on lidar SLAM technology, it has been mentioned that a variety of 2D lidar-based SLAM techniques have been developed and are relatively more mature than 3D lidar SLAM. It is also described that the technology of converting into a depth image, starting from LOAM technology, is considered to have a better error recovery ability and modeling time advantage. In this study, in terms of the modeling stability, 3D lidar SLAM also showed great advantages, although the tree potential and other branches were cut off, but the error between the two models was relatively small (RMSE < 0.25 m) and can be regarded as the effect of changes such as pruning (Table 2). In the UAV-SfM, there was the biggest error amount of 0.22 m between the point cloud and the dense point cloud. This may be because the high-density point cloud method uses more photo information to generate many more points from the point cloud model instead of three-dimensional pairing. Another reason for the error between the UAV-SfM point clouds is inferred to be caused by the different light situation and white spots of the easily matched feature points. In particular, the white pesticide sprayed on 2 March showed randomly distributed spots on every branch. According to previous studies by Nguyen et al. [45], Paulus et al. [46], and Kochi et al. [47], the spray of white pesticide can significantly increase the number of feature points using actively projected structured light or irregular speckle distribution in the SfM calculations. This leads to the number of points increasing in the point cloud model and, overall, increasing the accuracy of the modeling. We consider this could be the main reason why the UAV-SfM of the 2 March model had a higher number of total points and quality than the 4 February model.
For the core observation item of branches, it can also be found in this paper that the modeling rate of the 3D lidar SLAM in branches with an RMSE = 3084 was much higher than that of the UAV-SfM model, with the point cloud’s RMSE = 4496 and dense point cloud’s RMSE = 4554. Although it cannot make an accurate model of the fine branches like TLS, a sparse and dense structure of the point cloud could indeed be observed. On the other hand, for the spatial density branch detection method used in this paper, the major branch parts with diameters over 3 cm were also successfully classified correctly. In general, a larger the branch diameter means a stronger the structure, so this method may also be used as a method to detect strong obstacles in an agricultural environment. Finally, since the structure of major branches was obtained, growth models might be constructed for the leaf density and growth status of the fruit trees using different periods of 3D point cloud data of the fruit trees in the future.

5. Conclusions

This study compared two 3D modeling methods, backpack 3D lidar SLAM and UAV-SfM, using a peach orchard during the winter pruning period as the observation object, and found that the method of 3D lidar SLAM had a faster and more accurate 3D modeling effect, with stable modeling and higher iterations in different periods. A method using spatial density was proposed to classify point clouds without color information and to effectively distinguish point clouds of major branches from those of minor branches. Finally, the 3D lidar SLAM approach also showed a high correlation (R2 = 0.93) with small errors (RMSE = 3084 g) in the inference of the pruning weight.

Author Contributions

P.T., experiment planning, design, data collection and analysis, and writing the article. Y.Z., experiment planning discussion, data collection, 3D modelling suggestions, article editing. T.Y. (Takayoshi Yamane), experiment planning discussion, farm cultivation management. M.K., UAV maintenance and flight system setup, UAV data collection and modelling. T.Y. (Takeshi Yoshida), 3D lidar and experimental proposal. T.O., experimental proposal, discussion, and conception of branch classification method. J.N., discussion and article editing. All authors have read and agreed to the published version of the manuscript.

Funding

This research received no external funding.

Data Availability Statement

This study did not report any data.

Acknowledgments

We would like to express special thanks to Noda, S. for his assistance in setting up the initial system environment and providing related knowledge.

Conflicts of Interest

The authors declare no conflict of interest.

References

  1. MAFF. FY2021 Summary of the Annual Report on Food, Agriculture and Rural Areas in Japan; Ministry of Agriculture, Forestry and Fisheries: Tokyo, Japan, 2022. [Google Scholar]
  2. Yoshida, T.; Onishi, Y.; Kawahara, T.; Fukao, T. Automated Harvesting by a Dual-Arm Fruit Harvesting Robot. ROBOMECH J. 2022, 9, 19. [Google Scholar] [CrossRef]
  3. Yoshida, T.; Kawahara, T.; Fukao, T. Fruit Recognition Method for a Harvesting Robot with RGB-D Cameras. ROBOMECH J. 2022, 9, 15. [Google Scholar] [CrossRef]
  4. Tworkoski, T.J.; Glenn, D.M. Long-Term Effects of Managed Grass Competition and Two Pruning Methods on Growth and Yield of Peach Trees. Sci. Hortic. 2010, 126, 130–137. [Google Scholar] [CrossRef]
  5. Ikinci, A. Influence of Pre- and Postharvest Summer Pruning on the Growth, Yield, Fruit Quality, and Carbohydrate Content of Early Season Peach Cultivars. Sci. World J. 2014, 2014, 104865. [Google Scholar] [CrossRef] [PubMed]
  6. Grechi, I.; Sauge, M.H.; Sauphanor, B.; Hilgert, N.; Senoussi, R.; Lescourret, F. How Does Winter Pruning Affect Peach Tree-Myzus persicae Interactions? Entomol. Exp. Appl. 2008, 128, 369–379. [Google Scholar] [CrossRef]
  7. Kochi, N.; Isobe, S.; Hayashi, A.; Kodama, K.; Tanabata, T. Introduction of All-Around 3D Modeling Methods for Investigation of Plants. Int. J. Autom. Technol. 2021, 15, 301–312. [Google Scholar] [CrossRef]
  8. Teng, P.; Ono, E.; Zhang, Y.; Aono, M.; Shimizu, Y.; Hosoi, F.; Omasa, K. Estimation of Ground Surface and Accuracy Assessments of Growth Parameters for a Sweet Potato Community in Ridge Cultivation. Remote Sens. 2019, 11, 1487. [Google Scholar] [CrossRef] [Green Version]
  9. Teng, P.; Fukumaru, Y.; Zhang, Y.; Aono, M.; Shimizu, Y.; Hosoi, F.; Omasa, K. Accuracy Assessment in 3D Remote Sensing of Japanese Larch Trees Using a Small UAV. Eco-Engineering 2018, 30, 1–6. [Google Scholar]
  10. Yu, Z.; Poching, T.; Aono, M.; Shimizu, Y.; Hosoi, F.; Omasa, K. 3D Monitoring for Plant Growth Parameters in Field with a Single Camera by Multi-view Approach. J. Agric. Meteorol. 2018, 74, 129–139. [Google Scholar] [CrossRef] [Green Version]
  11. Zhang, Y.; Teng, P.; Shimizu, Y.; Hosoi, F.; Omasa, K. Estimating 3D Leaf and Stem Shape of Nursery paprika Plants by a Novel Multi-camera Photography System. Sensors 2016, 16, 874. [Google Scholar] [CrossRef] [Green Version]
  12. Lu, X.; Ono, E.; Lu, S.; Zhang, Y.; Teng, P.; Aono, M.; Shimizu, Y.; Hosoi, F.; Omasa, K. Reconstruction Method and Optimum Range of Camera-Shooting Angle for 3D Plant Modeling Using a Multi-camera Photography System. Plant Methods 2020, 16, 118. [Google Scholar] [CrossRef] [PubMed]
  13. Raman, M.G.; Carlos, E.F.; Sankaran, S. Optimization and Evaluation of Sensor Angles for Precise Assessment of Architectural Traits in Peach Trees. Sensors 2022, 22, 4619. [Google Scholar] [CrossRef] [PubMed]
  14. Teng, P.; Zhang, Y.; Shimizu, Y.; Hosoi, F.; Omasa, K. Accuracy Assessment in 3D Remote Sensing of Rice Plants in Paddy Field Using a Small UAV. Eco-Engineering 2016, 28, 107–112. [Google Scholar]
  15. Liu, J.; Xiang, J.; Jin, Y.; Liu, R.; Yan, J.; Wang, L. Boost Precision Agriculture with Unmanned Aerial Vehicle Remote Sensing and Edge Intelligence: A Survey. Remote Sens. 2021, 13, 4387. [Google Scholar] [CrossRef]
  16. Ecke, S.; Dempewolf, J.; Frey, J.; Schwaller, A.; Endres, E.; Klemmt, H.J.; Tiede, D.; Seifert, T. UAV-based forest health monitoring: A systematic review. Remote Sens. 2022, 14, 3205. [Google Scholar] [CrossRef]
  17. Krok, G.; Kraszewski, B.; Stereńczak, K. Application of terrestrial laser scanning in forest inventory—An overview of selected issues. For. Res. Pap. 2020, 81, 175–194. [Google Scholar] [CrossRef]
  18. Srinivasan, S.; Popescu, S.C.; Eriksson, M.; Sheridan, R.D.; Ku, N.-W. Terrestrial Laser Scanning as an Effective Tool to Retrieve Tree Level Height, Crown Width, and Stem Diameter. Remote Sens. 2015, 7, 1877–1896. [Google Scholar] [CrossRef] [Green Version]
  19. Hosoi, F.; Omasa, K. Voxel-based 3-D modeling of individual trees for estimating leaf area density using high-resolution portable scanning lidar. IEEE Trans. Geosci. Remote Sens. 2006, 44, 3610–3618. [Google Scholar] [CrossRef]
  20. Henning, J.G.; Philip, J.R. Ground-based laser imaging for assessing three-dimensional forest canopy structure. Photogramm. Eng. Remote Sens. 2006, 72, 1349–1358. [Google Scholar] [CrossRef]
  21. Thrun, S.; Montemerlo, M. The Graph SLAM Algorithm with Applications to Large-Scale Mapping of Urban Structures. Int. J. Robot. Res. 2006, 25, 403–429. [Google Scholar] [CrossRef]
  22. Thrun, S. Simultaneous Localization and Mapping. In Robotics and Cognitive Approaches to Spatial Mapping; Springer: Berlin/Heidelberg, Germany, 2008; pp. 13–41. [Google Scholar] [CrossRef] [Green Version]
  23. Huang, L. Review on Lidar-Based SLAM Techniques. In Proceedings of the 2021 International Conference on Signal Processing and Machine Learning (CONF-SPML), Stanford, CA, USA, 14 November 2021; Volume 2021, pp. 163–168. [Google Scholar] [CrossRef]
  24. Zhang, J.; Singh, S. Low-Drift and Real-Time Lidar Odometry and Mapping. Auton. Robot. 2017, 41, 401–416. [Google Scholar] [CrossRef]
  25. Shan, T.; Englot, B. LeGO-LOAM: Lightweight and Ground-Optimized Lidar Odometry and Mapping on Variable Terrain. In Proceedings of the 2018 IEEE/RSJ International Conference on Intelligent Robots and Systems (IROS), Madrid, Spain, 1–5 October 2018; pp. 4758–4765. [Google Scholar] [CrossRef]
  26. Xu, X.; Zhang, L.; Yang, J.; Cao, C.; Wang, W.; Ran, Y.; Tan, Z.; Luo, M. A Review of Multi-Sensor Fusion SLAM Systems Based on 3D LIDAR. Remote Sens. 2022, 14, 2835. [Google Scholar] [CrossRef]
  27. Debeunne, C.; Vivet, D. A Review of Visual-Lidar Fusion Based Simultaneous Localization and Mapping. Sensors 2020, 20, 68. [Google Scholar] [CrossRef] [PubMed] [Green Version]
  28. Dalla Corte, A.P.; Rex, F.E.; Almeida, D.R.A.D.; Sanquetta, C.R.; Silva, C.A.; Moura, M.M.; Wilkinson, B.; Zambrano, A.M.A.; Cunha Neto, E.M.D.; Veras, H.F.P.; et al. Measuring Individual Tree Diameter and Height Using Gatoreye High-Density UAV-Lidar in an Integrated Crop-Livestock-Forest System. Remote Sens. 2020, 12, 863. [Google Scholar] [CrossRef] [Green Version]
  29. Zhao, W.; Wang, X.; Qi, B.; Runge, T. Ground-Level Mapping and Navigating for Agriculture Based on IoT and Computer Vision. IEEE Access. 2020, 8, 221975–221985. [Google Scholar] [CrossRef]
  30. Auat Cheein, F.; Steiner, G.; Perez Paina, G.; Carelli, R. Optimized EIF-SLAM Algorithm for Precision Agriculture Mapping Based on Stems Detection. Comput. Electron. Agric. 2011, 78, 195–207. [Google Scholar] [CrossRef]
  31. Yuan, W.; Choi, D.; Bolkas, D. GNSS-IMU-Assisted Colored ICP for UAV-Lidar Point Cloud Registration of Peach Trees. Comput. Electron. Agric. 2022, 197, 106966. [Google Scholar] [CrossRef]
  32. Auat Cheein, F.A.; Guivant, J. SLAM-Based Incremental Convex Hull Processing Approach for Treetop Volume Estimation. Comput. Electron. Agric. 2014, 102, 19–30. [Google Scholar] [CrossRef]
  33. Tang, J.; Chen, Y.; Kukko, A.; Kaartinen, H.; Jaakkola, A.; Khoramshahi, E.; Hakala, T.; Hyyppä, J.; Holopainen, M.; Hyyppä, H. SLAM-Aided Stem Mapping for Forest Inventory with Small-Footprint Mobile Lidar. Forests 2015, 6, 4588–4606. [Google Scholar] [CrossRef]
  34. Qian, C.; Liu, H.; Tang, J.; Chen, Y.; Kaartinen, H.; Kukko, A.; Zhu, L.; Liang, X.; Chen, L.; Hyyppä, J. An Integrated GNSS/INS/Lidar-SLAM Positioning Method for Highly Accurate Forest Stem Mapping. Remote Sens. 2017, 9, 3. [Google Scholar] [CrossRef] [Green Version]
  35. Gollob, C.; Ritter, T.; Nothdurft, A. Forest Inventory with Long Range and High-Speed Personal Laser Scanning (PLS) and Simultaneous Localization and Mapping (SLAM) Technology. Remote Sens. 2020, 12, 1509. [Google Scholar] [CrossRef]
  36. Chen, X.; Läbe, T.; Milioto, A.; Röhling, T.; Vysotska, O.; Haag, A.; Behley, J.; Stachniss, C. OverlapNet: Loop Closing for Lidar-Based SLAM. Robot. Sci. Syst. 2020. [Google Scholar] [CrossRef]
  37. Wang, K.; Zhou, J.; Zhang, W.; Zhang, B. Mobile Lidar Scanning System Combined with Canopy Morphology Extracting Methods for Tree Crown Parameters Evaluation in Orchards. Sensors 2021, 21, 339. [Google Scholar] [CrossRef] [PubMed]
  38. Itakura, K.; Hosoi, F. Automatic Individual Tree Detection and Canopy Segmentation from Three-Dimensional Point Cloud Images Obtained from Ground-Based Lidar. J. Agric. Meteorol. 2018, 74, 109–113. [Google Scholar] [CrossRef] [Green Version]
  39. Itakura, K.; Kamakura, I.; Hosoi, F. Estimation of Tree Trunk Diameter by LIDAR While Moving on Foot or by Car. Eco-Engineering 2017, 29, 107–113. [Google Scholar] [CrossRef]
  40. Pan, Y.; Kuo, K.T.; Hosoi, F. A Study on Estimation of Tree Trunk Diameters and Heights from Three-Dimensional Point Cloud Images Obtained by SLAM. Eco-Engineering 2017, 29, 17–22. [Google Scholar] [CrossRef]
  41. Lowe, T.; Moghadam, P.; Edwards, E.; Williams, J. Canopy Density Estimation in Perennial Horticulture Crops Using 3D Spinning Lidar SLAM. J. F. Robot. 2021, 38, 598–618. [Google Scholar] [CrossRef]
  42. García-Fernández, M.; Sanz-Ablanedo, E.; Pereira-Obaya, D.; Rodríguez-Pérez, J.R. Vineyard Pruning Weight Prediction Using 3D Point Clouds Generated from UAV Imagery and Structure from Motion Photogrammetry. Agronomy 2021, 11, 2489. [Google Scholar] [CrossRef]
  43. Moe, K.T.; Owari, T.; Furuya, N.; Hiroshima, T. Comparing Individual Tree Height Information Derived from Field Surveys, LiDAR and UAV-DAP for High-Value Timber Species in Northern Japan. Forests 2020, 11, 223. [Google Scholar] [CrossRef]
  44. Pascual, M.; Villar, J.M.; Rufat, J.; Rosell, J.R.; Sanz, R.; Arnó, J. Evaluation of Peach Tree Growth Characteristics Under Different Irrigation Strategies by LIDAR System: Preliminary Results. Acta Hortic. 2011, 227–232. [Google Scholar] [CrossRef]
  45. Nguyen, T.T.; Slaughter, D.C.; Max, N.; Maloof, J.N.; Sinha, N. Structured Light-Based 3D Reconstruction System for Plants. Sensors 2015, 15, 18587–18612. [Google Scholar] [CrossRef] [PubMed] [Green Version]
  46. Paulus, S. Measuring Crops in 3D: Using Geometry for Plant Phenotyping. Plant Methods. 2019, 15, 103. [Google Scholar] [CrossRef] [PubMed]
  47. Kochi, N.; Hayashi, A.; Shinohara, Y.; Tanabata, T.; Kodama, K.; Isobe, S. All-Around 3D Plant Modeling System Using Multiple Images and Its Composition. Breed. Sci. 2022, 72, 75–84. [Google Scholar] [CrossRef] [PubMed]
Figure 1. Introduction of the system outline and the sensors: (A) system outline; (B) DJI Inspire version 2 UAV model; (C) 3D lidar system.
Remotesensing 15 00408 g001
Figure 2. Job block introduction using the image taken by UAV-SfM. The orange block was used to illustrate the difference between 3D lidar SLAM and UAV-SfM and the classification method of the branches. A3–E4 represent the ID of tree.
Remotesensing 15 00408 g002
Figure 3. The point cloud was built from LeGO LOAM SLAM when walking in the field (green points are the matched points; pink points are the features of the surface point; red points are the point features of the edge).
Remotesensing 15 00408 g003
Figure 4. ICP processing work between the different point clouds: (A) point clouds before ICP processing; (B) point clouds after ICP processing.
Remotesensing 15 00408 g004
Figure 5. The voxel model was built from the point cloud model: (left top)—top view of the point cloud model; (left bottom)—side view of the point cloud model; (right top)—top view of the voxel model; (right bottom)—side view of the voxel model.
Remotesensing 15 00408 g005
Figure 6. Comparison of the point cloud models without ground surface made using the data from 4 February 2022: top view of the 3D lidar SLAM on the (left top), the 45 degree viewing angle of the 3D lidar SLAM on the (left bottom), the top view of the UAV-SfM on the (right top), and the 45-degree viewing angle of the UAV-SfM on the (left bottom).
Remotesensing 15 00408 g006
Figure 7. Point cloud cross-section of peach tree (red points: UAV-SfM point cloud; blue points: 3D lidar SLAM).
Remotesensing 15 00408 g007
Figure 8. Before and after coloring the point cloud using a spatial density value calculating the number of points with a radius of 0.2 m in a spherical space: (left)—original point cloud model; (right)—the point cloud model colors using the spatial density value of the point.
Remotesensing 15 00408 g008
Figure 9. Classification of the branches using the spatial density value of the points (gray points represent fine branches below μ + 1σ. Other colors represent thick branches above μ + 1σ; μ: arithmetic mean; σ: standard deviation). (A) histogram made be the spatial density value of the point. (B) the point cloud model from 24 December 2021 after classification.
Remotesensing 15 00408 g009
Figure 10. The voxel point clouds for the data before and after pruning; blue points indicate before pruning, and green points indicate after pruning. B3–E4 represent the ID of tree; (top): 3D lidar SLAM; (middle): UAV-SfM point cloud; (bottom): UAV-SfM dense point cloud.
Remotesensing 15 00408 g010aRemotesensing 15 00408 g010b
Table 1. Comparison of the point cloud models.
Type of DataDateProcessing TimeNumber of Points in All FieldsNumber of Points in Target Areas
without Land
Number of Voxel Points in Target Area
3D lidar SLAM24 December 20218 min2,271,670286,665122,130
3D lidar SLAM4 February 20229 min1,809,583243,83099,160
3D lidar SLAM24 February 20228 min1,869,821153,38963,260
3D lidar SLAM4 March 202210 min1,971,106170,65563,835
UAV-SfM, point cloud4 February 2022371 min14,023,81638,35511,123
UAV-SfM, point cloud4 March 2022412 min14,309,07762,65714,816
UAV-SfM, dense point cloud4 February 20221124 min50,124,418188,4545240
UAV-SfM, dense point cloud4 March 20221363 min26,118,154298,01010,183
Table 2. Comparison of the point cloud differences for each model.
RMSE (m)Reference
3D Lidar SLAMUAV-SfM Point CloudUAV-SfM Dense Point Cloud
24 December 20214 February 202224 February 20224 March 20224 February 20224 March 20224 February 20224 March 2022
Aligned3D lidar SLAM24 December 202100.120.060.080.210.140.120.07
4 February 2022 00.060.070.220.140.110.07
24 February 2022 00.080.250.170.140.09
4 March 2022 00.240.170.120.09
UAV-SfM point cloud4 February 2022 00.220.080.2
4 March 2022 00.140.22
UAV-SfM dense point cloud4 February 2022 00.6
4 March 2022 0
Table 3. Relationship between the branch diameter and cross-sectional points of the 3D point cloud.
No.CatalogDiameter (cm) Cross-Sectional PointsNo.CatalogDiameter
(cm)
A4Major branches2026No. 1 endSub-major branches3
B2Major branches2524No. 2 endSub-major branches8
B3Major branches2120No. 3 endSub-major branches5
C4Major branches1919No. 4 endSub-major branches4
No. 1 major branches sideSub-major branches179No. 5 endSub-major branches4
No. 2 major branches sideSub-major branches108No. 3Side branchesMean 1.63
No. 3 major branches sideSub-major branches107
No. 4 major branches sideSub-major branches89
No. 5 major branches sideSub-major branches810
Table 4. Relationship between fresh weight and estimated volume value in different blocks at the experimental site.
RMSE (g) R 2CorrelationFormula
3D lidar SLAM30840.93positivey = 0.2122x + 196.25
UAV-SfM point cloud44960.94negativey = −0.2478x + 764.52
UAV-SfM dense point cloud45540.1positivey = 0.07x − 773.22
Disclaimer/Publisher’s Note: The statements, opinions and data contained in all publications are solely those of the individual author(s) and contributor(s) and not of MDPI and/or the editor(s). MDPI and/or the editor(s) disclaim responsibility for any injury to people or property resulting from any ideas, methods, instructions or products referred to in the content.

