
Spatiotemporal Distribution of CO in the UTLS Region in the Asian Summer Monsoon Season: Analysis of MLS Observations and CMIP6 Simulations
Abstract
:1. Introduction
2. Data Description
2.1. Satellite Data
2.2. Meteorological Analysis Data
2.3. CMIP6 Models
3. Method
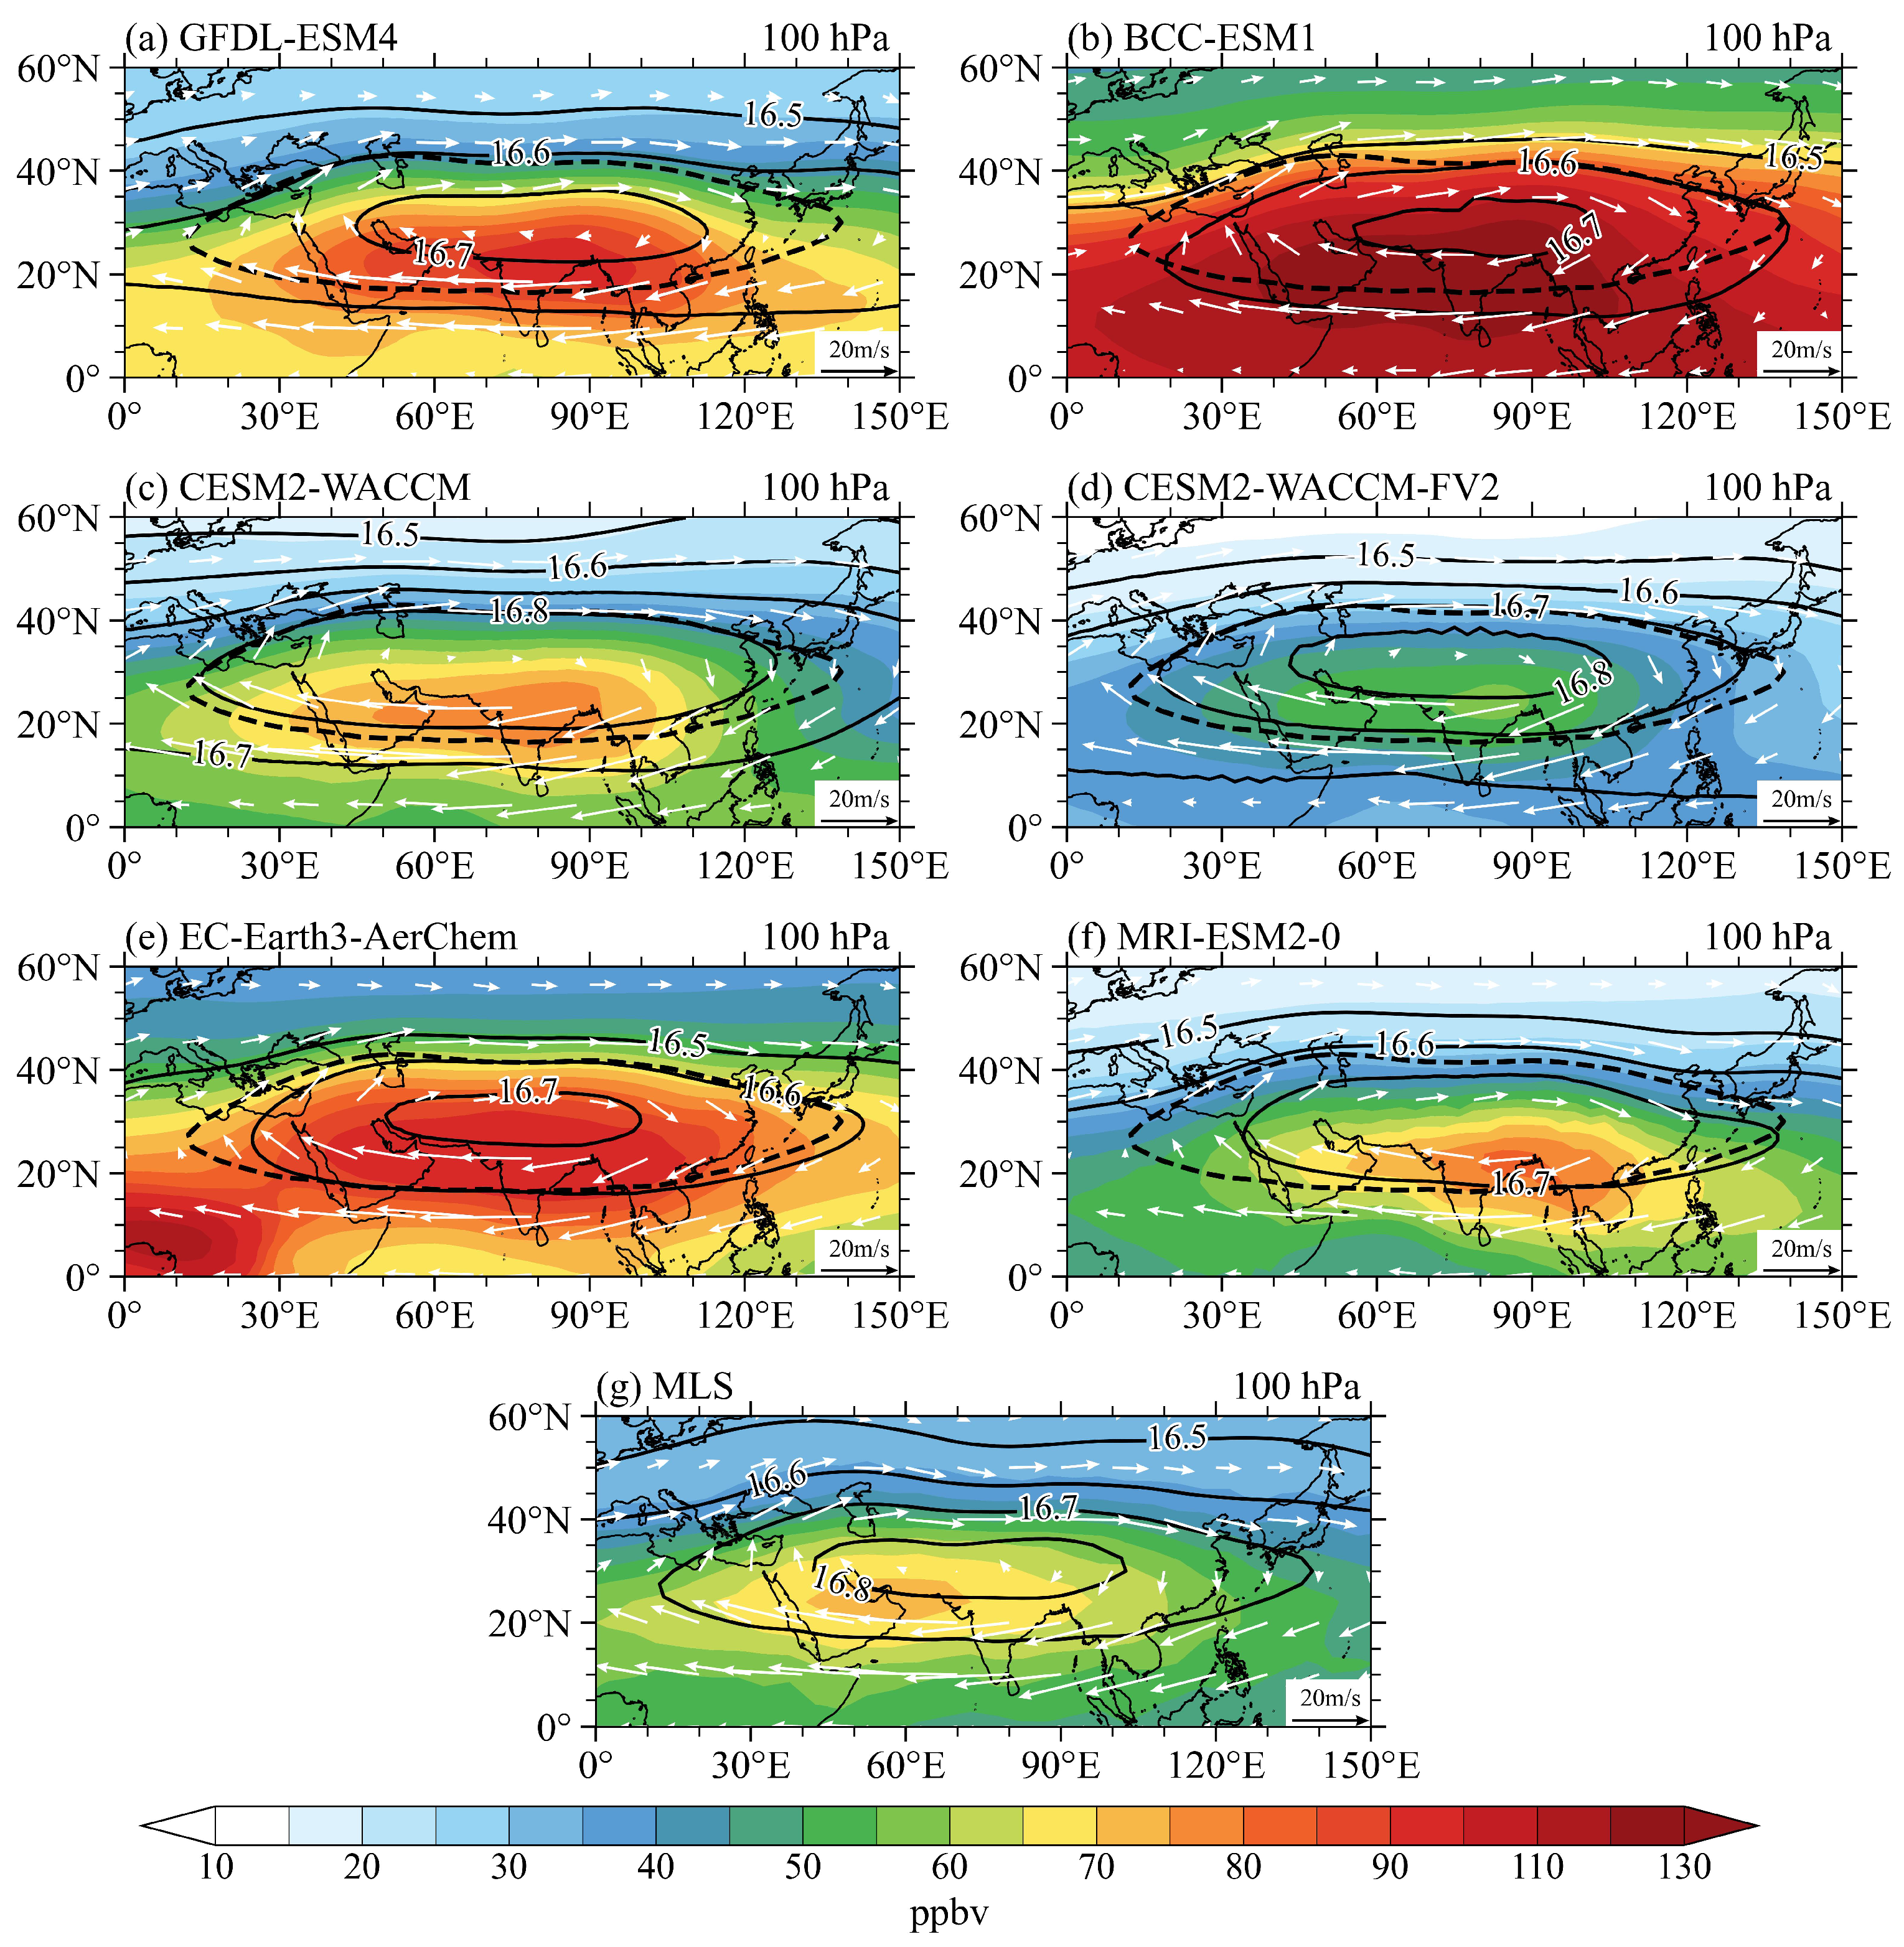
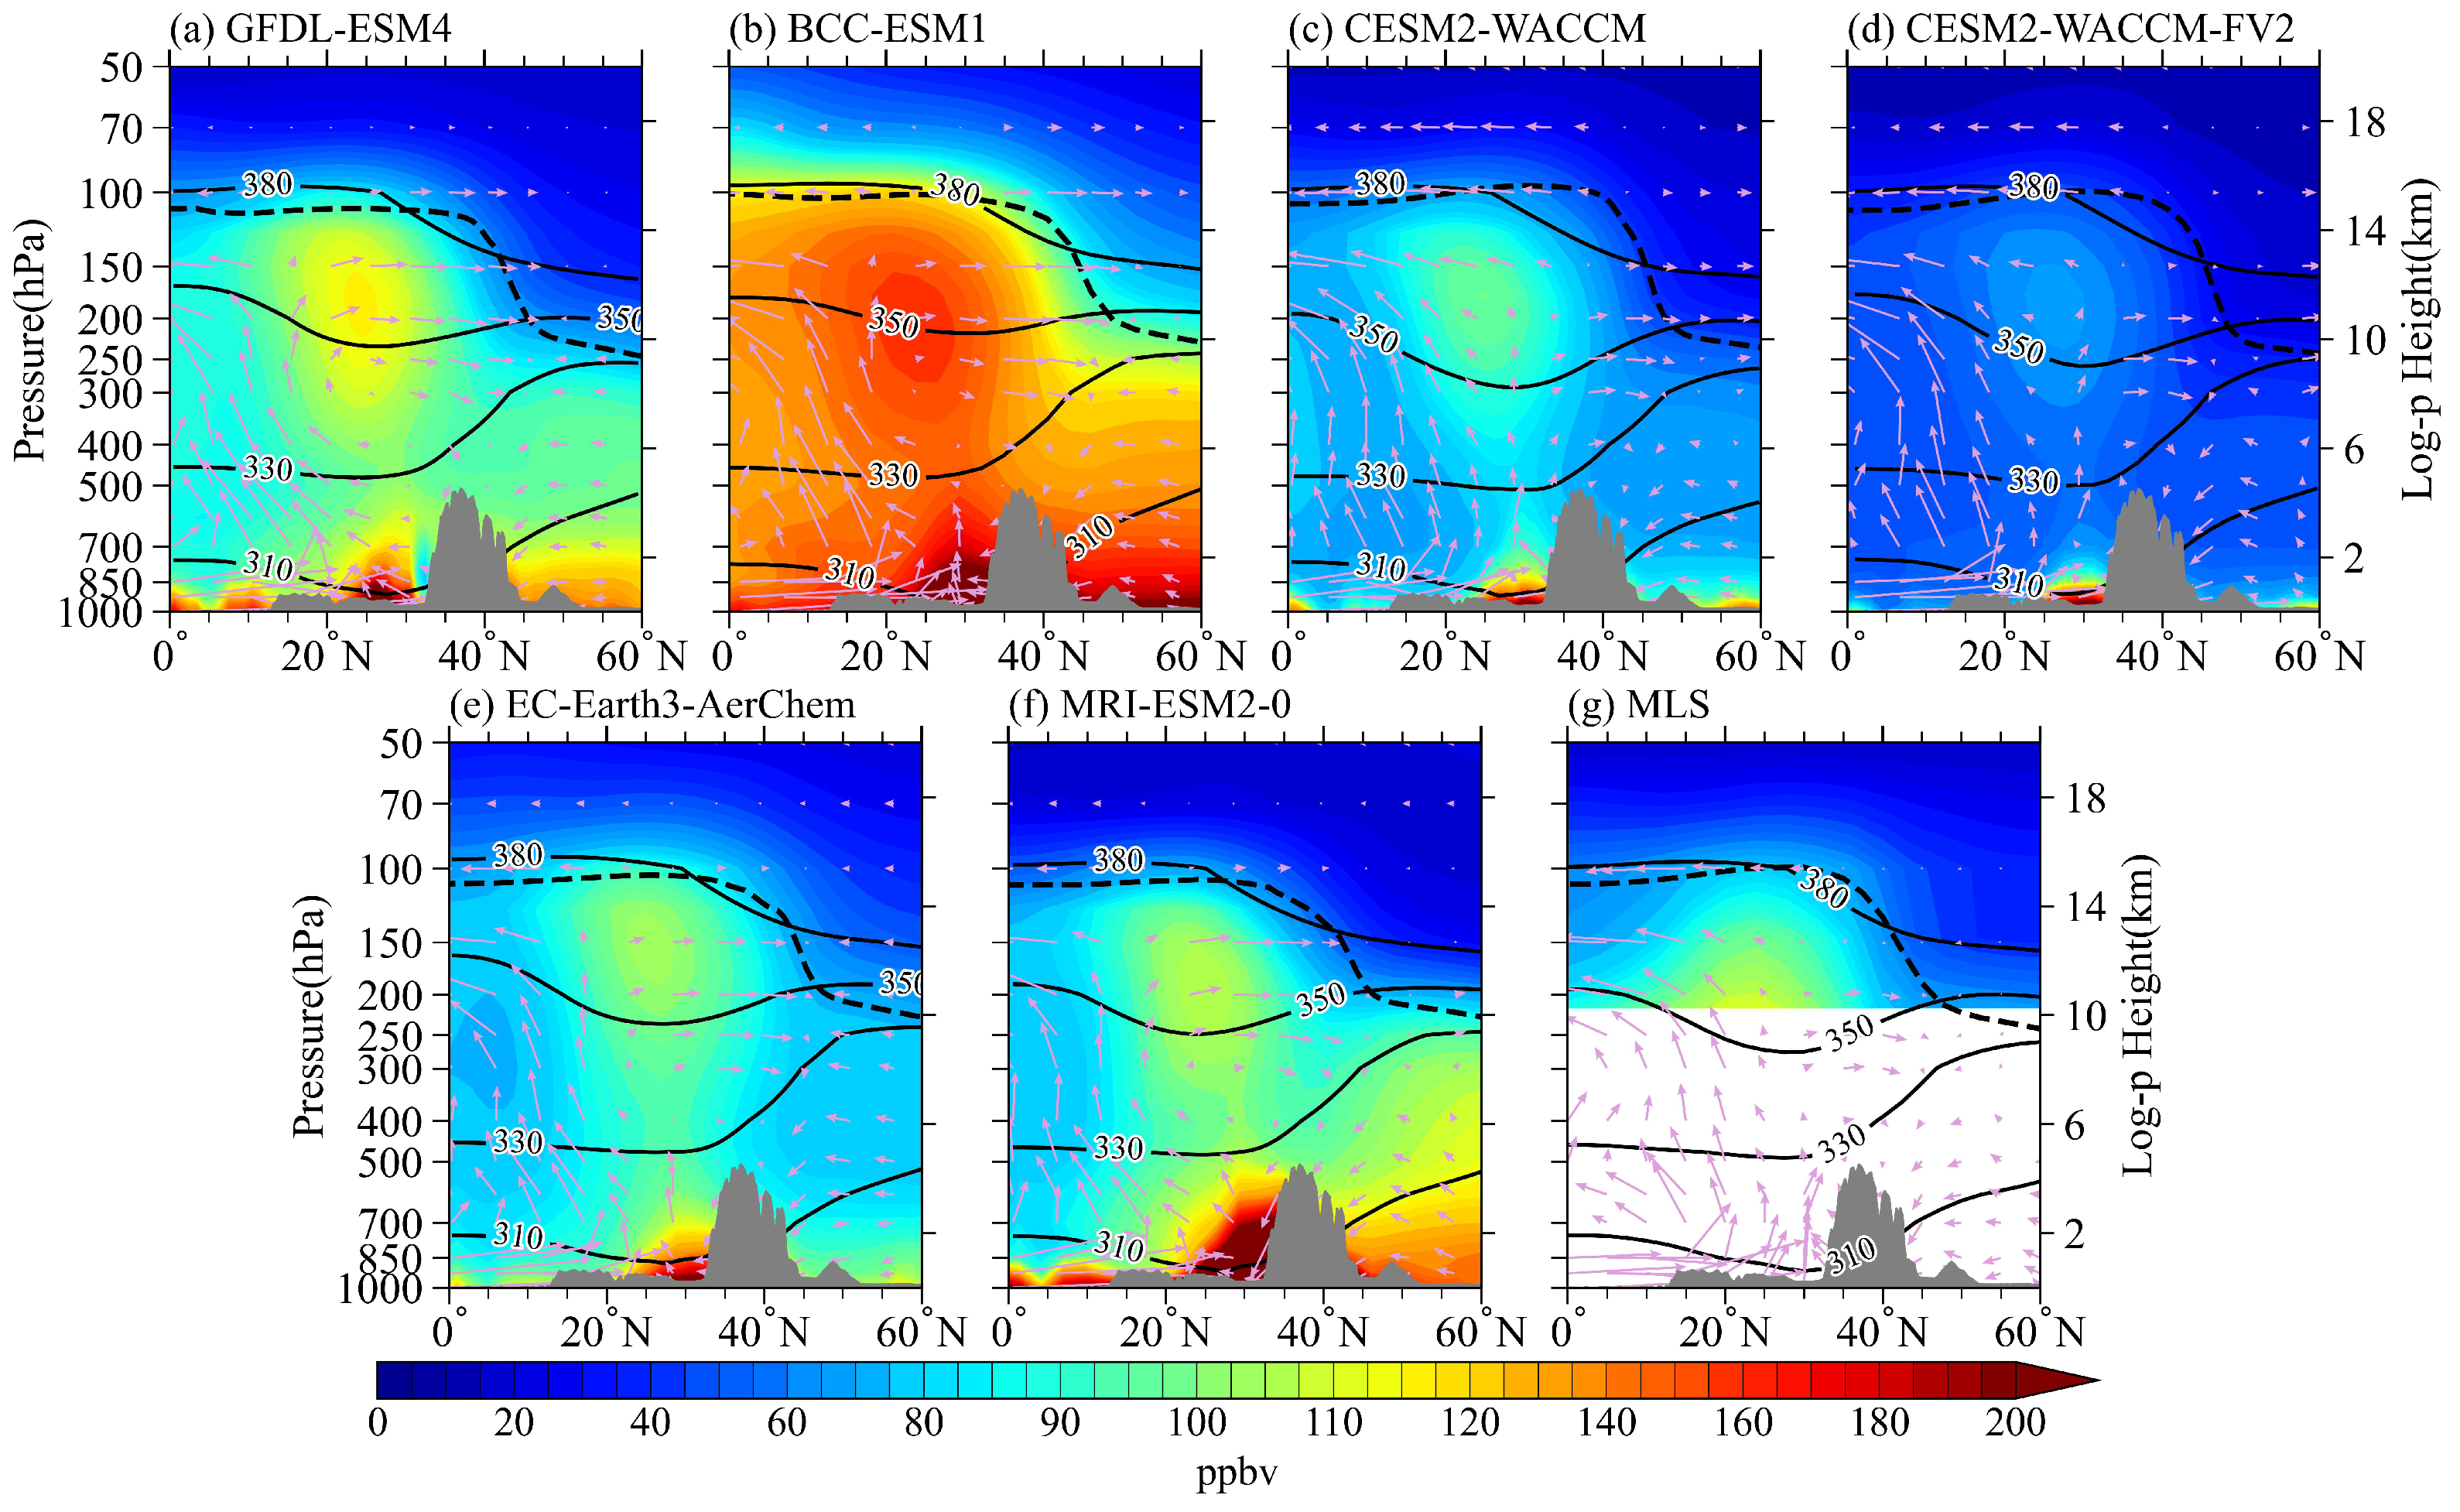
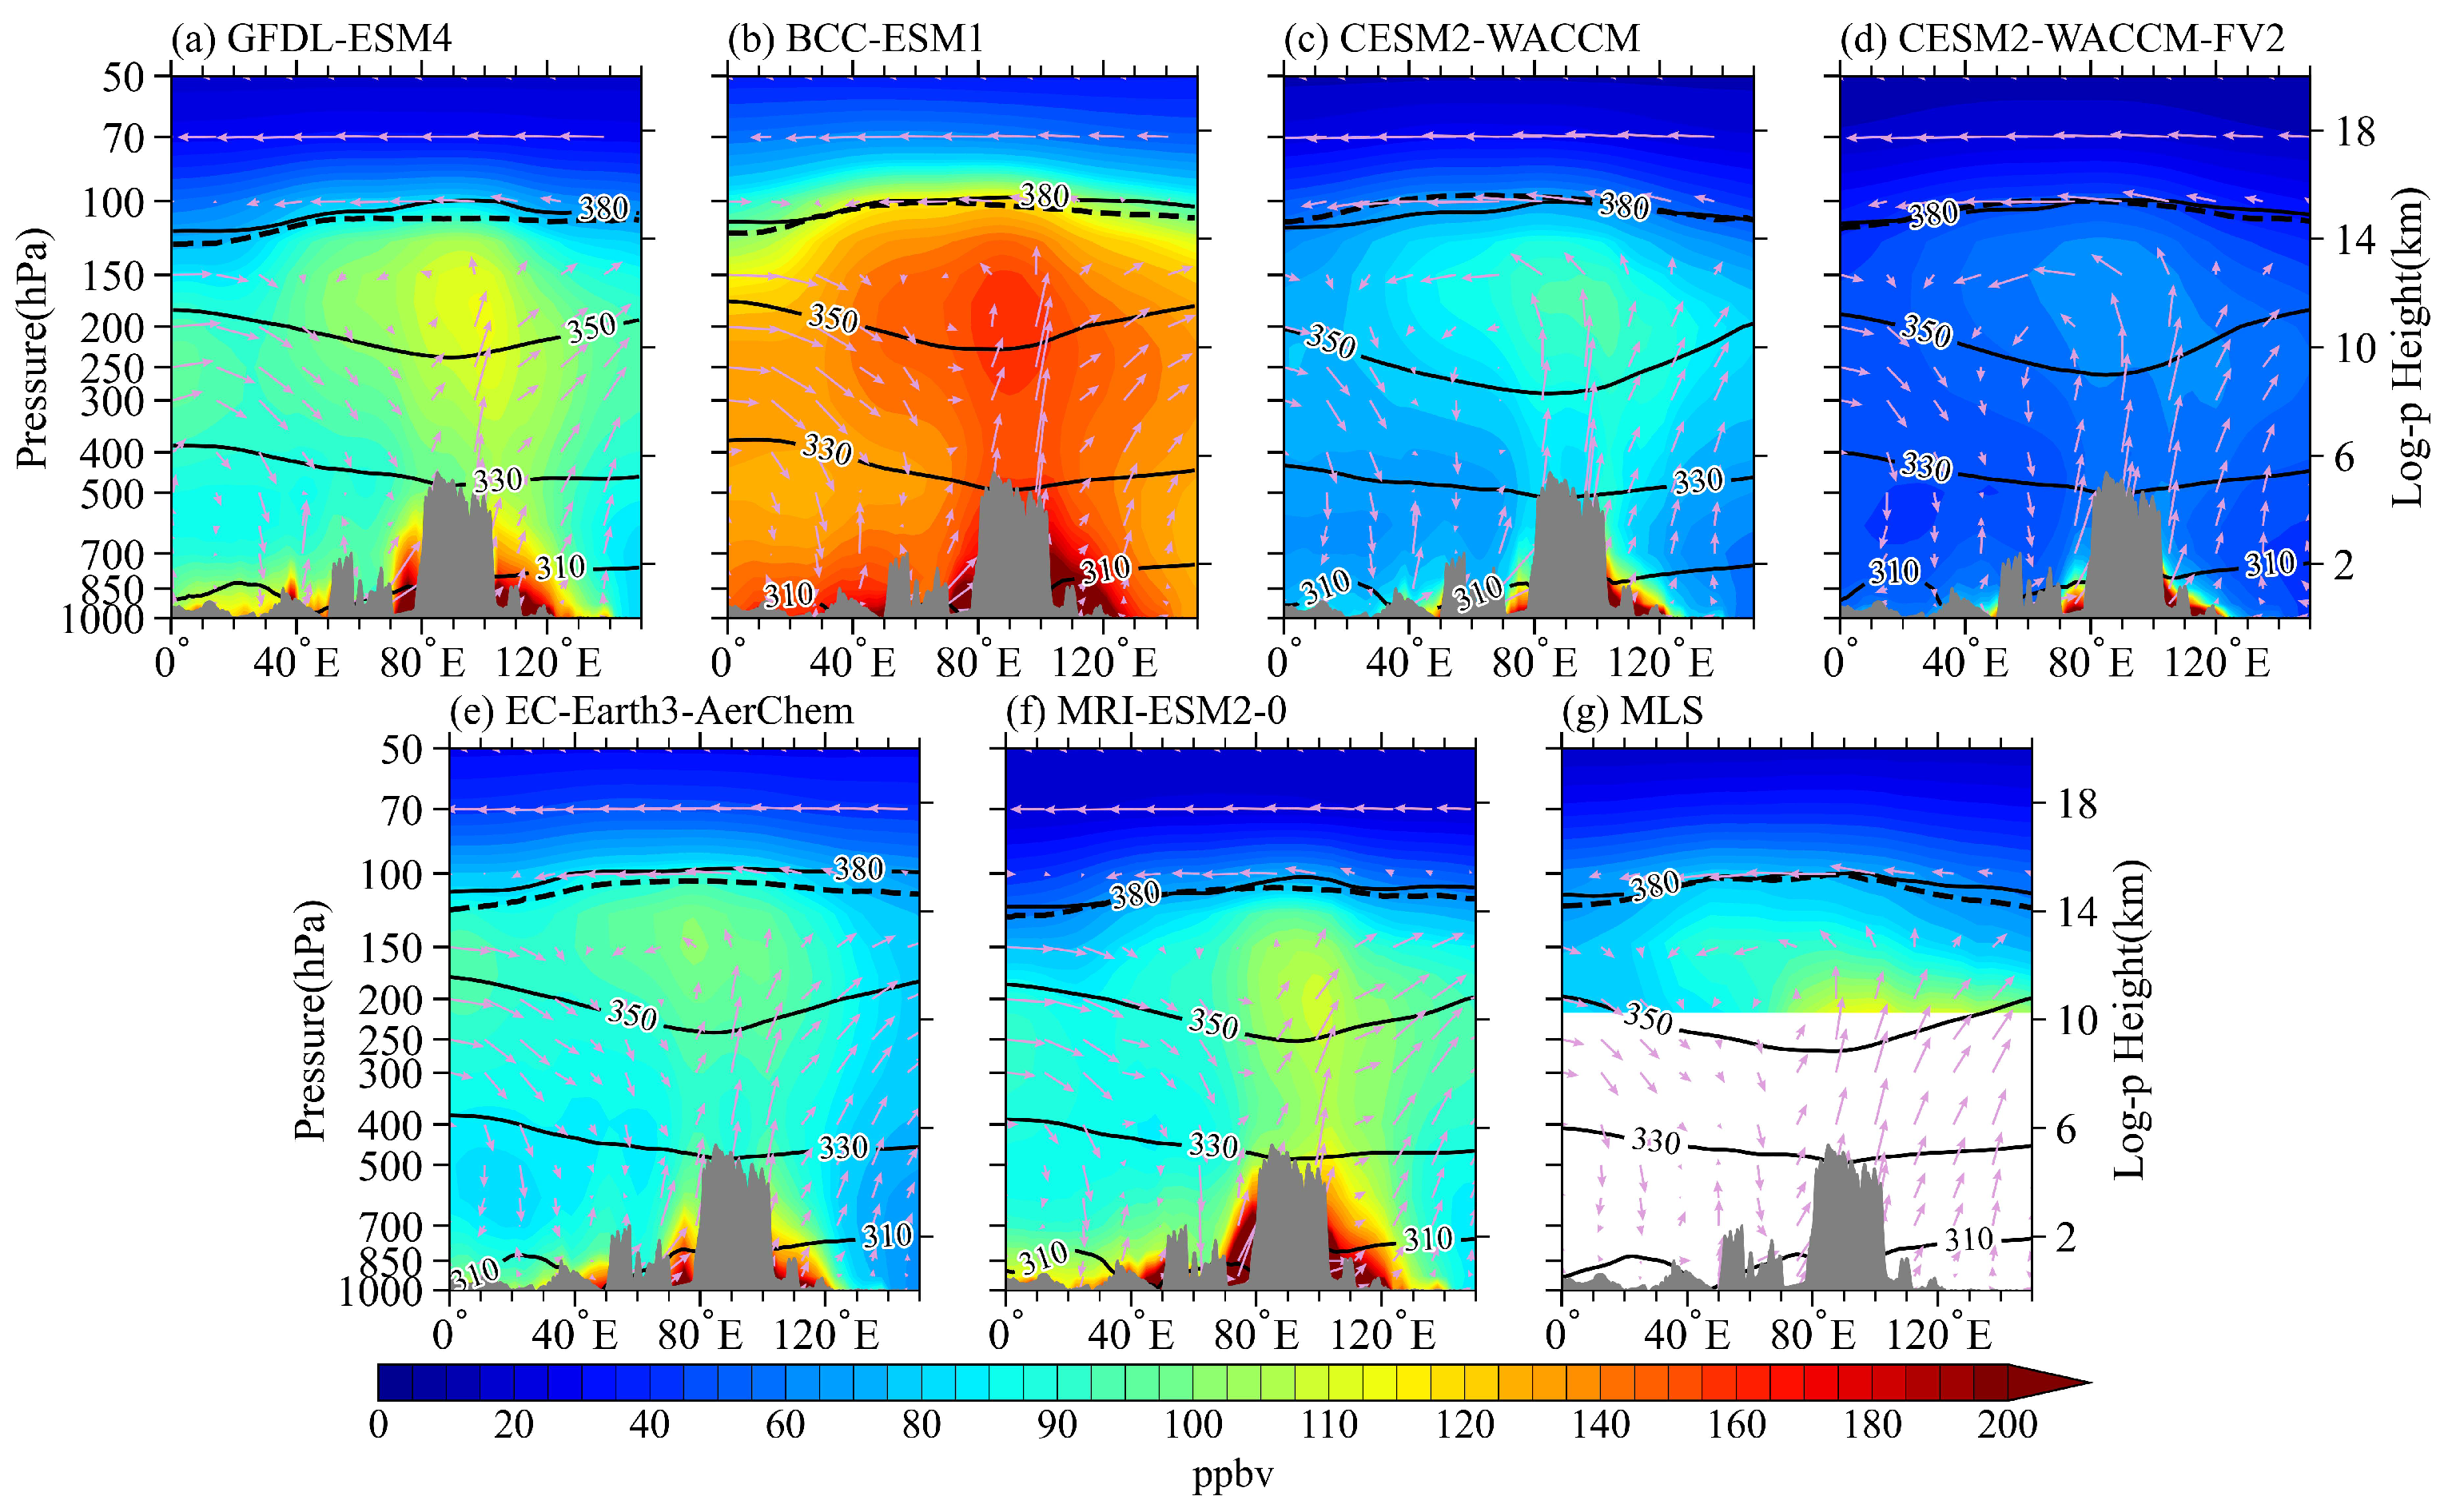
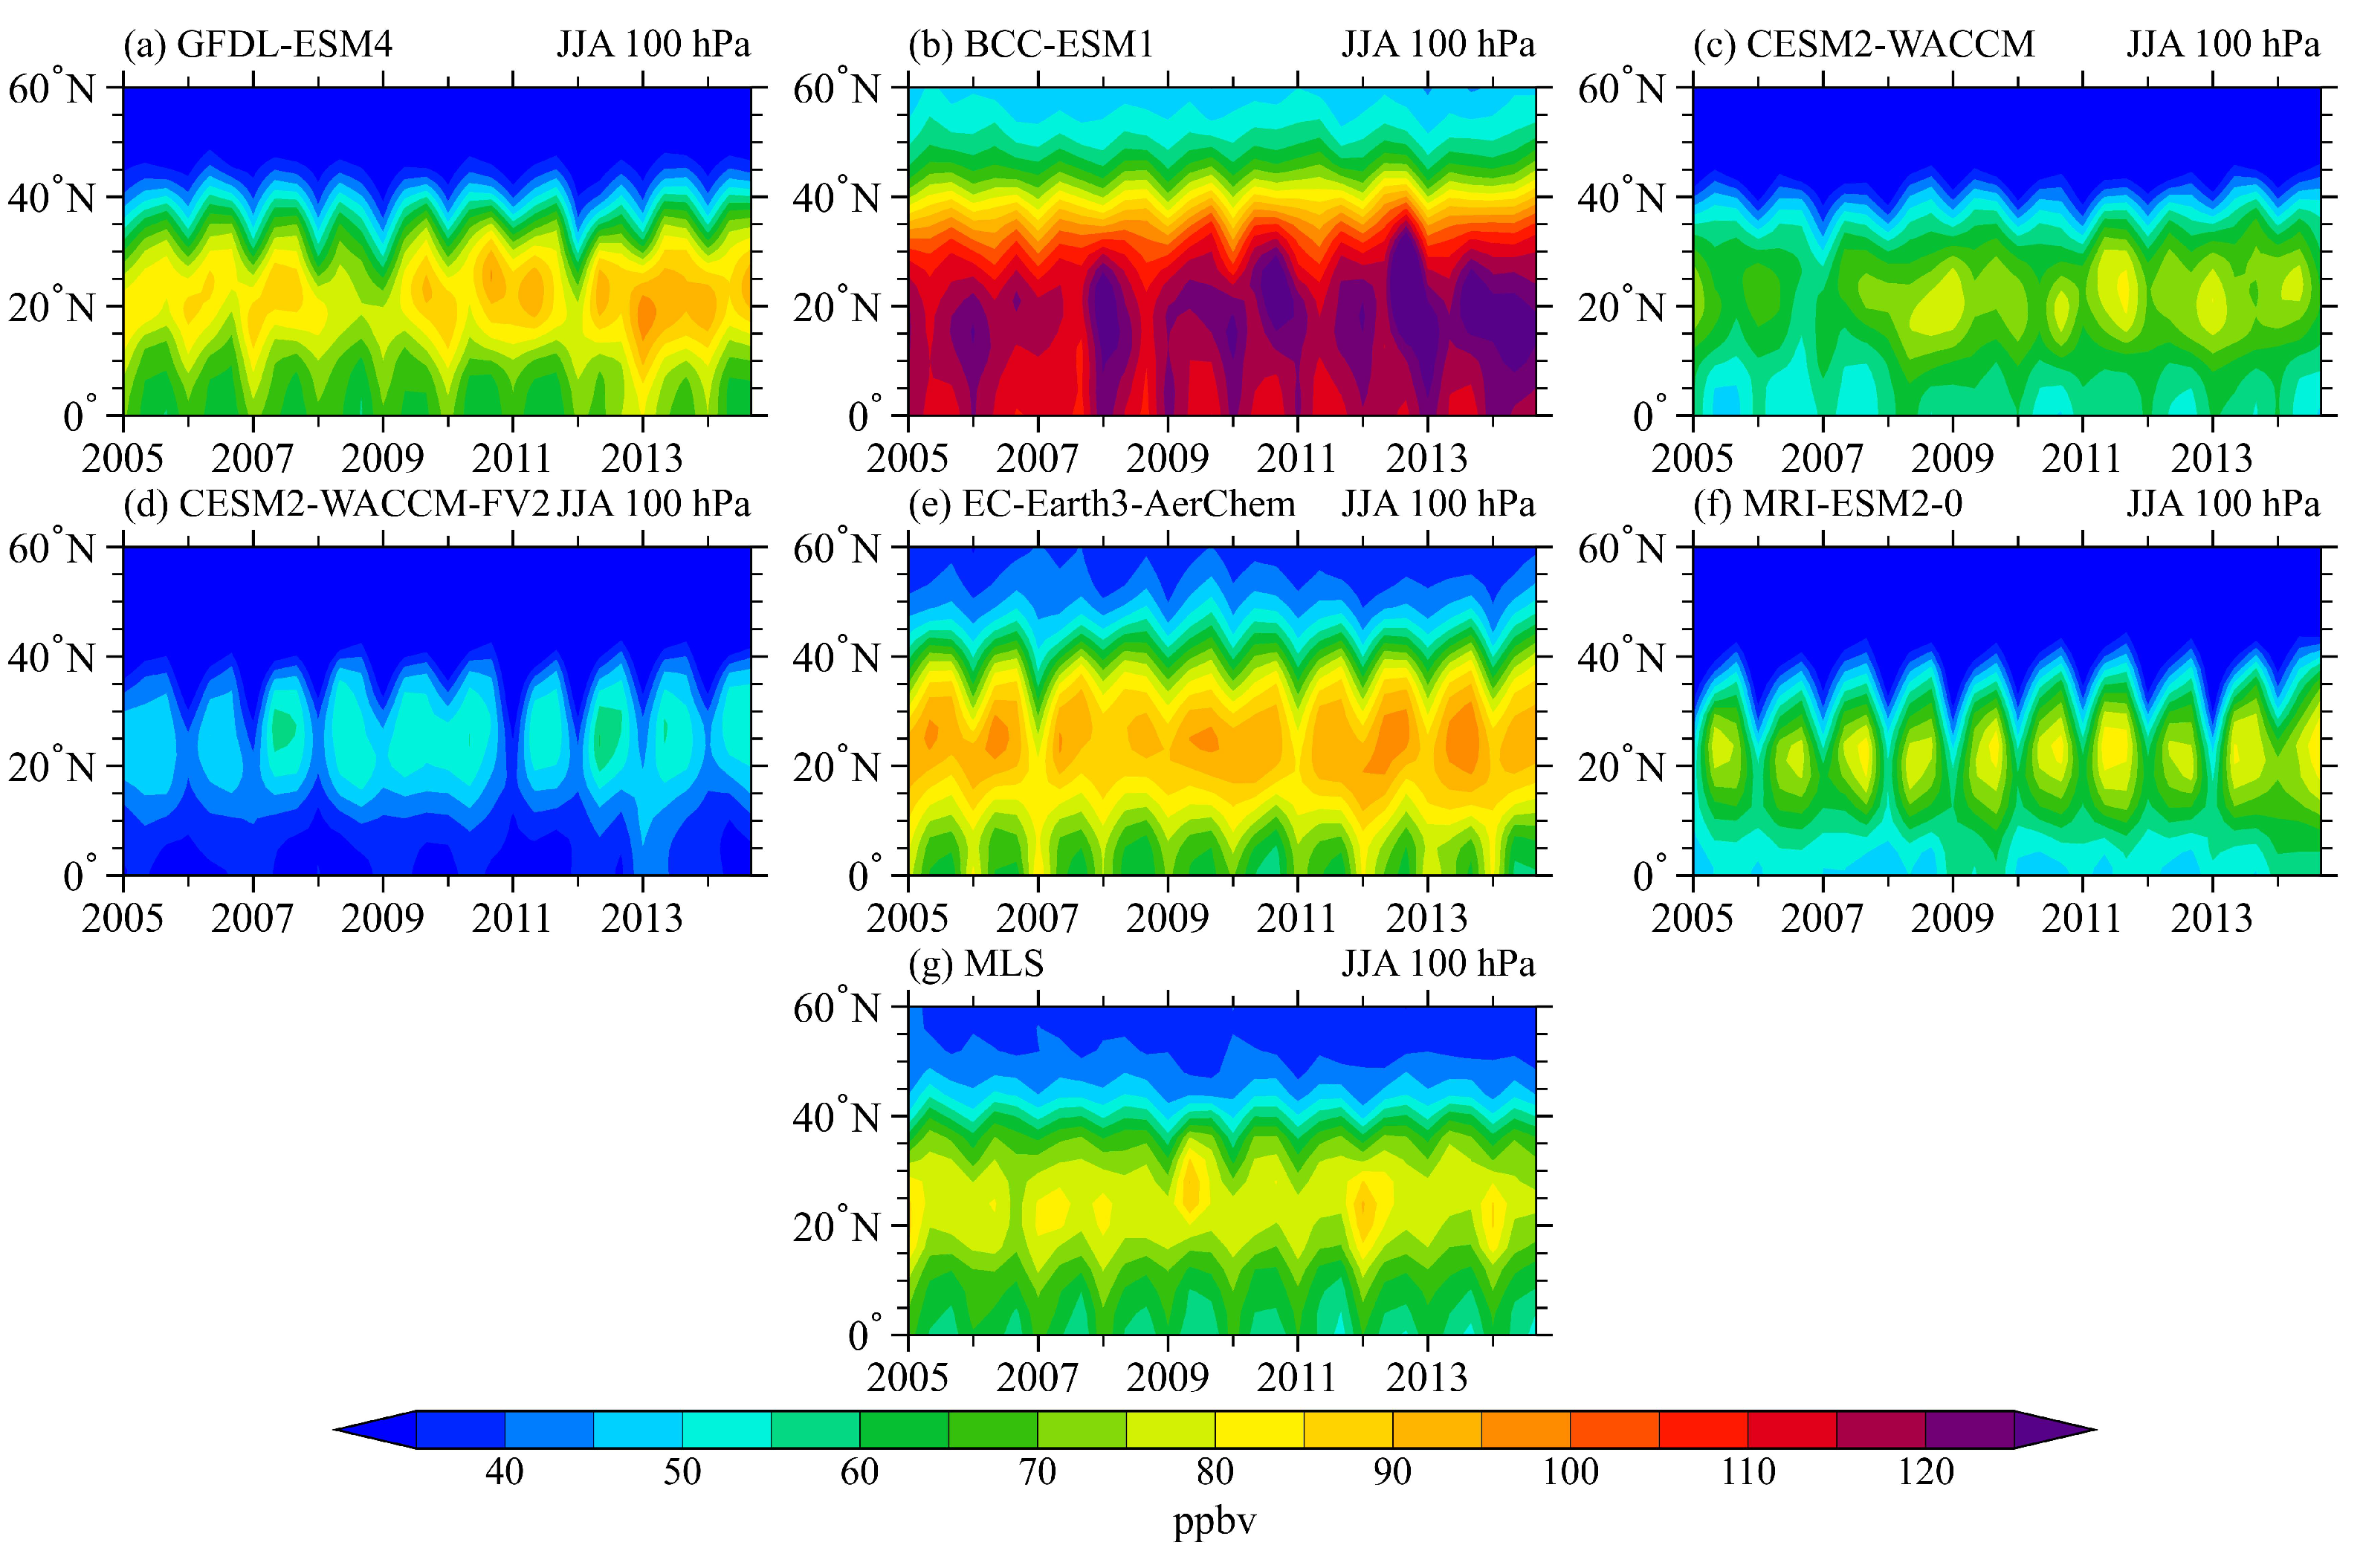
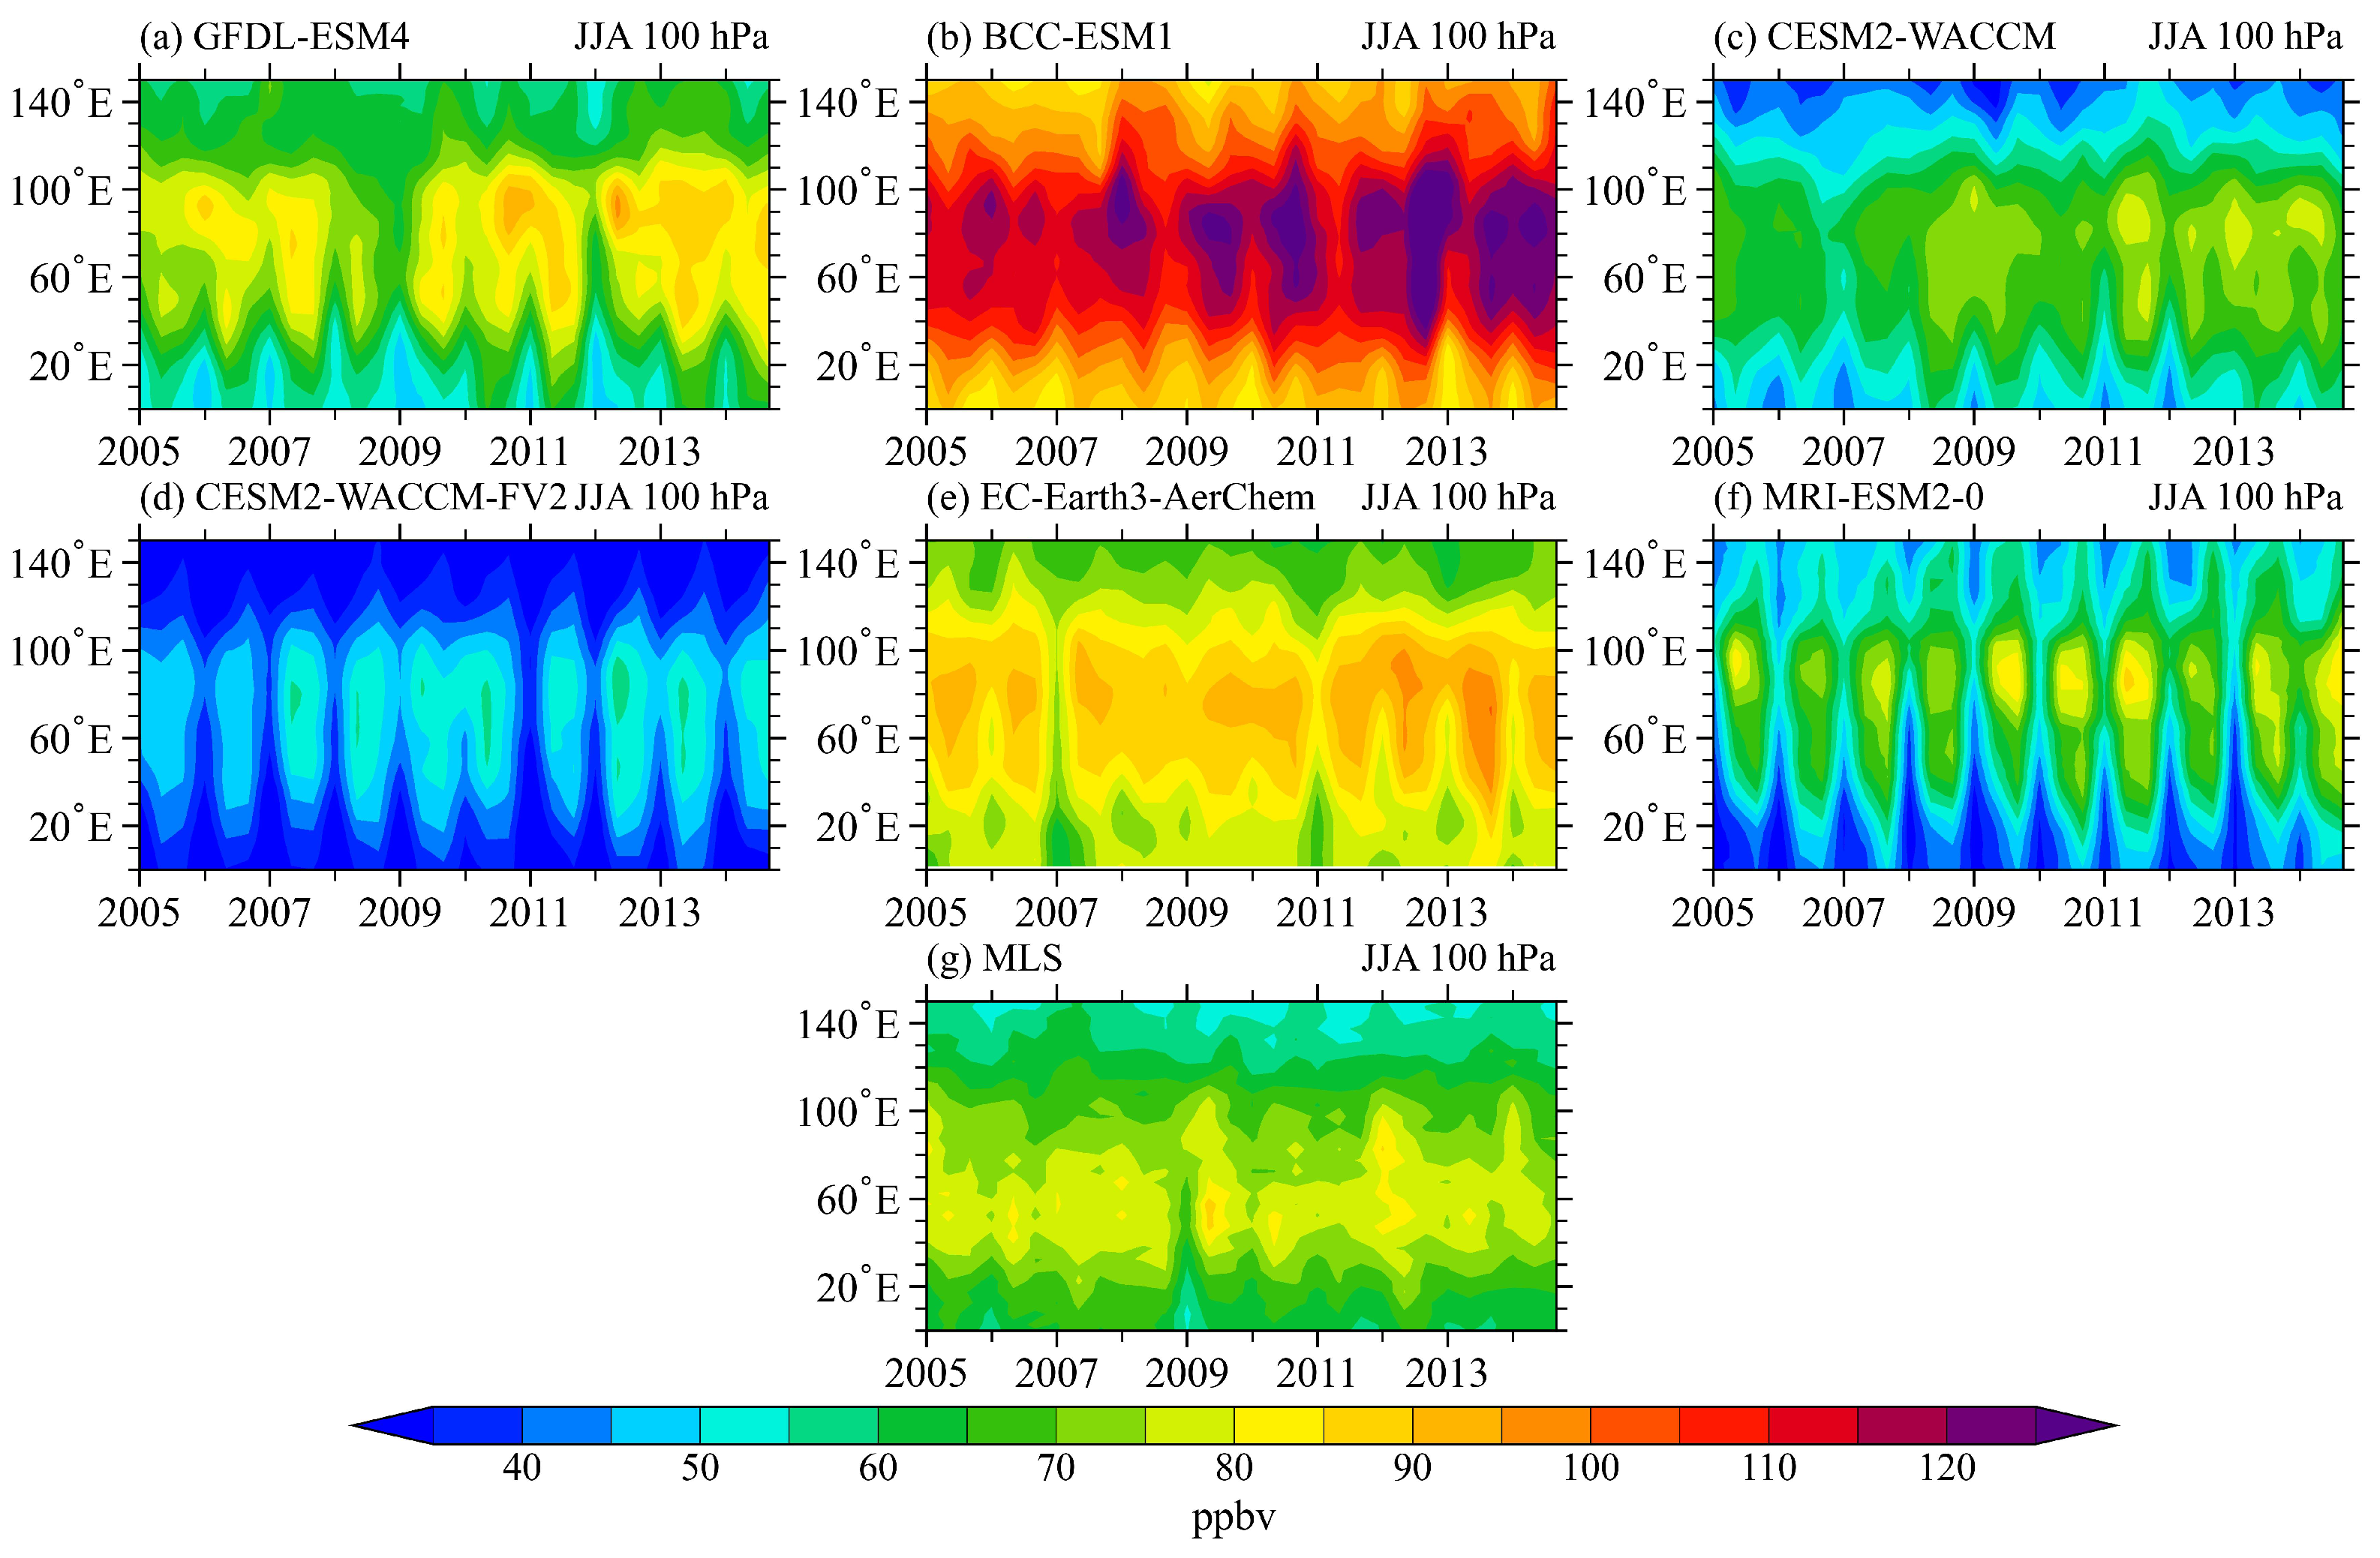
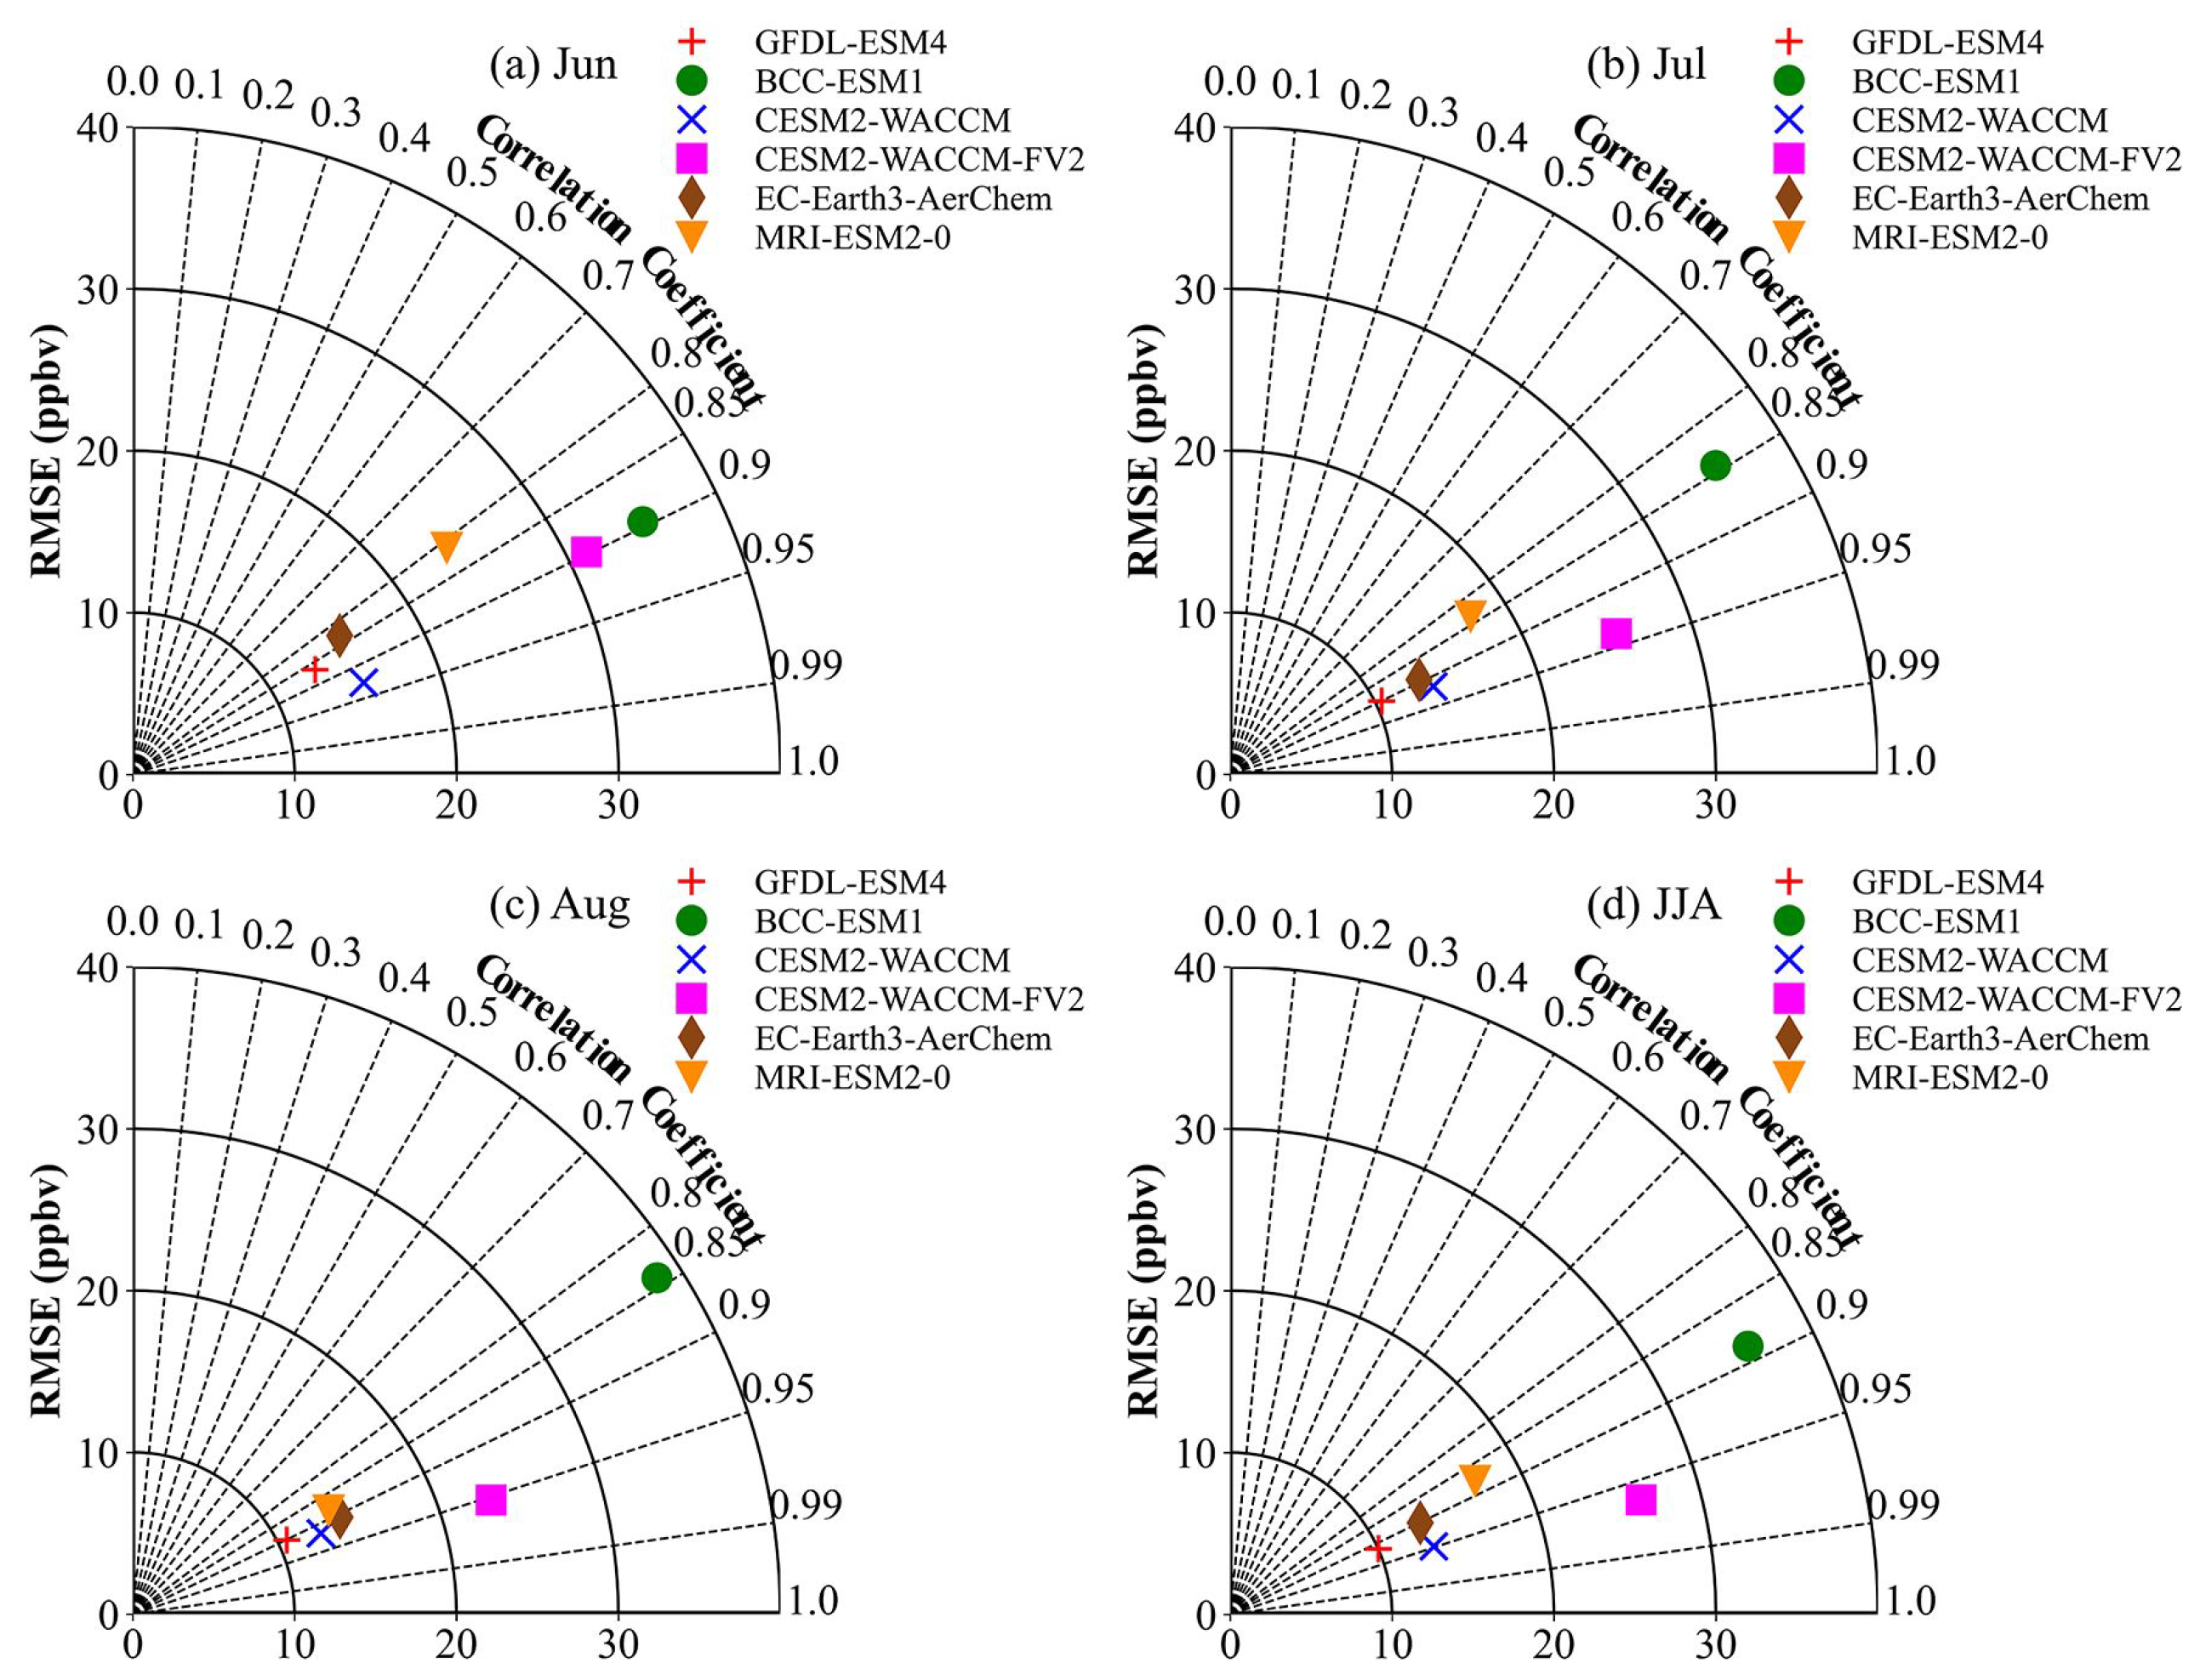
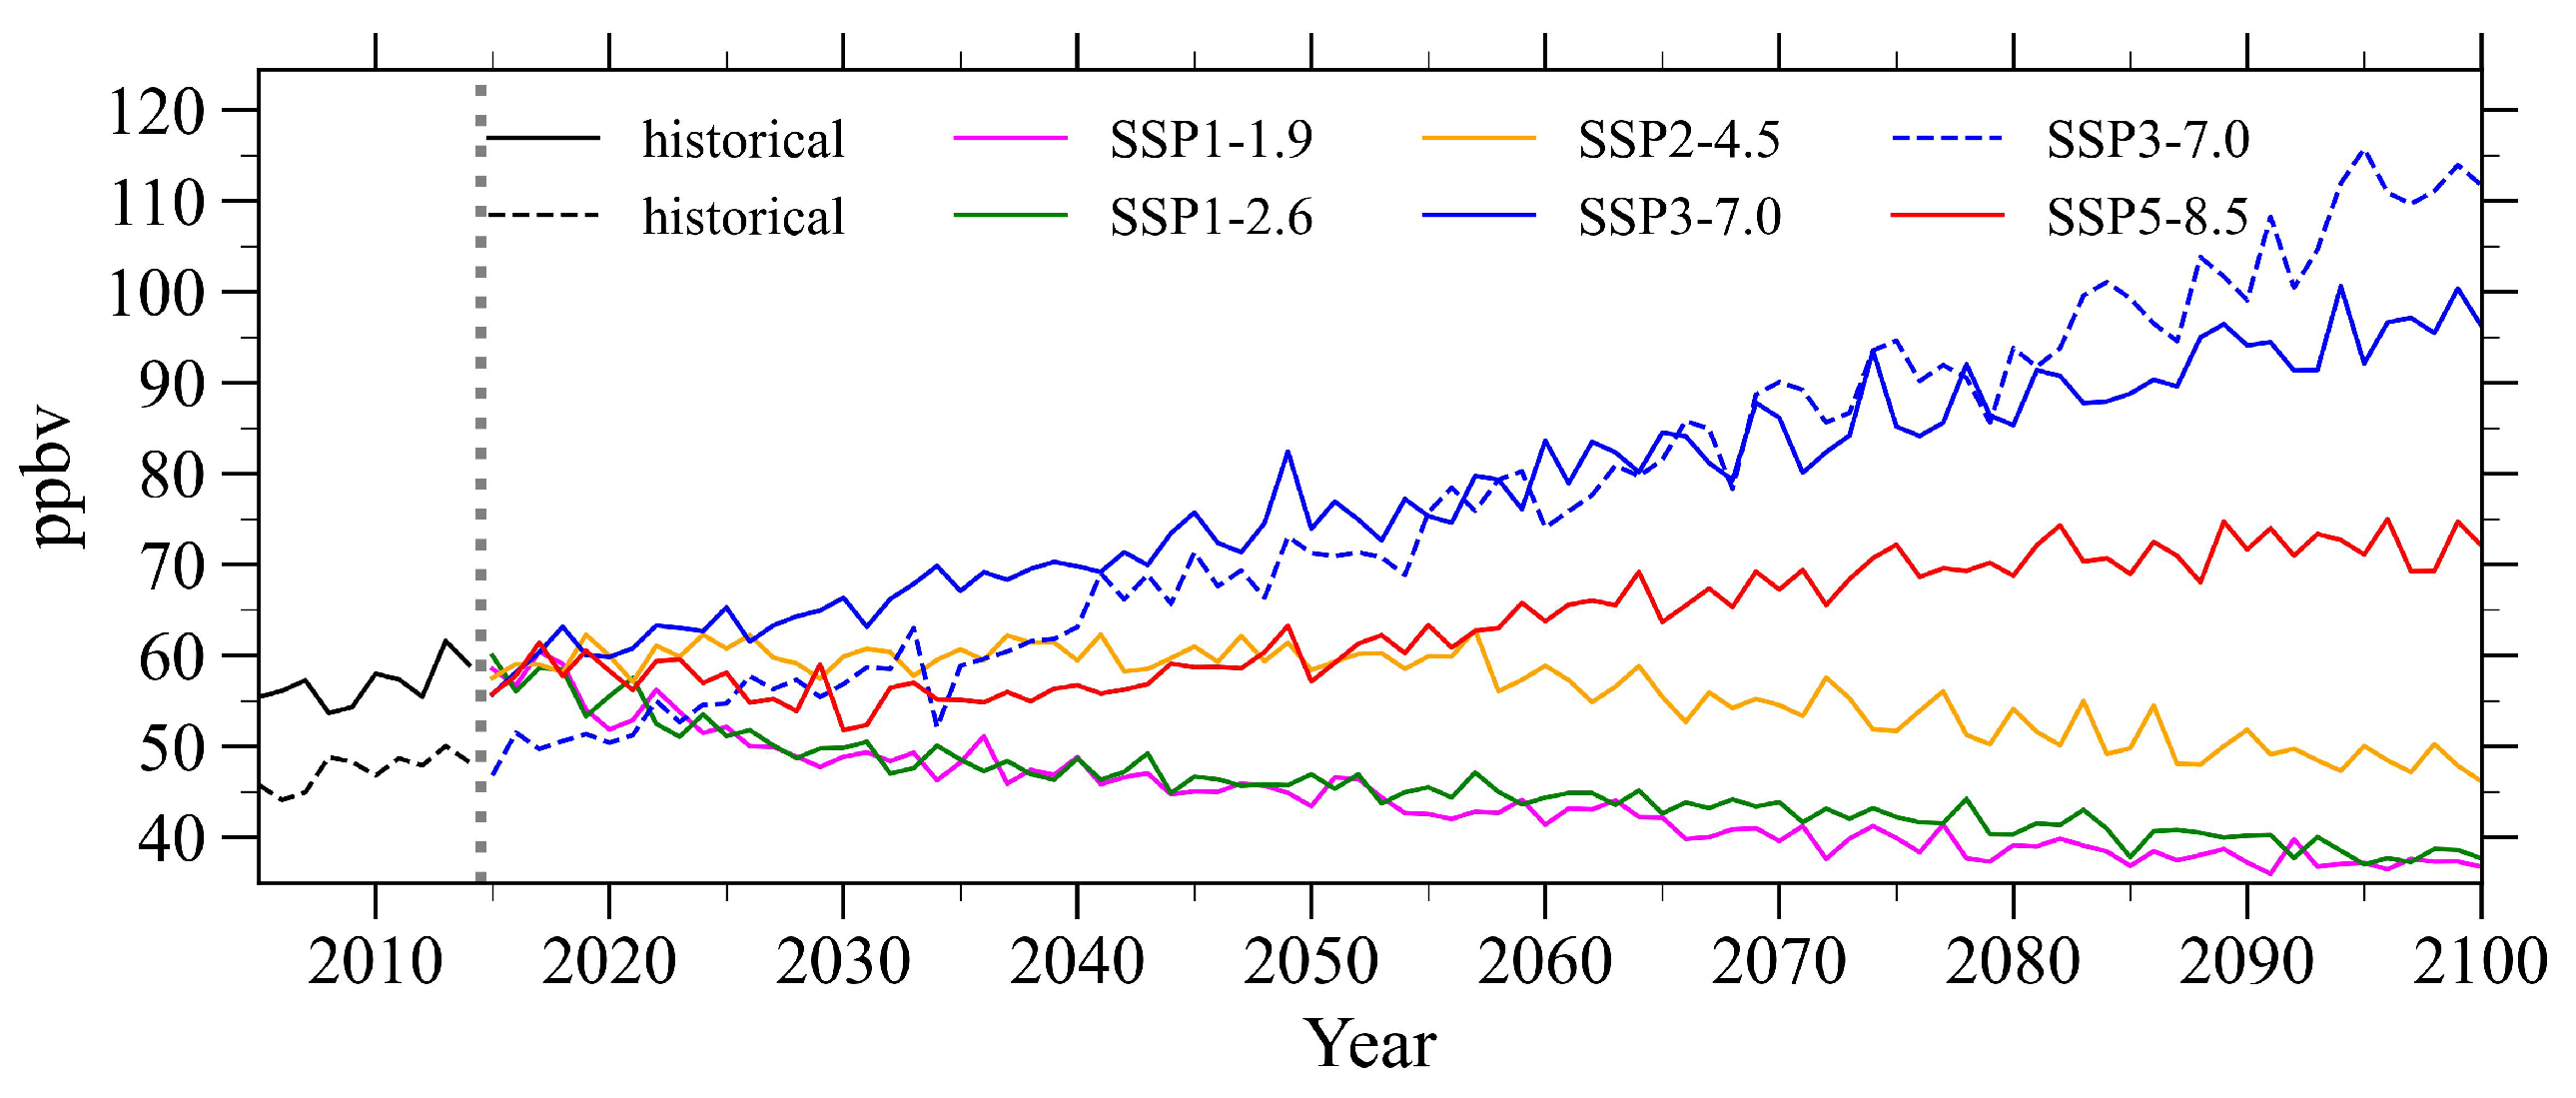
4. Results
5. Summary
Author Contributions
Funding
Institutional Review Board Statement
Informed Consent Statement
Data Availability Statement
Acknowledgments
Conflicts of Interest
References
- Randel, W.J.; Park, M. Deep convective influence on the Asian summer monsoon anticyclone and associated tracer variability observed with Atmospheric Infrared Sounder (AIRS). J. Geophys. Res. 2006, 111, D12314. [Google Scholar] [CrossRef]
- Randel, W.J.; Park, M.; Emmons, L.; Kinnison, D.; Bernath, P.; Walker, K.A.; Boone, C.; Pumphrey, H. Asian Monsoon Transport of Pollution to the Stratosphere. Science 2010, 328, 611–613. [Google Scholar] [CrossRef] [PubMed] [Green Version]
- Garny, H.; Randel, W.J. Dynamic variability of the Asian monsoon anticyclone observed in potential vorticity and correlations with tracer distributions: Anticyclone variability. J. Geophys. Res. Atmos. 2013, 118, 421–433. [Google Scholar] [CrossRef]
- Luo, J.; Pan, L.L.; Honomichl, S.B.; Bergman, J.W.; Randel, W.J.; Francis, G.; Clerbaux, C.; George, M.; Liu, X.; Tian, W. Space–time variability in UTLS chemical distribution in the Asian summer monsoon viewed by limb and nadir satellite sensors. Atmos. Chem. Phys. 2018, 18, 12511–12530. [Google Scholar] [CrossRef] [Green Version]
- Ren-Chang, Y.; Jian-Chun, B.; Qiu-Jun, F. The Impact of the South Asia High Bimodality on the Chemical Composition of the Upper Troposphere and Lower Stratosphere. Atmos. Ocean. Sci. Lett. 2011, 4, 229–234. [Google Scholar] [CrossRef] [Green Version]
- Ohara, T.A.H.K.; Akimoto, H.; Kurokawa, J.I.; Horii, N.; Yamaji, K.; Yan, X.; Hayasaka, T. An Asian emission inventory of anthropogenic emission sources for the period 1980–2020. Atmos. Chem. Phys. 2007, 7, 4419–4444. [Google Scholar] [CrossRef] [Green Version]
- Bowman, K.P. Transport of carbon monoxide from the tropics to the extratropics. J. Geophys. Res. 2006, 111, D02107. [Google Scholar] [CrossRef]
- Xiao, Y.; Jacob, D.J.; Turquety, S. Atmospheric acetylene and its relationship with CO as an indicator of air mass age. J. Geophys. Res. 2007, 112, D12305. [Google Scholar] [CrossRef] [Green Version]
- Li, Q.; Jiang, J.H.; Wu, D.L.; Read, W.G.; Livesey, N.J.; Waters, J.W.; Zhang, Y.; Wang, B.; Filipiak, M.J.; Davis, C.P.; et al. Convective outflow of South Asian pollution: A global CTM simulation compared with EOS MLS observations: Trapping of asian pollution. Geophys. Res. Lett. 2005, 32, L14826. [Google Scholar] [CrossRef]
- Glatthor, N.; Höpfner, M.; Stiller, G.P.; Von Clarmann, T.; Funke, B.; Lossow, S.; Eckert, E.; Grabowski, U.; Kellmann, S.; Linden, A.; et al. Seasonal and interannual variations in HCN amounts in the upper troposphere and lower stratosphere observed by MIPAS. Atmos. Chem. Phys. 2015, 15, 563–582. [Google Scholar] [CrossRef]
- Kunze, M.; Braesicke, P.; Langematz, U.; Stiller, G. Interannual variability of the boreal summer tropical UTLS inobservations and CCMVal-2 simulations. Atmos. Chem. Phys. 2016, 16, 8695–8714. [Google Scholar] [CrossRef] [Green Version]
- Park, M.; Randel, W.J.; Gettelman, A.; Massie, S.T.; Jiang, J.H. Transport above the Asian summer monsoon anticyclone inferred from Aura Microwave Limb Sounder tracers. J. Geophys. Res. 2007, 112, D16309. [Google Scholar] [CrossRef] [Green Version]
- Alley, R.; Berntsen, T.; Bindoff, N.L.; Chen, Z.; Chidthaisong, A.; Friedlingstein, P.; Zwiers, F. Climate Change 2007: The Physical Science Basis. Contribution of Working Group I to the Fourth Assessment Report of the Intergovernmental Panel on Climate Change. Summary for Policymakers; IPCC Secretariat: Geneva, Switzerland, 2007; 21p. [Google Scholar]
- Zhou, T.; Yu, R. Twentieth-Century Surface Air Temperature over China and the Globe Simulated by Coupled Climate Models. J. Clim. 2006, 19, 5843–5858. [Google Scholar] [CrossRef]
- Eyring, V.; Bony, S.; Meehl, G.A.; Senior, C.A.; Stevens, B.; Stouffer, R.J.; Taylor, K.E. Overview of the Coupled Model Intercomparison Project Phase 6 (CMIP6) experimental design and organization. Geosci. Model Dev. 2016, 9, 1937–1958. [Google Scholar] [CrossRef] [Green Version]
- Jiang, D.; Hu, D.; Tian, Z.; Lang, X. Differences between CMIP6 and CMIP5 Models in Simulating Climate over China and the East Asian Monsoon. Adv. Atmos. Sci. 2020, 37, 1102–1118. [Google Scholar] [CrossRef]
- Schwartz, M.; Pumphrey, H.; Livesey, N.; Read, W.; Fuller, R. MLS/Aura Level 3 Monthly Binned Carbon Monoxide (CO) Mixing Ratio on Assorted Grids V004. Greenbelt, MD, USA, Goddard Earth Sciences Data and Information Services Center (GES DISC). Available online: https://10.5067/Aura/MLS/DATA/3205 (accessed on 1 November 2022).
- Livesey, N.J.; Filipiak, M.J.; Froidevaux, L.; Read, W.G.; Lambert, A.; Santee, M.L.; Jiang, J.H.; Pumphrey, H.C.; Waters, J.W.; Cofield, R.E.; et al. Validation of Aura Microwave Limb Sounder O 3 and CO observations in the upper troposphere and lower stratosphere. J. Geophys. Res. 2008, 113, D15S02. [Google Scholar] [CrossRef] [Green Version]
- Commerce NC for EPWSSD of. NCEP FNL Operational Model Global Tropospheric Analyses, Continuing from July 1999. Available online: https://doi.org/10.5065/d6m043c6 (accessed on 1 November 2022).
- Wu, T.; Zhang, F.; Zhang, J.; Jie, W.; Zhang, Y.; Wu, F.; Li, L.; Yan, J.; Liu, X.; Lu, X.; et al. Beijing Climate Center Earth System Model version 1 (BCC-ESM1): Model description and evaluation of aerosol simulations. Geosci. Model Dev. 2020, 13, 977–1005. [Google Scholar] [CrossRef] [Green Version]
- Danabasoglu, G.; Lamarque, J.F.; Bacmeister, J.; Bailey, D.A.; DuVivier, A.K.; Edwards, J.; Emmons, L.K.; Fasullo, J.; Garcia, R.; Gettelman, A.; et al. The Community Earth System Model Version 2 (CESM2). J. Adv. Model. Earth Syst. 2020, 12, e2019MS001916. [Google Scholar] [CrossRef] [Green Version]
- Gettelman, A.; Hannay, C.; Bacmeister, J.T.; Neale, R.B.; Pendergrass, A.G.; Danabasoglu, G.; Lamarque, J.F.; Fasullo, J.T.; Bailey, D.A.; Lawrence, D.M.; et al. High Climate Sensitivity in the Community Earth System Model Version 2 (CESM2). Geophys. Res. Lett. 2019, 46, 8329–8337. [Google Scholar] [CrossRef]
- Danso, D.K.; Anquetin, S.; Diedhiou, A.; Lavaysse, C.; Hingray, B.; Raynaud, D.; Kobea, A.T. The EC-Earth3 Earth System Model for the Climate ModelIntercomparison Project 6. Geosci. Model Dev. Discuss. 2021, 1, 2021. [Google Scholar] [CrossRef]
- Dunne, J.P.; Horowitz, L.W.; Adcroft, A.J.; Ginoux, P.; Held, I.M.; John, J.G.; Krasting, J.P.; Malyshev, S.; Naik, V.; Paulot, F.; et al. The GFDL Earth System Model Version 4.1 (GFDL-ESM 4.1): Overall Coupled Model Description and Simulation Characteristics. J. Adv. Model. Earth Syst. 2020, 12, 2019MS002015. [Google Scholar] [CrossRef]
- Yukimoto, S.; Kawai, H.; Koshiro, T.; Oshima, N.; Yoshida, K.; Urakawa, S.; Tsujino, H.; Deushi, M.; Tanaka, T.; Hosaka, M.; et al. The Meteorological Research Institute Earth System Model Version 2.0, MRI-ESM2.0: Description and Basic Evaluation of the Physical Component. J. Meteorol. Soc. Japan. Ser. II 2019, 97, 931–965. [Google Scholar] [CrossRef] [Green Version]
- Hoesly, R.M.; Smith, S.J.; Feng, L.; Klimont, Z.; Janssens-Maenhout, G.; Pitkanen, T.; Seibert, J.J.; Vu, L.; Andres, R.J.; Bolt, R.M.; et al. Historical (1750–2014) anthropogenic emissions of reactive gases and aerosols from the Community Emissions Data System (CEDS). Geosci. Model Dev. 2018, 11, 369–408. [Google Scholar] [CrossRef] [Green Version]
- O’Neill, B.C.; Tebaldi, C.; Van Vuuren, D.P.; Eyring, V.; Friedlingstein, P.; Hurtt, G.; Knutti, R.; Kriegler, E.; Lamarque, J.F.; Lowe, J.; et al. The Scenario Model Intercomparison Project (ScenarioMIP) for CMIP6. Geosci. Model Dev. 2016, 9, 3461–3482. [Google Scholar] [CrossRef] [Green Version]
- Park, M.; Randel, W.J.; Emmons, L.K.; Bernath, P.F.; Walker, K.A.; Boone, C.D. Chemical isolation in the Asian monsoon anticyclone observed in Atmospheric Chemistry Experiment (ACE-FTS) data. Atmos. Chem. Phys. 2008, 8, 757–764. [Google Scholar] [CrossRef] [Green Version]
- Randel, W.J.; Jensen, E.J. Physical processes in the tropical tropopause layer and their roles in a changing climate. Nat. Geosci. 2013, 6, 169–176. [Google Scholar] [CrossRef]
- Park, M.; Randel, W.J.; Emmons, L.K.; Livesey, N.J. Transport pathways of carbon monoxide in the Asian summer monsoon diagnosed from Model of Ozone and Related Tracers (MOZART). J. Geophys. Res. Atmos. 2009, 114, D08303. [Google Scholar] [CrossRef] [Green Version]
- Gidden, M.J.; Riahi, K.; Smith, S.J.; Fujimori, S.; Luderer, G.; Kriegler, E.; Van Vuuren, D.P.; Van Den Berg, M.; Feng, L.; Klein, D.; et al. Global emissions pathways under different socioeconomic scenarios for use in CMIP6: A dataset of harmonized emissions trajectories through the end of the century. Geosci. Model Dev. 2019, 12, 1443–1475. [Google Scholar] [CrossRef]


| Model | Country | Organization | Resolution |
|---|---|---|---|
| BCC-ESM1 | China | BCC | |
| CESM2-WACCM | America | NCAR | |
| CESM2-WACCM-FV2 | America | NCAR | |
| EC-Earth3-AerChem | Europe | EC-Earth-Consortium | |
| GFDL-ESM4 | America | NOAA-GFDL | |
| MRI-ESM2-0 | Japan | MRI |
Disclaimer/Publisher’s Note: The statements, opinions and data contained in all publications are solely those of the individual author(s) and contributor(s) and not of MDPI and/or the editor(s). MDPI and/or the editor(s) disclaim responsibility for any injury to people or property resulting from any ideas, methods, instructions or products referred to in the content. |
© 2023 by the authors. Licensee MDPI, Basel, Switzerland. This article is an open access article distributed under the terms and conditions of the Creative Commons Attribution (CC BY) license (https://creativecommons.org/licenses/by/4.0/).
Share and Cite
Liang, Z.; Zhu, F.; Liang, T.; Luo, F.; Luo, J. Spatiotemporal Distribution of CO in the UTLS Region in the Asian Summer Monsoon Season: Analysis of MLS Observations and CMIP6 Simulations. Remote Sens. 2023, 15, 367. https://doi.org/10.3390/rs15020367
Liang Z, Zhu F, Liang T, Luo F, Luo J. Spatiotemporal Distribution of CO in the UTLS Region in the Asian Summer Monsoon Season: Analysis of MLS Observations and CMIP6 Simulations. Remote Sensing. 2023; 15(2):367. https://doi.org/10.3390/rs15020367
Chicago/Turabian StyleLiang, Ziling, Fangrui Zhu, Tian Liang, Fuhai Luo, and Jiali Luo. 2023. "Spatiotemporal Distribution of CO in the UTLS Region in the Asian Summer Monsoon Season: Analysis of MLS Observations and CMIP6 Simulations" Remote Sensing 15, no. 2: 367. https://doi.org/10.3390/rs15020367
APA StyleLiang, Z., Zhu, F., Liang, T., Luo, F., & Luo, J. (2023). Spatiotemporal Distribution of CO in the UTLS Region in the Asian Summer Monsoon Season: Analysis of MLS Observations and CMIP6 Simulations. Remote Sensing, 15(2), 367. https://doi.org/10.3390/rs15020367