

Deformation Detection of Mining Tunnel Based on Automatic Target Recognition
Beijing Advanced Innovation Center for Imaging Theory and Technology, Key Laboratory of 3D Information Acquisition and Application, MOE, College of Resource Environment and Tourism, Academy for Multidisciplinary Studies, Capital Normal University, Beijing 100048, China
*
Author to whom correspondence should be addressed.
Remote Sens. 2023, 15(2), 307; https://doi.org/10.3390/rs15020307
Submission received: 27 October 2022
/
Revised: 29 December 2022
/
Accepted: 3 January 2023
/
Published: 4 January 2023
(This article belongs to the Special Issue Remote Sensing for Structural Health Monitoring and Structural Analysis in Civil Engineering and Industrial Facilities Structures)
Abstract
:Mining tunnels have irregular and diverse cross-sectional shapes. Structural deformation detection using mobile laser measurement has some problems, such as the inconvenient positioning of the deformation, difficulties in unifying the multiphase data, and difficulties in solving the section parameters. To address these problems, this paper proposes a mining tunnel deformation detection method based on automatic target recognition. Firstly, a mobile tunnel laser detection scheme combined with the target layout is designed. Secondly, a preview image of the tunnel lining is generated using the mobile laser point cloud data, and the index relationship between the image and point cloud is established. The target recognition accuracy of the You Only Look Once version 4 (YOLOv4) model is optimized by integrating the prediction confidence threshold, target spatial position, and target gray scale rule. Based on target recognition and positioning, the chord length and vault net height of the mining tunnel are calculated using gross error elimination and curve fitting. Finally, the engineering application of the model and algorithm is realized using ML.NET. The research method was verified using the field measurement data of the mining tunnel. The target recognition accuracy reached 100%, and the repeated deviations of the chord length and net height of the arch crown were 1.7 mm and 1.4 mm, respectively, which established the effectiveness and high accuracy of the research method.
1. Introduction
In recent years, China’s urban rail transit system has developed rapidly. By June 2022, 51 cities in the mainland had 9573.65 km of urban rail transit lines. The length of the subway line is 7529.02 km, accounting for 78.64% of the total length [1]. Owing to the influence of the geological state, stress state, and groundwater change, deformations of different degrees will inevitably occur inside a tunnel. The stability of the surrounding rock is affected by ground vibrations and uncertainty of blasting construction, and tunnel collapse may occur in serious cases. Underground tunneling for urban subways is conducted through the interior of rock and soil masses. Excavation construction disturbs the underground rock and soil, and with the increasing number of excavation projects above or beside the tunnel along a subway, the internal stress balance of the tunnel will be affected, triggering tunnel deformation. Therefore, to ensure the safe operation of the subway and passenger safety, it is particularly important to inspect the tunnel structure regularly.
Currently, the main measurement methods for obtaining the tunnel structure information include total station doting, laser profiler scanning, station 3D laser scanning, and mobile 3D laser scanning. The common disadvantages of the total station measurement method are large personnel investment, limited data acquisition, and low operational efficiency [2,3,4,5]. The laser profiler can obtain the comprehensive information of a certain section, but because it is required to be perpendicular to the track centerline at all times, it is difficult to operate in practical applications, and the efficiency is relatively low [6,7,8]. The station 3D laser scanning technology can obtain high-density and high-precision point cloud information of a tunnel. However, during actual operation, it is necessary to change the stations for observation, which results in low operational efficiency. In addition, data processing requires multisite cloud data splicing followed by section extraction. Moreover, the postprocessing workload in this method is heavy [9,10,11,12,13,14].
The mobile tunnel laser detection system comprises a 3D laser scanner and other sensors. It can obtain high-precision and high-density tunnel laser point clouds in a short time and has gradually become a reliable method for rail transit tunnel deformation detection. Therefore, tunnel point cloud data-processing methods based on mobile laser scanning technology have been extensively researched [15,16,17,18,19,20]. Currently, representative mobile tunnel laser detection systems include the GRP IMS5000 mobile scanning system [21] developed by AMBERG in Switzerland, TS3 tunnel scanning system [22] developed by SPACETEC in Germany, SiTrack: One [23] developed by Leica, rMMS of Wuhan Hanning Rail Transit Technology Co., Ltd. [24], and Mobile tunnel laser detection system developed by Capital Normal University, China [25]. These systems can quickly acquire high-density point clouds of tunnels by integrating laser scanners, odometers, inertial measurement units (IMUs), and other sensors.
Presently, deformation detection methods for subway tunnels based on mobile laser scanning technology have been widely studied. Shield tunneling and mining tunneling are the main methods for subway tunnel construction. Because the section of a shield tunnel is similar to that of a standard circle, it is assembled using prefabricated segments with high regularity, which is convenient for segment identification, positioning, and parameter calculation. Therefore, the current research on tunnel structure deformation detection is mainly focused on shield tunnels. In the context of shield tunnel deformation detection, Du et al. [26,27] proposed a calculation method for the tunnel convergence diameter based on point cloud data. After preprocessing the point cloud data, which included noise removal and slicing, they performed ellipse fitting and then calculated the convergence diameter of the shield tunnel according to the long axis of the fitted ellipse. Subsequently, they calculated the dislocation of the shield tunnel based on the section point cloud. By selecting multiple noise removal sections on both sides of the circumferential seam and clustering the points at each angle, they calculated the circumferential dislocation. In addition, the longitudinal dislocation was calculated by fitting the segments in each ring. Yang and Xu [28] registered the multiphase point cloud data according to the existing control points and analyzed the structural deformation of the section by superimposing the section. Yue et al. [29] generated the tunnel orthophoto based on the point cloud strength information, identified the circumferential and longitudinal seams based on the image, and calculated the dislocations between and inside the rings using the section superposition method and local symmetrical foot method. Zhao et al. [30] used a point cloud to generate an image and manually mark the circumferential seams, and then used symmetrical section superposition to analyze the dislocation between the rings. Ji et al. [31] used the spatial distribution characteristics of bolt holes to locate the seams and divide the tunnels into rings and blocks, providing a good precondition for the deformation detection of shield tunnels. The mining method tunnel does not have the regular segment structure of the shield tunnel. Because of the irregular shapes and various section types of the mining method tunnel, the calculation of the section parameters is more complex. It is difficult to rely solely on the mileage positioning in the mobile tunnel laser detection system, and the poor mileage positioning accuracy makes it difficult to unify the multiphase data benchmark. Han et al. [32,33] realized mining tunnel positioning by using the linear recovery of relative point clouds based on the measured track centerline of the tunnel. In addition, they proposed a 3D point cloud generation method based on multi-sensor fusion, which uses a few targets to constrain inertial navigation and odometers, and fuses scanners to generate the 3D point cloud data. Both methods convert the relative measurement data into absolute measurement data. During the calculation process, it is necessary to measure the track centerline or control point coordinates, or add inertial navigation sensors, which increases the difficulty of fieldwork. The deformation analysis of a mining tunnel is still mainly based on the fixed-point detection of deformation using the traditional total station method. Yue et al. [34] proposed a mining tunnel deformation detection method in combination with mobile laser scanning data. The section was located using the gray image, and the chord length, vault net height, and catenary guide height of the section were calculated. However, this method requires manual point selection. Owing to large manual interference, the repeatability comparison error of multiphase data is large, which is not conducive to deformation positioning and multiphase detection.
To summarize, owing to its structural rules, the deformation detection of the shield tunnel has been extensively studied. The irregular section structure of the mine tunnel has caused several problems in the deformation detection process, such as inaccurate positioning of deformation points, difficulties in the unification of multiphase benchmarks, and difficulties in the calculation of section parameters. Therefore, there has been limited research on mining tunnels. In this paper, a deformation detection method based on automatic target recognition is proposed to solve the problems encountered in tunnel deformation detection by the mining method. Through automatic target recognition, the positioning and multiphase data datum are unified. Specifically, a preview image is first generated according to the tunnel point cloud obtained by the mobile tunnel laser detection system. Second, the You Only Look Once version 4 (YOLOv4) [35] target detection algorithm is used to automatically identify the tunnel section containing the target position, and the recognition accuracy is optimized by comprehensively considering the prediction confidence threshold, target spatial position, and target grayscale rule. Then, the chord length and vault net height are calculated by using the gross error elimination and curve-fitting methods. Finally, the applicability and accuracy of the method were verified using the measured data.
2. Methods
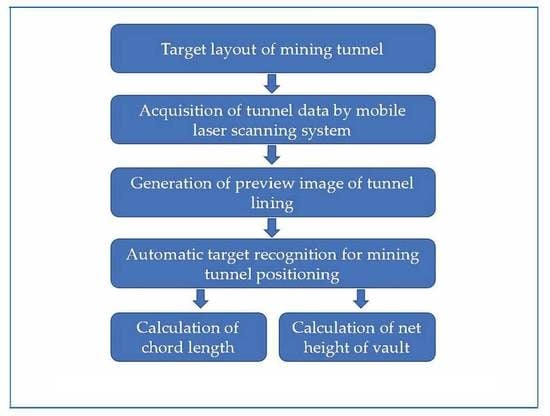
The deformation detection method for mining tunnels, proposed in this paper, is divided into four parts: data acquisition scheme design, target identification method, parameter calculation algorithm, and model encapsulation and application. In the data acquisition scheme, the laser-based deformation detection and data positioning for a mobile tunnel are realized by utilizing the target layout. During target recognition, the process of generating a preview image of the tunnel lining in the mining method and the process of automatically recognizing the target and improving the recognition accuracy based on a deep learning model are employed. In the parameter calculation part, the calculation methods for two section parameters—chord length and vault net height—are proposed. The discussion on model encapsulation and application explains the encapsulation and subsequent practical implementation of the model using ML.NET.
2.1. Data Acquisition Scheme Design
In this study, a mobile tunnel laser detection system was used to acquire and process the point cloud data for a mining tunnel. Simultaneously, a target layout scheme was designed to obtain a better solution to the problem of mining tunnel positioning.
2.1.1. Mobile Tunnel Laser Detection System
Owing to their advantages of high efficiency and high accuracy, mobile tunnel laser detection systems have gradually become the main tools for tunnel deformation detection. The main function of such systems is to assess the tunnel structure and detect diseases according to the tunnel point cloud data obtained by the laser scanner and tunnel-related data obtained by other sensors. The system consists of two parts: a hardware system and a software system. The hardware system is mainly composed of an electric detection trolley, laser scanner, odometer, inertial navigation system, and tablet computer. The system supports the Faro Focus3D series, Leica P series, SICK, Z + F 9012, and Z + F 5016 laser scanners. Based on a review of the technical specifications of various laser scanners, the Z + F 9012 laser scanner was selected as the main measurement sensor in this study; its technical parameters are summarized in Table 1. The Z + F 9012 scanner has three types of resolutions (low, high, and ultra-high) and three speeds (50 Hz, 100 Hz, and 200 Hz). The hardware system design is shown in Figure 1. The acquisition control software was deployed on a tablet computer and connected to the scanner through a local area network. The electric detection trolley was driven at a constant speed of 0.05–1.25 m/s, adjusted through five gears, and the constant speed error was less than 0.5%. To ensure the quality of the point cloud data of the mining method tunnel, this study recommends that the scanner use high-resolution, 200 Hz rotating speed. The trolley’s forward speed was 1 m/s for performing scanning and acquisition while moving along the track. The point spacing in the obtained data section was 3–5 mm, and the section spacing was up to 5 mm. The point density satisfies the requirements of tunnel deformation analysis and can generate high-quality tunnel lining images.
The software system is primarily used to process, analyze, and display the collected data, as shown in Figure 2. The tunnel laser scan dataset (TLSD) is the software part of the mobile tunnel laser detection system, which consists of six modules: project, field operation, point cloud processing, image annotation, result display, and multiphase comparison. The project module is used to fill in the basic parameters of the tunnel, including the scanning mode, operation sequence, and measurement object. The field operation module is used to control the starting and stopping of the scanner and other sensors. The point cloud processing module can calculate the laser point cloud data section and obtain the calculation results. The image annotation module can realize tunnel disease annotation and generate a tunnel roaming video. The result display module is mainly used to display the solution results to users. The multiphase comparison module performs a detailed comparison of the registered multiphase images to detect changes in the tunnel lining that are difficult to recognize by human eyes.
2.1.2. Target Layout Scheme
For the layout of the measurement points of the mining method tunnel, refer to the Technical Code for Monitoring Underground Works of Shenzhen Urban Rail Transit [36]. A section is selected every 5 to 30 m, and one to three measurement points are identified for each section to conduct the convergence measurement of the mining method tunnel. For better determination of the cross section, this study recommends the use of a 20 cm × 20 cm square metal plane target for positioning. As shown in Figure 3, a pair of targets was placed with an interval of 5 m at a relatively stable point at the tunnel arch bottom. When the measurement point on one tunnel wall is projected vertically through the axial plane of the tunnel (the plane that passes through the central axis of the tunnel and is parallel to the elevation direction and mileage direction) to the other side, the deviation between the two target centers on the left and right sides of the same section after projection is limited to within 5 cm in the elevation and mileage directions. The target position is taken as the benchmark for convergence measurement, and the total station is used to control the installation accuracy.
In this study, the horizontal deformation of the mining tunnel was determined by calculating the distance between the left and right targets, that is, the chord length, and the vertical deformation of the mining method tunnel was determined by calculating the distance from the track surface of the section, where the centerpoint of the target was located, to the vault, that is, the net height of the vault.
2.2. Target Identification
In this study, we used the point cloud strength information to generate a tunnel lining preview image and establish the relationship between the image pixels and point clouds. Then, we used the deep learning model to identify the target in the image and used the prior knowledge of the target to optimize the recognition results to improve the recognition accuracy.
2.2.1. Preview Image Generation
The coordinate information of the point cloud data obtained by the mobile tunnel laser detection system can be used to measure the relevant section size for deformation detection, and the strength information can be used to characterize the tunnel surface reflection characteristics and actively generate the images. By using the intensity information, preview images can be generated to facilitate rapid identification of the structural features and targets. The cross section of a shield tunnel is similar to that of a standard circle, and the radius and center coordinates of the circle can be obtained through circle fitting. Then, the two parameters can be used in combination with the cylindrical projection to generate images. However, the cross sections of mining tunnel are of diverse types, as shown in Figure 4. Therefore, the cylindrical projection method is not suitable for image generation. In this study, we established a point cloud index and pixel matrix, filled the intensity information into the pixel matrix, and then converted this information into gray information to generate the tunnel lining images. This method is applicable to mining tunnels of different section types.
- (1)
- Build the index and pixel matrix
To realize the interaction between the operator and point cloud through the preview image, it is important to establish the relationship between the pixel points and point cloud points. In this study, the point cloud intensity information was written into the pixel matrix sequentially. The scanner rotates clockwise to collect the two-dimensional section point cloud data and expands it into a three-dimensional point cloud based on the mileage. Therefore, in this study, a three-dimensional coordinate system of the tunnel was established, as shown in Figure 5. The forward direction was considered the positive direction of the y-axis; the z-axis was vertical to the track, with the upward direction as the positive direction; the x-axis was vertical to the plane comprising the y- and z-axis, and the positive direction was toward the right of the forward direction; the origin o was located at the center of the scanner. The sections perpendicular to the y-axis were sequentially numbered, column indexes were established, and the point cloud in the section was numbered clockwise from the intersection point P of the negative half-axis of the z-axis and the section to establish a row index.
The number of points in each section of the scanner remained essentially the same when the scanner speed was stable. Therefore, a pixel matrix of size n × m was established according to the number of points in each section (n) and the number of sections (m), and the intensity value of the points in the point cloud was placed at the specified position in the pixel matrix according to the column and row indexes. This process is illustrated in Figure 6.
- (2)
- Generate image
The intensity information indicates that the LiDAR transmits the laser beams with a certain transmission power. When the laser beams reach the object surface, they are reflected and scattered, and are received by the LiDAR receiver. After processing by the internal system of the LiDAR, the echo receiving power is obtained. The receiver converts the receiving power into voltage and digitizes a certain integer value of the output. The range of the point cloud intensity information obtained by different scanners is different. For example, the range of point cloud intensity obtained by the Z + F 9012/5016 and Faro S/X series laser scanners can be exported to various intensity ranges such as [0, 1] or [0, 65, 525]. The original intensity range in the point cloud data is not suitable for human eyes to interpret the scene in the tunnel, especially the target, whereas [0, 255] is the pixel value range of common images, which is more acceptable to human eyes. Therefore, the point cloud intensity information cannot be directly used as a pixel value. After being input into the pixel matrix, grayscale quantization is required. The grayscale value obtained after grayscale quantization is used as the pixel value to generate the final tunnel lining preview image, as shown in Figure 7. Grayscale quantization is used to map the intensity range of the original point cloud to [0, 255] in a linear manner. The grayscale quantization formula is expressed as follows:
where is the maximum laser intensity, is the minimum laser intensity, is the intensity of the current laser point, and is the gray level after conversion of the current laser point.
2.2.2. Target Automatic Recognition
The target detection method based on deep learning can independently learn the most appropriate feature extraction operator and has significantly higher accuracy and speed when compared with traditional methods. The target detection algorithm is divided into two-stage and single-stage detection. The single-stage target detection algorithm does not need to generate the region proposal, but directly calculates the image to generate the target category and position frame. Although the accuracy is lower than that of the two-stage target detection algorithm, it has the advantage of fast speed and is more suitable for engineering applications. In this study, from the perspective of practicality combined with accuracy and speed, a typical single-stage target detection algorithm YOLOv4 was selected to study the automatic target recognition method. In addition, the confidence threshold was considered and prior knowledge, such as the location of the target in the tunnel and characteristics of the target in the image, was fused to remove the false detection results to improve the accuracy of model recognition.
- (1)
- Dataset preparation and model training
In this study, the tunnel lining preview image was cut into sub-images with a growth width of 640 × 640, and the sub-images containing the target information were selected to build the original dataset. The training and validation sets were divided according to the ratio of 4:1. Subsequently, the dataset was expanded by contrast stretching, left and right flipping, and up and down flipping, as shown in Figure 8. Finally, 1539 training sets and 381 validation sets were obtained.
A GeForce RTX 3090 graphics processing unit with a memory size of 24 G was used to train and test the model. The loss function curve during the training process is shown in Figure 9. When the training reached 1400 rounds, the loss function tended to be stable, and the model converged.
- (2)
- Model evaluation
Multiple indicators are required to evaluate the merits of an algorithm. In this study, the following indicators were used to evaluate the merits of the model: the number of true positives (), that is, the number of results consistent with the actual prediction; the number of false positives (), that is, the number of samples with prediction results as positive but actual results are negative; and the number of false negatives (), defined as the number of samples with prediction results as negative but actual results are positive. In the below expressions, represents the precision, which is the proportion of correct detection quantity in all detection results; and represents the recall, which is the ratio of the number of true positives to the sum of true positives and false negatives. The range of is [0,1]; the closer the value of is to 1, the better the model verification result, that is, the more accurate and comprehensive the detection target:
Before training the deep learning model, it is necessary to set a set of optimal super parameters to improve the performance and effect of the model. The main super parameters in YOLOv4 include the batch size, number of iterations, learning rate parameters (initial learning rate, learning rate adjustment strategy), momentum, and weight decay regularization coefficient. The batch size determines the amount of data input to the model in each iteration of the training process. If it is too small, the gradient calculated each time would be unstable, resulting in a large training shock. Eventually, the model will become difficult to converge, resulting in under fitting. If it is too large, each parameter update is for the same sample, resulting in over fitting, which reduces the model generalization ability. In YOLOv4, the batch and subdivisions determine the batch size. Because there are only 1539 training sets, the batch size is set to 64 and the subdivisions to 16. Each time, four pictures are input to the network for training, that is, the batch size is 4. The number of iterations is determined by the number of sample types, which is generally 2000 times the number of sample types. There was only one sample in this dataset; hence, the total number of iterations was set to 2000. The learning rate directly controls the magnitude of the network gradient update in training. One or a group of excellent learning rates can not only accelerate the training of the model but also obtain better or even optimal accuracy. A too large or too small learning rate will directly affect the convergence of the model. In this study, the initial learning rate was 0.001, the learning rate adjustment strategy was the stepped mode, and the learning rate was changed to one-tenth of the original when the number of iterations was 1600 and 1800. Momentum can retain the influence of the historical gradient on the existing gradient, reduce the gradient oscillation, and accelerate the model training. In this study, the momentum was set to 0.95. The weight attenuation regularization coefficient can effectively prevent overfitting; it was set to 0.0005 in this study. The trained weight file was used to test the validation set, and the test results are shown in Table 2.
There were 507 positive samples in this validation set; 552 positive samples were detected by the model, of which 507 positive samples were correctly detected and there were 45 detection errors. The accuracy rate of the model can reach 0.92, recall rate can reach 1, and can reach 0.96. The test results show that the trained model performs well, but due to the existence of false detection, it cannot be directly applied to engineering applications; therefore, further optimization of the model is needed.
- (3)
- Optimization of identification accuracy
The results of model training and testing revealed many false positives due to interference from the metal supports of fixed cables in the tunnel, image clipping, and other reasons. Figure 10a shows the false positives caused by the metal supports of the fixed cables in the tunnel, and Figure 10b shows the false positives caused by image clipping. Because the confidence level of false positives is usually lower than that of true positives, and certain rules need to be followed for the spatial position and image gray level of the target, this study considered the following three aspects to reduce the number of false positives: prediction confidence threshold, spatial position of the target, and target gray level rule (black and white).
- Confidence
Confidence represents the probability that the current bounding box contains an object, indicating whether the current bounding box is a background or a target. Because the confidence of some false positives is lower than that of the true positives, setting the confidence threshold to eliminate the low-confidence bounding box can avoid many false positives.
- b.
- Target space position
In the process of clipping the preview image, it is possible to split the target into two sub-images, which results in unnecessary false positives, as shown in Figure 10b. Considering that the positions of the two bounding boxes are very close or intersect each other, the positions of the upper-right-corner pixel of the first bounding box and upper-left-corner pixel of the second bounding box are used to set an appropriate threshold. If the position spacing is less than the threshold, the two bounding boxes are merged to reduce the number of false positives.
In actual measurements, the targets are generally installed at the left and right arch bottoms of the tunnel, at a fixed distance from the track surface. Only the sub-images at this location are used for prediction, thus effectively reducing the number of false positives caused by the metal supports of the fixed cables. In the mileage direction, the targets are separated by a certain distance, and the distance between two successive bounding boxes will be traversed sequentially. If it is less than a certain distance, it will be considered as a false detection for removal, thus effectively reducing the false positives caused by other inner-wall accessories of the tunnel.
- c.
- Target gray scale rule
The square target was divided into four areas and distinguished by different colors, as shown in Figure 11a. The pixel values of the target in the image are different and show certain rules, as depicted in Figure 11b. Taking the center of the bounding box as the reference, eight rows of pixels were taken from top to bottom, and eight columns of pixels from left to right; the average pixel value of the entire area and the average pixel values , , , of the four sub-areas were calculated. If the rules , , , and were satisfied, the result was determined to be correct. Otherwise, it was determined as a false positive and was removed.
2.3. Parameter Calculation
The section deformation of the mining tunnel can be measured using the chord length and net height of the arch crown. After automatic target recognition, the row and column numbers of the upper-left-corner pixel of the target in the image and the number of pixels occupied by the width and height are obtained. Thus, the row and column numbers of the target center pixel can be obtained, and the position of the target centerpoint in the point cloud can be found using the index between the point cloud and the image. The point cloud of the mining tunnel section was determined according to the target centerpoint, and the chord length and net height of the arch crown were calculated.
2.3.1. Chord Length Calculation
Chord length refers to the distance between the left and right tunnel walls of a specified height in the same section of the mining tunnel; it is used to reflect the horizontal deformation of the mining tunnel. Because the centerpoints of the same pair of targets on the left and right tunnel walls differ by a certain number of sections, we calculated the chord length of all sections between the centerpoints of the two targets and used the average as the final chord length. During the scanning of the mobile tunnel laser detection system, noise may be generated due to the influence of the operating environment and the accuracy of the scanner itself. To improve the accuracy, the gross errors were eliminated by comparing the deviation between the chord length and its average value with the standard deviation.
Because the centerpoint pixels of the same pair of targets were not in the same section, we used the column number of the centerpoint pixel of the right-side target to locate the starting section, the row number to locate the right-side height, the column number of the central point pixel of the left-side target to locate the ending section, and the row number to locate the left-side height. As shown in Figure 12, the scanner coordinate system was adopted, with the center of the scanner lens as the origin o; the z-axis was perpendicular to the orbital plane, with the upward direction as positive; the x-axis was perpendicular to the z-axis and pointed to the right; and the chord length on the same section was the distance from the specified point coordinates on the right to the specified point coordinates on the left . The calculation formula is as follows:
The average chord length of n sections in the target center is
The standard deviation is
When , the chord length is the gross error, which is eliminated, and the average value of the reserved chord length is taken as the final chord length.
2.3.2. Calculation of Vault Net Height of Arch Crown
The vault net height of the arch crown is the distance from the track surface to the arch crown (Figure 13), which is used to judge the deformation of the mining method tunnel in the vertical direction. Owing to a variety of cross-section types of mining tunnels, the vault is not the highest point of the cross section but the intersection of the cross section and the straight line passing through the centerpoint of the track surface in the perpendicular direction. The point cloud of the section where the target center was located was selected to calculate the net height of the vault. The track surface refers to the line connecting the left and right rail ends in the same section. Because the scanner in the mobile tunnel laser detection system has a fixed installation mode, the track surface elevation is determined by the distance from the scanner lens center to the track surface.
Because of the occlusion of the catenary, a part of the point cloud of the vault was missing, and it was impossible to locate the vault directly by searching for the maximum elevation point. For better determination of the vault height in the scanner coordinate system, we selected the point cloud within a certain radius near the intersection between the tunnel section point cloud and the positive half-axis of the z-axis to use polynomial fitting curves. Finally, the distance from the centerpoint of the track plane to the intersection between the z-axis and fitted curve was used as the vault clearance height. To ensure accuracy and prevent overfitting, the fitting degree n was set to 10. The formula for the polynomial fitting curve is as follows:
2.4. Model Encapsulation and Application
In practical engineering applications, many projects adopt .NET development and deployment, but .NET cannot be used to directly integrate the current mainstream deep learning model frameworks, which makes it inconvenient to apply many deep learning models in engineering. In this study, the trained YOLOv4 model was converted into an open neural network exchange (ONNX) format. ONNX is a standard used to represent the deep learning model, which can transfer the model between different frameworks and then load the ONNX format files on the .NET platform for target detection to achieve effective engineering applications of the deep learning model in the .NET environment, as shown in Figure 14.
The methods investigated in this study were integrated into TLSD, as shown in Figure 15. In the point cloud processing module, the targets can be identified in the current preview image or in all preview images. After target recognition, the specified survey line was calculated. After the calculation, the chord length and vault clearance height of the mining tunnel were obtained. The overall operational process is simple and convenient and improves the efficiency of data processing.
3. Results
To verify the effectiveness of this method and its applicability to different section shapes, a mining tunnel section of the Chongqing Metro was selected for analysis. The starting mileage of the specific survey area was K00+018, approximately 2000 m long, and the lining was made of precast concrete. This section comprised a horseshoe-shaped tunnel, straight-wall circular arch tunnel, and a similar rectangular tunnel. Thus, diverse tunnel types are used here. Thirty-eight square targets were pasted on the tunnel wall at intervals of 50 m along the mileage direction. Each pair of targets was arranged at a relatively stable point at the bottom of the tunnel arch. The elevation deviation of the target center and section center deviation should be within 5 cm. This is shown in Figure 16a. The mobile tunnel laser detection system developed by Capital Normal University was used to collect the point cloud data of the mining method tunnel. The scanner had a high resolution, the rotating speed was 200 Hz, and moving speed of the trolley was 1 m/s; measurements were conducted back and forth along the track for mobile scanning collection. The field operation is shown in Figure 16b, and the partial laser point cloud data of the mining method tunnel are shown in Figure 16c.
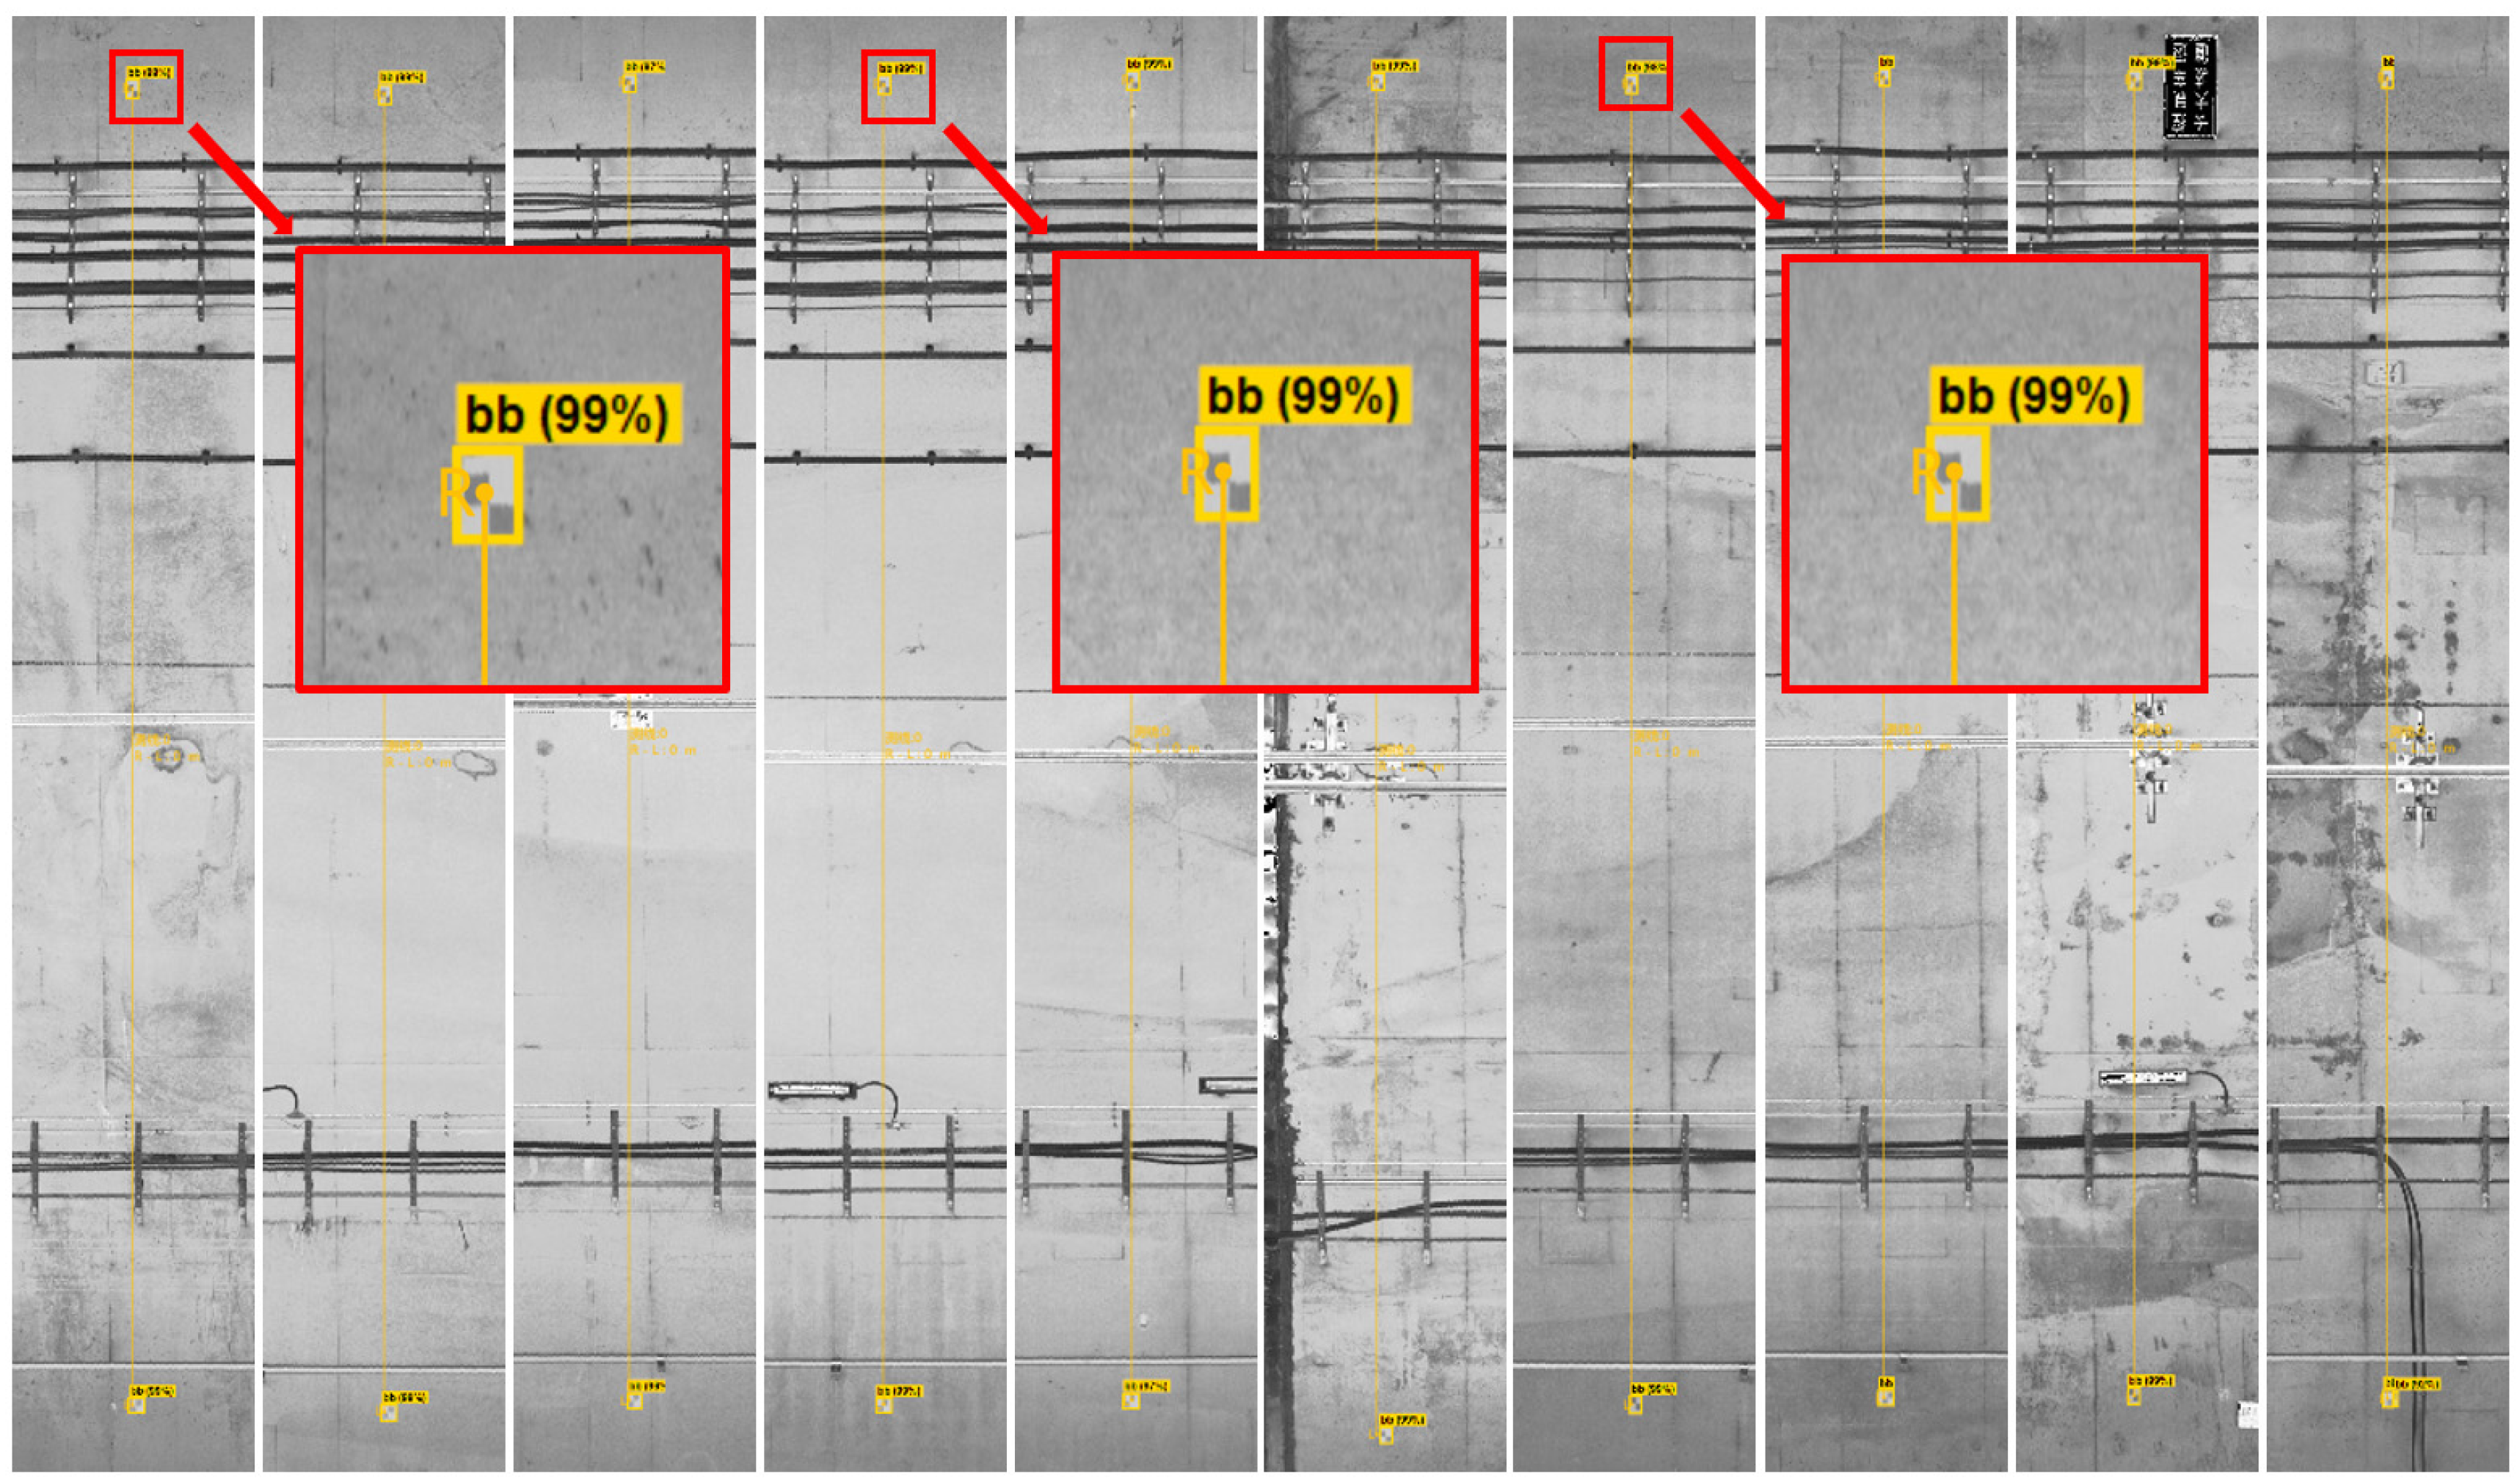
The target was automatically identified using the method described in this study. The results showed that the number of true positives was 76, and the number of false positives (FP) and number of false negatives were 0. The recognition results are shown in Figure 17.
3.1. Comparison of Chord Length Accuracy of Roundtrip Measurement
In this study, the precision of the chord length calculated by the proposed method was verified using the data of the Chongqing mining tunnel. We calculated and compared the chord lengths at the locations of each pair of targets in the roundtrip survey. The results are presented in Table 3. The absolute deviation of the roundtrip survey was between 0 and 4 mm, and the maximum deviation was 3.7 mm, accounting for 10.5% of the total deviation. The average difference between the horseshoe-shaped tunnel sections was 1.0 mm; the average difference between the rectangular A tunnel sections was 2.0 mm, whereas that between the rectangular B tunnel sections was 2.4 mm; the average difference between the straight-wall circular arch tunnel sections was 1.3 mm; and the overall average deviation was 1.7 mm.
3.2. Comparison of Vault Net Height Accuracy of Roundtrip Measurement
The precision of the vault net height calculated by the proposed method was verified using the data from the Chongqing mining method subway tunnel. We calculated and compared the net heights of the arch crowns of the sections determined by the centerpoint of the target on the right side of each pair of targets in the roundtrip survey. The results are presented in Table 4. The absolute deviation in the roundtrip survey was between 0 mm and 4 mm, with a maximum deviation of 3.5 mm. Cases exceeding 3 mm accounted for 5.3% of the total number of cases. The average difference between the horseshoe-shaped tunnel sections was 0.9 mm, the average difference between the rectangular A tunnel sections was 2.5 mm, the average difference between the rectangular B tunnel sections was 1.4 mm, and the average difference between the straight-wall circular arch tunnel sections was 1 mm. The overall average deviation was 1.4 mm.
4. Discussion
The analysis of the experimental results of the Chongqing mining method subway tunnel section proves the high accuracy of the method proposed in this paper in terms of automatic target recognition, chord length calculation, and vault net height calculation. The accuracy comparison of roundtrip measurement verified the high accuracy of the mining tunnel positioning method based on target automatic recognition.
Regarding mine tunnel positioning, a previous study [32] proposed the use of measured track centerline coordinates of the tunnel and tunnel design data to correct the relative point cloud, restore the true state of the tunnel, and realize mine tunnel positioning. The positioning accuracy of this method was 5.51 cm in the horizontal direction and 2.74 cm in the vertical direction. Another study [33] proposed a 3D point cloud generation method based on multi-sensor fusion. The positioning accuracy of this method was 4.0 cm in the horizontal direction and 3.7 cm in the vertical direction. The positioning accuracies in the above two methods were at the centimeter-level and the positioning error was large, which was not conducive to the alignment of two-phase data. Moreover, the acquisition of design data, measurement of track centerline coordinates, and fusion of multi-sensors enhance the difficulty in conducting field operations and increase the cost investment. In [34], mine tunnel positioning was performed by manually selecting points on the gray scale image, which increased the complexity and reduced the efficiency of the offsite work. In addition, this method is prone to large manual interference, which is likely to cause large repeatability contrast error in the multiphase data, especially when dealing with long tunnels. The positioning method of automatically identifying the targets in tunnels, proposed in this paper, does not require measuring the coordinates of the control points of the track centerline in the field, obtaining the tunnel design data, or adding inertial navigation sensors. By improving the fieldwork efficiency, it reduces the cost investment. In addition, the computer automatically identifies the target, thus reducing the manual interference and improving the positioning accuracy and efficiency of office data processing.
Regarding deformation detection of the mining method tunnel, in the previous study [34], the chord length and net height of the arch crown were calculated, and the results were verified for a 200 m-long tunnel. The average deviation between the chord length and net height of the arch crown in the roundtrip measurement was 1.3 mm. In this study, a calculation method for the chord length and net height of the arch crown was developed, and the accuracy of the method was verified by comparing the results against the actual measurements of a 2000 m-long tunnel. The average roundtrip deviation of the chord length was 1.7 mm and that of the net height of the arch crown was 1.4 mm, which are equivalent to the calculation accuracies in [34]. However, only a 200 m-long tunnel was used for verification in [34]. Such a small sample size cannot exclude the influence of contingency; hence, the solution accuracy was high. In addition, the point with the largest Z-value was used as the vault in [34]. This method neither can exclude the influence of noise points nor is it applicable to various types of cross sections of mining method tunnels, such as similar rectangular tunnels. The curve-fitting method developed in this study could fit the vault, which was considered as the intersection of the Z-axis and the curve. The proposed method is not only applicable to a variety of section types of mining method tunnels but also eliminates the influence of noise points.
At this stage, the method proposed in this paper was successfully applied to engineering applications, thus realizing the application of a deep learning model at the engineering level. Overall, the method proposed in this paper improved the efficiency and accuracy of deformation detection of mining method tunnels. However, the proposed method has scope for further improvement. In the future, based on the automatic identification and positioning of the target, the chord length, catenary guide height, catenary pull-out value, gauge, and other parameters of different heights and angles in the section can be calculated to achieve the deformation detection of mining method tunnels in a comprehensive and multi-level manner.
5. Conclusions
The previous deformation detection method for mining tunnels was very simple; moreover, it consumed considerable manpower and material resources, and had very low detection efficiency. Mobile laser scanning technology has gradually become the main method for tunnel deformation detection, owing to its advantages of high efficiency and high accuracy. In this paper, a mining method deformation detection scheme was designed to alleviate the problems of inaccurate positioning of deformation points of mining method tunnels, difficulties in unifying multiphase datum, and difficulties in solving section parameters. Through target layout design and automatic identification, mining method tunnel positioning and multiphase data datum unification were realized, and deformation detection was achieved by comparing the changes in the parameters of the same section in the multiphase data. In addition, a method based on automatic target recognition for deformation detection of a mining tunnel was proposed. First, the intensity information of the laser point cloud was used to generate a gray image and establish an index between the image pixels and laser points. The target was automatically recognized using a deep learning algorithm. Test results showed the accuracy of the model as 0.92. The model recognition effect was optimized by considering three aspects: prediction confidence threshold, target spatial location, and target grayscale rule. ML.NET was used to realize the engineering application of the model. The proposed approach had the advantages of reducing the number of false detections and achieving higher accuracy. It could automatically identify 38 pairs of targets in the survey area. The results showed TP of 76, FP of 0, and FN of 0. Secondly, based on the cross section located at the target centerpoint, the chord length and net height of the arch crown of the mining method tunnel were calculated using gross error elimination and curve fitting, and deformation detection of the tunnel was realized in the horizontal and vertical directions. A mining method tunnel with a length of approximately 2000 m was tested. The tunnel sections contained various types of cross sections. The average deviation of the roundtrip chord length was 1.7 mm, and the average deviation of the net height of the arch crown was 1.4 mm. The validity of the scheme and proposed method as well as the applicability to mining tunnel sections of different section types was verified. The method proposed in this study improves the efficiency of data processing and ensures high accuracy, which can meet the engineering requirements of deformation detection of mining method tunnels and facilitate the long-term detection of their structural deformations.
Author Contributions
Conceptualization, C.J. and H.S.; methodology, C.J.; software, C.J.; validation, C.J. and M.S.; formal analysis, C.J. and H.S.; investigation, C.J., J.L. and M.S.; resources, C.J. and H.S.; data curation, C.J., Y.L. and M.S.; writing—original draft preparation, C.J.; writing—review and editing, C.J. and H.S.; visualization, J.L. and Y.L.; supervision, H.S. and R.Z.; project administration, H.S.; funding acquisition, H.S. and R.Z. All authors have read and agreed to the published version of the manuscript.
Funding
This work was supported by the National Natural Science Foundation of China under Grant 42101444, 42071444 and U22A20568, and part of it was supported by the General scientific research projects of Beijing Municipal Commission of Education under Grant KM202010028012, the Open fund of State Key Laboratory of Rail Transit Engineering Informatization (SKLK22-09), and the National Key Technologies Research and Development Program of China under Grant 2022YFB3904101.
Conflicts of Interest
The authors declare no conflict of interest.
References
- Data statistics and analysis of urban rail transit in the first half of 2022. Mod. Urban Transit. 2022, 7, 116.
- Liao, H.S.; Li, Y.Z. Application of Automatic Deformation Monitoring Systemon Operational Metro Tunnel Monitoring. Geomat. Spat. Inf. Technol. 2021, 44, 193–195+198. [Google Scholar]
- Yang, S.Q. Research on rapid measurement method of long distance subway tunnel boundary. Geotech. Investig. Surv. 2022, 50, 57–61. [Google Scholar]
- Xu, Z.W.; Yao, L.B.; Sun, L.Y. Reliability and Accuracy Test Report on Trimble S8 Total Station′s Tunnel Profile Scan. Urban Geotech. Investig. Surv. 2008, 4, 118–122. [Google Scholar]
- Kontogianni, V.; Tzortzis, A.; Stiros, S. Deformation and failure of the Tymfristos tunnel, Greece. J. Geotech. Geoenviron. Eng. 2004, 130, 1004–1013. [Google Scholar] [CrossRef]
- Zhang, M.; Zhang, X. The Application of Laser Profiler in the Detection of Tunnel Section. Transp. Sci. Technol. 2014, 5, 94–96. [Google Scholar]
- Wu, H.; Jia, B.; Wang, Y. Application of laser cross-section instrument in modern tunnel works. Shanxi Archit. 2007, 31, 331–332. [Google Scholar]
- Pen, F. The application of the laser profiler on the first lining quality inspection of channel. Shanxi Archit. 2010, 36, 333–334. [Google Scholar]
- Cao, X.G.; Yang, J.L.; Liu, Y.; Hai-Yan, S.I.; Meng, X.L.; Zhang, W.C. Subway Tunnel Profile Measurement Based on Ground 3D Laser Scanning Data. Geomat. Spat. Inform. Technol. 2015, 38, 4–6. [Google Scholar]
- Tuo, L.; Kang, Z.Z.; Xie, Y.C.; Wang, B.Q. Continuously vertical section abstraction for deformation monitoring of subway tunnel based on terrestrial point clouds. Geomat. Inf. Sci. Wuhan Univ. 2013, 38, 171–175+185. [Google Scholar]
- Han, J.-Y.; Guo, J.; Jiang, Y.-S. Monitoring tunnel profile by means of multi-epoch dispersed 3-D LiDAR point clouds. Tunnell. Undergr. Space Technol. 2013, 33, 186–192. [Google Scholar] [CrossRef]
- Novaković, G.; Lazar, A.; Kovačič, S.; Vulić, M. The usability of terrestrial 3D laser scanning technology for tunnel clearance analysis application. Appl. Mech. Mater. 2014, 683, 219–224. [Google Scholar] [CrossRef]
- Cheng, Y.-J.; Qiu, W.; Lei, J. Automatic extraction of tunnel lining cross-sections from terrestrial laser scanning point clouds. Sensors 2016, 16, 1648. [Google Scholar] [CrossRef] [PubMed]
- Mukupa, W.; Roberts, G.W.; Hancock, C.M.; Al-Manasir, K. A review of the use of terrestrial laser scanning application for change detection and deformation monitoring of structures. Surv. Rev. 2017, 49, 99–116. [Google Scholar] [CrossRef]
- Han, S.; Cho, H.; Kim, S.; Jung, J.; Heo, J. Automated and efficient method for extraction of tunnel cross sections using terrestrial laser scanned data. J. Comput. Civil Eng. 2013, 27, 274–281. [Google Scholar] [CrossRef]
- Montero, R.; Victores, J.G.; Martínez, S.; Jardón, A.; Balaguer, C. Past, present and future of Robotic Tunnel Inspection. Automat. Constr. 2015, 59, 99–112. [Google Scholar] [CrossRef]
- Cui, H.; Ren, X.; Mao, Q.; Hu, Q.; Wang, W. Shield subway tunnel deformation detection based on mobile laser scanning. Automat. Constr. 2019, 106, 102889. [Google Scholar] [CrossRef]
- Cao, Z.; Chen, D.; Shi, Y.; Zhang, Z.; Jin, F.; Yun, T.; Xu, S.; Kang, Z.; Zhang, L. A flexible architecture for extracting Metro Tunnel Cross sections from Terrestrial Laser Scanning Point Clouds. Remote Sens. 2019, 11, 297. [Google Scholar] [CrossRef] [Green Version]
- Sun, H.; Liu, S.; Zhong, R.; Du, L. Cross-section deformation analysis and visualization of shield tunnel based on Mobile Tunnel Monitoring System. Sensors 2020, 20, 1006. [Google Scholar] [CrossRef]
- Sun, H.; Xu, Z.; Yao, L.; Zhong, R.; Du, L.; Wu, H. Tunnel monitoring and measuring system using mobile laser scanning: Design and deployment. Remote Sens. 2020, 12, 730. [Google Scholar] [CrossRef] [Green Version]
- GRP IMS5000 Tunnel Scanning System. 2022. Available online: http://www.brailtec.com/index/products.html?id=%2027 (accessed on 7 July 2022).
- TS3 Three Channels Scanner. 2022. Available online: https://www.spacetec.de/en/products/ts3/ (accessed on 7 July 2022).
- SiTrack One Mobile Track Scanning System. 2022. Available online: http://leica-gd.com/Products/Show_49.html (accessed on 7 July 2022).
- Track Moving 3D Laser Measurement System (rMMS). 2022. Available online: http://www.hirail.cn/product_detail/id/7.html (accessed on 7 July 2022).
- Liu, S.; Sun, H.; Zhang, Z.; Li, Y.; Zhong, R.; Li, J.; Chen, S. A multiscale deep feature for the instance segmentation of water leakages in tunnel using MLS point cloud intensity images. IEEE T. Geosci. Remote. 2022, 60, 1–16. [Google Scholar] [CrossRef]
- Du, L.M.; Zhong, R.F.; Sun, H.L.; Zhu, Q.; Zhang, Z. Tunnel cross section extraction and deformation analysis based on mobile laser scanning technology. Bull. Surv. Mapp. Suppl. 2018, 6, 61–67. [Google Scholar]
- Du, L.; Zhong, R.; Sun, H.; Pang, Y.; Mo, Y. Dislocation Detection of Shield Tunnel Based on Dense Cross-Sectional Point Clouds. IEEE Trans. Intell. Transp. Syst. 2022, 23, 22227–22243. [Google Scholar] [CrossRef]
- Yang, H.; Xu, X. Structure monitoring and deformation analysis of tunnel structure. Compos. Struct. 2021, 276, 114565. [Google Scholar] [CrossRef]
- Yue, Z.; Sun, H.; Zhong, R.; Du, L. Method for tunnel displacements calculation based on Mobile Tunnel Monitoring System. Sensors 2021, 21, 4407. [Google Scholar] [CrossRef]
- Zhao, N.N.; Wu, W.; Wang, Y. Research on application of structural deformation monitoring of metro tunnel based on 3D laser scanning technology. China Mini. Mag. 2020, 29, 176–180. [Google Scholar]
- Ji, C.Q.; Sun, H.L.; Zhong, R.F.; Li, J.C.; Han, Y.L. Precise Positioning Method of Moving Laser Point Cloud in Shield Tunnel based on Bolt Hole Extraction. Remote Sens. 2022, 14, 4719. [Google Scholar] [CrossRef]
- Han, Y.; Sun, H.; Zhong, R. Three-dimensional linear restoration of a tunnel based on measured track and uncontrolled mobile laser scanning. Sensors 2021, 21, 3815. [Google Scholar] [CrossRef]
- Han, Y.; Sun, H.; Lu, Y.; Zhong, R.; Ji, C.; Xie, S. 3D Point Cloud Generation Based on Multi-Sensor Fusion. Appl. Sci. 2022, 12, 9433. [Google Scholar] [CrossRef]
- Yue, Z.; Sun, H.; Zhong, R.; Ma, H.; Xu, Z.; Elliott, F. Measurement of tunnel clearance convergence using mobile laser detection technology. Can. J. Remote Sens. 2021, 47, 100–118. [Google Scholar] [CrossRef]
- Alexey, B.; Wang, C.Y.; Mark Liao, H.Y. Optimal speed and accuracy of object detection. arXiv 2020, arXiv:2004.10934. [Google Scholar]
- Liu, J.G. Technical Code for Monitoring Underground Works of Shenzhen Urban Rail Transit; Shenzhen Metro Group Co., Ltd.: Shenzhen, China, 2010. [Google Scholar]
Figure 1.
Hardware system.

Figure 2.
Software system.
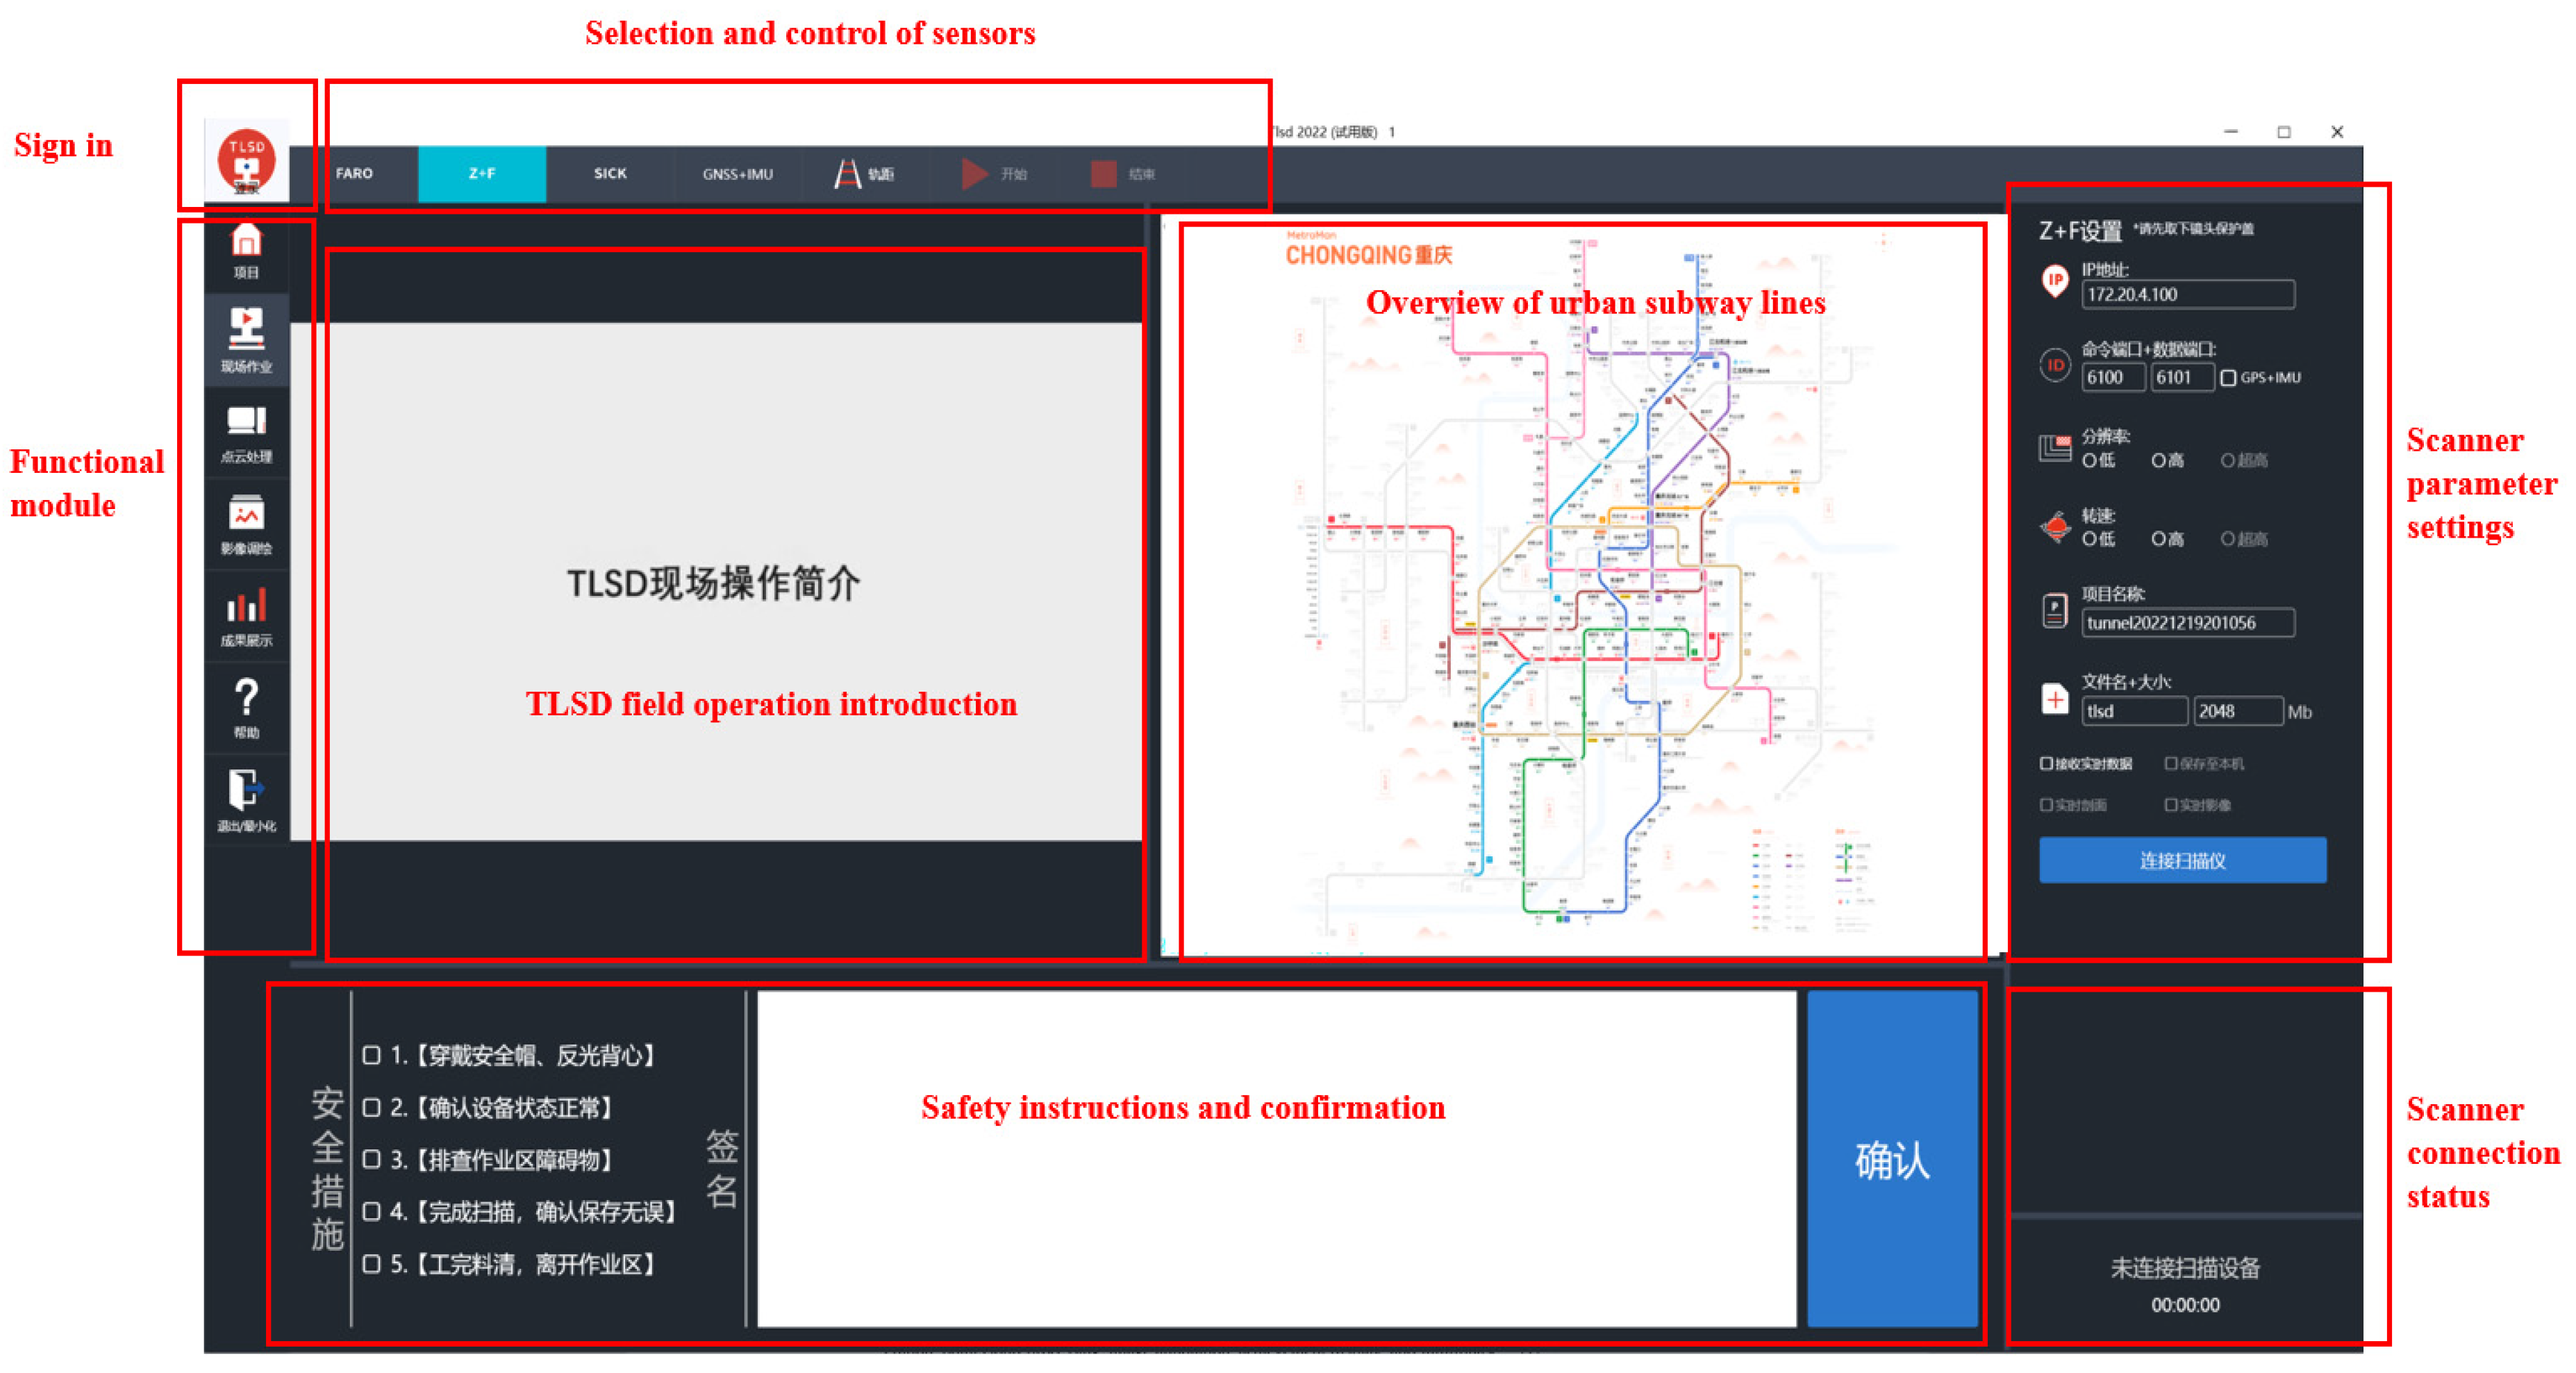
Figure 3.
Target layout.
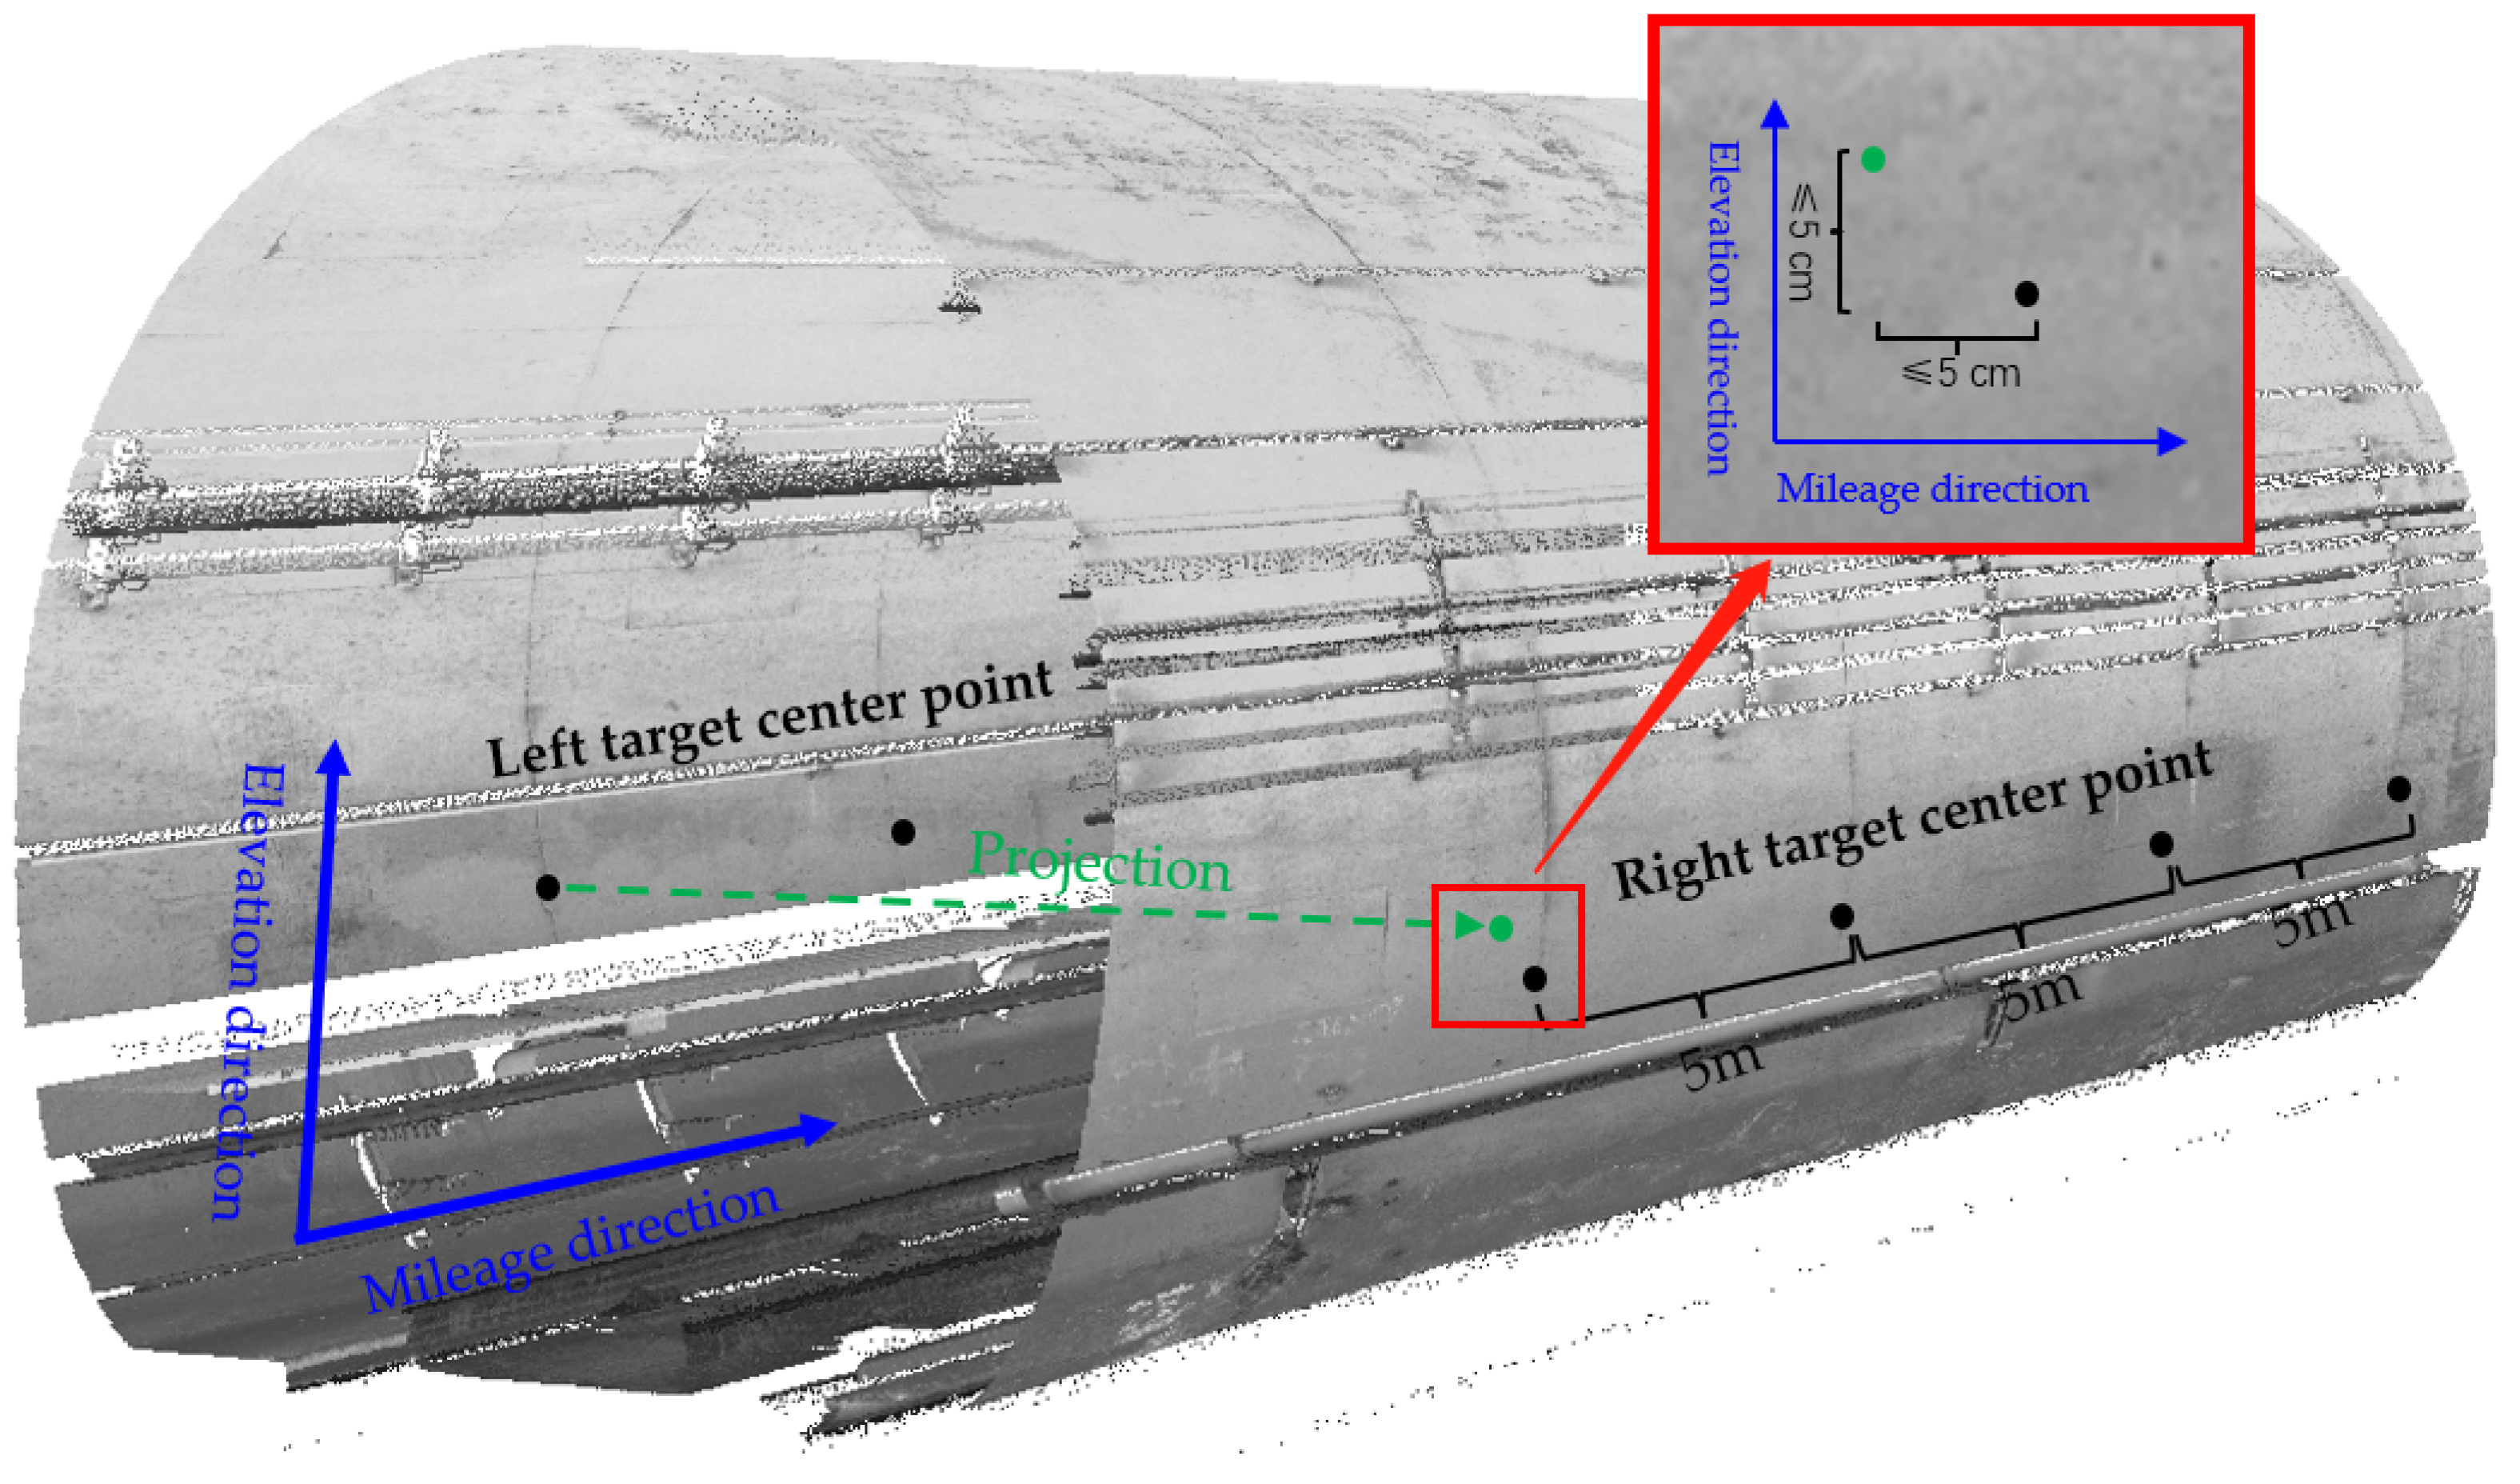
Figure 4.
Different section types of mining tunnel: (a) horseshoe tunnel; (b) straight-wall circular arch tunnel; (c) similar rectangular tunnel A; (d) similar rectangular tunnel B.
Figure 4.
Different section types of mining tunnel: (a) horseshoe tunnel; (b) straight-wall circular arch tunnel; (c) similar rectangular tunnel A; (d) similar rectangular tunnel B.
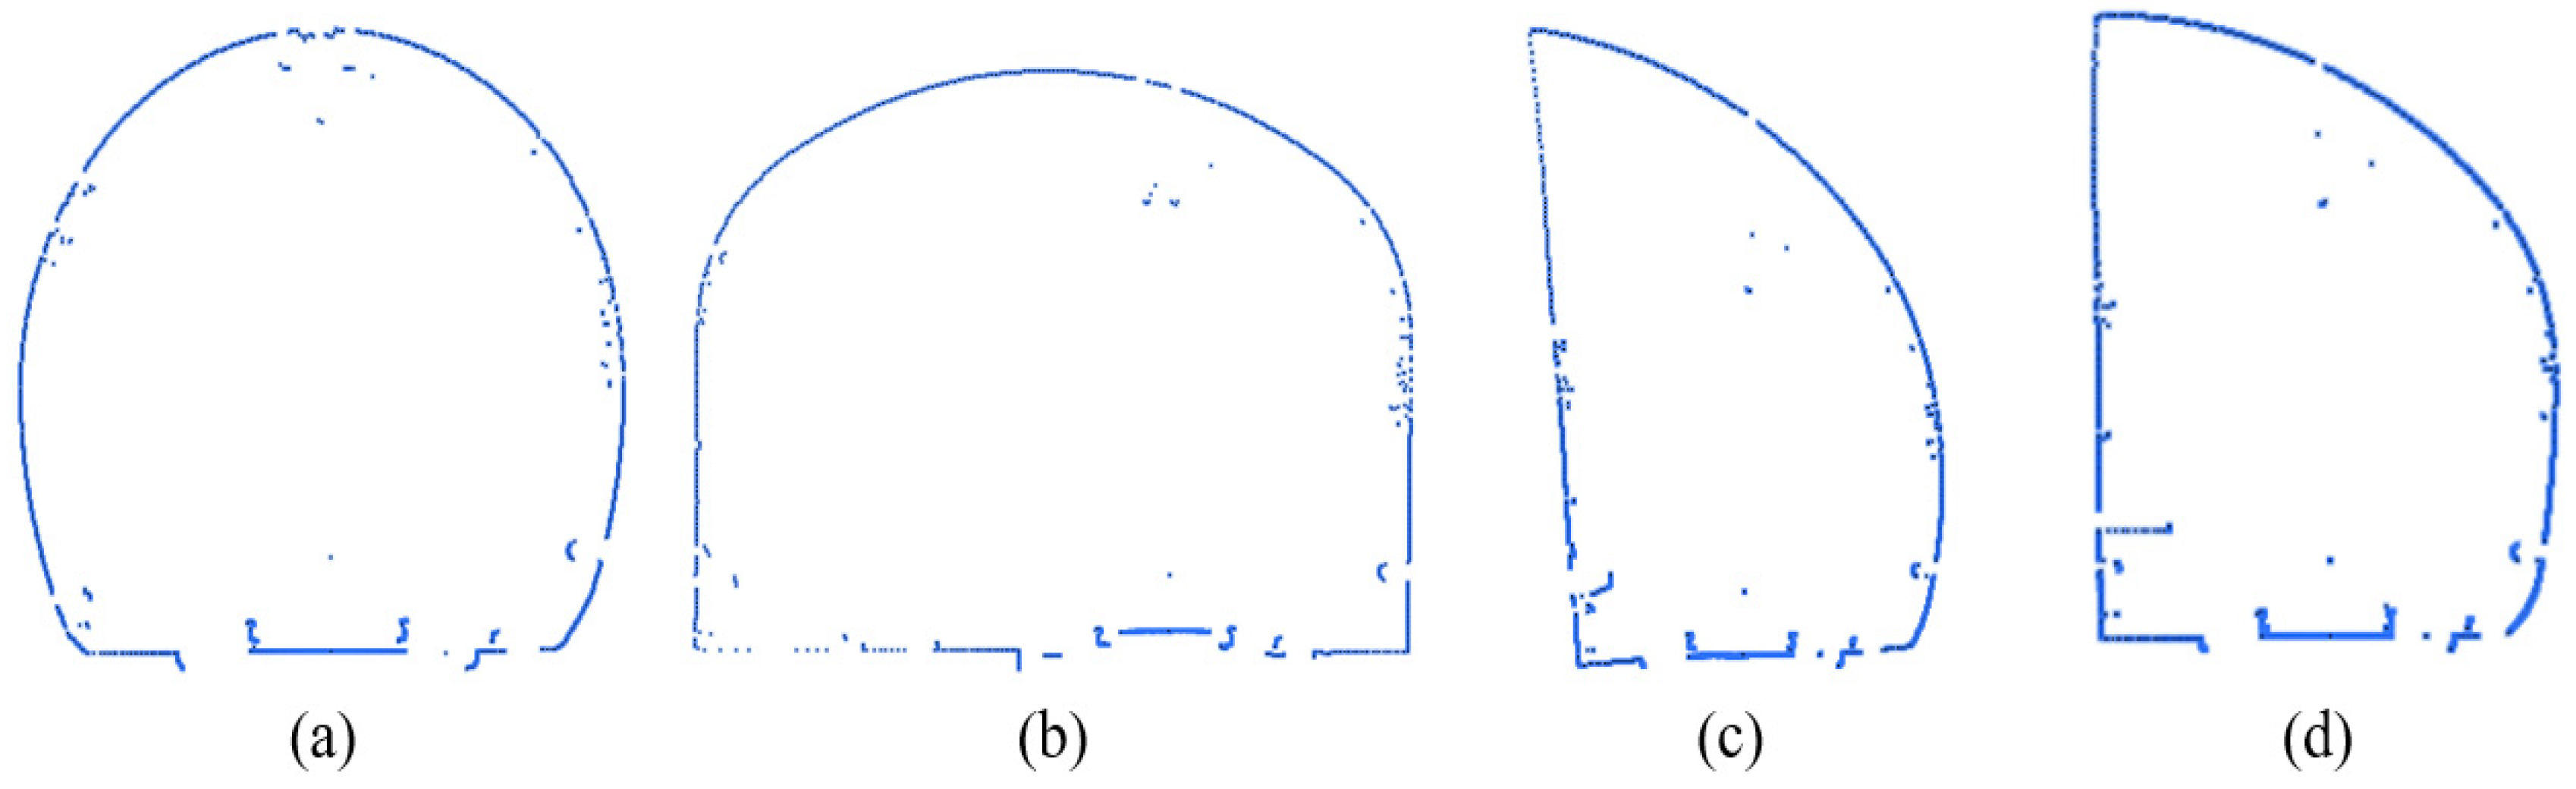
Figure 5.
Tunnel 3D coordinate system.

Figure 6.
Schematic of point cloud intensity information written into pixel matrix.
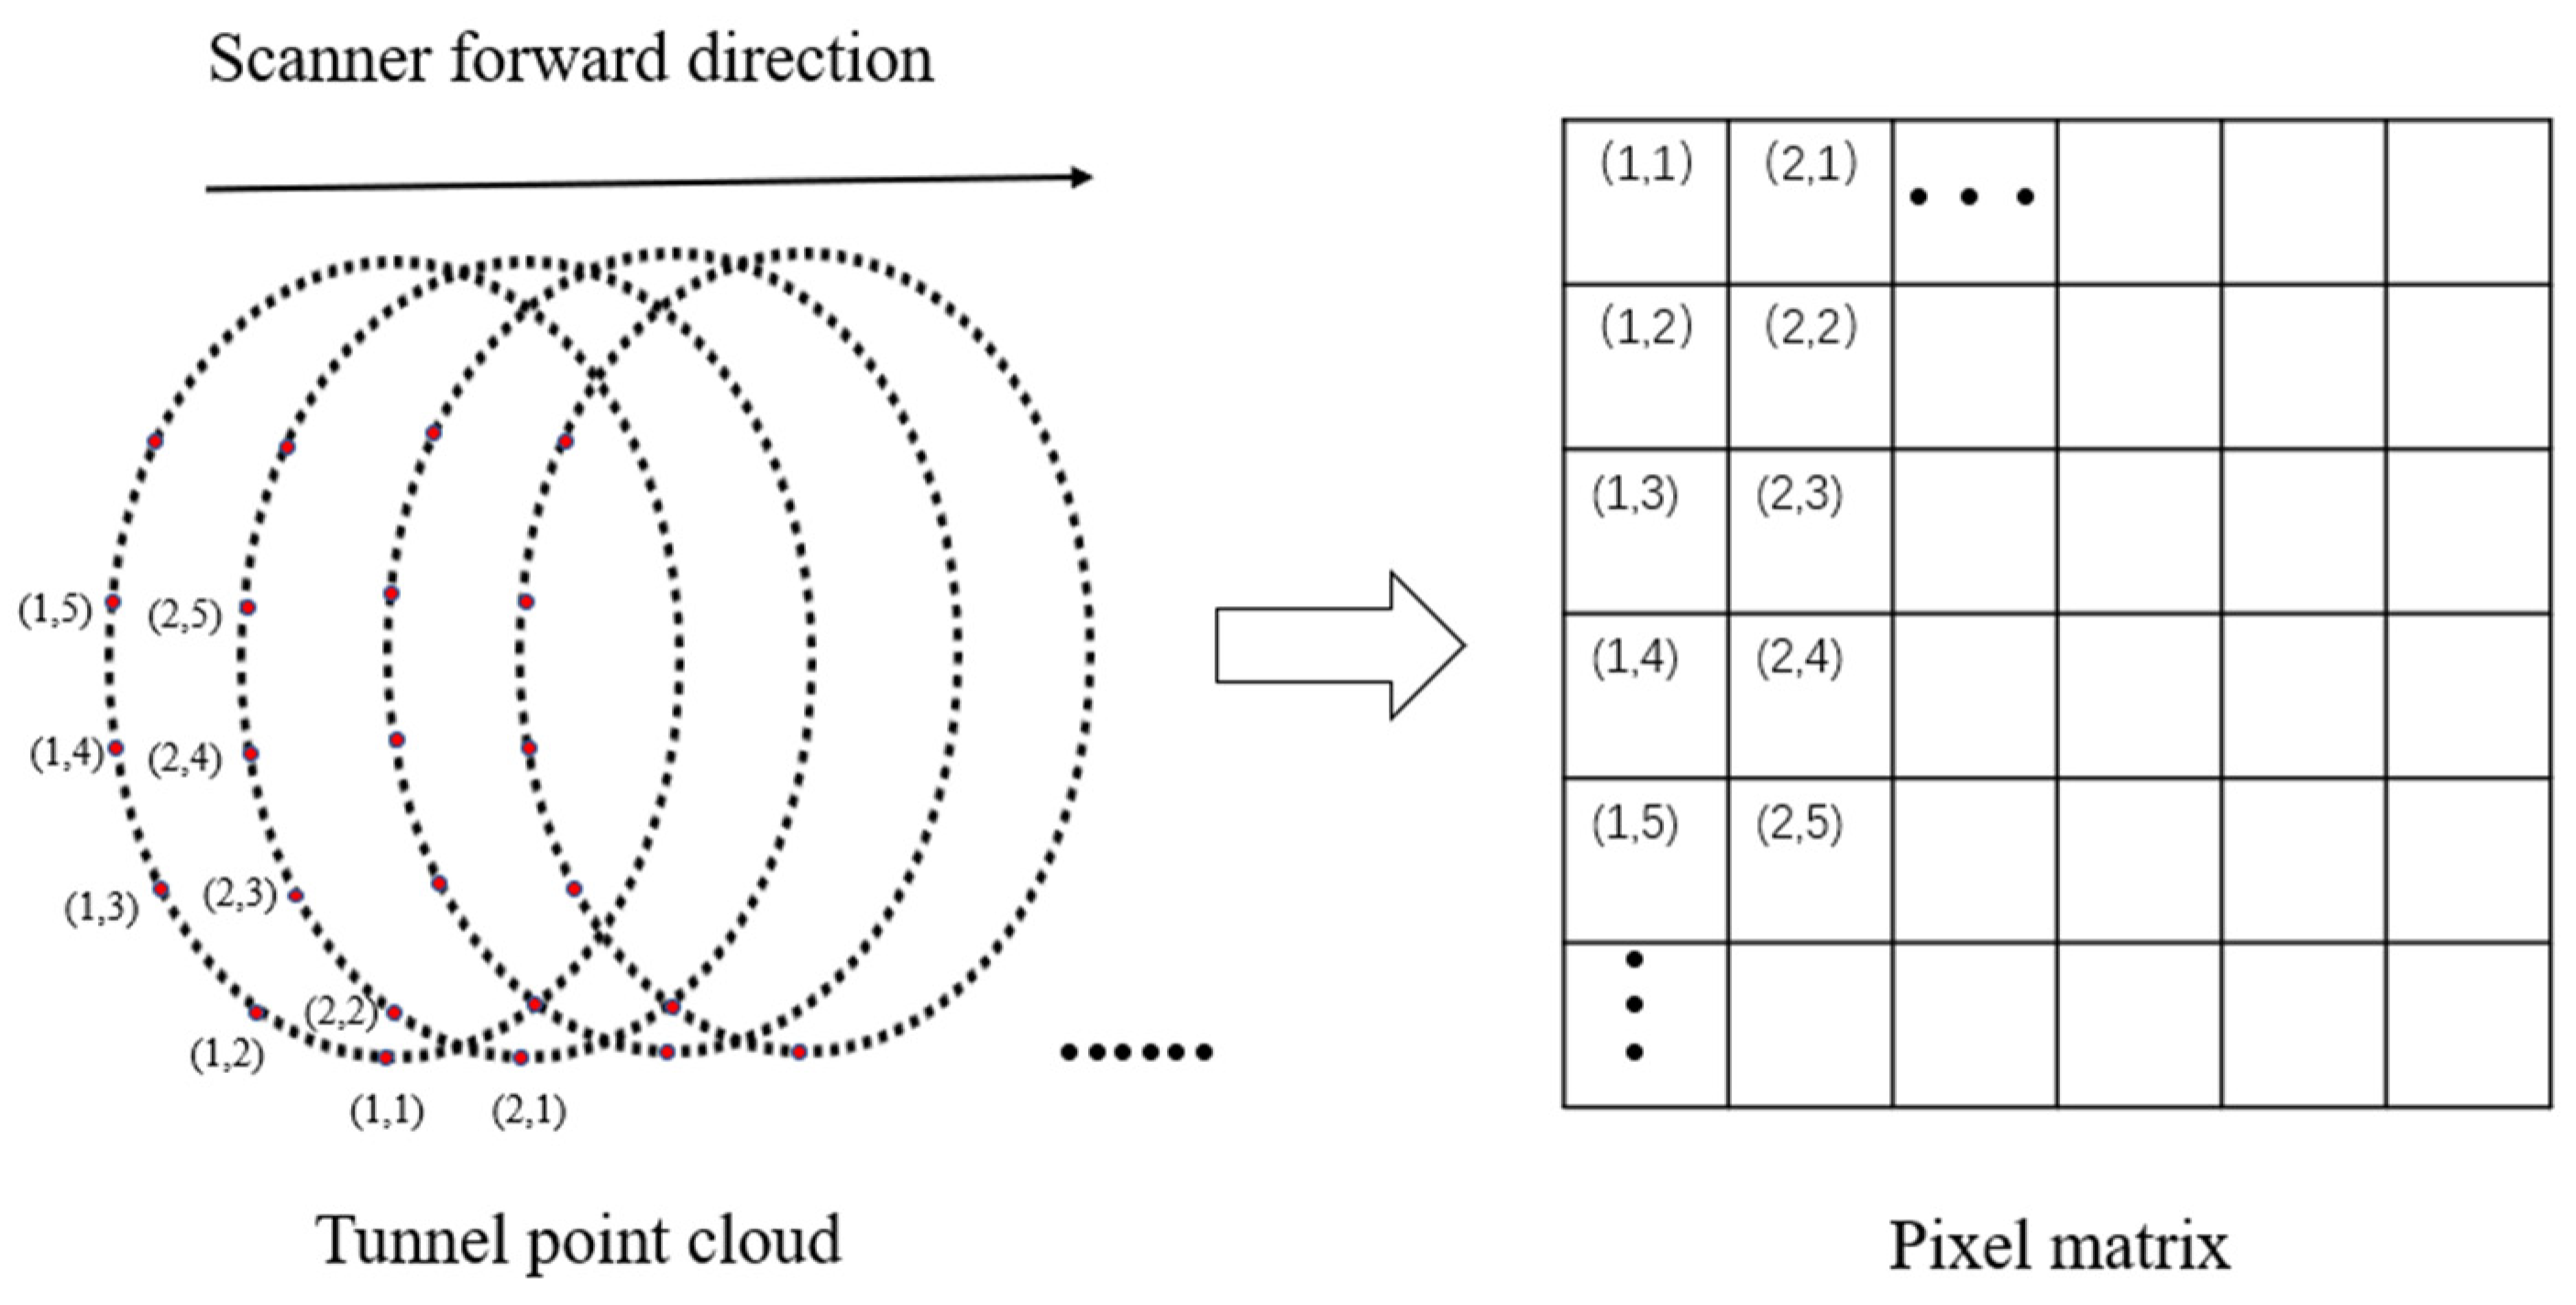
Figure 7.
Preview image of tunnel lining.
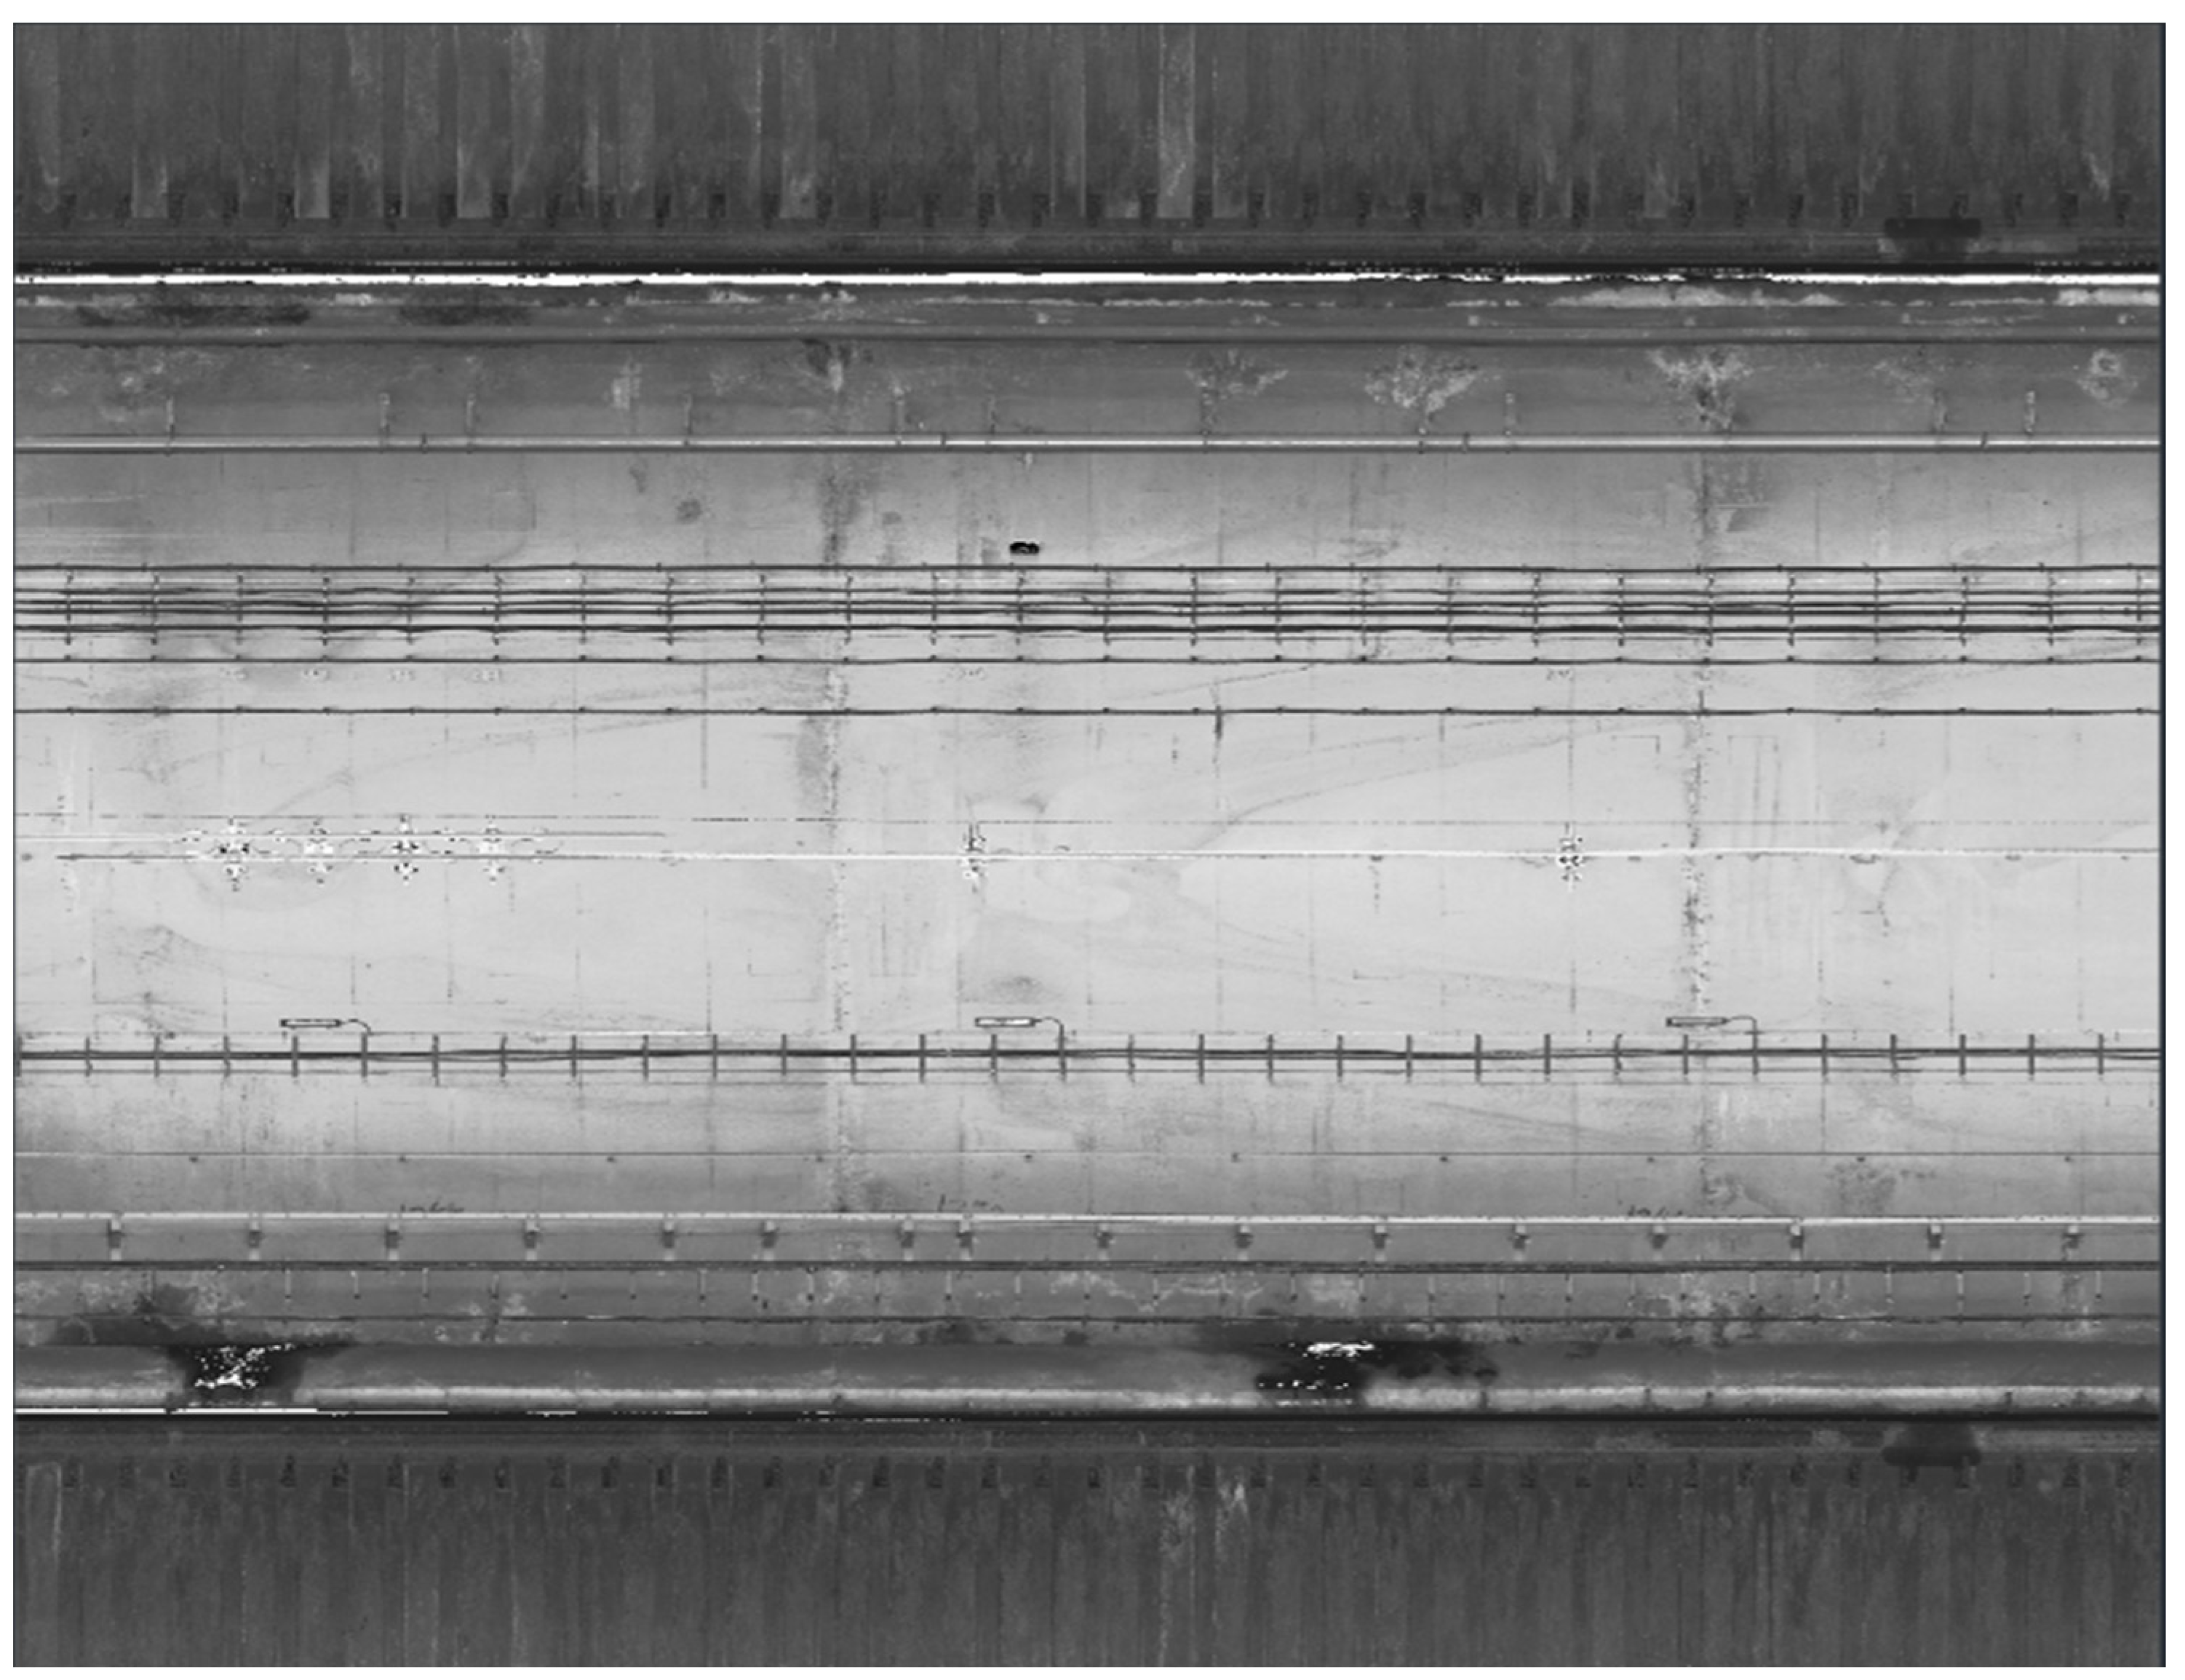
Figure 8.
Sample images in the dataset: (a) the original picture; (b) after flipping left and right; (c) after flipping up and down; (d) after contrast stretching.
Figure 8.
Sample images in the dataset: (a) the original picture; (b) after flipping left and right; (c) after flipping up and down; (d) after contrast stretching.

Figure 9.
Loss function curve of model training.

Figure 10.
(a) False positives caused by metal support; (b) false positives caused by clipping of picture.
Figure 10.
(a) False positives caused by metal support; (b) false positives caused by clipping of picture.
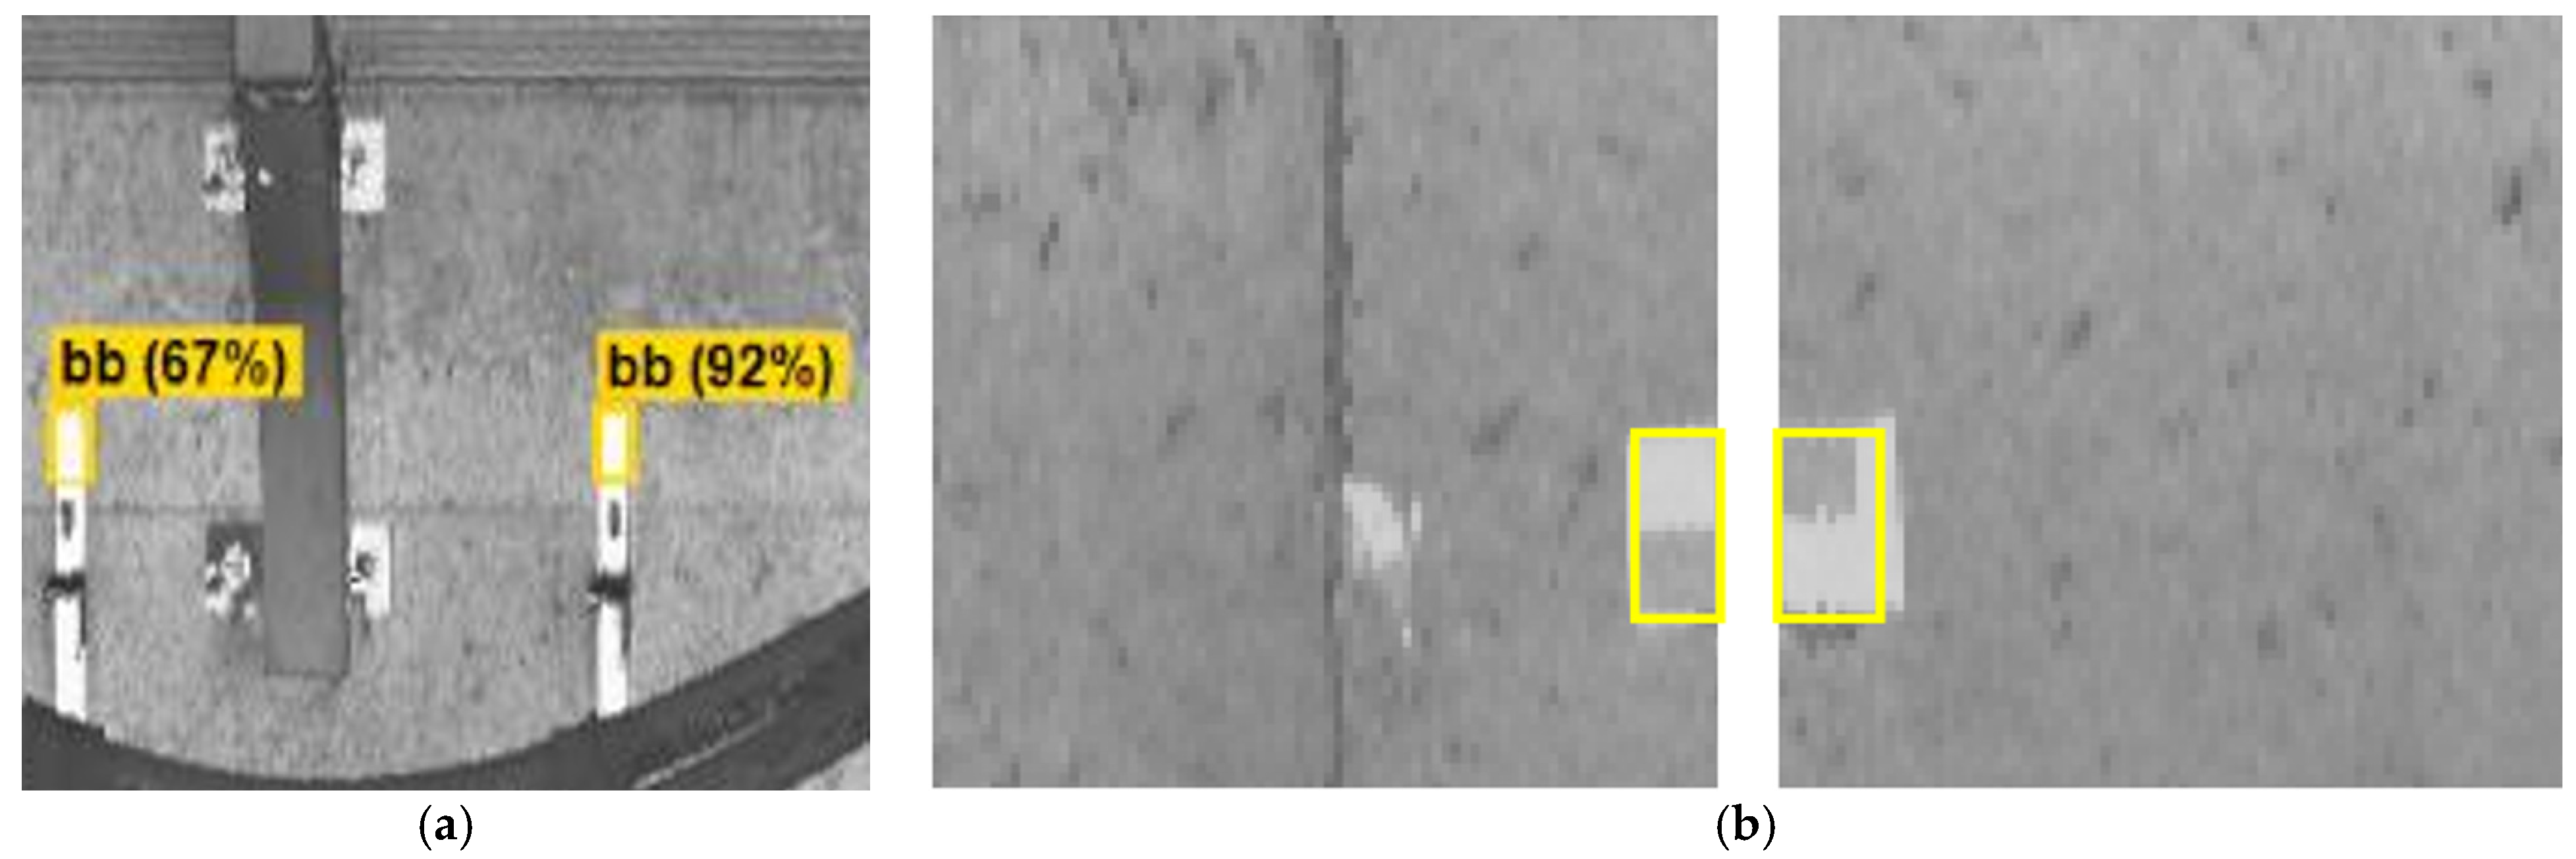
Figure 11.
(a) Target in grayscale image; (b) Target pixel value distribution.
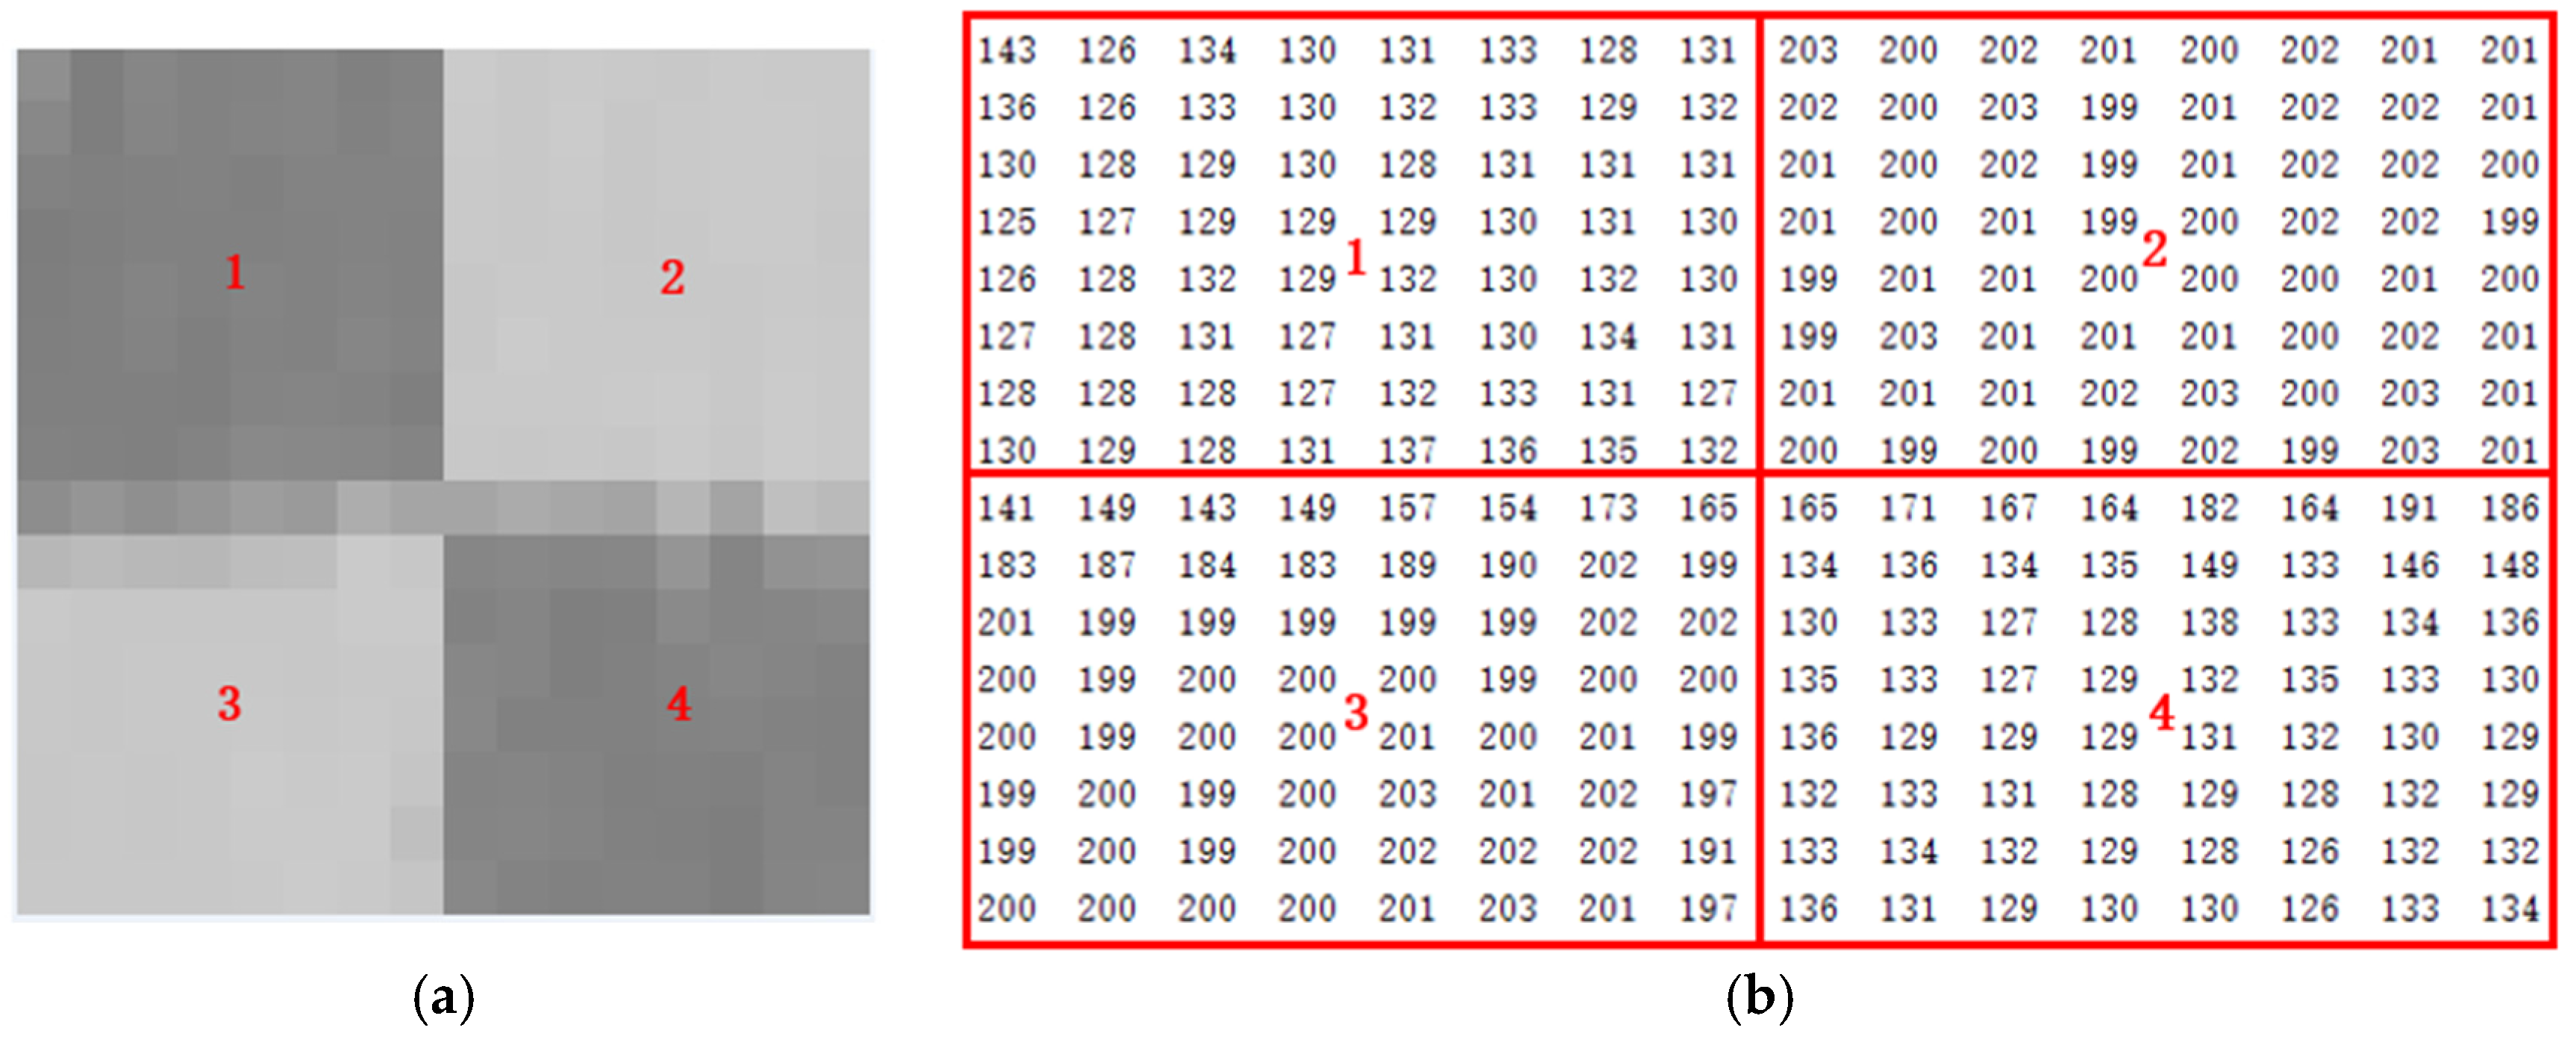
Figure 12.
Chord lengths of different section types.
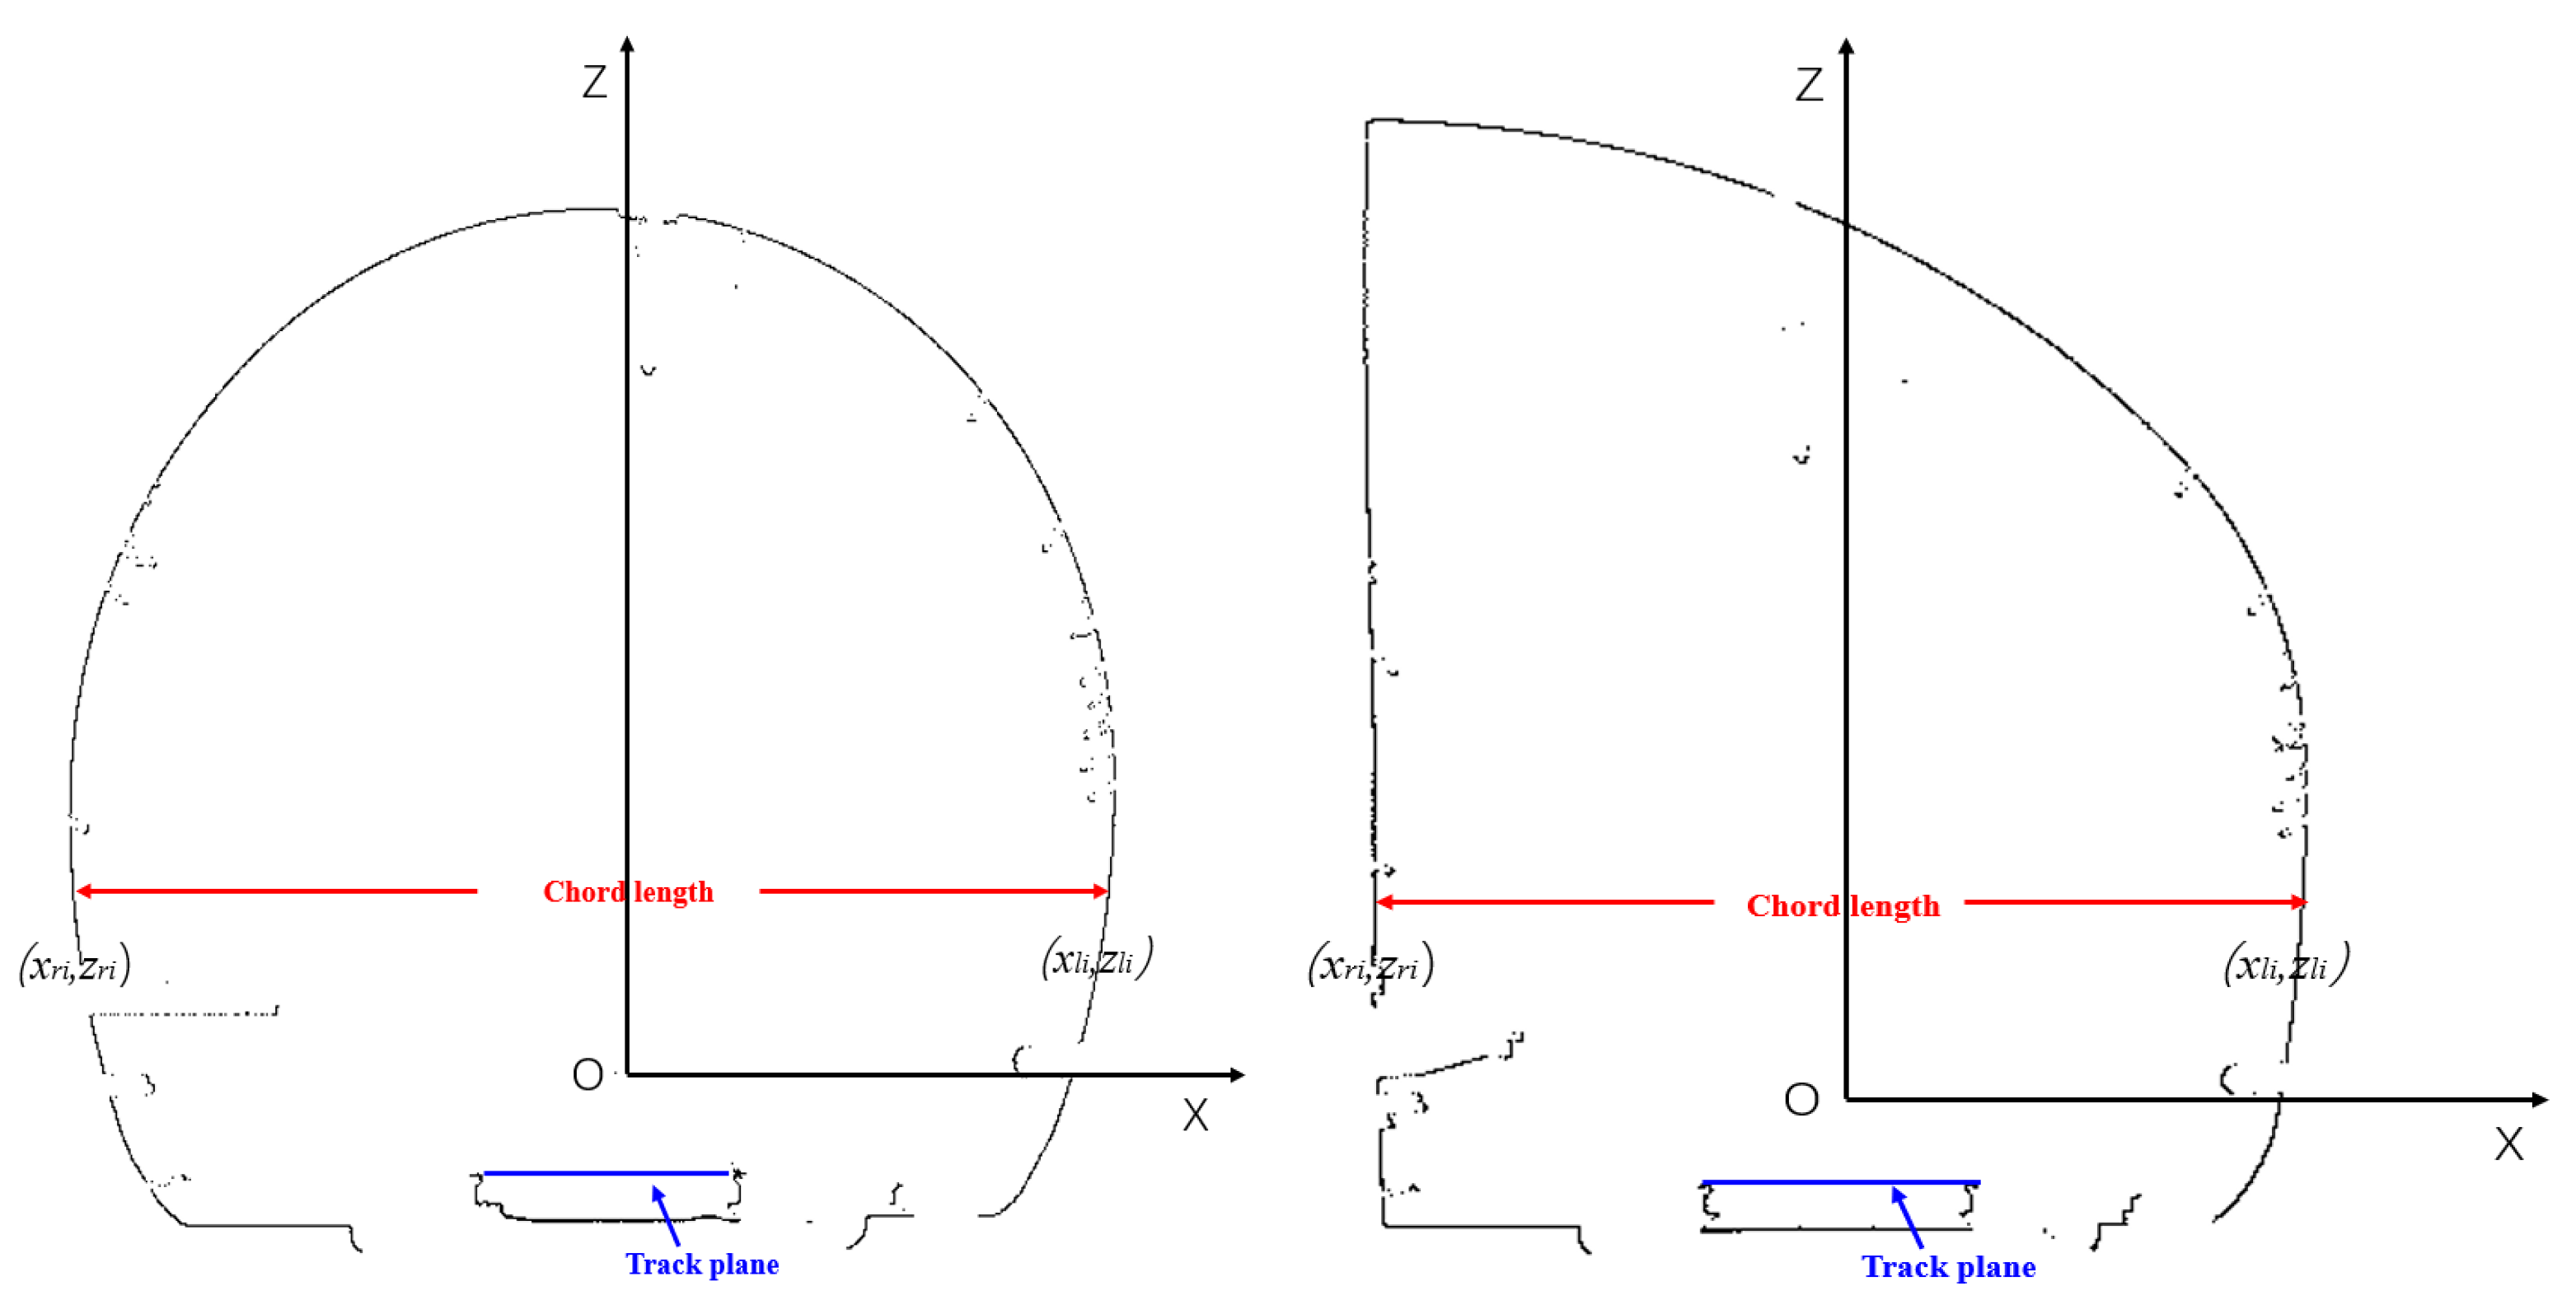
Figure 13.
Schematic of net height of vault of different section types.
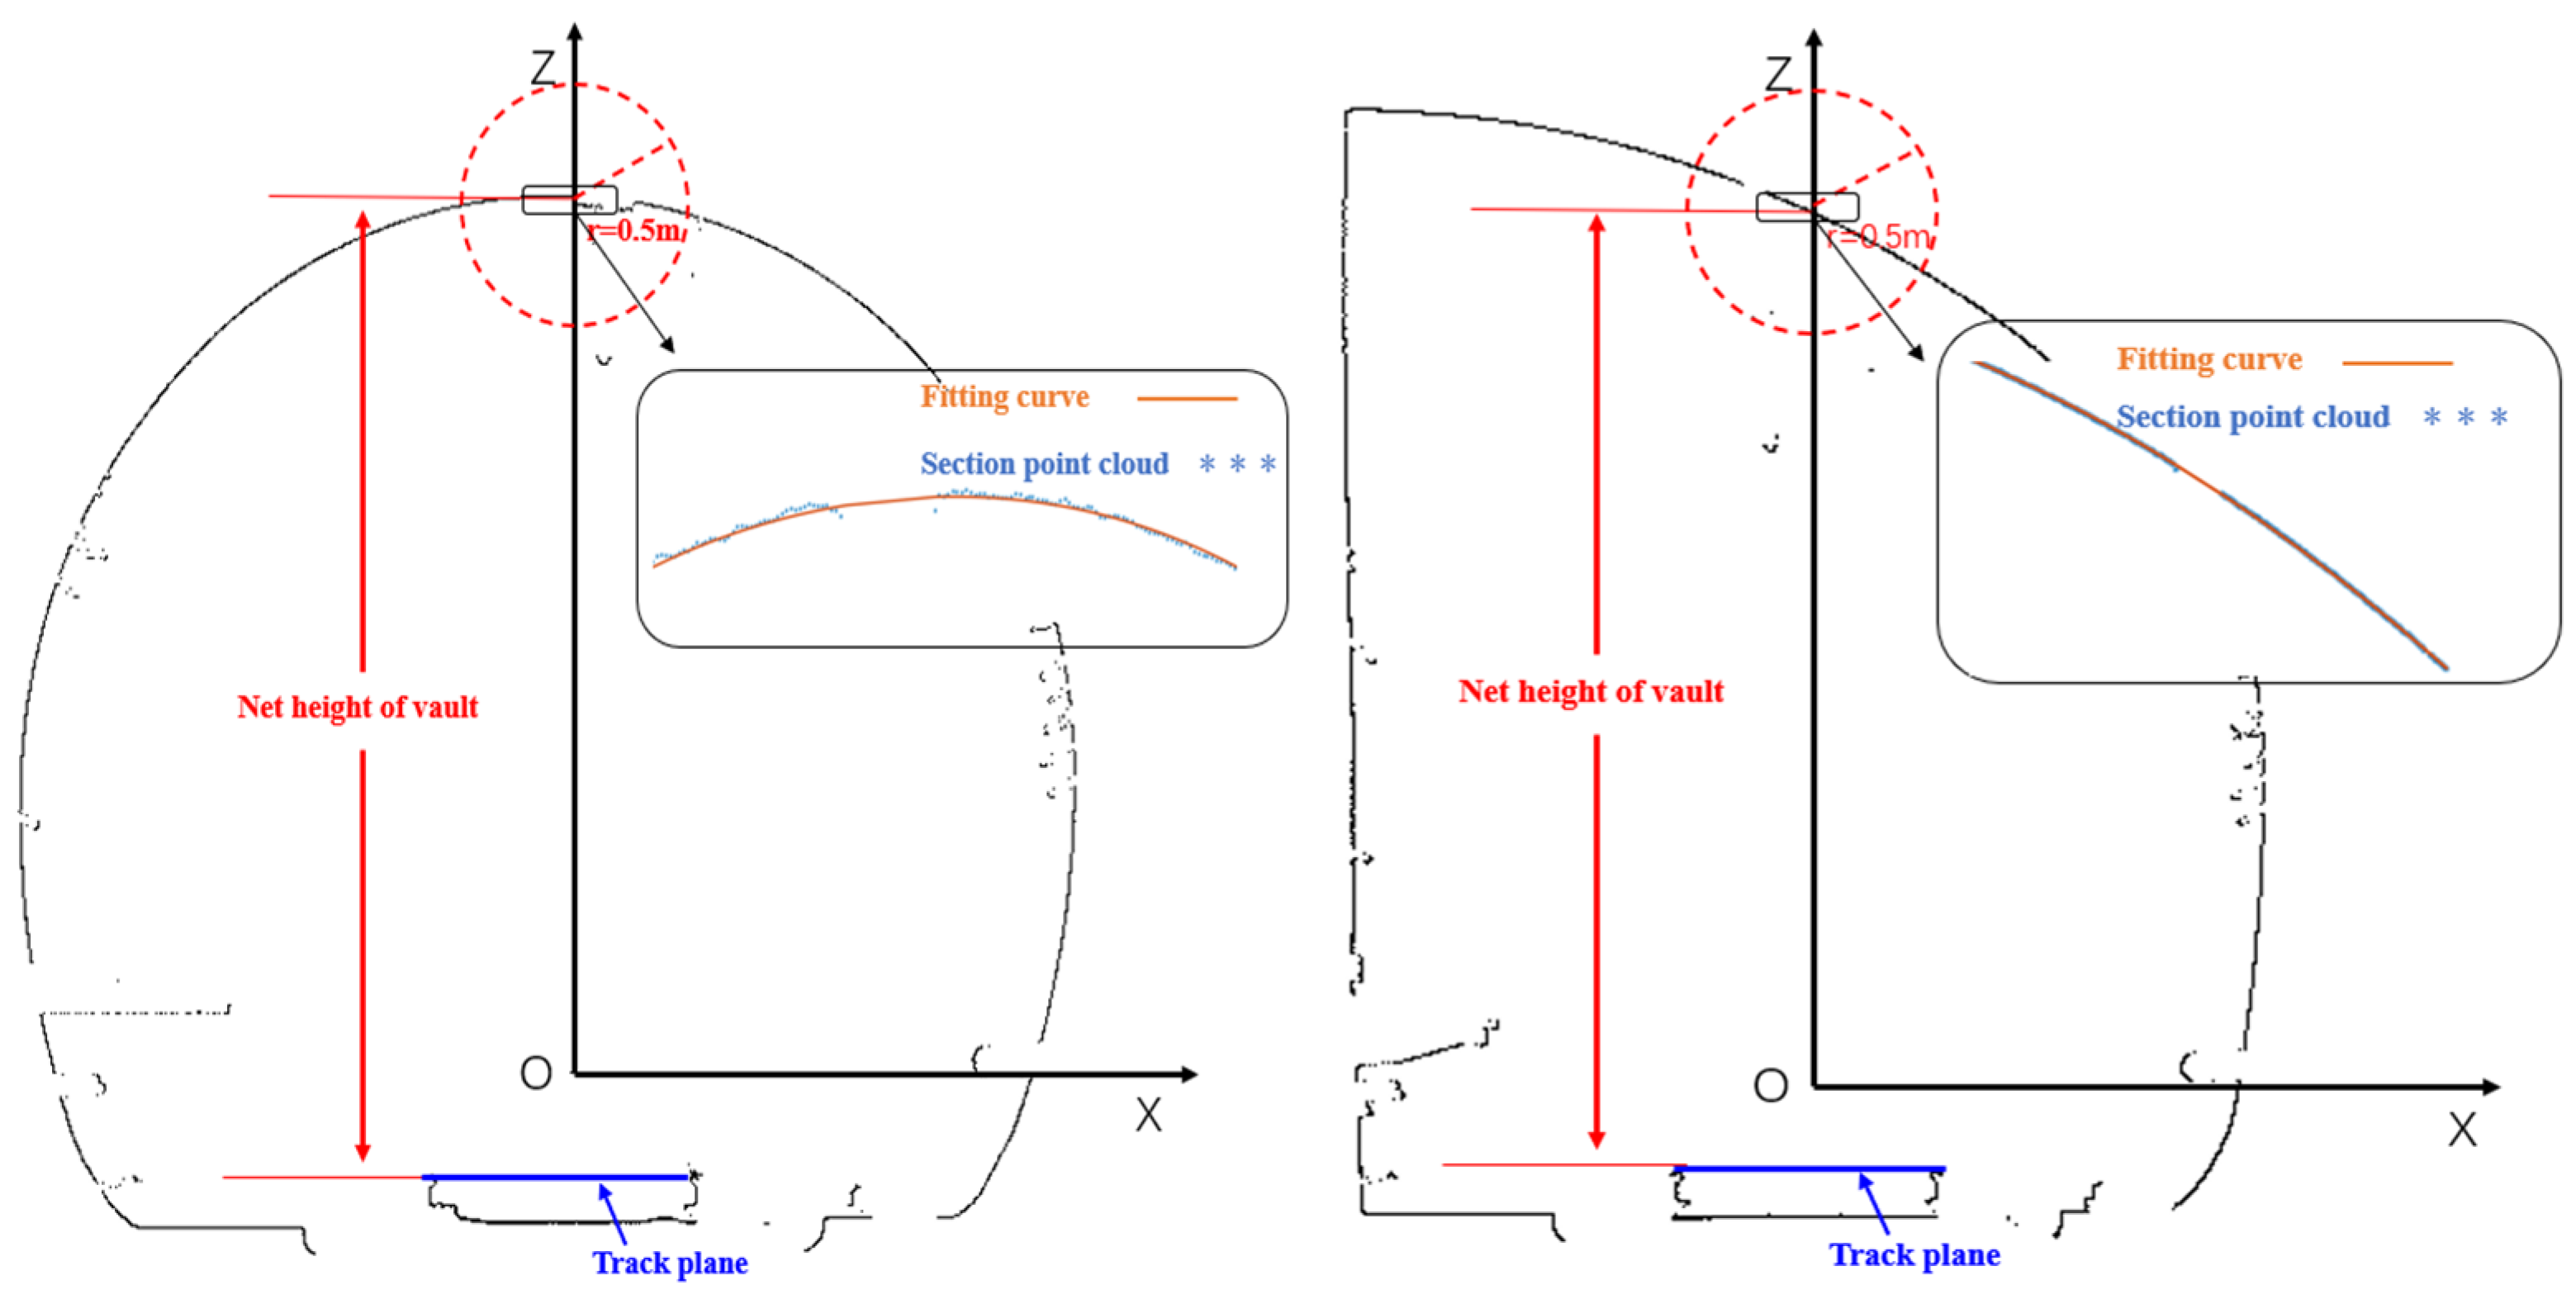
Figure 14.
NET integrated deep learning model process.

Figure 15.
Engineering application interface.
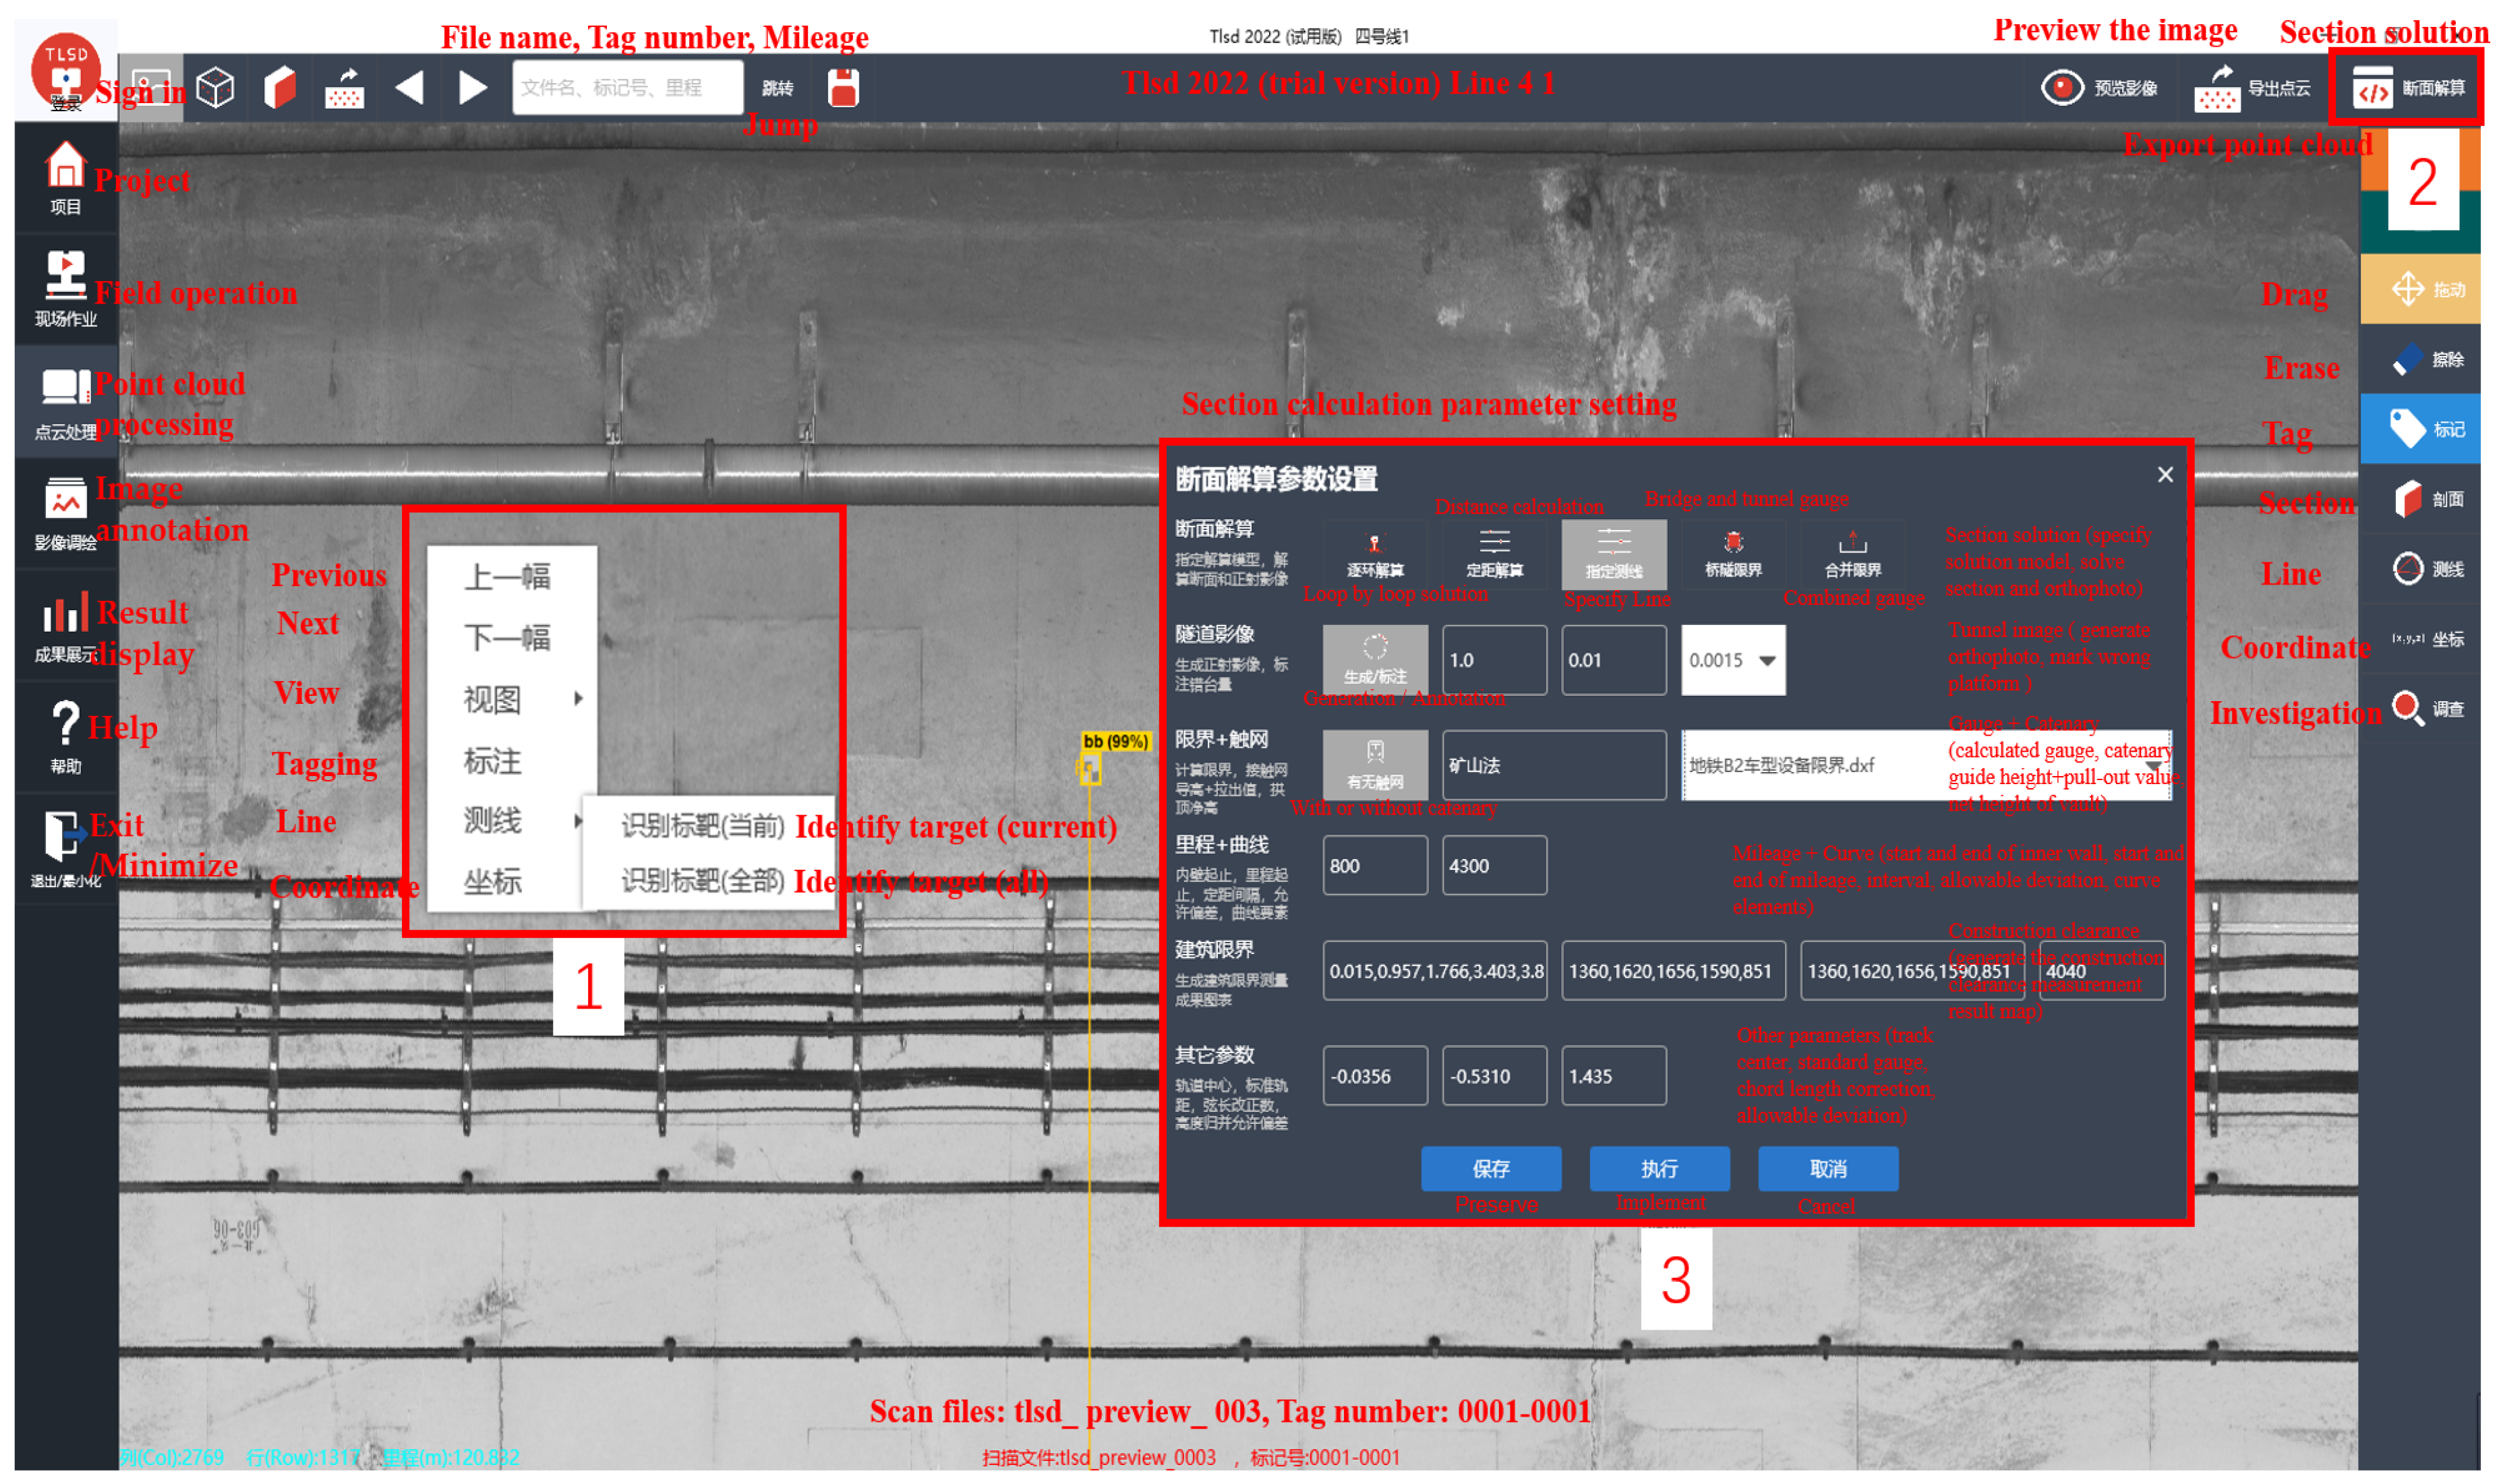
Figure 16.
(a) Field target; (b) field working diagram; (c) partial laser point cloud data.

Figure 17.
Partial recognition results of some targets.

Table 1.
Z + F 9012 laser scanner parameters.
| Laser System | |
|---|---|
| Beam divergence | <0.5 mrad |
| Range | 0.3–119 m |
| Range resolution | 0.1 mm |
| Rate of measurement of points | Maximum 1.016 million points per second |
| Linearity error | ≤1 mm |
| Transmitter unit | |
| Vertical viewing angle | 360° |
| Angular resolution | 0.0088° (40,960 pixel/360°) |
| Angle accuracy | 0.02° rms |
| Rotating speed | 50–200 Hz (Highest 12,000 rpm) |
Table 2.
Results of true positives, false positives, false negatives, precision, recall, and .
| Max Batches | TP | FP | FN | Detection Count | Truth Count | P | R | F1 |
|---|---|---|---|---|---|---|---|---|
| 2000 | 507 | 45 | 0 | 552 | 507 | 0.92 | 1 | 0.96 |
Table 3.
Comparison of chord length accuracy of roundtrip measurement.
| Tunnel Type | Serial No. | Forward (mm) | Backward (mm) | D-Value (mm) |
|---|---|---|---|---|
| Horseshoe tunnel | 1 | 5860.0 | 5860.0 | 0.0 |
| 2 | 5870.4 | 5871.2 | 0.8 | |
| 3 | 5867.0 | 5866.8 | 0.2 | |
| 4 | 5912.0 | 5911.8 | 0.2 | |
| 5 | 5924.6 | 5921.4 | 3.2 | |
| 6 | 5905.6 | 5906.4 | 0.8 | |
| 7 | 5914.0 | 5914.0 | 0.0 | |
| 8 | 5821.6 | 5820.4 | 1.2 | |
| 9 | 5894.8 | 5894.4 | 0.4 | |
| 10 | 5909.0 | 5907.0 | 2.0 | |
| 11 | 5931.3 | 5930.3 | 1.0 | |
| 12 | 5886.7 | 5885.4 | 1.3 | |
| 13 | 5851.2 | 5850.2 | 1.0 | |
| 14 | 5835.6 | 5833.1 | 2.5 | |
| 15 | 5890.3 | 5891.3 | 1.0 | |
| 16 | 5920.1 | 5919.1 | 1.0 | |
| 17 | 5911.2 | 5910.4 | 0.8 | |
| 18 | 5884.0 | 5884.0 | 0.0 | |
| 19 | 5859.0 | 5859.0 | 0.0 | |
| 20 | 5893.2 | 5894.0 | 0.8 | |
| 21 | 5885.6 | 5883.0 | 2.6 | |
| Average difference of horseshoe tunnel | 1.0 | |||
| Similar rectangular A tunnel | 22 | 5397.6 | 5394.2 | 3.4 |
| 23 | 5498.1 | 5499.1 | 1.0 | |
| 24 | 5484.0 | 5484.0 | 0.0 | |
| 25 | 5591.3 | 5589.3 | 2.0 | |
| 26 | 5554.1 | 5550.4 | 3.7 | |
| Average difference of similar rectangular A tunnel | 2.0 | |||
| Similar rectangular B tunnel | 27 | 5215.8 | 5213.8 | 2.0 |
| 28 | 5223.6 | 5221.0 | 2.6 | |
| 29 | 5197.2 | 5195.4 | 1.8 | |
| 30 | 5183.0 | 5183.0 | 0.0 | |
| 31 | 5179.4 | 5177.0 | 2.4 | |
| 32 | 5206.4 | 5203.4 | 3.0 | |
| 33 | 5182.0 | 5178.4 | 3.6 | |
| 34 | 5193.1 | 5190.3 | 2.8 | |
| 35 | 5175.2 | 5172.4 | 2.8 | |
| 36 | 5231.6 | 5228.4 | 3.2 | |
| Average difference of similar rectangular B tunnel | 2.4 | |||
| Straight-wall circular arch tunnel | 37 | 6599.8 | 6598.1 | 1.7 |
| 38 | 7998.4 | 7997.4 | 1.0 | |
| Average difference of straight-wall circular arch tunnel | 1.3 | |||
| Average difference | 1.7 | |||
Table 4.
Comparison of vault net height accuracy of roundtrip measurement.
| Tunnel Type | Serial No. | Forward (mm) | Backward (mm) | D-Value (mm) |
|---|---|---|---|---|
| Horseshoe tunnel | 1 | 5121.5 | 5122.4 | 0.9 |
| 2 | 5075.8 | 5076.9 | 1.1 | |
| 3 | 5098.7 | 5099.4 | 0.7 | |
| 4 | 5084.2 | 5083.5 | 0.7 | |
| 5 | 5075.8 | 5075.2 | 0.6 | |
| 7 | 5082.7 | 5081.2 | 1.5 | |
| 8 | 5065.5 | 5064.2 | 1.3 | |
| 9 | 5010.3 | 5011.4 | 1.1 | |
| 10 | 5080.4 | 5079.2 | 1.2 | |
| 11 | 5099.1 | 5097.3 | 1.8 | |
| 12 | 5113.5 | 5112.2 | 1.3 | |
| 13 | 5105.1 | 5104.4 | 0.7 | |
| 14 | 5102.5 | 5102.1 | 0.4 | |
| 30 | 5100.9 | 5099.7 | 1.2 | |
| 31 | 5084.6 | 5083.2 | 1.4 | |
| 32 | 5099.9 | 5100.1 | 0.2 | |
| 33 | 5094.0 | 5093.9 | 0.1 | |
| 34 | 5114.3 | 5114.1 | 0.2 | |
| 35 | 5172.6 | 5170.8 | 1.8 | |
| 36 | 5159.6 | 5159.0 | 0.6 | |
| 37 | 5193.8 | 5194.0 | 0.2 | |
| Average difference of horseshoe tunnel | 0.9 | |||
| Similar rectangular A tunnel | 15 | 6450.5 | 6452.0 | 1.5 |
| 16 | 6342.9 | 6340.0 | 2.9 | |
| 17 | 6604.1 | 6607.6 | 3.5 | |
| 28 | 6833.0 | 6830.3 | 2.7 | |
| 29 | 6914.7 | 6916.8 | 2.1 | |
| Average difference of similar rectangular A tunnel | 2.5 | |||
| Similar rectangular B tunnel | 18 | 5657.6 | 5654.8 | 2.8 |
| 19 | 5627.2 | 5624.5 | 2.7 | |
| 20 | 5629.1 | 5628.6 | 0.5 | |
| 21 | 5616.4 | 5616.9 | 0.5 | |
| 22 | 5595.0 | 5593.3 | 1.7 | |
| 23 | 5624.8 | 5624.7 | 0.1 | |
| 24 | 5561.6 | 5560.9 | 0.7 | |
| 25 | 5562.8 | 5561.2 | 1.6 | |
| 26 | 5580.8 | 5577.6 | 3.2 | |
| 27 | 5551.4 | 5551.2 | 0.2 | |
| Average difference of similar rectangular B tunnel | 1.4 | |||
| Straight-wall circular arch tunnel | 6 | 5269.8 | 5268.0 | 1.8 |
| 38 | 5412.6 | 5412.3 | 0.3 | |
| Average difference of straight-wall circular arch tunnel | 1.0 | |||
| Average difference | 1.4 | |||
Disclaimer/Publisher’s Note: The statements, opinions and data contained in all publications are solely those of the individual author(s) and contributor(s) and not of MDPI and/or the editor(s). MDPI and/or the editor(s) disclaim responsibility for any injury to people or property resulting from any ideas, methods, instructions or products referred to in the content. |
© 2023 by the authors. Licensee MDPI, Basel, Switzerland. This article is an open access article distributed under the terms and conditions of the Creative Commons Attribution (CC BY) license (https://creativecommons.org/licenses/by/4.0/).
Share and Cite
MDPI and ACS Style
Ji, C.; Sun, H.; Zhong, R.; Sun, M.; Li, J.; Lu, Y. Deformation Detection of Mining Tunnel Based on Automatic Target Recognition. Remote Sens. 2023, 15, 307. https://doi.org/10.3390/rs15020307
AMA Style
Ji C, Sun H, Zhong R, Sun M, Li J, Lu Y. Deformation Detection of Mining Tunnel Based on Automatic Target Recognition. Remote Sensing. 2023; 15(2):307. https://doi.org/10.3390/rs15020307
Chicago/Turabian StyleJi, Changqi, Haili Sun, Ruofei Zhong, Mingze Sun, Jincheng Li, and Yue Lu. 2023. "Deformation Detection of Mining Tunnel Based on Automatic Target Recognition" Remote Sensing 15, no. 2: 307. https://doi.org/10.3390/rs15020307
Note that from the first issue of 2016, this journal uses article numbers instead of page numbers. See further details here.