
Preliminary Investigation of Sudden Ground Subsidence and Building Tilt in Balitai Town, Tianjin City, on 31 May 2023


1
State Key Laboratory of Information Engineering in Surveying, Mapping and Remote Sensing (LIESMARS), Wuhan University, Wuhan 430079, China
2
Helmholtz Centre Potsdam, GFZ German Research Centre for Geosciences, 14473 Potsdam, Germany
3
Institute for Remote Sensing Science and Application, School of Geomatics, Liaoning Technical University, Fuxin 123000, China
4
Indian Institute of Technology Roorkee, Roorkee 247667, India
*
Author to whom correspondence should be addressed.
Remote Sens. 2023, 15(19), 4891; https://doi.org/10.3390/rs15194891
Submission received: 4 July 2023
/
Revised: 13 September 2023
/
Accepted: 20 September 2023
/
Published: 9 October 2023
(This article belongs to the Special Issue New Developments in Remote Sensing for the Environment II)
Abstract
:A short-term rapid subsidence event occurred in the Bi Guiyuan community in Balitai Town, Tianjin City, leading to the tilting of high-rise buildings and the emergency evacuation of over 3000 residents. In response to this incident, InSAR (Interferometric Synthetic Aperture Radar) technology was swiftly employed to monitor the subsidence in the area before and after the event. Our observations indicate that the region had maintained stability for 8 months prior to the incident. However, over the course of the 15-day event, the ground experienced more than 10mm of subsidence. By integrating the findings from an InSAR analysis with geological studies, we speculate that the rapid subsidence in the region is related to the extraction of geothermal resources. It is suspected that during drilling operations, the wellbore mistakenly penetrated a massive underground karst cavity. Consequently, this resulted in a sudden rapid leakage of drilling fluid, creating a pressure differential that caused the overlying soil layers to collapse and rapidly sink into the cavity. As a result, short-term rapid subsidence on the ground surface and tilting of high-rise buildings occurred.
1. Introduction
Ground subsidence is a common geohazard characterized by long formation periods and wide distribution. According to existing research, more than 19% of the population in over 1600 major cities worldwide is directly or indirectly affected by ground subsidence [1]. In China, the three main regions experiencing ground subsidence are the Yangtze River Delta, North China Plain, and Fenwei Plain [2]. Urban subsidence is influenced by both natural and anthropogenic factors. Natural factors include consolidation of soft soils and karst collapses, while anthropogenic factors include the construction of subway lines and groundwater extraction, among others. Unless in extreme cases, urban ground subsidence usually develops slowly. However, it has a very strong destructive impact, such as structural damage to buildings; damage to underground pipelines and facilities; and the sinking of the ground, which can lead to the failure of drainage systems or obstruction of water flow, increasing the risk of flooding in cities. In this case, regular monitoring of ground subsidence is crucial, allowing relevant authorities to analyze triggering factors and implement protective measures based on the severity of the issue [3,4]. Although ground surveys such as GPS or leveling can provide reliable measurements for monitoring ground subsidence, these methods lack timeliness and typically involve point-based monitoring. They cannot cover a large area precisely. Interferometric Synthetic Aperture Radar (InSAR) is a powerful tool for monitoring surface deformation, with an accuracy of up to millimeters. With the rapid development of SAR (Synthetic Aperture Radar) satellite systems in recent years, a vast amount of data have become available for use. The advantages of SAR data, such as wide coverage, relatively stable revisiting periods, and high precision, make InSAR technology a cost-effective and efficient means of monitoring surface deformation.
On the evening of 31 May 2023, a rare and sudden local ground subsidence event occurred in Balitai Town, Jinnan District, Tianjin City. This incident resulted in severe cracking and tilting of buildings, along with visible cracks on roads in the community and its surrounding areas. Over 3000 residents were urgently evacuated to safe zones. To investigate the sudden subsidence event, this study utilized time-series InSAR technology to reveal the sudden subsidence characteristics and combined existing geological information to infer its triggering cause. The result shows that the area was stable before 25 May, followed by rapid subsidence between 25 May and 15 June, with a maximum subsidence of over 10 mm. Through our analysis, we believe that the event was caused by improper geothermal well drilling, leading to the penetration of a large karst cavity (geological void) and the occurrence of well leakage. The drilling fluid and overlying soil layers infiltrated into the cavity, resulting in instability of the upper ground layers, thereby triggering rapid subsidence and tilting of buildings. This study aims to provide a preliminary report and inference regarding the cause of this event.
2. Study Area
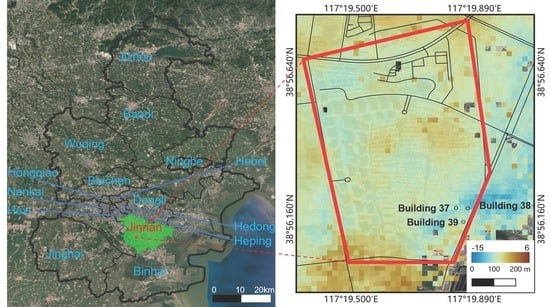
Tianjin is one of the four direct-controlled municipalities in China, with a population of nearly 16 million. Based on a review of the existing literature, it was found that Tianjin is a city severely affected by subsidence. In order to meet the demands of population growth and economic development, the city has experienced excessive groundwater extraction [5]. Leveling surveys have demonstrated that the maximum subsidence rate in the area has exceeded 80 mm/year between 1992 and 2008 [6]. Another study indicated that the maximum cumulative subsidence in Tianjin from 1959 to 2008 reached 3.22 m [7]. Following the recognition of subsidence as a significant issue, the government implemented measures such as diverting water from the Luan River into the city and restricting groundwater extraction to control the subsidence rate in the urban area. Additionally, Tianjin possesses abundant geothermal resources and is one of the first cities in the country to utilize geothermal energy for heating. There are more than 390 geothermal wells throughout the city [8]. Improper scale and methods of extracting geothermal resources can potentially lead to subsidence issues [9,10]. The incident area is located in the southern part of Tianjin City, as illustrated in Figure 1a, and it is a newly developed district. This region is rich in abundant geothermal energy, and Tianjin City has a significant history of geothermal energy extraction. Interestingly, the incident area coincides directly above Geothermal Field No. 52, as depicted in Figure 1b [11]. According to available data, this area was approved for geothermal energy development at the end of 2022 and construction began in April–May of this year.
3. InSAR Time-Series Analysis and Results
This study utilized the SBAS-InSAR time-series analysis method to conduct a detailed analysis of the study area [12]. We used 24 images from the Sentinel-1 satellites operating in C-band with a wavelength of 5.55 cm, spanning from 15 September 2022 to 18 June 2023. Each image was combined with others within a 400 m perpendicular baseline and a 90-day temporal baseline to form five interferometric pairs. Figure 2 depicts the interferoram network adopted for the processing. The interferograms were downsampled by a factor of 5 in the range direction and 1 in the azimuth direction, generating ground pixels of approximately 20 m × 20 m. Precise orbit data from ASF were utilized for Earth plane phase correction. The SRTM DEM was employed for computing and removing the topographic phase as well as geocoding the interferograms. To reduce noise, a GAMMA adaptive power spectral filter with an s value of 0.4 was used for spatial filtering. The two-dimensional phase was unwrapped using the statistical cost flow method in the SNAPHU software. During the phase unwrapping process, regions with low coherence in the interferograms (estimated coherence less than 0.5 based on the filtered interferogram) were masked as decorrelated areas. To mitigate atmospheric contributions to displacement signals, the iterative troposphere decomposition model implemented in the Generic Atmospheric Correction Online Service for InSAR (GACOS) was applied [13,14]. The time-series analysis was conducted using LiCSBAS [15].
Figure 3a shows the cumulative deformation map of the study area. Based on the derived settlement map, significant settlement has been detected in three high-rise buildings i.e., Buildings 37, 38, and 39, and the villa area at the center of the residential community. These three high-rise buildings were the first to exhibit tilting and were evacuated. On the right side of these three buildings is the drilling site for the geothermal wells, which is also the area with the highest settlement magnitude in the entire settlement chart. The maximum short-term settlement exceeded 10 mm. An analysis of the time-series curves in these three areas reveals that the region was stable before 23 May. However, in the two observations obtained after 23 May, rapid deformation was detected, consistent with the news reports.
4. Discussion
We discovered that the subsidence occurred directly above Geothermal Field No. 52, which is designated for geothermal energy extraction. The reservoir formation for geothermal energy is the Wumishan Formation of the Jixian Series. The top of the reservoir is approximately 3000 m deep, with a thickness of 600 m [11]. This indicates that the area has to be drilled down more than 3000 m using drilling methods to extract geothermal resources. According to the InSAR monitoring results, the area was relatively stable until 23 May 2023, with no significant subsidence observed. However, in the two images captured after 23 May, a rapid deformation of over 10 mm was detected.
This short-term rapid deformation characteristic is consistent with the occurrence of well leakage in underground drilling. During the drilling process, fractures and karst caves formed by groundwater dissolution in sedimentary carbonate rock layers such as the Ordovician, Cambrian, and Jixian formations allow the passage and storage of drilling fluids. If a void similar to a cavity is encountered during drilling, the drilling fluids may leak out completely in a short period of time, resulting in an extensive and rapid subsidence at the ground surface [16].
Existing studies have indicated that wellbore leakage commonly occurs in the limestone karst formations of the Ordovician and Cambrian, as well as in the dolomite formations of the Jixian Formation during geothermal drilling in Tianjin. For instance, in Well DL-76, leakage occurred when drilling reached the Changping Formation of the Cambrian. To address this issue, three leak plugging operations were conducted at a depth of 1654 m underground, utilizing a total of 17 tons of cement and 240 cubic meters of grout for successful sealing. Similarly, in Well DL-81, leakage was observed at a depth of 1959 m underground, and it required the use of 17 tons of cement for plugging [16].
Therefore, it was speculated that the cause of the rapid ground subsidence in this case may be similar. During the geothermal drilling in Block 52, drilling penetrated into carbonate rock layers where large karst cavities (geological voids) formed due to water erosion [17]. This resulted in the rapid leakage of drilling fluid into the cavities, which, in turn, caused the overlying sand layers to be flushed into the karst cavities under the pressure differential. The process is shown schematically in Figure 4.
According to Chinese regulations, the foundation depth for high-rise buildings should be no less than 1/6 of the building’s height. Based on this calculation, the foundation depth for a 30-story building experiencing tilting should be around 10–15 m [18]. In Tianjin, the soil cover exceeds 100 m and consists of a mixture of terrestrial and marine sediments [19,20,21] (as shown in the Figure 4). Therefore, the foundation does not reach the bedrock. The leakage from the underground layers caused the loosening of the foundation soil, resulting in the tilting of the building.
Additionally, karst formations have strong connectivity, and if attempts are made to replenish drilling fluids or seal the leaks, a significant amount of cement slurry may be required to completely fill them and to achieve a reduction in subsidence. Until now, the subsidence continues.
5. Conclusions
This study utilizes Sentinel-1 data to detect the sudden ground subsidence that recently occurred in the Bi’guiyuan residential area of Balitai Town, Jinnan District, Tianjin City. It reveals the spatiotemporal characteristics of this rapid subsidence and provides a preliminary analysis of its causes. It is speculated that the incident is due to improper drilling operations for geothermal wells, which penetrated a large karst cave (geological cavity) layer, leading to well leakage. The drilling fluid rapidly leaked into the cavity, causing the overlying sandy soil layers to also collapse into the cave under the pressure differential. This resulted in the occurrence of rapid subsidence. This study only provides an initial exploration and analysis of the subsidence patterns and movements. However, due to the complex geological structure, not all underground movements (such as well leakage or other soil layers entering the cave) can be directly observed as surface deformation through InSAR. Therefore, further in-depth inversion studies of the geological structure in the area are still needed. Apart from this, currently, there is no evidence to suggest that the subsidence has completely ceased. Long-term monitoring of the area is still necessary to analyze the stability and safety of the buildings.
Author Contributions
Conceptualization, H.J., J.L. and V.M.; methodology, H.J.; validation, H.J. and J.L.; formal analysis, H.J.; investigation, H.J.; resources, H.J.; data curation, J.L.; writing—original draft preparation, H.J. and V.M.; writing—review and editing, T.B.; visualization, H.J.; supervision, T.B.; funding acquisition, T.B. All authors have read and agreed to the published version of the manuscript.
Funding
This work is funded by the National Natural Science Foundation of China (grant number 42250610212) and the China Scholarship Council (No. 202106270150 and No. 202208210275).
Institutional Review Board Statement
Not applicable.
Informed Consent Statement
Not applicable.
Data Availability Statement
The Sentinel-1 data are copyright of the European Spaace Agency and were provided by Alaska Satellite Facility (ASF, https://search.asf.alaska.edu (accessed on 15 March 2023)). SRTM DEM was collected from NASA Earth science data (EARTHDATASEARCH, https://search.earthdata.nasa.gov/search (accessed on 15 March 2023)). GACOS Products were obtained from Generic Atmospheric Correction Online Service for InSAR (GACOS, http://www.gacos.net/ (accessed on 15 March 2023)).
Conflicts of Interest
The authors declare no conflict of interest.
References
- Herrera, G.; Ezquerro, P.; Tomás, R.; Bejar, M.; Vinielles, J.L.; Rossi, M.; Mateos, R.; Carreon, D.; Lambert, J.; Teatini, P.; et al. Mapping the global threat of land subsidence. Science 2020, 371, 34–36. [Google Scholar] [CrossRef] [PubMed]
- Liu, P.; Li, Q.; Li, Z.; Hoey, T.; Liu, G.; Wang, C.; Hu, Z.; Zhou, Z.; Singleton, A. Anatomy of Subsidence in Tianjin from Time Series InSAR. Remote Sens. 2016, 8, 266. [Google Scholar] [CrossRef]
- Jiang, H.; Balz, T.; Cigna, F.; Tapete, D. Land Subsidence in Wuhan Revealed Using a Non-Linear PSInSAR Approach with Long Time Series of COSMO-SkyMed SAR Data. Remote Sens. 2021, 13, 1256. [Google Scholar] [CrossRef]
- Jiang, H.; Balz, T.; Cigna, F.; Tapete, D.; Li, J.; Han, Y. Multi-sensor InSAR time series fusion for long-term land subsidence monitoring. Geo-Spat. Inf. Sci. 2023, 1–17. [Google Scholar] [CrossRef]
- Lixin, Y.; Fang, Z.; He, X.; Shijie, C.; Wei, W.; Qiang, Y. Land subsidence in Tianjin, China. Environ. Earth Sci. 2011, 62, 1151–1161. [Google Scholar] [CrossRef]
- Zhu, C.; Zhang, Y.; Zhang, J.; Zhang, L.; Long, S.; Wu, H. Recent subsidence in Tianjin, China: Observations from multi-looking TerraSAR-X InSAR from 2009 to 2013. Int. J. Remote Sens. 2015, 36, 5869–5886. [Google Scholar] [CrossRef]
- Li, D.; Hou, X.; Song, Y.; Zhang, Y.; Wang, C. Ground Subsidence Analysis in Tianjin (China) Based on Sentinel-1A Data Using MT-InSAR Methods. Appl. Sci. 2020, 10, 5514. [Google Scholar] [CrossRef]
- Liu, J.; Song, M.; Tian, G. Development Situation of the Geothermal Resources and Suggestion on Sustainable Development Utilization in Tianjin. Geol. Surv. Res. 2012, 35, 67–73. [Google Scholar]
- Allis, R.; Bromley, C.; Currie, S. Update on subsidence at the Wairakei-Tauhara geothermal system, New Zealand. Geothermics 2009, 38, 169–180. [Google Scholar] [CrossRef]
- Li, Y.; Zhang, J.; Li, Z.; Luo, Y.; Jiang, W.; Tian, Y. Measurement of subsidence in the Yangbajing geothermal fields, Tibet, from TerraSAR-X InSAR time series analysis. Int. J. Digit. Earth 2016, 9, 697–709. [Google Scholar] [CrossRef]
- Tianjin Municipal Bureau of Planning and Natural Resources Mineral Resources Management Division. Tianjin Jinan District, Tianjin 52 Block Geothermal Prospecting Rights Auction Results Public; Tianjin Municipal Bureau of Planning and Natural Resources Mineral Resources Management Division: Tianjin, China, 2022.
- Berardino, P.; Fornaro, G.; Lanari, R.; Sansosti, E. A new algorithm for surface deformation monitoring based on small baseline differential SAR interferograms. IEEE Trans. Geosci. Remote Sens. 2002, 40, 2375–2383. [Google Scholar] [CrossRef]
- Yu, C.; Li, Z.; Penna, N.T.; Crippa, P. Generic Atmospheric Correction Model for Interferometric Synthetic Aperture Radar Observations. J. Geophys. Res. Solid Earth 2018, 123, 9202–9222. [Google Scholar] [CrossRef]
- Yu, C.; Li, Z.; Penna, N.T. Interferometric synthetic aperture radar atmospheric correction using a GPS-based iterative tropospheric decomposition model. Remote Sens. Environ. 2018, 204, 109–121. [Google Scholar] [CrossRef]
- Morishita, Y.; Lazecky, M.; Wright, T.; Weiss, J.; Elliott, J.; Hooper, A. LiCSBAS: An Open-Source InSAR Time Series Analysis Package Integrated with the LiCSAR Automated Sentinel-1 InSAR Processor. Remote Sens. 2020, 12, 424. [Google Scholar] [CrossRef]
- Qian, H.; Wang, J.; Sun, Y.; Wang, Z.; Yuan, B. Analysis of leakage formation and selection of leaking stoppage methods in geothermal well drilling in Tianjin area. Geol. Surv. Res. 2016, 39, 226–230. [Google Scholar]
- Martel, R.; Castellazzi, P.; Gloaguen, E.; Trépanier, L.; Garfias, J. ERT, GPR, InSAR, and tracer tests to characterize karst aquifer systems under urban areas: The case of Quebec City. Geomorphology 2018, 310, 45–56. [Google Scholar] [CrossRef]
- The Ministry of Housing and Urban-Rural Development of the People’s Republic of China. General Code for Foundation Engineering of Building and Municipal Projects; The Ministry of Housing and Urban-Rural Development of the People’s Republic of China: Beijing, China, 2023.
- Feng, Y.; Jiang, S.; Hu, S.; Li, S.; Lin, C.; Xie, X. Sequence stratigraphy and importance of syndepositional structural slope-break for architecture of Paleogene syn-rift lacustrine strata, Bohai Bay Basin, E. China. Mar. Pet. Geol. 2016, 69, 183–204. [Google Scholar] [CrossRef]
- Minissale, A.; Borrini, D.; Montegrossi, G.; Orlando, A.; Tassi, F.; Vaselli, O.; Huertas, A.D.; Yang, J.; Cheng, W.; Tedesco, D.; et al. The Tianjin geothermal field (north-eastern China): Water chemistry and possible reservoir permeability reduction phenomena. Geothermics 2008, 37, 400–428. [Google Scholar] [CrossRef]
- Yao, Z.; Guo, Z.; Xiao, G.; Wang, Q.; Shi, X.; Wang, X. Sedimentary history of the western Bohai coastal plain since the late Pliocene: Implications on tectonic, climatic and sea-level changes. J. Asian Earth Sci. 2012, 54-55, 192–202. [Google Scholar] [CrossRef]
Figure 1.
Research Area map. Map of Tianjin is shown in (a) and the red dot in Jinnan District represents the specific location of the event. The Red polygon in (b) is the boundary of the district where the sudden subsidence occurred, and the green rectangle is the boundary of Geothermal Field No. 52. Field investigation is depicted in (c), showing the damage caused by the event. Photograph credits: China Central Television (CCTV).

Figure 2.
Graph of the temporal network used for InSAR time-series analysis. Red line marks the time of the sudden ground subsidence event.
Figure 2.
Graph of the temporal network used for InSAR time-series analysis. Red line marks the time of the sudden ground subsidence event.

Figure 3.
Cumulative subsidence map of research area. The three different colored triangles in (a) are the three reference points extracted, and their time series are represented by the same color in (b). The blue shaded area in (b) is noted as the event period.
Figure 3.
Cumulative subsidence map of research area. The three different colored triangles in (a) are the three reference points extracted, and their time series are represented by the same color in (b). The blue shaded area in (b) is noted as the event period.

Figure 4.
A simplified Geological profile of Tianjin and and schematic diagram of wellbore leakage process.
Figure 4.
A simplified Geological profile of Tianjin and and schematic diagram of wellbore leakage process.

Disclaimer/Publisher’s Note: The statements, opinions and data contained in all publications are solely those of the individual author(s) and contributor(s) and not of MDPI and/or the editor(s). MDPI and/or the editor(s) disclaim responsibility for any injury to people or property resulting from any ideas, methods, instructions or products referred to in the content. |
© 2023 by the authors. Licensee MDPI, Basel, Switzerland. This article is an open access article distributed under the terms and conditions of the Creative Commons Attribution (CC BY) license (https://creativecommons.org/licenses/by/4.0/).
Share and Cite
MDPI and ACS Style
Jiang, H.; Balz, T.; Li, J.; Mishra, V. Preliminary Investigation of Sudden Ground Subsidence and Building Tilt in Balitai Town, Tianjin City, on 31 May 2023. Remote Sens. 2023, 15, 4891. https://doi.org/10.3390/rs15194891
AMA Style
Jiang H, Balz T, Li J, Mishra V. Preliminary Investigation of Sudden Ground Subsidence and Building Tilt in Balitai Town, Tianjin City, on 31 May 2023. Remote Sensing. 2023; 15(19):4891. https://doi.org/10.3390/rs15194891
Chicago/Turabian StyleJiang, Haonan, Timo Balz, Jianan Li, and Vishal Mishra. 2023. "Preliminary Investigation of Sudden Ground Subsidence and Building Tilt in Balitai Town, Tianjin City, on 31 May 2023" Remote Sensing 15, no. 19: 4891. https://doi.org/10.3390/rs15194891
Note that from the first issue of 2016, this journal uses article numbers instead of page numbers. See further details here.