
Using the Commercial GNSS RO Spire Data in the Neutral Atmosphere for Climate and Weather Prediction Studies

1
NOAA National Environmental Satellite, Data, and Information Service, Center for Satellite Applications and Research, College Park, MD 20740, USA
2
Global Science & Technology, Inc., 7855 Walker Drive, Suite 200, Greenbelt, MD 20770, USA
3
Cooperative Institute for Satellite Earth System Studies (CISESS), Earth System Science Interdisciplinary Center, University of Maryland, College Park, MD 20740, USA
*
Author to whom correspondence should be addressed.
Remote Sens. 2023, 15(19), 4836; https://doi.org/10.3390/rs15194836
Submission received: 16 August 2023
/
Revised: 26 September 2023
/
Accepted: 3 October 2023
/
Published: 5 October 2023
(This article belongs to the Special Issue Editorial Board Members’ Collection Series: “Recent Progress of GNSS/GPS Radio Occultation Techniques”)
Abstract
:Recently, the NOAA has included GNSS (Global Navigation Satellite System) Radio Occultation (RO) data as one of the crucial long-term observables for weather and climate applications. To include more GNSS RO data in its numerical weather prediction systems, the NOAA Commercial Weather Data Pilot program (CWDP) started to explore the commercial RO data available on the market. After two rounds of pilot studies, the CWDP decided to award the first Indefinite Delivery Indefinite Quantity (IDIQ) contract to GeoOptics and Spire Incs. in 2020. This study examines the quality of Spire RO data products for weather and climate applications. Spire RO data collected from commercial CubeSats are carefully compared with data from Formosa Satellite Mission 7–Constellation Observing System for Meteorology, Ionosphere, and Climate-2 (COSMIC-2), the fifth-generation European Centre for Medium-Range Weather Forecasts (ECMWF) atmospheric reanalysis (ERA5), and high-quality radiosonde data. The results demonstrate that, despite their generally lower Signal-Noise-Ratio (SNR), Spire RO data show a pattern of lowest penetration height similar to that of COSMIC-2. The Spire and COSMIC-2 penetration heights are between 0.6 and 0.8 km altitude over tropical oceans. Although using different GNSS RO receivers, the precision of Spire STRATOS receivers is of the same quality as those of the COSMIC-2 TriG (Global Positioning System—GPS, GALILEO, and GLObal NAvigation Satellite System—GLONASS) RO Receiver System (TGRS) receivers. Furthermore, the Spire and COSMIC-2 retrieval accuracies are quite comparable. We validate the Spire temperature and water vapor profiles by comparing them with collocated radiosonde observation (RAOB) data. Generally, over the height region between 8 km and 16.5 km, the Spire temperature profiles match those from RS41 RAOB very well, with temperature biases of <0.02 K. Over the height range from 17.8 to 26.4 km, the temperature differences are ~−0.034 K, with RS41 RAOB being warmer. We also estimate the error covariance matrix for Spire, COSMIC-2, and KOMPSAT-5. The results show that the COSMIC-2 estimated error covariance values are slightly more significant than those from Spire over the oceans at the mid-latitudes (45°N–30°N and 30°S–45°S), which may be owing to COSMIC-2 SNR being relatively lower at those latitudinal zones.
1. Introduction
GNSS (Global Navigation Satellite System) Radio Occultation (RO) data provide unique measurements of atmospheric density’s vertical distribution, which is a function of the temperature, moisture, and pressure in the neutral atmosphere [1,2,3]. The studies in [4,5] demonstrated that the RO-derived temperature profiles in the lower stratosphere and water vapor profiles in the troposphere are instrumental in identifying the calibration biases from the satellite Infrared (IR) and Microwave (MW) sensors, respectively. Raw RO observation is essentially the measurement of the time delay resulting from the passage of the radio wave through the Earth’s atmosphere between the GNSS RO emitters and receivers. The RO receivers are onboard Low Earth Orbit (LEO) satellites. Unlike IR and MW sensors, RO measurements are of a very high vertical resolution (~300–600 m) and are unaffected by clouds and precipitation [1,2]. As a result, RO data products are very suitable for atmospheric studies of all weather conditions [5,6,7,8,9,10,11,12,13,14,15,16,17,18,19]. In addition, because the clocks on GNSS and LEO satellites are traceable to the International System of Unit (SI) of time (SI-traceable), RO data are also extremely stable, which is very suitable for climate studies [20,21,22,23,24,25,26,27,28]. In global operational numerical weather prediction (NWP) centers, GNSS RO data are used as in-space references to correct other satellite data [1,2,29].
Many new GNSS RO missions have been launched within the past five years, implementing different RO receivers and covering different orbits. These new missions have included Taiwan/US Formosat-7/Constellation Observing System for Meteorology, Ionosphere, and Climate-2 (COSMIC-2), the European Space Agency (ESA)/European Organisation for the Exploitation of Meteorological Satellites (EUMETSAT)/US Sentinel-6, and commercial RO missions from GeoOptics Inc. (Pasadena, CA, USA) and Spire Global Inc. (Boulder, CO, USA) [30]. The NOAA has included GNSS RO data as one of the crucial long-term observables for weather and climate applications, just as those from IR and MW measurements [30,31]. The NOAA National Center for Environmental Prediction (NCEP) has assimilated RO data from NOAA missions (i.e., COSMIC-2 and Sentinel-6) and partners’ missions (i.e., Korea Multi-Purpose Satellite/Arirang-5 (KOMPSAT-5), Meteorological Operational Satellite-A, -B, and -C (Metop-A, -B, and -C)) into their NWP system. Around 10 K daily occultation profiles were ingested into the NCEP global NWP system. These RO data have demonstrated apparent impacts on the NCEP global NWP, especially in the lower stratosphere [29]. The International Radio Occultation Working Group (IROWG) from the World Meteorology Organization (WMO) recommend that the optimal occultation number for NWP and climate applications is at least 20 K per day, with a uniform spatial and temporal distribution [30].
To include more GNSS RO data in its NWP systems, the NOAA initiated the Commercial Weather Data Pilot (CWDP) program to assess the quality of the commercial GNSS RO data available on the market. After two rounds of pilot studies, the CWDP decided to award the first Indefinite Delivery Indefinite Quantity (IDIQ) contract to GeoOptics and Spire Incs. in 2020. Unlike nationally supported RO missions with more expensive receivers and larger antennae (see below), GeoOptics and Spire used CubeSats. Using the miniature 6U CubeSat version onboard the Community Initiative for Cellular Earth Remote Observation (CICERO) satellites, GeoOptics can collect from approximately 1000 to 2000 occultation profiles per day. While GeoOptics data are collected from a few CubeSats, Spire GNSS RO data are collected from over thirty CubeSats. Currently, Spire can collect around 20 K occultation profiles per day. COSMIC-2 used the TriG (Global Positioning System—GPS, GALILEO, and GLObal NAvigation Satellite System—GLONASS) RO Receiver System (TGRS) receiver. The Spire STRATOS RO antenna–receiver payload can track GNSS signals from GPS, GLONASS, GALILEO, and Quasi-Zenith Satellite System (QZSS).
Ref. [30] stated that whether RO data from commercial CubeSats are of the same quality as those from other previous validated RO missions (i.e., Formosa Satellite Mission 3–Constellation Observing System for Meteorology, Ionosphere, and Climate (COSMIC-1 hereafter) [1,2,3,4,5,6,7,8,9,10,11,12,13,14,15,16,17,18,19,20], COSMIC-2 [21], etc.), so that we can still use them for climate and weather prediction studies [5,6,7,8,9,10,11,12,13,14,15,16,17,18,19,20,21,22,23,24,25,26,27,28,29], is the most pressing issue for the RO community. The specific questions we need to answer include the following:
- (1)
- Does lower signal-noise ratio (SNR) commercial CubeSat RO data lead to lower precision and more significant observation errors? The SNR is defined as the magnitude of the RO signals divided by the noise level from the receiver in the voltage-to-voltage unit (v/v). The SNR of the RO signal is one of the critical parameters that indicates the quality of RO measurements (i.e., time delay and excess phases) and Level 2 (L2) data products (i.e., bending angle (BA), refractivity, temperature, and moisture profiles). When RO signals are stronger or the noise level is smaller, the magnitude of the SNR will be larger, which may indicate an improved observation quality. While COSMIC-1 and COSMIC-2 used an antenna of two feet, the antenna from CubeSat is only one foot. Figure 1 depicts the SNR histograms of Spire, COSMIC-2, and KOMPSAT-5 for different GNSS RO emitters. The sample numbers are normalized to the maximum number of the SNR bin. With the TGRS receiver, COSMIC-2 has a larger mean SNR than that of Spire and KOMPSAT-5. The mean COSMIC-2 L1 SNR ranges from 250 to 2500 v/v [31,32], while the L1 SNR for Spire ranges from 200 v/v to 1500 v/v, lower than that from COSMIC-2 (Figure 1). The mean L1 SNR for KOMPAST-5 is 570 v/v. With a higher SNR than that of other RO missions, COSMIC-2 is expected to penetrate deeper into the lower troposphere [30,31,32,33].
- (2)
- Does lower-SNR Spire RO data lead to less accurate retrieval results? Whether the RO data products derived from lower SNR signals obtained from commercial CubeSats are as accurate as those from high SNR signals is a significant concern for the RO community and climate and atmospheric scientists. The causes of retrieval uncertainty may include receiver quality, antenna geometry, the accuracy of the Precise Orbit Determination (POD) estimation, L0 to L1a processing, L1a-L1b (excess phase) processing, and L1b-L2 (bending angle and refractivity profiles) processing [33].
- (3)
- How do we optimize the Spire RO data in the NWP data assimilation (DA) system? As mentioned above, because the RO bending angle and refractivity uncertainty, especially in the lower troposphere, are highly related to the atmospheric condition, we must carefully examine the observation uncertainty for each RO mission to use the RO data optimally in NWP DA algorithms.
The objective of this study is to precisely characterize the quality of the Spire CubeSats data in the neutral atmosphere in terms of their (i) precision, (ii) stability, and (iii) retrieval accuracy and uncertainty [2]. Many studies [34,35,36,37,38,39,40,41,42] have reported on the quality of Spire-retrieved data products using collocated in situ radiosondes, satellite observations, or reanalysis data interpolated onto RO locations. For example, Ref. [34] compared Spire-simulated brightness temperatures (BTs) with collocated measurements from NOAA-20 Advanced Technology Microwave Sounder (ATMS). However, because the quality of ATMS BTs (and in situ radiosonde, see Section 4.3) may be affected by the solar viewing angle [2,26], the quality of ATMS BTs may vary between day and night. Refs. [23,24,25] suggested that the best approach to quantifying the retrieval accuracy and uncertainty of one RO mission is to compare them with independent retrievals from another RO mission and compare the RO–RO pairs with other references. In addition, because RO data quality and retrieval uncertainty may also be affected by atmospheric conditions and viewing geometry, especially in the lower troposphere, to eliminate representative errors, the best approach is to conduct coplanar RO–RO comparisons.
The NOAA Center for Satellite Applications and Research (STAR) has developed capabilities as a GNSS RO science and data center (STAR RO DSC, see https://www.star.nesdis.noaa.gov/smcd/GNSSRO/RO/index.php, access on 1 June 2023), also see [31,33,43]). STAR RO DSC aims to develop enterprise RO-processing algorithms for all RO missions, like other NOAA infrared and microwave satellite missions. STAR has developed the RO inversion package for COSMIC-2 [33,43,44,45,46,47,48,49]. In addition to the Spire RO data processed by UCAR, STAR has also processed Spire data using an independently developed inversion package (see Appendix A).
In this study, we will compare STAR-processed Spire products with those from UCAR to evaluate the uncertainty due to the differences in the implementations of processing algorithms. We will examine the Spire data quality during the CWDP Delivery-Order 3 (DO3, from 8 September 2021 to 15 March 2022) and Delivery-Order 4 (DO4, from 16 March 2022 to 16 January 2023) periods. The NOAA purchased about 3000 Spire RO profiles daily in DO3 and about ~5000–6000 in DO4 (access on 1 June 2023). We will conduct a quality assessment of the UCAR Spire neutral atmospheric profiles regarding their stability, precision, and accuracy. To better compare the RO retrieval profiles from two missions, we develop an efficient simultaneous limb overpass RO (SRO) method for predicting and collecting RO limb-sounding events between GNSS emitters and LEO RO receivers for inter-satellite comparison purposes [32]. The procedures for obtaining coplanar SRO pairs were introduced by [32,50]. Because the Spire satellites are in the Sun-synchronized orbits that cover the globe, we can collect many coplanar Spire–Spire pairs and Spire–COSMIC-2 pairs at all latitudes during the performance period, which is critical for examining the climate quality for RO data.
We first describe the Spire data spatial and temporal distribution in Section 2. We also detail the data used to validate the Spire retrievals and present the SRO method for our studies to collect the Spire–Spire pairs, Spire–other-RO-mission pairs, and COSMIC-2–COSMIC-2 pairs in Section 2. We quantify the Spire penetration, precision, and stability in Section 3. Section 4 quantifies the UCAR Spire retrieval accuracy and uncertainties using STAR Spire retrievals, the fifth-generation European Centre for Medium-Range Weather Forecasts (ECMWF) atmospheric reanalysis (ERA5), and RS41 radiosondes. We further estimate the Spire error covariance matrix for the NWP data assimilation system in Section 5. We discuss the results in Section 6 and conclude this paper in Section 7.
2. Data and Methodology
2.1. Spatial and Local Time Distribution of Spire and Other RO Missions
In the Spire constellation, there were thirty satellites providing RO observations during the DO3 and DO4 periods, where twenty-five satellites were in high-inclination-angle orbit covering the globe and five satellites were in low-inclination-angle orbit covering mid-latitude and tropical regions (see below). To demonstrate the spatial distribution for different RO missions, we generate the RO sample numbers for each 5° × 5° gridbox for Spire, COSMIC-2, and KOMPSAT-5 for the whole DO3 period in Figure 2a–c, respectively. Figure 2 depicts that, while Spire and KOMPSAT-5 have a global spatial distribution, COSMIC-2 data cover mainly from 45°N to 45°S, where more than 70% of the COSMIC-2 data are within 15°N to 15°S. The observation numbers at each box are indicated by the color bar. Although the CWDP purchased more Spire data in DO4 than in DO3, the spatial distribution for the Spire DO4 data is very similar to that in Figure 2a. Please note that the lower Spire observation number over eastern Europe, particularly in the region bounded by 60°N–30°N and 30°E and 45°E, as shown in Figure 2a, is primarily attributed to the adverse conditions resulting from the Russo–Ukrainian conflict, which have led to a poor performance of GPS/GALILEO signals in this area.
Figure 3a–c show the local time distribution for the DO3 period binned at every 5° latitude and every local time for the Spire, COSMIC-2, and KOMPSAT-5 observations, respectively. Since COSMIC-2 satellites have a low inclination angle (24°), the observation can cover all latitudes within [45°S, 45°N] for a given local time (Figure 3b). While the KOMPSAT-5 observations are mainly distributed at 5–7 and 17–19 local time, the Spire observations are primarily distributed at 2–3, 9–10, 14–15, and 21–22 local time. The temporal distribution of the COSMIC-2 data exhibits a uniform spread within [45°N, 45°S]. In contrast, the Spire and KOMPSAT-5 data are notably concentrated around specific local times.
2.2. Spire Signal-to-Noise (SNR) Latitudinal Distribution
We usually use the SNR to indicate the strength of RO signals in penetrating the lower troposphere (see Section 3.1). Note that many factors affect the magnitude of SNRs and their spatial distribution. The most dominant factors include (i) the GNSS emitter’s signal power, (ii) the receiver intermediate frequency bandwidth, (iii) the RO antenna design, (iv) the antenna gain pattern related to the viewing geometry, and (v) the azimuth angle (the angle between the occultation plane and the direction to the true north). Each Spire flight module is equipped with a STRATOS GNSS RO receiver with a high-gain side-mounted antenna for both the L1 and L2 frequencies. With the antenna beam peak at a 20° electronic beam tilt and about a 36° vertical beamwidth [51], the Spire SNRs for GPS, GLONASS, and GALILEO are uniformly distributed at all latitudes (Figure 4), where the Spire SNR from GLONASS is higher than those from GPS and GALILEO. The mean Spire SNRs for the tracking from GPS, GLONASS, and GALILEO are equal to around 300 v/v, 850 v/v, and 250 v/v, respectively.
However, with different antenna geometry, the spatial distribution of the COSMIC-2 SNR differs from that of Spire. Each of the COSMIC-2 flighting modules equip two TGRS RO antennas, one forward antenna (+X), and one backward antenna (–X). Unlike Spire’s side-mounted RO antenna, the COSMIC-2 RO antenna points to the nadir, and the position-tracking antenna points to the sideway. Because the COSMIC-2 forward and backward antennas are within [23°, 66°] and [115°, 158°], respectively [32], the RO sample distribution has a maximum RO event at 24° for the forward antenna and 157° for the backward. As a result, the COSMIC-2 SNR is smaller in the mid-latitude (see Figure 5) and it has a broader distribution (from 200 v/v to 2000 v/v) from 30°N–30°S. The COSMIC-2 event distribution as a function of the antenna view angle was also shown by [32]. The geolocation distribution of the COSMIC-2 SNR may affect the COSMIC-2 penetration depth at different latitudes (see Section 3.1).
2.3. UCAR RO Data, STAR-Processed Spire Data, Global Radiosonde Data, and Reanalysis Data
This study examines the Spire data processed by UCAR. The other RO missions used in the Spire–RO comparisons, including COSMIC-1, COSMIC-2, KOMPSAT-5, PAZ, Metop-B, Metop-C, and TerraSAR-X, are also downloaded from UCAR. A general description of the UCAR inversion package and quality control procedures are detailed at http://cdaac-www.cosmic.ucar.edu/cdaac/doc/documents/Sokolovskiy_newroam.pdf (access on 1 June 2023), and are not further described. Any UCAR data flagged as “bad” are not used in this study.
To further evaluate the UCAR Spire RO data, we compared the UCAR Spire data with those derived from the STAR independently developed inversion package. The STAR RO package was designed to quantify the observation uncertainty propagation from the clock error and geometry determination to the bending angle/refractivity and temperature/humidity profiles [33]. The package consists of the GNSS RO L1a (phase and pseudo-range) to L1b (excess phase) processing modules (see Appendix), Full-Spectrum Inversion (FSI) based from L1b to L2 (bending angle and refractivity) data inversion module [43], and the neutral atmospheric temperature and humidity profiles derived by using the one-dimension variational (1D-Var) inversion module [45]. We compared the STAR-processed Spire bending angle data with those from UCAR to quantify the retrieval structure uncertainty due to the differences in the algorithm implementations [22,23,24,25].
In this study, we will evaluate the UCAR Spire RO temperature and water vapor accuracy and uncertainty through a comparison with Vaisala RS41 radiosonde observation (RAOB) data, which were downloaded from the National Center of Environmental Prediction (NCEP) Automated Data Processing (ADP) Global Upper Air Observational Weather Data (ds351.0, https://rda.ucar.edu/datasets/ds351.0, accessed on 20 July 2023). As mentioned in [26,31], the RAOB measurement quality may vary with the sensor types. The RAOB temperature measurements are affected by the solar radiation effect on the sensor [26]. Introduced in 2013, the Vaisala RS41 is currently the most accurate radiosonde observation system, which has an improved precision and accuracy compared to RS92 (see [26,31]). With an advanced manufacturer’s correction, the RS41 radiation effect on the sensor is significantly diminished compared to RS92. The NCEP RAOB dataset contains information such as pressure, geopotential height, air temperature, dew point temperature, wind direction, and wind speed. Including a few significant levels, the radiosonde data are available at up to 20 mandatory levels, ranging from 1000 millibars to about 10 millibars. Complete daily data can be downloaded in Binary Universal Form for the Representation of Meteorological Data (BUFR) format. The software library NCEPLIBS-bufr (also often referred to as BUFRLIB) is used in this study to decode the BUFR radiosonde data.
This study also uses ERA5 reanalysis model data as the background for the observation-minus-background (O-B) (Spire vs. ERA5) bending angle/refractivity difference and uncertainty analysis. The data used in this paper have been gridded to a regular latitude–longitude grid of 0.25 degrees for the reanalysis. ERA5 is updated daily with a latency of about five days. The background data from ERA5 used for the comparison with Spire are refractivity as a function of geopotential height and bending angle as a function of impact parameter. The O-B comparison requires forward modeling to derive the refractivity/bending angle from the atmospheric background temperature, humidity, and pressure profiles. In the forward modeling, refractivity is first calculated from the interpolated pressure, temperature, and water vapor profiles and then converted into the refractive index n to compute the bending angle using the Abel integral.
2.4. SRO Methodology and Approaches to Collecting Coplanar Spire–RO Data
The procedures for obtaining the simultaneous limb overpass RO (SRO) events from two receivers on different LEOs with the same GNSS satellite are illustrated in Figure 6 and detailed in [32]. The SRO-based RO data quality intercomparing helps to address the needs of quick inter-calibration, validation, and quality assurance of Small Satellite-based multi-RO sensors, particularly in the era of an increasing number of RO sensors being paired with augmented GNSS satellites. The first step in the SRO prediction module is using the Simplified orbital Perturbation Model (SGP4) with the satellite orbital Two-Line Element (TLE) as an input to predict the positions and velocities of LEOs or GNSS satellites. By establishing a functional relationship between the RO profile impact height and the direct height learned from past RO sounding events, the prediction algorithm solves four coupled equations (derived from the locations of a given pair of LEO and GNSS satellites) at each instant to predict the time and location (longitude and latitude) of the rising or setting RO limb-sounding events. The prediction module is validated with COSMIC-2 RO observations regarding the ground track, RO events number, and RO event distribution as a function of the antenna viewing angle [32]. In the SRO prediction, the TLEs from three satellites (two LEOs, LEO1 and LEO2, and one GNSS) for a given period are used as inputs for the RO prediction method. The RO prediction method generates two datasets, one for the receiver LEO1 and specific GNSS transmitter (i.e., GNSS_A hereafter), and the other for the receiver LEO2 and the same transmitter GNSS_A. These two datasets contain potential RO events, each comprising the calculated RO occurrence times and positions. The criteria for pairing RO events include a time window of less than 20 min and a distance of less than 200 km between RO event positions. The predicted SRO times are then used to identify the SRO events between LEO1 and LEO2 by searching and matching the time tag in the filenames of the RO atmospheric Profile (atmPrf) data products. The main advantage of SRO comparisons of RO data products is that the method significantly reduces collocation uncertainties due to a much shorter time (20 min) and minor atmospheric path differences in comparison to traditional RO comparisons (within a 3 h time window). The SRO events are very close to the coplanar. The UCAR-processed Spire data are collected and assessed in this study. We collected over 16,000 Spire–COSMIC-2 SRO pairs and 8000 Spire–Metop GRAS coplanar pairs since 2020 during the DO3 and DO4 periods.
The Spire–RO pairs are collected within 20 min and 200 km using the latitude and longitude information at a 5 km altitude for each RO profile. We specified the approach to generate the error covariance matrix in the DA system in Section 5.
3. Assessment of Spire Data Characteristics
This section assesses the Spire data characteristics regarding penetration, precision, and stability. We summarized the penetration height (cut-off height) of Spire and COSMIC-2 in Section 3.1. We used the SRO method to collect the Spire–Spire and COSMIC2–COSMIC-2 pairs and calculate their precision in Section 3.2. We also use the SRO approach to collect Spire–other-RO-mission pairs and quantify the Spire stability in Section 3.3.
3.1. The Lowest Penetration Height
In RO inversion procedures, it is essential to use RO tracking information and the derived excess phase to determine the cut-off height for RO retrievals. This ensures the optimal retrieval of the RO bending angles and refractivity profiles [33]. Therefore, the lowest penetration height is an essential indicator of the RO data quality. The lowest penetration height of RO tracking is usually related to the data’s SNR and the atmosphere’s dryness. Generally, observations with a higher SNR usually penetrate deeper than those with a lower SNR [31]. Figure 7a,b depict the global mean of the lowest penetration height in June 2022 binned into a 5° × 5° grid for COSMIC-2 (from 45°N–45°S) and Spire (from 90°N–90°S), respectively. With a 200 km horizontal resolution, the RO’s lowest penetration height may be affected by mountains and uneven topography along the tracks. Here, we showed the penetration height only over oceans. Figure 7 shows that, although, in general, COSMIC-2 has a relatively more uniform spatial distribution than Spire, the pattern of the lowest penetration height for COSMIC-2 is similar to that for Spire. The Spire and COSMIC-2 data generally penetrate the lower troposphere at higher (and drier) latitudes. The Spire and COSMIC-2 penetration heights are from around 0.6 to 0.8 km near the tropical region. The lowest penetration heights for Spire are from approximately 0.2 to 0.3 km altitude at mid-latitudes and high latitudes (Figure 7a).
Figure 8 depicts the penetration heights for different RO missions over oceans within [45°N, 45°S] during the DO3 period. It shows that the Spire data penetrate to a similar height as those of COSMIC-2 over oceans within this latitude range. Although not shown, the Spire data penetration heights are also very close to those of COSMIC-2 over land.
Table 1 summarizes the lowest penetration heights of 80% of the total data (defined as the 80% penetration height) for different RO missions in different latitudinal zones during the DO3 period. The Spire 80% penetration height is slightly higher than that of COSMIC-2 in latitudinal zones within [10°N, 10°S], but they are the same for the latitudinal zones of [30°N, 10°N] and [10°S, 30°S]. Spire has lower penetration heights than COSMIC-2 in the latitudinal zones of [30°S, 45°S] and [45°N, 30°N]. This may be owed to COSMIC-2’s SNR being lower in those latitudinal zones (see Figure 5). Because of the frequent occurrence of super-refraction over most of the stratocumulus cloud-dominated areas (i.e., the southeast of the Pacific, Atlantic, and South China seas), the COSMIC-2 and Spire penetration heights are from about 0.5 to 0.8 km altitudes over those regions.
Although not shown, the SRO pairs of COSMIC-2 and Spire also showed that the Spire penetration height is about 100 m lower than that of COSMIC-2 in the latitudinal zones of [30°S, 45°S] and [45°N, 30°N]. The lowest penetration heights of 80% of the total data for the COSMIC-2 and Spire SRO pairs are very similar to those in Table 1 and are not further detailed here.
3.2. Precision
Precision is one of the most crucial qualities for using RO data in climate studies [1,2,3,4,5,20,21,22,23,24,25]. For climate analyses, the precision of RO data is quantified as the mean differences of the retrieved variables derived for SRO pairs when viewing the same emitter. The uncertainty of the mean (standard deviation, STD) at the vertical level indicates how well one can use RO data to detect climate signals. In [32] and [50], it was demonstrated how SRO pairs are matched. The coplanar (SRO pairs) eliminate the potential comparison uncertainty owing to the viewing geometry.
From about 26 to 30 satellites were in the Spire constellation over the DO3 and DO4 periods. Therefore, Spire provided plenty of opportunities for inter-comparisons of the RO observations between two flight modules from the SRO pairs. We collocated these observations from two receivers only 20 min and 200 km apart, but viewed the identical emitters. Figure 9 shows the fractional bending angle, dry temperature, and water vapor mixing ratio comparisons between the collocated Spire S128 and S119 receivers. The mean differences are very close to zero from the surface to a 40 km altitude for all three physical quantities. The standard deviations from the bending angle, dry temperature, and water vapor mixing ratio are similar to those from other RO missions, such as COSMIC-2 and COSMIC-1 [31]. Although it is not shown, the mean bending angle difference and STD of the differences for the SRO pairs between any Spire flight modules are consistent with those between S128 and S119. This indicates that the Spire receiver quality has a high precision.
Because the Spire SNR range varies when tracking different GNSS systems (see Figure 4), Figure 10 also examines how the Spire precision may differ with different SNR ranges. To see how the Spire precision may change when tracking other GNSS systems, we compare the fractional mean BA difference for Spire S124 and S120 from the surface to 40 km altitudes, but separated with GPS, GLONASS, and GALILEO, respectively (Figure 10a). The corresponding standard deviations and sample numbers at each vertical level are shown in Figure 10b,c, respectively. Although the SNRs from different emitter ranges are different, the mean differences for GPS, GLONASS, and GALILEO are all close to zero, with STDs of 1.81, 1.78, and 1.78, respectively.
Using a similar approach, we further compare the precision of Spire with that of COSMIC-2 and COSMIC-1. Because the uncertainty of the mean difference may vary with the atmospheric moisture distribution, we limit our comparisons to the same period from October 1 to November 30, but with different years and over the same latitudinal zones (the tropical region from 20°N–20°S, mid-latitudes from 20°S–45°S and 45°N–20°N) (Figure 11). The Spire, COSMIC-2, and COSMIC-1 data are collected from 2022, 2019, and 2006, respectively. In general, the STD of Spire is very close to that from COSMIC-2 over the tropical region, especially in the troposphere (Figure 11b). With fewer observations in the lower troposphere, the COSMIC-1 STD is smaller than that of Spire and COSMIC-2. The COSMIC-2 STDs over mid-latitudes are slightly more significant than those from Spire, which may be owed to their lower SNR over the same regions (see Figure 5). The Spire STD above a 10 km altitude is marginally larger than that of COSMIC-2 and COSMIC-1.
3.3. Stability
To quantify the stability of the Spire data, we compare the fractional bending angle profiles for the Spire–PAZ, Spire–KOMPSAT-5, Spire–Metop-B, Spire–Metop-C, and Spire–Terrsar-X SRO pairs during the DO4 period in this section (Figure 12). Although the satellite SNR and equator crossing time differ, we do not see a systematic difference for each Spire–RO comparison. Note that, with a higher SNR, the Spire–Metop-B/-C GRAS STD is smaller than that of Spire–other-RO-missions, especially above a 30 km altitude. Table 2 lists the mean BA fractional differences and corresponding standard deviations for the Spire–PAZ, Spire–KOMPSAT-5, Spire–Metop-B, Spire–Metop-C, and Spire–Terrsar-X SRO pairs from the surface to a 40 km altitude. With a higher SNR, the STD for Spire–Metop-B and Spire–Metop-C is smaller than that of the others above a 30 km altitude. The STDs for the Spire–Metop-B and Spire–Metop-C SRO pairs are 1.94% and 2.89%, respectively, and those for the Spire–PAZ, Spire–KOMPSAT-5, and Spire–TerraSAR-X SRO pairs are 3.25%, 3.20%, and 3.35%, respectively.
To see whether the retrieval quality of lower-SNR Spire may differ from that of COSMIC-2, we further compare the bending angle profiles between Spire and COSMIC-2 (Spire–COSMIC-2 SRO pairs) in the DO4 period for different COSMIC-2 SNR groups (i.e., 0–500 v/v, 500–1000 v/v, 1000–1500 v/v, 1500–2000 v/v, and >2000 v/v) in Figure 13. Table 3 lists the mean fractional BA differences, the standard deviations of the mean differences, and the sample numbers at a 10 km altitude for each of the five SNR groups for the Spire–COSMIC-2 SRO pairs.
The bending angle profiles generally show a good agreement between Spire and COSMIC-2 from 8 to 40 km, with an absolute mean of less than 0.2% and a standard deviation close to 4% for all five groups (see below). Above 30 km, the mean differences are minimal (less than 0.5%), but the standard deviations gradually increase with the height and reach 5% at 40 km. Below 10 km, the mean relative bending angle difference increases with a decreasing height and more significant oscillation toward the surface, owing to the sharp decrease in the sample pairs. At the same time, the standard deviations dramatically increase toward the lower-impact height and reach the maximum (~20%) at about 3 km. Below a 30 km impact height, there is no noticeable difference in the standard deviations for these five SNR groups. The COSMIC-2 SNR level slightly affects the mean bias at a low level. A higher COSMIC-2 SNR introduced a more negligible bias in the height range close to the surface; however, the standard deviations relative to the mean BA fractional Spire–COSMIC-2 differences for all five groups are all around 4.0% from the surface to a 40 km impact height, which is larger than those of the Spire–RO pairs (see Table 3).
4. Quantify the Spire Retrieval Accuracy and Uncertainty
While the above sections quantify the Spire retrievals’ penetration, precision, and stability, we assess the Spire retrieval accuracy and uncertainty from Section 4.1, Section 4.2 and Section 4.3. To evaluate the UCAR Spire bending angle quality, we compare them with the STAR Spire retrievals in Section 4.1. We interpolate the ERA5 refractivity profiles onto the locations and times of the Spire data and summarize the comparison results in Section 4.2. Because we also want to compare the Spire retrieval accuracy with that from COSMIC-2, we limit our comparisons from 45°N to 45°S in Section 4.2. We also compare the UCAR Spire global (90°N to 90°S) temperature and moisture profiles with those of the collocated RS41 measurements, mainly over lands and islands, in Section 4.3. We also generate the Spire–RS41 temperature and water vapor difference time series in the same section.
4.1. Initial Comparison of UCAR Spire Products with STAR Spire Retrievals
RO retrievals may vary when implementing different processing procedures [20,21,22,23,24,25]. To quantify the UCAR retrieval uncertainty owing to the RO processing, we also compare the UCAR Spire data with the STAR Spire retrievals (see Appendix A). STAR has become an RO processing and science center [31,33,34,49]. We developed RO inversion packages for COSMIC-1, KOMPSAT-5, COSMIC-2, and GeoOptics data [32,33]. In addition, we also developed a processing package for the CWDP Spire mission (see Appendix A). Like the approaches used to derive the COSMIC-2 data products, we use a similar inversion package to derive the STAR Spire bending angle and refractivity profiles. The STAR Spire BA is close to the ERA5 data interpolated at the Spire location and time.
Figure 14 shows that the relative bending angle difference between the STAR and UCAR Spire retrievals from an 8 km to 30 km altitude is close to zero. Table 4 lists the means and standards of the STAR–UCAR Spire fractional refractivity for GPS, GLONASS, and GALILEO from the surface to a 40 km altitude. The mean fractional refractivity difference is less than 0.06% from the surface to 40 km altitudes for the GPS, GLONASS, and GALILEO signals. GLONASS’s standard deviation is larger than GPS and GALILEO’s.
4.2. Assessment of the Spire Bending Angle Accuracy by Comparing with ERA5
With a similar lowest penetration height to that from COSMIC-2 (see Section 3.1), Spire data can also explore the atmosphere in the lower troposphere. Figure 15 shows the Spire–ERA5 and COSMIC-2–ERA5 BA fractional differences in different latitudinal zones from 45°N to 45°S. Here, the Spire–COSMIC-2 SRO pairs (compared to the ERA5 profiles interpolated onto the Spire–COSMIC-2 locations and times) are used in the comparisons. Figure 15 shows that, although the Spire data are of a lower SNR, there is no noticeable difference for the Spire–ERA5 and COSMIC-2–ERA5 pairs in different latitudinal zones. The Spire–COSMSIC-2 SRO pairs from 1 to 31 August 2022 are used in the comparisons.
We also compare the Spire–ERA5 and COSMIC-2–ERA5 BA comparisons for different SNR groups. Again, the mean differences for Spire–ERA5 and COSMIC-2–ERA5 have no significant differences among the five SNR groups.
4.3. Assessment of Spire Temperature and Water Vapor Accuracy by Comparing to RS41 Radiosonde Observation
Spire’s geographic location is determined by the longitude and latitude of the perigee point at the occultation point. This study collected collocated Spire retrievals and RS41 RAOB data within the position and time ranges of 150 km and 2 h, respectively. Any Spire RO profiles with a bad attribute flag (equal to 1) were excluded.
We collected 16 months of Spire and RAOB data covering the DO3 and DO4 periods. About 19,000 collocated Spire and RS41 pairs were collected for this study. We use the hydrostatic equation to convert the RAOB pressure level into the geometric height. Then, we interpolate the Spire temperature data to the radiosonde’s geometric heights at 8, 9.6, 11, 12.5, 14.5, 16.5, 17.5, 20, 23, 26.5, and 30 km altitudes for the temperature comparison. RO and RAOB humidity data are also interpolated to fixed levels for comparison, and the vertical sampling interval is 0.6 km over the height region of interest below 8.4 km. Using this approach, we maintain a high vertical resolution below 8.4 km for the humidity comparison.
Figure 16 shows the height-dependent mean temperature/humidity differences (UCAR Spire–RS41) and associated uncertainties. Table 5 shows the mean temperature differences over three height layers, e.g., 8–11 km, 12.5–16.5 km, and 17.8–26.4 km altitudes, which are derived from the comparison of the retrieval with the RS41 RAOB observations shown in Figure 16a.
Above a 4.2 km altitude, the humidity difference (Spire–RS41) between the UCAR Spire retrievals and RS41 RAOB is relatively small, equal to −0.04 g/kg (Figure 16c). Below 4.2 km, the UCAR Spire humidity retrievals deviate from the RS41 observations with increasing negative humidity differences approaching the surface, and the mean difference below 4.2 km reaches −0.19 g/kg. This may indicate systematic dry biases in the RO humidity retrievals due to the refractivity biases caused by the super-refraction near the Planetary Boundary Layer (PBL) when a high temperature and moisture gradients are present.
Table 5 also shows the mean humidity differences (uncertainties) over two height ranges (below and above 4.2 km) between the Spire retrievals and RS41. Generally, over the height region between 8 km and 16.5 km, the Spire temperature profiles match RS41 very well, with a mean temperature difference of <0.02 K. In the altitude range from 17.8 to 26.4 km, the average temperature difference is −0.01 K. However, small fluctuations can be seen in this height range, particularly a negative temperature difference (Spire temperature < RS41 temperature) over the height from 18 to 24 km.
Because the quality of RS41 may be affected by the solar zenith angle (SZA) (see [5]), we compare the Spire retrievals versus the RS41 observations for different SZA groups. The Spire–RS41 temperature/humidity differences are divided into three SZA groups for daytime (SZA <= 80°), dusk/dawn (80° < SZA <100°), and nighttime (SZA >= 100°). Figure 17 shows the height-dependent mean temperature differences and uncertainties over the three SZA groups. Table 6 lists the mean temperature differences and uncertainties over three height ranges (8–11 km, 12.5–16.5 km, and 17.8–26.4 km) and three SZA groups. The number of Spire and RAOB collocations over the dusk/dawn zone is relatively small compared to the daytime and nighttime groups.
From Figure 17 and Table 6, over the height range of 8–26.4 km, the temperature between Spire and RS41 during daytime and nighttime is consistent and within 0.06 K. However, a warm difference, i.e., Spire being warmer than RS41, in temperature is shown at different altitudes during the daytime. In contrast, a cold difference in temperature is shown at nighttime, which can come from the temperature correction scheme implemented for RS41.
We also analyze the humidity biases between the Spire retrievals and the RS41 RAOB observations according to the daytime, dusk/dawn, and nighttime SZA groups. The results are summarized in Table 7. In particular, the height-dependent humidity differences over these three SZA groups are shown in Figure 18. The mean humidity biases over two height regions (below 4.2 km and 4.8–8.4 km) are calculated from the data shown in Figure 18. Over the height range above 4.8 km, the mean humidity differences between the UCAR Spire retrievals and RS41 are all less than 0.06 g/kg for both daytime and nighttime, which suggests that the day and nighttime UCAR Spire retrievals agree well with RS41. Over the height range below 4.2 km, Figure 18 shows that the Spire–RS41 humidity differences are all negative over the three SZA groups, and the nighttime difference is the largest (−0.23 g/kg), which is about 0.07 g/kg more negative than the daytime difference.
5. Estimates of the Error Covariance Matrix for NWP Data Assimilation
The observation error matrix is an important component of any NWP DA system because it modulates the relative weighting assigned to individual observations and the background state when generating the analysis solution, regardless of whether the algorithm is variational, an ensemble Kalman filter (EnKF), or hybrid-flavored. RO profiles from different receiver satellite platforms may have systematic differences in their observation uncertainty, which must be specified in the RO DA system. Based on the calibration and validation results, we can provide RO data quality information to NWP centers and collaborate to optimize RO data assimilation. We also use NWP diagnostic tools to analyze the RO data usage from our forecast experiment datasets and provide feedback to NCEP for assessing the RO DA impacts on the current NCEP data assimilation system.
Accurate estimates of RO observation errors and their dependence on the platform, observation location, and meteorological fields are needed for the optimal usage of the RO data assimilated into a NWP model. In the operational NCEP Global Forecast System (GFS) model’s Gridpoint Statistical Interpolation (GSI) DA system, BA, instead of refractivity data, are assimilated [52]. The RO observation error sources associated with signal measurement and processing into bending angle profiles can be grouped into measurement and calibration errors [53]. These measurement errors include the SNR performance, open-loop tracking error, clock instability, and local multipath propagation; calibration errors include the residual ionospheric effects, orbit determination accuracy, and clock error removal. In an NWP framework, “representativeness errors” arising from uncertainties in simulating observations from the background forecast field (i.e., forward operator errors) provide an additional observation error source. The perturbation method can theoretically predict the observation error for individual error sources and then assemble it to establish an overall accuracy estimate.
The differences (aka the apparent or perceived error) between the observations and their corresponding values estimated from the background forecast contain contributions from observation and model forecast errors. One method for estimating observation error variance uses observation innovation (i.e., observation-minus-background) and short-term forecast error statistics, as [53] described. Equation (1) shows that, under the assumption that observation errors are uncorrelated with forecast errors, the apparent error variance () can be divided into model forecast error variance () and observation error variance ( components:
Therefore, if the model forecast error can be reasonably well estimated, one can estimate the observation error by subtracting the model forecast error variance from the apparent error variance. Our work calculates the model forecast error using the National Meteorological Center (NMC) method [53,54], which approximates using the differences between sets of 12 h and 24 h GFS forecasts, verifying simultaneously. The apparent error is calculated using the difference between the RO observations and 6 h GFS forecasts.
A recent STAR RO DSC study estimated the bending angle observation error for four RO missions, COSMIC-2, KOMPSAT-5, GeoOptics, and Spire, from 15 December 2022 to 15 January 2023. Note that, because the Spire quality does not change at different Delivery Orders, the estimated errors from DO3 are very similar to those from other Delivery Orders, and are not repeated here. A bending angle forward model developed by the STAR RO DSC (see [33]) was used to calculate a corresponding model background forecast bending angle for each RO observation by (i) interpolating the GFS 6 h forecast pressure, temperature, and water vapor fields to a grid column at the RO observation’s latitude/longitude location and time; (ii) computing the forecast BA/refractivity from these fields; and then (iii) integrating the forecast BA/refractivity field’s vertical gradient from the model top down to the observation impact height. The observation errors are estimated from the observation-minus-background sample variance () and the model error variance estimate () using Equation (1). Figure 19 shows the estimates of the four RO missions’ bending angle observation errors (normalized by the mean BA profile, aka the relative BA error (%)) based on one month of observations and the corresponding GFS forecasts from 45°N to 45°S over oceans (Figure 19a), land (Figure 19b), and both oceans and land (Figure 19c). The observation errors are less than 4% above 9 km and below 36 km. We also depict the relative BA errors over oceans for the mid-latitude southern hemisphere (from 20°S to 45°S, Figure 19d), the tropical region (from 20°N to 20°S, Figure 19e), and the mid-latitude northern hemisphere (from 45°N to 20°N, Figure 19f).
Below 9 km, the observation errors increase with a decreasing height and peak at around 2 km. For all four missions, the lower troposphere peak value over oceans (~15%) is larger than that over land (~12%). These significant errors in the lower troposphere may result from a greater RO retrieval uncertainty relative to the middle and upper troposphere, due to multipath propagation and a smaller SNR over the mid-latitudes for COSMIC-2. Larger observation errors also exist in the upper stratosphere above 36 km. This likely results from larger GFS forecast field errors at these altitudes and RO retrieval uncertainty (i.e., residual ionospheric errors). The over-land observation errors (Figure 19b) are generally smaller than those over oceans. Owing to the significantly larger number of RO observations over oceans than over land, the full-sample observation errors (Figure 19c) are similar to the over-ocean observation errors shown in Figure 19a. We can implement the defined COSMIC-2, PAZ, Metop-C, KOMPSAT-5, and Sentinel-6 RO observation errors and updated forward operator (including QC settings) generated based on these results into STAR’s offline RO data assessment system. The NCEP can also use these results for the global NWP through DA. The relative BA error over oceans is larger for the tropical region and mid-latitude summer (in the southern hemisphere) than that in the mid-latitude winter region (in the northern hemisphere) (see Figure 19d–f).
6. Discussion
As mentioned in the introduction section, with such a smaller antenna size for Spire, one might expect the detected SNR to be much smaller than that from a larger antenna, which may lead to a higher measurement and retrieval uncertainty. However, this study did not find that the lower SNR Spire RO data led to less accurate retrieval results. The penetration height and precision of Spire were even better than those from COSMIC-2 at mid-latitudes (45°N–30°N and 30°S–45°S). These were also consistent with previous studies from [34,35,36], which indicated that the Spire bending angle, refractivity, temperature, and moisture profiles were compatible with those of COSMIC-2.
In this study, we concluded that the accuracy and uncertainty of the retrieved water vapor and refractivity profiles for COSMIC-2 from higher SNR (>2000 v/v) signals were compatible with those from lower SNR (less than 1000 v/v) signals. Even with a smaller SNR, the retrieval uncertainties from COSMIC (SNR ~1200 v/v) were almost identical to those of COSMIC-2. However, the SNR may not be the only factor that affects RO retrieval uncertainty. For example, a simulation study (JPL, personal communication) demonstrated that horizontal water vapor irregularity and turbulence may also affect RO retrieval uncertainty, especially in the lower troposphere. That study showed that the retrieval biases and uncertainty were identical for all SNR groups while increasing the turbulence effect. A detailed analysis will be in a future study.
In this study, we also noticed that the antenna’s viewing geometry affected the SNRs’ latitudinal distribution, affecting the observation error distribution. As discussed in Section 2, the factors that affected the SNR included (i) the GNSS emitter’s signal power, (ii) the receiver intermediate frequency bandwidth, (iii) the RO antenna design, (iv) the antenna gain pattern related to the viewing geometry, and (v) the azimuth angle, where the antenna viewing geometry directly affected the SNR’s latitudinal distribution. With the high-gain side-mounted antenna for both the L1 and L2 frequencies, the Spire SNRs for GPS, GLONASS, and GALILEO were uniformly distributed at all latitudes. Unlike Spire, the COSMIC-2 RO antenna points to the nadir, and the position-tracking antenna points to the sideway. As a result, the COSMIC-2 SNR was smaller in the mid-latitude. Generally, COSMIC-2 SNR had a broader distribution (from 200 v/v to 2000 v/v) from 30°N to 30°S. The COSMIC-2 event distribution as a function of the antenna view angle was also shown by [32]. The geolocation distribution of the COSMIC-2 SNR may affect the COSMIC-2 penetration depth at different latitudes. We demonstrated that, owing to the viewing geometry, the COSMIC-2 SNR was lowest (~1000 v/v) at mid-latitudes (45°N–30°N and 30°S–45°S). As a result, the COSMIC-2 retrieval uncertainty at mid-latitudes was higher than that from Spire and other RO missions.
These results will provide confidence for the RO community to use commercial CuteSats Spire data for climate [4,5,6,7,8,9,10,11,12,13,14,15,16,17,18,19,20,21,22,23,24,25,26,27] and weather applications [29], just as those using previous RO missions. Ref. [30] also summarized the recent preliminary studies using COSMIC-2 and Spire data for climate analyses, atmospheric studies, weather forecasts, gravity wave detection, and atmospheric applications.
7. Conclusions and Future Work
Recently, the NOAA included GNSS RO data as one of the crucial long-term observables for weather and climate applications, just as those from IR and MW measurements. To include more GNSS RO data in the NWP system, the NOAA CWDP program started to explore the commercial RO data available on the market. CWDP awarded the first IDIQ contract to GeoOptics and Spire Incs. in 2020. Both GeoOptics and Spire RO data were collected from commercial CubeSats. Ref. [32] examined the GeoOptics data quality. This study examined the specific quality of the Spire data products during the DO3 and DO4 periods (from 8 September 2021 to 16 January 2023) for climate and weather applications. We carefully examined the Spire data’s penetration, precision, stability, and accuracy. We also quantified the Spire BA vertical error uncertainty (the diagonal terms in the error covariance matrix), which is crucial for the RO NWP through DA. We reaches the following conclusions.
- (1)
- The spatial and temporal coverage. Spire had close to 30 satellites at LEO orbits during DO3 and DO4. Although the complete global Spire RO occultation was around 20 K per day during the performance periods, the CWDP purchased about 3000 Spire occultation profiles per day during DO3 and 5500 Spire occultation profiles per day in DO4. While COSMIC-2 has an inclination angle of 24°, Spire is in the Sun-synchronized orbits. While Spire data cover the globe and are distributed relatively evenly across all latitudes, COSMIC-2 observations can cover all latitudes within [45°N, 45°S]. Spire has observations peaking local time ranges in 2–3, 9–10, 14–15, and 21–22, while the KOMPSAT5 observation peaking local times are located at 6 and 18, and COSMIC-2 observations cover all local times.
- (2)
- The effect of the SNR on Spire data penetration. The lowest penetration height is an essential indicator of RO data quality. The lowest penetration height of RO tracking is usually related to the data’s SNR and the atmosphere’s dryness. Although with a lower SNR in general, the pattern of the lowest penetration height for Spire was similar to that for COSMIC-2. The Spire and COSMIC-2 penetration heights were from around a 0.6 to 0.8 km altitude over tropical oceans. We also compared the lowest penetration height of 80% of the total data for different RO missions in different latitudinal zones. GeoOptics and Spire had lower penetration heights (for 80% of the total data) than COSMIC-2 in the latitudinal zones of [30°S, 45°S] and [45°N, 30°N]. This may be owed to COSMIC-2’s SNR being lower in the latitudinal zones of [30°S, 45°S] and [45°N, 30°N].
- (3)
- The Spire data precision and stability. We used the Spire–Spire SRO pairs to quantify the Spire precision for the bending angle, dry temperature, and water vapor mixing ratio. The results showed that the mean differences were very close to zero from the surface to a 40 km altitude for all three physical quantities. The standard deviations from the bending angle, dry temperature, and water vapor mixing ratio were similar to those from other RO missions, such as COSMIC-2 and COSMIC-1. We also compared the fractional mean BA difference for Spire S124 and S120 from the surface to a 40 km altitude, but separated with GPS, GLONASS, and GALILEO, respectively. Although the SNR ranges from different emitters were different, the mean differences for GPS, GLONASS, and GALILEO were all close to zero with STDs of 1.81, 1.78, and 1.78, respectively. We also compared the precision of COSMIC-1 (SRO pairs collected from 2006) and COSMIC-2 (SRO pairs collected from 2021) with those from Spire (SRO pairs collected from 2022). All the comparisons were within [45°N,45°S]. We found that the COSMIC-2 STDs over mid-latitudes were slightly more significant than those from Spire, which may be owed to their lower SNR over the same regions. Although it was not shown in this paper, the receiver quality for different flight modules is very close. Although using slightly different receivers, the precision of Spire STRATOS receivers is of the same quality as those of COSMIC-2 TGRS receivers.
- (4)
- The effect of the SNR on the Spire retrieval accuracy. The UCAR Spire retrievals were consistent with those from the STAR-independent derived BA retrievals. The independent statistical analysis and validation from ERA5 and the direct bending angle profile comparison from these SRO cases above 35 km suggested: (i) the RO bending angle profiles retrieved from the GPS satellites were, in general, better than those from the GLONASS satellites; (ii) significant uncertainty existed for the RO bending angle profiles from GLONASS, which may indicate a potential RO phase issue related to the clock, residual ionospheric effects, receiver noise, and orbit determination errors for GLONASS. We validated the Spire temperature and water vapor profiles by comparing them with collocated radiosonde in situ data. Generally, over the height region between 8 km and 16.5 km, the RS41 RAOB matched the Spire temperature profiles very well, with temperature biases of <0.02 K. Over the height range from 17.8 to 26.4 km, the temperature biases were ~−0.034 K, with RS41 RAOB being warmer.
- (5)
- Estimates of the error covariance matrix for NWP. Below 9 km, the RO observation errors increased with a decreasing height and peaked at around 2 km. The magnitude of the relative BA errors in the troposphere for Spire was very close to that from COSMIC-2, KOMPSAT-5, and GeoOptics missions (also see [55]). In the lower troposphere, their peak values at a 2 km altitude over oceans (~15%) were more significant than those over land (~12%). These significant errors in the lower troposphere may have resulted from a greater RO retrieval uncertainty relative to the middle and upper troposphere, due to multipath propagation and a smaller SNR over mid-latitudes for COSMIC-2. The COSMIC-2 retrieval uncertainty was slightly more significant over oceans at mid-latitudes (45°N–30°N and 30°S–45°S), which may also be owed to COSMIC-2’s SNR being lower in those latitudinal zones.
The GNSS RO landscape has been rapidly evolving. Besides GeoOptics and Spire, more commercial RO data are available on the market (i.e., PlanetiQ and others). More than 100 GNSS RO sensors are currently in orbit to track more signals (i.e., GPS, GLONASS, QZSS, IRNSS, GALILEO, Beidou, and GPS III). To use all the above different tracking and receiver systems for climate and NWP applications, we need to carefully examine the quality of each receiver and the inter-consistency of the retrieved data products. NOAA STAR has become a GNSS RO DSC (see https://www.star.nesdis.noaa.gov/smcd/GNSSRO/RO/index.php (access on 1 June 2023) and [31,32,33,43,44,45]). We will continue developing RO processing packages for PlanetiQ and other RO missions and use our validation system (see [45]) to provide independent validation results. This will be for future work.
Author Contributions
Conceptualization, S.-p.H.; methodology, S.-p.H., X.S. and Y.C.; software, X.Z. and X.J.; validation, X.Z., X.J. and W.M.; formal analysis, X.Z. and X.J.; investigation, X.Z.; resources, X.Z.; data curation, X.J.; writing—original draft preparation, S.-p.H.; writing—review and editing, S.-p.H., X.S. and Y.C.; visualization, X.Z.; supervision, S.-p.H.; project administration, S.-p.H.; funding acquisition, S.-p.H. All authors have read and agreed to the published version of the manuscript.
Funding
This study was supported by NOAA grant NA19NES4320002 (Cooperative Institute for Satellite Earth System Studies—CISESS) at the University of Maryland/ESSIC.
Data Availability Statement
The data presented in this study are available on request from the corresponding author.
Acknowledgments
The authors would like to thank three reviewers for their comments and suggestions to improve the quality of this manuscript. The manuscript contents are solely the opinions of the authors and do not constitute a statement of policy, decision, or position on behalf of NOAA or the U.S. government.
Conflicts of Interest
The authors declare no conflict of interest.
Appendix A. STAR Spire Data Products
In addition to COSMIC-1, KOMPSAT-5, COSMIC-2, and GeoOptics, we also developed a processing package for the CWDP SPIRE mission. Figure A1 details the STAR SPIRE RO data-processing flow chart. The Spire data-processing procedures are similar to COSMIC-2. This processing is detailed in [33], except SPIRE has high-rate reference link observations from the POD antenna. It has only one POD antenna and two OCC antennas for setting and rising measurements.
Figure A1.
The STAR Spire RO data-processing flow chart.

There are data from more than 20 small satellites available during the DO3 period. The processing of more than 20 other satellites requires parallel processing. We developed a code for the parallel processing of multiple LEO POD solutions to retrieve orbit and clock information. We retrieved all the needed satellite parameters, including the COSPAR ID, satellite launch dates, satellite antenna offset and phase center variations, and satellite mass, and assigned each satellite a unique processing ID.
One more distinct feature of SPIRE different from COSMIC-2 and other missions is that it has GALILEO satellite signals in the OCC antenna observations. The two frequencies used are L1C and L7Q. The occultation also includes GPS and GLONASS signals, but POD observation only has GPS signals. Thus, this makes POD processing relatively easier. However, including GALILEO signals with OCC observations requires additional code development to process excess phase and bending angles. One caveat for GALILEO processing is that we do not have GNSS bit time series. In the long run, a global ground station network must collect the GALILEO broadcasting word and decipher the bit time series based on the spatial and temporal availability when OCC observation occurs. UCAR or another agency can provide such a database. However, the ROPP [56]-provided GNSS bit internal time series routine can still be used in bending angle inversion.
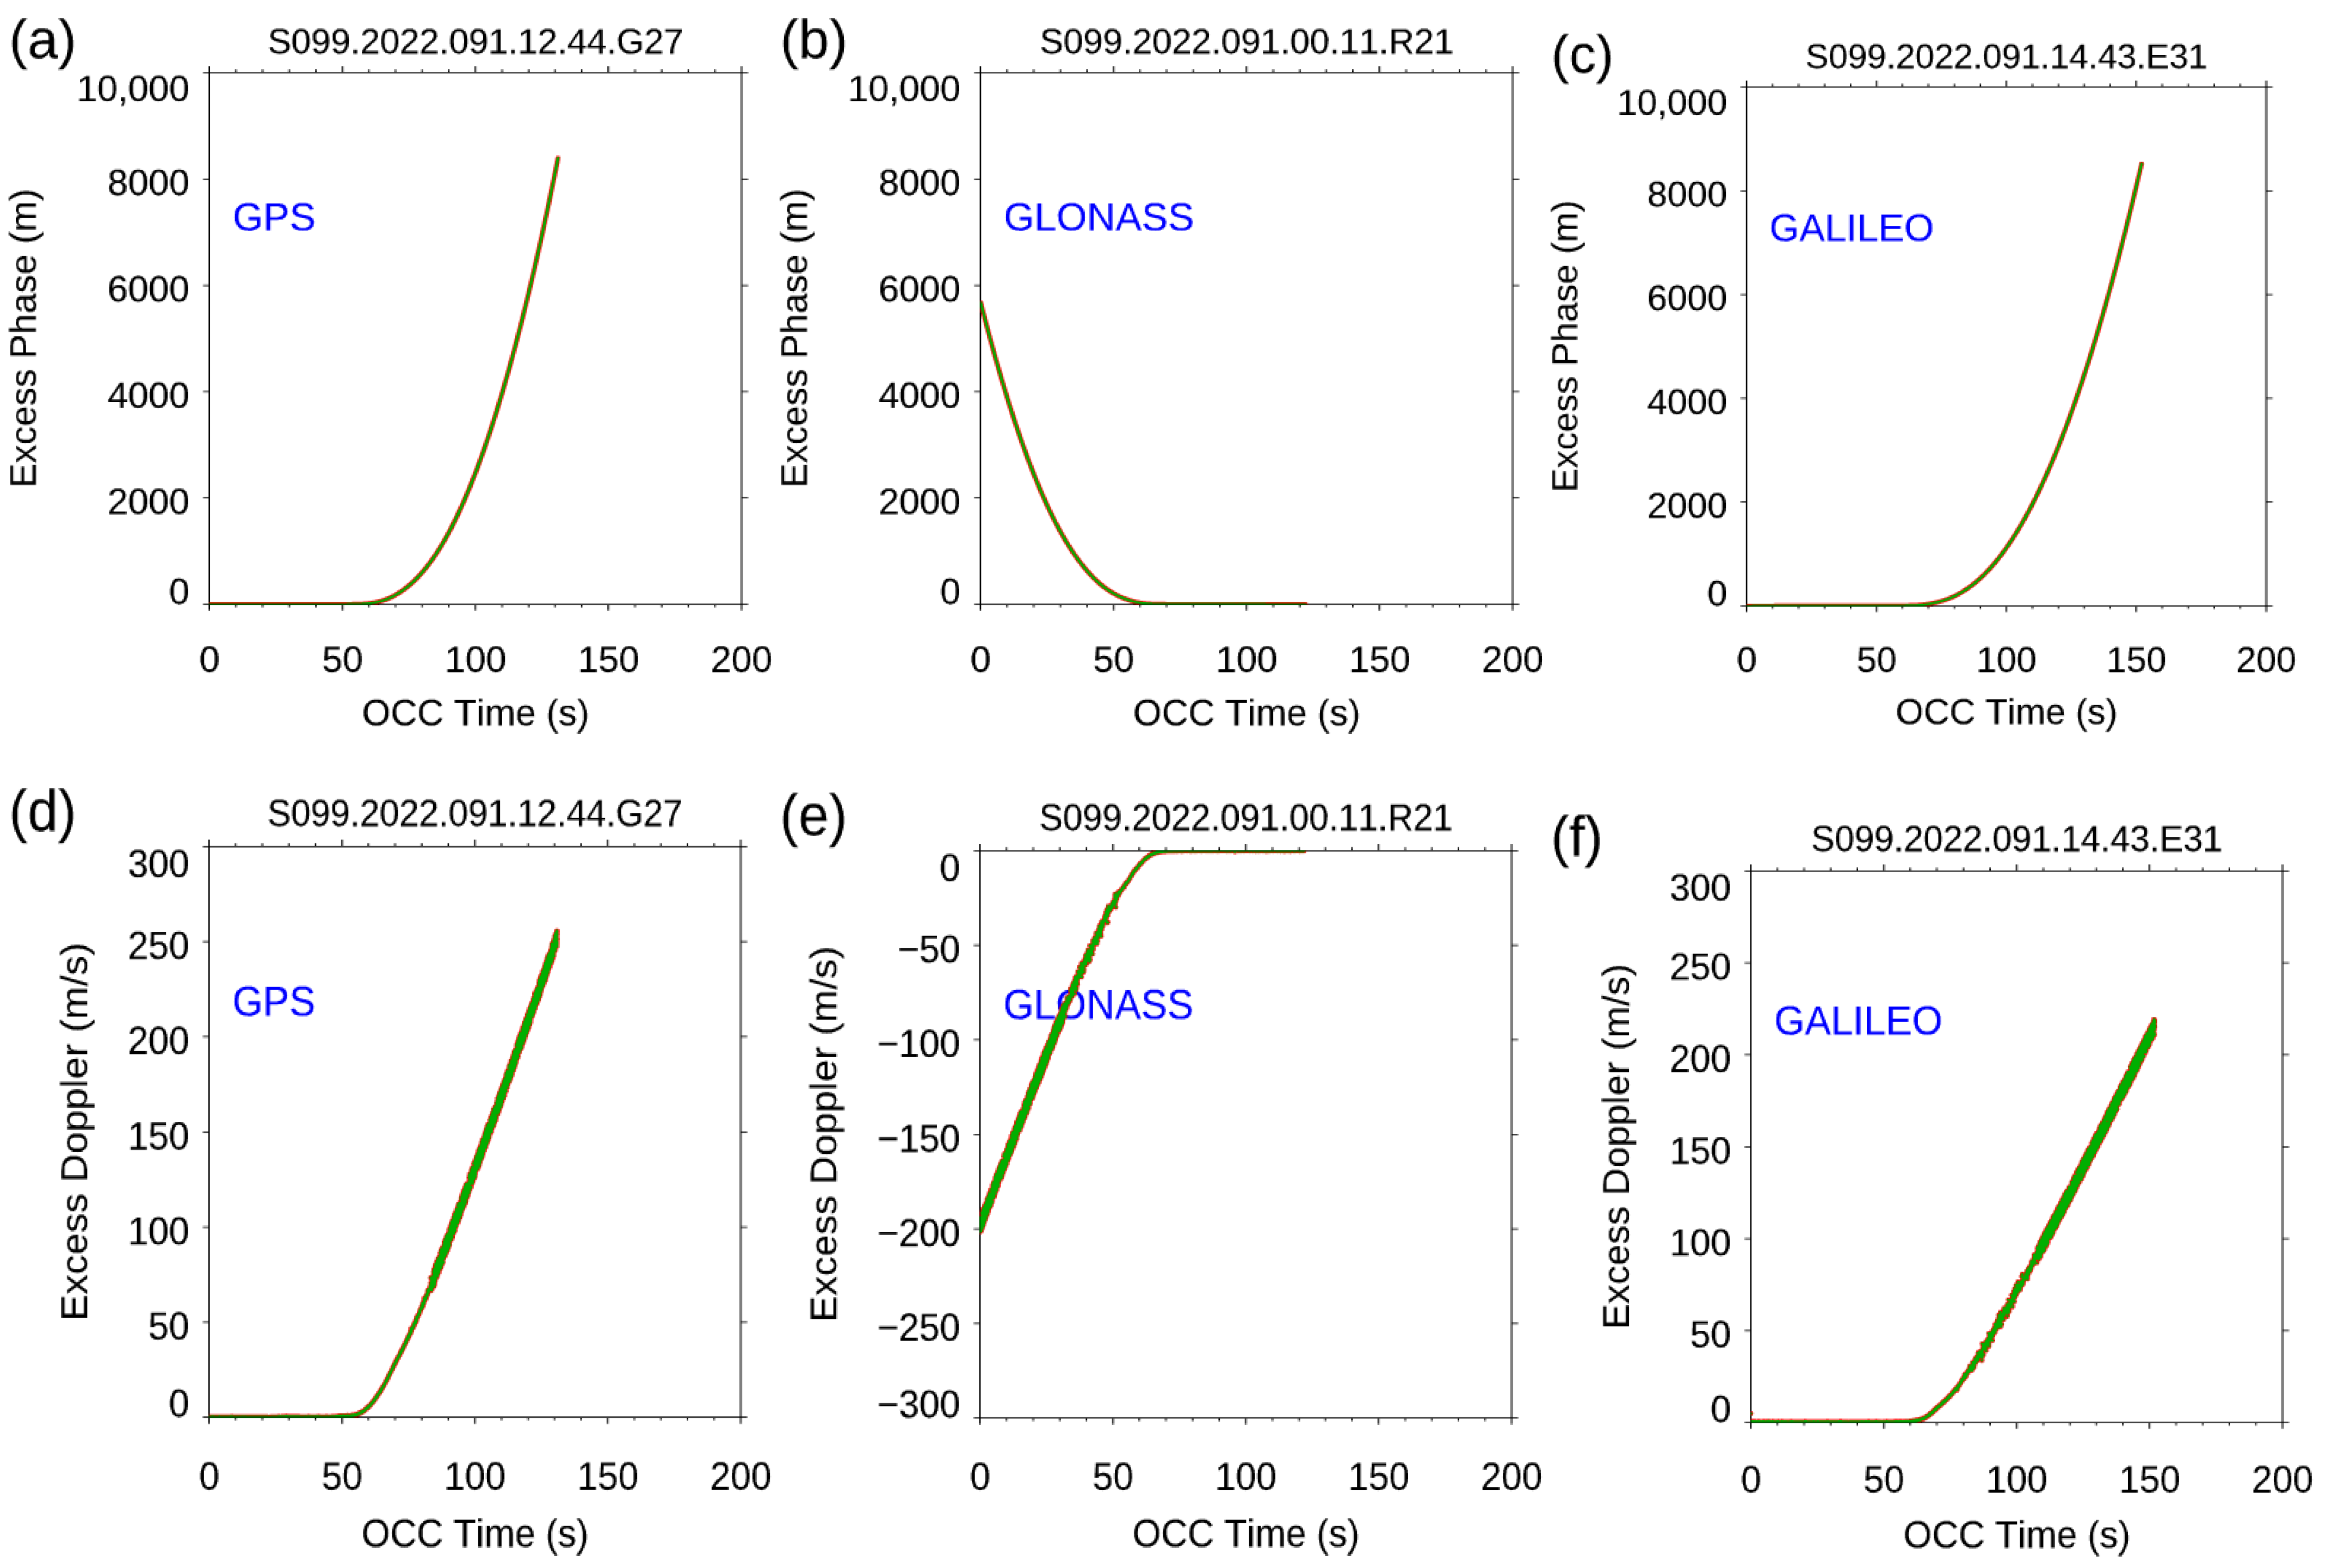
The Spire clock bias can be significant with high-rate POD observations. The single differencing removes the clock bias with the excess phase calculation. The excess phase is calculated by eliminating the geometric distance between the receiver and transmitter antennas, the receiver and transmitter clock bias, and corrections to other terms [57]. Then, the excess phase, the SNR, and the receiver/transmitter position information are written into a netCDF file for each profile. Figure A2 shows the excess phase comparisons between the STAR and UCAR processes for three GNSS systems. An excellent agreement between these two processes can be achieved for all three satellite systems.
Figure A2.
STAR-processed Spire RO excess phase comparison with those processed by UCAR for three cases representing RO tracking to (left) GPS, (middle) GLONASS, and (right) GALILEO systems, respectively. (a–c) The excess phase comparison for GPS, GLONASS, and GALILEO, respectively. (d–f) The excess Doppler comparison for GPS, GLONASS, and GALILEO.
References
- Anthes, R.A.; Bernhardt, P.A.; Chen, Y.; Cucurull, L.; Dymond, K.F.; Ector, D.; Healy, S.B.; Ho, S.-P.; Hunt, D.C.; Kuo, Y.; et al. The COSMIC/FORMOSAT-3 Mission: Early Results. Bull. Am. Meteorol. Soc. 2008, 89, 313–334. [Google Scholar] [CrossRef]
- Ho, S.-P.; Anthes, R.A.; Ao, C.O.; Healy, S.; Horanyi, A.; Hunt, D.; Mannucci, A.J.; Pedatella, N.; Randel, W.J.; Simmons, A. The COSMIC/FORMOSAT-3 Radio Occultation Mission after 12 Years: Accomplishments, Remaining Challenges, and Potential Impacts of COSMIC-2. Bull. Am. Meteorol. Soc. 2020, 101, E1107–E1136. [Google Scholar] [CrossRef]
- Bean, B.R.; Dutton, E.J. Radio Meteorology. National Bureau of Standards Monogr., No. 92; U.S. Government Printing Office: Washington, DC, USA, 1966; p. 435. [Google Scholar]
- Ho, S.-P.; Goldberg, M.; Kuo, Y.-H.; Zou, C.-Z.; Shiau, W. Calibration of Temperature in the Lower Stratosphere from Microwave Measurements Using COSMIC Radio Occultation Data: Preliminary Results. Terr. Atmos. Ocean. Sci. 2009, 20, 87. [Google Scholar] [CrossRef]
- Ho, S.-P.; Zhou, X.; Kuo, Y.-H.; Hunt, D.; Wang, J.-H. Global Evaluation of Radiosonde Water Vapor Systematic Biases using GPS Radio Occultation from COSMIC and ECMWF Analysis. Remote Sens. 2010, 2, 1320–1330. [Google Scholar] [CrossRef]
- Alexander, S.P.; Tsuda, T.; Kawatani, Y. COSMIC GPS Observations of Northern Hemisphere winter stratospheric gravity waves and comparisons with an atmospheric general circulation model. Geophys. Res. Lett. 2008, 35. [Google Scholar] [CrossRef]
- Alexander, S.P.; Tsuda, T.; Kawatani, Y.; Takahashi, M. Global distribution of atmospheric waves in the equatorial upper troposphere and lower stratosphere: COSMIC observations of wave mean flow interactions. J. Geophys. Res. Atmos. 2008, 113, D24115. [Google Scholar] [CrossRef]
- Luna, D.; Alexander, P.; De La Torre, A. Evaluation of uncertainty in gravity wave potential energy calculations through GPS radio occultation measurements. Adv. Space Res. 2013, 52, 879–882. [Google Scholar] [CrossRef]
- Nath, D.; Chen, W.; Guharay, A. Climatology of stratospheric gravity waves and their interaction with zonal mean wind over the tropics using GPS RO and ground-based measurements in the two phases of QBO. Theor. Appl. Clim. 2014, 119, 757–769. [Google Scholar] [CrossRef]
- Healy, S. Forecast impact experiment with a constellation of GPS radio occultation receivers. Atmos. Sci. Lett. 2008, 9, 111–118. [Google Scholar] [CrossRef]
- Healy, S. Surface pressure information retrieved from GPS radio occultation measurements. Q. J. R. Meteorol. Soc. 2013, 139, 2108–2118. [Google Scholar] [CrossRef]
- Aparicio, J.M.; Deblonde, G.; Aparicio, J.M. Impact of the Assimilation of CHAMP Refractivity Profiles on Environment Canada Global Forecasts. Mon. Weather Rev. 2008, 136, 257–275. [Google Scholar] [CrossRef]
- Poli, P.; Moll, P.; Puech, D.; Rabier, F.; Healy, S.B. Quality Control, Error Analysis, and Impact Assessment of FORMOSAT-3/COSMIC in Numerical Weather Prediction. Terr. Atmos. Ocean. Sci. 2009, 20, 101–113. [Google Scholar] [CrossRef]
- Melbourne, W.G.; Davis, E.S.; Duncan, C.B.; Hajj, G.A.; Hardy, K.R.; Kursinski, E.R.; Meehan, T.K.; Young, L.E.; Yunck, T.P. The Application of Spaceborne GPS to Atmospheric Limb Sounding and Global Change Monitoring; NASA Jet Propulsion Laboratory: Pasadena, CA, USA, 1994. Available online: https://ntrs.nasa.gov/archive/nasa/casi.ntrs.nasa.gov/19960008694.pdf (accessed on 1 June 2023).
- Yunck, T.P.; Liu, C.-H.; Ware, R. A History of GPS Sounding. Terr. Atmos. Ocean. Sci. 2000, 11, 001. [Google Scholar] [CrossRef]
- Smith, E.; Weintraub, S. The constants in the equation for atmospheric refractive index at radio frequencies. J. Res. Natl. Inst. Stand. Technol. 1953, 50, 39. [Google Scholar] [CrossRef]
- Neiman, P.J.; Ralph, F.M.; Wick, G.A.; Kuo, Y.-H.; Wee, T.-K.; Ma, Z.; Taylor, G.H.; Dettinger, M.D. Diagnosis of an Intense Atmospheric River Impacting the Pacific Northwest: Storm Summary and Offshore Vertical Structure Observed with COSMIC Satellite Retrievals. Mon. Weather Rev. 2008, 136, 4398–4420. [Google Scholar] [CrossRef]
- Wee, T.-K. A variational regularization of Abel transform for GPS radio occultation. Atmos. Meas. Tech. 2018, 1947–1969. [Google Scholar] [CrossRef]
- Xie, F.; Syndergaard, S.; Kursinski, E.R.; Herman, B.M. An Approach for Retrieving Marine Boundary Layer Refractivity from GPS Occultation Data in the Presence of Superrefraction. J. Atmos. Ocean. Technol. 2006, 23, 1629–1644. [Google Scholar] [CrossRef]
- Ho, S.-P.; Kuo, Y.-H.; Schreiner, W.; Zhou, X. Using SI-traceable global positioning system radio occultation measurements for climate monitoring in “State of the Climate in 2009”. Bull. Am. Meteorol. Soc. 2010, 91, S36–S37. [Google Scholar]
- Ho, S.P.; Yue, X.; Zeng, Z.; Ao, C.O.; Huang, C.Y.; Kursinski, E.R.; Kuo, Y.H. Applications of COSMIC radio occultation data from the troposphere to ionosphere and potential impacts of COSMIC-2 data. Bull. Am. Meteorol. Soc. 2014, 95, ES18–ES22. [Google Scholar] [CrossRef]
- Ho, S.-P.; Peng, L.; Anthes, R.A.; Kuo, Y.-H.; Lin, H.-C. Marine Boundary Layer Heights and Their Longitudinal, Diurnal, and Interseasonal Variability in the Southeastern Pacific Using COSMIC, CALIOP, and Radiosonde Data. J. Clim. 2015, 28, 2856–2872. [Google Scholar] [CrossRef]
- Ho, S.-P.; Kirchengast, G.; Leroy, S.; Wickert, J.; Mannucci, A.J.; Steiner, A.; Hunt, D.; Schreiner, W.; Sokolovskiy, S.; Ao, C.; et al. Estimating the uncertainty of using GPS radio occultation data for climate monitoring: Intercomparison of CHAMP refractivity climate records from 2002 to 2006 from different data centers. J. Geophys. Res. Earth Surf. 2009, 114, D23107. [Google Scholar] [CrossRef]
- Ho, S.-P.; Hunt, D.; Steiner, A.; Mannucci, A.J.; Kirchengast, G.; Gleisner, H.; Heise, S.; Von Engeln, A.; Marquardt, C.; Sokolovskiy, S.; et al. Reproducibility of GPS radio occultation data for climate monitoring: Profile-to-profile inter-comparison of CHAMP climate records 2002 to 2008 from six data centers. J. Geophys. Res. Earth Surf. 2012, 117, D18111. [Google Scholar] [CrossRef]
- Steiner, A.K.; Ladstädter, F.; Ao, C.O.; Gleisner, H.; Ho, S.-P.; Hunt, D.; Schmidt, T.; Foelsche, U.; Kirchengast, G.; Kuo, Y.-H.; et al. Consistency and structural uncertainty of multi-mission GPS radio occultation records. Atmos. Meas. Tech. 2020, 13, 2547–2575. [Google Scholar] [CrossRef]
- Ho, S.-P.; Peng, L.; Vömel, H. Characterization of the long-term radiosonde temperature biases in the upper troposphere and lower stratosphere using COSMIC and Metop-A/GRAS data from 2006 to 2014. Atmos. Chem. Phys. 2017, 17, 4493–4511. [Google Scholar] [CrossRef]
- Ho, S.-P.; Peng, L. Global water vapor estimates from measurements from active GPS RO sensors and passive infrared and microwave sounders. In Green Chemistry Applications; IntechOpen: London, UK, 2018. [Google Scholar] [CrossRef]
- Lin, C.C.; Yang, S.C.; Ho, S.P.; Pedatella, N.M. Exploring the terrestrial and space weather using an operational radio occultation satellite constellation—A FORMOSAT-7/COSMIC-2 Special Issue after 1-year on orbit. Terr. Atmos. Ocean. Sci. 2022, 32, 1–3. [Google Scholar] [CrossRef]
- Cucurull, L.; Derber, J.C.; Purser, R.J. A bending angle forward operator for global positioning system radio occultation measurements. J. Geophys. Res. Atmos. 2013, 118, 14–28. [Google Scholar] [CrossRef]
- Ho, S.-P.; Pedatella, N.; Foelsche, U.; Healy, S.; Weiss, J.P.; Ullman, R. Using Radio Occultation Data for Atmospheric Numerical Weather Prediction, Climate Sciences, and Ionospheric Studies and Initial Results from COSMIC-2, Commercial RO Data, and Recent RO Missions. Bull. Am. Meteorol. Soc. 2022, 103, E2506–E2512. [Google Scholar] [CrossRef]
- Ho, S.-P.; Zhou, X.; Shao, X.; Zhang, B.; Adhikari, L.; Kireev, S.; He, Y.; Yoe, J.; Xia-Serafino, W.; Lynch, E. Initial Assessment of the COSMIC-2/FORMOSAT-7 Neutral Atmosphere Data Quality in NESDIS/STAR Using In Situ and Satellite Data. Remote Sens. 2020, 12, 4099. [Google Scholar] [CrossRef]
- Chen, Y.; Shao, X.; Cao, C.-Y.; Ho, S.-P. Simultaneous Radio Occultation Predictions for Inter-Satellite Comparison of Bending Angle Profiles from COSMIC-2 and GeoOptics. Remote Sens. 2021, 13, 3644. [Google Scholar] [CrossRef]
- Zhang, B.; Ho, S.-P.; Cao, C.; Shao, X.; Dong, D.; Chen, Y. Verification and Validation of the COSMIC-2 Excess Phase and Bending Angle Algorithms for Data Quality Assurance at STAR. Remote Sens. 2022, 14, 3288. [Google Scholar] [CrossRef]
- Jing, X.; Ho, S.-P.; Shao, X.; Liu, T.-C.; Chen, Y.; Zhou, X.-J. Spire RO Thermal Profiles for Climate Studies: Initial Comparisons of the Measurements from Spire, NOAA-20 ATMS, Radiosonde, and COSMIC-2. Remote Sens. 2023, 15, 3710. [Google Scholar] [CrossRef]
- Irisov, V.; Masters, D.; Gorbunov, M.; Nguyen, V.; Sikarin, R.; Bloom, A.; Rocken, C. Comparison of Spire RO profiles processed by UCAR and Spire. In Proceedings of the 8th International Radio Occultation Working Group Meeting—IROWG-8, Virtual, 7–13 April 2021. [Google Scholar]
- McCarty, W.; Todling, R.; Privé, N.; Chattopadhyay, M.; Partyka, G.; Gelaro, R. Assessment of New Radio Occultation Measure- ments at the Global Modeling and Assimilation Office. In Proceedings of the 8th International Radio Occultation Working Group Meeting—IROWG-8, Virtual, 7–13 April 2021. [Google Scholar]
- Murphy, M.J.; Haase, J.S. Evaluation of GNSS Radio Occultation Profiles in the Vicinity of Atmospheric Rivers. Atmosphere 2022, 13, 1495. [Google Scholar] [CrossRef]
- Angling, M.J.; Nogués-Correig, O.; Nguyen, V.; Vetra-Carvalho, S.; Bocquet, F.-X.; Nordstrom, K.; Melville, S.E.; Savastano, G.; Mohanty, S.; Masters, D. Sensing the ionosphere with the Spire radio occultation constellation. J. Space Weather Space Clim. 2021, 11, 56. [Google Scholar] [CrossRef]
- Bosch, G. GNSS Radio Occultation in Advanced Numerical Weather Prediction Models. GEOmedia 2019, 23, 34–37. [Google Scholar]
- Forsythe, V.V.; Duly, T.; Hampton, D.; Nguyen, V. Validation of Ionospheric Electron Density Measurements Derived from Spire CubeSat Constellation. Radio Sci. 2020, 55, e2019RS006953. [Google Scholar] [CrossRef]
- Zeng, Z.; Schreiner, W.S.; Weiss, J. Evaluation of Spire GNSS RO data for global tropopause and PBL detections. AGU Fall Meet. Abstr. 2020, 2020, IN029-02. [Google Scholar]
- Alessandro, P. SPIRE/STRATOS (GNSS-RO) Quality Assessment Summary; Telespazio: Rome, Italy, 2020. [Google Scholar]
- Adhikari, L.; Ho, S.-P.; Zhou, X. Inverting COSMIC-2 Phase Data to Bending Angle and Refractivity Profiles Using the Full Spectrum Inversion Method. Remote Sens. 2021, 13, 1793. [Google Scholar] [CrossRef]
- Chen, Y.; Cao, C.; Shao, X.; Ho, S.-P. Assessment of the Consistency and Stability of CrIS Infrared Observations Using COSMIC-2 Radio Occultation Data over Ocean. Remote Sens. 2022, 14, 2721. [Google Scholar] [CrossRef]
- Ho, S.-p.; Kireev, S.; Shao, X.; Zhou, X.; Jing, X. Processing and Validation of the STAR COSMIC-2 Temperature and Water Vapor Profiles in the Neural Atmosphere. Remote Sens. 2022, 14, 5588. [Google Scholar] [CrossRef]
- Jing, X.; Shao, X.; Liu, T.-C.; Zhang, B. Comparison of GRUAN RS92 and RS41 Radiosonde Temperature Biases. Atmosphere 2021, 12, 857. [Google Scholar] [CrossRef]
- Miller, W.J.; Chen, Y.; Ho, S.-P.; Shao, X. Evaluating the impacts of COSMIC-2 GNSS RO bending angle assimilation on Atlantic hurricane forecasts using the HWRF model. Mon. Weather Rev. 2023, 151, 1821–1847. [Google Scholar] [CrossRef]
- Shao, X.; Ho, S.-P.; Zhang, B.; Cao, C.; Chen, Y. Consistency and Stability of SNPP ATMS Microwave Observations and COSMIC-2 Radio Occultation over Oceans. Remote Sens. 2021, 13, 3754. [Google Scholar] [CrossRef]
- Shao, X.; Ho, S.-P.; Zhang, B.; Zhou, X.; Kireev, S.; Chen, Y.; Cao, C. Comparison of COSMIC-2 radio occultation retrievals with RS41 and RS92 radiosonde humidity and temperature measurements. Terr. Atmos. Ocean. Sci. 2021, 32, 1015–1032. [Google Scholar] [CrossRef]
- Cao, C.; Wang, W.; Lynch, E.; Bai, Y.; Ho, S.-P.; Zhang, B. Simultaneous Radio Occultation for intersatellite comparison of bending angle toward more accurate atmospheric sounding. J. Atmos. Ocean. Technol. 2020, 37, 2307–2320. [Google Scholar] [CrossRef]
- Dallas Masters, Seizing Opportunity: Spire’s CubeSat Constellation of GNSS, AIS, and ADS-B Sensors, Stanford PNT Symposium, 2018-11-08. Available online: http://web.stanford.edu/group/scpnt/pnt/PNT18/presentation_files/I07-Masters-Spire_GNSS_AIS_ADS-B.pdf (accessed on 1 June 2023).
- Kursinski, E.R.; Gebhardt, T. A method to deconvolve errors in GPS RO-derived water vapor histograms. J. Atmos. Ocean. Technol. 2014, 31, 2606–2628. [Google Scholar] [CrossRef]
- Kuo, Y.-H.; Wee, T.-K.; Sokolovskiy, S.; Rocken, C.; Schreiner, W.; Hunt, D.; Anthes, R.A. Inversion and error estimation of GPS radio occultation data. J. Meteorol. Soc. Jpn. 2004, 82, 507–531. [Google Scholar] [CrossRef]
- Parrish, D.F.; Derber, J.C. The National Meteorological Center’s Spectral Statistical-Interpolation Analysis System. Mon. Weather Rev. 1992, 120, 1747–1763. [Google Scholar] [CrossRef]
- Anthes, R.; Sjoberg, J.; Feng, X.L.; Syndergaard, S. Comparison of COSMIC and COSMIC-2 Radio Occultation Refractivity and Bending Angle Uncertainties in August 2006 and 2021. Atmosphere 2022, 13, 790. [Google Scholar] [CrossRef]
- Culverwell, I.D.; Lewis, H.W.; Offiler, D.; Marquardt, C.; Burrows, C.P. The Radio Occultation Processing Package, ROPP. Atmos. Meas. Tech. 2015, 8, 1887–1899. [Google Scholar] [CrossRef]
- Schreiner, W.; Rocken, C.; Sokolovskiy, S.; Hunt, D. Quality assessment of COSMIC/FORMOSAT-3 GPS radio occultation data derived from single- and double-difference atmospheric excess phase processing. GPS Solut. 2009, 14, 13–22. [Google Scholar] [CrossRef]
Figure 1.
The distribution of the normalized SNR frequency sample numbers (defined as the sample numbers for each SNR bin normalized to the maximum number of the SNR bin) for GPS (in red line), GLONASS (in orange line), and GALILEO (in blue line) signals on (a) Spire, (b) COSMIC-2, and (c) KOMPSAT-5 over the CWDP Delivery-Order 3 (DO3, from 8 September 2021 to 15 March 2022). The total number of observations from each GNSS satellite is listed in the figures.
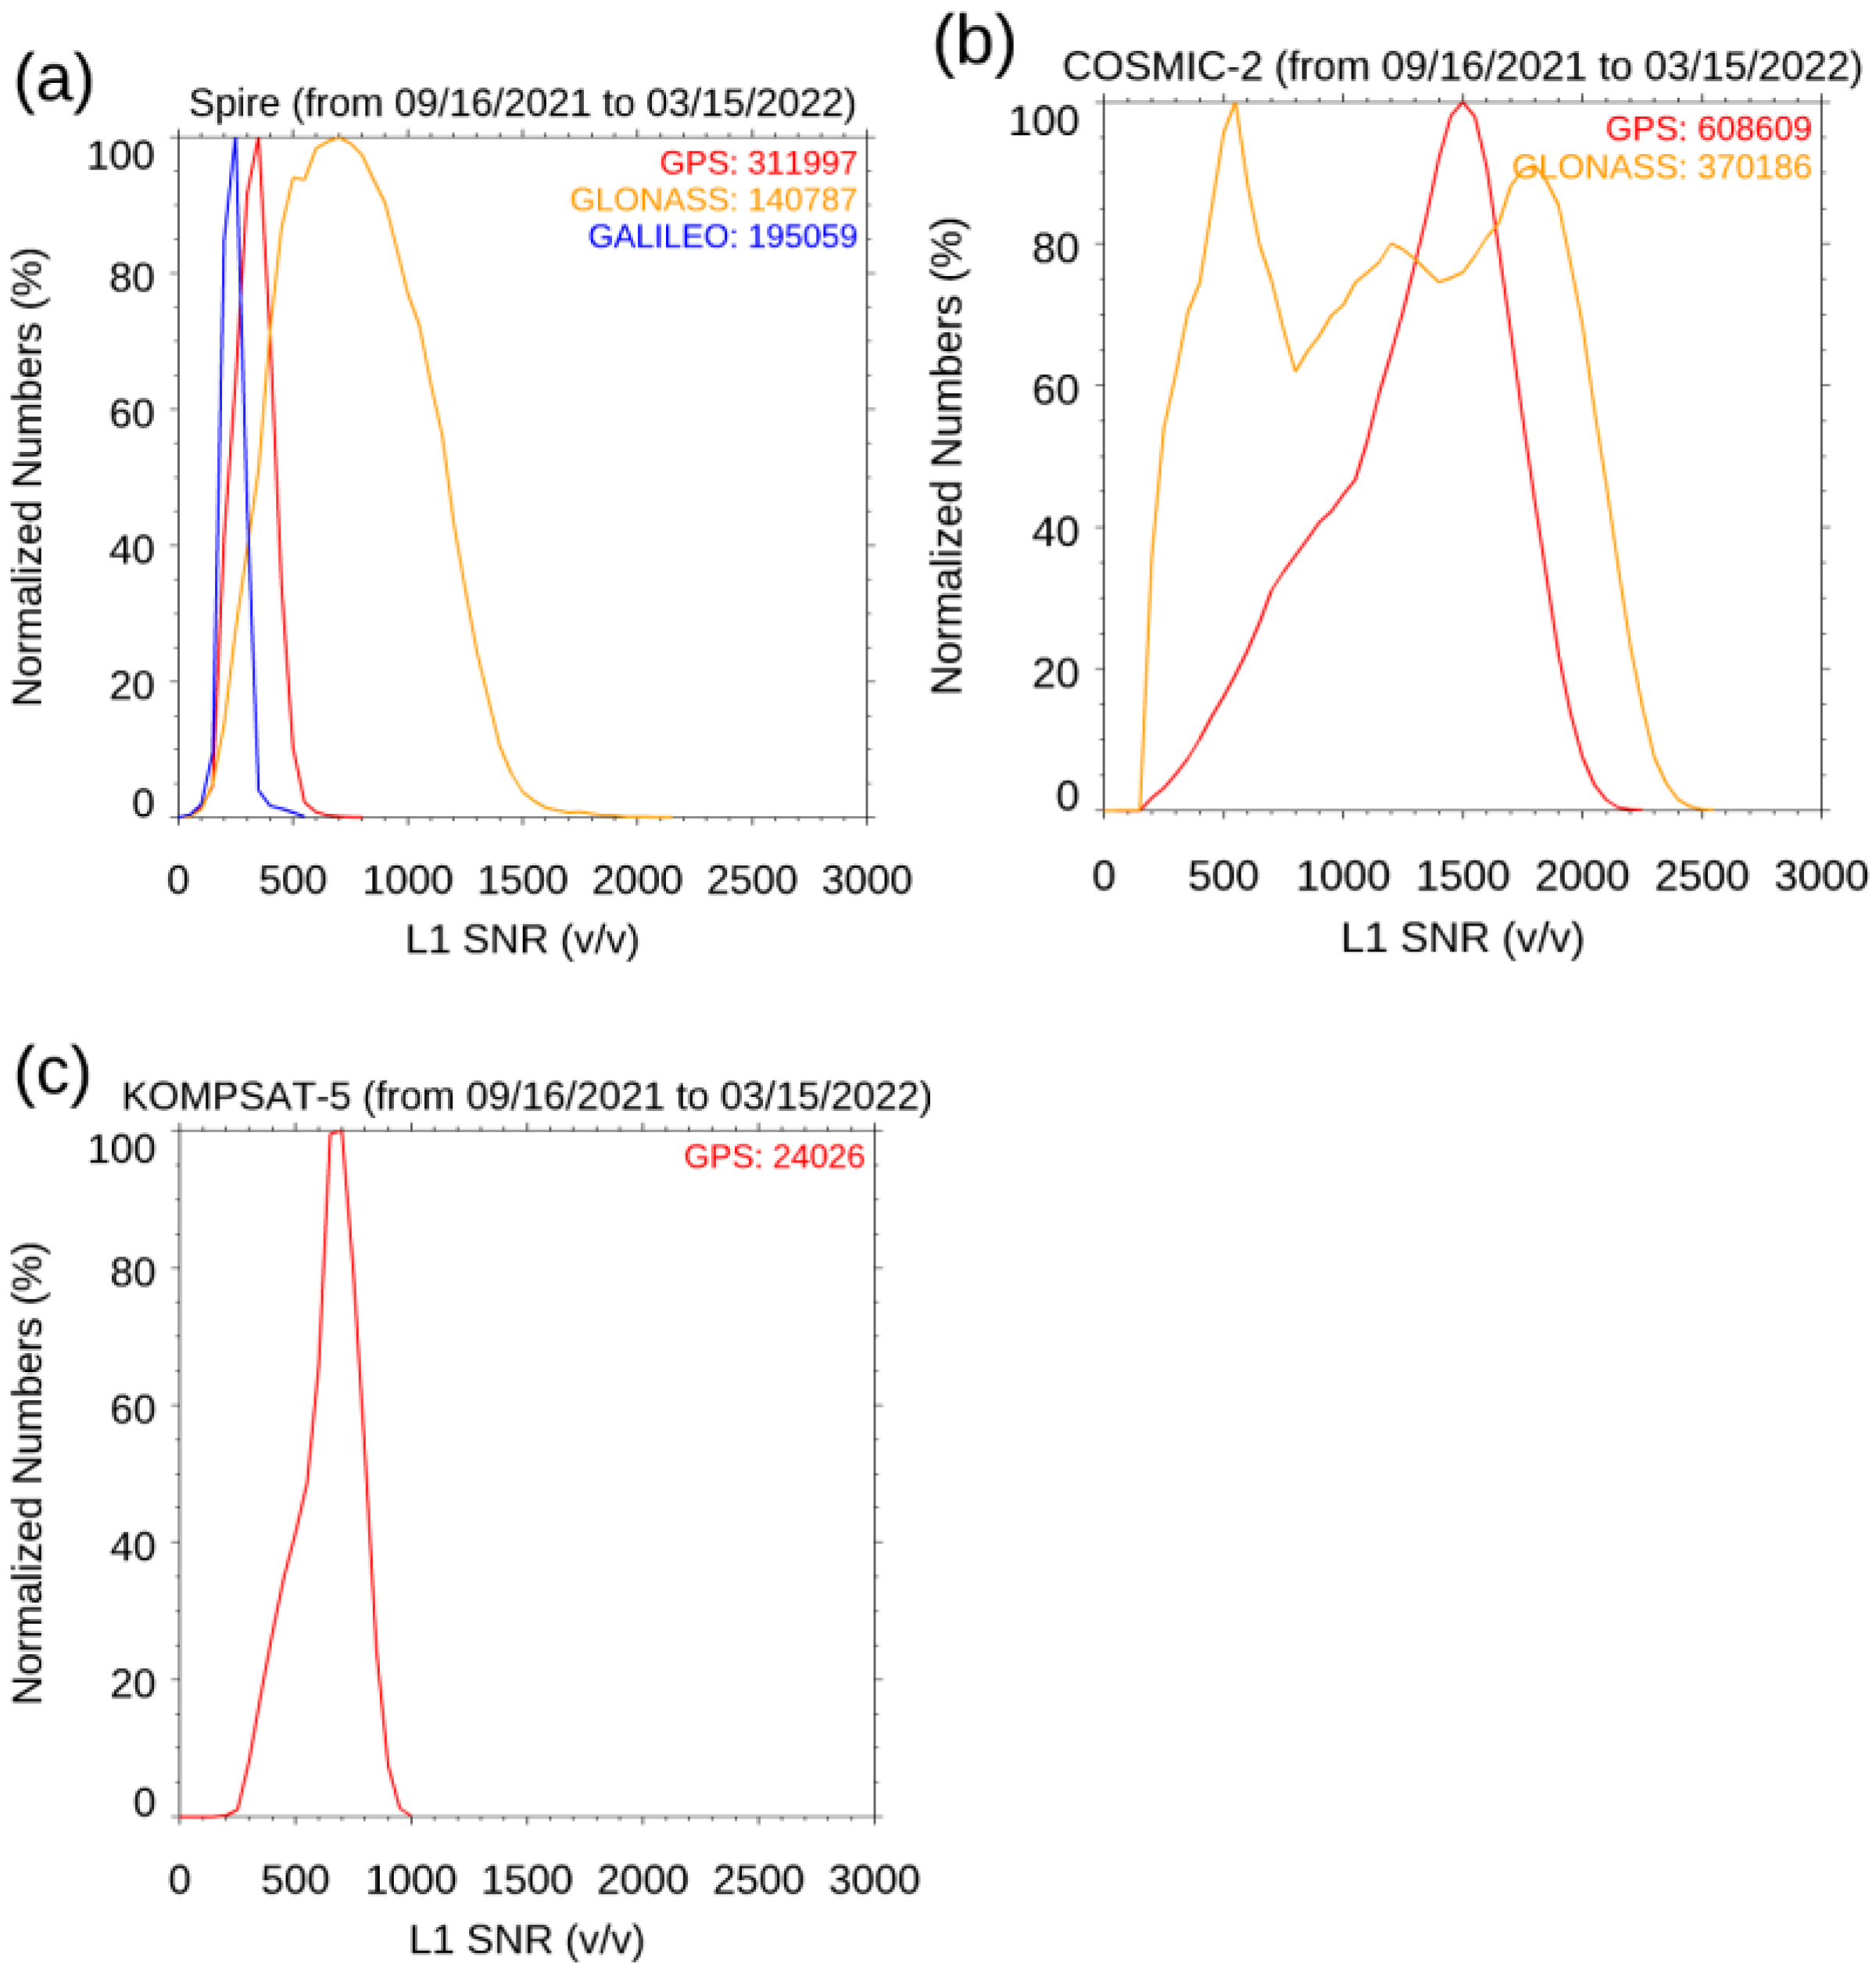
Figure 2.
Spatial distribution of the RO sample numbers for each 5° × 5° grid for (a) Spire, (b) COSMIC-2, and (c) KOMPSAT-5 for the whole DO3 period.
Figure 2.
Spatial distribution of the RO sample numbers for each 5° × 5° grid for (a) Spire, (b) COSMIC-2, and (c) KOMPSAT-5 for the whole DO3 period.
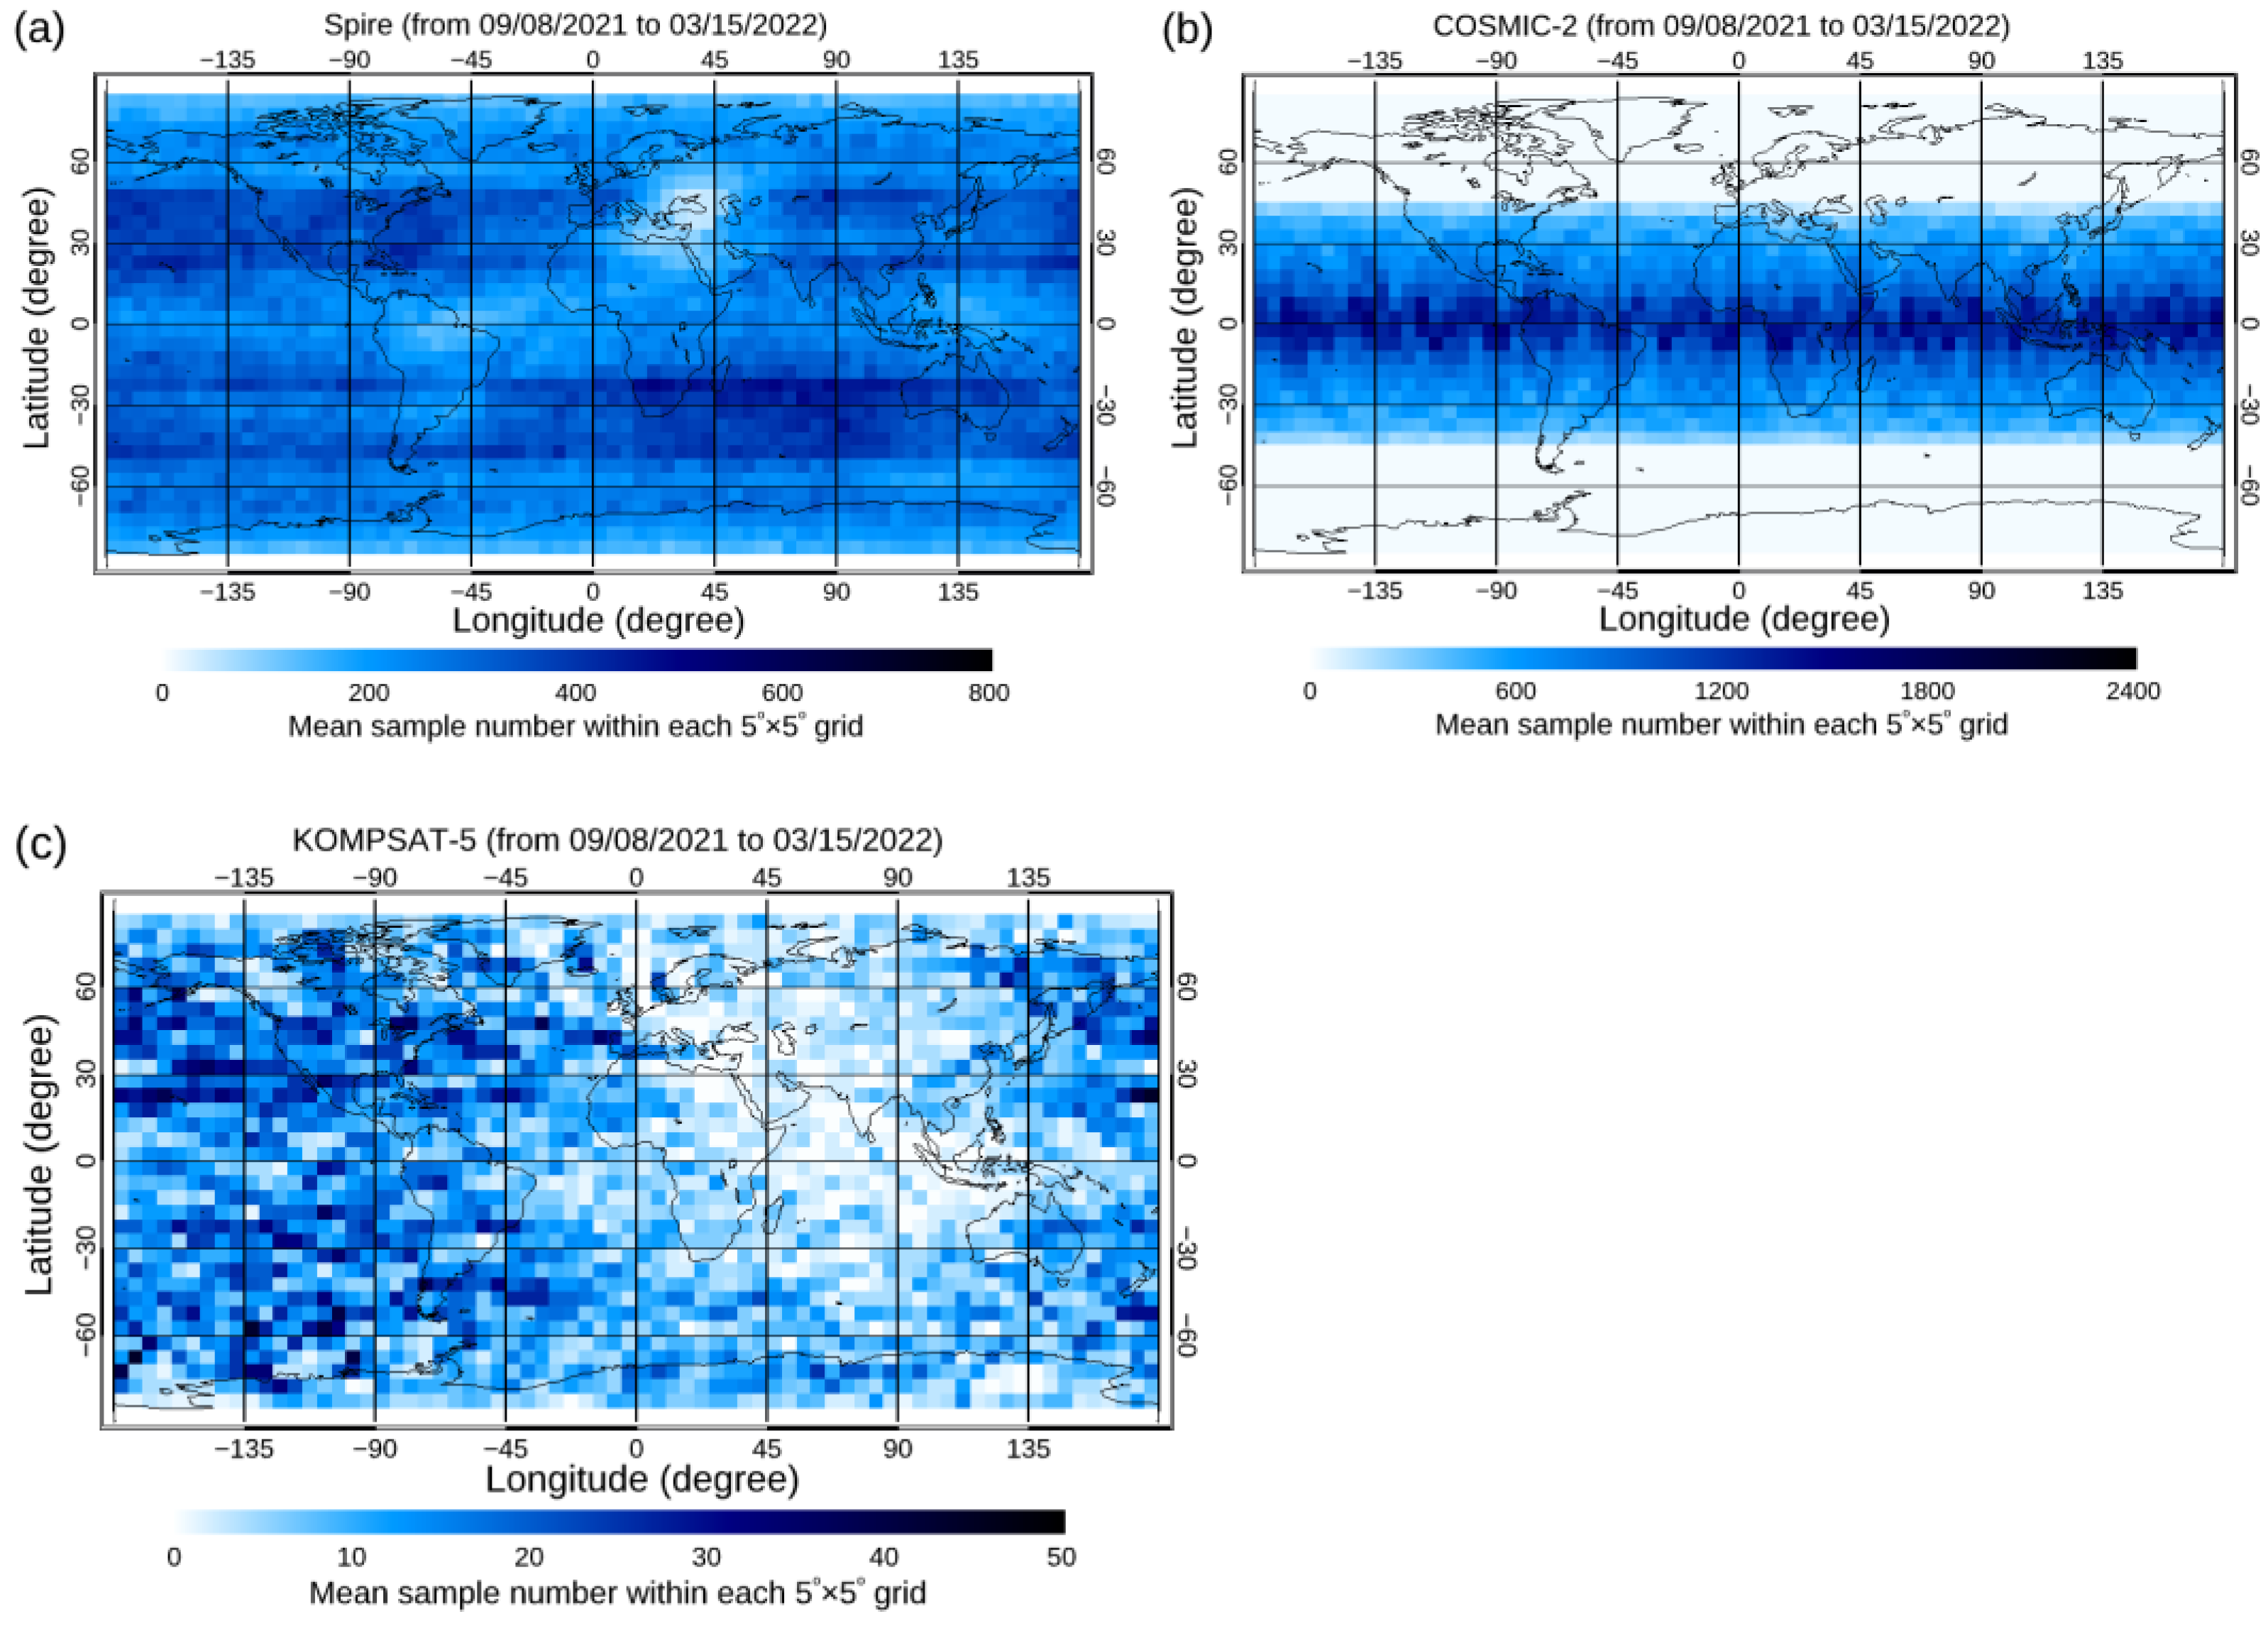
Figure 3.
Same as Figure 2, but for the hourly local time distribution binned at 5° latitude bin for (a) Spire, (b) COSMIC-2, and (c) KOMPSAT-5 for the DO3 period. The observation numbers at each box are indicated by the color bar.
Figure 3.
Same as Figure 2, but for the hourly local time distribution binned at 5° latitude bin for (a) Spire, (b) COSMIC-2, and (c) KOMPSAT-5 for the DO3 period. The observation numbers at each box are indicated by the color bar.
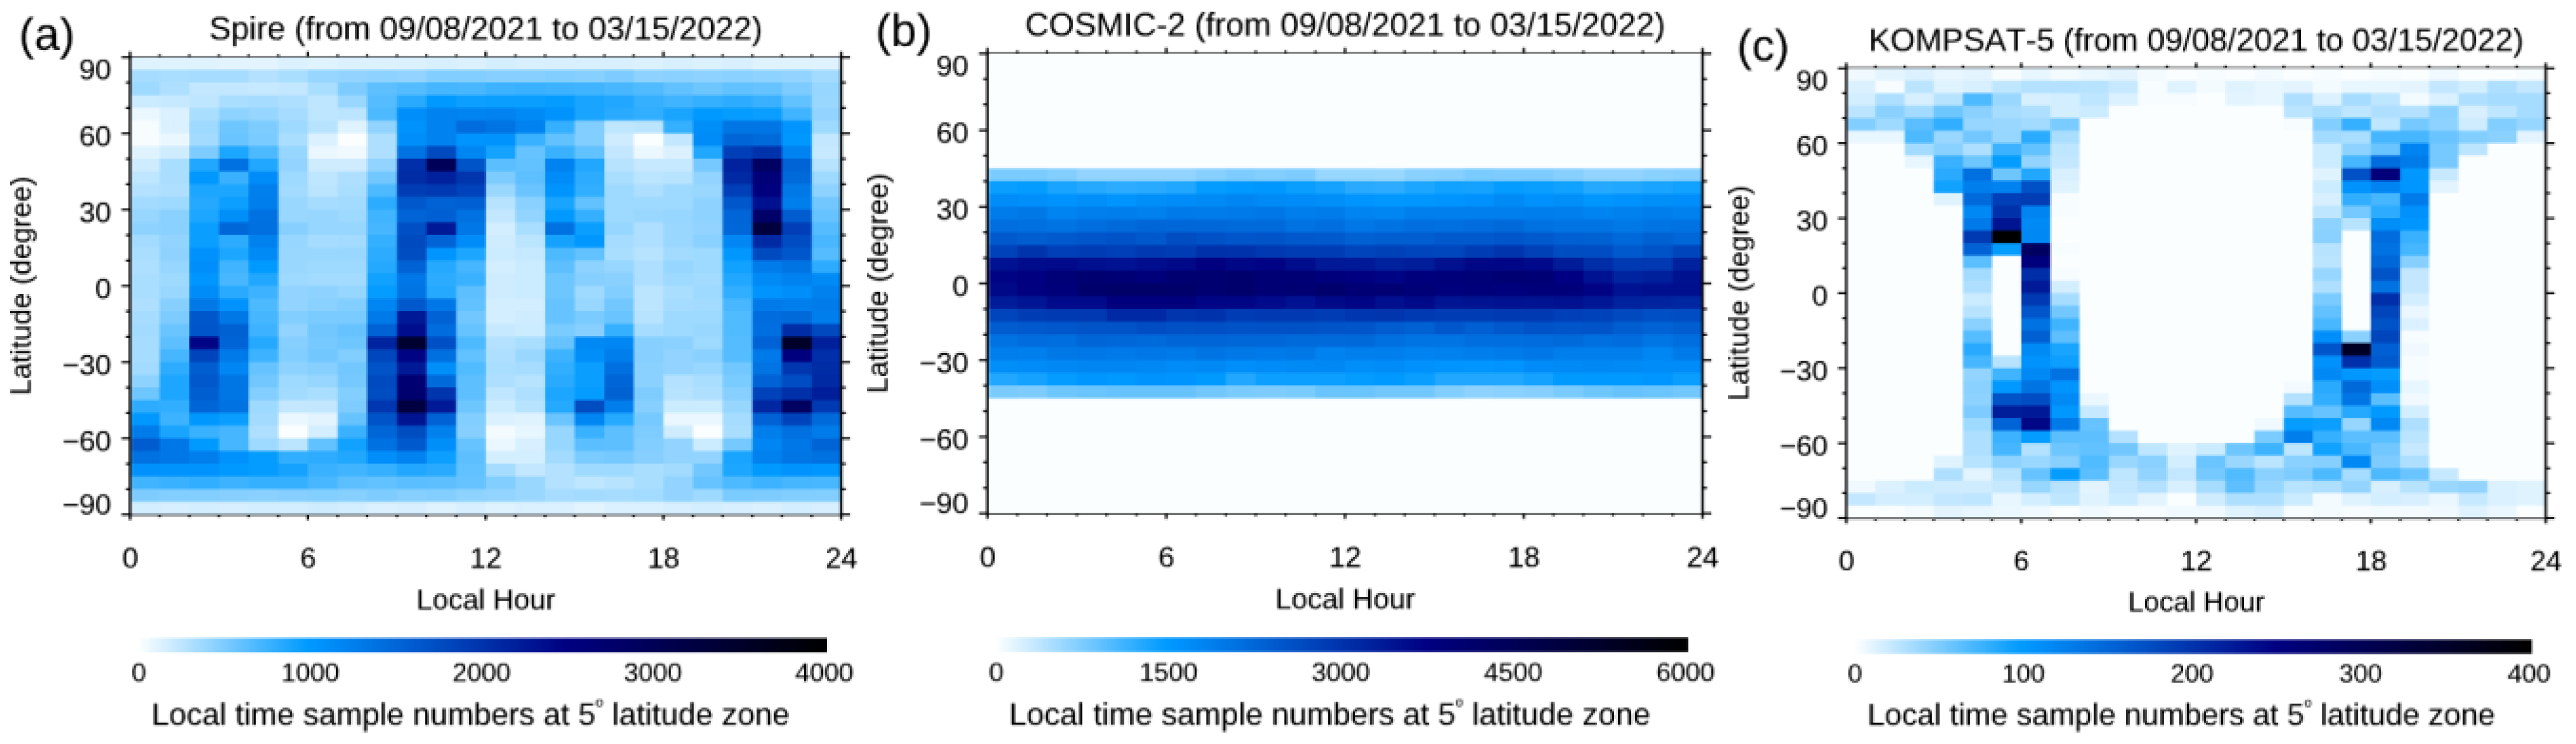
Figure 4.
Latitudinal distribution for Spire L1 SNR from 15 February to 15 March 2022 for (a) GPS, (b) GLONASS, and (c) GALILEO.
Figure 4.
Latitudinal distribution for Spire L1 SNR from 15 February to 15 March 2022 for (a) GPS, (b) GLONASS, and (c) GALILEO.
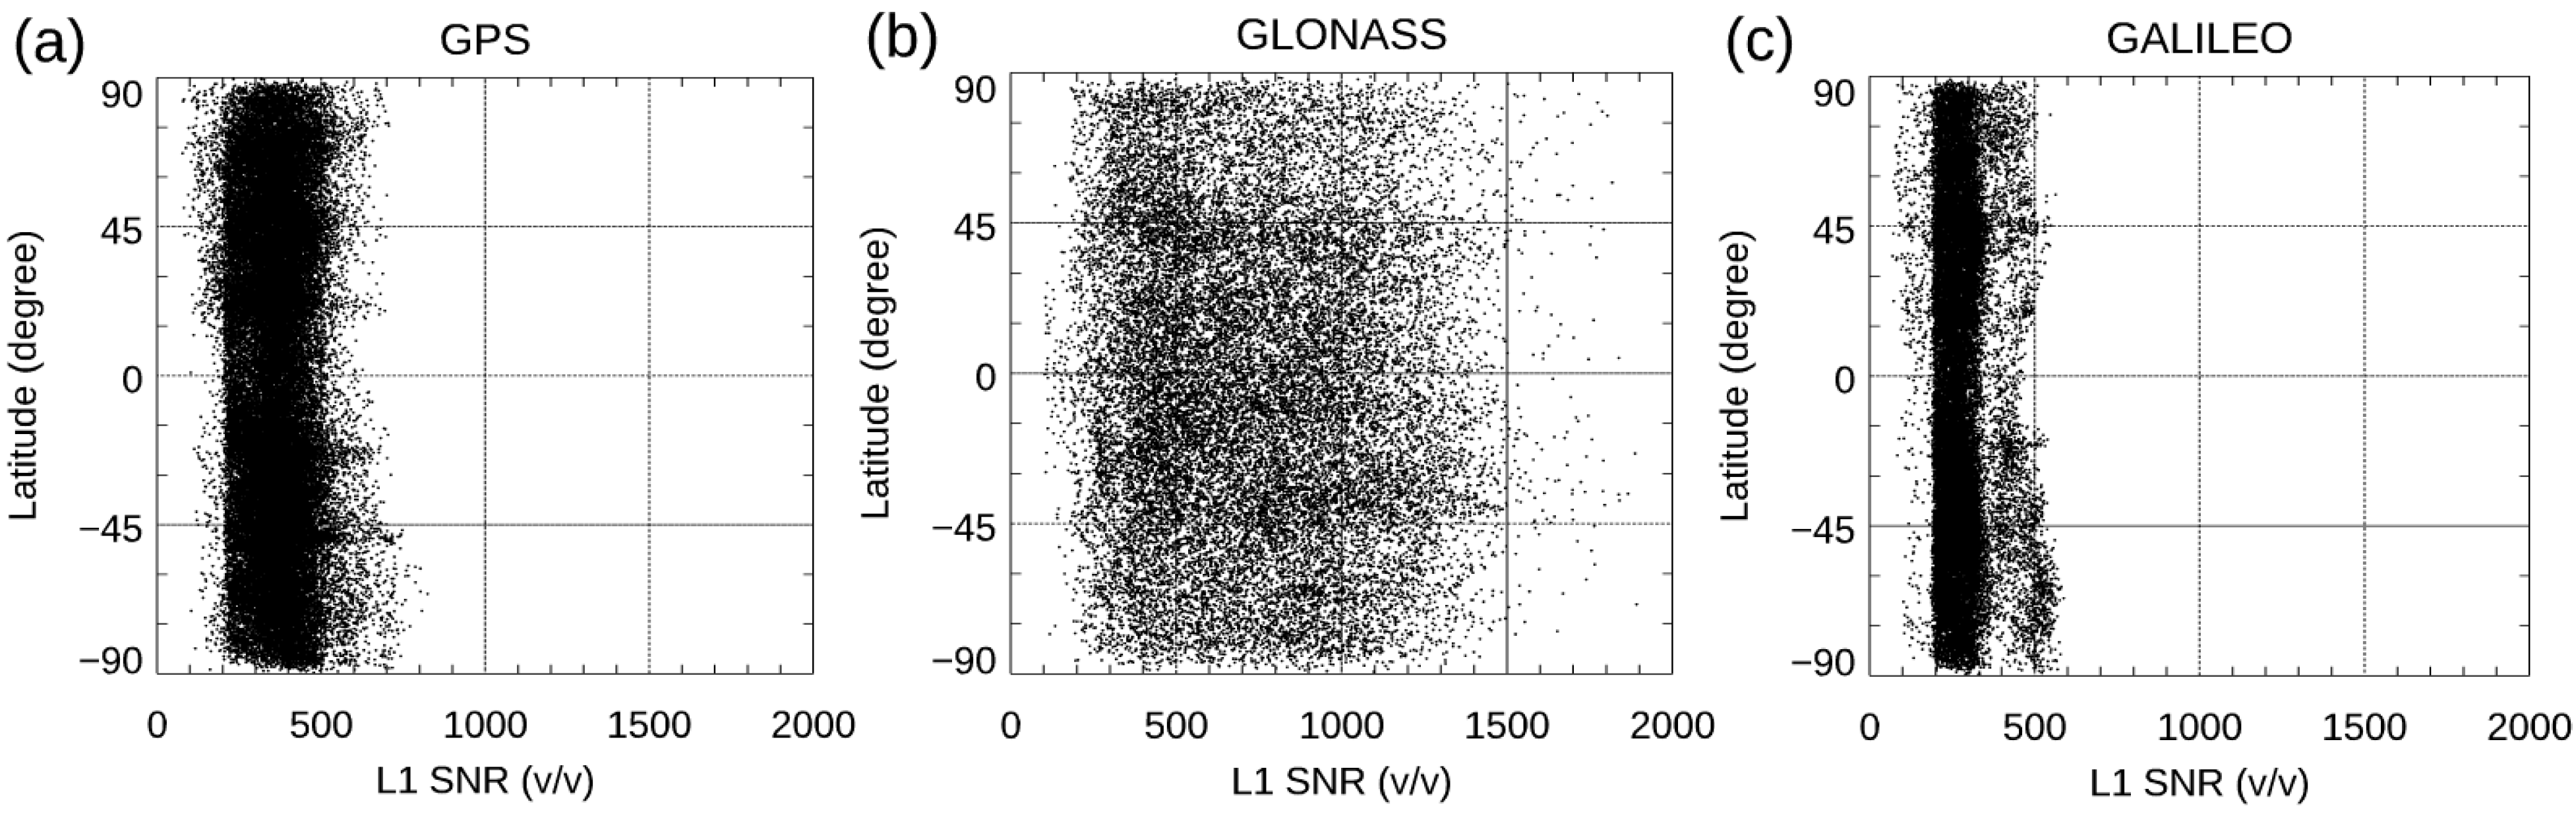
Figure 5.
Latitudinal distribution for COSMIC-2 L1 SNR from 15 February to 15 March 2022, for (a) GPS and (b) GLONASS.
Figure 5.
Latitudinal distribution for COSMIC-2 L1 SNR from 15 February to 15 March 2022, for (a) GPS and (b) GLONASS.
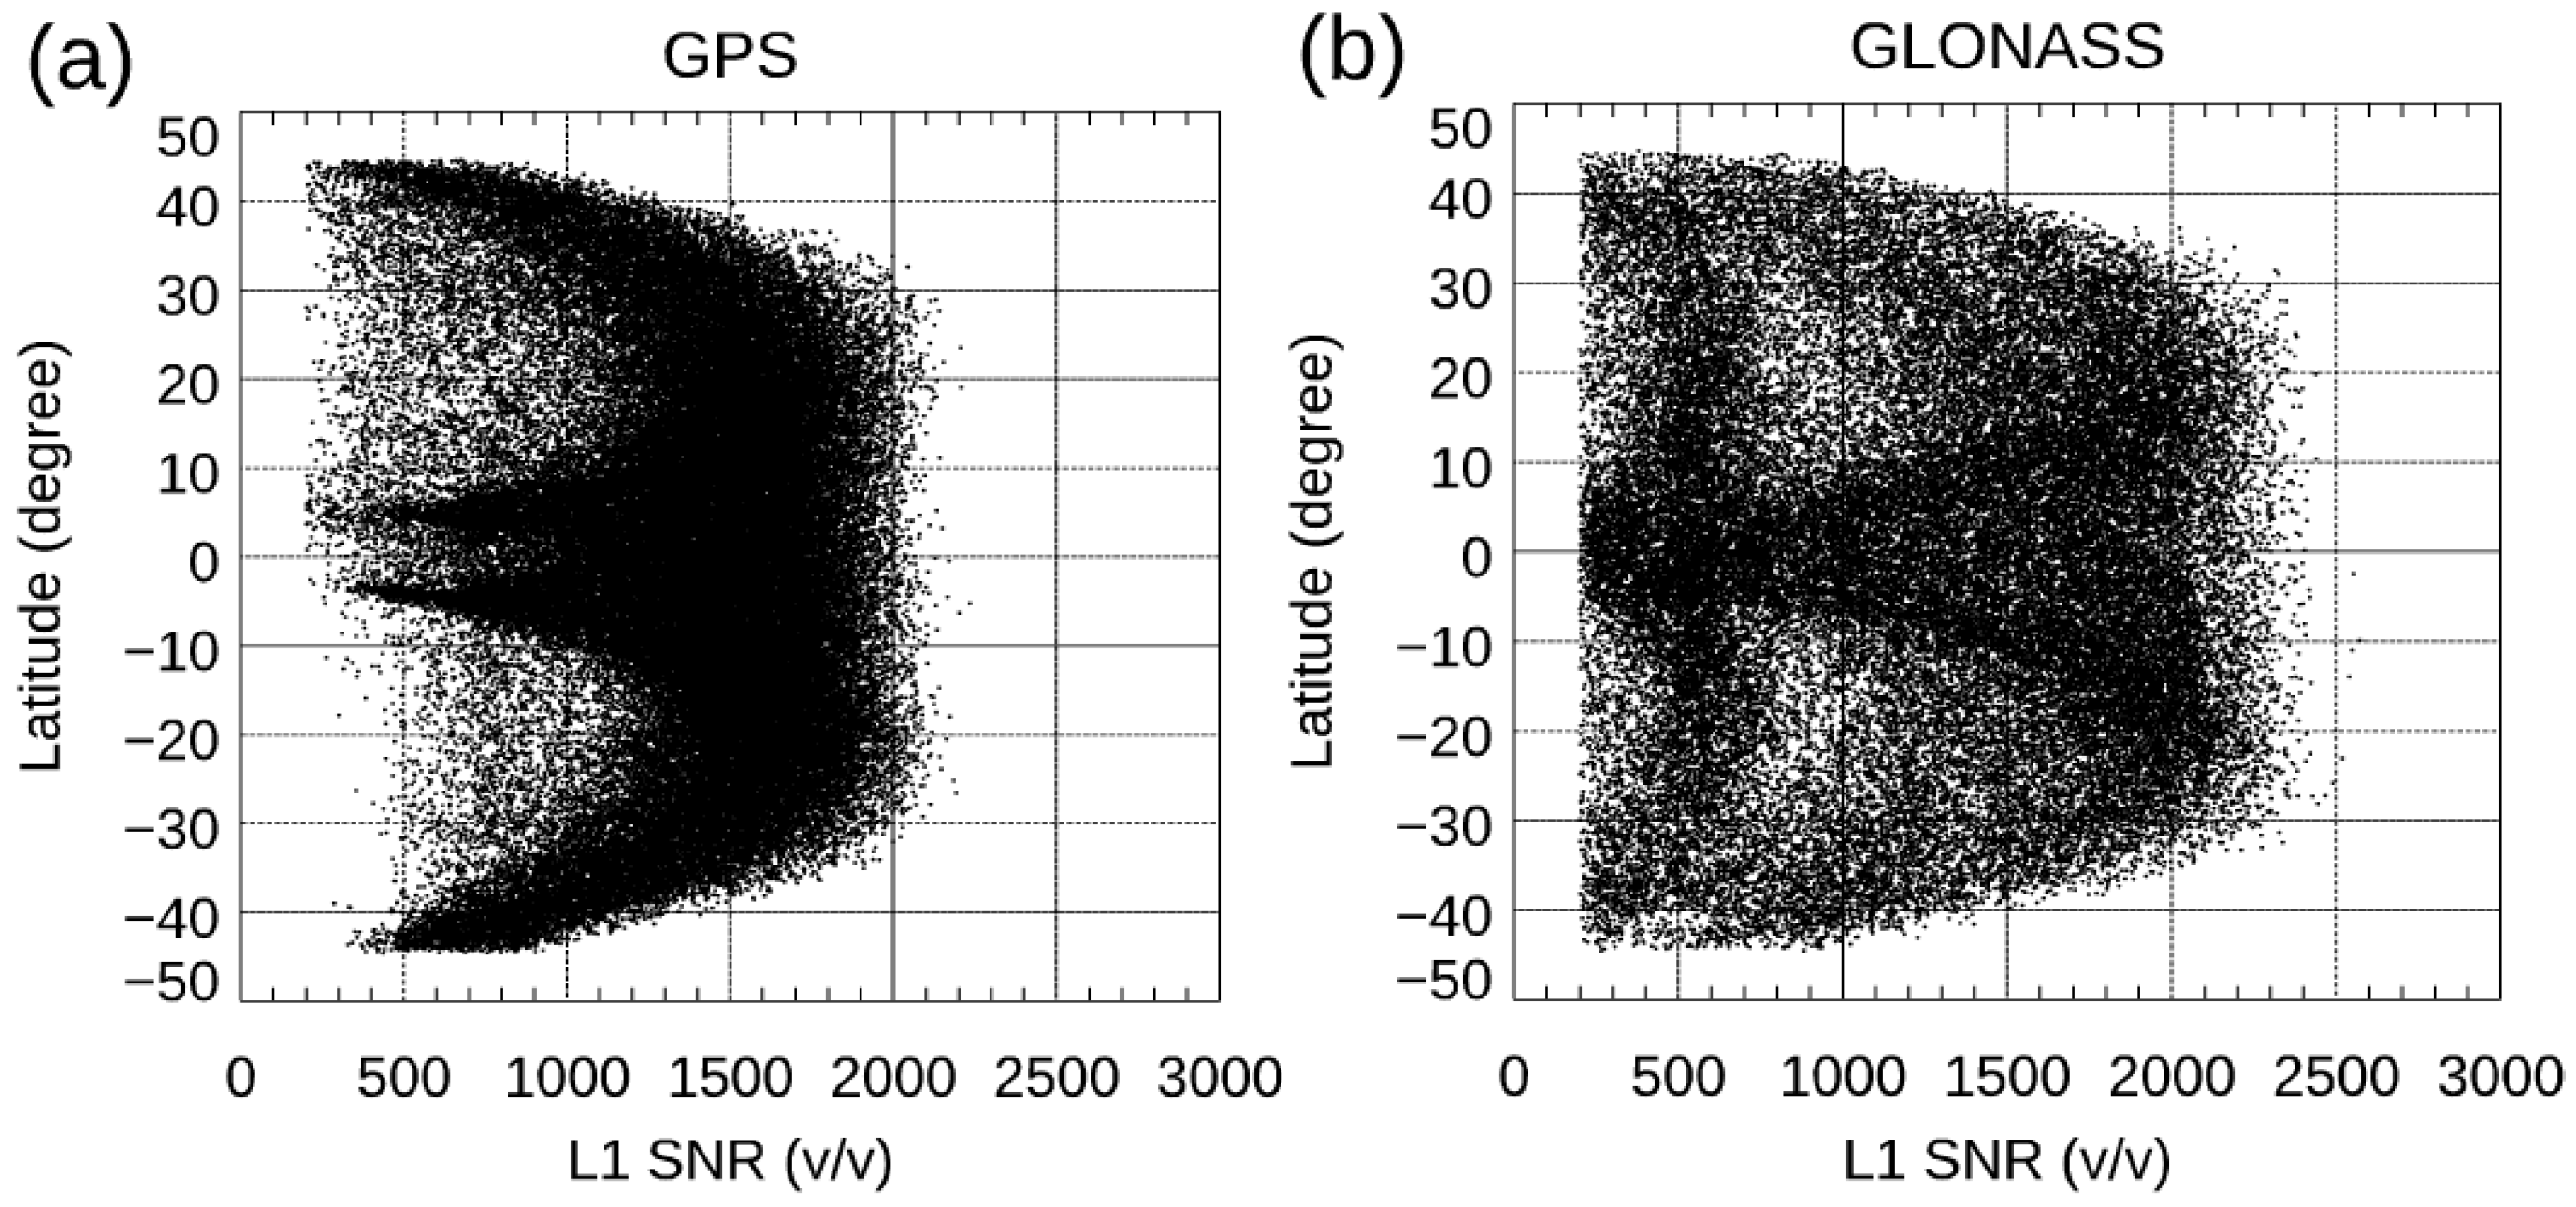
Figure 6.
Two-line element (TLE)-based SRO event prediction for two LEO receivers with the same GNSS satellite.
Figure 6.
Two-line element (TLE)-based SRO event prediction for two LEO receivers with the same GNSS satellite.
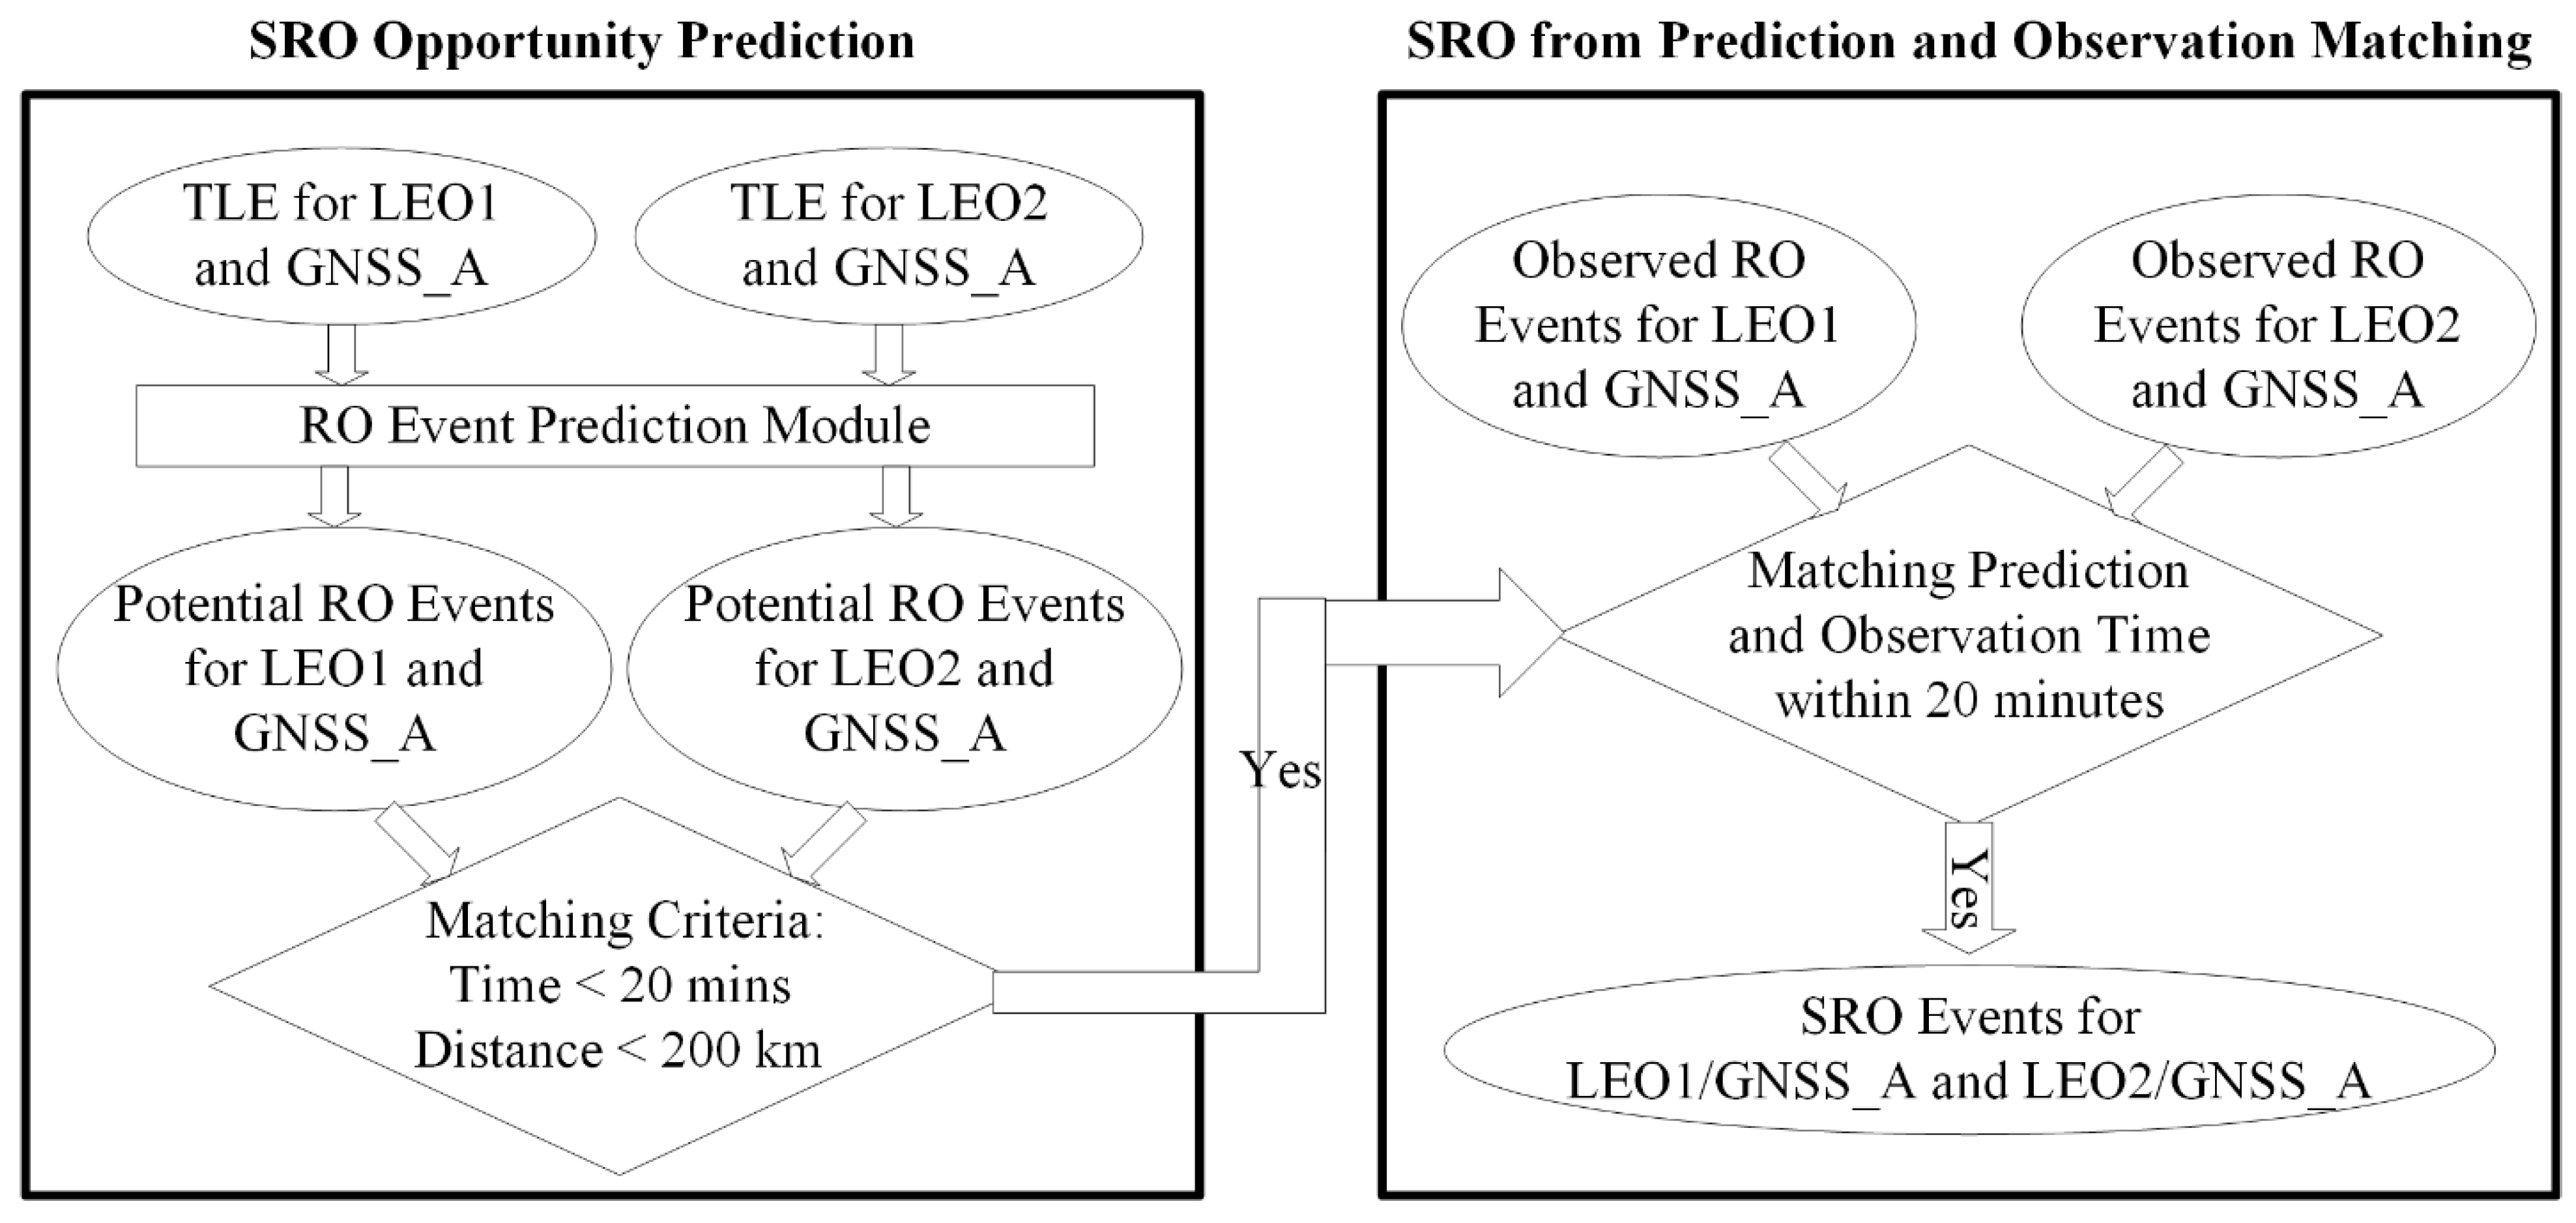
Figure 7.
The global mean of the lowest penetration height in June 2022 binned into a 5° × 5° grid for (a) Spire (from 90°N–90°S) and (b) COSMIC-2 (from 45°N–45°S).
Figure 7.
The global mean of the lowest penetration height in June 2022 binned into a 5° × 5° grid for (a) Spire (from 90°N–90°S) and (b) COSMIC-2 (from 45°N–45°S).

Figure 8.
(a) The RO penetration percentage (defined as the observation number at each penetration depth relative to the observation number at 8 km) over oceans within [45°N, 45°S] during the DO3 period and (b) the corresponding numbers of observations from surface to 14 km altitude for COSMIC-2, Spire, KOMPSAT5, and PAZ.

Figure 9.
The mean difference (in red line) and standard deviation (in green line) for (a) fractional bending angle, (b) dry temperature, and (c) water vapor mixing ratio comparisons for the Spire S128 and S119 DO3 SRO pairs. The corresponding numbers of observations are in blue lines.
Figure 9.
The mean difference (in red line) and standard deviation (in green line) for (a) fractional bending angle, (b) dry temperature, and (c) water vapor mixing ratio comparisons for the Spire S128 and S119 DO3 SRO pairs. The corresponding numbers of observations are in blue lines.

Figure 10.
The DO3 SRO fractional BA comparison for Spire S120 and S124 receivers for GPS (in red line), GLONASS (in orange line), and GALILEO (in blue line) for (a) the fractional mean difference, (b) the standard deviation, and (c) the observation numbers from surface to 40 km altitude.
Figure 10.
The DO3 SRO fractional BA comparison for Spire S120 and S124 receivers for GPS (in red line), GLONASS (in orange line), and GALILEO (in blue line) for (a) the fractional mean difference, (b) the standard deviation, and (c) the observation numbers from surface to 40 km altitude.
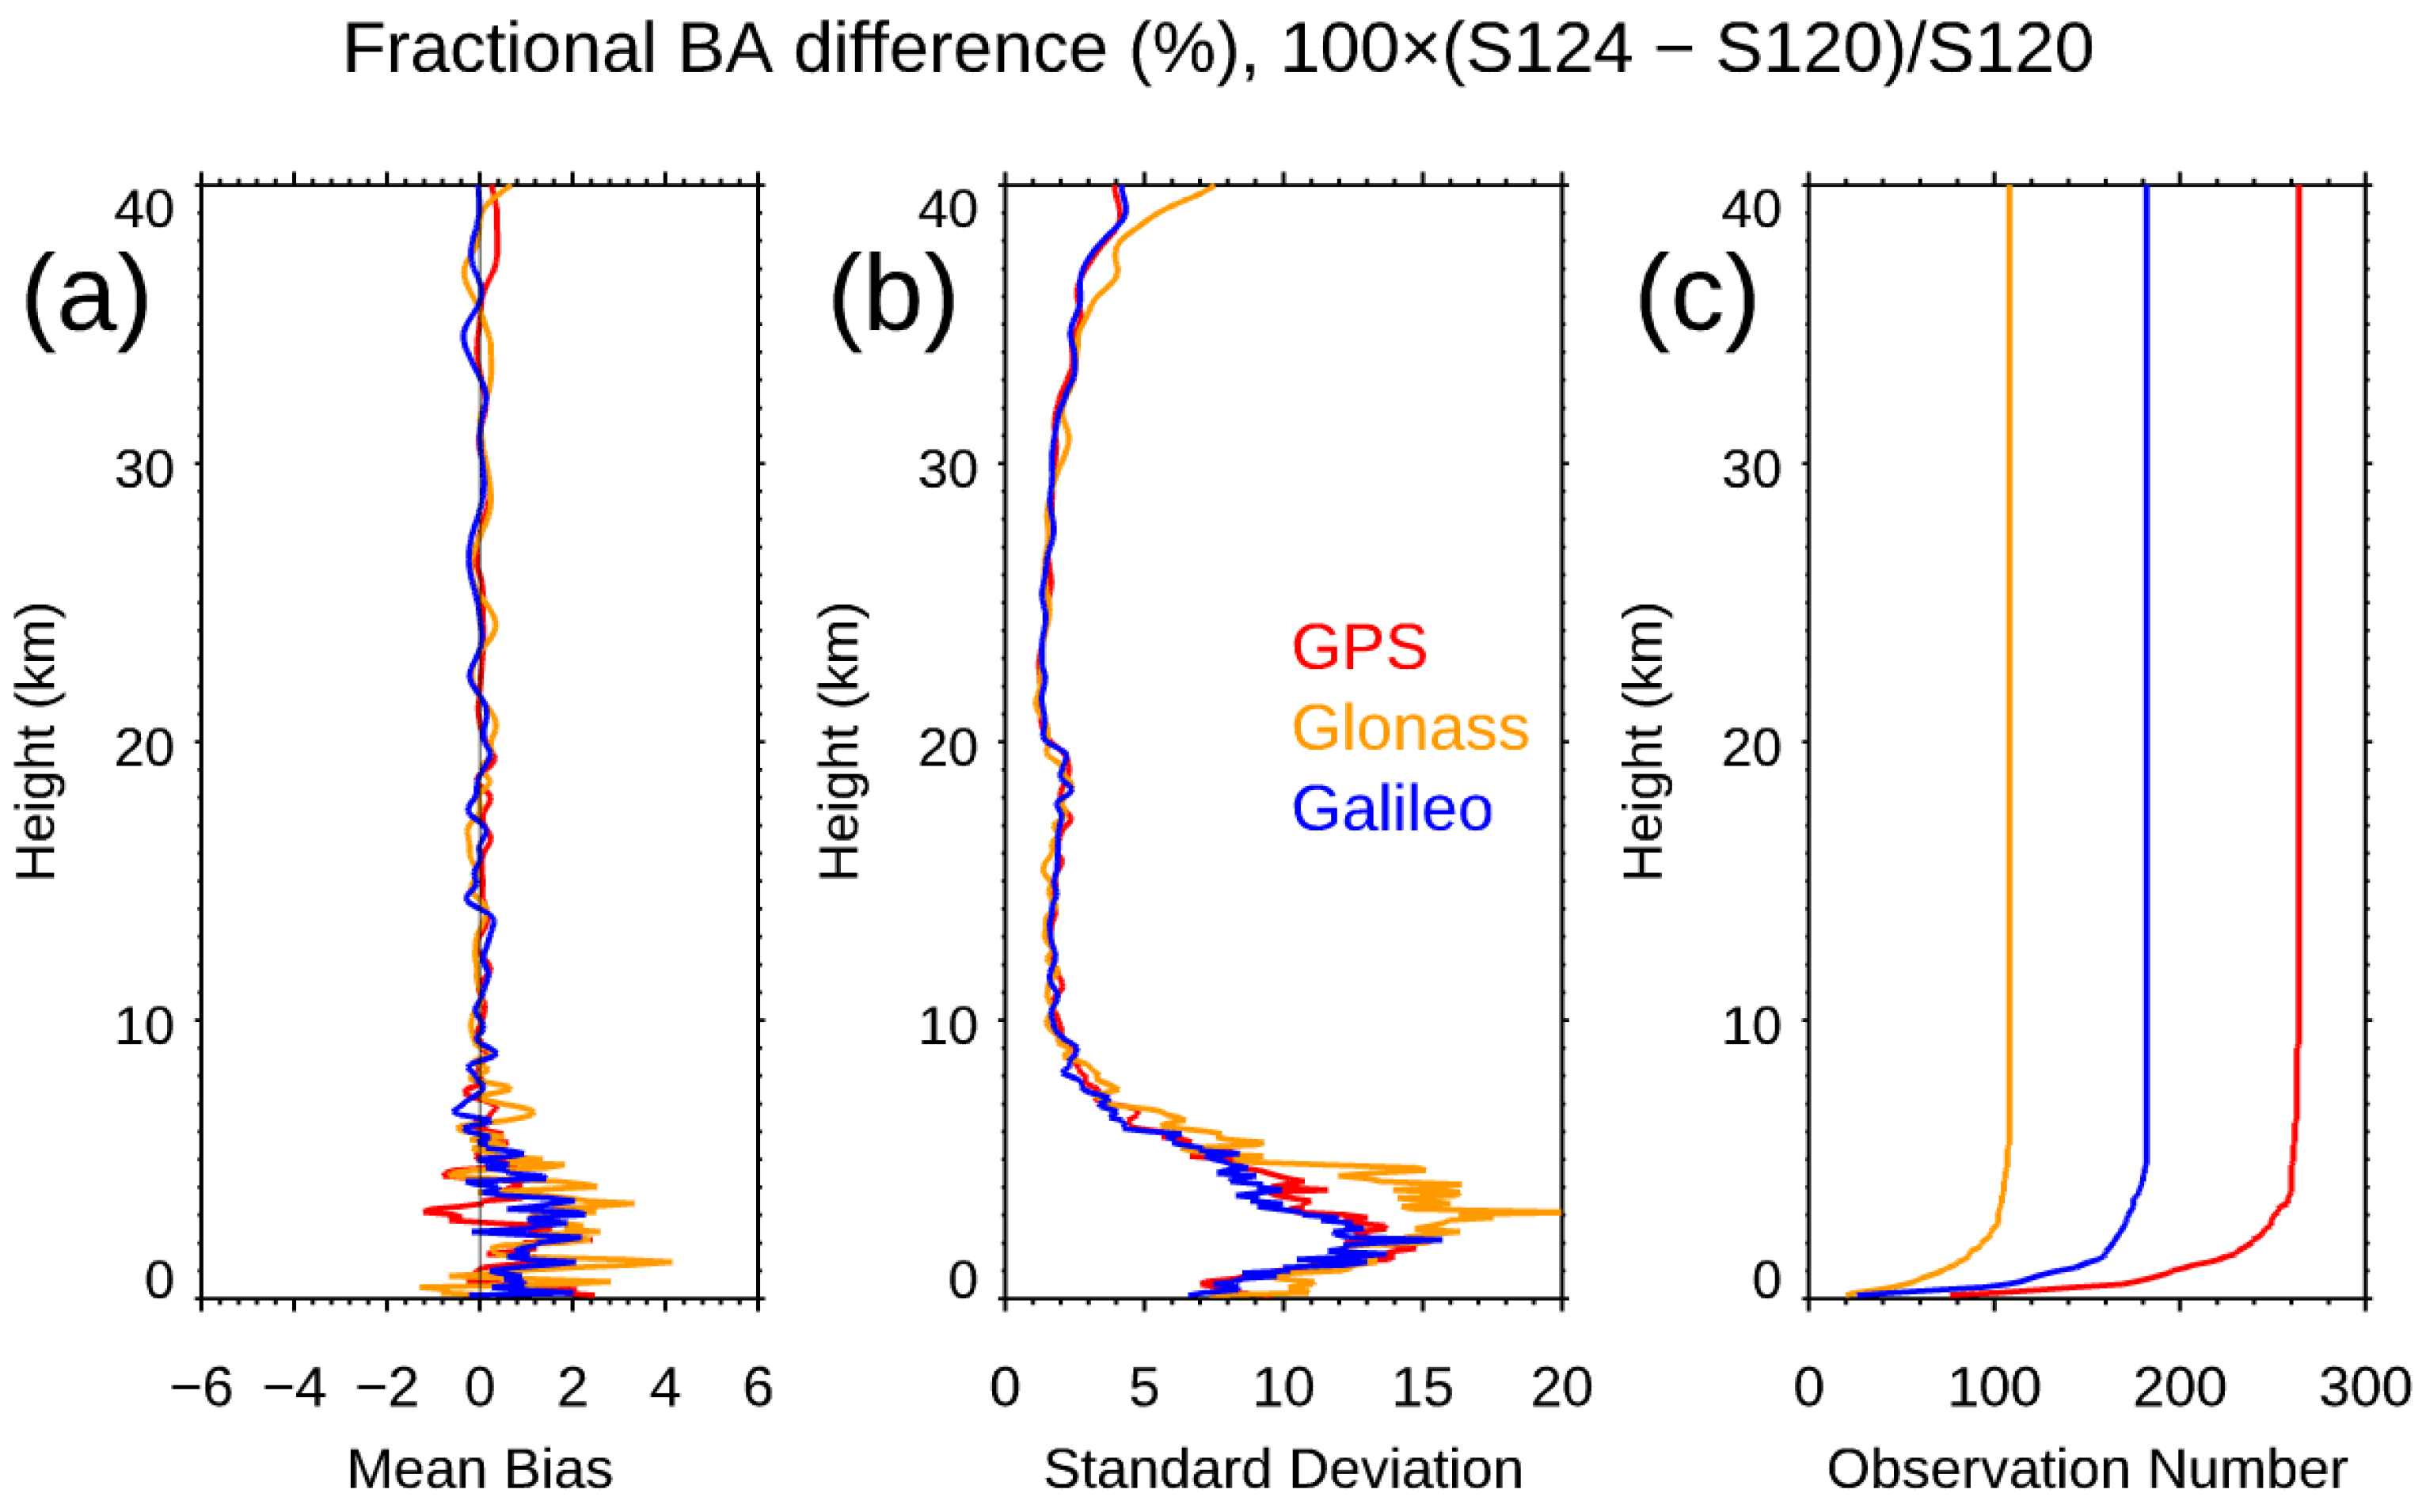
Figure 11.
The fractional BA difference, the corresponding standard deviation, and the sample number at each vertical level from surface to 40 km altitude for Spire (in red line), COSMIC-2 (in green line), and COSMIC-1 (in blue line) for (a) mid-latitude for the southern hemisphere (20°S–45°S), (b) tropical region (20°N–20°S), and (c) mid-latitude for the northern hemisphere (45°N–20°N). We also compute the standard error of the mean (SEM) in a vertical line superimposed on the mean.

Figure 12.
The fractional BA Spire–RO comparison for (a) mean differences, (b) the standard deviations, and (c) observation numbers for the Spire–PAZ, Spire–KOMPSAT-5, Spire–Metop-B, Spire–Metop-C, and Spire–TerraSAR-X SRO pairs during the DO4 period.
Figure 12.
The fractional BA Spire–RO comparison for (a) mean differences, (b) the standard deviations, and (c) observation numbers for the Spire–PAZ, Spire–KOMPSAT-5, Spire–Metop-B, Spire–Metop-C, and Spire–TerraSAR-X SRO pairs during the DO4 period.
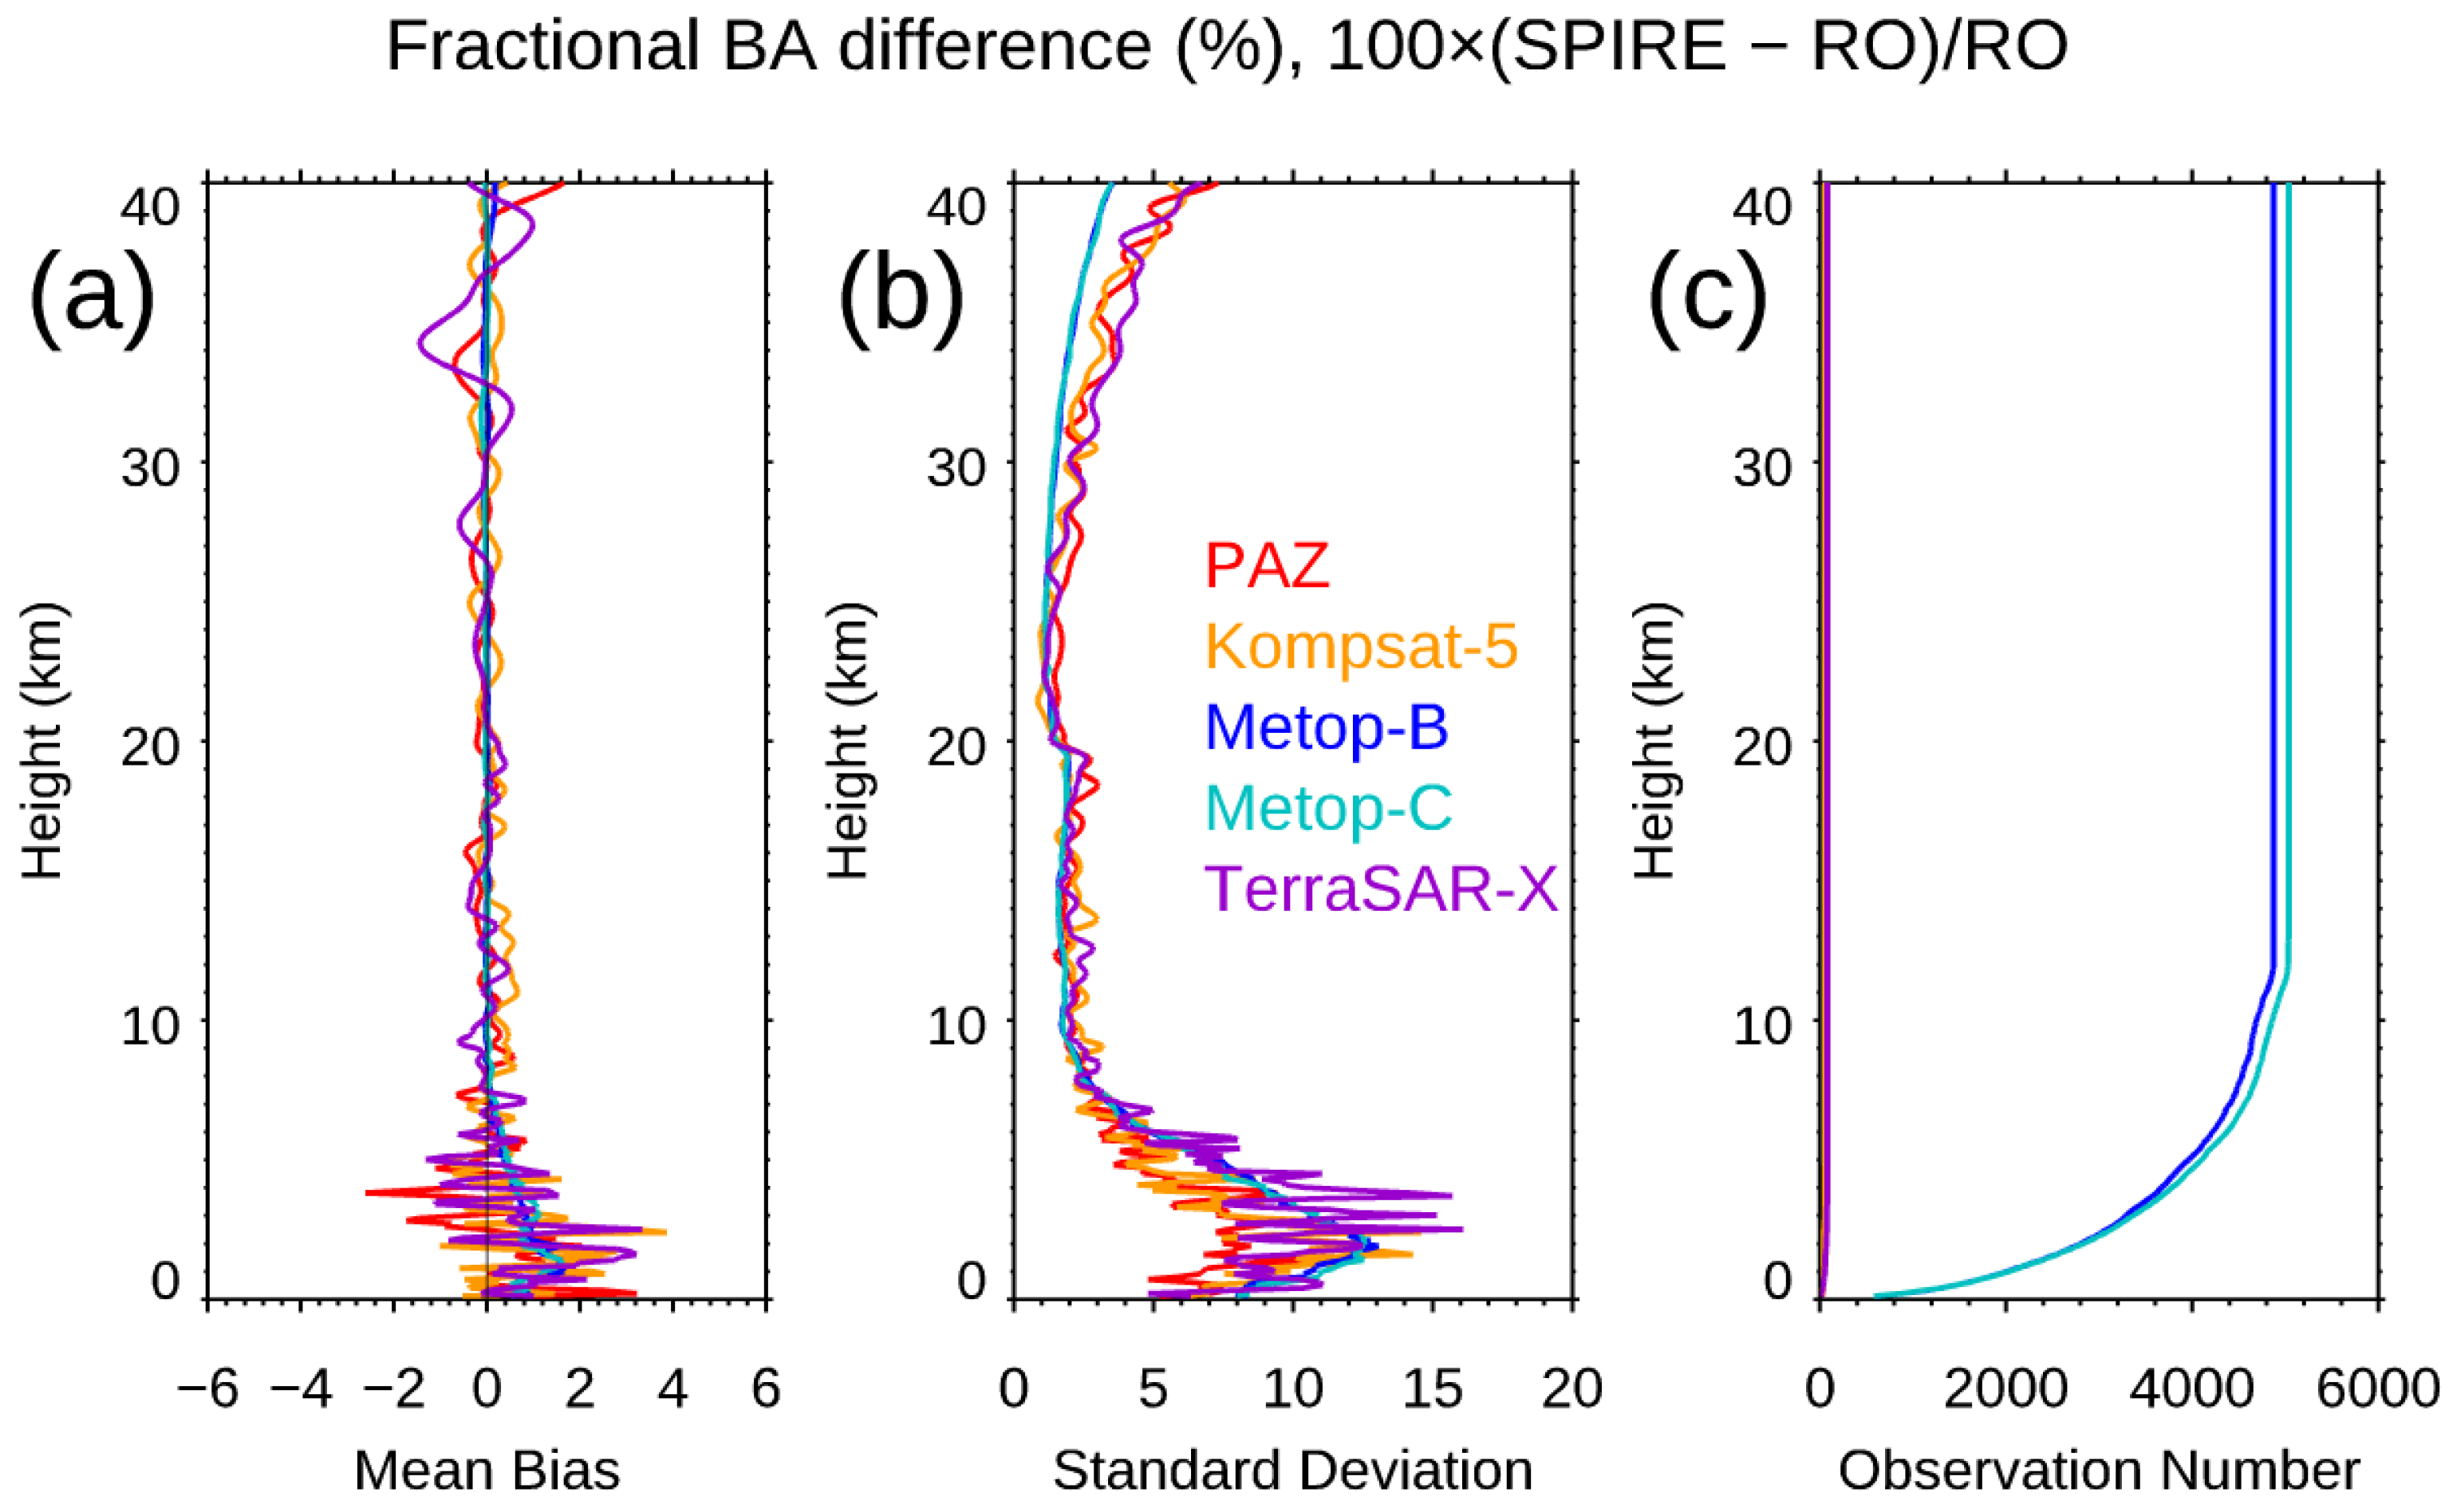
Figure 13.
Bending angle profile comparison between COSMIC-2 and Spire for (a) fractional BA profile differences, (b) the standard deviations, and (c) vertical observation numbers for five COSMIC-2 SNR groups (i.e., 0–500 v/v, 500–1000 v/v, 1000–1500 v/v, 1500–2000 v/v, and >2000 v/v).
Figure 13.
Bending angle profile comparison between COSMIC-2 and Spire for (a) fractional BA profile differences, (b) the standard deviations, and (c) vertical observation numbers for five COSMIC-2 SNR groups (i.e., 0–500 v/v, 500–1000 v/v, 1000–1500 v/v, 1500–2000 v/v, and >2000 v/v).

Figure 14.
Bending angle profile comparison between STAR and UCAR Spire for GPS (in red line), GLONASS (in orange line), and GALILEO (in blue line) for (a) the fractional mean difference, (b) the standard deviation, and (c) the observation numbers from surface to 40 km altitude.
Figure 14.
Bending angle profile comparison between STAR and UCAR Spire for GPS (in red line), GLONASS (in orange line), and GALILEO (in blue line) for (a) the fractional mean difference, (b) the standard deviation, and (c) the observation numbers from surface to 40 km altitude.
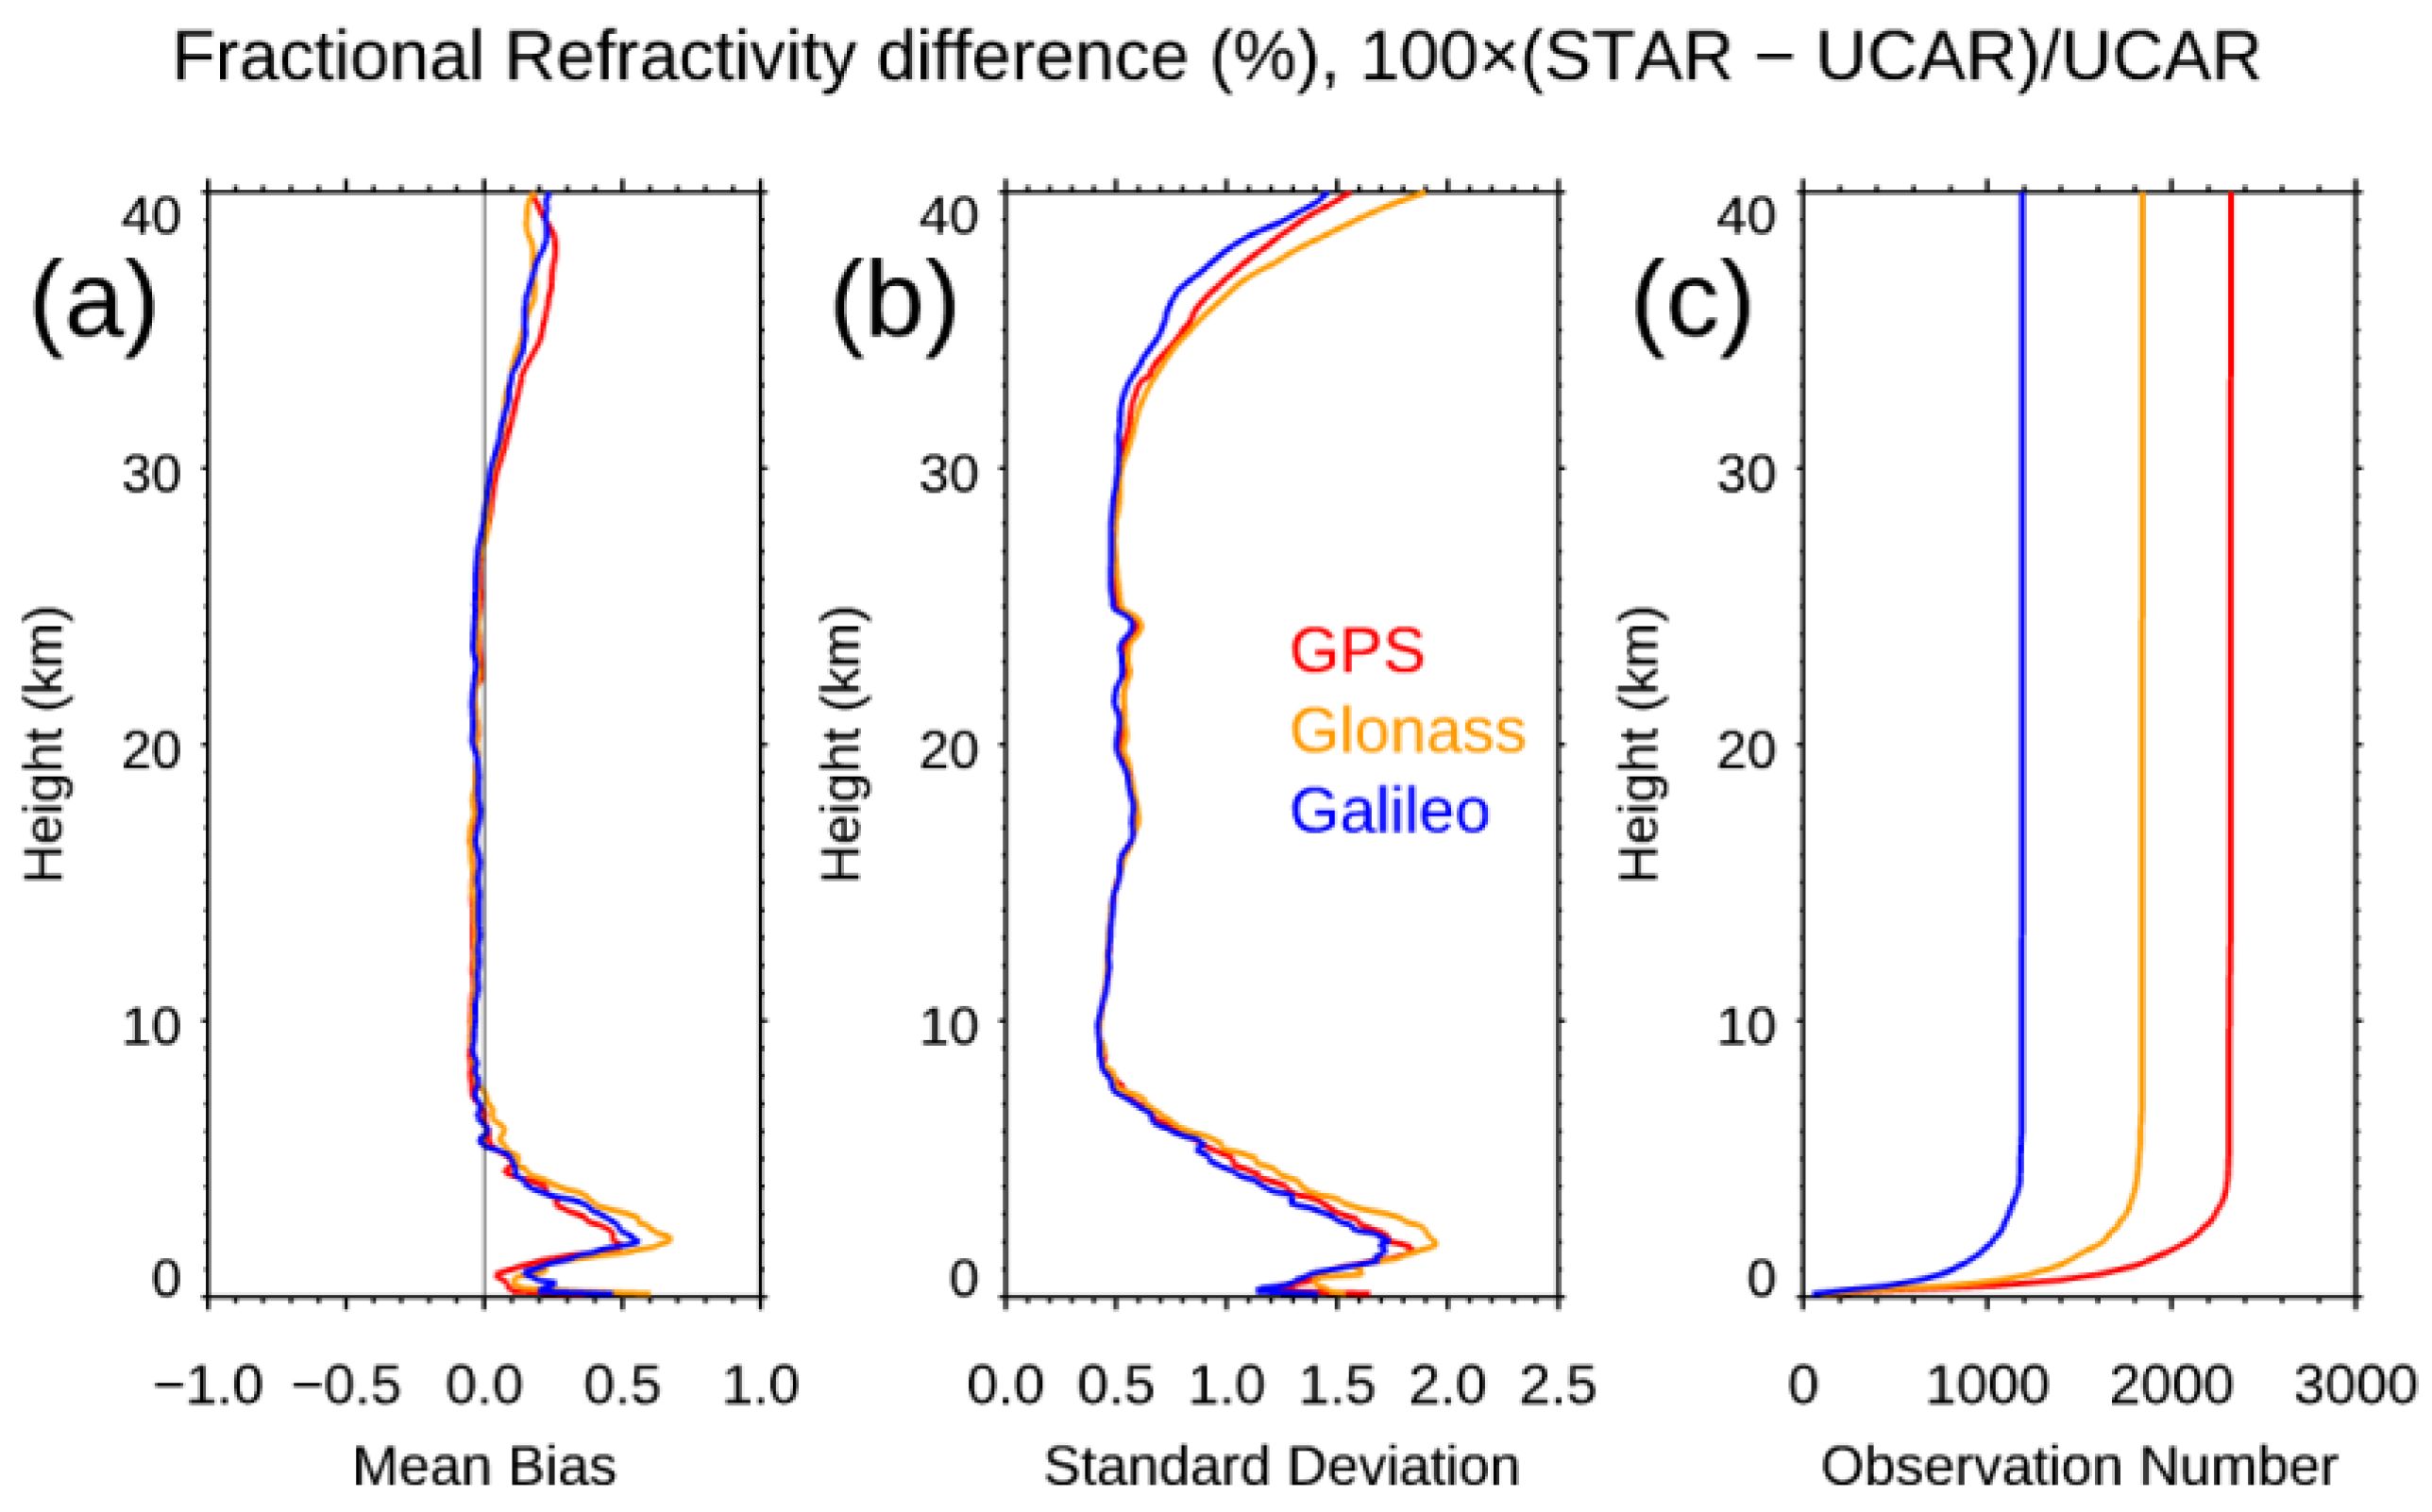
Figure 15.
Spire–ERA5 mean BA fractional difference and corresponding standard deviations for (a) 45°N to 45°S, (b) 45°N to 30°N, (c) 30°N to 30°S, and (d) 30°S to 45°S. Similar to (a–d), we also compare the COSMIC-2 and ERA5 BA fractional differences and corresponding standard deviations in (e) 45°N to 45°S, (f) 45°N to 30°N, (g) 30°N to 30°S, and (h) 30°S to 45°S.
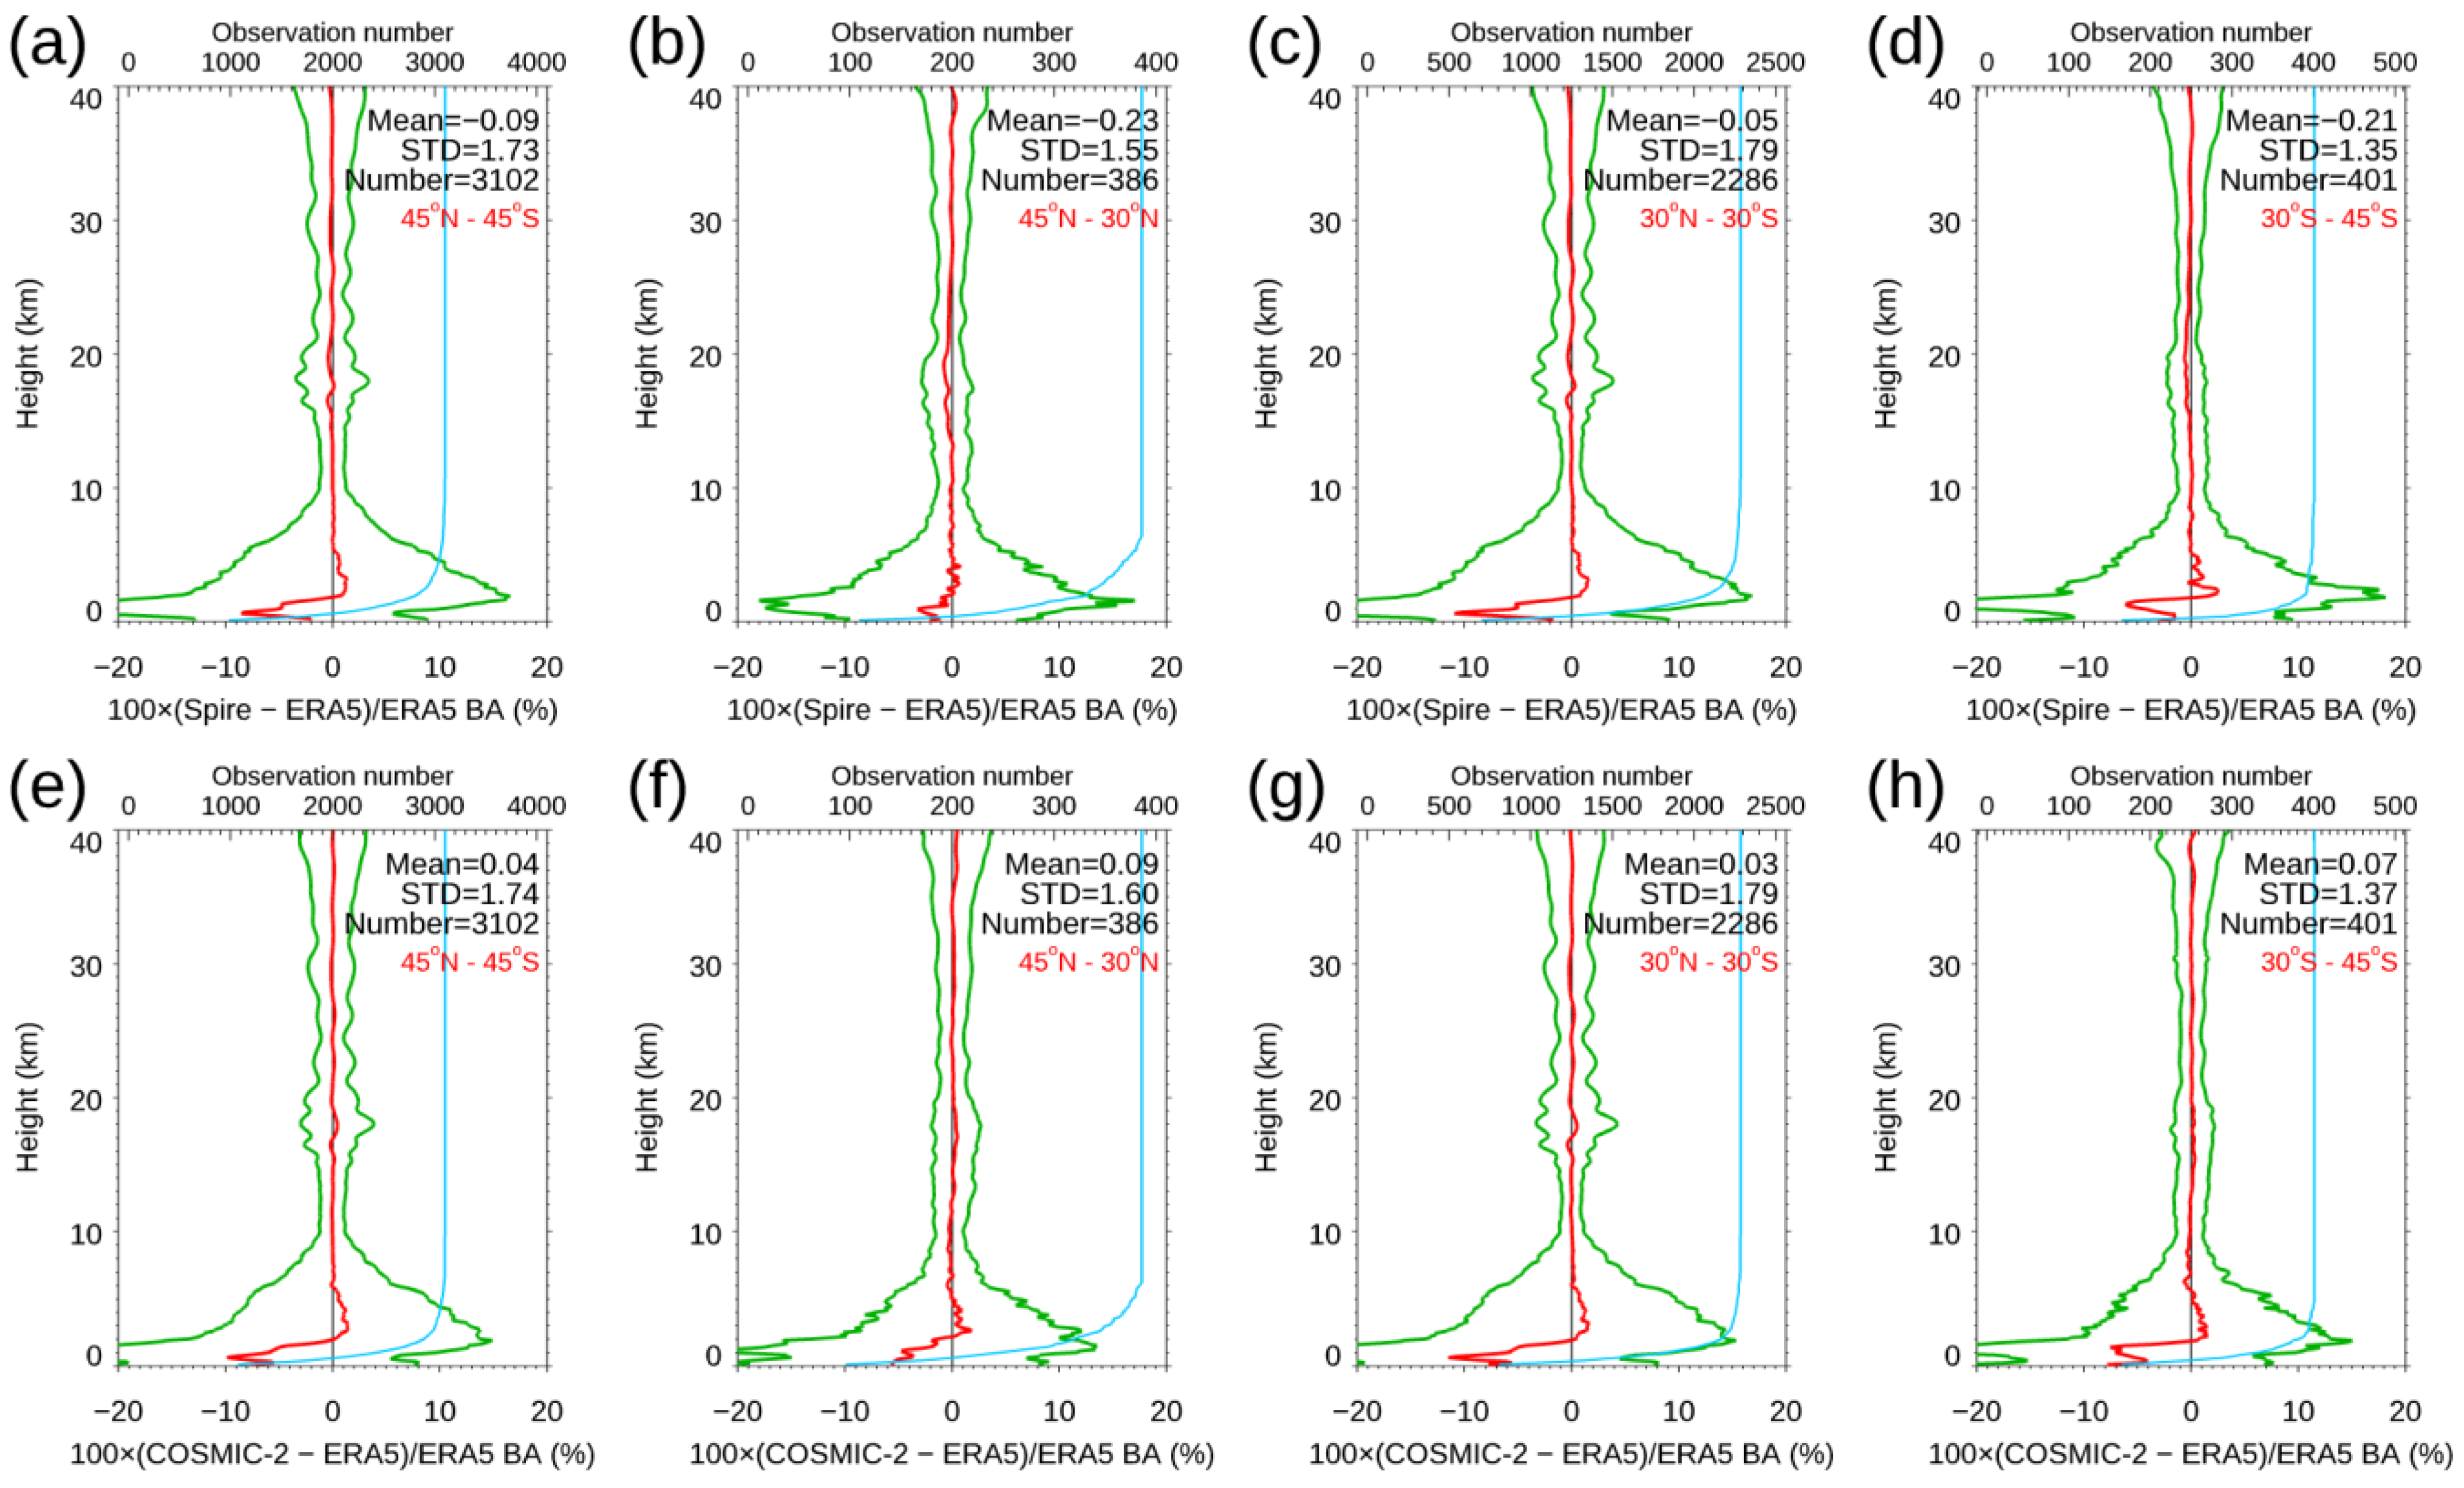
Figure 16.
(a) Differences (dash lines) and uncertainties (dot lines) of Spire temperature profiles retrieved by UCAR wetPf2 compared to RS41 RAOB data. (c) Differences (dash lines) and uncertainties (dot lines) of Spire-specific humidity profiles retrieved by UCAR wetPf2 compared to RS41 RAOB data. (b) Shows the number of collocated Spire–RAOB temperature profiles, and (d) is the number of Spire–RAOB water vapor profiles.
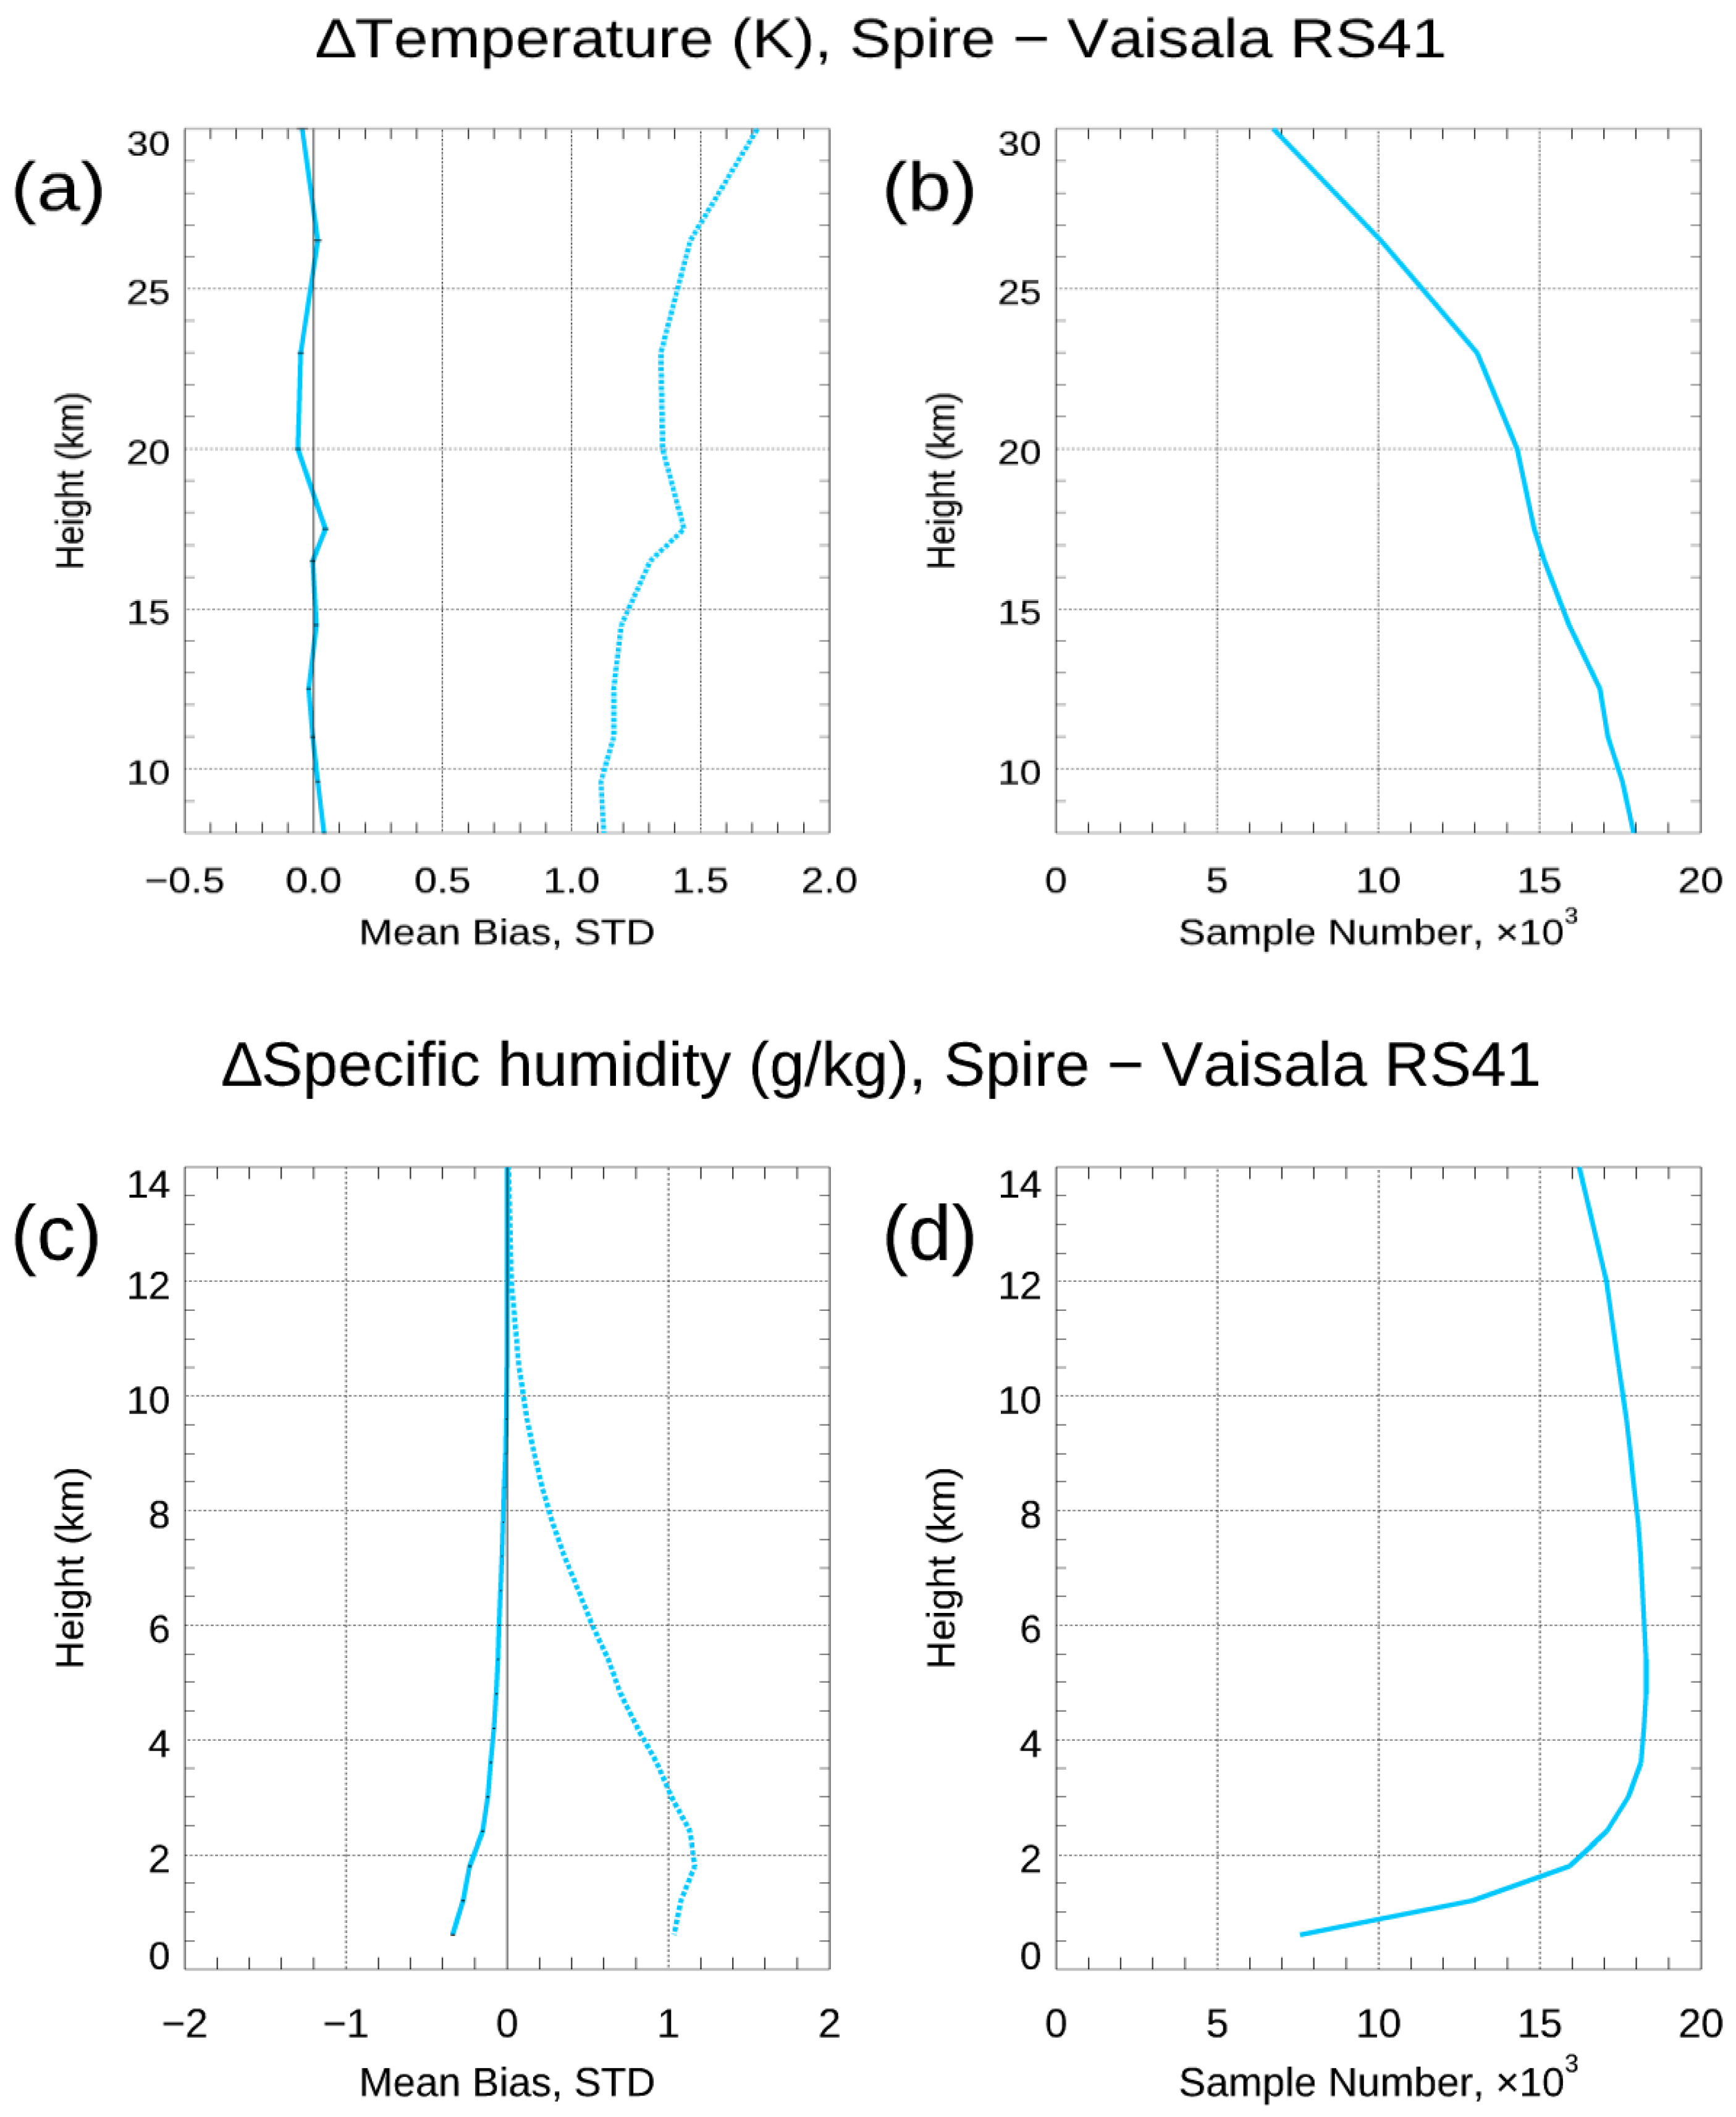
Figure 17.
(a) Height-dependent mean temperature differences (K) of UCAR wetPf2 versus RS41 RAOB in the zones of daytime (SZA < 80°), nighttime (SZA > 100°), and dusk/dawn (80° < SZA < 100°) in the upper troposphere and lower stratosphere. (b) The height-dependent profile numbers for the analysis.
Figure 17.
(a) Height-dependent mean temperature differences (K) of UCAR wetPf2 versus RS41 RAOB in the zones of daytime (SZA < 80°), nighttime (SZA > 100°), and dusk/dawn (80° < SZA < 100°) in the upper troposphere and lower stratosphere. (b) The height-dependent profile numbers for the analysis.
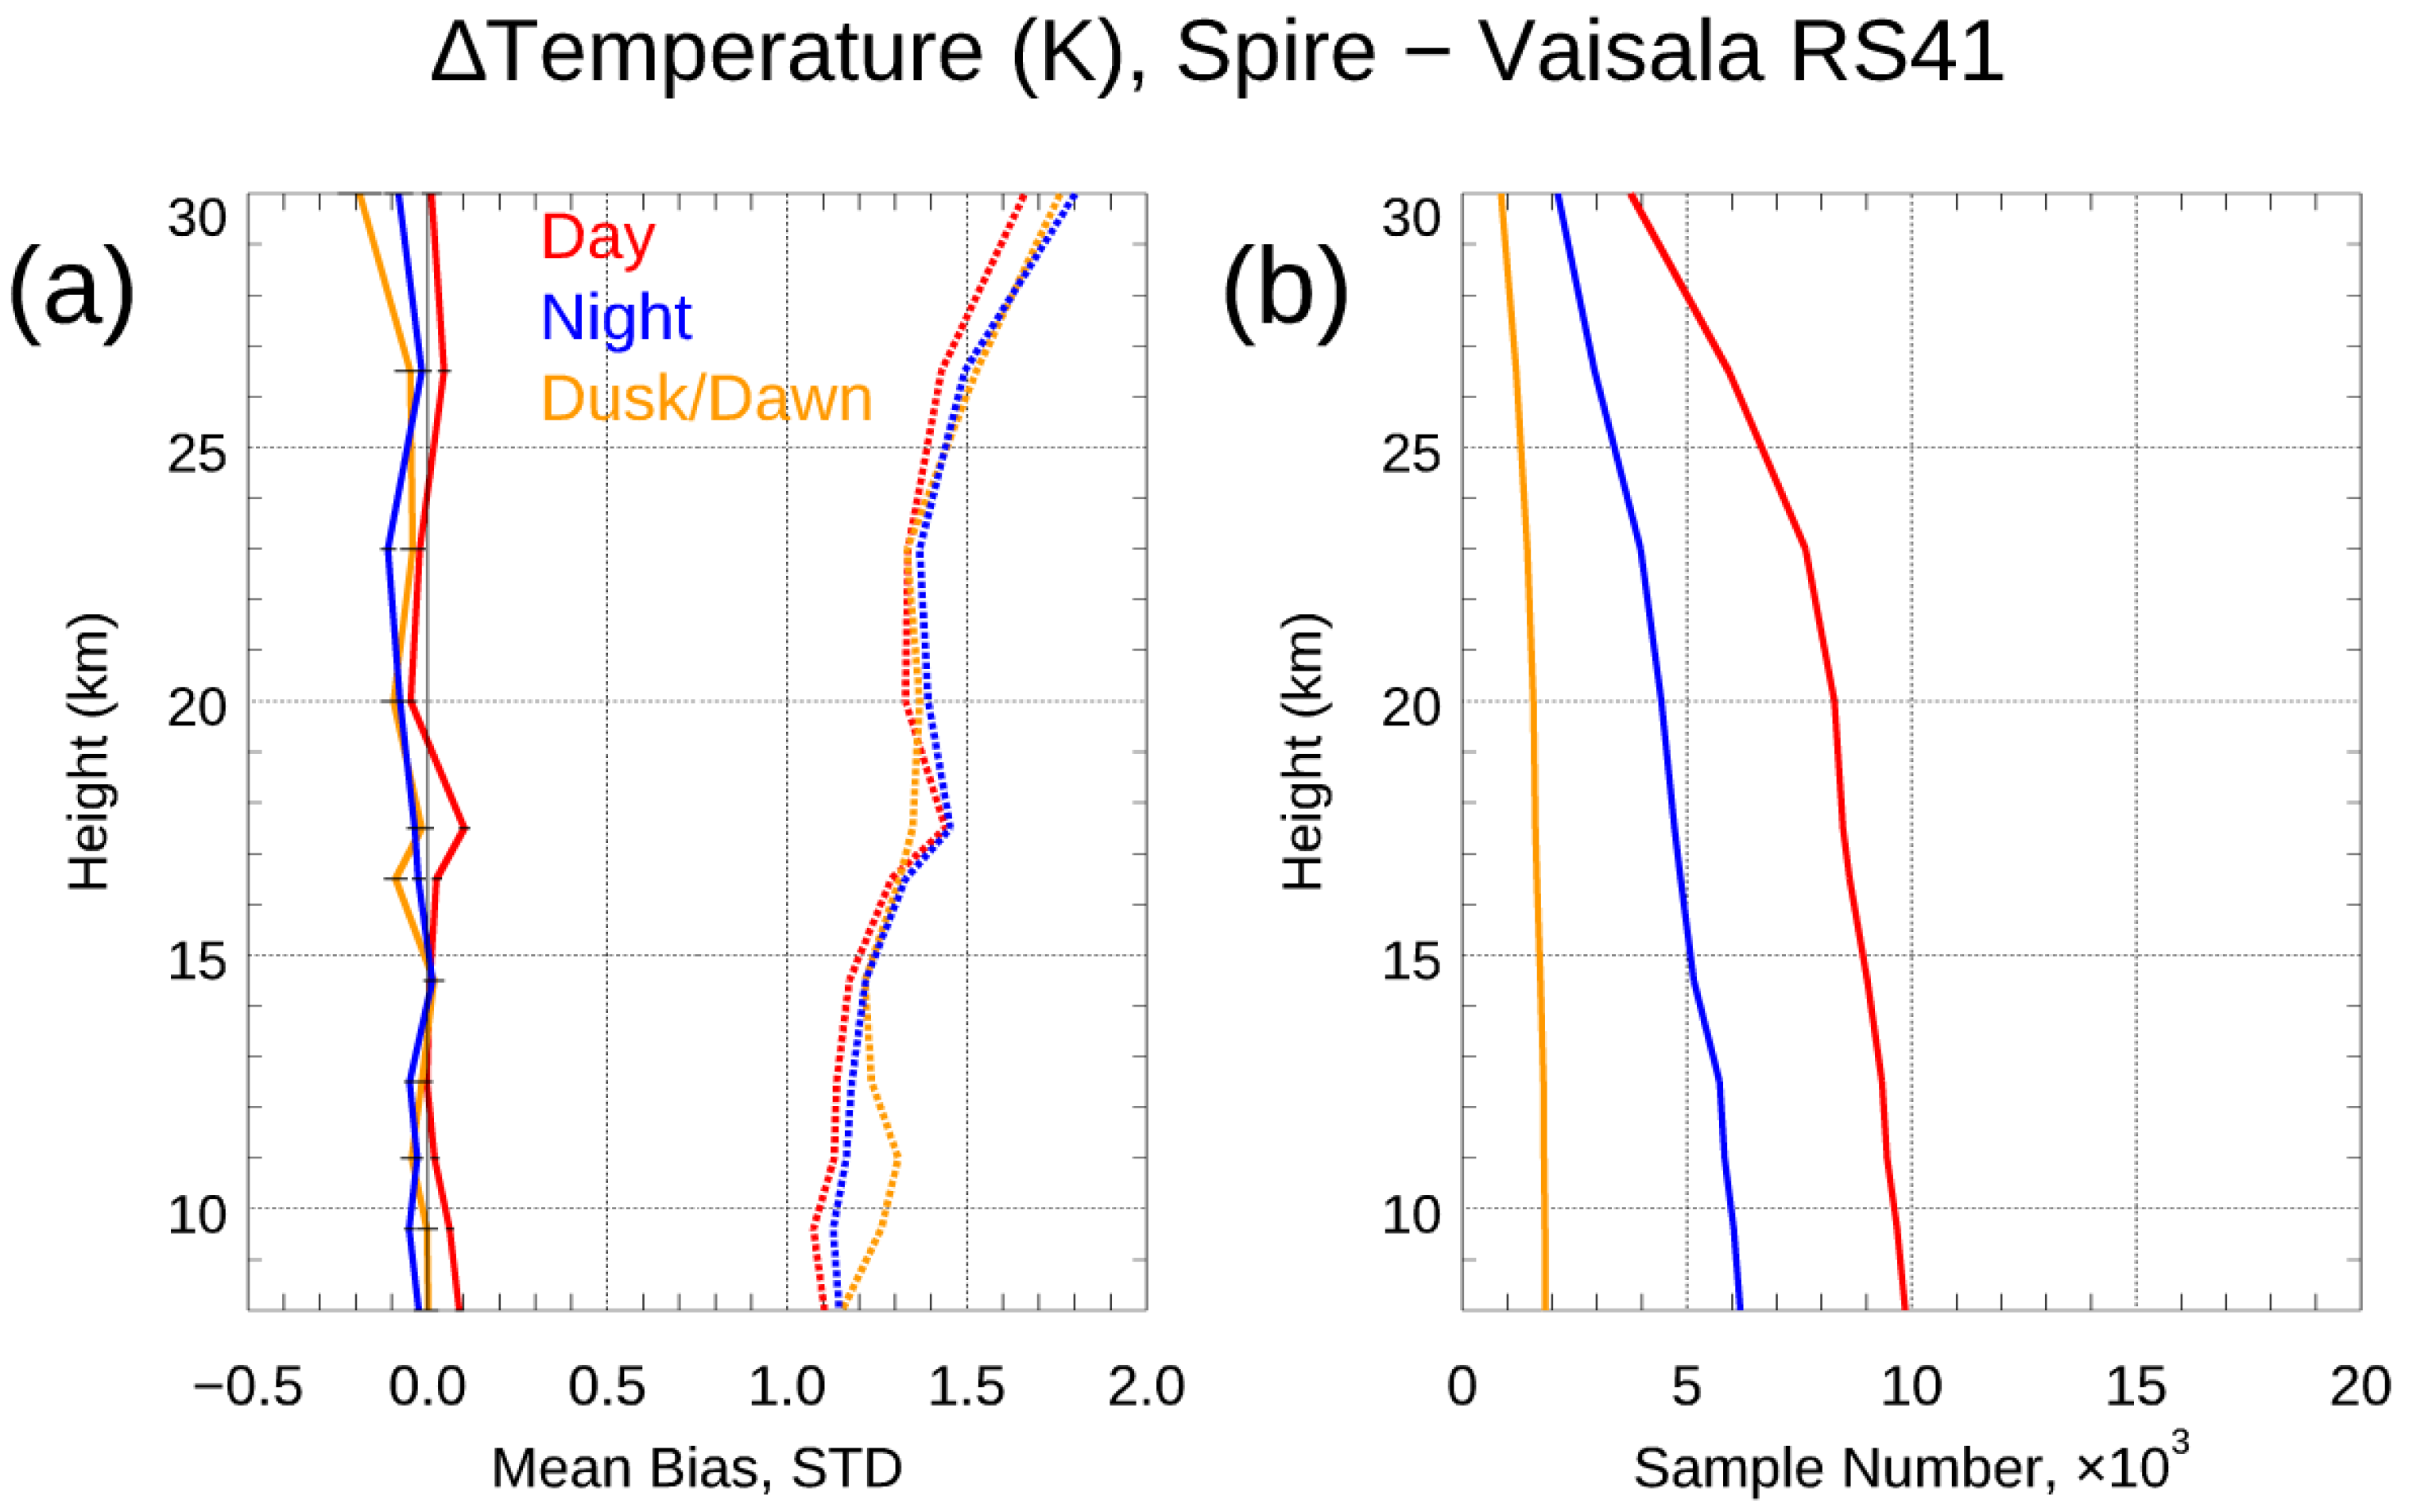
Figure 18.
(a) The height-dependent mean humidity differences (g/kg) of UCAR wetPf2 versus RS41 RAOB for daytime (SZA < 80°), nighttime (SZA > 100°), and dusk/dawn (80° < SZA < 100°). Corresponding profile numbers are shown in (b).
Figure 18.
(a) The height-dependent mean humidity differences (g/kg) of UCAR wetPf2 versus RS41 RAOB for daytime (SZA < 80°), nighttime (SZA > 100°), and dusk/dawn (80° < SZA < 100°). Corresponding profile numbers are shown in (b).

Figure 19.
Fractional BA observation errors (in %) estimated for the region within [45°N, 45°S] for (a) over oceans, (b) over land, and (c) over oceans and land, (d) over oceans [20°S, 45°S], (e) over oceans [20°N, 20°S], and (f) over oceans [45°N, 20°N]. One month (from 15 December 2020 to 15 January 2021) of COSMIC-2, KOMPSAT-5, GeoOptics, and Spire bending angle observations were used for generating these figures.
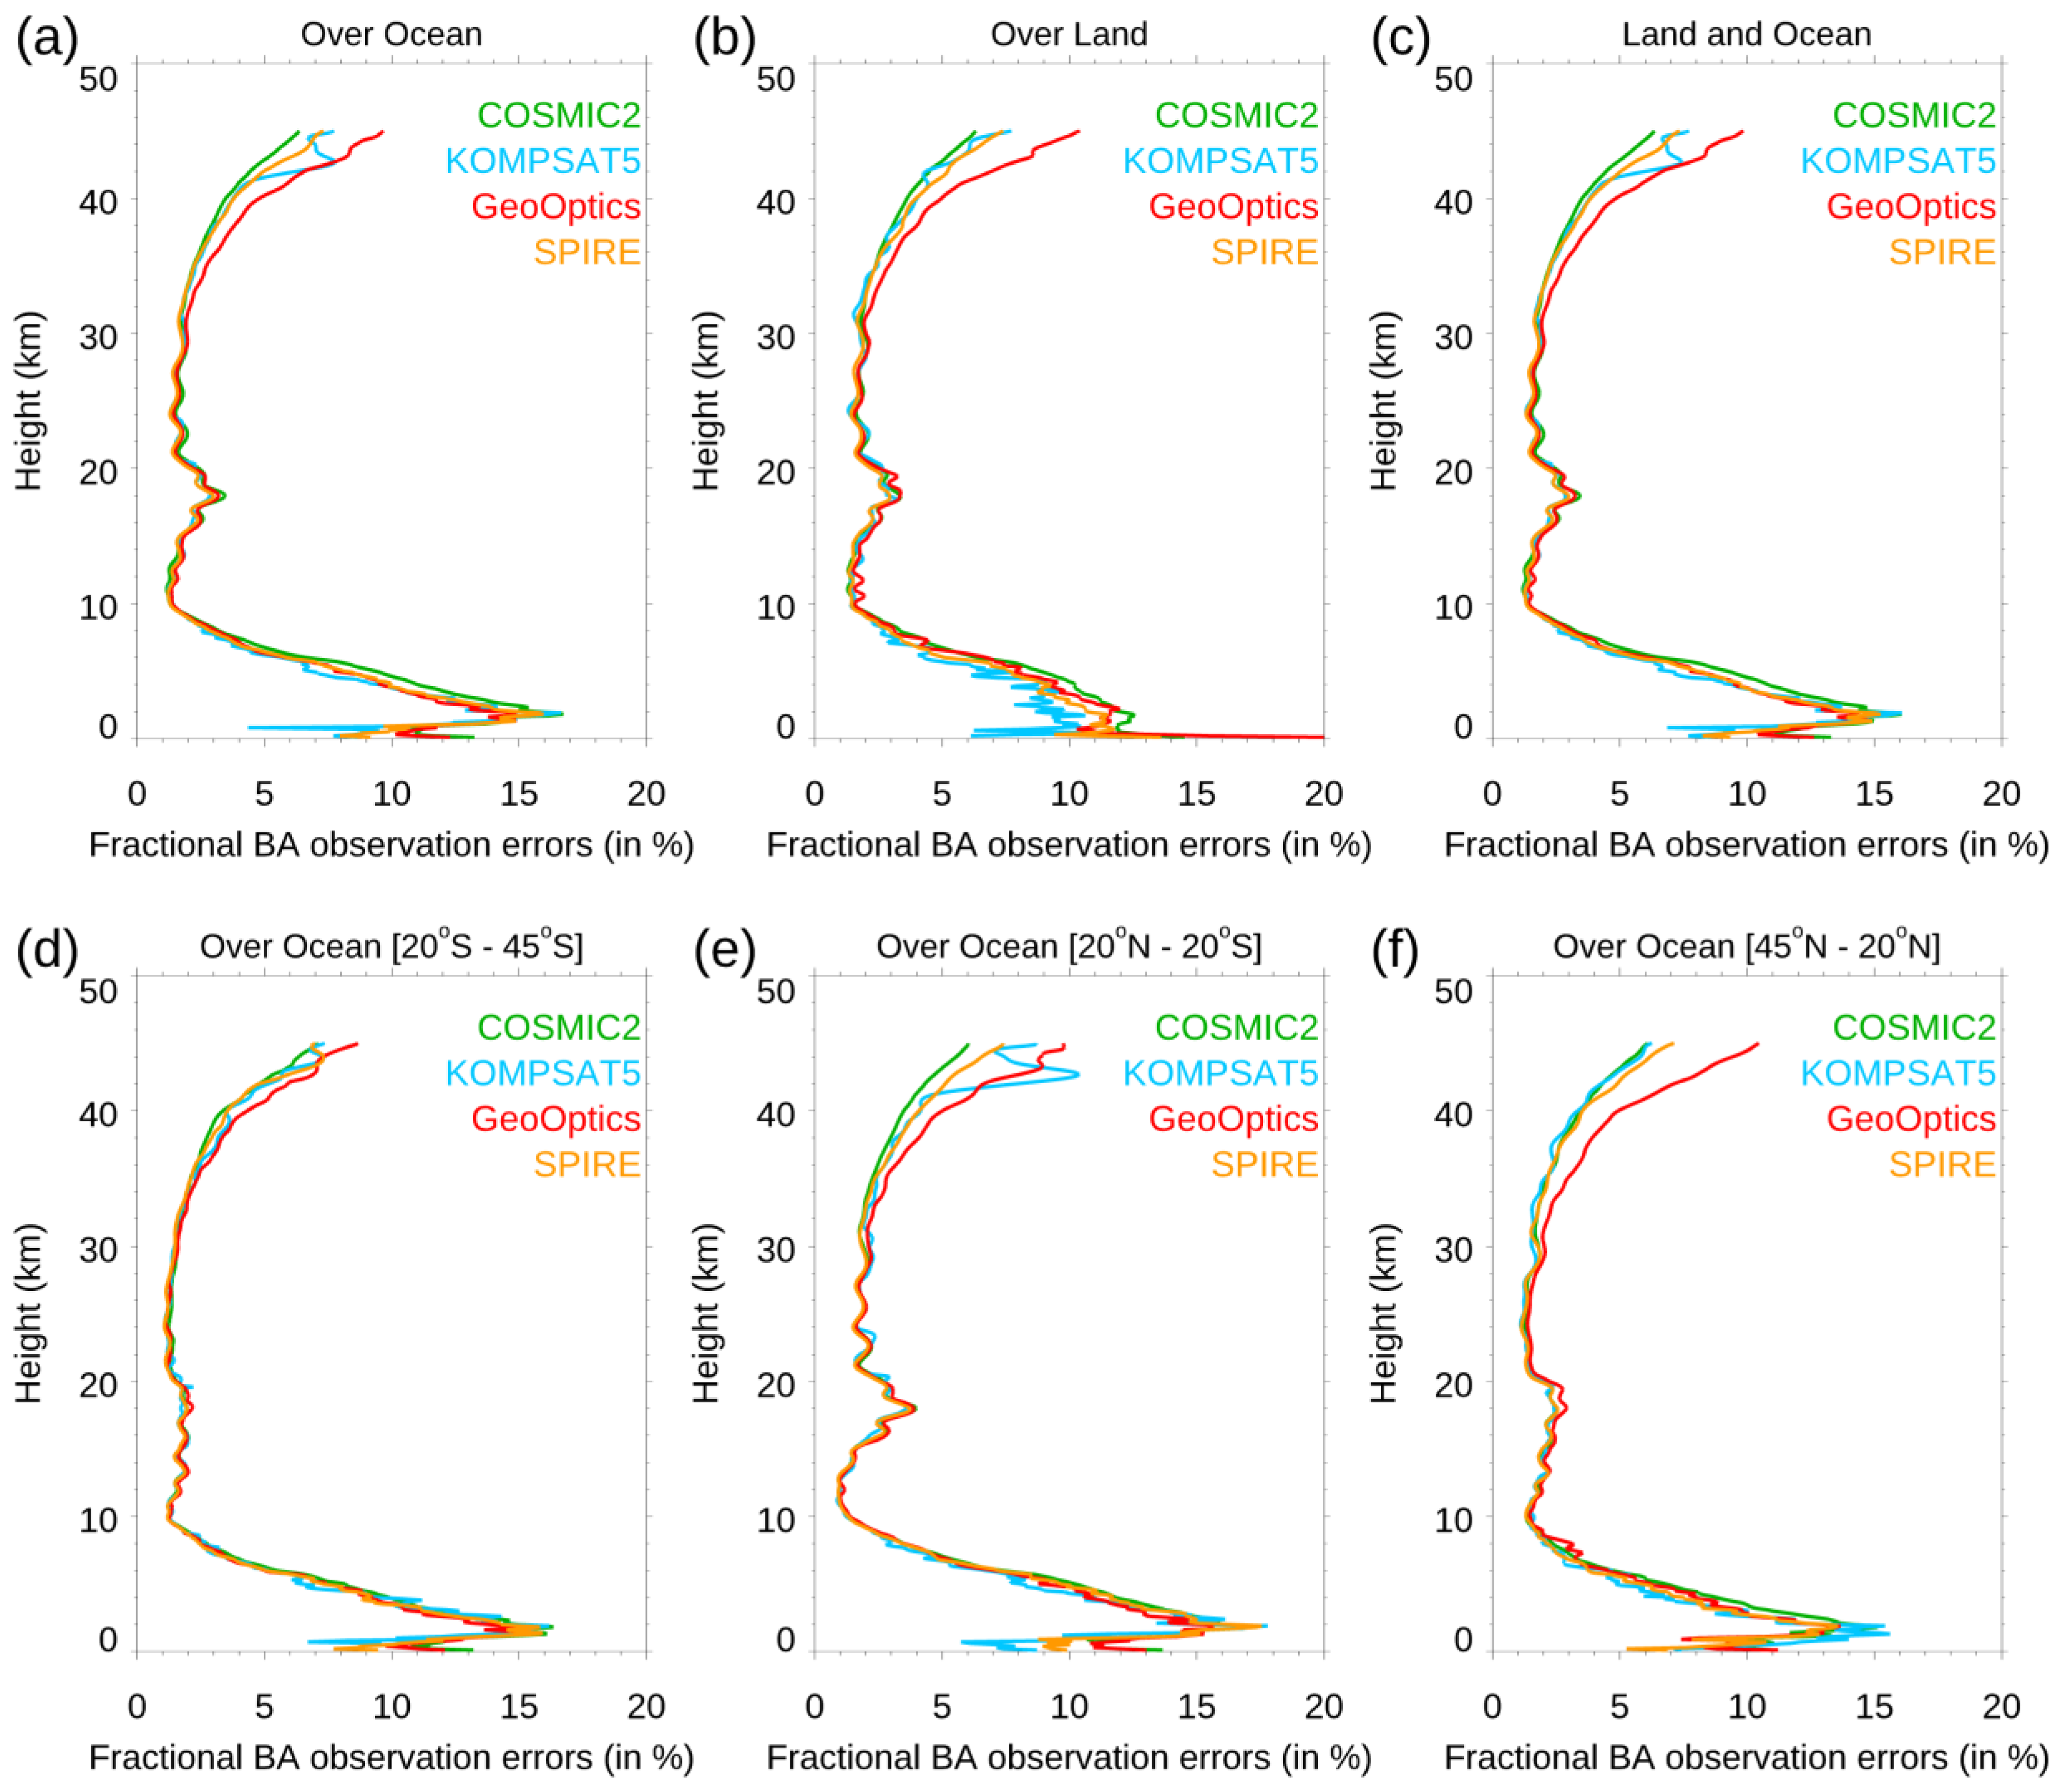

Table 1.
The lowest penetration heights of 80% of the total data for different RO missions in different latitudinal zones.
Table 1.
The lowest penetration heights of 80% of the total data for different RO missions in different latitudinal zones.
| 10°N–10°S | 30°N–10°N | 10°S–30°S | 45°N–30°N | 30°S–45°S | 60°N–45°N | 45°S–60°S | 90°N–60°N | 60°S–90°S | |
|---|---|---|---|---|---|---|---|---|---|
| COSMIC-2 | 0.85 km | 0.90 km | 0.75 km | 1.35 km | 1.10 km | ||||
| Spire | 0.90 km | 0.90 km | 0.75 km | 0.80 km | 0.55 km | 0.45 km | 0.25 km | 0.45 km | 0.20 km |
| KOMPSAT-5 | 1.85 km | 1.50 km | 1.15 km | 0.40 km | 0.95 km | 0.35 km | 0.40 km | 0.25 km | 0.20 km |
| PAZ | 2.65 km | 1.85 km | 2.05 km | 0.90 km | 1.30 km | 0.45 km | 0.45 km | 0.35 km | 0.35 km |
Table 2.
The mean BA fractional differences and the corresponding standard deviations for the Spire–PAZ, Spire–KOMPSAT-5, Spire–Metop-B, Spire–Metop-C, and Spire–TerraSAR-X SRO pairs from surface to 40 km altitude.
Table 2.
The mean BA fractional differences and the corresponding standard deviations for the Spire–PAZ, Spire–KOMPSAT-5, Spire–Metop-B, Spire–Metop-C, and Spire–TerraSAR-X SRO pairs from surface to 40 km altitude.
| Mean Difference | Standard Deviation | |
|---|---|---|
| Spire–PAZ | 0.01% | 3.25% |
| Spire–KOMSAT-5 | 0.18% | 3.20% |
| Spire–Metop-B GRAS | 0.12% | 1.94% |
| Spire–Metop-C GRAS | 0.06% | 2.89% |
| Spire–TerraSAR-X | −0.13% | 3.35% |
Table 3.
The mean fractional BA differences, standard deviations of the mean differences, and sample numbers at 10 km altitude for Spire–COSMIC-2 SRO pairs for different COSMIC-2 SNR groups (i.e., 0–500 v/v, 500–1000 v/v, 1000–1500 v/v, 1500–2000 v/v, and >2000 v/v).
Table 3.
The mean fractional BA differences, standard deviations of the mean differences, and sample numbers at 10 km altitude for Spire–COSMIC-2 SRO pairs for different COSMIC-2 SNR groups (i.e., 0–500 v/v, 500–1000 v/v, 1000–1500 v/v, 1500–2000 v/v, and >2000 v/v).
| Mean | Standard Deviation | Sample Number at 10 km Altitude | |
|---|---|---|---|
| 0–500 v/v | 0.12% | 4.15% | 364 |
| 500–1000 v/v | 0.10% | 4.14% | 1727 |
| 1000–1500 v/v | 0.24% | 3.97% | 2559 |
| 1500–2000 v/v | 0.16% | 3.87% | 2325 |
| >2000 v/v | 0.19% | 4.07% | 332 |
Table 4.
The means and standard deviations for the fractional refractivity difference between STAR and UCAR Spire for GPS, GLONASS, and GALILEO.
Table 4.
The means and standard deviations for the fractional refractivity difference between STAR and UCAR Spire for GPS, GLONASS, and GALILEO.
| Mean | Standard Deviation | |
|---|---|---|
| GPS | 0.06% | 0.73% |
| GLONASS | 0.06% | 0.78% |
| GALILEO | 0.06% | 0.69% |
Table 5.
Mean temperature biases (uncertainties) (K) and mean humidity biases (uncertainties) (g/kg) between Spire RO retrievals and RS41 RAOB observations over different height regions.
Table 5.
Mean temperature biases (uncertainties) (K) and mean humidity biases (uncertainties) (g/kg) between Spire RO retrievals and RS41 RAOB observations over different height regions.
| Spire Retrieval | µ(ΔT) (σ(ΔT)) (K) (8–11 km) | µ(ΔT) (σ(ΔT)) (K) (12.5–16.5 km) | µ(ΔT) (σ(ΔT)) (K) (17.8–26.4 km) | µ(ΔH) (σ(ΔH)) (g/kg) (below 4.2 km) | µ(ΔH) (σ(ΔH)) (g/kg) (4.8–8.4 km) |
|---|---|---|---|---|---|
| UCAR wetPf2 | 0.02(1.13) | 0.00(1.22) | −0.01(1.40) | −0.19(1.02) | −0.04(0.45) |
Table 6.
The mean temperature bias (uncertainty) (K) of UCAR Spire wetPf2 versus RS41 RAOB comparisons in three SZA zones over three height regions in the upper and lower stratosphere.
Table 6.
The mean temperature bias (uncertainty) (K) of UCAR Spire wetPf2 versus RS41 RAOB comparisons in three SZA zones over three height regions in the upper and lower stratosphere.
| Height Range | Day | Night | Dusk/Dawn |
|---|---|---|---|
| 8–11 km | 0.06 (1.10) | −0.04 (1.15) | −0.01 (1.21) |
| 12.5–16.5 km | 0.01 (1.20) | −0.02 (1.25) | −0.02 (1.25) |
| 17.8–26.4 km | 0.02 (1.38) | −0.05 (1.46) | −0.06 (1.35) |
Table 7.
Mean humidity differences (uncertainties) (g/kg) between RO retrievals and RS41 RAOB observations over two height regions and three SZA zones.
Table 7.
Mean humidity differences (uncertainties) (g/kg) between RO retrievals and RS41 RAOB observations over two height regions and three SZA zones.
| Height Range | Day | Night | Dusk/Dawn |
|---|---|---|---|
| Below 4.2 km | −0.17 (1.03) | −0.23 (1.07) | −0.15 (0.89) |
| 4.8–8.4 km | −0.04 (0.45) | −0.06 (0.49) | −0.02 (0.39) |
Disclaimer/Publisher’s Note: The statements, opinions and data contained in all publications are solely those of the individual author(s) and contributor(s) and not of MDPI and/or the editor(s). MDPI and/or the editor(s) disclaim responsibility for any injury to people or property resulting from any ideas, methods, instructions or products referred to in the content. |
© 2023 by the authors. Licensee MDPI, Basel, Switzerland. This article is an open access article distributed under the terms and conditions of the Creative Commons Attribution (CC BY) license (https://creativecommons.org/licenses/by/4.0/).
Share and Cite
MDPI and ACS Style
Ho, S.-p.; Zhou, X.; Shao, X.; Chen, Y.; Jing, X.; Miller, W. Using the Commercial GNSS RO Spire Data in the Neutral Atmosphere for Climate and Weather Prediction Studies. Remote Sens. 2023, 15, 4836. https://doi.org/10.3390/rs15194836
AMA Style
Ho S-p, Zhou X, Shao X, Chen Y, Jing X, Miller W. Using the Commercial GNSS RO Spire Data in the Neutral Atmosphere for Climate and Weather Prediction Studies. Remote Sensing. 2023; 15(19):4836. https://doi.org/10.3390/rs15194836
Chicago/Turabian StyleHo, Shu-peng, Xinjia Zhou, Xi Shao, Yong Chen, Xin Jing, and William Miller. 2023. "Using the Commercial GNSS RO Spire Data in the Neutral Atmosphere for Climate and Weather Prediction Studies" Remote Sensing 15, no. 19: 4836. https://doi.org/10.3390/rs15194836
Note that from the first issue of 2016, this journal uses article numbers instead of page numbers. See further details here.