
Statistical Insights on the Eruptive Activity at Stromboli Volcano (Italy) Recorded from 1879 to 2023


1
Istituto Nazionale di Geofisica e Vulcanologia, Osservatorio Etneo—Sezione di Catania, Piazza Roma 2, 95125 Catania, Italy
2
Dipartimento di Ingegneria Elettrica, Elettronica e Informatica, Università degli Studi di Catania, Viale A. Doria 6, 95122 Catania, Italy
*
Author to whom correspondence should be addressed.
Remote Sens. 2023, 15(19), 4822; https://doi.org/10.3390/rs15194822
Submission received: 8 August 2023
/
Revised: 11 September 2023
/
Accepted: 2 October 2023
/
Published: 4 October 2023
(This article belongs to the Special Issue Remote Sensing at Istituto Nazionale di Geofisica e Vulcanologia (INGV) — Geophysics and Volcanology Experience)
Abstract
:Stromboli is an open-conduit active volcano located in the southern Tyrrhenian Sea and is the easternmost island of the Aeolian Archipelago. It is known as “the lighthouse of the Mediterranean” for its continuous and mild Strombolian-type explosive activity, occurring at the summit craters. Sometimes the volcano undergoes more intense explosions, called “major explosions” if they affect just the summit above 500 m a.s.l. or “paroxysms” if the whole island is threatened. Effusive eruptions are less frequent, normally occurring every 3–5 years, and may be accompanied or preceded by landslides, crater collapses and tsunamis. Given the small size of the island (maximum diameter of 5 km, NE–SW) and the consequent proximity of the inhabited areas to the active craters (maximum distance 2.5 km), it is of paramount importance to use all available information to forecast the volcano’s eruptive activity. The availability of a detailed record of the volcano’s eruptive activity spanning some centuries has prompted evaluations on its possible short-term evolution. The aim of this paper is to present some statistical insights on the eruptive activity at Stromboli using a catalogue dating back to 1879 and reviewed for the events during the last two decades. Our results confirm the recent trend of a significant increase in major explosions, small lava flows and summit crater collapses at the volcano, and might help monitoring research institutions and stakeholders to evaluate volcanic hazards from eruptive activity at this and possibly other open-vent active basaltic volcanoes.
1. Introduction
Stromboli is the easternmost volcanic island of the Aeolian Archipelago, located in the southern Tyrrhenian Sea (Italy; Figure 1a). It has a conical shape and is up to 924 m a.s.l. and at most 5 km wide along a NE–SW direction (Figure 1b). Two villages are located on the NE and W flanks, Stromboli and Ginostra, respectively (Figure 1b), with a total number of about 540 residents, increasing more than ten times during the summer season due to tourists [1]. The active summit craters are located within an elliptical crater depression, oriented NE–SW and located within the upper Sciara del Fuoco (SdF) depression at an elevation of about 750 m a.s.l. (Figure 1b). The almost persistent and mild explosive activity displayed by the summit vents is the origin of the island’s name being used for these kinds of eruptions observed around the world. Indeed, the term Strombolian-type explosive activity [2,3,4,5] refers to mild explosions common to many other volcanoes, such as Tajogaite (La Palma, Canary Islands; [6]), Shishaldin (Alaska; [7]), Fuego and Pacaya (Guatemala; [8,9]), Villarrica (Chile; [10]), Etna and Vesuvius (Italy; [11,12]), Karymsky (Kamchatka, Russia; [13]), Yasur (Vanuatu; [14,15]), Erebus (Antarctica; [5,16]), Aso and Sakurajima (Japan; [17,18]) and Kilauea (Hawaii; [19]), among others. Strombolian explosions are characterized by the bursting of a gas slug at the magma-free surface [3,20,21,22]. The power of an explosive event is given by its magnitude and intensity, with the explosive magnitude defined by the erupted volume of ejecta, and the intensity by the ratio between erupted volume and eruption duration [2]. The difficulty of obtaining magnitude and intensity values of each explosive event has prompted the proposal of several alternative classifications, initially based on the area affected by the fallout [23] and gradually involving a growing number of geophysical, volcanological and remote sensing measurements [22,24,25,26,27,28,29,30,31,32,33,34,35].
In general, we can distinguish three main types of explosive activity at Stromboli. (1) The first class comprises the persistent, mild Strombolian explosions that occur at a frequency of one every few minutes to a few tens of minutes [20,36], and eject a mixture of gas, spatter and ash up to a few tens of meters from the crater rim. These are further distinguished into Type 0 when erupting just gas [37], Type 1 when erupting gas and coarse ballistics, and Type 2a and 2b when erupting gas and either ballistics plus ash or just ash without ballistics [22]. (2) The second type is major explosions (ME), and these are more powerful explosive events occurring on average twice a year and involving tephra fallout well outside the crater terrace, but normally affecting the top of the island above 500 m a.s.l., with eruptive columns rising a few hundred meters above the crater rim [23,31,32,33,38,39]. (3) The third type is called paroxysms (P). These are very powerful explosive events involving more than one vent and forming eruptive columns more than 1 km above the craters and occurring at a frequency of one every few decades [23,39,40,41,42,43]. The last five episodes occurred on 5 April 2003, 15 March 2007, 3 July and 28 August 2019, and 19 July 2020 [29,30,42,44,45,46,47,48,49,50,51]. This latest event of 19 July 2020 was on the boundary between ME and P because it was characterized by several discrete pulses involving more than one crater zone, and on the basis of the seismic trace, VLP size, area involved by the fallout, height of the eruptive column, thermal signature and magma source depth [32,34,51,52]. The collapse of the eruptive column accompanying the paroxysms may cause pyroclastic density currents (PDC) spreading along the SdF barren slope (Figure 1b) and possibly on the sea surface, up to 2 km away from the coastline [32,33,53].
Effusive eruptions may occur as slow lava output from the summit vents, forming small lobes confined within the crater terrace, or as larger volume lava flows spreading above the crater rim and on the crater outer flanks and along the upper SdF, or again as major lava flows spreading from eruptive vents and fissures along the SdF and down to the coast and beyond. As such, they can range widely, both in duration, spanning from hours to months, and volume, between 103 and 107 m3 [23,33,44,45,53,54,55,56,57,58,59]. Often associated with the eruptive activity, landslides have also occurred along the SdF [60,61,62], as have sudden collapses of portions of the summit crater [53,63] and more rarely tsunamis [64,65,66]. An increasing number of landslides detected by the seismic network were related to the opening of effusive vents along the SdF [67], but also to the crumbling of lava flow fronts during their expansion on the steep SdF slope [44,53,57]. Crater collapses are recently becoming more frequent due to the growth of the NE crater on the edge of the crater rim [63,68], making it prone to collapse as soon as the magma level within the conduit rises and magma lateral intrusion increases the cone instability [32,33,45,61,69,70].
The mild weather and beautiful landscape have led to the volcano being visited by tourists for centuries, with regular descriptions of its activity dating back to the 18th century [23]. A daily and systematic record of the explosive activity started in 1895, when an observatory was established at Semaforo Labronzo [23], on the north side of the island (Figure 1b). Barberi et al. [23] were the first to publish a critical re-examination of available reports and documents of about three centuries of volcanic activity at Stromboli, producing a very detailed catalogue updated to 1990, with the aim of assessing the types of hazards and their probability of occurrence, as well as estimating the areas exposed to eruptive phenomena. A paper by Rosi et al. [39] represented the frequency of eruptive events in two graphs, with the first encompassing the period from 1990 to 2012 and the second from 1900 to 2012. Together with explosive activity, they also take into account effusive activity, pyroclastic density currents and hot avalanches, wildfires, landslides and tsunami, giving a description of the number of recorded events and of the related hazards. A new catalogue of the explosive activity published by Bevilacqua et al. [71] comprised a review of the scientific literature of the last 140 years, including 180 explosive events, of which 36 were classified as paroxysms. Using this catalogue, Bevilacqua et al. [72] quantified the temporal rate of major explosions and paroxysms as a function of time passed since the last event occurred, finding that recurrence hazard levels were significantly elevated in the weeks and months following a major explosion or paroxysm, and then gradually decreased over longer periods. In this paper, we present a new database based on the catalogues by [23,71], which we have updated, reviewed and improved with the aim of gaining additional information that could prove useful for hazard assessment.
2. Data
The new catalogue of volcanic and instability events, namely the basis of this paper (Table S1), comprises the previous catalogues by [23,71,72,73], that we have completed, reviewed and improved, adding effusive activity, crater collapses, landslides and tsunami, especially for events occurring after 2000. In doing so, we have gathered information collected by the INGV–OE (Istituto Nazionale di Geofisica e Vulcanologia–Osservatorio Etneo) monitoring systems, updated to the end of June 2023 and published in the daily and weekly reports available at (https://www.ct.ingv.it/index.php/monitoraggio-e-sorveglianza/prodotti-del-monitoraggio/comunicati-attivita-vulcanica, accessed on 20 August 2023). In addition, we have used new, unpublished data obtained from the analysis of visual, infrared and thermal images recorded by the INGV–OE monitoring cameras (Figure 1b). The features of the monitoring cameras and their frequency of acquisition are described in detail by [33] in their Supplementary Materials, and by [32]. Our catalogue is available here as Supplementary Materials (Table S1).
Following [71,72], in our catalogue the explosive activity is divided into three classes. Paroxysms (P) are the most energetic explosive events involving the whole crater zone, which may affect the whole island and the settled area and produce eruptive columns more than 1 km above the craters [23,32,39,40], and which are often associated with pyroclastic density currents (PDC) and hot avalanches [42,44,50]. Major explosions (ME) are explosive strombolian events more powerful than the persistent explosive activity, which involve one or more crater zones and result in eruptive columns rising several hundred meters above the craters. Their tephra fallout mainly affects the summit of the volcano above 500 m a.s.l. [23,29,32]. Uncertain (U) explosive events are those in between major explosions and persistent explosive activity [71,72]. We have considered U those that are mentioned in the INGV–OE activity reports as “strong explosions” or “explosions more powerful than normal”, but for which we do not have enough data to classify as major explosions.
Our dataset comprises effusive activity, distinguished in three categories of different size and/or duration: class F comprises small lava flows lasting less than 1 day, or intra–crater lava flows having volume up to 103 m3; FF are overflows from the crater rim and small lava flows lasting more than 1 day and less than 1 month, having volumes greater than 103 m3 and less than 106 m3; and FFF are flank eruptions, involving the opening of eruptive fissures on the Sciara del Fuoco, a duration of 1 month or more, and/or lava volumes greater than 1 × 10⁶ m3. In order to further clarify our choices for the three lava flow classes, it is worth pointing out that the most common data available on lava flows is their duration, which can be considered a reliable proxy for erupted volume. This is true for all cases, but not for the small lava flows spreading within the crater when the magma level is too high. These tiny lava flows can last several days, but result in extremely small lava flows (tens of meters long, directly observed) due to their very low effusion rate, much less than 0.1 m3 s−1. This is why we have considered the volume as criteria for classifying the intra–crater lava flows (F class), which even when lasting several days result in very small erupted volumes. Conversely, the duration for overflows and flank eruptions is a good proxy for erupted volumes. In these instances, we have distinguished the FF class (1 day to less than 1 month duration and/or lava volumes less than 1 × 10⁶ m3) from the FFF class (flank eruptions and overflows lasting 1 month or more, and/or lava volumes greater than 1 × 10⁶ m3) using the duration as the main distinctive criteria.
For the explosive and effusive activity until 1985, we relied on the description of references reported in the last column of Table S1. For the most recent events after 1985, we largely used the INGV–OE activity reports that describe the events on the basis of the analysis of the signals recorded by the monitoring networks. These comprise thermal and visual cameras, seismic stations, ground deformation measurements (tilt, global positioning system (GPS) and strainmeters), geochemical measurements on the plume and of the gases released from the ground and an estimation of the thermal output from the volcano retrieved from satellite. When the INGV–OE reports were not sufficiently detailed to classify an event, we used the analysis of the videos recorded by the INGV–OE monitoring cameras to distinguish between explosive activity (on the basis of the plume’s height, area affected by the fallout, event duration and/or involvement of more than one crater area) following [32]. For effusive activity, the analysis of the videos was used to estimate the duration of the lava flow output, which is a good proxy for the erupted volume. However, it is worth noting that small intra–crater effusive activity can be detected only when direct observations are available in the INGV–OE monitoring reports, or when at least one of the summit monitoring cameras (SPI, SPT, SPV; Figure 1b) were available and the weather was good enough to allow visibility within the crater depression.
Our aim was to propose some statistical considerations on a set of data concerning the volcanic activity recorded at Stromboli from 1879 to 2023. During this time interval, the 180 major and paroxysmal explosive events listed by [72] until 2020 increased to 278 explosive events (Table 1(a)). We have changed the classification by [71,72] from uncertain (U) to major explosions (ME) for a few explosive events when the description of the events mentioned the emission of the highly vesiculated golden pumice together with the crystallized dark scoria. In fact, following the literature [38,43,73,74,75,76], golden pumice is erupted during major explosions and paroxysms. In addition, several ME and lava flows occurred in 1935–1937, not included by [71], were added based on the accounts by [23,77,78]. Additional ME events compared to the catalogue by [72] were added based on the accounts by [54,79,80,81,82,83,84,85] and several INGV–OE monitoring reports, as specified in Table S1. Only one ME event from the list of [72] was rated as a paroxysmal (P) event (6 December 1985), on the basis of the description provided by [23,56]: “a large–scale emission of ashes, gases and vapour, forming an eruptive cloud and a small hot avalanche”, this being rated as a sequence that characterizes paroxysms (Table S1).
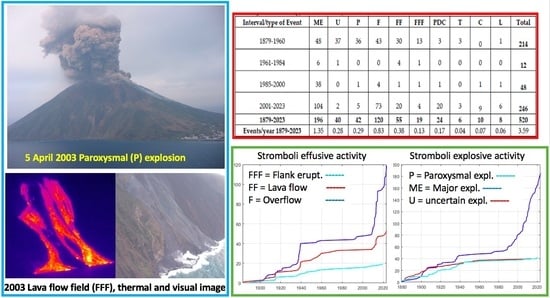
The overall number of events considered in this paper consists of 520 records from 1879 to June 2023, as shown at the bottom of the last column of Table 1(a). Among the 278 explosive events, 196 are classified as major explosions (ME), 42 as paroxysmal explosions (P) and 40 as uncertain major explosions (U). For the older events, before 1985, to define the U class we relied on the descriptions of the references listed in Table S1, and they essentially did not differ from those listed by [71]. The other classes contained in our catalogue (Table S1) were Pyroclastic Density Current (PDC), Tsunami (T), Crater Failure (C) and Landslides (L).
The number of events in the sub–intervals 1879–1960, 1961–1984, 1985–2000 and 2001–2023 are reported in Table 1(a), which shows the non–uniform distribution of events with time. It appears, for instance, that during the 82 years from 1879 to 1960, 214 total events were reported (or 2.6 event/year), which is much less than the 246 events recorded during the 23 years from 2001 to 2023 (10.7 event/year). The last row in Table 1(a) reports the number of events per year for each class, obtained by dividing the number of events during 1879–2023 by 145, i.e., the total number of years comprised by our dataset.
An interesting and useful parameter for hazard assessment is the inter–event time, which is the lapse of time between two events. Some simple statistics, such as minimum, maximum, median and standard deviation of the inter–event time, denoted by τ, are reported in Table 1(b). In particular, the high mean value of the inter–event time for events classified as FFF, PDC, T and L, compared with the explosive events, suggests a lack of completeness in the dataset regarding these classes of events. In addition, it should be noted that the first episode of crater collapse (C) on record is also the most recent among the classes here described, and occurred in 1992 [86] (Table S1 and Table 1(b)). However, all the other C events on record occurred during the last ten years, displaying a significant increase with time [32,33,53,69], which is probably related to the growth of the NE crater vents on the crater edge [68].
The main cause of the non–uniform distribution of the events at Stromboli is of course due to the fact that in recent times the observations have been instrumental and much more accurate and continuous than in the past. However, an intrinsic irregularity of the Stromboli volcano’s activity should not be overlooked, as testified by the low number of total events (12) recorded during 24 years (0.50 event/year) of relatively recent activity, from 1961 to 1984, compared with the 48 events recorded during 15 years of activity from 1985 to 2000 (3.2 event/year). If we do not consider the first interval of time, ranging from 1879 to 1960, when for at least 40 years Stromboli craters were monitored daily by the Italian Navy from the Semaforo Labronzo lighthouse [23], the increase in the total number of events recorded between 1961 and 2023 strongly suggests improvements in the monitoring systems, especially following the 2002–03 flank eruption, landslide and tsunami that heavily impacted the island [44,87,88,89,90]. As we can see in Table 1(b), P and U classes have a maximum inter–event time that is similar (~26–27 years) and almost twice that of ME and of all explosive classes (ME + U + P) considered together (~12 years), whereas the median inter–event time value is about ~1 year for P and U and ~2 months for ME and for all explosive classes together, respectively. For effusive events, the smaller F flows have a maximum recurrence time of ~31 years, whereas for FF and FFF this is ~18–19 years, and for all effusive classes together (F + FF + FFF) it is ~11 years. The median values of inter–event time for F, FF and FFF are ~1 month, ~1 year and ~5 years, respectively, with the median inter–event time for all effusive classes together being just 1 month. Thus, it appears that both explosive and effusive events have a very similar median recurrent time, of ~2 and ~1 month, respectively. The time distribution of events in the dataset distinguished by class is shown in Figure 2.
Figure 2 shows that the number of ME events has significantly increased in recent years, especially from the year 2000 onwards, while the number of P and especially of U events has decreased. Both of these effects could be related to the improved instrumental acquisitions, although an increase in the ME events and decrease in the P events between 2007 and 2012 have been attributed to structural changes following the recent flank eruptions [91]. In contrast to ME events, it appears that the frequency of P events occurring in the period 1900–1960 was slightly higher than in recent years, but in terms of number of events per year these are much lower values than the ME events. Concerning the classes of F and FF events, there seems to be a slight increase in recent years, probably also in this case attributable to improved instrumental observations, while the distribution of FFF events seems fairly uniform over time. Since these events are larger in size, it is possible that their record is fairly complete.
Given the non–uniform temporal distribution of the events, the average number of events per year shown in the last row of Table 1(a) is poorly representative. Indeed, it is easy to see that the average number of events per year is heavily dependent on the length of window w over which the averaging is performed. In order to obtain a representation that was visually understandable, we have averaged the number of events over non–overlapping time windows of w = 24 years, obtaining the results shown in Figure 3a and Figure 3b for explosive and effusive events, respectively.
Figure 3a shows that the number of ME per year was lower than 1 (on average 0.6) for a long time, until the end of 1970s, and then increased, reaching 1.25 events/year until 2000 and about 4.3 events/year in recent years. The number of paroxysm (p) events per year fluctuated around the value 0.4 events per year until the early 1940s, and then the value decreased, and it currently fluctuates around the value of 0.2 events per year. The number of U–type events per year fluctuated around the value of 0.8 until the 1910s and subsequently continuously decreased, reaching a level of about 0.1 events per year at present. Figure 3b shows that the average number per year of F–type events was 0.2 to about 0.6 from 1879 to the 1950s, then decreased to ~0.2 in 1970s and then rose again to a level of ~0.8 events/year from 2000 to the present. The average level of FF events increased from 0.2 to 1 from 1879 to 1950s, fell to ~0.2 and then increased to ~3 in recent years. Finally, the average level of FFF events increased from 0.1 to 0.2 from 1879 to 1950s then decreased to 0.05 until the 2000s, and increased to ~0.2 events/year until recently. However, we stress once again that these results are rudimentary and susceptible to different interpretations as the length of the chosen time window varies. This can also be interpreted as saying that both explosive and effusive activity at Stromboli are non–stationary processes.
To further appreciate the inhomogeneity in the frequency of occurrence of the events, we have represented the cumulative distribution as a function of time. In particular, in Figure 4a and Figure 4b the cumulative number of explosive events and lava flow events, respectively, are reported, whereas in Figure 4c we have represented the classes PDC and T, and in Figure 4d the classes C and L. In more detail, Figure 4a shows that while the cumulative curve of explosive events of P and U types had a regular growth, the cumulative curve for ME events underwent a sharp rise after 1989. Previously, this curve exhibited a rapid but limited growth during 1900–1906 and 1932–1938. Concerning effusive events, there have been changes during 1900–1907, 1936–1939 and recently after 2008, again probably related to the improved monitoring system, with the exception of events belonging to the class FFF that, having greater size and duration, probably did not pass undetected even when the monitoring system did not exist. Figure 4c displays a general increase in occurrence for PDC and T events and Figure 4d shows the behaviour of C and PDC events. It appears that data referring to C have been collected since 1992 and the cumulative rate is rapidly growing, especially from 2013. It is worth noting here that crater collapses (C) often trigger the formation of PDC along the Sciara del Fuoco, and that these collapses are becoming more frequent since the growth of the NE Crater outside the crater terrace and on the crater rim [33,45,53,62,63]. This has caused the formation of a thick apron of talus on the NE flank of the crater depression [68], which is prone to remobilization when the magma level within the upper conduit rises and magma lateral intrusion occurs [33,45,63,92,93]. As regards the increase in landslides after 2002, it has been found [67] that the daily number of landslides recorded by the seismic monitoring system increased just before the start of a flank eruption as a consequence of the slope and summit inflation and opening of ephemeral vents and fissures on the Sciara del Fuoco [92,93].
Furthermore, the number of landslides increases significantly during effusive eruptions, when the crumbling of lava flow fronts triggers debris mobilization and the deep erosion of the slope [60]. The greater increase in the number of recorded tsunamis can again be attributed to the improved monitoring system, which also enables 0.5 m waves to be detected, as those formed as a consequence of the 2019 paroxysmal episodes and PDCs entering the sea [50,94]. Due to the small number of events belonging to the PDC (only 24), the T (6), C (10) and L (8) classes present in our catalogue were considered insufficient to make reliable statistics; in this work, we will deal with the statistical analysis of data concerning explosive and effusive events without making a distinction between their class. In other words, we refer as a whole to the events ME + U + P as “explosive” and to those F + FF + FFF as “effusive”. Furthermore, given the lack of homogeneity in the acquisition methods, for each class of events we first carried out a statistical analysis on the entire catalogue (1879–2023) and then an analysis referring to a portion of the catalogue from 1985 until 2023. The choice of the most recent interval of time was due to the fact that in 1985 the activity of the Stromboli volcano passed under the control of the Italian CNR–IIV (Consiglio Nazionale delle Ricerche–Istituto Internazionale di Vulcanologia), which merged within INGV (Istituto Nazionale di Geofisica e Vulcanologia) in 1999, and although progress in adapting the instrumentation has been progressive, we can consider the data in the catalogue to be more reliable from 1985.
One of the parameters of greatest interest for the purposes of hazard assessment is the inter–event time (τ), i.e., the time interval between two consecutive events, which we will statistically analyse in this paper. The inter–event time for the considered time interval, without distinguishing among event classes (ME+P+U) and reported in days, is shown in Figure 5.
The time series of the inter–event time, being related to the number of events per year considered above, exhibits an irregular behaviour, although it is possible that the significant increase recorded between 1970 and 1990 for both explosive and effusive events (Figure 5a,b) is caused by a lack of or scant information recorded in that period.
3. Methods
In order to analyse the time series of the inter–event times from a statistical point of view, we applied an approach similar to that considered for the inter–event time of Lava Fountains (LFs) at Mt. Etna [95]. This approach starts from the observation that the probability density function (pdf) of the inter–event time of volcanic activity belongs to the class of heavy tailed distributions; that is, they have longer tails than the exponential distribution and in particular are one–tailed, as suggested by the histograms shown in Figure 6, which are characterized by right–tails.
Figure 6 shows that at Stromboli, 86% of explosive events and 79% of effusive events, respectively, belong to the first bin of the histogram, which corresponds to an inter–event time of approximately 1 year. In order to fit such kinds of histograms, only a few partial density models are appropriate: the log–normal, the Weibull, the generalised Pareto and the log–logistics. To strengthen the appropriateness of the use, the log–normal and the Weibull distributions were considered [72] to model the inter–event time between major explosions and paroxysms at Stromboli, while the log–logistic has been found to be suitable to fit inter–event times of volcanic eruptions [96,97]. The mathematical representation of these distributions is reported in [95]. Moreover, as well as the above–mentioned models, we have also considered the so–called power law distribution that fits better than the alternative the tail, which usually comprises the most energetic events. The power law distribution for a continuous variable x is written as:
In many cases, when dealing with power law, it is useful to also consider the Complementary Cumulative Distribution Function (CCDF), which is expressed as:
where α is the power law exponent and is a lower bound for x. The presence of this lower bound, which is not required for traditional probabilistic models, is necessary because this density diverges as . The use of the power law distribution as an alternative to other probability distribution models has been recognized as valid because various natural phenomena, including the field of geosciences, seem to follow this type of distribution, even if a rigorous statistical analysis is particularly complex. The difficulties arise because the power law is valid for a portion of the dataset, which normally escapes the smaller events due to the difficulty of detecting them, and larger ones due to the finite size of the physical systems. Bak [98] first discussed the ubiquity of power law distributions in natural systems. To refer to the vast literature concerning this kind of distribution is a hard task and is beyond the scope of this paper. By limiting to the application of power law models in geoscience, it is possible to cite the review paper by [99]. In order to objectively inter–compare the considered probabilistic models, we have computed the AIC (Akaike Information Criterion) index, which allowed taking into account the model likelihood and the number of model parameters. Indeed, for a model, the AIC is defined as in Expression (3)
where is the likelihood and is the number of model parameters. In turn, the likelihood is defined by Expression (4):
where is the partial density function (PDF) of the candidate distribution model j, considered for fitting a given dataset . The best model is the candidate with the smallest AIC.
4. Numerical Results
In this section, we implement the models for estimating the probability of occurrence of the inter–event time discussed in Section 3. In more detail, in Section 4.1 we consider the inter–event times of explosive and effusive events recorded from 1879 to 2023, while in Section 4.2 we consider the shortened and more recent portion of the catalogue, which refers to the time interval 1985–2023. As previously mentioned, this was motivated by looking at Figure 2, which shows that the number of events per year versus time for the classes of events here considered is quite different. Indeed, for instance, there could be a lack of P events after 1960 and before 2020 which, according to [72] could be attributed to under–sampling between 1960 and 1985. Furthermore, ref. [91] pointed out an increasing number of major explosions and a decreasing number of paroxysms at Stromboli after 2007, for which they suggest structural modifications of the shallow conduit caused by flank eruptions.
4.1. Statistical Models for the 1879–2023 Data Set
For the 1879–2023 data set, the estimated model parameters of the log–normal, Weibull, generalised Pareto and log–logistics distributions are reported in Table 2(a,b) for explosive and effusive inter–event time, respectively.
The AIC performance indices obtained for the two classes of events (explosive and effusive) and for each of the four probabilistic models considered (Log–normal, Weibull, GPareto and Log–logistic) are shown in Table 3, while the trends of the CCDF curves are shown in Figure 7a and Figure 7b for explosive and effusive events, respectively.
Results in Table 3 show that for both the explosive and effusive events, the AIC indices of the four standard models were quite similar. However, a visual inspection of Figure 7a,b shows that none of the models seem to satisfactorily fit the right tail of the dataset, which comprises the most energetic events. This is essentially because conventional probabilistic models try to fit the entire dataset. On the contrary, as will become clear below, power law models focus on modelling the events belonging to the tail of the distribution, i.e., those characterised by and therefore may be more effective. Referring to the power law models, the estimated parameters α and and the corresponding standard deviations and and the plausibility index for explosive and effusive events are reported in the first two rows of Table 4, whereas the patterns of the CCDF of empirical and power law models are shown in Figure 8a,b. As concerns the plausibility index [100], it ranges between and a common practice is to discard a power law model if ; otherwise, it is considered plausible.
The results in Table 4 indicate that while the power law is a plausible model for the inter–event time of explosive events, since , it is not so for the inter–event time between effusive events, since in this latter case we have . Indeed, Figure 8b shows that the furthest data of the tail remain quite distant from the dashed line (i.e., the power law). Given the impossibility of finding a unique power law model for all the effusive events, we decided to fit separate power law models for classes F and FF + FFF, obtaining the results indicated in the third and fourth rows of Table 4 and Figure 9a,b for F and FF + FFF events, respectively. With this distinction, the plausibility indexes for the F and FF + FFF classes are now 0.14 and 0.13, respectively, thus indicating that the corresponding power law models are plausible.
To perform an objective comparison between the power law models and the alternatives (i.e., the Log–normal, Weibull, Generalized Pareto and the Log–Logistic), in Table 5 we report the AIC indices (lowest value is the best). Of course, to make the comparison consistent, the costs for the alternative models were computed on the subset for explosive models, for for the effusive F models and for for the FF + FFF models, which were the values computed for the mentioned dataset (see Table 4).
The results in Table 5 show that the power law model is slightly better than the log–normal, Weibull, generalized Pareto and log–logistic in fitting the tail of the dataset, since it exhibits the lowest AIC index. The direct comparison among the empirical CCDF, the power law model and the other distribution models of inter–event times are reported in Figure 10a, Figure 10b and Figure 10c for explosive, F and FF + FFF effusive events, respectively.
4.2. Statistical Models for the 1985–2023 Dataset
For this shortened dataset, the total number of explosive events (ME + U + P) was 150, while for the class F and FF + FFF we had 77 and 26 events, respectively. We fitted the long–tail distribution models mentioned above and the corresponding power law models. For brevity, we report in Table 6 the parameters of the power law models only.
It is possible to see that for the shortened dataset, the power law models are also plausible since we have estimated , and , for the explosive, F and FF + FFF events, respectively, all of which are greater than 0.1.
The direct comparison among the power law models and the four alternative models is summarized in Table 7 in terms of AIC indices and in Figure 11a–c in terms of CCDF curves.
It is possible to see that for the shortened 1985–2023 dataset, the power law models also performed better than the alternatives to fit tails of inter–event times of both explosive and effusive events.
4.3. Statistical Interpretation of Results
In this work, we have highlighted that the events characterizing the activity of the Stromboli volcano from 1879 to today, whether explosive or effusive in nature, have an irregular temporal distribution; in other terms the inter–event time is a random variable (Figure 2, Figure 3, Figure 4 and Figure 5). Therefore, the probabilistic approach is the only one we can use to answer questions such as “what is the probability that after an explosive event has occurred, another one will occur with an inter–event time greater or equal to six months (formally: )?” From the probabilistic point of view, this is equivalent to calculating the Complementary Cumulative Distribution Function of the random variable (the inter–event time) in correspondence with the value 182.5 days (i.e., 6 months). All the CCDF graphs shown in this paper report the inter–event time expressed in days. While the use of the log–normal, Weibull, GPareto and log–logistic distributions is not required to fix an prior to the fitting, the power law is usually more accurate in modelling the events belonging to the tail of the distribution, as found in this paper (Figure 11). However, considering that the different models provide values that are not very different from each other, in addition to calculating the probability estimated by using the individual models, we reported the average of their values. Numerical results are organized as follows: Table 8(a–c) refer to the entire dataset, while Table 9(a–c) refer to the shortened dataset. The last column in each table indicates the probabilities obtained by averaging the different models.
Starting with the explosive events, we report in Table 8(a) the values of the five considered CCDF to estimate the probabilities for inter–event times of . For , the power law model is not applicable (N.A.) since the model holds for days. It is possible to see that by varying from 15 days to 3 years, the average cumulative complementary probability varies from 0.77 to 0.03. In brief, we can say that after an explosive event has occurred there is on average, a probability of 77% that another one may occur after 15 days or more, and this probability reduces to 3% that the next explosive event will occur after 3 years or more.
In an analogous way, we can interpret the results reported in Table 8(b,c), which refer to F and FF + FFF events, respectively.
For the models estimated by using the shortened dataset (1985 to 2023), the results are reported in Table 9(a–c) for explosive, F and FF + FFF events, respectively.
In order to evaluate the differences using the whole (1879–2023) and shortened (1985–2023) datasets, we report in Figure 12a–c the CCDF obtained by averaging the five probability models (see the last columns of Table 8(a–c) and Table 9(a–c)). The graphic representation helps realize that the complementary cumulative probabilities are, on average, lower when using the shortened dataset than the full dataset for all kinds of considered classes (i.e., explosive, F and FF + FFF). This is because the marked increase in events recorded in recent times (see Figure 4) implies a reduction in inter–event times compared to the whole dataset.
The average CCDF plots show that the differences between the models (1879–2023 and 1985–2023) become more pronounced for longer inter–event times (this is more clearly visible in Figure 12a,b). This is because long inter–event times are less frequent in observations made from 1985 onwards and therefore less probable.
5. Discussion
In this paper, we present a new catalogue of events (Table S1) occurring at Stromboli volcano from 1879 until June 2023. Although the catalogue cannot be considered complete, it is still the most complete currently available. The dataset comprises a total of 278 explosive and 194 effusive events, plus other classes that might be useful for hazard assessment. In this dataset, explosive events are distinguished into three classes, major explosions (ME), paroxysms (P) and uncertain (U), this last having an intensity in between major explosions and the mild and persistent Strombolian activity always present at the summit vents. The effusive activity is distinguished into three classes on the basis of magnitude and intensity: very brief and small intra–crater effusions (F), small overflows (FF) and flank eruptions (FFF). In our catalogue, we have also listed landslides (L), crater collapses (C), pyroclastic density currents (PDCs) and tsunamis (T). These last four categories were not mentioned in the previous catalogues, and the frequency of their occurrence is too low to allow us to apply any statistics. In fact, we had just 24 episodes of PDCs, 60% of which have occurred since 2001 (Table S1 and Table 1), and most of them are related to column collapse following paroxysmal eruptions [32,33,45,50,94]. Of the six T events, 50% occurred after 2001. Our catalogue contains ten events of C, 90% of which occurred after 2001, and six events of L, with five of them taking place after 2001 (Table S1 and Table 1). For these four classes of events (L, C, PDC, T), we can consider that the collection of information is much more complete now than it was in the past, and thus that the historical accounts before 2001 were not complete. However, it is worth noting that the first C event (Table 1(b)) was recorded in 1992 [86], and that nine out of the ten C events occurred during the last decade (Table 1(a)). Although the low number of L, C, PDC and T events does not allow a statistical treatment of their frequency of occurrence, these events are being recorded by the present monitoring system and represent an important hazard to the Stromboli population. Such a hazard must be taken into account when considering the approach of people and tourists to specific sites of the island, such as the summit craters or the northern coast, or the deep ravines at the sides of the Sciara del Fuoco [23,39,61,64,92,93,101].
The Stromboli volcano extends above the sea for up to 924 m and below the sea down to ~—2000 m depth [102,103,104,105]. Thus, considering the whole size of the volcanic edifice, it is often compared in size to Mt. Etna, which rises up to 3347 m a.s.l. [106,107,108]. However, the sizes and capacities of the plumbing systems of the two volcanoes are notably different [109,110,111,112,113,114], and this is also testified by the large difference between the erupted volumes. Indeed, effusive activity at Etna results in the output of an average ~30–50 × 106 m3 lava [115,116,117,118], whereas flank eruptions at Stromboli produce on average 3–10 × 106 m3 lava [44,53,55,56,57,58]. Despite the small size of its plumbing system, Stromboli was in a steady state for almost 2000 years [75,111,119], with a persistent and mild Strombolian activity that characterises its summit, and with no significant changes in the morphology and position of the active vents within the crater terrace, at least during the last century [120,121,122]. Considering the small size of its plumbing system [113,114], it is conceivable that subtle and limited changes in its shape and or capacity may cause important changes in the frequency of occurrence of eruptive events. In particular, [91] pointed out a several–fold increase in the number of major explosions and small overflows observed between 2007 and 2012 and a comparable decrease in the number of paroxysmal explosions and flank eruptions when compared to the previous period. [91] explain this with a structural change caused by the 2002–03 and 2007 flank eruptions, which caused an expansion of the upper conduit and thus a greater capacity of the upper 250 m of the feeding system. This small change would have been sufficient to allow efficient mixing between the gas–rich magma rising from the deep storage [52,73,74,123] and the gas–poor magma residing within the uppermost conduit [124,125], resulting in a greater number of major explosions and a smaller number of paroxysms, and in a greater number of small overflows and fewer flank eruptions [91]. This result is further demonstrated by our analysis of the eruptive activity at Stromboli, extended until June 2023, and can be only partially attributed to an improved monitoring system, which was completely rebuilt in 2003 [39,88,89,90]. The statistical models reported in this work represent a contribution to the hazard assessment of both explosive and effusive events. In fact, they allow the evaluation of the cumulative complementary probability that an event of a certain class will occur with an inter–event time greater than or equal to a prefixed value assigned in days. The results provided are to be considered fairly robust as they were obtained by averaging the estimated probabilities using five different distribution models, even if they obviously depend on the degree of completeness of the catalogue. This last consideration, above all, concerns effusive events for which the completeness of the catalogue is, to date, less certain than for explosive events. In addition to the recent increase in the number of major explosions and overflows from the crater rim, the summit crater failure events have also increased significantly [33,45,53,63], as can be observed from Table 1 and Figure 2. This is the result of the asymmetric growth of the summit cone, which from 2010 onwards saw the NE crater piling up welded and loose scoria and spatter on the edge of the NE crater rim [68]. This asymmetric cone growth formed a wide, steep and thick talus, making the summit cone more prone to collapse. In turn, more frequent collapses of the summit cone are responsible for the recent increase in the number of PDC and landslides recorded along the SdF. The search for the reasons for this NE displacement of the summit feeding system is not trivial. However, presumably these changes must be related to processes occurring within or near to the shallow plumbing system. Here, we propose that the NE displacement of the seismicity recorded below Stromboli before the 2007 and 2014 flank eruptions [126], as well as the lateral dike intrusion recorded in 1996 [127], might be connected. In fact, given that the Stromboli feeding system is very small [91,113,114], even a little perturbation at depth might cause an observable change at the surface.
6. Concluding Remarks
One of the novelties of the work here presented is to have compiled a dataset, updated to the end of June 2023, including not just the explosive activity, but also the effusive activity occurring as overflows from the crater rim or as flank eruptions, as well as tsunamis, crater collapses, landslides and PDC. Furthermore, for estimating the hazards related to the explosive activity at Stromboli, we have considered, in addition to well–known heavy–tailed distributions such as the log–normal, already taken into account by previous authors [72], the use of the power law distribution. Indeed, it has been shown that this model is plausible as it fits as well or even better than the traditional heavy tail distribution models for those events belonging to the tail of the distribution, which are the most powerful and hazardous (i.e., those characterized by ). However, the most important consequence of this result is not limited to the model accuracy, but rather to the fact that the power law distribution is characterised by the scale invariance. The lack of a characteristic scale also implies the lack of a characteristic frequency of events. In our case, this implies that the average inter–event time is not relevant for the hazard assessment, similar to what happens in many natural events, including earthquakes and floods, in terms of the expected magnitude of the most likely event, in both time and space.
Supplementary Materials
The following supporting information can be downloaded at: https://www.mdpi.com/article/10.3390/rs15194822/s1, Table S1. The overall number of events considered in this catalogue consists of 520 records from 1879 to June 2023. Among the 278 explosive events, 196 are classified as major explosions (X), 42 as paroxysmal explosions (XX) and 40 are uncertain major explosions (U), which means that they lie at the boundary between the persistent explosive activity and major explosions. The remaining events have been classified as lava flows, further subdivided on the basis of duration and erupted volume as F (small lava flows lasting less than 1 day, or intra–crater lava flows having volume up to 103 m3), FF (overflows from the crater rim and small lava flows lasting more than 1 day and less than 1 month, having volumes greater than 103 m3 and less than 106 m3) and FFF (flank eruptions, involving opening of eruptive fissures on the Sciara del Fuoco, duration of 1 month or more, and/or lava volumes greater than 1 × 10⁶ m3); then Pyroclastic Density Current (PDC), Tsunami (T), Crater Failure (C) and Landslides (L). In the table here below, in white are evidenced the explosive events; in red the effusive events; in green the instability events, either crater failure, landslides or pyroclastic density currents; in yellow tsunami. Time is expressed in UTC, local time (LT) only when specified [128,129,130,131,132,133,134,135,136,137,138,139,140,141,142,143,144,145,146].
Author Contributions
Conceptualization, S.C. and G.N.; methodology, S.C. and G.N.; software, G.N.; validation, S.C. and G.N.; formal analysis, S.C. and G.N.; investigation, S.C. and G.N.; resources, S.C. and G.N.; data curation, S.C. and G.N.; writing—original draft preparation, S.C. and G.N.; writing—review and editing, S.C. and G.N.; visualization, S.C. and G.N.; supervision, S.C. and G.N.; project administration, S.C.; funding acquisition, S.C. All authors have read and agreed to the published version of the manuscript.
Funding
This research was funded by Project FIRST—ForecastIng eRuptive activity at Stromboli volcano: timing, eruptive style, size, intensity, and duration, INGV–Progetto Strategico Dipartimento Vulcani 2019 (Delibera n. 144/2020; Scientific Responsibility: S.C.).
Data Availability Statement
The data used in this paper are listed in the Supplementary Materials—Table S1.
Acknowledgments
We would like to thank the INGV–OE scientists and technicians for the monitoring networks maintenance, and especially Michele Prestifilippo and Placido Montalto for providing essential information for this work. The English style has been reviewed by Stephen Conway.
Conflicts of Interest
The authors declare no conflict of interest.
References
- Bertolaso, G.; De Bernardinis, B.; Cardaci, C.; Scalzo, A. Stromboli (2002–2003) Crisis Management and Risk Mitigation Actions. In The Stromboli Volcano: An Integrated Study of the 2002–2003 Eruption; Geophysical Monograph Series; American Geophysical Union: Washington, DC, USA, 2008; Volume 182. [Google Scholar] [CrossRef]
- Walker, G.P.L. Explosive volcanic eruptions—A new classification scheme. Geol. Rundsch. 1973, 62, 431–446. [Google Scholar] [CrossRef]
- Parfitt, E.A. A discussion of the mechanisms of explosive basaltic eruptions. J. Volcanol. Geotherm. Res. 2004, 134, 77–107. [Google Scholar] [CrossRef]
- Bombrun, M.; Harris, A.; Gurioli, L.; Battaglia, J.; Barra, V. Anatomy of a Strombolian eruption: Inferences from particle data recorded with thermal video. J. Geophys. Res. Solid Earth 2015, 120, 2367–2387. [Google Scholar] [CrossRef]
- Vergniolle, S.; Métrich, N. An interpretative view of open-vent volcanoes. Bull. Volcanol. 2022, 84, 83. [Google Scholar] [CrossRef]
- Benito, M.B.; Alvarado, G.E.; Marchamalo, M.; Rejas, J.G.; Murphy, P.; Franco, R.; Castro, D.; Garcia-Lanchares, C.; Sanchez, J. Temporal and spatial evolution of the 2021 eruption in the Tajogaite volcano (Cumbre Vieja rift zone, La Palma, Canary Islands) from geophysical and geodetic parameter analyses. Nat. Hazards 2023, 118, 2245–2284. [Google Scholar] [CrossRef]
- Genzano, N.; Marchese, F.; Neri, M.; Pergola, N.; Tramutoli, V. Implementation of Robust Satellite Techniques for Volcanoes on ASTER Data under the Google Earth Engine Platform. Appl. Sci. 2021, 11, 4201. [Google Scholar] [CrossRef]
- Schaefer, L.N.; Di Traglia, F.; Chaussard, E.; Lu, Z.; Nolesini, T.; Casagli, N. Monitoring volcano slope instability with Synthetic Aperture Radar: A review and new data from Pacaya (Guatemala) and Stromboli (Italy) volcanoes. Earth-Sci. Rev. 2019, 192, 236–257. [Google Scholar] [CrossRef]
- Dualeh, E.W.; Ebmeier, S.K.; Wright, T.J.; Albino, F.; Naismith, A.; Biggs, J.; Ordoñez, P.A.; Boogher, R.M.; Roca, A. Analyzing explosive volcanic deposits from satellite-based radar backscatter, Volcan de Fuego, 2018. J. Geophys. Res. Solid Earth 2021, 126, e2021JB022250. [Google Scholar] [CrossRef]
- Romero, J.E.; Morgado, E.; Pisello, A.; Felix Boschetty, F.; Maurizio Petrelli, M.; Cáceres, F.; Ayaz Alam, M.; Margherita Polacci, M.; José, L.; Palma, J.; et al. Pre-eruptive Conditions of the 3 March 2015 Lava Fountain of Villarrica Volcano (Southern Andes). Bull. Volcanol. 2023, 85, 2. [Google Scholar] [CrossRef]
- Calvari, S.; Cannavò, F.; Bonaccorso, A.; Spampinato, L.; Pellegrino, A.G. Paroxysmal Explosions, Lava Fountains and Ash Plumes at Etna Volcano: Eruptive Processes and Hazard Implications. Front. Earth Sci. 2018, 6, 107. [Google Scholar] [CrossRef]
- Sbrana, A.; Cioni, R.; Marianelli, P.; Sulpizio, R.; Andronico, D.; Pasquini, G. Volcanic evolution of the Somma-Vesuvius Complex (Italy). J. Maps 2020, 16, 137–147. [Google Scholar] [CrossRef]
- Ozerov, A.; Ispolatov, I.; Lees, J. Modeling Strombolian eruptions of Karymsky volcano, Kamchatka, Russia. J. Volc. Geoth. Res. 2003, 122, 265–280. [Google Scholar] [CrossRef]
- Firth, C.W.; Turner, S.P.; Handley, H.K.; Turner, M.B.; Cronin, S.J.; Girard, G.; Smith, I.E.M. Rapid magmatic processes drive persistently active volcanism. Lithos 2021, 380–381, 105868. [Google Scholar] [CrossRef]
- Fenner, D.; Rümpker, G.; Laumann, P.; Srivastava, N. Amplitude and inter-event time statistics for the island volcanoes Stromboli, Mount Etna, Yasur, and Whakaari. Front. Earth Sci. 2023, 11, 1228103. [Google Scholar] [CrossRef]
- Peters, N.; Oppenheimer, C.; Kyle, P.; Kingsbury, N. Decadal persistence of cycles in lava lake motion at Erebus volcano, Antarctica. Earth Planet. Sci. Lett. 2014, 395, 1–12. [Google Scholar] [CrossRef]
- Iguchi, M.; Yakiwara, H.; Tameguri, T.; Hendrasto, M.; Hirabayashi, J. Mechanism of explosive eruption revealed by geophysical observations at the Sakurajima, Suwanosejima and Semeru volcanoes. J. Volcanol. Geotherm. Res. 2008, 178, 1–9. [Google Scholar] [CrossRef]
- Tsunematsu, K.; Ishii, K.; Yokoo, A. Transport of ballistic projectiles during the 2015 Aso Strombolian eruptions. Earth Planets Space 2019, 71, 49. [Google Scholar] [CrossRef]
- Houghton, B.F.; Swanson, D.A.; Rausch, J.; Carey, R.J.; Fagents, S.A.; Orr, T.R. Pushing the Volcanic Explosivity Index to its limit and beyond: Constraints from exceptionally weak explosive eruptions at Kīlauea in 2008. Geology 2013, 41, 627–630. [Google Scholar] [CrossRef]
- Chouet, B.; Hamisevicz, N.; McGetchin, T.R. Photoballistics of volcanic jet activity at Stromboli, Italy. J. Geophys. Res. 1974, 79, 4961–4976. [Google Scholar] [CrossRef]
- Patrick, M. Dynamics of strombolian ash plumes from thermal (FLIR) video: Motion, morphology and air entrainment. J. Geophys. Res. 2007, 112, B06202. [Google Scholar] [CrossRef]
- Patrick, M.R.; Harris, A.J.L.; Ripepe, M.; Dehn, J.; Rothery, D.A.; Calvari, S. Strombolian explosive styles and source conditions: Insights from thermal (FLIR) video. Bull. Volcanol. 2007, 69, 769–784. [Google Scholar] [CrossRef]
- Barberi, F.; Rosi, M.; Sodi, A. Volcanic hazard assessment at Stromboli based on review of historical data. Acta Vulcanol. 1993, 3, 173–187. [Google Scholar]
- Andronico, D.; Corsaro, R.A.; Cristaldi, A.; Polacci, M. Characterizing high energy explosive eruptions at Stromboli volcano using multidisciplinary data: An example from the 9 January 2005 explosion. J. Volcanol. Geotherm. Res. 2008, 176, 541–550. [Google Scholar] [CrossRef]
- Andronico, D.; Pistolesi, M. The November 2009 paroxysmal explosions at Stromboli. J. Volcanol. Geotherm. Res. 2010, 196, 120–125. [Google Scholar] [CrossRef]
- Coppola, D.; Laiolo, M.; Delle Donne, D.; Ripepe, M.; Cigolini, C. Hot-spot detection and characterization of strombolian activity from MODIS infrared data. Int. J. Remote Sens. 2014, 35, 3403–3426. [Google Scholar] [CrossRef]
- Houghton, B.F.; Taddeucci, J.; Andronico, D.; Gonnermann, H.M.; Pistolesi, M.; Patrick, M.R.; Orr, T.R.; Swanson, D.A.; Edmonds, M.; Gaudin, D.; et al. Stronger or longer: Discriminating between Hawaiian and Strombolian eruption styles. Geology 2016, 44, 163–166. [Google Scholar] [CrossRef]
- Giudicepietro, F.; Calvari, S.; Alparone, S.; Bianco, F.; Bonaccorso, A.; Bruno, V.; Caputo, T.; Cristaldi, A.; D’Auria, L.; De Cesare, W.; et al. Integration of Ground-Based Remote-Sensing and In Situ Multidisciplinary Monitoring Data to Analyze the Eruptive Activity of Stromboli Volcano in 2017–2018. Remote Sens. 2019, 11, 1813. [Google Scholar] [CrossRef]
- Giudicepietro, F.; Calvari, S.; D’Auria, L.; Di Traglia, F.; Layer, L.; Macedonio, G.; Caputo, T.; De Cesare, W.; Ganci, G.; Martini, M.; et al. Changes in the Eruptive Style of Stromboli Volcano before the 2019 Paroxysmal Phase Discovered through SOM Clustering of Seismo-Acoustic Features Compared with Camera Images and GBInSAR Data. Remote Sens. 2022, 14, 1287. [Google Scholar] [CrossRef]
- Giudicepietro, F.; Lopes, C.; Macedonio, G.; Alparone, S.; Bianco, F.; Calvari, S.; De Cesare, W.; Delle Donne, D.; Di Lieto, B.; Esposito, A.M.; et al. Geophysical precursors of the July–August 2019 paroxysmal eruptive phase and their implications for Stromboli volcano (Italy) monitoring. Sci. Rep. 2020, 10, 10296. [Google Scholar] [CrossRef]
- Calvari, S.; Büttner, R.; Cristaldi, A.; Dellino, P.; Giudicepietro, F.; Orazi, M.; Peluso, R.; Spampinato, L.; Zimanowski, B.; Boschi, E. The 7 September 2008 Vulcanian explosion at Stromboli volcano: Multi-parametric characterisation of the event and quantification of the ejecta. J. Geophys. Res. Solid Earth 2012, 117, B05201. [Google Scholar] [CrossRef]
- Calvari, S.; Giudicepietro, F.; Di Traglia, F.; Bonaccorso, A.; Macedonio, G.; Casagli, N. Variable Magnitude and Intensity of Strombolian Explosions: Focus on the Eruptive Processes for a First Classification Scheme for Stromboli Volcano (Italy). Remote Sens. 2021, 13, 944. [Google Scholar] [CrossRef]
- Calvari, S.; Di Traglia, F.; Ganci, G.; Bruno, V.; Ciancitto, F.; Di Lieto, B.; Gambino, S.; Garcia, A.; Giudicepietro, F.; Inguaggiato, S.; et al. Multiparametric Study of an Eruptive Phase Comprising Unrest, Crater Failure, and Lava Flows: Stromboli volcano, 1 December 2020–30 June 2021. Front. Earth Sci. 2022, 10, 899635. [Google Scholar] [CrossRef]
- Corradino, C.; Amato, E.; Torrisi, F.; Calvari, S.; Del Negro, C. Classifying Major Explosions and Paroxysms at Stromboli Volcano (Italy) from Space. Remote Sens. 2021, 13, 4080. [Google Scholar] [CrossRef]
- Amato, E.; Corradino, C.; Torrisi, F.; Del Negro, C. A Deep Convolutional Neural Network for Detecting Volcanic Thermal Anomalies from Satellite Images. Remote Sens. 2023, 15, 3718. [Google Scholar] [CrossRef]
- Gouhier, M.; Donnadieu, F. The geometry of Strombolian explosions: Insights from Doppler radar measurements. Geophys. J. Int. 2010, 183, 1376–1391. [Google Scholar] [CrossRef]
- Leduc, L.; Gurioli, L.; Harris, A.; Colò, L.; Rose-Koga, E.F. Types and mechanisms of strombolian explosions: Characterization of a gas-dominated explosion at Stromboli. Bull. Volcanol. 2015, 77, 8. [Google Scholar] [CrossRef]
- Bertagnini, A.; Coltelli, M.; Landi, P.; Pompilio, M.; Rosi, M. Violent explosions yield new insights into dynamics of Stromboli volcano. Eos Trans. Am. Geophys. Union 1999, 80, 633–636. [Google Scholar] [CrossRef]
- Rosi, M.; Pistolesi, M.; Bertagnini, A.; Landi, P.; Pompilio, M.; Di Roberto, A. Stromboli volcano, Aeolian Islands (Italy): Present eruptive activity and hazards. Geol. Soc. Lond. Mem. 2013, 37, 473–490. [Google Scholar] [CrossRef]
- Rittmann, A. Der Ausbruch des Stromboli am 11 September 1930. Z Vulkanol. 1931, 14, 47–77. [Google Scholar]
- Ponte, G. Attività straordinaria dello Stromboli. Ann. Geophys. 1948, 1, 200–202. [Google Scholar] [CrossRef]
- Harris, A.J.L.; Ripepe, M.; Calvari, S.; Lodato, L.; Spampinato, L. The 5 April 2003 Explosion of Stromboli: Timing of Eruption Dynamics using Thermal Data. In The Stromboli Volcano: An Integrated Study of the 2002–2003 Eruption; American Geophysical Union Monograph Series; American Geophysical Union: Washington, DC, USA, 2008; Volume 182, pp. 305–316. [Google Scholar] [CrossRef]
- Métrich, N.; Bertagnini, A.; Pistolesi, M. Paroxysms at Stromboli Volcano (Italy): Source, Genesis and Dynamics. Front. Earth Sci. 2021, 9, 593339. [Google Scholar] [CrossRef]
- Calvari, S.; Spampinato, L.; Lodato, L.; Harris, A.J.L.; Patrick, M.R.; Dehn, J.; Burton, M.R.; Andronico, D. Chronology and complex volcanic processes during the 2002–2003 flank eruption at Stromboli volcano (Italy) reconstructed from direct observations and surveys with a handheld thermal camera. J. Geophys. Res. 2005, 110, B02201. [Google Scholar] [CrossRef]
- Calvari, S.; Di Traglia, F.; Ganci, G.; Giudicepietro, F.; Macedonio, G.; Cappello, A.; Nolesini, T.; Pecora, E.; Bilotta, G.; Centorrino, V.; et al. Overflows and Pyroclastic Density Currents in March–April 2020 at Stromboli Volcano Detected by Remote Sensing and Seismic Monitoring data. Remote Sens. 2020, 12, 3010. [Google Scholar] [CrossRef]
- Pistolesi, M.; Rosi, M.; Pioli, L.; Renzulli, A.; Bertagnini, A.; Andronico, D. The paroxysmal explosion and its deposits. In The Stromboli Volcano: An Integrated Study of the 2002–2003 Eruption; Geophysical Monograph Series; AGU: Washington, DC, USA, 2008; Volume 182, pp. 317–329. [Google Scholar] [CrossRef]
- Pistolesi, M.; Delle Donne, D.; Pioli, L.; Ripepe, M. The 15 March 2007 explosive crisis at Stromboli volcano, Italy: Assessing physical parameters through a multidisciplinary approach. J. Geophys. Res. Atmos. 2011, 116, B12206. [Google Scholar] [CrossRef]
- Bonaccorso, A.; Calvari, S.; Linde, A.; Sacks, S.; Boschi, E. Dynamics of the shallow plumbing system investigated from borehole strainmeters and cameras during the 15 March 2007 Vulcanian paroxysm at Stromboli volcano. Earth Planet. Sci. Lett. 2012, 357–358, 249–256. [Google Scholar] [CrossRef]
- Di Lieto, B.; Romano, P.; Scarpa, R.; Linde, A.T. Strain signals before and during paroxysmal activity at Stromboli volcano, Italy. Geophys. Res. Lett. 2020, 47, e2020GL088521. [Google Scholar] [CrossRef]
- Giordano, G.; De Astis, G. The summer 2019 basaltic Vulcanian eruptions (paroxysms) of Stromboli. Bull. Volcanol. 2021, 83, 1. [Google Scholar] [CrossRef]
- Voloschina, M.; Métrich, N.; Bertagnini, A.; Marianelli, P.; Aiuppa, A.; Ripepe, M.; Pistolesi, M. Explosive eruptions at Stromboli volcano (Italy): A comprehensive geochemical view on magma sources and intensity range. Bull. Volcanol. 2023, 85, 34. [Google Scholar] [CrossRef]
- Aiuppa, A.; Bitetto, M.; Delle Donne, D.; La Monica, F.P.; Tamburello, G.; Coppola, D.; Della Schiava, M.; Innocenti, L.; Lacanna, G.; Laiolo, M.; et al. Volcanic CO2 tracks the incubation period of basaltic paroxysms. Sci. Adv. 2021, 7, eabh0191. [Google Scholar] [CrossRef]
- Di Traglia, F.; Calvari, S.; D’Auria, L.; Nolesini, T.; Bonaccorso, A.; Fornaciai, A.; Esposito, A.; Cristaldi, A.; Favalli, M.; Casagli, N. The 2014 effusive eruption at Stromboli: New insights from in-situ and remote sensing measurements. Remote Sens. 2018, 10, 2035. [Google Scholar] [CrossRef]
- Nappi, G. Recent activity of Stromboli. Nature 1976, 261, 119–120. [Google Scholar] [CrossRef]
- Capaldi, G.; Guerra, I.; Lo Bascio, A.; Luongo, G.; Pece, R.; Rapolla, A.; Scarpa, R.; Del Pezzo, E.; Martini, M.; Ghiara, M.R.; et al. Stromboli and its 1975 Eruption. Bull. Volcanol. 1978, 41, 259–285. [Google Scholar] [CrossRef]
- De Fino, M.; La Volpe, L.; Falsaperla, S.; Frazzetta, G.; Neri, G.; Francalanci, L.; Rosi, M.; Sbrana, A. The Stromboli eruption of December 6, 1985–April 25, 1986: Volcanological, petrological and seismological data. Rend. Soc. It. Min. Petr. 1988, 43, 1021–1038. [Google Scholar]
- Calvari, S.; Lodato, L.; Steffke, A.; Cristaldi, A.; Harris, A.J.L.; Spampinato, L.; Boschi, E. The 2007 Stromboli flank eruption: Chronology of the events, and effusion rate measurements from thermal images and satellite data. J. Geophys. Res. Solid Earth 2010, 115, B04201. [Google Scholar] [CrossRef]
- Marsella, M.; Baldi, P.; Coltelli, M.; Fabris, M. The morphological evolution of the Sciara del Fuoco since 1868: Reconstructing the effusive activity at Stromboli volcano. Bull. Volcanol. 2012, 74, 231–248. [Google Scholar] [CrossRef]
- Casalbore, D.; Di Traglia, F.; Bosman, A.; Romagnoli, C.; Casagli, N.; Chiocci, F.L. Submarine and Subaerial Morphological Changes Associated with the 2014 Eruption at Stromboli Island. Remote Sens. 2021, 13, 2043. [Google Scholar] [CrossRef]
- Falsaperla, S.; Maiolino, V.; Spampinato, S.; Jaquet, O.; Neri, M. Sliding episodes during the 2002–2003 Stromboli lava effusion: Insights from seismic, volcanic, and statistical data analysis. Geochem. Geophys. Geosystems 2008, 9, Q04022. [Google Scholar] [CrossRef]
- Salvatici, T.; Di Roberto, A.; Di Traglia, F.; Bisson, M.; Morelli, S.; Fidolini, F.; Bertagnini, A.; Pompilio, M.; Hungr, O.; Casagli, N. From hot rocks to glowing avalanches: Numerical modelling of gravity-induced pyroclastic density currents and hazard maps at the Stromboli Volcano (Italy). Geomorphology 2016, 273, 93–106. [Google Scholar] [CrossRef]
- Turchi, A.; Di Traglia, F.; Luti, T.; Olori, D.; Zetti, I.; Fanti, R. Environmental aftermath of the 2019 Stromboli eruption. Remote Sens. 2020, 12, 994. [Google Scholar] [CrossRef]
- Calvari, S.; Intrieri, E.; Di Traglia, F.; Bonaccorso, A.; Casagli, N.; Cristaldi, A. Monitoring crater-wall collapse at active volcanoes: A study of the 12 January 2013 event at Stromboli. Bull. Volcanol. 2016, 78, 39. [Google Scholar] [CrossRef]
- Maramai, A.; Graziani, L.; Tinti, S. Tsunamis in the Aeolian Islands (southern Italy): A review. Mar. Geol. 2005, 215, 11–21. [Google Scholar] [CrossRef]
- Tinti, S.; Maramai, A.; Armigliato, A.; Graziani, L.; Manucci, A.; Pagnoni, G.; Zaniboni, F. Observations of physical effects from tsunamis of December 30, 2002 at Stromboli volcano, Southern Italy. Bull. Volcanol. 2006, 68, 450–461. [Google Scholar] [CrossRef]
- Fornaciai, A.; Favalli, M.; Nannipieri, L. Numerical simulations of the tsunamis generated by the Sciara del Fuoco landslides (Stromboli Islands, Italy). Sci. Rep. 2019, 9, 18542. [Google Scholar] [CrossRef] [PubMed]
- Martini, M.; Giudicepietro, F.; D’Auria, L.; Esposito, A.M.; Caputo, T.; Curciotti, R.; De Cesare, W.; Orazi, M.; Scarpato, G.; Caputo, A.; et al. Seismological monitoring of the February 2007 effusive eruption of the Stromboli volcano. Ann. Geophys. 2007, 50, 775–788. [Google Scholar] [CrossRef]
- Tioukov, V.; Giudicepietro, F.; Macedonio, G.; Calvari, S.; Di Traglia, F.; Fornaciai, A.; Favalli, M. Structure of the Shallow Supply System at Stromboli Volcano, Italy, through Integration of Muography, Digital Elevation Models, Seismicity, and Ground Deformation Data. In Exploring Earth’s Subsurface with Elementary Particles; Olah, L., Tanaka, H.K.M., Varga, D., Eds.; Wiley: Hoboken, NJ, USA, 2022; Volume 270, pp. 75–91. [Google Scholar] [CrossRef]
- Di Traglia, F.; Intrieri, E.; Nolesini, T.; Bardi, F.; Del Ventisette, C.; Ferrigno, F.; Frangioni, S.; Frodella, W.; Gigli, G.; Lotti, A.; et al. The ground-based InSAR monitoring system at Stromboli volcano: Linking changes in displacement rate and intensity of persistent volcanic activity. Bull. Volcanol. 2014, 76, 786. [Google Scholar] [CrossRef]
- Di Traglia, F.; Del Ventisette, C.; Rosi, M.; Mugnai, F.; Intrieri, E.; Moretti, S.; Casagli, N. Ground-based InSAR reveals conduit pressurization pulses at Stromboli volcano. Terra Nova 2013, 25, 192–198. [Google Scholar] [CrossRef]
- Bevilacqua, A.; Bertagnini, A.; Pompilio, M.; Landi, P.; Del Carlo, P.; Roberto, A.D.; Piccione, C.; Neri, A. Historical Catalog of Major Explosions and Paroxysms at Stromboli (Italy), 1st ed.; Istituto Nazionale di Geofisica e Vulcanologia (INGV): Roma, Italy, 2020. [Google Scholar] [CrossRef]
- Bevilacqua, A.; Bertagnini, A.; Pompilio, M.; Landi, P.; Del Carlo, P.; Di Roberto, A.; Aspinall, W.; Neri, A. Major explosions and paroxysms at Stromboli (Italy): A new historical catalog and temporal models of occurrence with uncertainty quantification. Sci. Rep. 2020, 10, 17357. [Google Scholar] [CrossRef] [PubMed]
- Métrich, N.; Bertagnini, A.; Landi, P.; Rosi, M. Crystallization Driven by Decompression and Water Loss at Stromboli Volcano (Aeolian Islands, Italy). J. Pet. 2001, 42, 1471–1490. [Google Scholar] [CrossRef]
- Métrich, N.; Bertagnini, A.; Landi, P.; Rosi, M.; Balhadj, O. Triggering mechanism at the origin of paroxysms at Stromboli (Aeolian Archipelago, Italy): The 5 April 2003 eruption. Geophys. Res. Lett. 2005, 32, L10305. [Google Scholar] [CrossRef]
- Rosi, M.; Bertagnini, A.; Landi, P. Onset of the persistent activity at Stromboli Volcano (Italy). Bull. Volcanol. 2000, 62, 294–300. [Google Scholar] [CrossRef]
- Lautze, N.; Houghton, B.F. Linking variable explosion style and magma textures during 2002 at Stromboli volcano, Italy. Bull. Volcanol. 2007, 69, 445–460. [Google Scholar] [CrossRef]
- Abruzzese, D. Attività dello Stromboli dal 1934 al 1936. Bull. Volcanol. 1937, 11, 205–210. [Google Scholar] [CrossRef]
- Abruzzese, D. Attività dello Stromboli dal 1937 al giugno 1939. Bull. Volcanol. 1940, 7, 57–66. [Google Scholar] [CrossRef]
- Lo Giudice, E.; Rittmann, A. BGVN (Global Volcanism Program, Smithsonian Institution); Smithsonian Institution: Washington, DC, USA, 6 May 1971; CSLP 34-71, card 1196. [Google Scholar]
- Nappi, G. Sull’attività recente dello Stromboli (ottobre 1972–dicembre 1974). Boll. Della Soc. Geol. Ital. 1975, 94, 465–478. [Google Scholar]
- Falsaperla, S.; Montalto, A.; Spampinato, S. Analysis of seismic data concerning explosive sequences on Stromboli volcano in 1989. Gruppo Naz. Per La Vulcanol. Boll. 1989, 1, 249–258. [Google Scholar]
- Falsaperla, S.; Cardaci, C. Seismic activity at Stromboli. Acta Vulcanol. 1994, 6, 56–58. [Google Scholar]
- Renzulli, A.; Nappi, G.; Cardaci, C.; Falsaperla, S. Annual Report of the World Volcanic Eruptions in 1992. Bull. Volcan. Erupt. 1995, 32, 7–10. [Google Scholar]
- Falsaperla, S.; Spampinato, S. Seismic insight into explosive paroxysms at Stromboli volcano, Italy. J. Volcanol. Geotherm. Res. 2003, 125, 137–150. [Google Scholar] [CrossRef]
- Jaquet, O.; Carniel, R. Multivariate stochastic modelling: Towards forecasts of paroxysmal phases at Stromboli. J. Volcanol. Geotherm. Res. 2003, 128, 261–271. [Google Scholar] [CrossRef]
- Langer, H.; Falsaperla, S. Long-term observation of volcanic tremor on Stromboli volcano (Italy): A synopsis. Pure Appl. Geophys. 1996, 147, 1198–1223. [Google Scholar] [CrossRef]
- Bonaccorso, A.; Calvari, S.; Garfì, G.; Lodato, L.; Patané, D. December 2002 flank failure and tsunami at Stromboli volcano inferred by volcanological and geophysical observations. Geophys. Res. Lett. 2003, 30, 1941–1944. [Google Scholar] [CrossRef]
- Bertolaso, G.; Bonaccorso, A.; Boschi, E. Scientific Community and Civil Protection Synergy during the Stromboli 2002–2003 Eruption. In The Stromboli Volcano: An Integrated Study of the 2002–2003 Eruption; Geophysical Monograph Series; American Geophysical Union: Washington, DC, USA, 2008; Volume 182. [Google Scholar] [CrossRef]
- Barberi, F.; Civetta, L.; Rosi, M.; Scandone, R. Chronology of the 2007 eruption of Stromboli and the activity of the Scientific Synthesis Group. J. Volcanol. Geotherm. Res. 2009, 182, 123–130. [Google Scholar] [CrossRef]
- Casagli, N.; Intrieri, E.; Carlà, T.; Di Traglia, F.; Frodella, W.; Gigli, G.; Lombardi, L.; Nocentini, M.; Raspini, F.; Tofani, V. Monitoring and Early Warning Systems: Applications and Perspectives. In Understanding and Reducing Landslide Disaster Risk; ICL Contribution to Landslide Disaster Risk Reduction; Casagli, N., Tofani, V., Sassa, K., Bobrowsky, P.T., Takara, K., Eds.; Springer: Berlin/Heidelberg, Germany, 2021. [Google Scholar] [CrossRef]
- Calvari, S.; Bonaccorso, A.; Madonia, P.; Neri, M.; Liuzzo, M.; Salerno, G.G.; Behncke, B.; Caltabiano, T.; Cristaldi, A.; Giuffrida, G.; et al. Major eruptive style changes induced by structural modifications of a shallow conduit system: The 2007–2012 Stromboli case. Bull. Volcanol. 2014, 76, 841. [Google Scholar] [CrossRef]
- Di Traglia, F.; Nolesini, T.; Ciampalini, A.; Solari, L.; Frodella, W.; Bellotti, F.; Fumagalli, A.; De Rosa, G.; Casagli, N. Tracking morphological changes and slope instability using spaceborne and ground-based SAR data. Geomorphology 2018, 300, 95–112. [Google Scholar] [CrossRef]
- Di Traglia, F.; Calvari, S.; Borselli, L.; Cassanego, L.; Giudicepietro, F.; Macedonio, G.; Nolesini, T.; Casagli, N. Assessing flank instability of Stromboli volcano (Italy) by the reappraising of the 30 December 2002 tsunamigenic landslides. Landslides 2023, 20, 1363–1380. [Google Scholar] [CrossRef]
- Andronico, D.; Del Bello, E.; D’Oriano, C.; Landi, P.; Pardini, F.; Scarlato, P.; de’ Michieli Vitturi, M.; Taddeucci, J.; Cristaldi, A.; Ciancitto, F.; et al. Uncovering the eruptive patterns of the 2019 double paroxysm eruption crisis of Stromboli volcano. Nat. Commun. 2021, 12, 4213. [Google Scholar] [CrossRef]
- Calvari, S.; Nunnari, G. Etna Output Rate during the Last Decade (2011–2022): Insights for Hazard Assessment. Remote Sens. 2022, 14, 6183. [Google Scholar] [CrossRef]
- Watt, S.F.L.; Mather, T.A.; Pyle, D.M. Vulcanian explosion cycles: Patterns and predictability. Geology 2007, 35, 839–842. [Google Scholar] [CrossRef]
- Connor, C.B.; Sparks, R.S.J.; Mason, R.M.; Bonadonna, C.; Young, S.R. Exploring links between physical and probabilistic models of volcanic eruptions: The Soufrière Hills Volcano, Montserrat. Geophys. Res. Lett. 2003, 30, 1701. [Google Scholar] [CrossRef]
- Bak, P. How Nature Works: The Science of Self-Organized Criticality. Copernicus: New York, NY, USA, 1996. [Google Scholar]
- Corral, A.; Gonzales, A. Power Law Size Distributions in Geoscience Revisited. Earth Space Sci. 2019, 6, 673–697. [Google Scholar] [CrossRef]
- Clauset, A.; Cosma, R.S.; Newman, M.E.J. Power-Law Distributions in Empirical Data. SIAM Rev. 2009, 5, 661–703. [Google Scholar] [CrossRef]
- Fornaciai, A.; Favalli, M.; Nannipieri, L. Reconstruction of the 2002 tsunami at Stromboli using the non-hydrostatic WAVE model (NHWAVE). Geol. Soc. Lond. Spec. Publ. 2021, 519, SP519-2020. [Google Scholar] [CrossRef]
- Romagnoli, C.; Casalbore, D.; Bortoluzzi, G.; Bosman, A.; Chiocci, F.L.; D’Oriano, F.; Gamberi, F.; Ligi, M.; Marani, M. Bathy-morphological setting of the Aeolian Islands. Geol. Soc. Lond. Mem. 2013, 37, 27–36. [Google Scholar] [CrossRef]
- Romagnoli, C.; Kokelaar, P.; Rossi, P.L.; Sodi, A. The submarine extension of the Sciara del Fuoco feature (Stromboli isl.): Morphologic characterization. Acta Vulcanol. 1993, 3, 91–98. [Google Scholar]
- Marani, M.P.; Gamberi, F. Distribution and nature of submarine volcanic landforms in the Tyrrhenian Sea: The arc vs the backarc. Mem. Descr. Carta Geol. D’italia 2004, 44, 109–126. [Google Scholar]
- Civico, R.; Ricci, T.; Scarlato, P.; Andronico, D.; Cantarero, M.; Carr, B.B.; De Beni, E.; Del Bello, E.; Johnson, J.B.; Kueppers, U.; et al. Unoccupied Aircraft Systems (UASs) Reveal the Morphological Changes at Stromboli Volcano (Italy) before, between, and after the 3 July and 28 August 2019 Paroxysmal Eruptions. Remote Sens. 2021, 13, 2870. [Google Scholar] [CrossRef]
- Neri, M.; Mazzarini, F.; Tarquini, S.; Bisson, M.; Isola, I.; Behncke, B.; Pareschi, M.T. The changing face of Mount Etna’s summit area documented with Lidar technology. Geophys. Res. Lett. 2008, 35, L09305. [Google Scholar] [CrossRef]
- Bisson, M.; Spinetti, C.; Andronico, D.; Palaseanu-Lovejoy, M.; Buongiorno, M.F.; Alexandrov, O.; Cecere, T. Ten years of volcanic activity at Mt Etna: High resolution mapping and accurate quantification of the morphological changes by Pleiades and Lidar data. Int. J. Appl. Earth Obs. Geoinf. 2021, 102, 102369. [Google Scholar] [CrossRef]
- Ganci, G.; Cappello, A.; Neri, M. Data Fusion for Satellite- Derived Earth Surface: The 2021 Topographic Map of Etna Volcano. Remote Sens. 2023, 15, 198. [Google Scholar] [CrossRef]
- Wadge, G. The storage and release of magma on Mount Etna. J. Volcanol. Geotherm. Res. 1977, 2, 361–384. [Google Scholar] [CrossRef]
- Corsaro, R.A.; Pompilio, M. Dynamics of magma at Mount Etna. In Mt. Etna Volcano Laboratory; Geophysical Monograph Series; American Geophysical Union: Washington, DC, USA, 2004; Volume 143, pp. 91–110. [Google Scholar]
- Francalanci, L.; Avanzinelli, R.; Nardini, I.; Tiepolo, M.; Davidson, J.P.; Vannucci, R. Crystal recycling in the steady-state system of the active Stromboli volcano: A 2.5-ka story inferred from in situ Sr-isotope and trace element data. Contrib. Miner. Pet. 2012, 163, 109–131. [Google Scholar] [CrossRef]
- Patané, D.; Aiuppa, A.; Aloisi, M.; Behncke, B.; Cannata, A.; Coltelli, M.; Di Grazia, G.; Gambino, S.; Gurrieri, S.; Marria, M.; et al. Insights into magma and fluid transfer at Mount Etna by a multiparametric approach: A model of the events leading to the 2011 eruptive cycle. J. Geophys. Res. Solid Earth 2013, 118, 3519–3539. [Google Scholar] [CrossRef]
- Patané, D.; Barberi, G.; De Gori, P.; Cocina, O.; Zuccarello, L.; Garcia-Yeguas, A.; Castellano, M.; D’Alessandro, A.; Sgroi, T. The shallow magma chamber of Stromboli Volcano (Italy). Geophys. Res. Lett. 2017, 44, 6589–6596. [Google Scholar] [CrossRef]
- Revil, A.; Finizola, A.; Johnson, T.; Ricci, T.; Gresse, M.; Delcher, E.; Ripepe, M. The thermal plumbing system of Stromboli volcano, Aeolian Islands (Italy) inferred from electrical conductivity and induced polarization tomography. J. Geophys. Res. : Solid Earth 2023, 128, e2023JB026475. [Google Scholar] [CrossRef]
- Guest, J.E.; Duncan, A.M. Internal plumbing of Mount Etna. Nature 1981, 290, 584–586. [Google Scholar] [CrossRef]
- Branca, S.; Del Carlo, P. Types of eruptions of Etna volcano AD 1670–2003: Implications for short-term eruptive behaviour. Bull. Volcanol. 2005, 67, 732–742. [Google Scholar] [CrossRef]
- Harris, A.J.L.; Steffke, A.; Calvari, S.; Spampinato, L. Thirty years of satellite-derived lava discharge rates at Etna: Implications for steady volumetric output. J. Geophys. Res. 2011, 116, B08204. [Google Scholar] [CrossRef]
- Harris, A.J.L.; Steffke, A.; Calvari, S.; Spampinato, L. Correction to “Thirty years of satellite-derived lava discharge rates at Etna: Implications for steady volumetric output”. J. Geophys. 2012, 117, B08207. [Google Scholar] [CrossRef]
- Harris, A.J.L.; Stevenson, D.S. Magma budgets and steady-state activity of Vulcano and Stromboli. Geophys. Res. Lett. 1997, 24, 1043–1046. [Google Scholar] [CrossRef]
- Washington, H.S. Persistence of vents at Stromboli and its bearing on volcanic mechanism. Geol. Soc. Am. Bull. 1917, 28, 249–278. [Google Scholar] [CrossRef]
- Cavallaro, C. Le attività dello Stromboli nel triennio 1957-59 e le variazioni morfologiche da esse determinate. In Proceedings of the Atti del XX Congresso Geografico Italiano (1967), Rome, Italy, 23 March–3 April 1967; pp. 229–243. [Google Scholar]
- Harris, A.; Ripepe, M. Temperature and dynamics of degassing at Stromboli. J. Geophys. Res. 2007, 112, B03205. [Google Scholar] [CrossRef]
- Allard, P.; Aiuppa, A.; Loyer, H.; Carrot, F.; Gaudry, A.; Pinte, G.; Michel, A.; Dongarrà, G. Acid gas and metal emission rates during long-lived basalt degassing at Stromboli volcano. Geophys. Res. Lett. 2000, 27, 1207–1210. [Google Scholar] [CrossRef]
- Pompilio, M.; Bertagnini, A.; Métrich, N. Geochemical heterogeneities and dynamics of magmas within the plumbing system of a persistently active volcano: Evidence from Stromboli. Bull. Volcanol. 2012, 74, 881–894. [Google Scholar] [CrossRef]
- Re, G.; Pompilio, M.; Del Carlo, P.; Di Roberto, A. Physical and morphological characterization of the 19 May 2021 ash cloud deposit at Stromboli (Italy). Sci. Rep. 2022, 12, 10777. [Google Scholar] [CrossRef] [PubMed]
- Gambino, S.; Scaltrito, A. Volcanic-tectonic seismicity at Stromboli (2005–2016). J. Volcanol. Geotherm. Res. 2018, 350, 1–6. [Google Scholar] [CrossRef]
- Bonaccorso, A. Evidence of a dike-sheet intrusion at Stromboli volcano inferred through continuous tilt. Geophys. Res. Lett. 1998, 25, 4225–4228. [Google Scholar] [CrossRef]
- Abbruzzese, D. Attività dello Stromboli dal 1930 al 1934. Boll. Soc. Sism. It. 1935, 33, 118–125. [Google Scholar]
- Burton, M.; Calvari, S.; Spampinato, L.; Lodato, L.; Pino, N.A.; Marchetti, E.; Mure, F. Volcanic and seismic activity at Stromboli preceding the 2002-03 eruption. In The Stromboli Volcano: An Integrated Study of the 2002–2003 Eruption; American Geophysical Union Monograph Series; American Geophysical Union: Washington, DC, USA, 2008; Volume 182, pp. 93–104. ISBN 978-0-87590-447-0. [Google Scholar] [CrossRef]
- Calvari, S. Bulletin of the Global Volcanism Network; May 1993, vol. 18, n. 5. Global Volcanism Program, 1993; Report on Stromboli (Italy) (Venzke, E., ed.). Bulletin of the Global Volcanism Network, 18:5. Smithsonian Institution. 1993. Available online: https://volcano.si.edu/showreport.cfm?doi=10.5479/si.GVP.BGVN199305-211040 (accessed on 20 August 2023).
- Calvari, S. Bulletin of the Global Volcanism Network vol. 18, n. 10. Global Volcanism Program, 1993. Report on Stromboli (Italy) (Venzke, E., ed.). Bulletin of the Global Volcanism Network, 18:5. Smithsonian Institution. 1993. Available online: https://volcano.si.edu/showreport.cfm?doi=10.5479/si.GVP.BGVN199310-211040 (accessed on 20 August 2023).
- Calvari, S. 2011 INGV Internal Report Prot. Int. N. UFVG2011/30; INGV: Catania, Italy, 2011. [Google Scholar]
- Cavallaro, C. Un ciclo effusivo dello Stromboli (1–14 gennaio 1956; 16 gennaio–16 marzo 1956). Riv. Stromboli 1957, 6, 33–39. [Google Scholar]
- Cavallaro, C. L’attività dello Stromboli dal 1940 al 1953. Boll. Accad. Gioenia Sci. Nat. Catania 1957, 3, 525–532. [Google Scholar]
- Cavallaro, C. L’attività effusiva dello Stromboli del 22 marzo 1955. Riv. Stromboli 1957, 5, 15–17. [Google Scholar]
- Cavallaro, C. L’attività dello Stromboli dall’aprile 1954 al 31 dicembre 1956. Boll. Accad. Gioenia Sci. Nat. Catania 1957, 4, 103–118. [Google Scholar]
- Cucuzza Silvestri, S. La recente attività dello Stromboli (febbraio-marzo 1954). Boll. Accad. Gioenia Sci. Nat. Catania 1955, 3, 26–31. [Google Scholar]
- De Fiore, O. I fenomeni eruttivi avvenuti allo Stromboli dal 1914 al 1916. Boll. Soc. Sism. It. 1923, 24, 9–66. [Google Scholar]
- Falsaperla, S.; Cardaci, C. Main Features of seismic activity at Stromboli. Acta Vulcanol. 1998, 10, 136–140. [Google Scholar]
- Falsaperla, S.; Velardita, L. Bulletin of the Global Volcanism Network; January 1993, vol. 18, n. 1. Global Volcanism Program, 1993. Report on Stromboli (Italy) (Venzke, E., ed.). Bulletin of the Global Volcanism Network, 18:1. Smithsonian Institution. 1993. Available online: https://volcano.si.edu/showreport.cfm?doi=10.5479/si.GVP.BGVN199301-211040 (accessed on 20 August 2023).
- Gasparini, P.; Lirer, L.; Luongo, G. Caratteristiche petrochimiche e fisiche della lava emessa dallo Stromboli nell’aprile del 1967. Ann. Dell’osservatorio Vesuv. Sesta Ser. 1996, 8, 37–52. [Google Scholar]
- Gurioli, L.; Harris, A.J.L.; Colò, L.; Bernard, J.; Favalli, M.; Ripepe, M.; Andronico, D. Classification, landing distribution, and associated flight parameters for a bomb field emplaced during a single major explosion at Stromboli, Italy. Geology 2013, 41, 559–562. [Google Scholar] [CrossRef]
- Landi, P.; Métrich, N.; Bertagnini, A.; Rosi, M. Recycling and “re-hydration” of degassed magma inducing transient dissolution/crystallization events at Stromboli (Italy). J. Volcanol. Geotherm. Res. 2008, 174, 325–336. [Google Scholar] [CrossRef]
- Nappi, G.; Renzulli, A.; Falsaperla, S. Annual Report of the World Volcanic Eruptions in 1988. Bull. Volcan. 1991, 53, 1–108. [Google Scholar]
- Rosi, M.; Sbrana, A. Annual Report of the World Volcanic Eruptions in 1985. Bull. Volcan. Erupt. 1988, 25. Bull. Volcanol. 1988, 50, 7–54. [Google Scholar]
- Simkin, T.; Siebert, L.; McClell, L.; Bridge, D.; Newhall, C.; Latter, J.H. Volcanoes of the World; Hutchinson Ross Publ. Co.: Washington, DC, USA, 1981; p. 233. [Google Scholar]
Figure 1.
(a) The southern Tyrrhenian Sea and location of the Aeolian Archipelago, with Stromboli island in the red circle. (b) Google maps image of Stromboli island, with the villages of Stromboli and Ginostra on the NE and W flanks of the island, respectively. The Sciara del Fuoco depression (SdF) on the NW flank is where the present lava flows expand. The active craters are located in the upper part of the Sciara del Fuoco, and their position is marked by the red ellipse. The yellow and red dots indicate the position and labels of the INGV monitoring cameras, both thermal (in red, SPCT, SCT, SQT, SPT), infrared (in red, SPI) and visual (in yellow, SCV, SQV, SPV), used for the assessment of the eruptive activity and the compilation of the catalogue (Table S1). An observatory (white square) was established in 1895 at Semaforo Labronzo on the north flank of the island [23].

Figure 2.
Number of events per year from 1879 to 2023 attributed to the ten classes considered in the dataset. ME = major explosions; U = uncertain major explosions; P = paroxysms; F = small lava flows lasting less than 1 day or intracrater lava flows having a maximum volume of 103 m3; FF = overflows from the crater rim and small lava flows lasting more than 1 day and less than 1 month, having volumes greater than 103 m3 and less than 106 m3; FFF = flank eruptions, involving the opening of eruptive fissures on the Sciara del Fuoco, a duration of 1 month or more, and/or lava volumes of 1 × 10⁶ m3 or greater; PDC = pyroclastic density currents; T = tsunami; C = crater failure; L = landslides.

Figure 3.
Number of events per year computed for each class, averaging on non–overlapping windows of length w = 24 years: (a) ME, P and U events; (b) F, FF and FFF events.
Figure 3.
Number of events per year computed for each class, averaging on non–overlapping windows of length w = 24 years: (a) ME, P and U events; (b) F, FF and FFF events.

Figure 4.
(a) Cumulative number of ME, U and P class events versus time expressed in year. (b) Cumulative number of F, FF and FFF class events versus time expressed in year. (c) Cumulative number of PDC and T class events versus time expressed in year. (d) Cumulative number of C and L class events versus time expressed in year.

Figure 5.
(a) Inter–event times (in days) for the explosive events (ME + P + U) and (b) effusive events (F + FF + FFF) occurring at Stromboli during 1879–2023.
Figure 5.
(a) Inter–event times (in days) for the explosive events (ME + P + U) and (b) effusive events (F + FF + FFF) occurring at Stromboli during 1879–2023.

Figure 6.
Distribution of inter–event times between 1879 and 2023: (a) explosive, (b) effusive.

Figure 7.
Empirical CCDF and model fits performed by using the log–normal model, Weibull, generalized Pareto model and log–logistic distributions (a) for explosive events and (b) for effusive events. The 1879–2023 dataset was considered.
Figure 7.
Empirical CCDF and model fits performed by using the log–normal model, Weibull, generalized Pareto model and log–logistic distributions (a) for explosive events and (b) for effusive events. The 1879–2023 dataset was considered.

Figure 8.
Empirical complementary cumulative distribution function (CCDF) (blue circles) and its power law model fit (dotted black line): (a) obtained by using the inter–event time of explosive events (ME + P + U) occurring at Stromboli between 1879 and 2023, and (b) by using the (F + FF + FF) events. The blue star symbol in the abscissa indicates the estimate that for the considered dataset is equal to 147 days and 26 days, respectively.

Figure 9.
Power law model for (a) F inter–event times and (b) for FF and FFF inter–event times. The blue star symbol in the abscissa indicates the estimate that for the considered dataset is equal to 147 days and 26 days, respectively.
Figure 9.
Power law model for (a) F inter–event times and (b) for FF and FFF inter–event times. The blue star symbol in the abscissa indicates the estimate that for the considered dataset is equal to 147 days and 26 days, respectively.

Figure 10.
Log–log plot of the empirical complementary cumulative distribution function (CCDF) of inter–event times and the five considered cumulative probability distribution models obtained by using the entire dataset: (a) ME + P + U events, (b) F events, (c) FF + FFF events.
Figure 10.
Log–log plot of the empirical complementary cumulative distribution function (CCDF) of inter–event times and the five considered cumulative probability distribution models obtained by using the entire dataset: (a) ME + P + U events, (b) F events, (c) FF + FFF events.


Figure 11.
Log–log plot of the empirical complementary cumulative distribution functions (CCDFs) of inter–event times and the five considered cumulative probability distribution models obtained by using the shortened dataset: (a) explosive events, (b) F effusive events, (c) FF and FFF effusive events.


Figure 12.
Comparison between the inter–event time average complementary cumulative probabilities obtained by using the entire (1879–2023) and the shortened dataset (1985–2023): (a) for explosive events, (b) for F effusive events, (c) for FF + FFF effusive events.
Figure 12.
Comparison between the inter–event time average complementary cumulative probabilities obtained by using the entire (1879–2023) and the shortened dataset (1985–2023): (a) for explosive events, (b) for F effusive events, (c) for FF + FFF effusive events.


Table 1.
(a) Number of events occurring at Stromboli volcano within the specified lapse of time. ME = major explosions; U = uncertain major explosions; P = paroxysmal explosions; F = small lava flows lasting less than 1 day, or intra–crater lava flows having a maximum volume of 103 m3; FF = overflows from the crater rim and small lava flows lasting more than 1 day and less than 1 month, having volumes greater than 103 m3 and less than 106 m3; FFF = flank eruptions, involving opening of eruptive fissures on the Sciara del Fuoco, duration of 1 month or more, and/or lava volumes of 1 × 10⁶ m3 or greater. PDC = pyroclastic density currents; T = tsunami; C = crater failure; L = landslides. (b) Some statistical information on the dataset: the first column shows the event class, the second column the date of the first recorded event, and the third to seventh columns show the minimum, maximum, median and standard deviation of the inter–event time τ, here expressed in days.
| (a) | ||||||||||||||
| Interval/Type of Event | ME | U | P | F | FF | FFF | PDC | T | C | L | Total | |||
| 1879–1960 | 48 | 37 | 36 | 43 | 30 | 13 | 3 | 3 | 0 | 1 | 214 | |||
| 1961–1984 | 6 | 1 | 0 | 0 | 4 | 1 | 0 | 0 | 0 | 0 | 12 | |||
| 1985–2000 | 38 | 0 | 1 | 4 | 1 | 1 | 1 | 0 | 1 | 1 | 48 | |||
| 2001–2023 | 104 | 2 | 5 | 73 | 20 | 4 | 20 | 3 | 9 | 6 | 246 | |||
| 1879–2023 | 196 | 40 | 42 | 120 | 55 | 19 | 24 | 6 | 10 | 8 | 520 | |||
| Events/year 1879–2023 | 1.35 | 0.28 | 0.29 | 0.83 | 0.38 | 0.13 | 0.17 | 0.04 | 0.07 | 0.06 | 3.59 | |||
| (b) | ||||||||||||||
| Type of Event | First Record | Min (τ) | Max (τ) | Median (τ) | σ (τ) | |||||||||
| ME | 04-Feb-1879 | 0 | 4255 | 64 | 651 | |||||||||
| U | 18-Oct-1881 | 7 | 9995 | 386 | 1958 | |||||||||
| P | 05-Feb-1879 | 13 | 9645 | 326 | 2095 | |||||||||
| ME + U + P | 04-Feb-1879 | 0 | 4247 | 61 | 437 | |||||||||
| F | 30-Jun-1891 | 1 | 11,376 | 30 | 1301 | |||||||||
| FF | 17-Nov-1882 | 1 | 6403 | 311 | 1506 | |||||||||
| FFF | 24-Oct-1888 | 30 | 6956 | 1915 | 2409 | |||||||||
| F + FF + FFF | 17-Nov-1882 | 0 | 3683 | 26 | 603 | |||||||||
| PDC | 19-Oct-1900 | 1 | 15,083 | 162 | 4157 | |||||||||
| T | 22-May-1919 | 56 | 21,314 | 5092 | 8146 | |||||||||
| C | 22-Nov-1992 | 6 | 7356 | 70 | 2433 | |||||||||
| L | 13-Nov-1915 | 36 | 30,944 | 878 | 11,279 | |||||||||
Table 2.
(a) Model parameters for the inter–event time dataset for major explosions and paroxysms at Stromboli between 1879 and 2023 (see Table S1 for the entire dataset, and [95] for the mathematical expressions of these models). (b) Model parameters for the inter–event time dataset for effusive events at Stromboli between 1879 and 2023.
| (a) | |||
| Model | |||
| Log–normal | μ = 3.92 [3.69, 4.14] | σ = 1.83 [1.69, 2.00] | |
| Weibull | a = 122.63 [98.90, 151.92] | b = 0.60 [0.55, 0.65] | |
| Generalized Pareto | k = 0.94 [0.67, 1.22] | σ = 55.57 [42.21, 73.17] | θ = 0 |
| Log–logistic | μ = 3.98 [3.75, 4.20] | σ = 1.06 [0.96, 1.18] | |
| (b) | |||
| Model | |||
| Log–normal | μ = 3.43 [3.11, 3.76] | σ = 2.25 [2.04, 2.50] | |
| Weibull | a = 97.55 [68.84, 136.27] | b = 0.45 [0.41, 0.50] | |
| Generalized Pareto | k = 1.92 [1.49, 2.35] | σ = 15.92 [11.08, 22.88] | θ = 0 |
| Log–logistic | μ = 3.35 [3.01, 3.68] | σ = 1.34 [1.19, 1.50] | |
Table 3.
AIC indices of compared models for the inter–event time dataset of explosive and effusive events.
Table 3.
AIC indices of compared models for the inter–event time dataset of explosive and effusive events.
| Dataset | Log–Normal | Weibull | GPareto | Log–Logistic |
|---|---|---|---|---|
| Explosive | 3285 | 3304 | 3298 | 3298 |
| Effusive | 2195 | 2229 | 2205 | 2209 |
Table 4.
Parameters of the power law model for the inter–event time of explosive, effusive, F effusive and FF + FFF effusive events.
Table 4.
Parameters of the power law model for the inter–event time of explosive, effusive, F effusive and FF + FFF effusive events.
| Dataset | α | ||||
|---|---|---|---|---|---|
| Explosive | 2.14 | 147 | 0.22 | 74.28 | 0.20 |
| Effusive | 1.50 | 26 | 0.32 | 207.39 | 0.01 |
| F effusive | 1.53 | 41 | 0.20 | 217.72 | 0.14 |
| FF + FFF effusive | 1.85 | 261 | 0.52 | 474.08 | 0.13 |
Table 5.
AIC indices of compared models for the inter–event time dataset for explosive, F effusive and FF + FFF effusive.
Table 5.
AIC indices of compared models for the inter–event time dataset for explosive, F effusive and FF + FFF effusive.
| Dataset | PowerLaw | Log–Normal | Weibull | GenPareto | Log–Logistic |
|---|---|---|---|---|---|
| Explosive | 1193 | 1430 | 1403 | 1438 | 1436 |
| F effusive | 814 | 900 | 891 | 923 | 908 |
| FF + FFF effusive | 639 | 709 | 692 | 702 | 706 |
Table 6.
Parameters of the power law model for the inter–event time of explosive, F effusive and FF+ FFF events estimated for the reduced dataset.
Table 6.
Parameters of the power law model for the inter–event time of explosive, F effusive and FF+ FFF events estimated for the reduced dataset.
| Dataset | α | ||||
|---|---|---|---|---|---|
| Explosive | 3.31 | 233 | 0.47 | 56.91 | 0.94 |
| F effusive | 1.59 | 29 | 0.26 | 73.90 | 0.15 |
| FF + FFF effusive | 2.40 | 271 | 0.58 | 173.31 | 0.81 |
Table 7.
AIC indices of compared models for the 1985–2023 period. According to the column of Table 6, the indices were computed for , and for explosive, F and FF + FFF inter–event times, respectively.
Table 7.
AIC indices of compared models for the 1985–2023 period. According to the column of Table 6, the indices were computed for , and for explosive, F and FF + FFF inter–event times, respectively.
| Dataset | Power Law | Log–Normal | Weibull | GenPareto | Log–Logistic |
|---|---|---|---|---|---|
| Explosive | 1189 | 1425 | 1398 | 1434 | 1431 |
| F effusive | 440 | 499 | 490 | 513 | 516 |
| FF + FFF effusive | 17 | 219 | 213 | 223 | 219 |
Table 8.
(a) Complementary cumulative probability for inter–event times , estimated for explosive events by using the power law and the alternative model fitted by using the entire dataset. For the power law model is not applicable (N.A.) since for this model we have computed (see Table 4), which simply means that the model is not reliable for inter–event times lower than this value. (b) Complementary cumulative probability for inter–event times , estimated for F effusive events by using the power law and the alternative model fitted by using the entire dataset. For days, the power law model is not applicable (N.A.) since for this model we have computed (see Table 4), which simply means that the model is not reliable for inter–event times lower than this value. (c) Complementary cumulative probability for inter–event times , estimated for FF + FFF effusive events by using the power law and the alternative model fitted by using the entire dataset. For , the power law model is not applicable (N.A.) since for this model we have computed (see Table 4), which means that the model is not reliable for inter–event times lower than this value.
| (a) | ||||||
| Inter–Event Time | Power Law | Log–Normal | Weibull | GenPareto | Log–Logistic | Average Pr. |
| N.A. | 0.75 | 0.75 | 0.78 | 0.77 | 0.77 | |
| N.A. | 0.61 | 0.65 | 0.64 | 0.63 | 0.63 | |
| 0.25 | 0.23 | 0.27 | 0.22 | 0.23 | 0.24 | |
| τ | 0.11 | 0.13 | 0.14 | 0.12 | 0.13 | 0.13 |
| τ | 0.05 | 0.07 | 0.05 | 0.06 | 0.07 | 0.06 |
| τ | 0.02 | 0.04 | 0.02 | 0.04 | 0.05 | 0.03 |
| (b) | ||||||
| Inter–event time | Power Law | Log–Normal | Weibull | GenPareto | Log–Logistic | Average Pr. |
| N.A. | 0.62 | 0.65 | 0.58 | 0.61 | 0.60 | |
| N.A. | 0.50 | 0.55 | 0.45 | 0.49 | 0.50 | |
| 0.20 | 0.21 | 0.26 | 0.19 | 0.20 | 0.21 | |
| τ | 0.14 | 0.13 | 0.16 | 0.14 | 0.13 | 0.15 |
| τ | 0.10 | 0.08 | 0.08 | 0.10 | 0.08 | 0.10 |
| τ | 0.08 | 0.06 | 0.05 | 0.08 | 0.06 | 0.07 |
| (c) | ||||||
| Inter–event time | Power Law | Log–Normal | Weibull | GenPareto | Log–Logistic | Average Pr. |
| N.A. | 0.89 | 0.89 | 0.94 | 0.91 | 0.91 | |
| N.A. | 0.82 | 0.83 | 0.89 | 0.85 | 0.85 | |
| N.A. | 0.51 | 0.58 | 0.56 | 0.54 | 0.55 | |
| τ | 0.39 | 0.37 | 0.43 | 0.38 | 0.39 | 0.36 |
| τ | 0.22 | 0.25 | 0.28 | 0.23 | 0.26 | 0.23 |
| τ | 0.15 | 0.19 | 0.19 | 0.17 | 0.20 | 0.17 |
Table 9.
(a) Complementary cumulative probability for inter–event times , estimated for explosive events by using the power law and the alternative model fitted by using the shortened dataset. For , the power law model is not applicable (N.A.) since for this model we have computed (see Table 7), which means that the model is not reliable for inter–event times lower than this value. (b) Complementary cumulative probability for inter–event times , estimated for F effusive events by using the power law and the alternative model fitted by using the shortened dataset. For the power law model is not applicable (N.A.) since for this model we have computed (see Table 7), which means that the model is not reliable for inter–event times lower than this value. (c) Complementary cumulative probability for inter–event times , estimated for FF + FFF effusive events by using the power law and the alternative model fitted by using the shortened dataset. For , , the power law model is not applicable (N.A.) since for this model we have computed (see Table 7), which simply means that the model is not reliable for inter–event times lower than this value.
| (a) | ||||||
| Inter–Event Time | Power Law | Log–Normal | Weibull | GenPareto | Log–Logistic | Average Pr. |
| N.A. | 0.71 | 0.73 | 0.74 | 0.72 | 0.72 | |
| N.A. | 0.54 | 0.60 | 0.58 | 0.55 | 0.57 | |
| N.A. | 0.14 | 0.15 | 0.13 | 0.15 | 0.14 | |
| τ | 0.04 | 0.07 | 0.04 | 0.05 | 0.08 | 0.06 |
| τ | 0.01 | 0.03 | 0.01 | 0.02 | 0.04 | 0.02 |
| (b) | ||||||
| Inter–event time | Power Law | Log–Normal | Weibull | GenPareto | Log–Logistic | Average Pr. |
| N.A. | 0.53 | 0.57 | 0.46 | 0.50 | 0.52 | |
| 0.43 | 0.40 | 0.46 | 0.34 | 0.37 | 0.40 | |
| 0.14 | 0.14 | 0.17 | 0.14 | 0.12 | 0.14 | |
| τ | 0.09 | 0.08 | 0.09 | 0.10 | 0.08 | 0.09 |
| τ | 0.06 | 0.04 | 0.04 | 0.07 | 0.05 | 0.05 |
| τ | 0.05 | 0.03 | 0.02 | 0.06 | 0.03 | 0.04 |
| (c) | ||||||
| Inter–event time | Power Law | Log–Normal | Weibull | GenPareto | Log–Logistic | Average Pr. |
| N.A. | 0.77 | 0.80 | 0.83 | 0.81 | 0.80 | |
| N.A. | 0.68 | 0.73 | 0.72 | 0.72 | 0.71 | |
| N.A. | 0.39 | 0.46 | 0.36 | 0.41 | 0.40 | |
| τ | 0.31 | 0.29 | 0.33 | 0.26 | 0.30 | 0.30 |
| τ | 0.17 | 0.20 | 0.20 | 0.18 | 0.21 | 0.19 |
| τ | 0.09 | 0.16 | 0.14 | 0.14 | 0.16 | 0.14 |
Disclaimer/Publisher’s Note: The statements, opinions and data contained in all publications are solely those of the individual author(s) and contributor(s) and not of MDPI and/or the editor(s). MDPI and/or the editor(s) disclaim responsibility for any injury to people or property resulting from any ideas, methods, instructions or products referred to in the content. |
© 2023 by the authors. Licensee MDPI, Basel, Switzerland. This article is an open access article distributed under the terms and conditions of the Creative Commons Attribution (CC BY) license (https://creativecommons.org/licenses/by/4.0/).
Share and Cite
MDPI and ACS Style
Calvari, S.; Nunnari, G. Statistical Insights on the Eruptive Activity at Stromboli Volcano (Italy) Recorded from 1879 to 2023. Remote Sens. 2023, 15, 4822. https://doi.org/10.3390/rs15194822
AMA Style
Calvari S, Nunnari G. Statistical Insights on the Eruptive Activity at Stromboli Volcano (Italy) Recorded from 1879 to 2023. Remote Sensing. 2023; 15(19):4822. https://doi.org/10.3390/rs15194822
Chicago/Turabian StyleCalvari, Sonia, and Giuseppe Nunnari. 2023. "Statistical Insights on the Eruptive Activity at Stromboli Volcano (Italy) Recorded from 1879 to 2023" Remote Sensing 15, no. 19: 4822. https://doi.org/10.3390/rs15194822
Note that from the first issue of 2016, this journal uses article numbers instead of page numbers. See further details here.