
Application of Filtering Techniques to Smooth a Surface of Hybrid Digital Bathymetric Model


Navigational Department, Chair of Geoinformatics and Hydrography, Maritime University of Szczecin, Waly Chrobrego 1-2, 70-500 Szczecin, Poland
*
Author to whom correspondence should be addressed.
Remote Sens. 2023, 15(19), 4737; https://doi.org/10.3390/rs15194737
Submission received: 11 August 2023
/
Revised: 21 September 2023
/
Accepted: 22 September 2023
/
Published: 27 September 2023
(This article belongs to the Special Issue Advances in Remote Sensing of the Inland and Coastal Water Zones II)
Abstract
:The aim of the research is to identify the optimal method for smoothing the surface of a hybrid digital bathymetric model (HDBM). The initiation of this research is justified by the fact that a model created from diverse types of data may have different surface textures and outliers. This diversity may cause problems in subsequent data processing stages, such as generating depth contours. As part of the adopted research methodology, fifteen filters were analysed. Filtering techniques were examined for filter type, the number of iterations, weights, and window size. The result is the adopted research methodology, which enabled the selection of the optimal filtering method. The research undertaken in this work is an extension of the methodology for developing an HDBM. An important aspect of the research is the approach to elaborating on such kinds of models in shallow and ultra-shallow waters adjacent to the land, as well as the use of data obtained by modern measurement platforms, such as unmanned surface vehicles (USV) and unmanned aerial vehicles (UAV). The studies fit into the general context of works related to the development of this type of model and undoubtedly provide a solid reference for further development or improvement of similar methods.
1. Introduction
The digital terrain model (DTM) is the basic geographical framework, enabling the implementation of tasks in various fields such as surveying, cartography, spatial planning, geology, ecology, and many others. Current trends focus on creating high-resolution and precise models using technologies such as UAV [1] and LIDAR [2], which find wide applications. Examples include local monitoring of areas using precise DTMs, where significant morphological changes may occur [3], or flood risk mapping [4]. A similar situation applies to global models, where there is often a focus on increasing their accuracy [5], stemming from the need to obtain increasingly precise results from analyses conducted with their help. In publication [6], the need to develop a new generation of high-resolution and vertical precision global digital elevation models was indicated, to enable the creation of significantly improved global flood hazard models. An analogous situation occurs with digital bathymetric models (DBM). The S-44 standard [7] of the International Hydrographic Organization (IHO) defines the requirements concerning the accuracy and coverage of bathymetric measurements, depending on the class of water area. In the case of classes such as special order or exclusive order, 100% measurement coverage is required, which is usually achieved using a multibeam echosounder, enabling the creation of precise and high-resolution bathymetric models.
The acquisition of various terrain features often requires carrying out the entire process of processing measurement data, including the application of appropriate spatial interpolation techniques [8,9,10,11] and algorithms enabling the acquisition of various terrain elements. Such elements may include spot heights (significant height points) or contour lines [12,13,14]. Digital terrain models are invaluable in conducting various spatial analyses [15], such as visibility analysis [16,17], hydrology [18,19,20,21,22], road infrastructure design [23], natural resource management [24,25,26], or geology [27,28,29]. One of the fundamental applications of digital terrain models is the creation of topographic maps [30,31,32], on which various terrain features can be depicted, such as characteristic height points, skeleton lines, landforms, or contours. Digital bathymetric models play a similar role. In recent years, they have found applications in mapping the seabed [33,34,35], watercourses [36,37,38], water reservoirs [39,40,41,42], technical inspection of hydrotechnical structures [43,44,45,46], hydrological modelling [47,48], exploration for mineral deposits [49], and digital hydrographic elaborations [50,51].
Considering the cyclical development of data acquisition techniques, one can observe a tendency to gather increasingly accurate information, allowing for the creation of more detailed and comprehensive spatial models. One of the most important tools for obtaining such data is LIDAR, both in topographic and hydrographic versions [52,53]. In hydrographic applications, it has allowed for the collection of data in shorter periods, often in water bodies inaccessible to conventional hydrographic units. Other types of hydrographic sensors, where dynamic technological development can be observed along with new applications, include multibeam echosounders [54,55,56] and satellite remote sensing techniques [57,58,59,60]. In recent times, unmanned vehicles also play a significant role in remote sensing and hydrography, enabling remote data acquisition, whether mobile, airborne, or floating [61,62,63,64]. The diversity of platforms and data acquisition techniques often serves as a catalyst for research into the creation of digital elevation models, from both quantitative and qualitative perspectives. This often involves combining data from various sources to achieve cohesive DBMs [65,66,67,68,69,70,71,72,73,74].
Due to humans’ limited analytical capacity, topographic or bathymetric information is often generalised, facilitating a better understanding of the content presented. The same applies to numerical elevation models, often represented in a discrete, vector form—using points, lines, and areas. In the case of DBMs, these are correspondingly sounding points and depth contours. On standardised electronic navigation maps, there are also depth areas. It is worth noting that these lines are generated data and undergo specific processing operations, such as generalisation and smoothing. Generalisation is typically associated with the map’s scale, while smoothing enhances the readability of the information presented on the map, adding aesthetic values. One of the significant principles emphasised by Imhof [75] is that in the generalisation process, lines should remain as unchanged as possible from their original positions on a large scale, altered only as much as required for readability, clarity of the map, and compatibility of its elements. This is crucial for the subsequent use of contour lines, which are often used to develop numerical elevation models [76,77,78], using GIS methods and various geoprocessing tools.
A significant stage in the creation of DTMs is smoothing, particularly relevant in an era when high-density data acquisition is common. Such data are often characterised by a certain degree of noise and the occurrence of outliers. A model developed and filtered from such erroneous data might retain excessive detail, leading to difficulties in generating smooth contour lines or depth contours. Prime examples include data from LIDAR, photogrammetry, or multi-beam echosounders, which create large datasets that can reach hundreds of points per square meter. This leads to the registration of numerous terrain microforms, significantly impacting the appearance of the generated lines. Various smoothing methods are discussed in the literature. One of them is the adaptive surface smoothing method [79], a solution based on the comprehensive modification and blending of complete DEMs (digital elevation model). This method blends lightly and strongly smoothed DEMs according to the topographic position index (TPI), a measure that assesses local deviations from surrounding height changes. It accounts for different levels of smoothing in uniformly changing areas and those with local deviations. Another approach to adaptive smoothing was presented in [80], employing an adaptive linear prediction technique to extract a DTM of dense forestry areas, with the primary goal of minimising its errors. However, in certain situations, smoothing methods may prove too invasive, eliminating essential terrain details, such as drainage features [81]. This issue applies to standard low-pass filters, for example. In response, the authors propose the feature-preserving DEM smoothing (FPDEMS) method, modifying surface models to smooth the topographic surface similarly to approaches designed for de-noising 3D meshes. The FPDEMS method is specifically tailored for raster DEM data. Another smoothing technique relies on a penalised least squares method [82]. The resulting high-accuracy surface smoothing method (HASM-SM) efficiently filters noise in grid-based surfaces like DEMs. An interesting solution was presented in [83], utilising local linear smoothing methods to remove artefacts from lossy compression of a digital model of the sea floor. In work [84], an algorithm of the multiquadric method (MQ) based on an improved Huber loss function (MQ-IH) was developed. In this instance, smoothing is accomplished through a modified interpolation algorithm that primarily reduces the influence of outliers on terrain surface construction.
The next stage in developing depth contours is their generalisation. One of the critical rules associated with this process states that the indicated depth at any location on a map may never be deeper than the depth originally measured at that location [85]. This principle is related to navigation safety and is specifically aimed at preventing ships from running aground. Another rule presented in the above study maintains that a map should be as realistic and accurate as possible. The overall shape of the underwater surface morphology should be clearly noticeable, and defining features must be preserved. Hence, it is important to properly process depth contours in the form of vector data. This is also reflected in other works related to the generalisation or smoothing of depth contours [86,87,88], as well as in the production of electronic navigational maps [89,90,91].
The research conducted in this work continues the methodology for developing a hybrid digital bathymetric model from data obtained through hydroacoustic and photogrammetric methods. In the main phase of the study, conducted in [74], the focus was on integrating data from USV and UAV collected in shallow and ultra-shallow water areas to create a unified digital bathymetric model. The basis for initiating the study was the limitations of USVs in conducting measurements due to shallow water depths and obstacles such as partially submerged vegetation or other underwater obstructions. Data for areas inaccessible to USVs can be acquired using UAVs, though this data may be more heterogeneous and accurate only up to a certain depth due to the attenuation of electromagnetic waves in water. The developed method of integrating these two types of data relied on creating a bathymetric reference surface (BRS) from echosounder measurements, followed by selecting points from the UAV point cloud based on a set tolerance value. After combining UAV data with USV data, various interpolation methods were used to create surfaces, allowing for qualitative and quantitative evaluation of the formed bathymetric surfaces. The final quantitative and qualitative analysis led to a discussion that forms the basis for further research related to surface smoothing and the elimination of outlier data (depths with ordinates above chart datum). The need to standardise the surface texture was also dictated by the need to improve the generation of depth contours, which were irregularly shaped on the rough surface and created in very large quantities.
In this respect, the methodology was expanded to include a final stage focused on smoothing the bathymetric surface and eliminating outliers. To this end, linear convolutional filters were tested, and a quantitative and qualitative analysis of the smoothed surface was conducted. A novel contribution of this work is the development of a methodology for creating an HDBM that includes final data processing to smooth the surface. The study posits the thesis that it is possible to smooth the surface of an HDBM developed from data obtained through hydroacoustic and photogrammetric methods using filtering techniques. The main goal of the work was to identify an optimal filtering method that would meet the following conditions: properly smooth the surface, minimise deviations from the input model, eliminate outliers, and enable the correct generation of depth contours. In the case of filtering methods, the focus was on analysing various techniques, primarily based on filter type, filtration iterations, weights, and the size of convolutional windows.
Based on the comparative analyses conducted, including both quantitative and qualitative assessments, the suitability of filtering methods for smoothing this type of hybrid surface was confirmed. The research findings can be applied in engineering fields related to the planning and construction of hydrotechnical structures. They can certainly also be utilised in the planning of navigational missions for unmanned surface vehicles in shallow and ultra-shallow water bodies. Additionally, the model may find applications in works related to underwater archaeology and high-density electronic navigational chart (HD ENC) development.
2. Materials and Methods
2.1. Study Area
The studied water area, located in Czarna Łąka in West Pomeranian Voivodeship, Goleniów County (Figure 1), is part of Dąbie Lake. The area includes a specific landform—a small bay with a beach named Bystra. Coastal vegetation dominates along the northern and southern borders of the water area, forming the elongated shape of the bay. In contrast, to the east is a beach with a distinctive sandy bottom. The area of the study is 2.71 ha. The bottom of the lake is mainly characterised by a flat profile, except for a larger depression noticeable at the entrance to the bay. This specific bottom structure leads to the partial irregularity of the shape of the bathymetric surface. The average depth of the area oscillates around 1 m, while the maximum depth is 3.95 m. During the survey, weather conditions were variable—the sky was slightly overcast, but during the photogrammetric missions, there was sunny weather. The water surface was slightly wavy. The measurement campaign took place on 4 August 2021, between 7:30 a.m. and 1:00 p.m. UTC [74].
2.2. Input Data
A digital bathymetric model was used in the study. The survey data from which the model was developed were obtained by hydrographic and photogrammetric measurements. Hydrographic measurements were carried out using USV, while photogrammetric measurements were carried out using UAV and GNSS receivers. The basic parameters of these unmanned vehicles are shown in Table 1 and Table 2, and the photos are in Figure 2.
An important part of preparing the collections for the creation of digital bathymetric surfaces was the integration of data using the method developed and presented in [74]. This method involved the development of a geoprocessing process that made it possible to filter out survey points acquired by photogrammetric methods. The data combined from both UAV and USV and processed using this method are illustrated in Figure 3. In this case, the threshold value for the tolerance of the UAV data retained from the dataset was set at 0.25 m. The characteristics and statistics of the measurement data are as follows: number of points: 1,858,366; minimum value: −3.95 m; maximum value: 0.25 m; mean value: −0.60; standard deviation: 0.18 m.
These models were subjected to detailed qualitative and quantitative analyses, based on which the most effective numerical bathymetric model was selected and developed using the Kriging interpolation method (Figure 4). The Surfer software (version 20, 64 bit) was used to create the surface model. In modelling the surface, the following gridding rules of the Kriging method were set—Kriging type: point; polynomial drift order: 0; Kriging std. deviation grid: no; variogram model: linear; anisotropy angle: 0; anisotropy ratio: 1; variogram slope: 0.000259397; search parameters: 182 m; search ellipse: 0; number of search sectors: 4; maximum data per sector: 12.
Because both hydroacoustic and photogrammetric data were used to develop the model, the resulting model was hybrid in nature. Consequently, the dataset was not homogeneous, leading to variations in surface shape. Based on previous analyses, the model was found to have a smooth surface in the part where bathymetric data acquired with a single beam echosounder were located, and a rougher surface in the part corresponding to the photogrammetric data. This was because the hydrographic data had previously been cleaned of errors, while the photogrammetric data were filtered to a given tolerance threshold (0.25 cm) relative to the bathymetric reference surface. In the case of the latter, where densities reached 300 points per square meter, greater vertical variability could be observed, largely attributable to the mapping of smaller bottom structures.
The hypsometric and statistical characteristics of the surface are illustrated in Figure 5. As seen, the water area consists of both shallow and ultra-shallow waters, with prevailing depths ranging from −0.5 to −1 m. Depression depths in the western part of the area reach up to −3.95 m. A mere 0.07% of the area is occupied by outliers. Factors contributing to these errors could include erroneous data due to the presence of dead vegetation or errors stemming from the point cloud generation process itself. In the present study, one aspect examined was the possibility of eliminating these errors using filter methods. It is also worth noting that interpolation methods, despite having filtering properties, do not eliminate outliers. In the case of the survey dataset, the outlier values reached up to 0.25 m. After the digital bathymetric surface was developed using the Kriging method, this value admittedly decreased, but only to 0.18 m.
Analysis of the datasets recorded by the USV and UAV showed significant differences in their characteristics. The data obtained from the USV, after processing, exhibited stability, with no local extremes or significant deviations noted. They represent a consistent, uniform source of information that can be further used to create digital bathymetric models characterised by high accuracy. Meanwhile, UAS-derived data present different characteristics. They are characterised by a noticeable variation in height, which results, along with their high density per square meter (about 300 points), in the formation of a more complex structure in the form of a layer of points that represents the surface. This high roughness of the point cloud can result from various factors, such as the presence of underwater vegetation, micro-bottom denivelations, or imprecise matching of images during photogrammetric process. Figure 6 compares the visualisation of the surface in the standard form without the use of vertical exaggeration (Figure 6a) and with a vertical exaggeration factor of 30 (Figure 6b). In Figure 6b, the greater surface roughness developed from the UAV data can be seen. In addition, outlier observations in the boundary of the development become apparent.
2.3. Research Methodology
Spatial domain filters are used often for processing remote sensing images [92]. This study investigated 15 different linear convolution filters, each of which was further analysed in terms of the effect of filtering iteration on HDBM surface smoothing. Surfer software (version 20, 64-bit) was used to perform the tasks. The study of filters in smoothing a digital bathymetric surface involved analysing how these filters affect the detail and precision of the surface representation of a hybrid bathymetric model, the magnitude of errors, and the quality of depth contours generation. As previously mentioned, the model had a non-uniform surface structure, as revealed in its smoothness in the part developed from USV data and roughness, in the part developed from UAV data. In addition, there was a local occurrence of outliers. Therefore, the aim of the research is to correctly smooth the surface of the hybrid bathymetric model using filter methods. In this context, the surface after the smoothing process was subjected to appropriate qualitative and quantitative analysis. In terms of quantitative analysis, such values as maximum depth values, minimum depth values, minimum errors, maximum errors, mean errors, and RMS errors were considered. In terms of qualitative analysis, the effectiveness of smoothing on the entire surface was evaluated, with special attention to the elimination of roughness in the part of the model developed from UAV data. In the final stage, the correctness of depth contour generation was evaluated. In this regard, their shape and number were analysed. The study was carried out in three stages. In Stage 1, a general evaluation of the smoothing efficiency of various filters was made based on visual analysis, followed by the selection of filters for further, more detailed research in Stage 2. In this one, quantitative analysis was carried out, which was the basis for selecting the optimal filter method. To conduct the quantitative analysis, maximum and minimum depth values in the modelled surface domain were used, along with maximum, minimum, mean, and RMS errors. To calculate the error values, 56 survey checkpoints (soundings) were used [74], which are also presented in Figure 7. The determining factor was the correctness of minimising the deviation of the smoothed surface from the input model. In Stage 3, the possibility of generating depth contours was analysed on the DBM developed with the dedicated filter method. In this case, the effect of filter iteration on the correctness of depth contour generation was analysed. The research methodology is illustrated in Figure 7.
2.4. Convolution Filters
Convolution filters calculate new values based on values from neighbouring nodes of the input grid. In our case, the input grid is the GRID mesh of the modelled surface. The differences between them lie in the size of the window and the values of the weights. Filters can also have additional parameters, and each filter can iterate, meaning it can pass through the data multiple times, refining the result with each pass. In our study, each filter was tested in the following sequence of iterations: 1, 5, 10, 15, 20, 25, 30, 35, 40, 45, and 50. The sizes of the filters were fixed, using commonly accepted filter sizes of (3 × 3) and (5 × 5). The linear convolution filters are summarised in Table 3. The additional parameters used for the filters were: power = 1 (DIST), power = 1 and central weight = 2 (IDIST), alpha = 4 (GAULP). Most of the filters tested were low-pass filters, which are often referred to as smoothing or blurring filters. They work by allowing low frequencies to pass through while attenuating higher frequency components. In addition, second-order derivative filters, also known as Laplacians, were tested. These filters are used in image processing to detect edges and other image details.
All convolution filters work by calculating weighted averages of neighbouring points on an input grid. The differences between various linear convolution filters are determined by the size and shape of the neighbourhood area and the specific weights (W) that are applied. If the width of the filter window is denoted as T and the height as H, the process of calculating the values in the output grid for a row (denoted as r) and a column (denoted as c) can be described as follows:
3. Results
3.1. Stage 1: Pre-Testing of Smoothing Filters
The first phase of the research analysed several types of filters, specifically falling into two categories: low-pass filters and second-order derivative filters. Low-pass filters, also known as smoothing or blurring filters, remove high-frequency components from an image, leading to a reduction in noise and detail but also a loss of sharpness. Second-order derivative filters, or Laplacians, are used to enhance edges. They operate on a similar principle to first-order derivative filters but utilise the second derivative, allowing the detection of more subtle changes in the image.
The choice of low-pass filters was made based on their primary property, namely smoothing. Laplace smoothing is often employed in surface smoothing processes in mesh structures [93,94,95], but the filter itself can sometimes intensify certain types of noise present in the data. Regarding the commonly used Laplacian smoothing, the selection of this type of filter for smoothing the hybrid surface in the GRID structure was experimental.
Given the specific properties of the filters, the focus of the Stage 1 study was based on visual analysis. This emphasis arose from the fact that some filters even distorted the bathymetric surface, which was contrary to the intended effect. While this could have been due to specific aspects of the filter’s operation, such as those related to edge detection, it was difficult to predict, based solely on theoretical foundations, what their effect would be on a particular type of data like a hybrid digital bathymetric model.
Visual Analysis
Visual analysis was conducted for each type of filter at three different iterations: 1, 25, and 50. Increasing the number of iterations aimed to assess their impact on the surface smoothing effect. The surfaces for the low-pass filters are illustrated in Figure 8, Figure 9, Figure 10, Figure 11, Figure 12, Figure 13, Figure 14, Figure 15, Figure 16, Figure 17 and Figure 18. To improve visualisation, the Z scale factor was used. As the Z scale factor increases, the surface becomes more exaggerated vertically. Increasing this factor enhances the shading effect and can be useful for bringing out more detail, especially on relatively flat surfaces.
It can be noted that as the iteration increases, the degree of surface smoothing also increases. However, among the analysed filters, the degree of smoothing is seen to vary significantly with increasing iteration. Some filters, such as AVG, DIST, and IDIST, provide the most smoothing to the surface (Figure 8, Figure 9 and Figure 10). In contrast, filters like 5PXAVG and 9PAVG are less intrusive, bringing out more surface detail (Figure 13 and Figure 14), while filters such as GAULP, 5PAVG (Figure 11 and Figure 12), and GAUS, LP1, LP2, LP3 (Figure 15, Figure 16, Figure 17 and Figure 18) preserve even more detail. Of all the filters, the LP3 filter retained the most detail.
The situation was markedly different with the Laplace filters. These filters significantly enhanced the details of the bottom surface, which was especially noticeable in the part of the surface developed from UAV data (Figure 19a–c). When iterations were increased, these filters generated extremely large deviations, underscoring the ineffectiveness of their application in this context. This phenomenon occurred for all the analysed Laplace filters, LAP1, LAP2, LAP3, LAP4. For comparison, the LAP1-filtered surfaces were juxtaposed with the AVG-filtered surface, demonstrating the effectiveness of smoothing when appropriate filtering methods are selected.
3.2. Stage 2: Testing of Selected Smoothing Filters
In this phase, a quantitative analysis was carried out, which included the minimum (zmax) and maximum depth values (zmin), calculated according to Formulas (4) and (5)
where D is the set of pixels of the smoothed model in the raster surface domain, z(r)—depth value in each pixel, r—elementary pixel.
In addition, the maximum, minimum, average and RMS errors were calculated on the testing set S. This set consisted of 56 checkpoints (p) evenly distributed over the water area. In the following notation, Z(p) represents the depth value at the test point, while z(p) represents the corresponding depth value on the smoothed surface. The maximum and minimum errors were calculated according to formulas (6) and (7):
The statistics for the S set were as follows: maximum value of −0.47 m, minimum value of −3.92 m, mean value of −1.29 m, and a standard deviation of 0.87. Mean error (ME) was calculated according to Equation (8):
where Zi is the height measured at the pi point with coordinates (xi, yi), zi is the height of the modelled surface at the point with coordinates (xi, yi), and n is the number of p points. To assess the precision of the tests carried out, the RMS error was also calculated according to Equation (9):
Error Analysis
After analysing the maximum depth values for the processed surfaces, these values increase in all filtering methods, as illustrated in Figure 20. This trend is most noticeable for the AVG (up to −0.16 m), DIST (up to −0.14 m), and IDIST (up to −0.13 m) methods. Following these, the increase occurs for 5PXAVG (up to −0.09 m), 9PAVG (up to −0.09 m), LP1 (up to −0.08 m), GAUS (up to −0.07 m), GAULP (up to −0.07 m), LP2 (up to −0.07 m), and 5PAVG (up to −0.06 m). The LP3 filter shows slightly smaller values (up to −0.03 m).
An essential observation is that the filters can eliminate outliers. For the AVG, DIST, and IDIST filters, this effect can be achieved after the first iteration, while for others, it requires five iterations. Considering this criterion, the LP3 filter is the least invasive, as its values range between 0 and −0.03 m from 5 to 50 passes of the filter.
A similar trend can be observed for the minimum depth values, as shown in Figure 21. A significant decrease in these values occurs for AVG (to −3.65 m), DIST (to −3.7 m), IDIST (to −3.72 m), and is followed by 5PXAVG (to −3.8 m), 9PAVG (to −3.82 m), LP1 (to −3.83 m), GAUS (to −3.84 m), GAULP (to −3.84 m), LP2 (to −3.84 m), and 5PAVG (to −3.86 m). The smallest values are recorded for the LP3 filter (to −3.87 m), indicating a tendency to artificially shallow the modelled water area.
The next comparative measures analysed include maximum (MaxE), minimum (MinE), mean (ME), and RMS errors (Figure 22). In the case of MinE, an increase can be observed with increasing iterations, with the exceptions being the 5PXAVG and LP3 filters, where a slight decrease occurs in value at iteration number 2. The largest values of MinE are reached by the AVG (−0.40 m), DIST (−0.35 m), and IDIST (−0.33 m) filters. Subsequent filters achieved smaller values: −0.21 m (5PXAVG), −0.18 m (9PAVG), −0.17 m (LP1), −0.15 m (GAUS, LP2, GAULP), −0.12 m (5PAVG), −0.10 m (LP3).
MaxE follows a distinct pattern, initially decreasing with increasing iterations and then rising. The LP3 filter is an exception, with errors steadily decreasing. The maximum values for the tested filters are as follows: 0.19 m (AVG), 0.17 m (DIST, IDIST), 0.12 m (5PXAVG), 0.11 m (9PAVG, LP1), 0.10 m (LP3, GAULP, GAUS, LP2), 0.09 m (5PAVG).
ME remain stable, ranging from 0 to 0.01 m for all filters, indicating that filtration does not significantly affect the overall over- or underestimation of processed bathymetric data.
The final error analysed is the RMS. The values of this error measure the fit of the modelled surface to the measured data. Larger values indicate a weaker fit to the true values. This error’s values in descending order are: 0.09 m (AVG), 0.08 m (DIST, IDIST), 0.06 m (5PXAVG), 0.05 m (9PAVG, LP1), 0.04 m (GAULP, GAUS, LP2, 5PAVG, LP3). Based on these error values, the best results appear achievable with the last six filter methods (RMS = 0.04 m).
From the quantitative analysis, it can be concluded that the LP3 filter is the optimal surface smoothing method. Except for the MaxE, it achieved the best values, translating to the smallest deviations from the test set’s measurement points. A significant observation is that in the case of MaxE, they decreased in value with increasing iterations, contrasting with other methods. Considering all error values for the LP3 filter, it appears to be the most resistant to artificial shallowing of the water area. This made data processing with this method the least invasive and best preserved the bathymetric surface shape, allowing for a good representation of terrain microforms.
3.3. Stage 3: Research on the Optimal Filter Method
As the purpose of this study is to analyse the effectiveness of filters in smoothing the hybrid bathymetric model, the subsequent study will examine the effect of the level of surface smoothing on the number and shape of depth contours. This examination will be conducted on the optimal model, smoothed with the LP3 filter, as depicted in Figure 23. A small number of iterations does not sufficiently smooth the surface, leading to a large number of depth contours with irregular shapes. However, increasing the number of iterations results in greater surface smoothing and fewer depth contours with more regular shapes. Notably, on the part of the DBM developed from the USV data, the depth contours practically do not change their shape. This stability is attributed to the filter’s effective operation on the surface areas with high roughness, where the coverage was provided by the UAV data. This observation confirms the suitability of this type of filter for smoothing the HDBM.
The study also investigated how the level of surface smoothing affects the number of generated depth contours. As illustrated in Figure 24, the number of generated depth contours decreases exponentially with an increasing number of iterations. Just one pass of the filter results in an almost 50% decrease in the number of depth contours. Subsequently, the decrease occurs less dynamically, but a stabilisation in their number can be observed for iterations 40, 45, and 50. In this range of iterations, the differences only reach 2–3 depth contours. This pattern indicates that the surface is sufficiently smoothed, and further smoothing does not significantly affect the number of depth contours generated.
Therefore, a surface smoothed after 45 iterations of the LP3 filter was ultimately selected. The DBM and depth contours are illustrated in Figure 25. The depth contours generated in this manner can be further processed using line smoothing methods, depending on the specific application.
3.4. Exemplary Implementation of the Developed Model
One of the most widely used software applications for producing electronic navigational charts is from Caris. This software provides the entire process chain of data processing, from the generation of the bathymetric surface model to the final vector product.
The illustration below (Figure 26) shows the implementation of the developed depth contours in the form of an HD ENC map, using Caris BathyData Base software (version 3.2.2). For this purpose, data from the smoothed HDBM with the LP3 filter (45 iterations) were used to build the bathymetric surface. XYZ data with a resolution of 0.5 m were imported in UTM-33N (WGS84) projection, using the shoalest depth gridding method, which employs the shoalest soundings within a node. In the next step, the contour interval was defined as 0.1 m. In the process of generating vector data, a linear layer of DEPCNT contours (depth contours) and a polygon layer of the depth area (DEPARE) were created. The presentation of the following data was determined with these parameters: safety contour 0.5 m, shallow water 1 m, and deep water 3 m.
In summary, the research demonstrates that it is possible to uniformly smooth the surface of a hybrid bathymetric model while removing outliers using filtering methods. Such models can be developed for generating depth contours in precise, high-resolution map products.
4. Discussion
The conducted study aimed to identify the optimal filtration method for a hybrid bathymetric model, created based on data from a single beam echosounder and UAV in shallow and ultra-shallow areas. The working thesis, which assumed that a filtering technique would effectively smooth the hybrid surface, eliminating specific differences in its structure, was confirmed. Choosing the right filter from among 15 examined required a series of tests, and ultimately, the LP3 low-pass filter was chosen, meeting the work’s assumptions. This filter adequately smoothed the surface, minimised deviations from the input model, eliminated outlier values, and enabled the correct generation of depth contours. The results of the work continue earlier research on creating a hybrid digital bathymetric model and extend the proposed methodology with a smoothing stage. They also confirm the possibility of using low-pass filters in surface smoothing processes. However, the key is selecting the right type of filter and the number of its iterations. Filters with a larger window showed greater smoothing abilities, but unfortunately, they increased the analysed errors. Studies have shown that the key aspect of the accuracy of depth contour generation is the number of iterations. Incorrect selection of the filtration method can overly smooth the surface, which in turn increases errors. In work [81], it was noted that the low-pass filter might eliminate essential terrain details, so its use may not always bring the desired effect. In this context, the development of new methods using low-pass filters in the processes of smoothing geographical surfaces [79] can be justified. In this case, it has been confirmed that the filter could be used in its basic form, but it is essential to properly select its type, weights, window size, and the number of iterations (passes). An example of improper filter selection is the Laplace filter, which did not bring the expected results, especially in areas interpolated from UAV data, where significant deviations were observed. On the other hand, smoothing using the Laplace operator is used in generating depth contours, but this process often involves complex data processing techniques [89].
While the focus of the study was indeed on filtration research, the results should be viewed in a broader context. This undoubtedly justifies the continuation of research on the development of HDBM from data on different configurations or structures in shallow water areas. This also applies to a specific case related to the development of a digital model adjacent to the coastline. The first issue is associated with obtaining a heterogeneous texture of the modelled surface, resulting in a varied structure of the input data for the DBM development acquired by different sensors. This should include considerations such as varying density, spatial distribution, and noise in survey data. Even when using interpolation methods with filtering properties, like Kriging, it is not always possible to adequately reduce surface roughness. Moreover, these methods have weak properties for eliminating outliers, which may result in smaller or larger errors in surface development. The sensitivity problem of methods like MQ or Kriging was highlighted in work [84]. In the case of HDBM smoothing with the proposed filter, this task was accomplished. Identified outliers were mainly concentrated in the nearshore area. It seems that this is also an element in bathymetric studies to pay attention to, especially concerning the mapping possibilities of ultra-shallow depths. A limitation of the research is its confinement to a previously developed method for DBM processing [74]. In this case, the surface texture is the result of assumed geodata processing techniques, particularly related to UAV data selection and the final choice of interpolation method, such as Kriging. However, considering the indication of various problems with processing integrated data with different geospatial characteristics for HDBM development, the study points to key aspects of this process that must be considered. This also includes surface smoothing, which enables the generation of other data, such as depth contours. The study also did not exhaust the possibilities for the configuration and operation of filters (e.g., adaptive filtering), hence further research can be conducted in this direction. A known limitation of convolutional filters is the boundary conditions, where the filter window partially extends beyond the data boundary. In this case, the pixel value is determined based on a smaller number of pixels, which may result in a different outcome. Considering the range of developed surfaces, in many cases, this will be a negligible aspect, although it must be considered. In the case of standardising filtration operation, edge pixels can ultimately be removed, which should not affect the result of the development, especially for high-resolution products with small ground pixel dimensions.
It should also be noted that in terms of the applicability of the model for navigational purposes, its use is limited to tasks involving small, unmanned vessels. On the other hand, the adopted strategy for modelling bathymetric data enables the creation of data processing using, among other things, basic filtering methods, which is undoubtedly a significant advantage of the proposed approach.
The research has shown that by using the LP3 filter, very good results can be achieved, although as in any data processing process, the uncertainty of the data increases with the number of data processing stages. This leads to changes in the accuracy of the developed model. In the context of the analysed maximum values, the final model had a maximum and minimum value at the levels of −3.87 m and −0.03 m, respectively. The difference in this case from the input model was 0.08 cm in the range of the greatest depth, and 0.21 m at the highest elevation. Based on these results, it can be concluded that the smoothing filter artificially shallowed the water body and eliminated outlier data, but it did not achieve a maximum value equal to 0.00, i.e., the correct ordinate value that the shoreline should have. Such a condition can result from the pixelation of the model, as well as from the way the filter works. Meanwhile, the MaxE and MinE errors were 0.07 m and −0.09 m, respectively, ME had a value of 0.01 m, and the RMS error was 0.03 m. Considering the adopted tolerance of the development at the level of 0.25 m [74], it can be concluded that the obtained results fall within this range. As can be observed in the charts set out in Figure 20, Figure 21 and Figure 22, each type of filter, as well as the number of iterations, had a significant impact on the error values.
Considering the research results, future work should focus on further optimisation of the process of smoothing the surfaces of hybrid bathymetric models. It is essential to conduct research on choosing the most effective filtering method. An attempt to use the Laplace filter showed that the choice of filtration method is key to achieving optimal results. Additionally, the impact of HDBM resolution and data reduction [96] on the quality of the obtained data can be considered, e.g., developed using other source data or sensors.
5. Conclusions
This study focused on optimising the filtration process of a hybrid bathymetric model, created from data derived from a single beam echosounder and UAV, in shallow and very shallow water areas. In an analysis of 11 low-pass filters, the most effective filter, LP3, was identified, confirming its effectiveness in eliminating specific differences in surface texture, minimising deviations from the initial model, removing outlier data, and correctly generating depth contours. A comprehensive analysis of various filtration methods showed that the proper selection of filter type, weights, and the number of iterations is crucial. These results confirm the usability and efficiency of the developed method for creating a bathymetric model in shallow water areas, including those that are difficult to analyse along the shoreline. However, it should be emphasised that an improper choice of filter type and filtration parameters can lead to over-smoothing of the surface, thereby increasing errors and eliminating significant topographical details. Considering uncertainties and errors resulting from data processing, it is essential to consider these factors in the process of analysis and interpretation of results. The research suggests the possibility of continuing further work on hybrid bathymetric models in shallow water areas adjacent to the shoreline. Additionally, future work should focus on optimising the surface smoothing process and selecting the most effective filtration method. These efforts represent a significant contribution to developing the methodology of creating hybrid bathymetric models. The overall research may also inspire the development of other HDBM methods from data obtained with various sensors, particularly in the field of modern measurement techniques based on unmanned platforms.
Author Contributions
Conceptualisation, J.L.; methodology, J.L.; software, J.L. and G.Z.; validation, J.L.; formal analysis, J.L and G.Z.; investigation, J.L.; resources, J.L. and G.Z.; data curation, J.L. and G.Z.; writing—original draft preparation, J.L. and G.Z; writing—review and editing, J.L. and G.Z.; visualisation, J.L. and G.Z.; supervision, J.L.; project administration, J.L.; funding acquisition, J.L. All authors have read and agreed to the published version of the manuscript.
Funding
This research outcome was financed by a subsidy from the Polish Ministry of Education and Science for statutory activities at the Maritime University of Szczecin.
Data Availability Statement
Not applicable.
Conflicts of Interest
The authors declare no conflict of interest. The funders had no role in the design of the study; in the collection, analyses, or interpretation of data; in the writing of the manuscript; or in the decision to publish the results.
References
- Jiménez-Jiménez, S.I.; Ojeda-Bustamante, W.; Marcial-Pablo, M.D.J.; Enciso, J. Digital Terrain Models Generated with Low-Cost UAV Photogrammetry: Methodology and Accuracy. ISPRS Int. J. Geo-Inf. 2021, 10, 285. [Google Scholar] [CrossRef]
- Chen, Z.; Gao, B.; Devereux, B. State-of-the-Art: DTM Generation Using Airborne LIDAR Data. Sensors 2017, 17, 150. [Google Scholar] [CrossRef] [PubMed]
- Brzank, A.; Heipke, C.; Goepfert, J.; Soergel, U. Aspects of Generating Precise Digital Terrain Models in the Wadden Sea from Lidar-Water Classification and Structure Line Extraction. ISPRS J. Photogramm. Remote Sens. 2008, 63, 510–528. [Google Scholar] [CrossRef]
- Alho, P.; Hyyppä, H.; Hyyppä, J. Consequence of DTM Precision for Flood Hazard Mapping: A Case Study in SW Finland. Nord. J. Surv. Real Estate Res. 2009, 6, 21–39. [Google Scholar]
- Yamazaki, D.; Ikeshima, D.; Tawatari, R.; Yamaguchi, T.; O’Loughlin, F.; Neal, J.C.; Sampson, C.C.; Kanae, S.; Bates, P.D. A High-Accuracy Map of Global Terrain Elevations. Geophys. Res. Lett. 2017, 44, 5844–5853. [Google Scholar] [CrossRef]
- Sampson, C.C.; Smith, A.M.; Bates, P.D.; Neal, J.C.; Trigg, M.A. Perspectives on Open Access High Resolution Digital Elevation Models to Produce Global Flood Hazard Layers. Front. Earth Sci. 2016, 3, 85. [Google Scholar] [CrossRef]
- International Hydrographic Organization (IHO). IHO Standards For Hydrographic Surveys, 6th ed.; International Hydrographic Bureau: Monaco, 2020. [Google Scholar]
- Lubczonek, J.; Wlodarczyk-Sielicka, M.; Lacka, M.; Zaniewicz, G. Methodology for Developing a Combined Bathymetric and Topographic Surface Model Using Interpolation and Geodata Reduction Techniques. Remote Sens. 2021, 13, 4427. [Google Scholar] [CrossRef]
- Stereńczak, K.; Ciesielski, M.; Bałazy, R.; Zawiła-Niedźwiecki, T. Comparison of Various Algorithms for DTM Interpolation from LIDAR Data in Dense Mountain Forests. Eur. J. Remote Sens. 2016, 49, 599–621. [Google Scholar] [CrossRef]
- Garnero, G.; Godone, D. Comparisons between Different Interpolation Techniques. Int. Arch. Photogramm. Remote Sens. Spat. Inf. Sci.-ISPRS Arch. 2013, 40, 139–144. [Google Scholar] [CrossRef]
- Arun, P.V. A Comparative Analysis of Different DEM Interpolation Methods. Egypt. J. Remote Sens. Sp. Sci. 2013, 16, 133–139. [Google Scholar] [CrossRef]
- Xie, J. Implementation and Performance Optimization of a Parallel Contour Line Generation Algorithm. Comput. Geosci. 2012, 49, 21–28. [Google Scholar] [CrossRef]
- Tan, L.; Wan, G.; Li, F.; Chen, X.; Du, W. GPU Based Contouring Method on Grid DEM Data. Comput. Geosci. 2017, 105, 129–138. [Google Scholar] [CrossRef]
- Ruiz, A.; Castillo, M.; Arbiol, R.; Colomer, J.L. ISAR DEM Data Processing for Contours Generation. In Proceedings of the OEEPE Workshop on Airborne Laserscanning and Interferometric SAR for Detailed Digital Elevation Models, Stockholm, Sweden, 1–3 March 2001. [Google Scholar]
- Sofia, G.; Eltner, A.; Nikolopoulos; Crosby, C. Leading Progress in Digital Terrain Analysis and Modeling. ISPRS Int. J. Geo-Inf. 2019, 8, 372. [Google Scholar] [CrossRef]
- Ruzickova, K.; Ruzicka, J.; Bitta, J. A New GIS-Compatible Methodology for Visibility Analysis in Digital Surface Models of Earth Sites. Geosci. Front. 2021, 12, 101109. [Google Scholar] [CrossRef]
- Achilleos, G.; Tsouchlaraki, A. Visibility and Viewshed Algorithms in an Information System for Environmental Management. In Management Information Systems 2004: Incorporating GIS and Remote Sensing; WIT Press: Southampton, UK, 2004; Volume 32, pp. 109–121. [Google Scholar]
- Wechsler, S.P. Uncertainties Associated with Digital Elevation Models for Hydrologic Applications: A Review. Hydrol. Earth Syst. Sci. 2007, 11, 1481–1500. [Google Scholar] [CrossRef]
- Chymyrov, A. Comparison of Different DEMs for Hydrological Studies in the Mountainous Areas. Egypt. J. Remote Sens. Sp. Sci. 2021, 24, 587–594. [Google Scholar] [CrossRef]
- Mandlburger, G.; Hauer, C.; Höfle, B.; Habersack, H.; Pfeifer, N. Optimisation of LiDAR Derived Terrain Models for River Flow Modelling. Hydrol. Earth Syst. Sci. 2009, 13, 1453–1466. [Google Scholar] [CrossRef]
- Lacroix, M.P.; Martz, L.W.; Kite, G.W.; Garbrecht, J. Using Digital Terrain Analysis Modeling Techniques for the Parameterization of a Hydrologic Model. Environ. Model. Softw. 2002, 17, 125–134. [Google Scholar] [CrossRef]
- Degetto, M.; Gregoretti, C.; Bernard, M. Comparative Analysis of the Differences between Using LiDAR and Contour-Based DEMs for Hydrological Modeling of Runoff Generating Debris Flows in the Dolomites. Front. Earth Sci. 2015, 3, 21. [Google Scholar] [CrossRef]
- Hatta Antah, F.; Khoiry, M.A.; Abdul Maulud, K.N.; Abdullah, A. Perceived Usefulness of Airborne Lidar Technology in Road Design and Management: A Review. Sustainability 2021, 13, 1773. [Google Scholar] [CrossRef]
- Bhakar, P.; Singh, A.P.; Mittal, R.K. Assessment of Groundwater Suitability Using Remote Sensing and GIS: A Case Study of Western Rajasthan, India. Arab. J. Geosci. 2022, 15, 41. [Google Scholar] [CrossRef]
- He, Q.; Chen, E.; An, R.; Li, Y. Above-Ground Biomass and Biomass Components Estimation Using LiDAR Data in a Coniferous Forest. Forests 2013, 4, 984–1002. [Google Scholar] [CrossRef]
- Romshoo, S.A.; Yousuf, A.; Altaf, S.; Amin, M. Evaluation of Various DEMs for Quantifying Soil Erosion Under Changing Land Use and Land Cover in the Himalaya. Front. Earth Sci. 2021, 9, 782128. [Google Scholar] [CrossRef]
- Badura, J.; Przybylski, B. Application of Digital Elevation Models to Geological and Geomorphological Studies-Some Examples. Prz. Geol. 2005, 53, 977–983. [Google Scholar]
- Grohmann, C.; Miliaresis, G. Geological Applications of Digital Terrain Analysis. Int. J. Geogr. Inf. Sci. 2013, 27, 1403–1404. [Google Scholar] [CrossRef]
- Xiong, L.; Li, S.; Tang, G.; Strobl, J. Geomorphometry and Terrain Analysis: Data, Methods, Platforms and Applications. Earth-Sci. Rev. 2022, 233, 104191. [Google Scholar] [CrossRef]
- Ahmad, M.J.; Ahmad, A.; Kanniah, K.D. Large Scale Topographic Mapping Based on Unmanned Aerial Vehicle and Aerial Photogrammetric Technique. IOP Conf. Ser. Earth Environ. Sci. 2018, 169, 2–9. [Google Scholar] [CrossRef]
- Mendes Junior, C.W.; Dani, N.; Arigony-Neto, J.; Simões, J.C.; Velho, L.F.; Ribeiro, R.R.; Parnow, I.; Bremer, U.F.; Fonseca Júnior, E.S.; Erwes, H.J.B. A New Topographic Map for Keller Peninsula, King George Island, Antarctica. Braz. Antarct. Res. 2012, 5, 105–113. [Google Scholar]
- Rizaldy, A.; Mayasari, R. Acceleration of Topographic Map Production Using Semi-Automatic DTM from DSM Radar Data. Int. Arch. Photogramm. Remote Sens. Spat. Inf. Sci.-ISPRS Arch. 2016, 41, 47–54. [Google Scholar] [CrossRef]
- Li, Z.; Peng, Z.; Zhang, Z.; Chu, Y.; Xu, C.; Yao, S.; García-Fernández, Á.F.; Zhu, X.; Yue, Y.; Levers, A.; et al. Exploring Modern Bathymetry: A Comprehensive Review of Data Acquisition Devices, Model Accuracy, and Interpolation Techniques for Enhanced Underwater Mapping. Front. Mar. Sci. 2023, 10, 1178845. [Google Scholar] [CrossRef]
- Ryu, P.; Brown, D.; Arsenault, K.; Cho, B.; March, A.; Ali, W.H.; Charous, A.; Lermusiaux, P.F.J. A Wide-Area Deep Ocean Floor Mapping System: Design and Sea Tests. Geomatics 2023, 3, 290–311. [Google Scholar] [CrossRef]
- Mayer, L.; Jakobsson, M.; Allen, G.; Dorschel, B.; Falconer, R.; Ferrini, V.; Lamarche, G.; Snaith, H.; Weatherall, P. The Nippon Foundation-GEBCO Seabed 2030 Project: The Quest to See the World’s Oceans Completely Mapped by 2030. Geosciences 2018, 8, 63. [Google Scholar] [CrossRef]
- Shintani, C.; Fonstad, M.A. Comparing Remote-Sensing Techniques Collecting Bathymetric Data from a Gravel-Bed River. Int. J. Remote Sens. 2017, 38, 2883–2902. [Google Scholar] [CrossRef]
- Legleiter, C.J.; Harrison, L.R. Remote Sensing of River Bathymetry: Evaluating a Range of Sensors, Platforms, and Algorithms on the Upper Sacramento River, California, USA. Water Resour. Res. 2019, 55, 2142–2169. [Google Scholar] [CrossRef]
- Salavitabar, S.; Li, S.S.; Lak, B. Mapping Underwater Bathymetry of a Shallow River from Satellite Multispectral Imagery. Geosciences 2022, 12, 142. [Google Scholar] [CrossRef]
- Yang, H.; Guo, H.; Dai, W.; Nie, B.; Qiao, B.; Zhu, L. Bathymetric Mapping and Estimation of Water Storage in a Shallow Lake Using a Remote Sensing Inversion Method Based on Machine Learning. Int. J. Digit. Earth 2022, 15, 789–812. [Google Scholar] [CrossRef]
- Dost, R.J.J.; Mannaerts, C.M.M. Generation of Lake Bathymetry Using Sonar, Satellite Imagery and Gis. In Proceedings of the 28th Annual Esri International User Conference, San Diego, CA, USA, 4–8 August 2008. [Google Scholar]
- Elshazly, R.E.; Armanuos, A.M.; Zeidan, B.A.; Elshemy, M. Evaluating Remote Sensing Approaches for Mapping the Bathymetry of Lake Manzala, Egypt. Euro-Mediterr. J. Environ. Integr. 2021, 6, 77. [Google Scholar] [CrossRef]
- Yunus, A.P.; Dou, J.; Song, X.; Avtar, R. Improved Bathymetric Mapping of Coastal and Lake Environments Using Sentinel-2 and Landsat-8 Images. Sensors 2019, 19, 2788. [Google Scholar] [CrossRef]
- Ho, M.; El-Borgi, S.; Patil, D.; Song, G. Inspection and Monitoring Systems Subsea Pipelines: A Review Paper. Struct. Health Monit. 2020, 19, 606–645. [Google Scholar] [CrossRef]
- Clubley, S.; Manes, C.; Richards, D. 1400033: High-Resolution Sonars Set to Revolutionise Bridge Scour Inspections. Proc. Inst. Civ. Eng. Civ. Eng. 2015, 168, 58. [Google Scholar]
- Bouziani, M.; Boucht, F.; Nouri, F. Contribution of Bathymetric Multi-beam Sonar and Laser Scanners in 3D Modeling and Estimation of Siltation of Dam Basin in Morocco. Remote Sens. Spat. Inf. Sci.-ISPRS Arch. 2021, 46, 5–9. [Google Scholar] [CrossRef]
- Zhang, W.; Zhou, T.; Li, J.; Xu, C. An Efficient Method for Detection and Quantitation of Underwater Gas Leakage Based on a 300-KHz Multibeam Sonar. Remote Sens. 2022, 14, 4301. [Google Scholar] [CrossRef]
- Adnan, N.A.; Atkinson, P.M. Remote Sensing of River Bathymetry for Use in Hydraulic Model Prediction of Flood Inundation. In Proceedings of the 2012 IEEE 8th International Colloquium on Signal Processing and its Applications, Malacca, Malaysia, 23–25 March 2012; pp. 159–163. [Google Scholar] [CrossRef]
- Dey, S.; Saksena, S.; Winter, D.; Merwade, V.; McMillan, S. Incorporating Network Scale River Bathymetry to Improve Characterization of Fluvial Processes in Flood Modeling. Water Resour. Res. 2022, 58, e2020WR029521. [Google Scholar] [CrossRef]
- Joo, J.; Kim, S.S.; Choi, J.W.; Pak, S.J.; Ko, Y.; Son, S.K.; Moon, J.W.; Kim, J. Seabed Mapping Using Shipboard Multibeam Acoustic Data for Assessing the Spatial Distribution of Ferromanganese Crusts on Seamounts in the Western Pacific. Minerals 2020, 10, 155. [Google Scholar] [CrossRef]
- International Hydrographic Organization (IHO). High Density (HD) ENC Production and Maintenance Guidance, 1st ed.; International Hydrographic Organization: Monaco, 2020. [Google Scholar]
- International Hydrographic Organization (IHO). Electronic Navigational Charts (ENCs) Production, Maintenance And Distribution Guidance, 2.1.0 ed.; International Hydrographic Organization: Monaco, 2017. [Google Scholar]
- Soeksmantono, B.; Utama, Y.P.; Syaifudin, F. Utilization of Airborne Topo-Bathymetric LiDAR Technology for Coastline Determination in Western Part of Java Island. IOP Conf. Ser. Earth Environ. Sci. 2021, 925, 012065. [Google Scholar] [CrossRef]
- Mandlburger, G.; Hauer, C.; Wieser, M.; Pfeifer, N. Topo-Bathymetric LiDAR for Monitoring River Morphodynamics and Instream Habitats-A Case Study at the Pielach River. Remote Sens. 2015, 7, 6160–6195. [Google Scholar] [CrossRef]
- Janowski, A.; Tȩgowski, J.; Nowak, J. Seafloor Mapping Based on Multibeam Echosounder Bathymetry and Backscatter Data Using Object-Based Image Analysis: A Case Study from the Rewal Site, the Southern Baltic. Oceanol. Hydrobiol. Stud. 2018, 47, 248–259. [Google Scholar] [CrossRef]
- Janowski, L.; Trzcinska, K.; Tegowski, J.; Kruss, A.; Rucinska-Zjadacz, M.; Pocwiardowski, P. Nearshore Benthic Habitat Mapping Based on Multi-Frequency, Multibeam Echosounder Data Using a Combined Object-Based Approach: A Case Study from the Rowy Site in the Southern Baltic Sea. Remote Sens. 2018, 10, 1983. [Google Scholar] [CrossRef]
- Lekkerkerk, H.-J. The Evolution Of a Bathymetric, State of the Art in Multibeam Echosounders. Hydro International, 30 October 2020. [Google Scholar]
- Al Najar, M.; Thoumyre, G.; Bergsma, E.W.J.; Almar, R.; Benshila, R.; Wilson, D.G. Satellite Derived Bathymetry Using Deep Learning. Mach. Learn. 2023, 112, 1107–1130. [Google Scholar] [CrossRef]
- Cesbron, G.; Melet, A.; Almar, R.; Lifermann, A.; Tullot, D.; Crosnier, L. Pan-European Satellite-Derived Coastal Bathymetry—Review, User Needs and Future Services. Front. Mar. Sci. 2021, 8, 740830. [Google Scholar] [CrossRef]
- Duplančić Leder, T.; Baučić, M.; Leder, N.; Gilić, F. Optical Satellite-Derived Bathymetry: An Overview and WoS and Scopus Bibliometric Analysis. Remote Sens. 2023, 15, 1294. [Google Scholar] [CrossRef]
- Jagalingam, P.; Akshaya, B.J.; Hegde, A.V. Bathymetry Mapping Using Landsat 8 Satellite Imagery. Procedia Eng. 2015, 116, 560–566. [Google Scholar] [CrossRef]
- Makar, A. Coastal Bathymetric Sounding in Very Shallow Water Using USV: Study of Public Beach in Gdynia, Poland. Sensors 2023, 23, 4215. [Google Scholar] [CrossRef] [PubMed]
- Specht, M.; Specht, C.; Szafran, M.; Makar, A.; Dabrowski, P.; Lasota, H.; Cywiński, P. The Use of USV to Develop Navigational and Bathymetric Charts of Yacht Ports on the Example of National Sailing Centre in Gdańsk. Remote Sens. 2020, 12, 2585. [Google Scholar] [CrossRef]
- Wang, D.; Xing, S.; He, Y.; Yu, J.; Xu, Q.; Li, P. Evaluation of a New Lightweight UAV-Borne Topo-Bathymetric LiDAR for Shallow Water Bathymetry and Object Detection. Sensors 2022, 22, 1379. [Google Scholar] [CrossRef] [PubMed]
- Zhou, G.; Zhou, X.; Li, W.; Zhao, D.; Song, B.; Xu, C.; Zhang, H.; Liu, Z.; Xu, J.; Lin, G.; et al. Development of a Lightweight Single-Band Bathymetric LiDAR. Remote Sens. 2022, 14, 5880. [Google Scholar] [CrossRef]
- Sotelo-Torres, F.; Alvarez, L.V.; Roberts, R.C. An Unmanned Surface Vehicle (USV): Development of an Autonomous Boat with a Sensor Integration System for Bathymetric Surveys. Sensors 2023, 23, 4420. [Google Scholar] [CrossRef]
- Noman, J.; Cassol, W.N.; Daniel, S.; Pham Van Bang, D. Bathymetric Data Integration Approach to Study Bedforms in the Estuary of the Saint-Lawrence River. Front. Remote Sens. 2023, 4, 1125898. [Google Scholar] [CrossRef]
- Makiello, L. Multi-Sensor Fusion for a UAV / USV Tandem System for Spatial Data Collection of Waterways. In Proceedings of the 33. Forum Bauinformatik, München, Germany, 7–9 September 2022. [Google Scholar]
- Joe, H.; Cho, H.; Sung, M.; Kim, J.; Yu, S. Cheol Sensor Fusion of Two Sonar Devices for Underwater 3D Mapping with an AUV. Auton. Robots 2021, 45, 543–560. [Google Scholar] [CrossRef]
- Ferreira, F.; Machado, D.; Ferri, G.; Dugelay, S.; Potter, J. Underwater Optical and Acoustic Imaging: A Time for Fusion? A Brief Overview of the State-of-the-Art. In Proceedings of the OCEANS 2016 MTS/IEEE Conference, Monterey, CA, USA, 19–23 September 2016. [Google Scholar] [CrossRef]
- Hao, Y.; Han, Q. Data Fusion of Multi-Beam Sonar and Side-Scan Sonar Base on Feature Contour Registration. In Proceedings of the 2011 International Conference on Consumer Electronics, Communications and Networks (CECNet), Xianning, China, 16–18 April 2011; pp. 174–177. [Google Scholar] [CrossRef]
- Cooper, I.; Hotchkiss, R.H.; Williams, G.P. Extending Multi-Beam Sonar with Structure from Motion Data of Shorelines for Complete Pool Bathymetry of Reservoirs. Remote Sens. 2021, 13, 35. [Google Scholar] [CrossRef]
- Alevizos, E.; Oikonomou, D.; Argyriou, A.V.; Alexakis, D.D. Fusion of Drone-Based RGB and Multi-Spectral Imagery for Shallow Water Bathymetry Inversion. Remote Sens. 2022, 14, 1127. [Google Scholar] [CrossRef]
- Alevizos, E.; Nicodemou, V.C.; Makris, A.; Oikonomidis, I.; Roussos, A.; Alexakis, D.D. Integration of Photogrammetric and Spectral Techniques for Advanced Drone-Based Bathymetry Retrieval Using a Deep Learning Approach. Remote Sens. 2022, 14, 4160. [Google Scholar] [CrossRef]
- Lubczonek, J.; Kazimierski, W.; Zaniewicz, G.; Lacka, M. Methodology for Combining Data Acquired by Unmanned Surface and Aerial Vehicles to Create Digital Bathymetric Models in Shallow and Ultra-Shallow Waters. Remote Sens. 2022, 14, 105. [Google Scholar] [CrossRef]
- Imhof, E. Cartographic Relief Presentation; ESRI Press: Redlands, CA, USA, 2012. [Google Scholar]
- Ardiansyah, P.O.D.; Yokoyama, R. DEM Generation Method from Contour Lines Based on the Steepest Slope Segment Chain and a Monotone Interpolation Function. ISPRS J. Photogramm. Remote Sens. 2002, 57, 86–101. [Google Scholar] [CrossRef]
- Li, X.; Shen, H.; Feng, R.; Li, J.; Zhang, L. DEM Generation from Contours and a Low-Resolution DEM. ISPRS J. Photogramm. Remote Sens. 2017, 134, 135–147. [Google Scholar] [CrossRef]
- Taud, H.; Parrot, J.-F.; Alvarez, R. DEM Generation by Contour Line Dilation. Comput. Geosci. 1999, 25, 775–783. [Google Scholar] [CrossRef]
- Kettunen, P.; Koski, C.; Oksanen, J. A Design of Contour Generation for Topographic Maps with Adaptive DEM Smoothing. Int. J. Cartogr. 2017, 3, 19–30. [Google Scholar] [CrossRef]
- Younan, N.H.; Lee, H.S.; King, R.L. DTM Error Minimization via Adaptive Smoothing. LIDAR Forest Measurements. IEEE Int. Geosci. Remote Sens. Symp. 2003, 6, 3611–3613. [Google Scholar] [CrossRef]
- Lindsay, J.B.; Francioni, A.; Cockburn, J.M.H. LiDAR DEM Smoothing and the Preservation of Drainage Features. Remote Sens. 2019, 11, 17–19. [Google Scholar] [CrossRef]
- Chen, C.; Yue, T.; Dai, H.; Tian, M. The Smoothness of HASM. Int. J. Geogr. Inf. Sci. 2013, 27, 1651–1667. [Google Scholar] [CrossRef]
- Wojciech, M. The Use of Linear Smoothing Methods to Remove Artefacts Resulting from the Seabed’s DTM Lossy Compression. Appl. Geomat. 2022, 14, 199–212. [Google Scholar] [CrossRef]
- Chen, C.; Li, Y.; Yan, C.; Dai, H.; Liu, G. A Robust Algorithm of Multiquadric Method Based on an Improved Huber Loss Function for Interpolating Remote-Sensing-Derived Elevation Data Sets. Remote Sens. 2015, 7, 3347–3371. [Google Scholar] [CrossRef]
- Peters, R.Y.; Ledoux, H.; Meijers, B.M. Generation and Generalization of Safe Depth-Contours for Hydrographic Charts Using a Surface-Based Approach. In Proceedings of the 16th Workshop of the ICA Commission on Generalisation and Multiple Representation, Dresden, Germany, 23–24 August 2013. [Google Scholar]
- Skopeliti, A.; Tsoulos, L.; Pe’eri, S. Depth Contours and Coastline Generalization for Harbour and Approach Nautical Charts. ISPRS Int. J. Geo-Inf. 2021, 10, 197. [Google Scholar] [CrossRef]
- Zhang, X.; Guilbert, E. A Multi-Agent System Approach for Feature-Driven Generalization of Isobathymetric Line. Adv. Cartogr. GISci. 2011, 1, 477–495. [Google Scholar] [CrossRef]
- Hennau, M.; De Wulf, A. Smoothing Contour Lines of Hydrographical Maps. In Proceedings of the 15th International Congress of the International Federation of Hydrographic Societies, Antwerpen, Belgium, 6–9 November 2006; pp. 199–201. [Google Scholar]
- Rustomji, P. Semi-Automated Generation of Depth Contours for Electronic Navigation Charts (ENCs). Int. Hydrogr. Rev. 2018, 20, 33–40. [Google Scholar]
- Sanchez, A.; Bosselmann-Borsos, V.; Lieto, A. Di A Practical Approach to the Production of ENC with High Density Bathymetric Content. Int. Hydrogr. Rev. 2019, 22, 7–18. [Google Scholar]
- Monahan, D.; Casey, M.J. Contours and Contouring in Hydrography. Part I-the Fundamental Issues. Int. Hydrogr. Rev. 1985, 62, 105–120. [Google Scholar]
- Mather, P.M.; Koch, M. Filtering Techniques. In Computer Processing of Remotely-Sensed Images; John Wiley & Sons Ltd.: Hoboken, NJ, USA, 2011. [Google Scholar] [CrossRef]
- Field, D.A. Laplacian Smoothing and Delaunay Triangulations. Commun. Appl. Numer. Methods 1988, 4, 709–712. [Google Scholar] [CrossRef]
- Sorkine, O.; Cohen-Or, D.; Lipman, Y.; Alexa, M.; Rössl, C.; Seidel, H.P. Laplacian Surface Editing. ACM Int. Conf. Proceeding Ser. 2004, 71, 175–184. [Google Scholar] [CrossRef]
- Vartziotis, D.; Himpel, B. Laplacian Smoothing Revisited. arXiv 2014, arXiv:1406.4333. [Google Scholar] [CrossRef]
- Mujta, W.; Wlodarczyk-Sielicka, M.; Stateczny, A. Testing the Effect of Bathymetric Data Reduction on the Shape of the Digital Bottom Model. Sensors 2023, 23, 5445. [Google Scholar] [CrossRef]
Figure 1.
Maps of the study area: (a) view of the bay and the area being studied; (b,c) view of the territory of Poland and the area at smaller scales against the background of Dąbie Lake.
Figure 1.
Maps of the study area: (a) view of the bay and the area being studied; (b,c) view of the territory of Poland and the area at smaller scales against the background of Dąbie Lake.
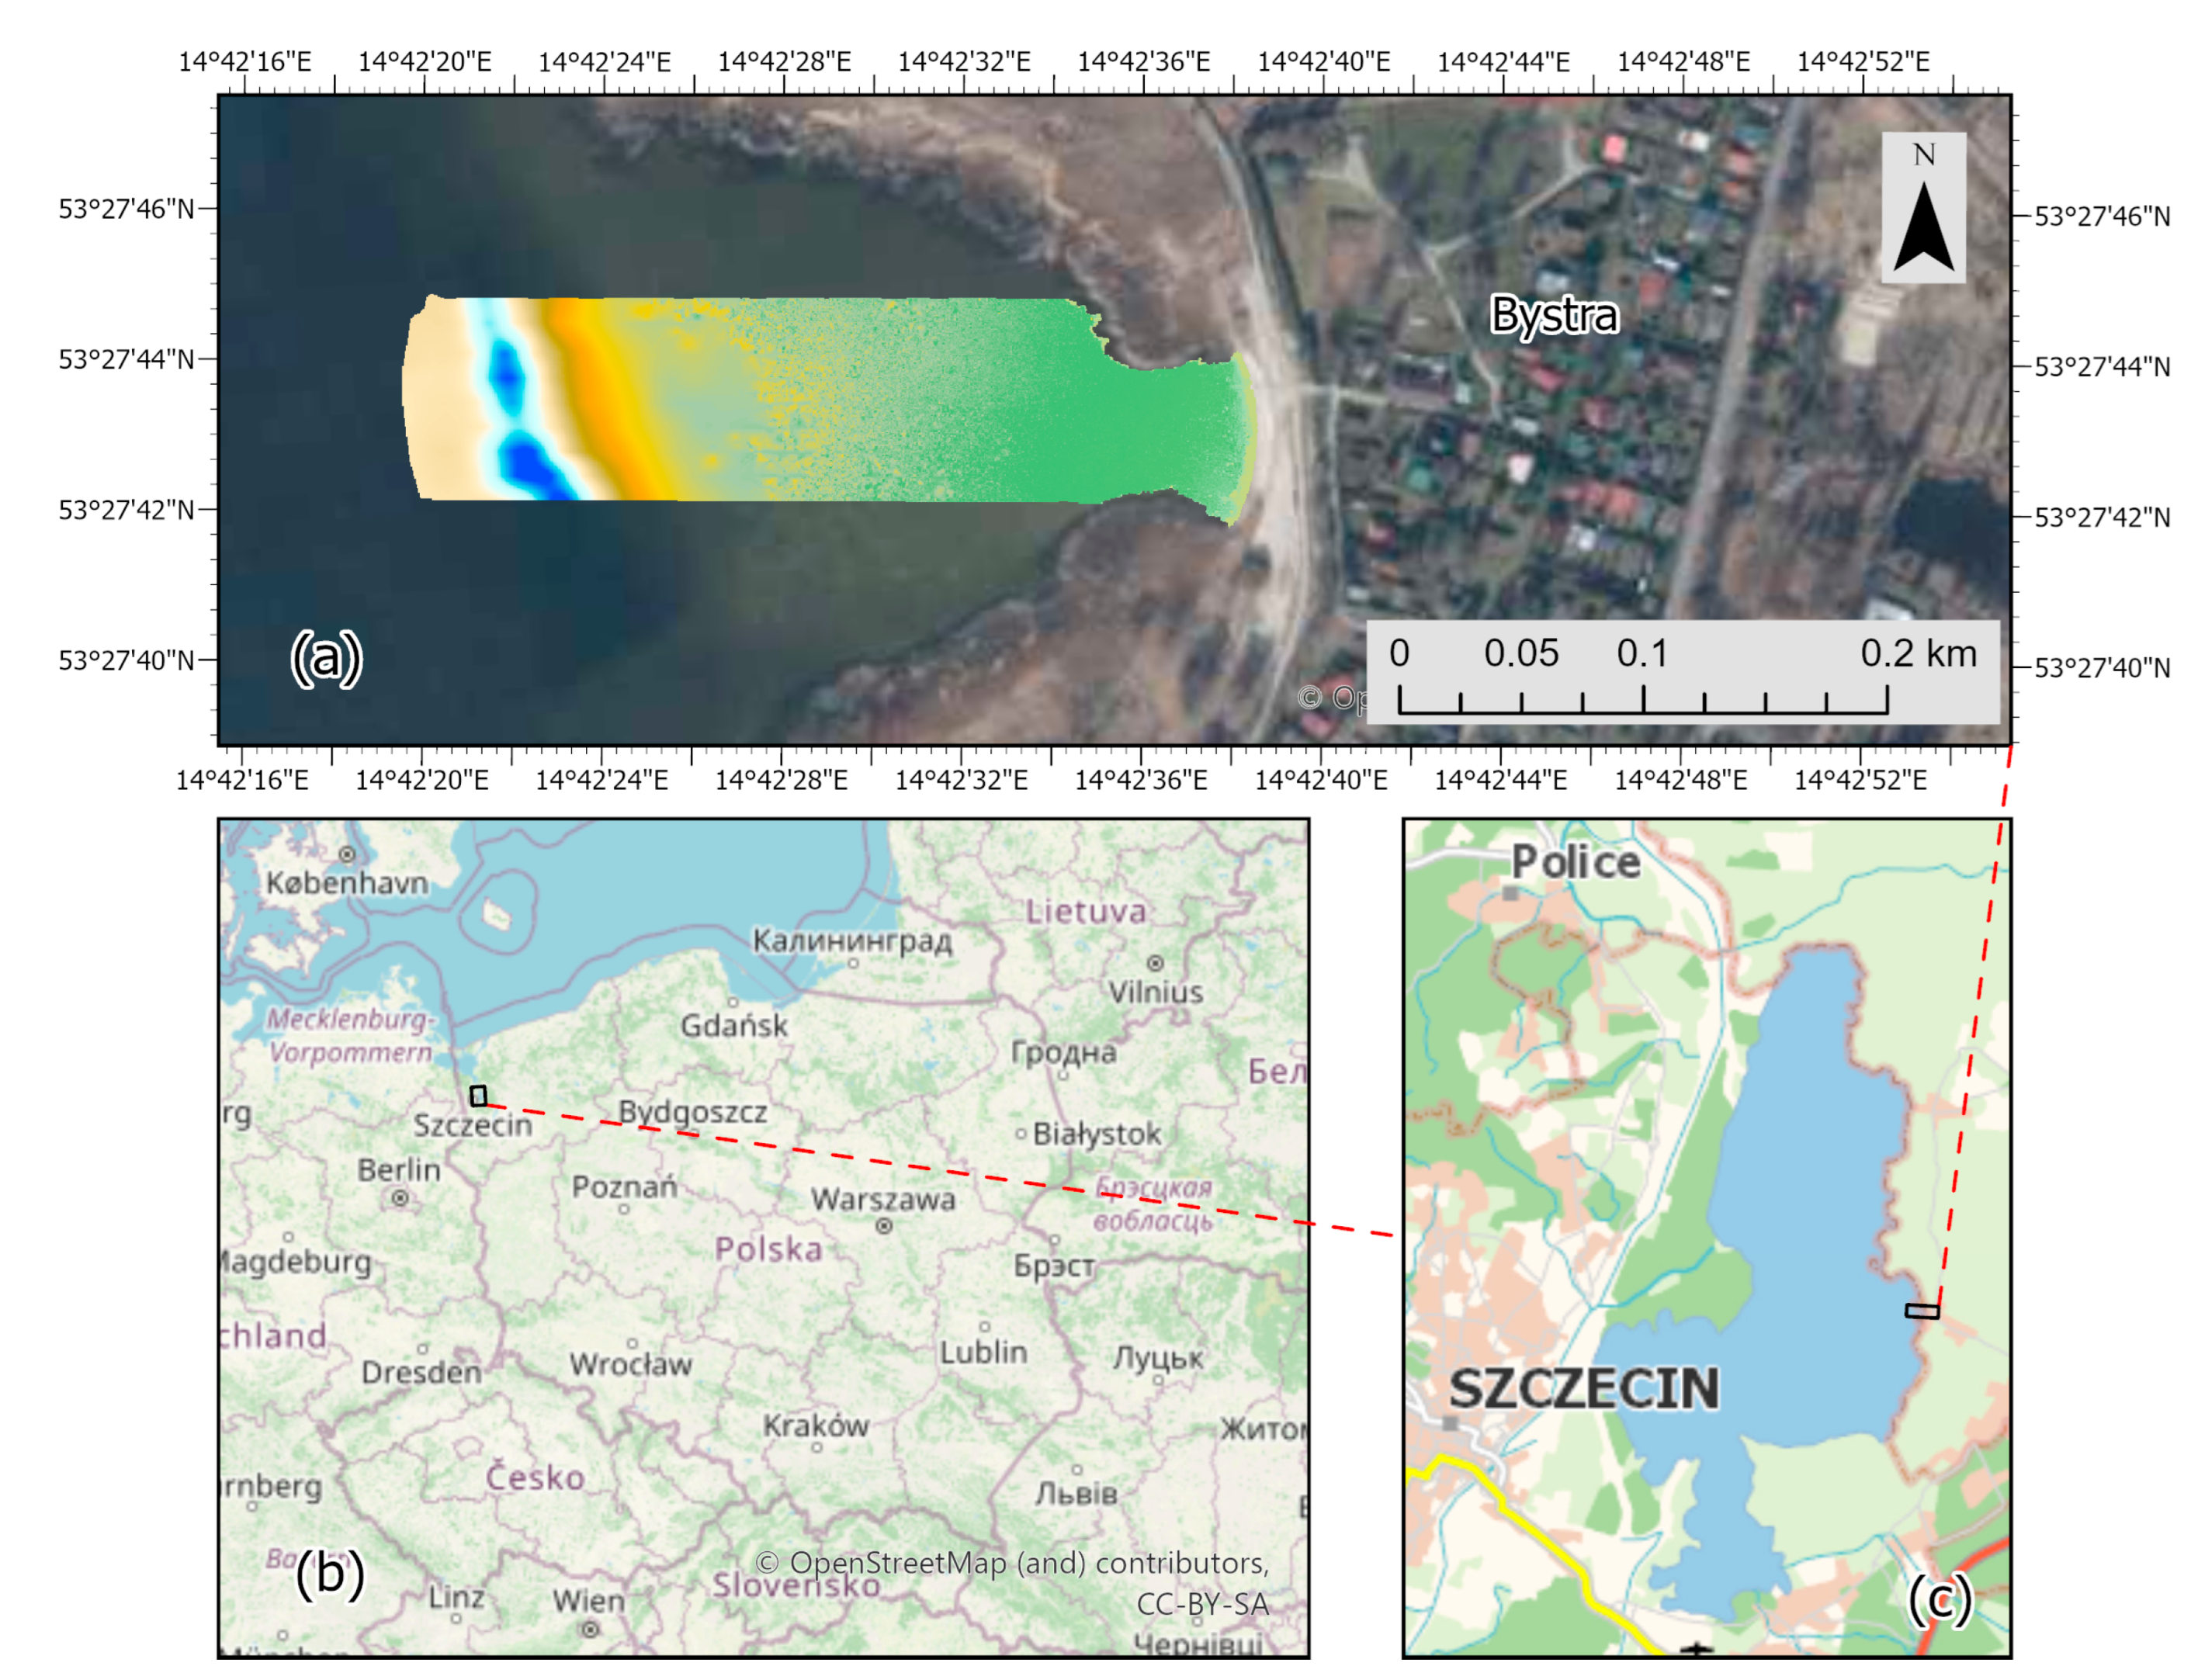
Figure 2.
Photos of the unmanned crafts used for data acquisition. UAV (left), USV (right).

Figure 3.
Combined bathymetric datasets acquired from a hydrographic survey (USV) and photogrammetric aerial survey (UAV) [74].
Figure 3.
Combined bathymetric datasets acquired from a hydrographic survey (USV) and photogrammetric aerial survey (UAV) [74].

Figure 4.
DBM elaborated using Kriging interpolation method [74].
Figure 4.
DBM elaborated using Kriging interpolation method [74].

Figure 5.
Hypsographic curve and statistic data of the modelled surface.

Figure 6.
Comparison of surface roughness in the standard model visualisation option (vertical exaggeration equal to 1, (a)) and on the model with a vertical exaggeration of 30 (b).
Figure 6.
Comparison of surface roughness in the standard model visualisation option (vertical exaggeration equal to 1, (a)) and on the model with a vertical exaggeration of 30 (b).

Figure 7.
Flow chart of the research methodology.

Figure 8.
Effect of smoothing the surface using the AVG filter, illustrated at iterations 1 (left), 25 (middle), and 50 (right).
Figure 8.
Effect of smoothing the surface using the AVG filter, illustrated at iterations 1 (left), 25 (middle), and 50 (right).

Figure 9.
Effect of smoothing the surface using the DIST filter, illustrated at iterations 1 (left), 25 (middle), and 50 (right).
Figure 9.
Effect of smoothing the surface using the DIST filter, illustrated at iterations 1 (left), 25 (middle), and 50 (right).

Figure 10.
Effect of smoothing the surface using the IDIST filter, illustrated at iterations 1 (left), 25 (middle), and 50 (right).
Figure 10.
Effect of smoothing the surface using the IDIST filter, illustrated at iterations 1 (left), 25 (middle), and 50 (right).

Figure 11.
Effect of smoothing the surface using the GAULP filter, illustrated at iterations 1 (left), 25 (middle), and 50 (right).
Figure 11.
Effect of smoothing the surface using the GAULP filter, illustrated at iterations 1 (left), 25 (middle), and 50 (right).

Figure 12.
Effect of smoothing the surface using the 5PAVG filter, illustrated at iterations 1 (left), 25 (middle), and 50 (right).
Figure 12.
Effect of smoothing the surface using the 5PAVG filter, illustrated at iterations 1 (left), 25 (middle), and 50 (right).

Figure 13.
Effect of smoothing the surface using the 5PXAVG filter, illustrated at iterations 1 (left), 25 (middle), and 50 (right).
Figure 13.
Effect of smoothing the surface using the 5PXAVG filter, illustrated at iterations 1 (left), 25 (middle), and 50 (right).

Figure 14.
Effect of smoothing the surface using the 9PAVG filter, illustrated at iterations 1 (left), 25 (middle), and 50 (right).
Figure 14.
Effect of smoothing the surface using the 9PAVG filter, illustrated at iterations 1 (left), 25 (middle), and 50 (right).

Figure 15.
Effect of smoothing the surface using the GAUS filter, illustrated at iterations 1 (left), 25 (middle), and 50 (right).
Figure 15.
Effect of smoothing the surface using the GAUS filter, illustrated at iterations 1 (left), 25 (middle), and 50 (right).

Figure 16.
Effect of smoothing the surface using the LP1 filter, illustrated at iterations 1 (left), 25 (middle), and 50 (right).
Figure 16.
Effect of smoothing the surface using the LP1 filter, illustrated at iterations 1 (left), 25 (middle), and 50 (right).

Figure 17.
Effect of smoothing the surface using the LP2 filter, illustrated at iterations 1 (left), 25 (middle), and 50 (right).
Figure 17.
Effect of smoothing the surface using the LP2 filter, illustrated at iterations 1 (left), 25 (middle), and 50 (right).

Figure 18.
Effect of smoothing the surface using the LP3 filter, illustrated at iterations 1 (left), 25 (middle), and 50 (right).
Figure 18.
Effect of smoothing the surface using the LP3 filter, illustrated at iterations 1 (left), 25 (middle), and 50 (right).

Figure 19.
Illustration of the surface smoothing effect in a 3D view using the LAP1 filter for iterations 1 (a), 25 (b), and 50 (c), and the AVG filter for iterations 1 (d), 25 (e), and 50 (f). A vertical exaggeration (VE) factor was applied to better showcase the surface details. For surfaces (a,d–f), a VE of 30 was applied; for surfaces (b,c) it was 2.3842 × 10⁻⁷.

Figure 20.
Maximum depth values on processed DBMs.

Figure 21.
Minimum depth values on processed DBMs.

Figure 22.
Values of analysed errors (MinE, MaxE, ME, RMS).

Figure 23.
Effect of smoothing on the shape and number of depth contours. The surface, smoothed with the LP3 filter, is presented at different stages: 1 iteration (left), 25 iterations (middle), 50 iterations (right).
Figure 23.
Effect of smoothing on the shape and number of depth contours. The surface, smoothed with the LP3 filter, is presented at different stages: 1 iteration (left), 25 iterations (middle), 50 iterations (right).

Figure 24.
Relationship between the number of generated depth contours and the number of filter iterations.
Figure 24.
Relationship between the number of generated depth contours and the number of filter iterations.

Figure 25.
The view of smoothed surface with overlaid depth contours. LP3 filter with 45 passes.

Figure 26.
Developed HD ENC based on data from DBM smoothed with the LP3 filter (45 iterations).


Table 1.
Basic technical data of the UAV and GNSS receiver for measuring control points [74].
Table 1.
Basic technical data of the UAV and GNSS receiver for measuring control points [74].
| UAV Type: DJI Phantom 4 Pro | GNSS Type: Sokkia GRX1 |
|---|---|
| Satellite positioning systems: GPS/GLONASS | Number of channels: 72 |
| Sensor: 1″ CMOS, effective pixels: 20 M | Tracked signals: GPS, GLONASS, SBAS |
| Photo: JPEG, DNG (RAW), JPEG + DNG | Frequency of measurement up to 20 Hz |
| Max flight time: approx. 30 min | Accuracy RTK: H 10 mm + 1 ppm, V 20 mm + 1 mm |
| Range: 3500 m | Data format: RTCM SC104 2.1/2.2/2.3/3.0/3.1, CMR, CMR+, NMEA, TPS |
Table 2.
Basic technical and operational data of the USV [74].
Table 2.
Basic technical and operational data of the USV [74].
| USV Type: Gerris | GNSS Type: RTK Emlid Reach M2 |
|---|---|
| Length, height, width: 1.2 m, 1 m, 0.36 m | Number of channels: 184 |
| Survey speed: 1.2 m/s | Tracked signals: GPS/QZSS, GLONASS, BeiDou, Galileo |
| Propulsion: 2 motors T200 Blue Robotics | Frequency of measurement is 20 Hz |
| Single beam echosounder: Echologger EU400 | Accuracy RTK: H: 7 mm + 1 ppm, V: 14 mm + 1 ppm |
| Echosounder range: 0.15 m~100 m | Data format: NTRIP, RTCM3ERB, text, NMEA (RMC, GGA, GSA, GSV), RINEX2.X, RINEX3.X |
Table 3.
Summary of weights, window sizes, and acronyms (given in brackets) of filters.
| Moving Average (AVG) | Distance Weighting (DIST) | Inverse Distance (IDIST) | ||||||||||||
|---|---|---|---|---|---|---|---|---|---|---|---|---|---|---|
| 1 | 1 | 1 | 1 | 1 | 0.3333 | 0.3333 | 0.3333 | 0.3333 | 0.3333 | 0.3536 | 0.4472 | 0.5000 | 0.4472 | 0.3536 |
| 1 | 1 | 1 | 1 | 1 | 0.3333 | 0.6667 | 0.6667 | 0.6667 | 0.3333 | 0.4472 | 0.7071 | 1.0000 | 0.7071 | 0.4472 |
| 1 | 1 | 1 | 1 | 1 | 0.3333 | 0.6667 | 1.0000 | 0.6667 | 0.3333 | 0.5000 | 1.0000 | 2.000 | 1.0000 | 0.5000 |
| 1 | 1 | 1 | 1 | 1 | 0.3333 | 0.6667 | 0.6667 | 0.6667 | 0.3333 | 0.4472 | 0.7071 | 1.0000 | 0.7071 | 0.4472 |
| 1 | 1 | 1 | 1 | 1 | 0.3333 | 0.3333 | 0.3333 | 0.3333 | 0.3333 | 0.3536 | 0.4472 | 0.5000 | 0.4472 | 0.3536 |
| Gaussian Low-Pass (GAULP) | 5-Node + Averaging (5PAVG) | 5-Node X Averaging (5PXAVG) | ||||||||||||
| 0.0003 | 0.0067 | 0.0183 | 0.0067 | 0.0003 | ||||||||||
| 0.0067 | 0.1353 | 0.3679 | 0.1353 | 0.0067 | 0 | 1 | 0 | 1 | 0 | 1 | ||||
| 0.0183 | 0.3679 | 1.0000 | 0.3679 | 0.0183 | 1 | 1 | 1 | 0 | 1 | 0 | ||||
| 0.0067 | 0.1353 | 0.3679 | 0.1353 | 0.0067 | 0 | 1 | 0 | 1 | 0 | 1 | ||||
| 0.0003 | 0.0067 | 0.0183 | 0.0067 | 0.0003 | ||||||||||
| 9-Node Averaging (9PAVG) | Gaussian (GAUS) | Low-Pass 1 (LP1) | ||||||||||||
| 1 | 1 | 1 | 1 | 2 | 1 | 1 | 1 | 1 | ||||||
| 1 | 1 | 1 | 2 | 4 | 2 | 1 | 2 | 1 | ||||||
| 1 | 1 | 1 | 1 | 2 | 1 | 1 | 1 | 1 | ||||||
| Low-Pass 2 (LP2) | Low-Pass 3 (LP3) | Laplacian 1 (LAP1) | ||||||||||||
| 1 | 1 | 1 | 1 | 1 | 1 | 0 | −1 | 0 | ||||||
| 1 | 4 | 1 | 1 | 12 | 1 | −1 | 4 | −1 | ||||||
| 1 | 1 | 1 | 1 | 1 | 1 | 0 | −1 | 0 | ||||||
| Laplacian 2 (LAP2) | Laplacian 3 (LAP3) | Laplacian 4 (LAP4) | ||||||||||||
| −1 | −1 | −1 | 1 | −2 | 1 | −1 | 0 | −1 | ||||||
| −1 | 8 | −1 | −2 | 4 | −2 | 0 | 4 | 0 | ||||||
| −1 | −1 | −1 | 1 | −2 | 1 | −1 | 0 | −1 | ||||||
Disclaimer/Publisher’s Note: The statements, opinions and data contained in all publications are solely those of the individual author(s) and contributor(s) and not of MDPI and/or the editor(s). MDPI and/or the editor(s) disclaim responsibility for any injury to people or property resulting from any ideas, methods, instructions or products referred to in the content. |
© 2023 by the authors. Licensee MDPI, Basel, Switzerland. This article is an open access article distributed under the terms and conditions of the Creative Commons Attribution (CC BY) license (https://creativecommons.org/licenses/by/4.0/).
Share and Cite
MDPI and ACS Style
Lubczonek, J.; Zaniewicz, G. Application of Filtering Techniques to Smooth a Surface of Hybrid Digital Bathymetric Model. Remote Sens. 2023, 15, 4737. https://doi.org/10.3390/rs15194737
AMA Style
Lubczonek J, Zaniewicz G. Application of Filtering Techniques to Smooth a Surface of Hybrid Digital Bathymetric Model. Remote Sensing. 2023; 15(19):4737. https://doi.org/10.3390/rs15194737
Chicago/Turabian StyleLubczonek, Jacek, and Grzegorz Zaniewicz. 2023. "Application of Filtering Techniques to Smooth a Surface of Hybrid Digital Bathymetric Model" Remote Sensing 15, no. 19: 4737. https://doi.org/10.3390/rs15194737
Note that from the first issue of 2016, this journal uses article numbers instead of page numbers. See further details here.