Technical Note

Optimal Pair Selection Applied to Sentinel-2 Images for Mapping Ground Deformation Using Pixel Offset Tracking: A Case Study of the 2022 Menyuan Earthquake (Mw 6.9), China

1
Faculty of Geosciences and Environmental Engineering, Southwest Jiaotong University, Chengdu 611756, China
2
State-Province Joint Engineering Laboratory of Spatial Information Technology of High-Speed Rail Safety, Chengdu 611756, China
*
Author to whom correspondence should be addressed.
Remote Sens. 2023, 15(19), 4735; https://doi.org/10.3390/rs15194735
Submission received: 4 September 2023 / Revised: 26 September 2023 / Accepted: 26 September 2023 / Published: 27 September 2023

Abstract

:
Pixel Offset Tracking (POT) for optical imagery is a widely used method for extracting large-scale ground deformation. However, the influence of imaging parameters on the measurement accuracy of POT is still unclear. In this study, based on 16 pairs of Sentinel-2 images covering the period before and after the Ms6.9 Menyuan earthquake in 2022, we quantitatively assessed the effects of imaging bands, time intervals between image pairs, and differences in solar zenith angles on the measurement accuracy of optical POT. The results showed that the quality of ground deformation extracted using the near-infrared band was superior to other bands. The accuracy of optical POT measurements exhibited a negative correlation with both the time interval between image pairs and the differences in solar zenith angles. The maximum difference in optical POT measurement accuracy for the near-infrared band between image pairs with different time intervals (5/10/15 days) reached 30.3%, while the maximum difference in deformation measurement accuracy for pairs with different solar zenith angle differences was 30.56%. Utilizing the optimal POT image pair, the accuracy of co-seismic deformation measurement for the Menyuan earthquake improved by 48.3% compared to the worst image pair. The maximum co-seismic horizontal displacement caused by the earthquake was estimated to be 3.00 ± 0.51 m.

1. Introduction

Ground deformation is a common phenomenon on the Earth’s land surface. It can be caused by a variety of factors, such as earthquakes, volcanoes, landslides, and human activities. Surface deformation monitoring and analysis can provide key information about the Earth’s crust and can help us understand and mitigate the impacts of these hazards. Pixel Offset Tracking (POT) is a technique that calculates the offset of a pixel with counterpart points between two Synthetic Aperture Radar (SAR) or optical images and gauges the horizontal displacement of the surface based on image resolution [1,2,3,4]. Compared to the Global Navigation Satellite System (GNSS), which usually provides single-point observations [5,6], or, Interferometric Synthetic Aperture Radar (InSAR), which is generally employed for extracting slow and small-amplitude surface deformations [7,8], POT offers considerable benefits for deriving large-scale and high-gradient surface deformation.
In the last decades, the increasing availability of freely accessible satellite optical data has greatly enhanced the applications of POT for mapping large-scale ground deformation. Specifically, in emergency scenarios, it can facilitate swift response observations of surface displacements triggered by significant geohazard events such as earthquakes or volcanic eruptions. For example, the short-period revisited and freely available optical imagery, such as Landsat-8/9 and Senitnel-2 data, have been used for rapid investigation of surface displacements induced the 2023 Turkey earthquake [9] and the eruption of the Colima volcano in Mexico [10]. In addition, with the long time-series optical imagery, it is also possible to track surface displacement changes over decades using POT, such as interannual flow rate changes of glaciers [11,12].
Previous studies have revealed several factors that can influence the displacement measurement accuracy using POT [12,13,14]. These factors include image quality, which is closely related to cloud conditions and imaging geometry (i.e., solar zenith and azimuth angles) at the time of image acquisition, the temporal span of the POT image pair, and the spectral band used for image correlation. Cloudiness can create voids and shadows on images. The changes in the solar zenith angle and solar altitude angle not only affect the amount of light reaching the surface but also impact the amount of light received by the sensor [15], which can lead to erroneous matching of corresponding points between the image pairs and further result in inaccuracies in the displacement measurements. Ding et al. [16] indicate that the smaller the difference between the solar zenith angle and solar altitude angle of image pairs, the less decorrelation noise is present in the image correlation results. The accuracy of correlation can also be compromised when the time interval between the POT image pairs is too long, as the spectral reflectance of the ground surface may change significantly over time [13,17]. For example, Ali et al. [18] have shown that the temporal span of the reference and secondary images would affect the POT results, with a positive correlation between the time interval and POT uncertainty in east-west displacements. Additionally, the quality of POT results may vary when different spectral bands of the optical image are used, given that the reflectance characteristics of various wavelength bands (red, green, blue, near-red) to the atmosphere are different [19,20].
To enhance the accuracy of surface displacement measurements using POT, it is essential to address and consider the factors mentioned above in the data acquisition and analysis process. However, the current research on the effects of these factors on the precision of surface deformation measurements with optical POT only qualitatively discussed the individual impact of each influencing factor on the uncertainty of the results, without combining these factors to derive a quantitative rule for selecting the image pairs. Additionally, there is controversy regarding the impact of certain factors on the measurement precision of optical POT. For instance, in a study by Zhang [12], they analyzed POT measurement accuracy using Sentinel-2 data in four different bands: red, green, blue, and near-infrared. Surprisingly, they found that the near-infrared band had the lowest measurement accuracy, while the three visible light bands showed similar precision. The difference in accuracy between the near-infrared band and the other bands could reach up to approximately 0.9 m. However, in contrast, He [14], also using Sentinel-2 imagery, arrived at the opposite conclusion, suggesting that deformation measurement accuracy based on near-infrared bands is superior to that based on visible bands. These contradictory findings emphasize the need for further quantitative research to comprehensively evaluate the effects of image bands and other factors on the precision of deformation retrieval with optical POT.
Currently, a large number of freely available optical remote sensing images bring opportunities for the optical POT technique to extract surface deformation but also challenge the efficiency of deformation extraction. For example, the Sentinel-2 mission, consisting of two identical satellites, Sentinel-2A and Sentinel-2B can acquire images at a revisit frequency of 5 days. How to determine the optimal POT image pairs based on the image parameters among the massive data in order to quickly acquire high-quality surface deformation is of great significance for the emergency response assessment of major geologic disasters. It would enable researchers and practitioners to make informed decisions and select appropriate data for their specific studies.
In this study, we used 15 Sentinel-2 images acquired before and after the Mw 6.9 Menyuan earthquake, Qinghai Province, China, which occurred on 8 January 2022, as an example to explore the optimized pair selection for ground deformation mapping using POT. Field investigations have shown that the maximum co-seismic displacement induced by the earthquake reached about 3 m [21,22,23]. In addition, Han et al. [24] have used the GF-7 data to study the Menyuan earthquake using optical POT. The maximum measured surface offset value in the study was about 4.0 m, with an average value of 1.9 m. Zhang et al. [25] have processed the optical POT using Sentinel-2 data, the conclusion was drawn that the maximum deformation in the east-west direction is 2 m. Here we mapped the co-seismic surface deformation due to this earthquake by optical POT through different image combinations of solar zenith angle, image-pair time interval, and imaging bands. On this basis, we investigated the influence of imaging parameters on the POT results and generated a linear regression model linking the deformation measurement accuracy and the difference between the solar zenith angle and the image-pair time interval. We further discussed the optimized strategy for selecting the optimal image pair for optical POT. Finally, the co-seismic deformation field of the Mengyuan earthquake was extracted and analyzed with the best optimal Sentinel-2 POT image pairs using the POT technique.

2. Optical POT and the Factors Influencing the Measurement Accuracy

2.1. Principles of Optical POT

The optical image offset tracking algorithm is a method that utilizes optical remote sensing image correlation matching to calculate ground displacements. This is mainly implemented through two types of algorithms: the spatial domain cross-correlation [26] and the frequency domain cross-correlation [27]. In this study, we used an improved cross-correlation algorithm in the frequency domain termed orientation correlation to calculate ground displacement. Previous studies have shown that the orientation correlation method, which is based on Fast Fourier Transforms (FFTs) for correlation matching of intensity gradient direction images, has the advantage of being fast and statistically robust [28].
Assuming that the reference and secondary optical images of an image pair to be matched are represented by f and g, the orientation image of the master image f d ( x , y ) can be represented as (similarly for the slave image g d ( x , y ) ) [28]:
f d x , y = s g n f x , y x + f x , y y i , W h e r e   s g n z = 0                         i f z = 0 z / z                 o t h e r w i s e
where, x , y represents the coordinates of each pixel of the image, f x , y x and f x , y y are the partial derivatives of the pixel values in the x and y directions, respectively, calculated using the central difference method [29]; i represents the imaginary part; s g n ( z ) denotes the signum function, where z is f x , y x + f x , y y i .
Using the FFT algorithm, the orientation images f d and g d can be subjected to correlation matching in the frequency domain. The orientation correlation matching surface for the POT image pair can then be represented as:
R I F F T F D k , l G D * k , l
where * stands for complex conjugate, F D k , l and G D k , l represent the frequency domain values obtained by applying the FFTs to f d x , y and g d x , y , respectively. The offset between the reference and secondary images can then be determined by the location of the maximum value of the directional correlation matching surface Equation (2) [30].

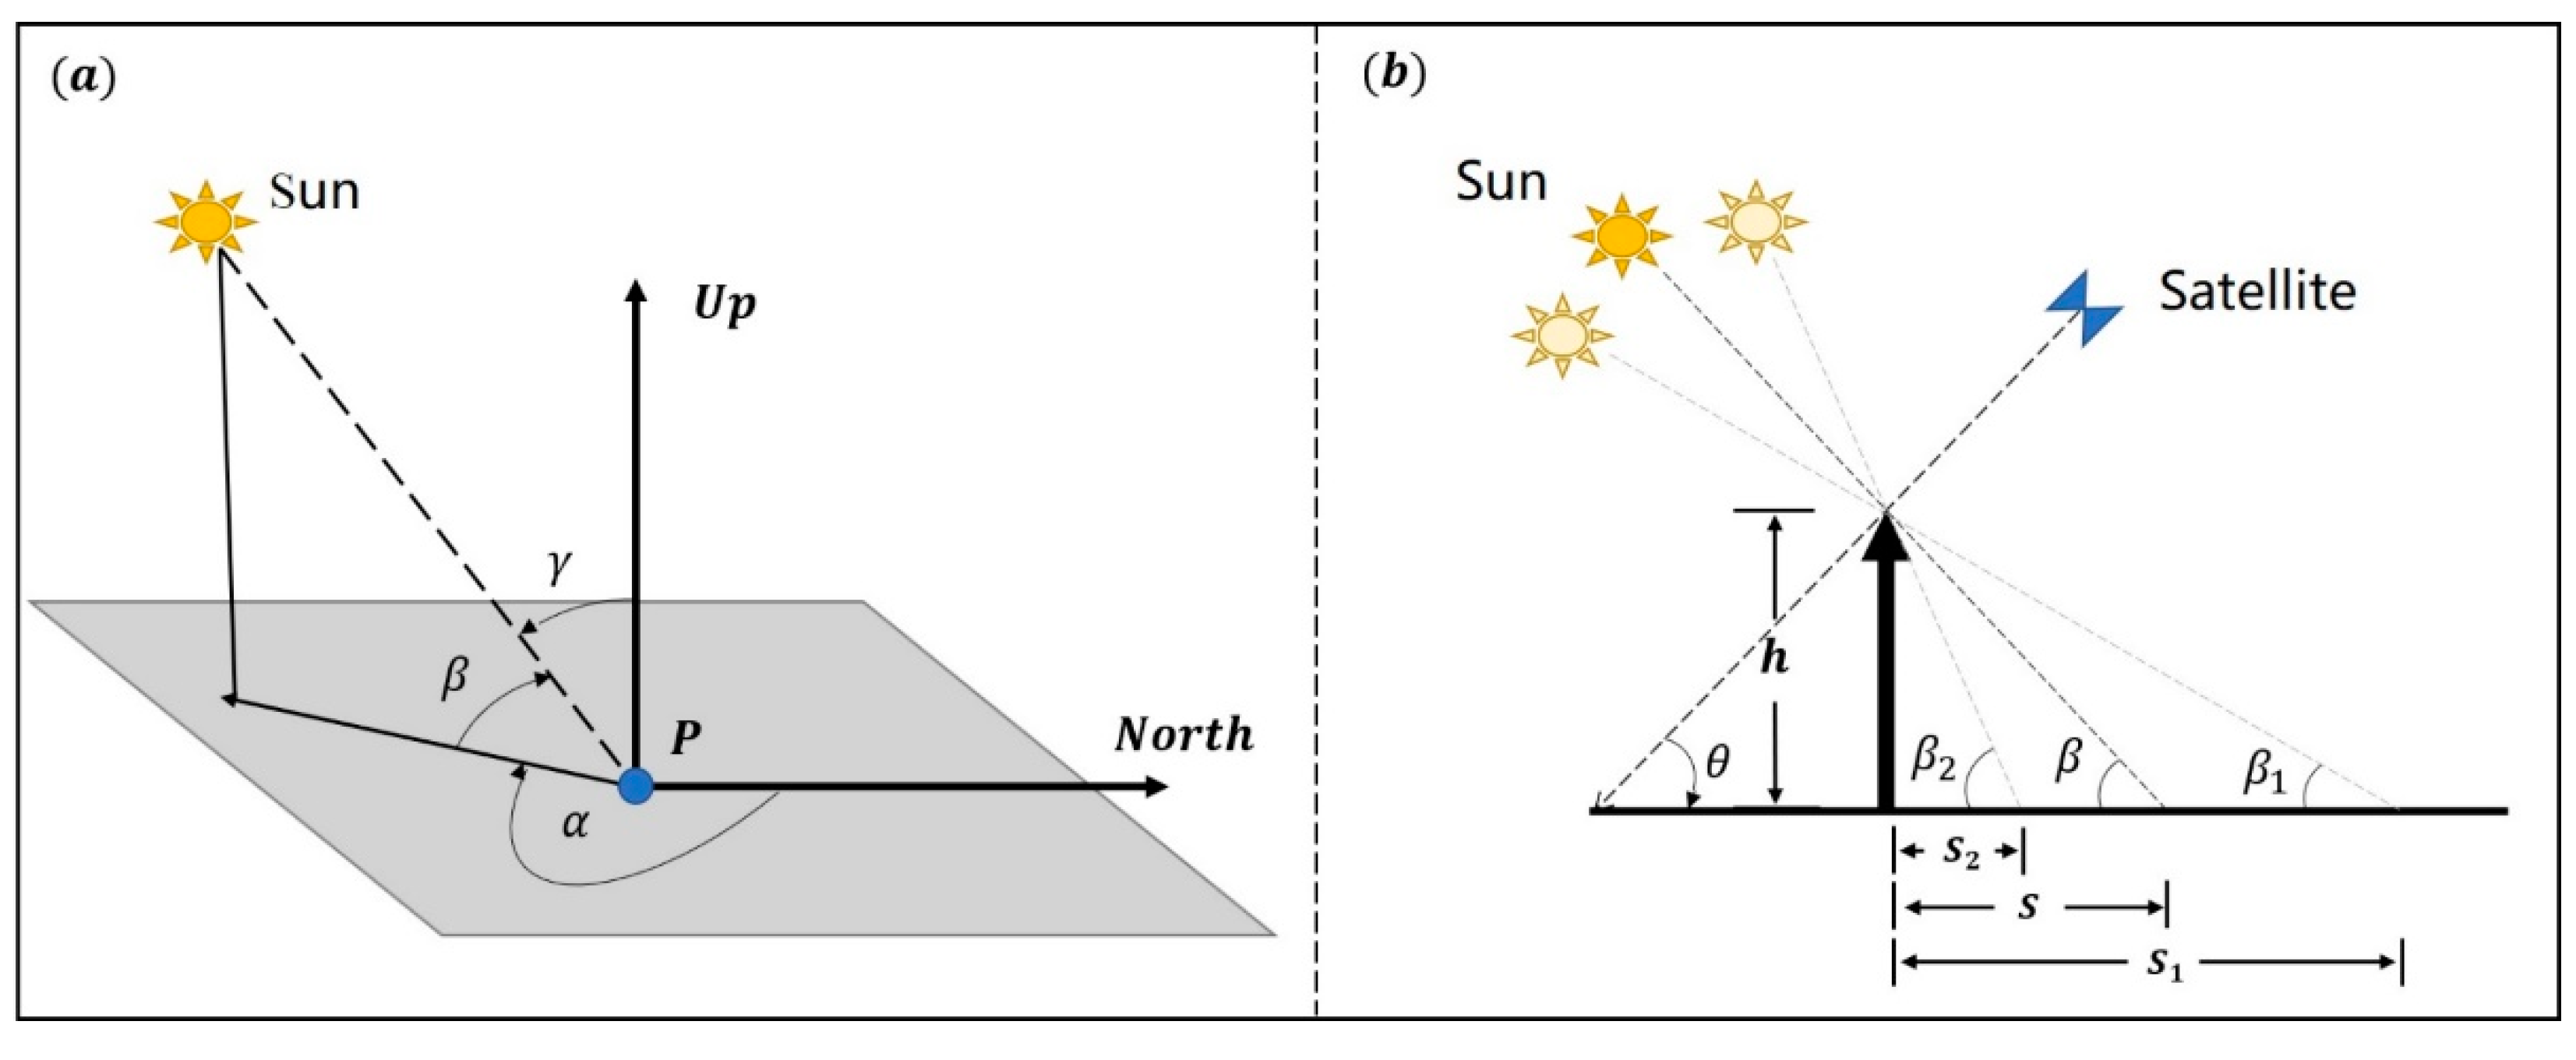
2.2. Factors Influencing the Measurement Accuracy of Optical POT

The image quality of the optical satellite image directly affects the matching accuracy of the reference and secondary images, thus affecting the optical POT deformation measurement results. The imaging quality is not only controlled by the parameter design index of the sensor itself but also affected by the solar altitude angle and the terrain undulation situation, which are mainly manifested in the uniformity of the scene illumination and the radiation of the image [31].
Figure 1 shows the diagrams of solar and satellite imaging geometries. The solar altitude angle is the angle between the line connecting the sun with an object on the ground and the horizon at a certain moment, while the solar zenith angle and the solar altitude angle are complementary to each other (Figure 1a). Due to the variation in the solar zenith angle, there is a certain difference in the length of shadows ( S = h tan γ ) of the same object in the reference and secondary images. As shown in Figure 1b, when the difference between the solar zenith angle of the reference and secondary images is negative (the secondary image corresponds to the solar altitude angle β 1 ), the shadow length of the secondary image ( S 1 ) increases, meaning that the degree of shadow influence in the secondary image relative to the reference image is enhanced. Conversely, when the difference between the solar zenith angle of the two images is positive (the secondary image corresponds to the solar altitude angle β 2 ), the length of shadows in the slave image ( S 2 ) will decrease. This means that the degree of shadow influence in the secondary image relative to the reference image is weakened. The increase in shadow area corresponding to the same object between the reference and secondary images will result in an increase in matching errors in image correlation [32].
The imaging time interval for an image pair also affects the matching accuracy between them. The longer the image-pair time interval, the greater the possibility of mismatching due to changes in spectral reflectance characteristics caused by changes in ground surface cover.
In addition, the reflectance of surface coverings can change with variations in solar zenith angle [33]. Previous studies have found that the impact of changes in solar angle on the reflectance of the red band is greater than that on the near-infrared band [34]. Considering the differences in reflectance of the same surface covering in different bands (near-infrared/red/green/blue), this study evaluates the optimal band for extracting the surface deformation field by statistically analyzing the deformation features in optical POT calculation results based on different bands.

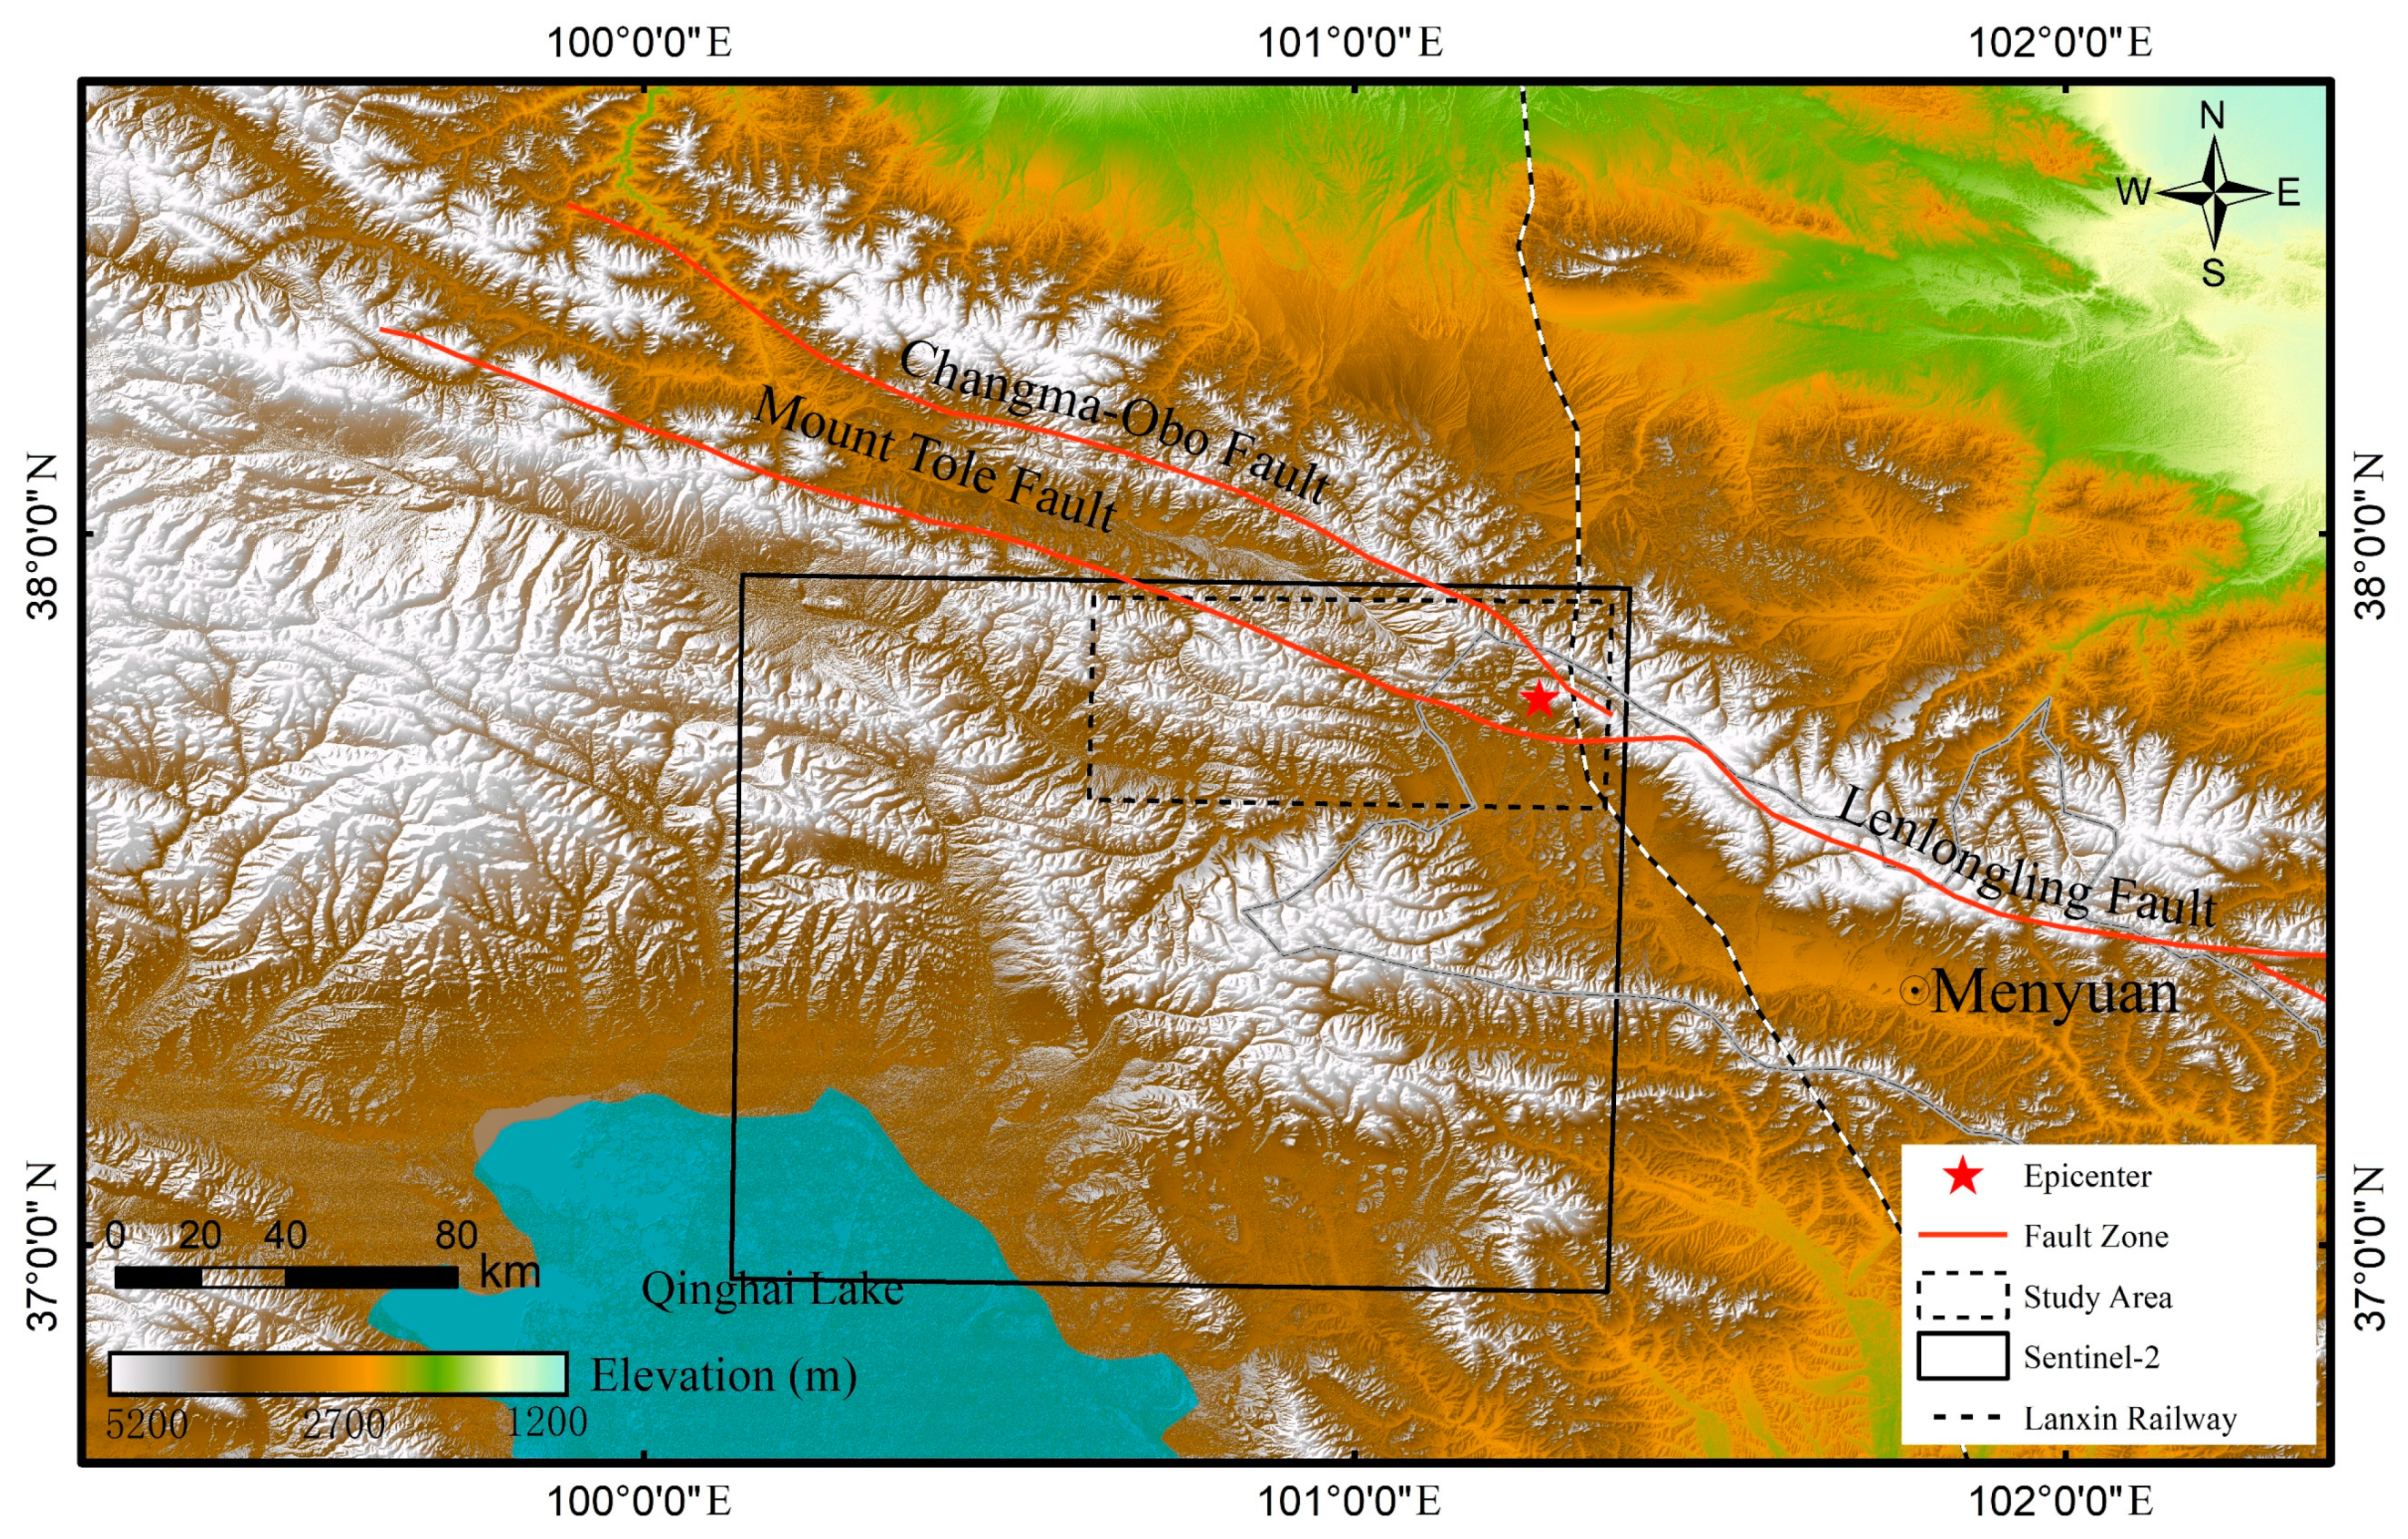
3. Study Area and Data

This study focuses on the case of the Mw 6.9 Menyuan Earthquake in Qinghai (37.77°N, 101.26°E), China, which occurred on 8 January 2022 (Figure 2). The focal depth of the earthquake was estimated to be approximately 13 km by the United States Geological Survey (USGS) [35]. The seismogenic fault zone for this earthquake is the Lenlongling Fault Zone, one of the segments of the Qilian-Haiyuan Fault Zone, located at the northeastern margin of the Qinghai-Tibet Plateau [36]. The focal mechanism solution indicates that the earthquake occurred on a left-lateral strike-slip fault [37]. Field investigations have revealed significant surface ruptures in the vicinity of the epicenter, indicating strong horizontal ground displacement caused by the earthquake. Previous studies have indicated that the post-seismic deformation in this case can be considered negligible compared to co-seismic deformation [38], so we did not consider the influence of post-seismic deformation in this study.
We used the Sentinel-2 satellite images as the test data. Sentinel-2 is a high-resolution multispectral imaging satellite constellation launched by the European Space Agency. It consists of two sister satellites, Sentinel-2A and Sentinel-2B, which were launched on 23 June 2015, and 7 March 2017, respectively. The spatial resolution of Sentinel-2 imagery ranges from 10–60 m, and its revisit period can be as short as 5 days [39]. To evaluate the impact of different image pair combinations on surface deformation measurements, this study obtained 15 pre- and post-earthquake Sentinel-2A/B Level-1C images covering the Menyuan Earthquake region in 2022, with a cloud coverage of less than 3% (see Table 1). The acquired images have a range of solar zenith angles from 19–63° and solar azimuth angles from 132–166°. It can be observed that there are significant differences in solar zenith and azimuth angles among the images, and the selection of image pairs with noticeable differences in these angles will inevitably affect the POT measurements. Previous studies have indicated that the correlation precision of Sentinel-2 images can reach values smaller than 1/10 pixel [40,41,42,43]. This suggests that the expected measurement accuracy of ground displacements using the POT method can be higher than 1 m, given a spatial resolution of 10 m for the Sentinel-2 images.

4. Ground Deformation Mapping Using POT

We constructed 21 POT image pairs based on the 15 Sentinel-2 images by setting a maximum temporal span of 15 days. Of the 21 image pairs, 4 of them covers earthquake event. We then used the ImGRAFT http://imgraft.glaciology.net/ (accessed on 20 February 2023) [44] software to implement the POT processing. Before the image cross-correlation operation, we pre-preprocessed all the images with Sen2cor Version 02.10.01 for terrain distortion correction and orthorectification [43]. With this pre-processing, the Level-1C format data was converted to Level-2A format. All the images were also resized to the same size of 2732 × 1160 pixels and resampled to 10 m.
We performed an accuracy assessment on the POT-derived surface deformation by calculating the Mean Absolute Errors (MAEs) of horizontal displacements in the far field away from the epicenter, assuming that the ground surface is stable during the earthquake. In comparison to other error evaluation metrics, MAE is advantageous because it takes the absolute value of the deviations, thereby avoiding the cancellation of positive and negative errors. The calculation for the MAE is shown as:
M A E = 1 m i = 1 m y i y i
where m represents the number of pixels in the selected window, y i is the arithmetic mean value of the pixels in the deformation map, and y i represents the individual pixel value. Furthermore, considering that different regions in the far field have different observational conditions, we randomly selected four regions: Z1~Z4 with each having a size 213 × 155 pixels (~24 km2) to calculate the MAEs. The average of these four regions’ MAE was then used to assess the POT accuracy for the whole area.
In addition to investigating the influence of imaging parameters on the POT results, we also considered the impact of the template window size for image correlation. Although it is not the main focus of our paper, we recognized its potential effect and conducted an analysis. We tested different template window sizes, including 21 × 21, 31 × 31, 41 × 41, 51 × 51, and 61 × 61 pixels, to implement the POT. The results revealed that using a smaller window size led to larger Mean Absolute Error (MAE) values in the far-field region (Z1~Z4) (Figure 3). On the other hand, window sizes of 51 × 51 and 61 × 61 produced overly smoothed results, resulting in the loss of fine details despite having smaller MAE values. This finding is consistent with previous studies [45]. Considering a trade-off between accuracy and preserving fine details, we selected a window size of 41 × 41. This choice not only provided a reasonable compromise but also resulted in the smallest proportion of NaN values among the different results (7.7%). We believe that this decision strikes a balance between accuracy and capturing important details in the analysis.
The ImGRAFT software implements optical POT using the orientation correlation algorithm. The matching template window size for the reference image was set to 41 × 41, and the corresponding search window size for the secondary image was set to 81 × 81. The obtained POT results were masked based on the correlation signal-to-noise ratio using a threshold of 0.4. We also removed 5 image pairs with low matching correlation (MAEs > 0.50). Finally, we obtained 16 POT image pairs including 6 pairs with a 5-day interval, 6 pairs with a 10-day interval, and 4 pairs with a 15-day interval (see Figure 4). The vertical axis represents the sequence number of the image pairs and the horizontal axis represents the image dates in Figure 4. The results obtained from the POT calculation represent the north-south and east-west displacements of the Earth’s surface, and their fusion allows for the calculation of horizontal displacement.

5. Result

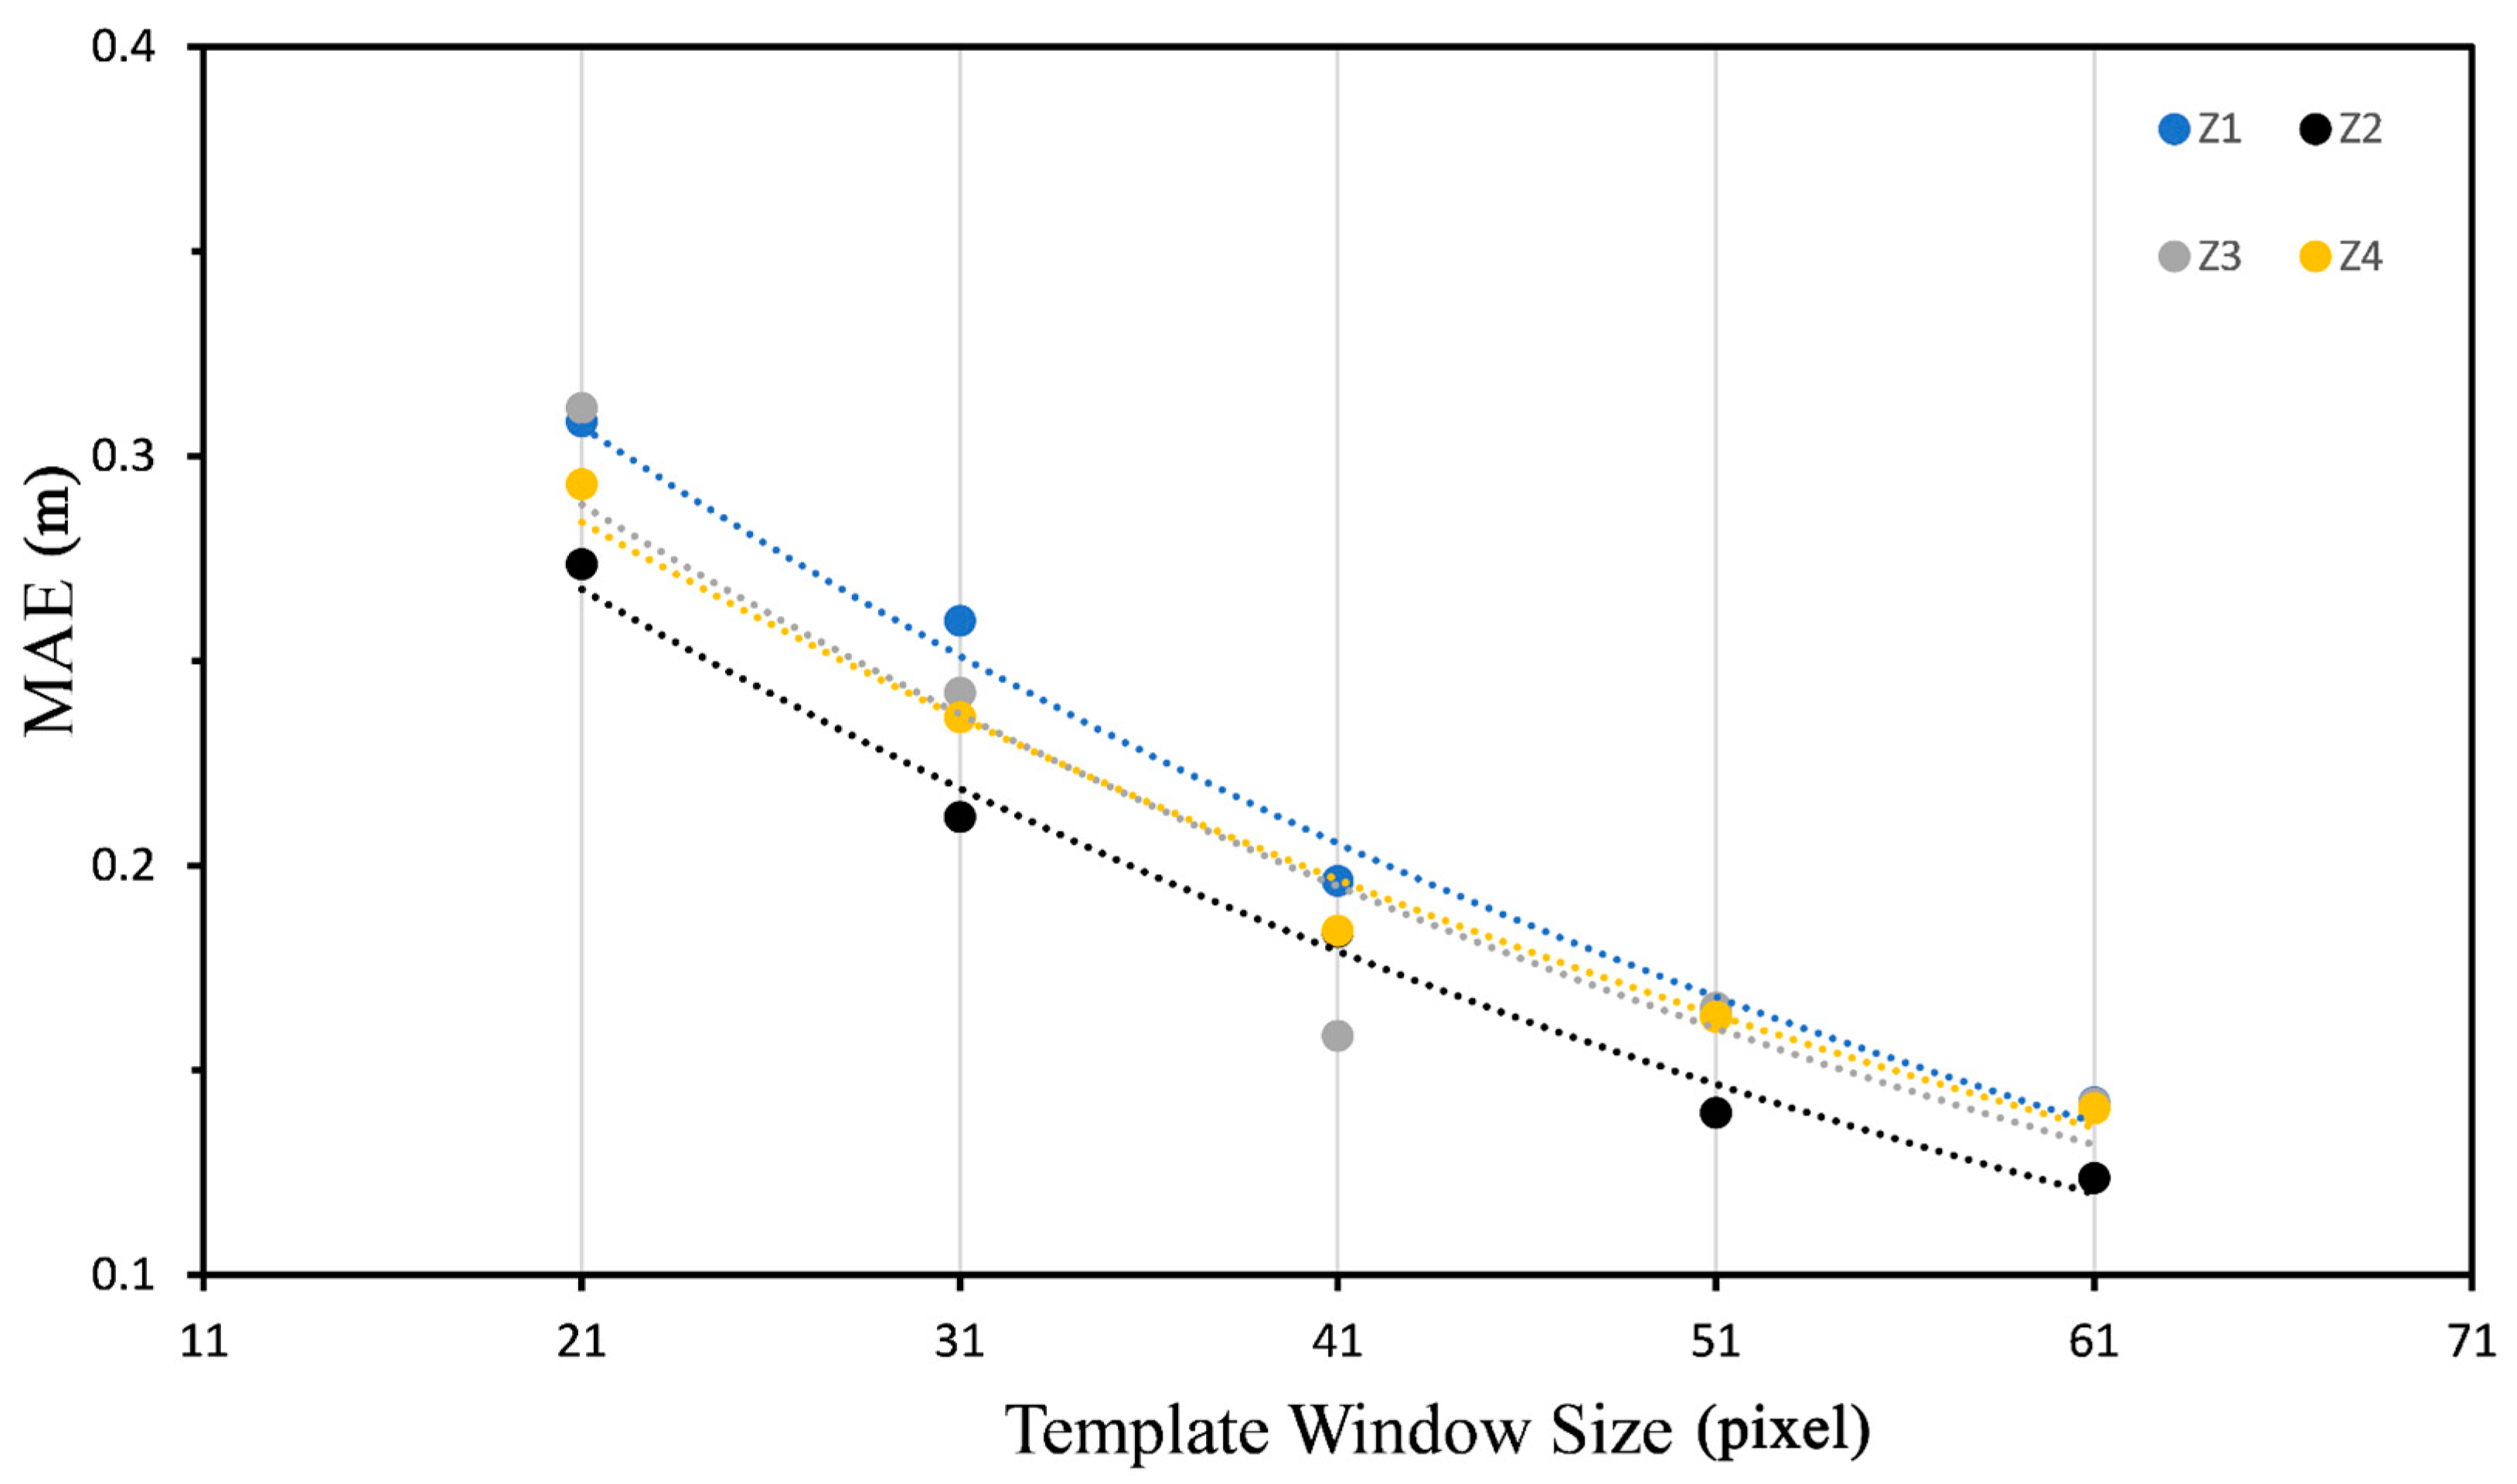
5.1. POT Results Using Different Optical Spectral Bands

We run the ImGRAFT for extracting the ground surface displacements using each spectral band (i.e., blue, green, red, and near-infrared) of the 16 image pairs (see Figure 4). Table 2 shows the averaged MAEs of the horizontal displacements of the four regions Z1~Z4 (see the black rectangles in Figure 5) in the far-field for each image pair, the image pair numbers correspond to the image pair sequence numbers in Figure 4. We did not calculate the MAEs for the blue band due to the high percentage of low cross-correlation coefficient areas. It can be seen that most of the image pairs have relatively lower MAEs in the near-infrared band results except for image pairs No. 2, No. 7, and No. 15. The averaged MAEs of the far-field displacements of all the image pairs for the green, red, and near-infrared bands are 0.33, 0.3, and 0.28, respectively. The blue band has the lowest accuracy, and its serious decoration makes it unable to calculate the MAEs.
As an example, Figure 5 shows the POT-derived surface displacement for the image pair 10 January 2022–15 January 2022 (image pair No. 2), whose far-field displacement MAEs are 0.23, 0.18, and 0.21 for the green (Figure 5b), red (Figure 5c), and near-infrared bands (Figure 5d), respectively. All the POT measurements have null values because of the low cross-correlation coefficient, while statistics show that the near-infrared band has the lowest percentage of null values (84.8%, 46.5%, 27%, and 26.7% for the blue, green, red, and near-infrared bands respectively). It can thus be inferred that the near-infrared band is the optimal band for POT-based surface deformation. The superiority of the near-infrared band is probably related to (1) the longer wavelength and (2) the relatively wider bandwidth of the near-infrared band. The longer wavelength allows the reflected signal to penetrate the Earth’s atmosphere more effectively and offers greater resistance to atmospheric artifacts, which has been documented by previous studies [32]. It could also be due to the fact that different bands have different bandwidths, which results in varying reflectance quality, especially in vegetated areas [20]. Increasing the bandwidth of the imaging sensor significantly increases reflectance [46]. In the case of Sentinel-2, the near-infrared band has the widest bandwidth compared to other red, green, and blue bands, probably making it have better imaging quality for extracting ground surface deformation.

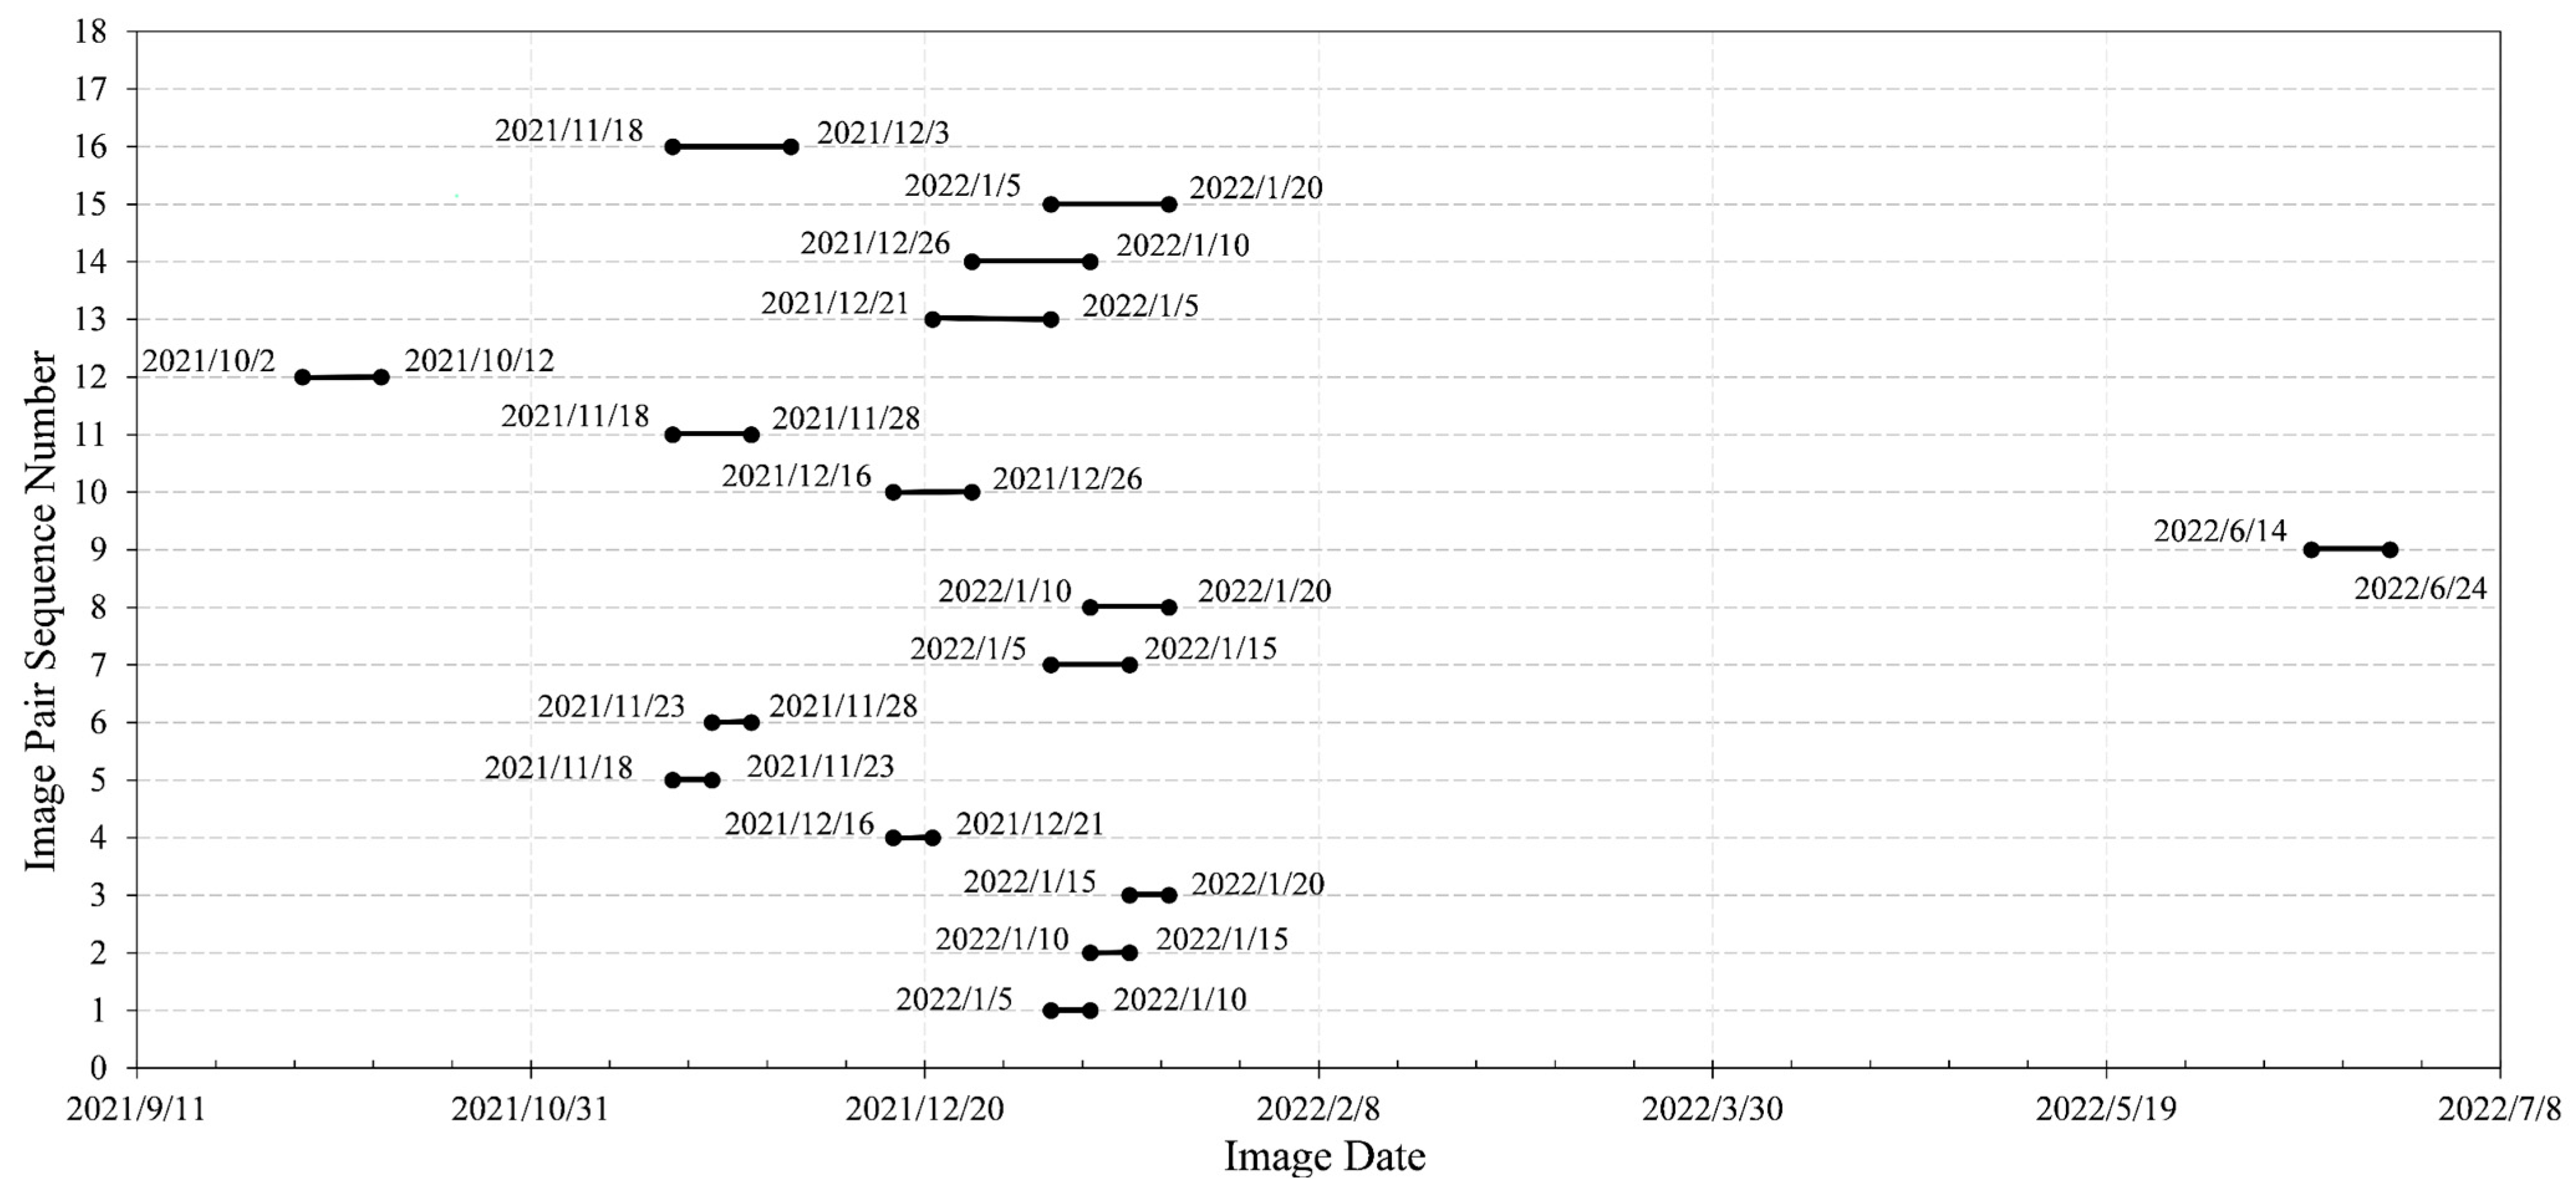
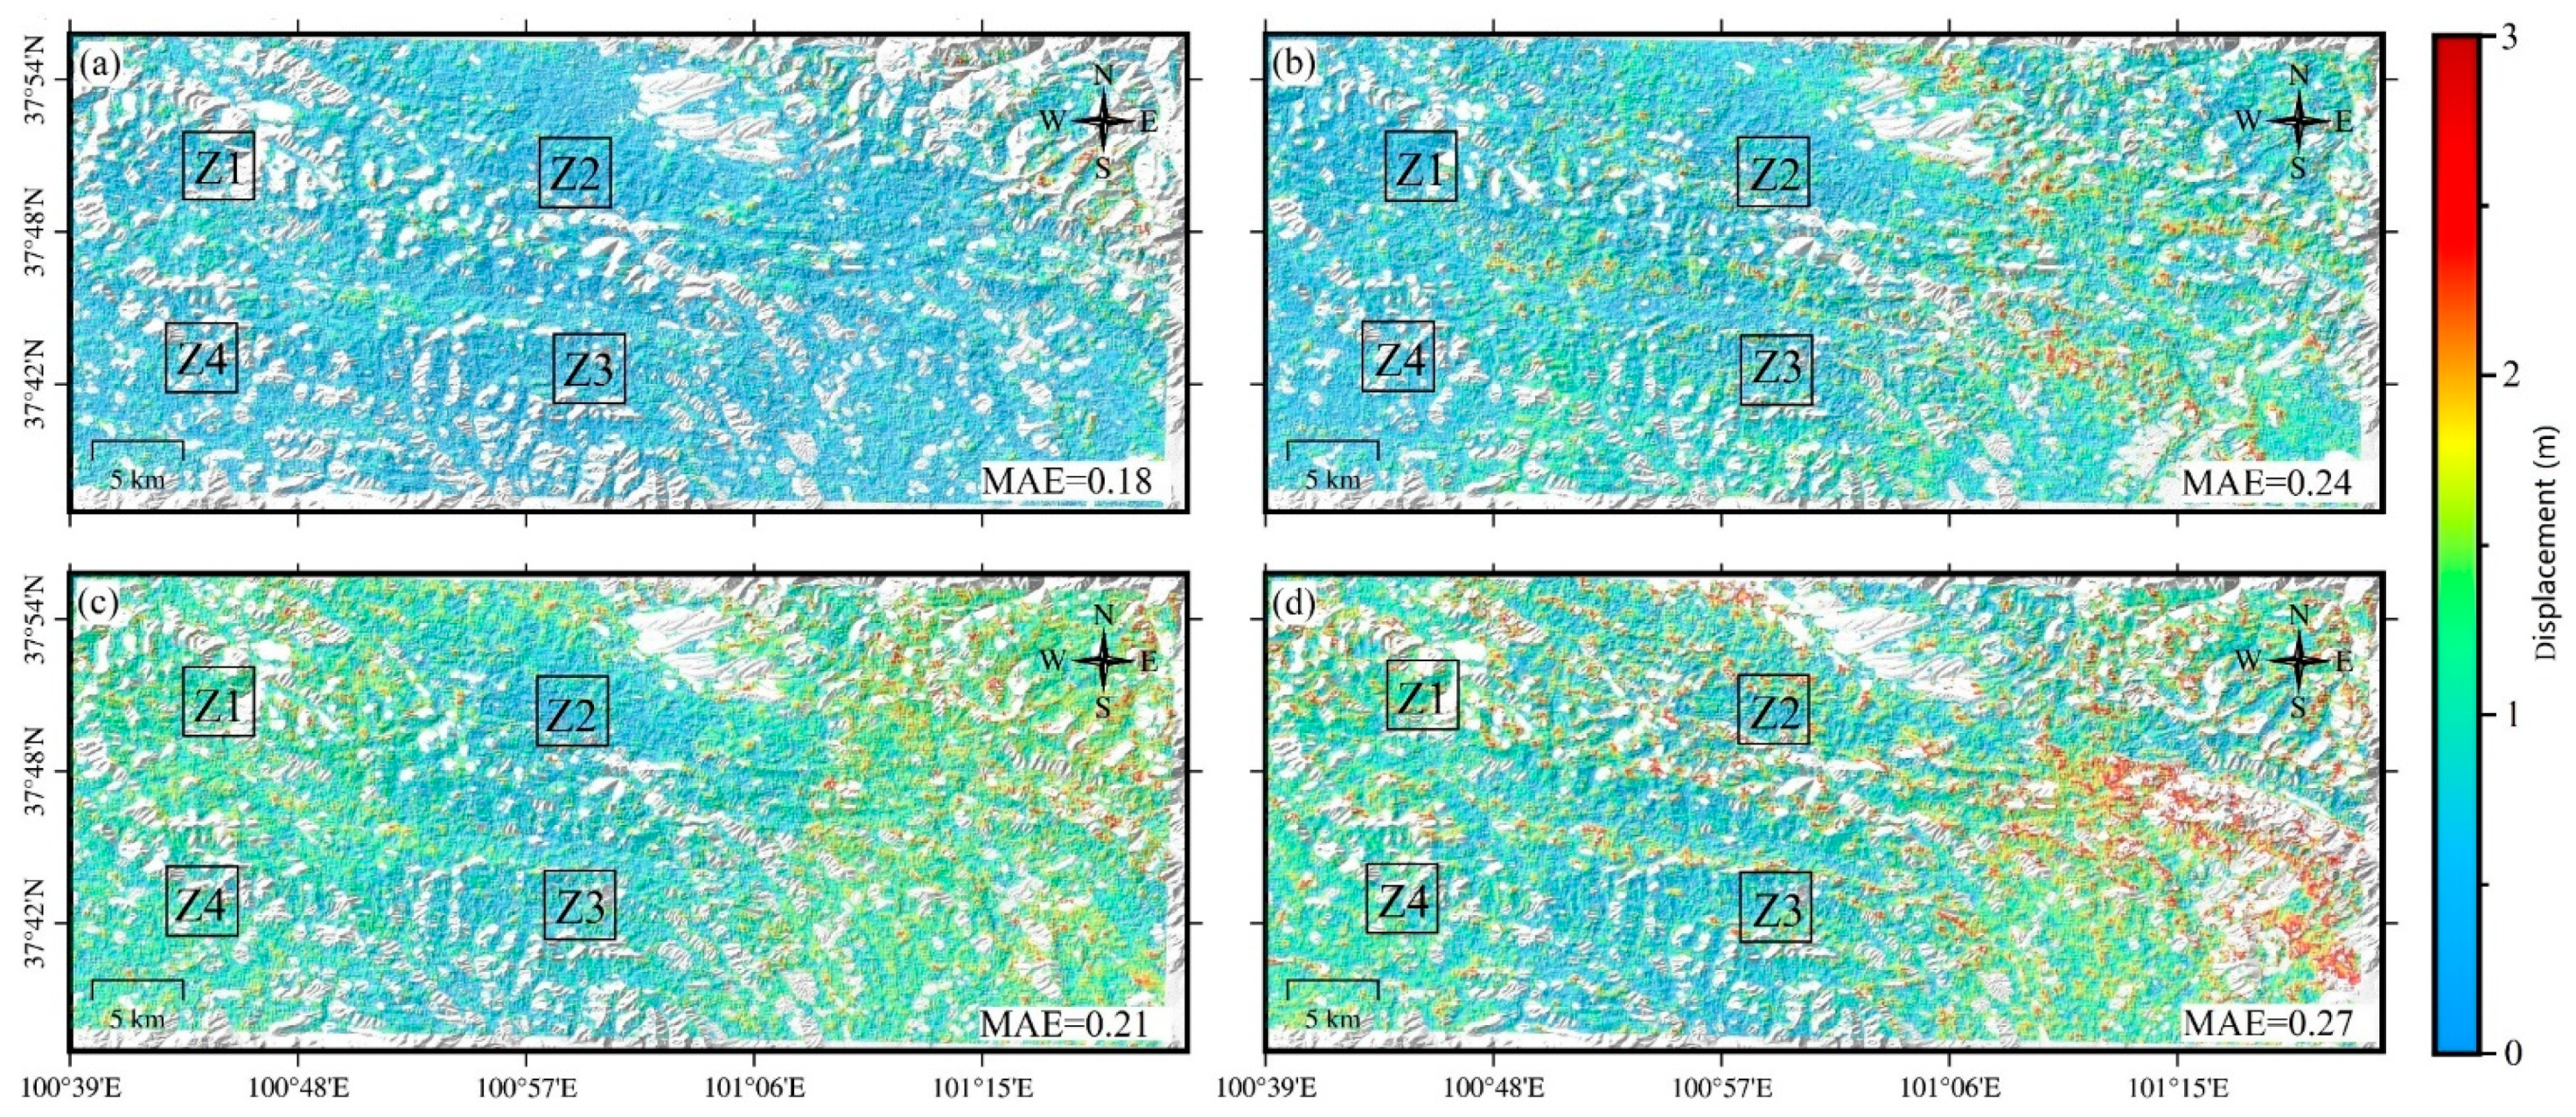
5.2. POT Results for the Different Image Pairs

To evaluate the influence of the image-pair time interval on the accuracy of POT measurements, we calculated the averaged MAEs of the near-infrared band POT measurements in the far-field region for three groups: 5 days, 10 days, and 15 days. Additionally, the image pairs were also divided into three groups based on the difference in solar zenith angle: [0.0°, 1.0°], (1.0°, 2.0°], and (2.0°, 4.0°], and the averaged MAEs of the far-field displacements were calculated for each group. Figure 6 shows the changes in averaged MAEs along with the image-pair time interval (Figure 6a) and the difference in solar zenith angle of image pairs (Figure 6b). The measurement error of POT is notably positively correlated with both the image-pair time interval and the difference in the solar zenith angle of image pairs. The maximum difference in the accuracy of near-infrared band POT measurements between image pairs with different image-pair time intervals (5 d and 15 d) is 30.30%. Moreover, the maximum difference in measurement accuracy for image pairs with different solar zenith angles ([0.0°, 1.0°] and (2.0°, 4.0°]) is 30.56%.
Figure 7 shows examples of the POT results derived from the near-infrared bands of four different image pairs. The four image pairs can be categorized into two control groups, that are pair No. 2 and No. 4 with evident difference in zenith angles but save time span, and the pair No. 1 and No. 3 with evident difference in time intervals but similar zenith angle.
Figure 7a,b depict the results of the image pair 10 January 2022–15 January 2022 (No. 2 in Table 2) and 16 December 2021–21 December 2021 (No. 4 in Table 2), respectively, which have both time intervals of 5 days. Pair No. 2 has a difference in solar zenith angle ( Z ) of 0.7, while image pair No. 4 has a Z of −0.2. It can be seen that the results of image pair No. 4 are coarser than that of pair No. 2. The averaged MAEs for the four far-filed regions for image pair No. 2 and No. 4 are 0.18 and 0.24, respectively. The relatively lower MAEs for image pair No. 2 indicate that the measurement accuracy for the image pair with a positive solar zenith angle is higher than that with a negative solar zenith angle. This is consistent with the theoretical analysis shown in Section 2.2.
Figure 7c,d show the POT results of image pairs of 15 January 2022–20 January 2022 (No. 3 in Table 2) and 21 December 2021–5 January 2022 (No. 13 in Table 2), respectively. While the difference in solar zenith angle ( Z ) is slightly larger for pair No. 3 compared to pair No. 13 (approximately 0.5), image pair No. 3 has a time interval of 5 days, whereas image pair No. 13 has a time span of 15 days. The calculated mean MAEs for the four far-filed regions for the image pair No. 3 and No. 13 are 0.21 and 0.27, respectively. The relatively lower MAE of the image pair No. 3 well demonstrated that the shorter time interval of the POT image pair, the higher the measurement accuracy would be achieved.

6. Discussion

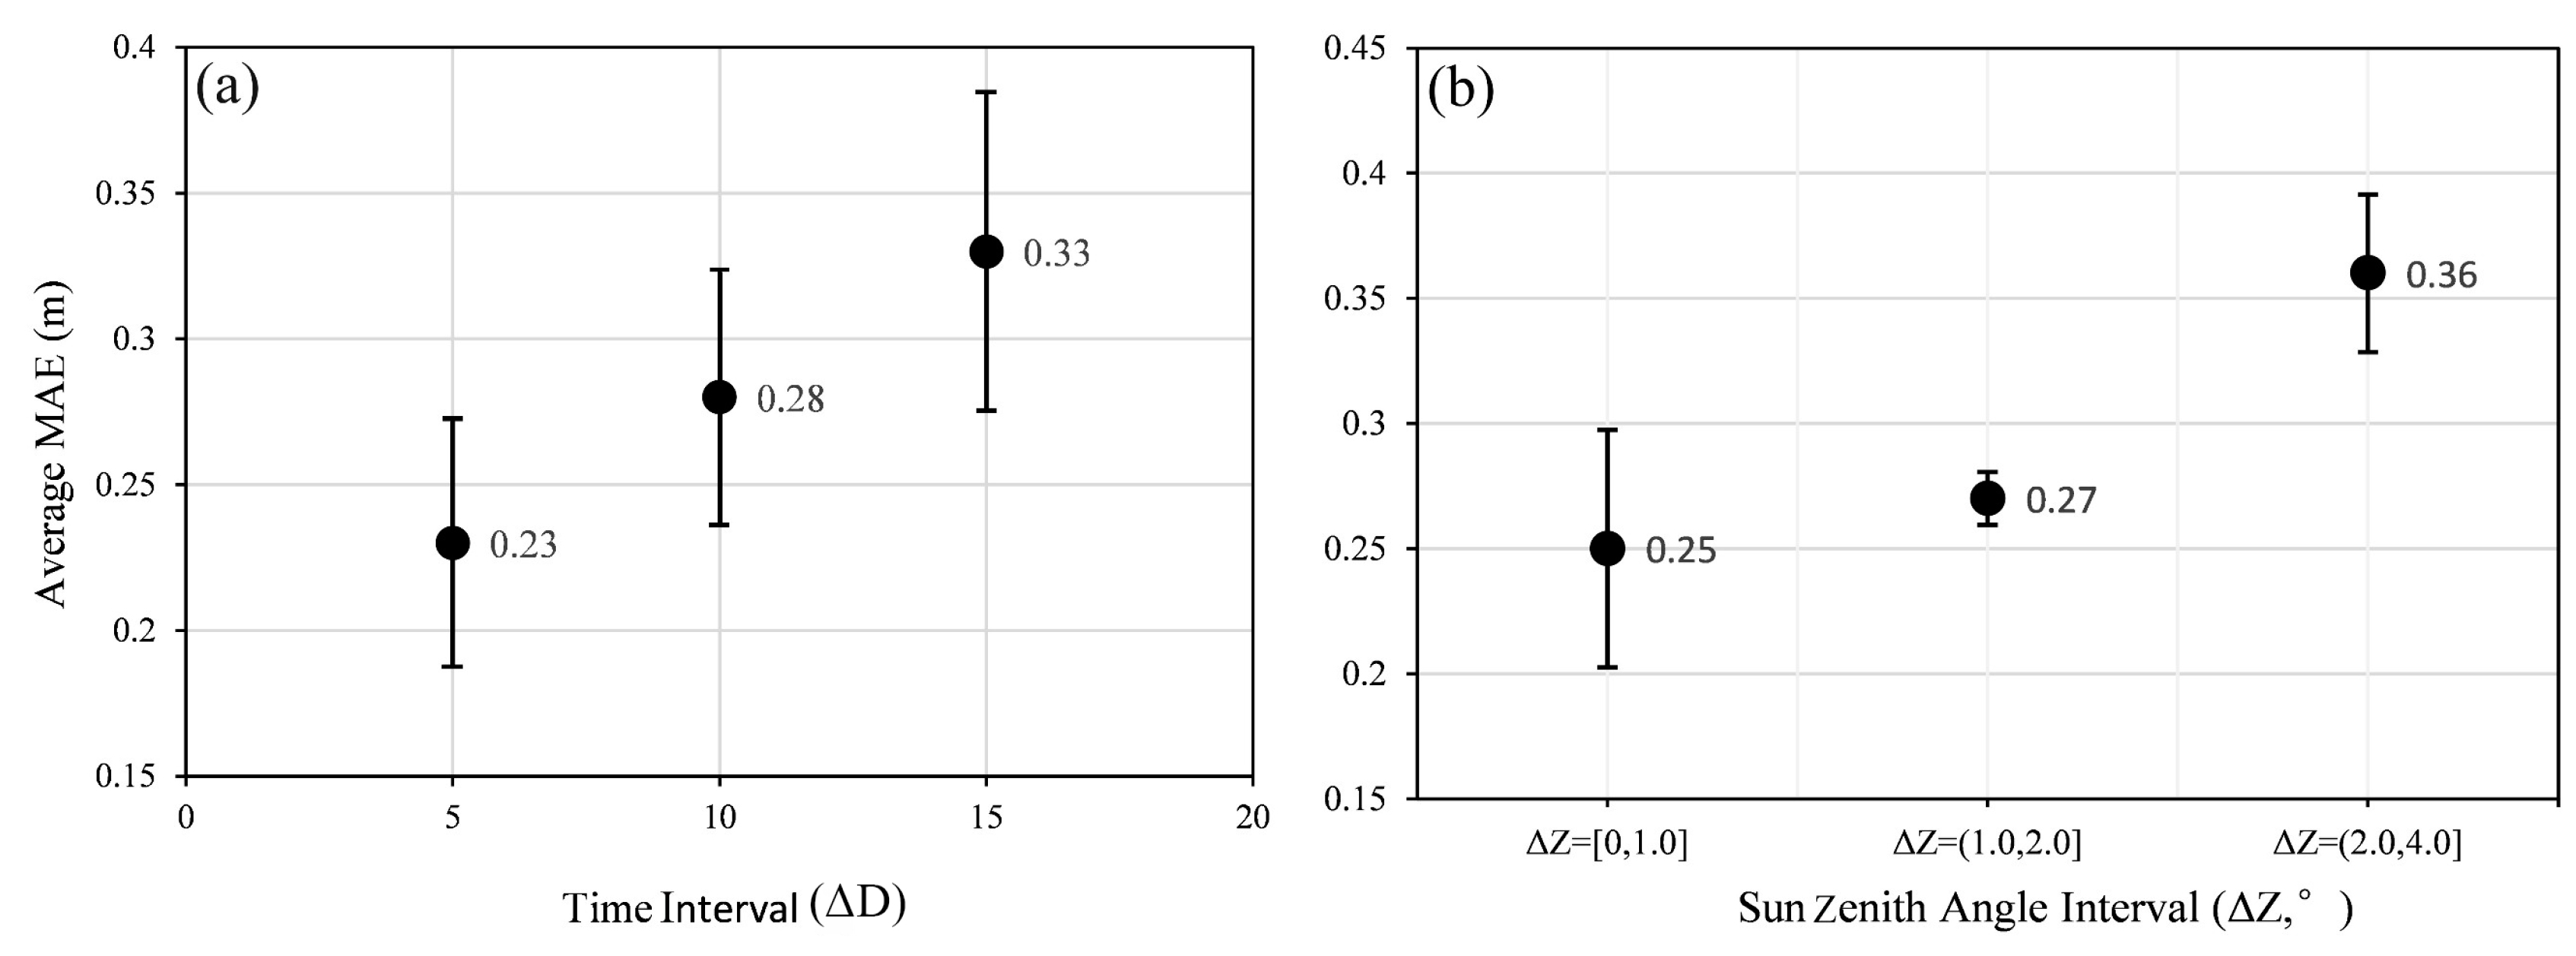
6.1. Strategy for Optimized POT Image Pair Selection

The POT results as shown in Section 5 demonstrate that the difference in solar zenith angle and the time interval of image pairs have apparent influences on the POT displacement measurement accuracy. To quantitively evaluate the impacts of these two factors on the POT results, we here use a multivariate linear regression model to link them to the displacement measurement accuracy of POT. Considering the independent influences of the two factors on POT results, we constructed the below regression model:
M A E = a × Z + b × D + c
where M A E represents the averaged Mean Absolute Error of the POT measurements of the four randomly selected regions Z1~Z4; Z represents the difference in solar zenith angle, D represents the image-pair time interval, and a and b are the scaling coefficients for the difference in solar zenith angle and the image-pair time interval, respectively; c represents a constant term.
As mentioned earlier in Section 2.2, the difference in solar zenith angle ( Z ) between image pairs can be either positive or negative, resulting in varying degrees of change in shadow length between images. Specifically, when Z is negative, the impact of shadows on the images relative to the reference image is increased, leading to an expected increase in error in the POT measurement results. According to the statistical data presented in Table 2, the averaged MAE of the near-infrared band POT results was 0.27 for image pairs with positive Z , which is 12.90% lower than that of image pairs with negative Z (0.31), aligning with theoretical predictions.
To provide a more accurate quantitative assessment of the influence of image pair data quality (image-pair time interval and zenith angle differences) on POT measurement accuracy, we divided the 16 image pairs into two groups based on the sign of the zenith angle differences ( Z ) and established multivariate regression models using Equation (4) to characterize the relationship between the image-pair time interval and zenith angle differences and the MAE of the optimal band (near-infrared) deformation results.
When Z is positive, the computed regression model is referred to as Model-A:
M A E b 8 = 0.037 × Z + 0.009 × D + 0.12
When Z is negative, the computed regression model is referred to as Model-B:
M A E b 8 = 0.03 × Z + 0.004 × D + 0.22
where Z represents the zenith angle differences, D represents the image-pair time interval, M A E b 8 represents the MAE and the coefficients of Z and D are their respective non-standardized coefficients. For Model-A, the corresponding R2 is 0.951, and the standardized coefficients for Z and D are 0.375 and 0.675, respectively. For Model-B, the corresponding R2 is 0.768, and the standardized coefficients for Z and D are 0.760 and 0.331, respectively. It can be observed that Model-A has a higher goodness of fit than Model-B, but both models have statistically significant levels of accuracy. Additionally, since larger standardized coefficients indicate a greater impact of the corresponding factor on the dependent variable, it can be inferred that when Z is positive, the image-pair time interval statistically has a greater impact on MAE compared to the zenith angle differences. Conversely, the zenith angle difference has a statistically higher impact on MAE than the image-pair time interval when Z is negative.
Using the regression models as presented above, given a list of available optical images, we can presumably select the optimal Sentinel-2 image pairs for extracting ground displacements using POT. Taking the image pairs shown in Figure 7 as examples, the predicted deformation extraction accuracy for image pair No. 2 (0.19) is higher than that of image pair No. 4 (0.25) given the image parameters using the Equations (5) and (6), which aligns with the actual computation results. We can also predict that the deformation extraction accuracy for pair No. 3 (0.20) is higher than that of pair No. 13 (0.27) using the Equation (5), which is consistent with the actual deformation computation results. The regression model can calculate the relative precision between candidate image pairs when we choose the optimal images, and then help determine the optimal image pairs for enhancing the efficiency and accuracy of surface displacements using POT with Sentinel-2 images.

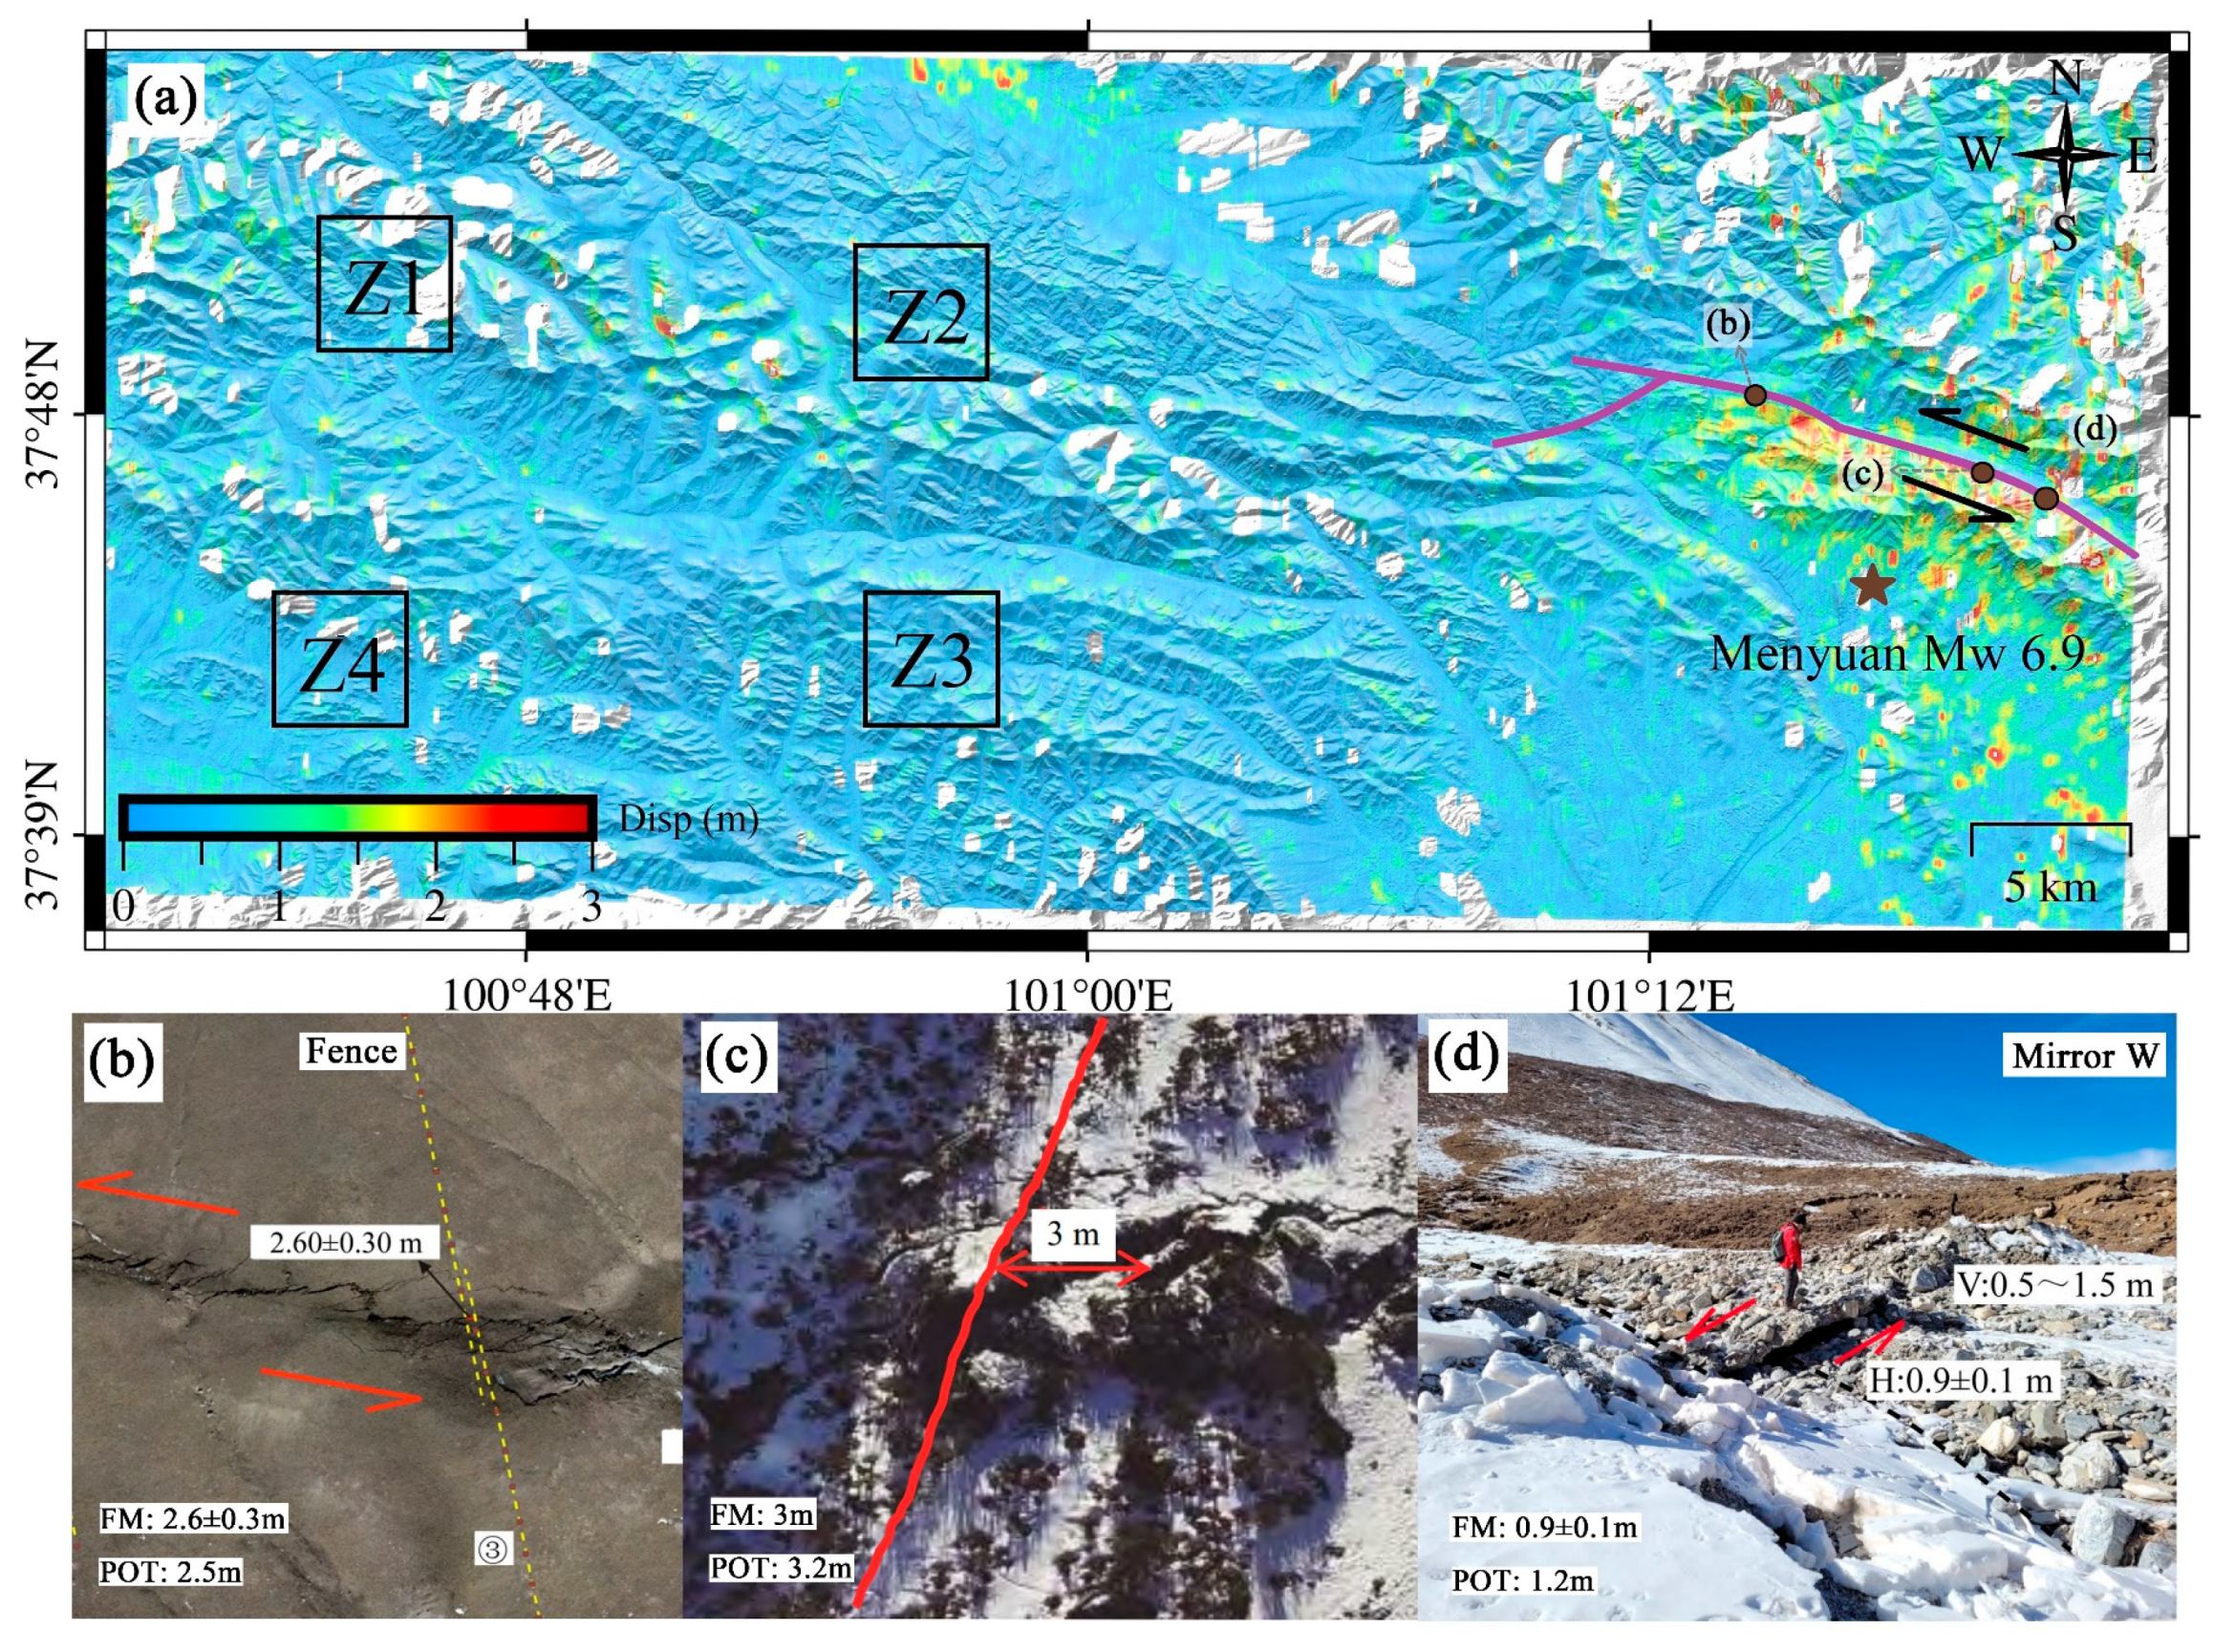
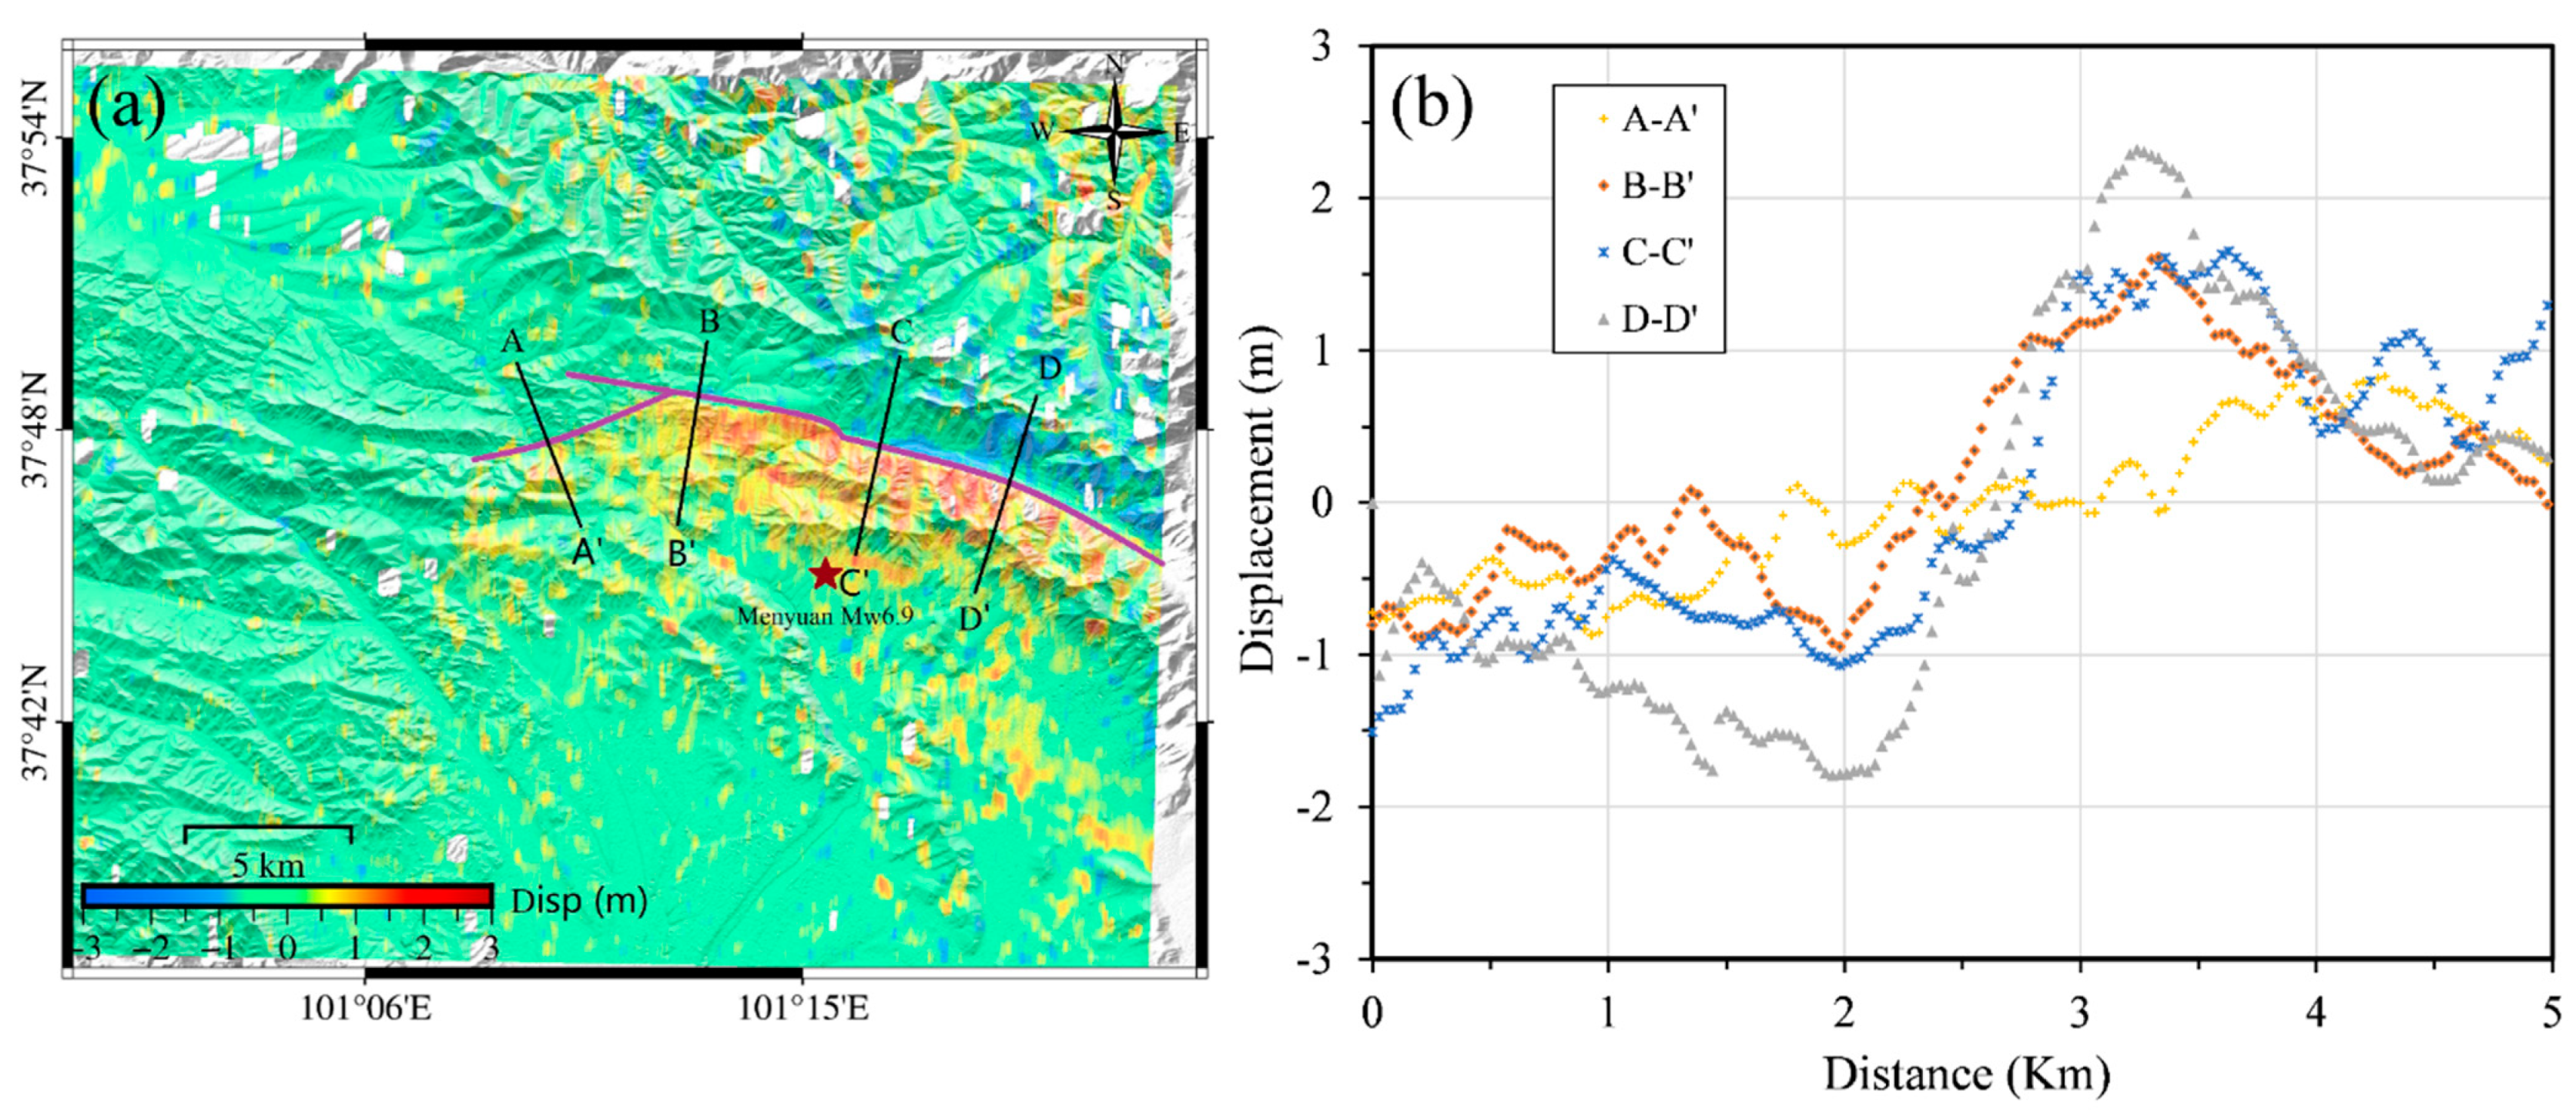
6.2. Co-Seismic Ground Deformation of the Menyuan Earthquake

From the statistics in Table 2, it can be seen that image pair 5 January 2022–10 January 2022 (No. 1) is the optimal image pair for mapping the co-seismic ground displacement of the Menyuan Earthquake using POT. Figure 8a shows the horizontal co-seismic deformation field derived from the POT processing of the near-infrared band of the optimal image pair. The purple lines depict the fault traces (Lenlongling fault) resulting from the earthquake, with the epicenter marked as the brown star. It can be observed that the ground displacement in the far-field appears smooth compared with the results from the other image pairs, such as those shown in Figure 7. The MAE in the stable region of the far field is approximately 0.18 m. Compared with the other three sets of co-seismic optical POT results of No. 7, No. 14, and No. 15, the measurement accuracies of POT have been improved by 32.26%, 43.75%, and 48.03%, respectively.
Figure 8a shows that the maximum horizontal displacement caused by the Mw 6.9 Menyuan earthquake in 2022 is 3.00 ± 0.51 m. The two black arrows indicate the main horizontal movement directions of the surface displacements, aligning along the NWW direction, which is consistent with the orientation of the Lenlongling fault [47]. The Lenglongling fault is the core area where the north-eastward compressional and extensional stress of the Qinghai-Tibet Plateau is transformed into south-eastward migration and escape. As the north-eastward thrusting of the Qinghai-Tibet Plateau continues, the Lenglongling fault exhibits significant physical property differences on the north and south sides, resulting in large differences in displacement and deformation between the two sides. In the southern region of the fault zone, the surface displacements mainly exhibit southeastward strike-slip motion, while the horizontal displacements in the northern region are not significantly prominent. This finding is consistent with the research on the dynamic mechanism of the Menyuan Mw 6.9 earthquake conducted by Zhao [48], who combined GPS data and precise leveling field data to analyze the stress structure of the Lenglongling Fault.
In order to further verify the POT results, we compared the co-seismic on-fault offset displacements measured from the POT with the field measurements (the FM value shown in Figure 8b–d) [22,23]. Over the three selected in-situ points (Points (a) (b) (c) in Figure 8a), the mean discrepancy between the field measurements and the POT results is only ±0.2 m. It thus can be concluded that the POT surface deformation measurement results of this study are consistent with the field measurements.
Given the sinistral strike-slip motion and nearly east-west alignment of the causative fault of the Menyuan earthquake (see Figure 8a), the co-seismic surface deformation in the north-south direction is not significant. Figure 9a presents the near-field ground displacement along the east-west direction derived from POT with the optimal image pair 5 January 2022–10 January 2022, in which the purple lines represent the fault traces. Figure 9b displays the variations of the ground displacements along the four cross-sections AA’~DD’ (Figure 9a). It can be observed that there are significant displacement variations on both sides of the fault. On the northern side of the fault, the dominant displacement is towards the west, with a maximum westward displacement of 1.79 ± 0.48 m. On the southern side of the fault, the dominant displacement is towards the east, with a maximum eastward displacement of 2.23 ± 0.44 m. These observation results are consistent with the maximum east-west displacement results (~2 m) extracted through a combination of InSAR and POT [26]. Considering the open-access availability of Sentinle-2 images, mapping ground deformation using POT with the optimal image pair would be useful to quickly assist the disaster assessment after the earthquake.

7. Conclusions

In this study, we took the 2022 Mw 6.9 Menyuan earthquake as an example to quantitatively evaluate the factors influencing the extraction of large gradient surface deformation using optical POT based on 15 Sentinel-2 images. By statistically analyzing the POT results measured from different spectral bands, the optimal spectral band and image pair for deformation extraction are determined. We found that the near-infrared band is the optimal spectral band for mapping ground displacements using POT and the blue band is the worst.
Our test results suggest that the displacement measurement accuracy of optical POT is closely related to the image-pair time interval and the solar zenith angle difference between image pairs. The MAEs of the POT measurements increase with the increase in the image-pair time interval and the solar zenith angle difference. Based on the optimal image pair No. 1 (5 January 2022–10 January 2022), the POT measurement accuracy is improved by 48.0% compared to the worst image pair No. 15 (5 January 2022–20 January 2022). By linking the far-field MAEs of the POT results to the solar zenith angle difference and time interval of the image pair, we then constructed two regression models to assess the expected displacement measurement accuracy of POT.
Based on the POT results with the optimal image pair determined by the regression model, the horizontal co-seismic deformation of the Menyuan earthquake is characterized. The POT measurements clearly show that the Menyuan earthquake occurred on a sinistral strike-slip fault, extending along nearly east-west direction at the southern end of the Changma-Obo fault. The earthquake-induced a maximum horizontal displacement of about 3.00 ± 0.51 m, with the dominant displacement occurring on the southern wall of the causative fault. The horizontal co-seismic deformation is mainly contributed by the east-west displacements, giving the nearly east-west strike of the fault. The maximum eastward and westward displacements measured from POT are about 2.23 ± 0.44 m and 1.79 ± 0.48 m, which is consistent with the results of previous studies that use optical POT to extract the maximum eastward and westward displacements (~2 m) of the Menyuan earthquake [25], the subtle differences in displacement may be attributed to the variations in the tools used. The results of this study confirm that the optimal selection strategy of massive optical data can effectively improve the accuracy of optical POT measurement for large gradient surface deformation, thus providing important references for rapid and high-precision extraction of surface deformations in major geological hazards.

Author Contributions

Conceptualization, S.W. and X.W.; Investigation, S.W., X.W., J.C. and G.L.; Methodology, S.W. and X.W.; Validation, S.W.; Writing—original draft, S.W., X.W., J.C. and G.L.; Writing—review and editing, S.W. and X.W.; Supervision, S.W. and X.W. All authors have read and agreed to the published version of the manuscript.

Funding

This work was supported by the National Natural Science Foundation of China under Grant No. (42071410, 42371458, 42171355, 52261074).

Data Availability Statement

Sentinel-2 data and Sen2cor are provided by the European Space Agency (ESA) https://scihub.copernicus.eu (accessed on 29 March 2022); The ImGRAFT toolbox is provided by Aslak Grinsted and Alexandra Messerli http://imgraft.glaciology.net (accessed on 20 February 2023).

Acknowledgments

We thank all editors and reviewers and for their valuable comments and suggestions for improving this manuscript.

Conflicts of Interest

The authors declare no conflict of interest.

References

  1. Hu, X.; Wang, T.; Liao, M. Measuring coseismic displacements with point-like targets offset tracking. IEEE Geosci. Remote Sens. Lett. 2013, 11, 283–287. [Google Scholar] [CrossRef]
  2. Zhang, D.; Yang, W.; Xu, C.; Ye, T.; Liu, Q. Extracting deforming landslides from time-series Sentinel-2 imagery. Landslides 2022, 19, 2761–2774. [Google Scholar] [CrossRef]
  3. Li, S.; Leinss, S.; Hajnsek, I. Cross-correlation stacking for robust offset tracking using SAR image time-series. IEEE J. Sel. Top. Appl. Earth Obs. Remote Sens. 2021, 14, 4765–4778. [Google Scholar] [CrossRef]
  4. Huang, L.; Li, Z. Comparison of SAR and optical data in deriving glacier velocity with feature tracking. Int. J. Remote Sens. 2011, 32, 2681–2698. [Google Scholar] [CrossRef]
  5. Zhang, K.; Gan, W.; Liang, S.; Xiao, G.; Dai, C.; Wang, Y.; Li, Z.; Zhang, L.; Ma, G. Coseismic displacement and slip distribution of the 2021 May 21, Ms 6.4, Yangbi Earthquake derived from GNSS observations. Chin. J. Geophys. 2021, 64, 2253–2266. [Google Scholar]
  6. Métivier, L.; Collilieux, X.; Lercier, D.; Altamimi, Z.; Beauducel, F. Global coseismic deformations, GNSS time series analysis, and earthquake scaling laws. J. Geophys. Res. Solid Earth 2014, 119, 9095–9109. [Google Scholar] [CrossRef]
  7. Xu, X.; Sandwell, D.T.; Smith-Konter, B. Coseismic displacements and surface fractures from Sentinel-1 InSAR: 2019 Ridgecrest earthquakes. Seismol. Res. Lett. 2020, 91, 1979–1985. [Google Scholar] [CrossRef]
  8. Hu, J.; Li, Z.; Ding, X.; Zhu, J.; Zhang, L.; Sun, Q. 3D coseismic displacement of 2010 Darfield, New Zealand earthquake estimated from multi-aperture InSAR and D-InSAR measurements. J. Geod. 2012, 86, 1029–1041. [Google Scholar] [CrossRef]
  9. Provost, F.; Van der Woerd, J.; Malet, J.-P.; Maggi, A.; Klinger, Y.; Michéa, D.; Pointal, E.; Pacini, F. Mapping the ruptures of the Mw7. 8 and Mw7. 7 Turkey-Syria Earthquakes using optical offset tracking with Sentinel-2 images. In Proceedings of the Copernicus Meetings, Vienna, Austria, 23–28 April 2023. [Google Scholar]
  10. Walter, T.R.; Legrand, D.; Granados, H.D.; Reyes, G.; Arámbula, R. Volcanic eruption monitoring by thermal image correlation: Pixel offsets show episodic dome growth of the Colima Volcano. J. Geophys. Res. Solid Earth 2013, 118, 1408–1419. [Google Scholar] [CrossRef]
  11. Mouginot, J.; Rabatel, A.; Ducasse, E.; Millan, R. Optimization of cross correlation algorithm for annual mapping of alpine glacier flow velocities; application to Sentinel-2. IEEE Trans. Geosci. Remote Sens. 2023, 61, 4300512. [Google Scholar] [CrossRef]
  12. Zhang, X.Y. Ice Avalanche Deformation Monitoring Based on Optical Remote Sensing Image Correlation Technology. Master’s Thesis, Southwest Jiaotong University, Chengdu, China, 2021. [Google Scholar]
  13. Bontemps, N.; Lacroix, P.; Doin, M.-P. Inversion of deformation fields time-series from optical images, and application to the long term kinematics of slow-moving landslides in Peru. Remote Sens. Environ. 2018, 210, 144–158. [Google Scholar] [CrossRef]
  14. He, L.J.; Feng, G.C.; Feng, G.X.; Gao, H. Coseismic displacements of 2016 Mw7.8 Kaikoura, New Zealand Earthquake, using Sentinel-2 optical images. J. Geod. Geoinf. Sci. 2019, 48, 339–351. [Google Scholar]
  15. Flood, N.; Danaher, T.; Gill, T.; Gillingham, S. An operational scheme for deriving standardised surface reflectance from Landsat TM/ETM+ and SPOT HRG imagery for Eastern Australia. Remote Sens. 2013, 5, 83–109. [Google Scholar] [CrossRef]
  16. Ding, C.; Zhang, L.; Liao, M.; Feng, G.; Dong, J.; Ao, M.; Yu, Y. Quantifying the spatio-temporal patterns of dune migration near Minqin Oasis in northwestern China with time series of Landsat-8 and Sentinel-2 observations. Remote Sens. Environ. 2020, 236, 111498. [Google Scholar] [CrossRef]
  17. Fahnestock, M.; Scambos, T.; Moon, T.; Gardner, A.; Haran, T.; Klinger, M. Rapid large-area mapping of ice flow using Landsat 8. Remote Sens. Environ. 2016, 185, 84–94. [Google Scholar] [CrossRef]
  18. Ali, E.; Xu, W.; Ding, X. Improved optical image matching time series inversion approach for monitoring dune migration in North Sinai Sand Sea: Algorithm procedure, application, and validation. ISPRS J. Photogramm. Remote Sens. 2020, 164, 106–124. [Google Scholar] [CrossRef]
  19. Feng, Z.; Feng, G.; Chen, H.; Xu, W.; Li, Z.; He, L.; Ren, Z. A block ramp errors correction method of Planet subpixel offset: Application to the 2018 Mw 7.5 Palu earthquake, Indonesia. IEEE Access 2019, 7, 174924–174931. [Google Scholar] [CrossRef]
  20. Drusch, M.; Del Dello, U.; Meygret, A.; Spoto, F.; Sy, O.; Marchese, F. Sentinel-2: ESA’s optical high-resolution mission for GMES operational services. Remote Sens. Environ. 2012, 120, 25–36. [Google Scholar] [CrossRef]
  21. Zhang, Y.; Chen, J.; Gong, W.; Han, N.; Liu, Y.; Shan, X. Geodetic modelling of the 2022 M w 6.6 Menyuan earthquake: Insight into the strain-partitioned northern Qilian Shan fault system and implications for regional tectonics and seismic hazards. Geophys. J. Int. 2023, 233, 1987–2003. [Google Scholar] [CrossRef]
  22. Zhang, Y.F.; Yuan, K.; Zhou, W.J.; Fan, J.W. Study on structural deformation characteristics and surface crack distribution of girder tunnel across Lenglongling fault caused by Menyuan earthquak. Chin. J. Rock Mech. Eng. 2023, 42, 1055–1069. [Google Scholar] [CrossRef]
  23. Yuan, D.Y.; Xie, H.; Su, R.H.; Li, Z.M.; Wen, Y.M.; Si, G.J.; Xue, S.Y.; Cheng, G.; Liu, B.X.; Liang, S.M.; et al. Characteristics of co-seismic surface rupture zone of Menyuan Ms6.9 earthquake in Qinghai Province on January 8, 2022 and seismogenic mechanism. Chin. J. Geophys. 2023, 66, 229–244. [Google Scholar]
  24. Han, N.; Zhang, G.; Shan, X.; Zhang, Y.; Hetland, E.; Qu, C.; Gong, W.; Sun, G.; Li, C.; Fan, X. Coseismic Surface Horizontal Deformation of the 2022 M w 6.6 Menyuan, Qinghai, China, Earthquake from Optical Pixel Correlation of GF-7 Stereo Satellite Images; Seismological Society of America: Albany, CA, USA, 2023. [Google Scholar]
  25. Zhang, C.L.; Li, Z.H.; Zhang, S.C.; Wang, J.W.; Zhan, J.W.; Li, X.L.; Liu, Z.J.; Du, J.T.; Cheng, B.; Meng, L.E. Surface ruptures of the 2022 Mw6.7 Menyuan Earthquake revealed by integrated remote sensing. Geomat. Inf. Sci. Wuhan Univ. 2022, 47, 1257–1270. [Google Scholar] [CrossRef]
  26. Liu, D.K. Design of Fast Template Matching Algorithm Based on Hartley. Master’s Thesis, Huazhong University of Science and Technology, Wuhan, China, 2011. [Google Scholar]
  27. Scambos, T.A.; Dutkiewicz, M.J.; Wilson, J.C.; Bindschadler, R.A. Application of image cross-correlation to the measurement of glacier velocity using satellite image data. Remote Sens. Environ. 1992, 42, 177–186. [Google Scholar] [CrossRef]
  28. Fitch, A.; Kadyrov, A.; Christmas, W.J.; Kittler, J. Orientation correlation. In Proceedings of the BMVC, Cardiff, UK, 2–5 September 2002; pp. 1–10. [Google Scholar]
  29. Wereley, S.; Gui, L. A correlation-based central difference image correction (CDIC) method and application in a four-roll mill flow PIV measurement. Exp. Fluids 2003, 34, 42–51. [Google Scholar] [CrossRef]
  30. Ghani, H.A.; Malek, M.R.A.; Azmi, M.F.K.; Muril, M.J.; Azizan, A. A review on sparse Fast Fourier Transform applications in image processing. Int. J. Electr. Comput. Eng. 2020, 10, 2088–8708. [Google Scholar] [CrossRef]
  31. Qiu, X.F.; Zeng, Y.; Liu, S.M. Distributed modeling of extraterrestrial solar radiation over rugged terrain. Chin. J. Geophys. 2005, 48, 1100–1107. [Google Scholar] [CrossRef]
  32. He, G.J.; Cheng, G.; He, X.Y.; Wang, W.; Liu, D.S. Extracting distribution information of different heights in a city from the shadows in a panchromatic SPOT image. J. Image Graph. 2001, 6, 19–22+104. [Google Scholar]
  33. Ranson, K.; Daughtry, C.; Biehl, L.; Bauer, M. Sun-view angle effects on reflectance factors of corn canopies. Remote Sens. Environ. 1985, 18, 147–161. [Google Scholar] [CrossRef]
  34. Lord, D.; Desjardins, R.L.; Dubé, P.A. Sun-angle effects on the red and near infrared reflectances of five different crop canopies. Can. J. Remote Sens. 1988, 14, 46–55. [Google Scholar] [CrossRef]
  35. Tang, D.W.; Ge, W.P.; Yuan, D.Y.; Zheng, W.J.; Hu, C.B. Triggering effect of historical earthquakes in the northern Tibetan Plateau on the Coulomb stress of the 2022 Menyuan Ms6.9 earthquake and subsequent earthquakes. Chin. J. Geophys. 2023, 66, 2772–2795. [Google Scholar]
  36. Zhang, M.; Gao, H.; Niu, Y.F.; Qu, F.F.; Wan, H.L.; Zhang, W. Coseismic deformation focal mechanisms inversion for 2016 Menyuan Earthquake by DInSAR observation. Prog. Geophys. 2017, 32, 1089–1094. [Google Scholar]
  37. Li, Z.M.; Gai, H.L.; Li, X.; Yuan, D.Y.; Xie, H.; Jiang, W.L.; Li, Y.S.; Su, Q. Seismogenic fault coseismic surface deformation of the Menyuan Ms6.9 Earthquake in Qinghai, China. Acta Geol. Sin. 2022, 96, 330–335. [Google Scholar]
  38. Liu, J.; Hu, J.; Li, Z.; Ma, Z.; Shi, J.; Xu, W.; Sun, Q. Three-dimensional surface displacements of the 8 January 2022 Mw6. 7 Menyuan earthquake, China from Sentinel-1 and AlOS-2 SAR observations. Remote Sens. 2022, 14, 1404. [Google Scholar] [CrossRef]
  39. Tian, Y.; Cheng, Z.Q.; Hui, F.M.; Cheng, X.; Oyang, L.X. ESA Sentinel-2A/B satellite: Characteristics and applications. J. Beijing Norm. Univ. Nat. Sci. 2019, 55, 57–65. [Google Scholar] [CrossRef]
  40. Altena, B.; Kääb, A. Ensemble matching of repeat satellite images applied to measure fast-changing ice flow, verified with mountain climber trajectories on Khumbu icefall, Mount Everest. J. Glaciol. 2020, 66, 905–915. [Google Scholar] [CrossRef]
  41. Provost, F.; Michéa, D.; Malet, J.-P.; Boissier, E.; Pointal, E.; Stumpf, A.; Pacini, F.; Doin, M.-P.; Lacroix, P.; Proy, C. Terrain deformation measurements from optical satellite imagery: The MPIC-OPT processing services for geohazards monitoring. Remote Sens. Environ. 2022, 274, 112949. [Google Scholar] [CrossRef]
  42. Stumpf, A.; Michéa, D.; Malet, J.-P. Improved co-registration of Sentinel-2 and Landsat-8 imagery for Earth surface motion measurements. Remote Sens. 2018, 10, 160. [Google Scholar] [CrossRef]
  43. Zhang, J.; He, P.; Hu, X.; Liu, Z. Dynamic Lake Ice movement on Lake khovsgol, Mongolia, revealed by time series displacements from pixel offset with Sentinel-2 optical images. Remote Sens. 2021, 13, 4979. [Google Scholar] [CrossRef]
  44. Messerli, A.; Grinsted, A. Image georectification and feature tracking toolbox: ImGRAFT. Geosci. Instrum. Methods Data Syst. 2015, 4, 23–34. [Google Scholar] [CrossRef]
  45. Cai, J.; Zhang, L.; Dong, J.; Wang, C.; Liao, M. Polarimetric SAR pixel offset tracking for large-gradient landslide displacement mapping. Int. J. Appl. Earth Obs. Geoinf. 2022, 112, 102867. [Google Scholar] [CrossRef]
  46. Cao, Z.; Ma, R.; Duan, H.; Xue, K. Effects of broad bandwidth on the remote sensing of inland waters: Implications for high spatial resolution satellite data applications. ISPRS J. Photogramm. Remote Sens. 2019, 153, 110–122. [Google Scholar] [CrossRef]
  47. Meyer, B.; Tapponnier, P.; Bourjot, L.; Metivier, F.; Gaudemer, Y.; Peltzer, G.; Shunmin, G.; Zhitai, C. Crustal thickening in Gansu-Qinghai, lithospheric mantle subduction, and oblique, strike-slip controlled growth of the Tibet plateau. Geophys. J. Int. 1998, 135, 1–47. [Google Scholar] [CrossRef]
  48. Zhao, L.Q.; Sun, X.Y.; Zhan, Y.; Yang, H.B.; Wang, Q.L.; Hao, M.; Liu, X.H. The seismogenic model of the Menyuan Ms6.9 Earthquake on January8, 2022, Qinghai Province and segmented extensional characteristics of the Lenglongling Fault. Chin. J. Geophys. 2022, 65, 1536–1546. [Google Scholar]
Figure 1. Diagram of solar and satellite imaging geometries. (a) The geometric relationship between the solar zenith angle; β is the solar altitude angle, γ is the solar zenith angle, and α is the solar azimuth angle. (b) Schematic diagram of imaging the sun, satellite, and object; h is the altitude of the object, θ is the satellite altitude angle, S is the actual object imaging shadow length.
Remotesensing 15 04735 g001
Figure 2. Overview of the study area of the 2022 Ms6.9 Qinghai Menyuan earthquake.
Remotesensing 15 04735 g002
Figure 3. Variations of MAEs along with the sizes of correlation template window and for image pair No.1 (5 January 2022–10 January 2022).
Remotesensing 15 04735 g003
Figure 4. The distribution of acquisition dates for the Sentinel-2 image pairs.
Remotesensing 15 04735 g004
Figure 5. POT results for each band of the image pair No. 2 (10 January 2022–15 January 2022). (a) Blue band. (b) Green band. (c) Red band. (d) Near-infrared band.
Remotesensing 15 04735 g005
Figure 6. Changes in far-field MAE for different groups of POT measurements. (a) Effect of image-pair time interval on MAE. (b) Effect of difference in solar zenith angle on MAE.
Remotesensing 15 04735 g006
Figure 7. Comparison of POT Deformation Extraction Results of Different Parameter Image Pairs. (a) Results of image pair No. 2. (b) Results of image pair No. 4. (c) Results of image pair No. 3. (d) Results of image pair No. 13.
Remotesensing 15 04735 g007
Figure 8. Co-seismic displacements of the Menyuan earthquake mapped from the optimal POT image pair and filed investigations. (a) POT derived horizontal displacement with the near-infrared band of the image pair 5 January 2022–10 January 2022 (No. 1 in Table 2). (bd) Field measurements of the earthquake-induced fault offset at the points annotated in (a).
Remotesensing 15 04735 g008
Figure 9. (a) East-west ground deformation derived from POT with the near-infrared band of the optimized image pair 5 January 2022–10 January 2022 (No. 1 in Table 2). (b) The displacement along the four profiles AA’, BB’, CC’, and DD’ in (a).
Remotesensing 15 04735 g009
Table 1. The Sentinel-2 data parameters used in this study.
NumberDateMean Solar Zenith Angle (Z, °)Mean Solar Azimuth Angle (A, °)
12021/10/0242.6162.0
22021/10/1246.1164.3
32021/11/1858.1164.9
42021/11/2359.3164.9
52021/11/2860.3164.7
62021/12/0361.1164.4
72021/12/1662.1165.8
82021/12/2162.3165.2
92021/12/2662.4164.5
102022/01/0561.9163.1
112022/01/1061.4162.4
122022/01/1560.7161.7
132022/01/2059.9161.0
142022/06/1419.0134.0
152022/06/2419.2132.5
Table 2. Statistical Results of the MAE for Each Image Pair.
MAE
Image Pair No.Difference in Solar Zenith Angle ( Z , °)Time Interval ( D )GreenRedNIR Infrared
10.550.210.180.18
20.750.230.180.21
30.950.220.210.21
4−0.250.300.260.24
5−1.250.330.310.29
6−1.050.300.290.27
71.2100.250.240.26
81.5100.270.260.27
9−0.2100.360.360.27
10−0.3100.380.350.28
11−2.6100.360.340.34
12−3.6100.400.430.37
130.4150.370.270.27
141.0150.490.340.32
152.1150.350.330.34
16−3.0150.450.450.40
Disclaimer/Publisher’s Note: The statements, opinions and data contained in all publications are solely those of the individual author(s) and contributor(s) and not of MDPI and/or the editor(s). MDPI and/or the editor(s) disclaim responsibility for any injury to people or property resulting from any ideas, methods, instructions or products referred to in the content.

