

Method for Determining Coastline Course Based on Low-Altitude Images Taken by a UAV

1
Department of Navigation and Hydrography, Polish Naval Academy, Śmidowicza 69, 81-127 Gdynia, Poland
2
Department of Transport and Logistics, Gdynia Maritime University, Morska 81-87, 81-225 Gdynia, Poland
*
Author to whom correspondence should be addressed.
Remote Sens. 2023, 15(19), 4700; https://doi.org/10.3390/rs15194700
Submission received: 7 August 2023
/
Revised: 20 September 2023
/
Accepted: 23 September 2023
/
Published: 25 September 2023
(This article belongs to the Special Issue Monitoring Coastal and Marine Environments Based on Remote Sensing Data)
Abstract
:In recent years, the most popular methods for determining coastline course are geodetic, satellite, and tacheometric techniques. None of the above-mentioned measurement methods allows marking out the shoreline both in an accurate way and with high coverage of the terrain with surveys. For this reason, intensive works are currently underway to find alternative solutions that could accurately, extensively, and quickly determine coastline course. Based on a review of the literature regarding shoreline measurements, it can be concluded that the photogrammetric method, based on low-altitude images taken by an Unmanned Aerial Vehicle (UAV), has the greatest potential. The aim of this publication is to present and validate a method for determining coastline course based on low-altitude photos taken by a drone. Shoreline measurements were carried out using the DJI Matrice 300 RTK UAV in the coastal zone at the public beach in Gdynia (Poland) in 2023. In addition, the coastline course was marked out using high-resolution satellite imagery (0.3–0.5 m). In order to calculate the accuracy of determining the shoreline by photogrammetric and satellite methods, it was decided to relate them to the coastline marked out using a Global Navigation Satellite System (GNSS) Real Time Kinematic (RTK) receiver with an accuracy of 2.4 cm Distance Root Mean Square (DRMS). Studies have shown that accuracies of determining coastline course using a UAV are 0.47 m (p = 0.95) for the orthophotomosaic method and 0.70 m (p = 0.95) for the Digital Surface Model (DSM), and are much more accurate than the satellite method, which amounted to 6.37 m (p = 0.95) for the Pléiades Neo satellite and 9.24 m (p = 0.95) for the Hexagon Europe satellite. Based on the obtained test results, it can be stated that the photogrammetric method using a UAV meets the accuracy requirements laid down for the most stringent International Hydrographic Organization (IHO) order, i.e., Exclusive Order (Total Horizontal Uncertainty (THU) of 5 m with a confidence level of 95%), which they relate to coastline measurements.
1. Introduction
The coastline is the line of contact between the land surface and the water surface in a reservoir or watercourse [1]. This boundary is characterised by instability, functional diversity, and depends on the region of occurrence [2]. The coastal zone is of particular importance from the point of view of the ecological and economic policy of coastal states, because it is rich in natural resources. For this reason, nearly 50% of the world’s population lives in areas that are located within 100 km of the shoreline [3]. Coastline course is shaped by a number of anthropogenic and natural factors, among which the following can be distinguished: marine erosion, which, based on conducted research [4,5], has the greatest impact on its form, biological activity, coastal flooding [6], earthquakes, ocean acidification, ocean currents, rising temperatures [7], rising water level [8], river regulation [9], rock debris transport, seawater intrusion [10], as well as tides and wave action [11]. Their impact on the shoreline course is carried out in waterbodies’ differing geographical forms found along the coast, such as: archipelagos [12], bays [13], channels, deltas, and estuaries [14,15], islands [16], reefs [17], straits and wetlands [18,19].
In recent years, the most popular methods for determining the coastline course are: the tacheometric method, using an electronic total station [20,21], geodetic method, with the use of a Global Navigation Satellite System (GNSS) receiver mounted on a pole [22,23], as well as the satellite method, using high-resolution multispectral (0.5–2.5 m) images [24,25,26] or moderate-resolution multispectral imaging [27,28,29]. The geodetic and tacheometric methods are characterised by high accuracy in determining the coastline course. However, they are time consuming and do not allow full coverage of the terrain with measurements. On the other hand, the satellite method makes it possible to obtain full coverage of the terrain with measurements, but these measurements are characterised by low accuracy. None of the above-mentioned measurement methods allows determination of the shoreline course both in an accurate way and with high coverage of terrain with surveys [30]. For this reason, intensive works are currently underway to find alternative solutions that could accurately, extensively, and quickly determine coastline course. Based on a review of the existing literature on the subject, it can be concluded that the photogrammetric method, which consists of determining the location of a point based on low-altitude photos taken by an Unmanned Aerial Vehicle (UAV), has the greatest potential.
Bayram et al. [31] investigated the effectiveness of machine learning methods for shoreline extraction based on UAV images. The aim of the publication was to test the efficiency of Support Vector Machines (SVM) and Random Forest (RF) classifiers to obtain land and water classes on the basis of digital orthophotomaps generated from drone photos. The study used a MULTIROTOR G4 Eagle Cargo UAV with a Sony Alpha 7R camera (Complementary Metal–Oxide–Semiconductor (CMOS) sensor). The research was carried out on the shoreline of Istanbul-Terkos Lake and the Karaburun-Ormanlı region (Turkey), which is subject to heavy marine erosion. Based on a digital orthophotomap using SVM and RF algorithms, the coastline course was determined. Validation studies were performed based on the indications of the GNSS Real Time Kinematic (RTK) receiver. Studies have shown that the mean coastline determination errors were 0.935 m for the SVM classifier and 0.939 m for the RF classifier. Thus, it was proven that the SVM and RF algorithms are not suitable for shoreline extraction, due to the low accuracy of the image classification.
Del Pizzo et al. [32] made an assessment of shoreline detection using UAVs. The aim of the publication was to propose a photogrammetric method, which allows shoreline detection using Structure from Motion (SfM) algorithms. The study used the DJI Phantom 4 Pro drone, which was equipped with a CMOS camera with a pixel size of 2.4 μm and a wide-angle lens (equivalent focal length of 24 mm). The research was carried out on a sandy beach situated on the Sorrento coast (Italy). Based on the UAV point cloud, DTMs were generated using ArcGIS 10.7 software, and then, on their basis, the coastline course was determined using the contour method. Validation studies were performed based on the indications of the GNSS RTK receiver. Studies have shown that the Root Mean Square Error (RMSE) for determining the coastline course was 0.23 m.
Huang et al. [33] proposed a method using a coastal zone Digital Elevation Model (DEM) generated based on UAV images and information about Mean High Water Springs (MHWS) to determine coastline course. The aim of the publication was to propose a high-efficiency determination of shoreline using tidal level information and a DEM from drone tilt photogrammetry. The study used a UAV equipped with a Sony tilt camera (Charge-Coupled Device (CCD)/CMOS sensor), POS/AV system, and aerial camera control system, as well as an unmanned boat equipped with a GNSS RTK receiver, attitude sensor, and compass. The research was carried out on a narrow beach of the coastal zones of Liaoning Province (China). ArcGIS software was used to determine the coastline course of the studied waterbodies. The DEM generated by the UAV and information about tides were loaded into this program. On their basis, the contour method was used to mark out the shoreline. Next, the accuracy of the determined coastline was assessed based on photos taken by a drone and information on MHWS measured using a GNSS RTK receiver. Validation studies were performed based on the shoreline course marked out using the Digital Orthophoto Map (DOM). It was proven that the proposed method allows determination of the shoreline with an accuracy of more than 0.2 m.
Templin et al. [34] present the possibility of using a proposed tailless fixed-wing UAV and data processing on the example of a shallow water lake. The aim of the publication was to propose a methodology for shallow lake shoreline extraction with the use of low-cost tailless fixed-wing drone. The study used the Skywalker X5 UAV, which consists of five main components: drone, Ground Control Station (GCS), Radio Control (RC), Sony RX100 20 MP camera, and telemetry link. The research was carried out on a small inland reservoir—Lake Suskie (Poland). Based on the UAV point cloud, DTMs were generated using ArcGIS 10.4.1 software, and then, on their basis, the coastline course was determined using the contour method. Validation studies were performed based on the indications of the Trimble R8 GNSS RTK receiver. Studies have shown that the shoreline course can be determined with an accuracy of several centimetres. The mean error for the horizontal coordinate was 0.007 m, while the average error for the vertical coordinate was slightly larger and amounted to 0.021 m. Hence, it was established that a low-cost fixed-wing UAV can be an ideal tool for precisely surveying a shallow lake coastline and produce useful geoinformation data acquired far faster than when classical geodetic methods are used.
Wilkowski et al. [35] raised the issue of determining coastline course in accordance with the Polish Water Law, from which it follows that the boundary of the shore is the edge, if it is clear, and in addition the border of permanent grass growth, or which is marked out according to the constant water level with an accuracy of 10 years. The aim of the publication was to assess the possibility of using UAVs to mark out the shoreline of natural watercourses. The study used a Trimble UX5 drone equipped with two cameras, a Sony NEX5R (RGB range) and Sony NEX5T (NIR range), as well as data on average water levels recorded by the Polish Institute of Meteorology and Water Management (IMGW-PIB) for the last 10 years in the studied area. The research was carried out on the Narew riverbed (Poland). Based on the UAV point cloud, DTMs were generated using ArcGIS 10.7 software, and then, on their basis, the coastline course was marked out using the contour method. Validation studies were performed based on the indications of the Leica Viva GNSS RTK receiver. It was proven that the proposed method allows determination of the shoreline with an accuracy of ±0.21 m. According to studies, the edge of the shore or the line drawn in accordance with the average sea level over a period of at least 10 years produced the best results for identifying the coastline. It would be wise to remove this section of the shoreline from the Polish Water Law due to the extremely confusing course of the coastline defined by the boundary of persistent grass growth.
Research in the literature has revealed that drones are increasingly used to determine the shoreline of reservoirs and watercourses. Therefore, the aim of the publication is to present a method for determining coastline course based on low-altitude images taken by a UAV. Moreover, statistical analyses will be carried out to assess whether the proposed method meets the accuracy requirements laid down for the most stringent International Hydrographic Organization (IHO) order, i.e., the Exclusive Order (Total Horizontal Uncertainty (THU) of 5 m with a confidence level of 95%) [36].
The publication consists of four sections. The technical note starts with the description of the measurement place, measurement equipment, software, and tools, as well as realisation and processing of geodetic, photogrammetric, and satellite surveys. Then, the obtained accuracies of determining coastline course by the GNSS RTK UAV and satellite methods are presented. The paper ends with a discussion on meeting the IHO accuracy requirements by tested methods.
2. Materials and Methods
2.1. Measurement Place
Coastline measurements were conducted on the waterbody at the public beach in Gdynia (Figure 1). It is located in proximity to the Mariusz Zaruski marina in Gdynia. This waterbody has a typically running coastline (a 400-metre straight sandy section), and the depths increase with the distance from the shore. However, according to previously conducted research [37], in certain locations, there are alternating “shallows” and “depressions” appearing up to the 1 m isobath. As the authors of this study have been able to find out, seafloor relief changes are the result of the activities of the Maritime Office in Gdynia, which refills the waterbody with material (sand) acquired from the dredging of port approach fairways. The visibility depth of the Secchi disk, analysed in the years 2014–2015 in the waters of the Port of Gdynia, was approx. 2 m [38,39].
Based on long-term research conducted at 35 gauging stations along the Baltic Sea [40], it appears that the sea is non-tidal, because the differences in water level due to the impact of the tides are small. The min. tide was at 3.5 cm in the eastern part of the Bay of Gdańsk (Baltiysk, Russia), whereas the max tides were recorded at the gauging stations located in the Gulf of Finland (Gorniy Institute, Kronstadt, Russia), and amounted to approx. 18 cm. The differences in water levels for the Baltic Sea between consecutive hours at the same gauging stations are small and amount to several centimetres (if anything). Therefore, the influence of sea tides on the water level fluctuations in Gdynia can be considered insignificant [41].
2.2. Measurement Equipment, Software, and Tools
During the realisation of geodetic, photogrammetric, and satellite measurements, the following instruments, software, and tools were used:
- The DJI Matrice 300 RTK UAV is a quadrocopter from an industrial Matrice series and the latest commercial representative from the DJI Enterprise segment. One of the main advantages of this drone is the RTK module, thanks to which high-resolution images can be obtained. It is equipped with advanced Artificial Intelligence (AI) systems and a number of safeguards to protect the device from damage. The drone has a DJI Zenmuse P1 camera with a focal length of 35 mm and an aperture of f/2.8–f/16. It is the first camera produced by DJI with a full-frame CMOS sensor with a resolution of 45 Mpx. The camera has a mechanical global shutter, which enables a series of photos to be taken effectively without the risk of rolling shutter and blurry images at higher flight speeds;
- Pléiades Neo satellite imagery with a spatial resolution of 0.5 m, taken on 31 December 2020 and Hexagon Europe satellite images with a resolution of 0.3 m, made on 18 May 2022. These were the most recent satellite images that were taken for the study area with a resolution not smaller than 0.5 m. Both data sources were downloaded in GeoTIFF format;
- The Trimble R10 GNSS RTK receiver incorporates a GNSS antenna, internal radio, receiver, and battery in a rugged light-weight unit that is suited as an all-on-the-pole RTK rover or quick-setup/rapid-mobilisation base station. It enables simultaneous tracking of satellite signals from the following systems: Global Positioning System (GPS), GLObal NAvigation Satellite System (GLONASS), Satellite-Based Augmentation System (SBAS), and Galileo and BeiDou Navigation Satellite System (BDS). The Trimble R10 GNSS RTK operating in RTK mode allows positioning accuracies amounting to 8 mm + 1 ppm Root Mean Square (RMS) in the horizontal plane and 15 mm + 1 ppm RMS in the vertical plane;
- Pix4Dmapper 4.8.4 software offers a wide range of products that are used to develop images from photogrammetric flight passes made by UAVs. This program allows creation of high-quality DTMs, orthophotomaps, point clouds, and 3D models;
- ArcMap 10.7 software is used to analyse, create, edit, and view geospatial data. Thanks to this program, users can examine data within a data set, symbolise characteristics appropriately, and produce maps. In addition to this software, the Digital Shoreline Analysis System (DSAS) plug-in was installed, and enables calculation of rate-of-change statistics from multiple historical shoreline positions [42,43].
2.3. Realisation and Processing of Geodetic, Photogrammetric, and Satellite Measurements
On 13 June 2023, photogrammetric measurements using the DJI Matrice 300 RTK UAV were conducted in the coastal zone at the public beach in Gdynia. As part of the study, it was decided to use Real Time Network (RTN) correction data provided by the Polish GNSS geodetic network, called ASG-EUPOS. In addition, it was assumed to carry out a photogrammetric flight pass at the altitude of 35 m, at the gimbal angle of 90°. Moreover, the longitudinal and transverse coverage of images was set at 75–80%. The mission was conducted using a drone under appropriate meteorological conditions, i.e., no precipitation, windless weather, and a sunny day [44,45]. Such conditions allowed good quality, evenly lit photos to be taken. During the photogrammetric flight pass, 979 images were taken, for which the Ground Sample Distance (GSD) did not exceed 0.5 cm. During the photogrammetric mission, five GCPs were used, evenly distributed over the study area. The locations of the GCPs had to be easily distinguishable, which is why concrete garbage bins located at the public beach in Gdynia were used for this task. After carrying out photogrammetric measurements using the UAV, the recorded low-altitude photos were loaded into Pix4DMapper software to generate both the Digital Surface Model (DSM) and the orthophotomosaic. Georeferencing errors (1σ) of the developed model were 0.009 m for the northing, 0.004 m for the easting, and 0.017 m for the height. Thanks to the created models, it was possible to determine the coastline course using the photogrammetric method.
In parallel with the photogrammetric measurements, geodetic measurements of the coastline were carried out using the Trimble R10 GNSS RTK receiver, which was mounted on a pole. During the research, it was decided to use RTN correction data provided by the ASG-EUPOS GNSS geodetic network. The geodetic method consisted of measuring the line of contact between the water and the land of the studied waterbody. The operator measured the shoreline every 1–1.5 m. Along the 400-metre stretch of the beach, 276 coastline points were determined with an accuracy of 2.4 cm Distance Root Mean Square (DRMS).
The determination of individual coastline points for the orthophotomosaic (Figure 2a) and maps from satellite imagery (Figure 2c,d) was carried out in the ArcMap software by defining the polyline through the boundary points of land and water. The length of the designated shoreline was, for each method: 483.5 m (DSM), 490.7 m (GNSS RTK), 488.7 m (Hexagon Europe), 504.9 m (orthophotomosaic), and 596.5 m (Pléiades Neo). Due to the fact that the resolution of the orthophotomosaic is very high (1 pixel is 0.5 cm), the visual method of determining coastline course can be considered accurate and correct. The shoreline on the orthophotomap and satellite imagery was marked where the land meets the water. It was determined in the place of a pixel that does not contain water, assuming that the neighbouring one contains it. The process of determination of coastline in the case of the DSM (Figure 2b) was separate and consisted of drawing a tangent line to places with a step change in the height of the terrain. The SfM algorithm uses corresponding key points in adjacent photos. In the case of the analysed coastal zone, there is a significant difficulty in finding the same points in the water, in part due to waving. As a result, the DSM in the area of contact between land and water is characterised by high variability of height resulting from a change in the density of the colour of the raster. To determine the shoreline, a Python script was prepared. Its role was to determine the colour saturation—grayscale value along pixels across the image (Figure 2b). The designated pixel through which the coastline passes was characterised by a significant difference in the amplitude of the grayscale value in relation to the pixels adjacent to it on its left side. The procedure was repeated every 1 m. The process result is illustrated in Figure 3. The location of the shoreline on the DSM is shown in Figure 4.
After defining the coastline by three methods (geodetic, photogrammetric, and satellite), it was possible to assess the accuracy of determining their course (Figure 5a). The shoreline measured by the geodetic method (GNSS RTK) was adopted as the reference coastline. In relation to it, the accuracy of determining the shoreline was calculated using the photogrammetric and satellite methods. The distance of individual coastlines (determined by the photogrammetric or satellite method) from the reference line (marked out by the geodetic method) along the section perpendicular to the baseline defined using the DSAS plug-in in the ArcMap software was adopted as a measure of the accuracy of the determining the shoreline (Figure 5b).
The calculation procedure begins with the definition of the baseline in the form [46]:
where:
- XBL, YBL—flat coordinates of the points that determine the baseline in the PL-Universal Transverse Mercator (UTM) system (m);
- b—slope of the baseline (–);
- a—x-intercept of the baseline (m).
Therefore, the equation of the line perpendicular to the baseline can be described by the formula [46]:
where:
- —flat coordinates of the points that determine the i-th line perpendicular to the baseline in the PL-UTM system (m);
- i—numbering of perpendicular lines (–).
The distance between the baseline and the coastline determined by the geodetic, photogrammetric, or satellite method (di) is calculated based on the intersection points of these lines with a line perpendicular to the baseline [46]:
where:
- —flat coordinates of the baseline intersection points with the i-th line perpendicular to it in the PL-UTM system (m);
- —flat coordinates of the coastline intersection points with the i-th line perpendicular to the baseline in the PL-UTM system (m).
To calculate the accuracy of determining coastline course, the distances between the individual measurement shorelines and the reference shoreline marked out by the geodetic method (Δd) were adopted.
3. Results
The distances between the individual measurement coastlines and the reference shoreline measured by the geodetic method (GNSS RTK) and their histograms are shown in Figure 6. It can be noticed that the closest to the reference value are coastlines determined based on the DSM and the orthophotomosaic. This is most likely due to the fact that photogrammetric measurements were made simultaneously. Satellite data coming from a different period of time certainly affect the course of shorelines determined on their basis. Another important point is that although the satellite images from the Pléiades Neo satellite are noticeably older and 20 cm lower in resolution than the Hexagon Europe satellite, their values are distributed closer to the reference values (GNSS RTK). The summary of descriptive statistics is presented in Table 1.
The distributions of distances between the individual measurement coastlines and the reference shoreline measured by the geodetic method (GNSS RTK) are shown in Figure 7. A noticeable difference in the accuracy of determining coastline course between the satellite and UAV data can be clearly stated. Both data from the Hexagon Europe and Pléiades Neo satellites are bimodal, where there are two local max values. In both cases, there is a mean value and a median between the peaks of the distributions. Furthermore, it can be seen that the distributions have a significantly shifted mean value from the expected value. The distributions for the DSM and the orthophotomosaic have very similar means and medians, except that the digital surface model has a larger value of standard deviation.
In order to determine whether a given coastline measurement method meets the accuracy requirements laid down for the most stringent IHO order, i.e., the Exclusive Order (THU of 5 m with a confidence level of 95%) [36], statistical tests for the mean and standard deviation were performed. The following statistical hypotheses were assumed:
- For the mean test:
- ○
- H0: ≤ 5 m;
- ○
- H1: > 5 m;
- For the standard deviation test:
- ○
- H0: 1.96 × σΔd ≤ 5 m;
- ○
- H1: 1.96 × σΔd > 5 m.
The results of the statistical hypothesis testing for differences in the distance between the coastline determined by the geodetic method and the shoreline marked out by the other measurement method are presented in the Table 2.
4. Discussion
The publication presents a method for determining coastline course based on low-altitude images taken by a UAV. On the basis of the geospatial data recorded by the drone, the shoreline was mapped in two ways: DSM and orthophotomosaic. In order to assess the accuracy of determining coastline course, shorelines determined by the photogrammetric method were compared with coastlines marked out using the Pléiades Neo and Hexagon Europe satellite images. Studies have shown that accuracies of determining the shoreline course using a UAV are 0.47 m (p = 0.95) for the orthophotomosaic and 0.70 m (p = 0.95) for the Digital Surface Model (DSM), and much more accurate than the satellite method, which amounted to 6.37 m (p = 0.95) for the Pléiades Neo satellite and 9.24 m (p = 0.95) for the Hexagon Europe satellite. Based on the obtained results, it can be concluded that the accuracy of determining coastline course using a drone is several times higher than using satellite images. It should be mentioned that the satellite data came from different time frames and they can only be treated as an addition to the analysis. The distributions of distances between the coastline determined by the photogrammetric method and the shoreline marked out by the geodetic method (GNSS RTK) show features of a normal distribution, their mean and median being close to each other (Figure 7a,b), while the distributions of distances between the coastline determined by the satellite method and the shoreline marked out by the geodetic method (GNSS RTK) are bimodal, with clear spacing between both of the mentioned statistical features (Figure 7c,d).
The obtained results of the accuracy of the determining the shoreline using a UAV are similar to the results of other authors, for example, Bayram et al. [31], Del Pizzo et al. [32], Huang et al. [33], Templin et al. [34], and Wilkowski et al. [35]. The errors in marking out the coastline do not exceed 1 m and depend on the following factors: measurement equipment (drone and camera), flight parameters, shoreline shape, hydrometeorological conditions, and visual assessment of its course.
5. Conclusions
After conducting statistical analyses, it can be concluded that a DSM and an orthophotomosaic generated from data recorded by a UAV are suitable for the coastline extraction. Both of these methods meet the accuracy requirements laid down for the most stringent IHO order, i.e., the Exclusive Order (THU of 5 m with a confidence level of 95%) [36]. The same cannot be stated for the satellite data, which prove a low level of accuracy of the extracted coastline. Moreover, the undoubted advantage of the proposed method is the determination of the current course of the coastline with high spatial resolution of the images taken, as opposed to the satellite method. However, the disadvantage of the discussed method is the visual assessment of the shoreline, consisting of marking out its course at the contact of land with water.
In future research, it is planned to determine the coastline based on images taken from a UAV using the contour method (Farris et al., 2018 [47]) and the cost optimisation method (Xu et al., 2019 [48]) in order to calculate the difference between the results obtained with the use of automatic and visual methods. Moreover, it plans to carry out this type of research in waterbodies with different shorelines in various periods of time.
Author Contributions
Conceptualization, Ł.M. and M.S.; methodology, Ł.M. and M.S.; software, Ł.M.; validation, Ł.M. and M.S.; formal analysis, M.S.; investigation, Ł.M. and M.S.; data curation, Ł.M.; writing—original draft preparation, M.S.; writing—review and editing, Ł.M.; visualization, Ł.M.; supervision, M.S. All authors have read and agreed to the published version of the manuscript.
Funding
This research was funded from the statutory activities of Polish Naval Academy and Gdynia Maritime University, grant number WN/2023/PZ/05.
Conflicts of Interest
The authors declare no conflict of interest.
References
- Li, Z.; Zhai, J.; Wu, F. Shape Similarity Assessment Method for Coastline Generalization. ISPRS Int. J. Geo-Inf. 2018, 7, 283. [Google Scholar] [CrossRef]
- Sui, L.; Wang, J.; Yang, X.; Wang, Z. Spatial-temporal Characteristics of Coastline Changes in Indonesia from 1990 to 2018. Sustainability 2020, 12, 3242. [Google Scholar] [CrossRef]
- Li, J.; Ye, M.; Pu, R.; Liu, Y.; Guo, Q.; Feng, B.; Huang, R.; He, G. Spatiotemporal Change Patterns of Coastlines in Zhejiang Province, China, Over the Last Twenty-five Years. Sustainability 2018, 10, 477. [Google Scholar] [CrossRef]
- Martínez, C.; Contreras-López, M.; Winckler, P.; Hidalgo, H.; Godoy, E.; Agredano, R. Coastal Erosion in Central Chile: A New Hazard? Ocean Coast. Manag. 2018, 156, 141–155. [Google Scholar] [CrossRef]
- Narra, P.; Coelho, C.; Sancho, F. Multicriteria GIS-based Estimation of Coastal Erosion Risk: Implementation to Aveiro Sandy Coast, Portugal. Ocean Coast. Manag. 2019, 178, 104845. [Google Scholar] [CrossRef]
- Kanwal, S.; Ding, X.; Sajjad, M.; Abbas, S. Three Decades of Coastal Changes in Sindh, Pakistan (1989-2018): A Geospatial Assessment. Remote Sens. 2020, 12, 8. [Google Scholar] [CrossRef]
- Zhang, Y.; Hou, X. Characteristics of Coastline Changes on Southeast Asia Islands from 2000 to 2015. Remote Sens. 2020, 12, 519. [Google Scholar] [CrossRef]
- Mury, A.; Jeanson, M.; Collin, A.; James, D.; Etienne, S. High Resolution Shoreline and Shelly Ridge Monitoring over Stormy Winter Events: A Case Study in the Megatidal Bay of Mont-Saint-Michel (France). J. Mar. Sci. Eng. 2019, 7, 97. [Google Scholar] [CrossRef]
- Nikolakopoulos, K.; Kyriou, A.; Koukouvelas, I.; Zygouri, V.; Apostolopoulos, D. Combination of Aerial, Satellite, and UAV Photogrammetry for Mapping the Diachronic Coastline Evolution: The Case of Lefkada Island. ISPRS Int. J. Geo-Inf. 2019, 8, 489. [Google Scholar] [CrossRef]
- Fu, Y.; Guo, Q.; Wu, X.; Fang, H.; Pan, Y. Analysis and Prediction of Changes in Coastline Morphology in the Bohai Sea, China, Using Remote Sensing. Sustainability 2017, 9, 900. [Google Scholar] [CrossRef]
- Mahamud, U.; Takewaka, S. Shoreline Change around a River Delta on the Cox’s Bazar Coast of Bangladesh. J. Mar. Sci. Eng. 2018, 6, 80. [Google Scholar] [CrossRef]
- Chen, C.; Liang, J.; Xie, F.; Hu, Z.; Sun, W.; Yang, G.; Yu, J.; Chen, L.; Wang, L.; Wang, L.; et al. Temporal and Spatial Variation of Coastline Using Remote Sensing Images for Zhoushan Archipelago, China. Int. J. Appl. Earth Obs. Geoinf. 2022, 107, 102711. [Google Scholar] [CrossRef]
- Martínez, C.; Quezada, M.; Rubio, P. Historical Changes in the Shoreline and Littoral Processes on a Headland Bay Beach in Central Chile. Geomorphology 2011, 135, 80–96. [Google Scholar] [CrossRef]
- Chu, Z.X.; Yang, X.H.; Feng, X.L.; Fan, D.J.; Li, Y.K.; Shen, X.; Miao, A.Y. Temporal and Spatial Changes in Coastline Movement of the Yangtze Delta during 1974-2010. J. Asian Earth Sci. 2013, 66, 166–174. [Google Scholar] [CrossRef]
- Cowart, L.; Corbett, D.R.; Walsh, J.P. Shoreline Change along Sheltered Coastlines: Insights from the Neuse River Estuary, NC, USA. Remote Sens. 2011, 3, 1516–1534. [Google Scholar] [CrossRef]
- Masucci, G.D.; Reimer, J.D. Expanding Walls and Shrinking Beaches: Loss of Natural Coastline in Okinawa Island, Japan. PeerJ 2019, 7, e7520. [Google Scholar] [CrossRef] [PubMed]
- Lowe, M.K.; Adnan, F.A.F.; Hamylton, S.M.; Carvalho, R.C.; Woodroffe, C.D. Assessing Reef-island Shoreline Change Using UAV-derived Orthomosaics and Digital Surface Models. Drones 2019, 3, 44. [Google Scholar] [CrossRef]
- Kuleli, T.; Guneroglu, A.; Karsli, F.; Dihkan, M. Automatic Detection of Shoreline Change on Coastal Ramsar Wetlands of Turkey. Ocean Eng. 2011, 38, 1141–1149. [Google Scholar] [CrossRef]
- Zhang, X.; Pan, D.; Chen, J.; Zhao, J.; Zhu, Q.; Huang, H. Evaluation of Coastline Changes under Human Intervention Using Multi-temporal High-resolution Images: A Case Study of the Zhoushan Islands, China. Remote Sens. 2014, 6, 9930–9950. [Google Scholar] [CrossRef]
- Koljonen, S.; Huusko, A.; Mäki-Petäys, A.; Louhi, P.; Muotka, T. Assessing Habitat Suitability for Juvenile Atlantic Salmon in Relation to In-stream Restoration and Discharge Variability. Restor. Ecol. 2012, 21, 344–352. [Google Scholar] [CrossRef]
- Lane, S.N.; Richards, K.S.; Chandler, J.H. Developments in Monitoring and Modelling Small-scale River Bed Topography. Earth Surf. Process. Landf. 1994, 19, 349–368. [Google Scholar] [CrossRef]
- Baptista, P.; Bastos, L.; Bernardes, C.; Cunha, T.; Dias, J. Monitoring Sandy Shores Morphologies by DGPS—A Practical Tool to Generate Digital Elevation Models. J. Coast. Res. 2008, 24, 1516–1528. [Google Scholar] [CrossRef]
- Specht, C.; Specht, M.; Cywiński, P.; Skóra, M.; Marchel, Ł.; Szychowski, P. A New Method for Determining the Territorial Sea Baseline Using an Unmanned, Hydrographic Surface Vessel. J. Coast. Res. 2019, 35, 925–936. [Google Scholar] [CrossRef]
- Al-Mansoori, S.; Al-Marzouqi, F. Coastline Extraction Using Satellite Imagery and Image Processing Techniques. Int. J. Curr. Eng. Technol. 2016, 6, 1245–1251. [Google Scholar]
- Wang, X.; Liu, Y.; Ling, F.; Liu, Y.; Fang, F. Spatio-temporal Change Detection of Ningbo Coastline Using Landsat Time-series Images during 1976–2015. ISPRS Int. J. Geo-Inf. 2017, 6, 68. [Google Scholar] [CrossRef]
- Maglione, P.; Parente, C.; Vallario, A. Coastline Extraction Using High Resolution WorldView-2 Satellite Imagery. Eur. J. Remote Sens. 2014, 47, 685–699. [Google Scholar] [CrossRef]
- Almonacid-Caballer, J.; Sánchez-García, E.; Pardo-Pascual, J.E.; Balaguer-Beser, A.; Palomar-Vázquez, J. Evaluation of Annual Mean Shoreline Position Deduced from Landsat Imagery as a Mid-term Coastal Evolution Indicator. Mar. Geol. 2016, 372, 79–88. [Google Scholar] [CrossRef]
- Viaña-Borja, S.P.; Ortega-Sánchez, M. Automatic Methodology to Detect the Coastline from Landsat Images with a New Water Index Assessed on Three Different Spanish Mediterranean Deltas. Remote Sens. 2019, 11, 2186. [Google Scholar] [CrossRef]
- Yuan, F.; Sawaya, K.E.; Loeffelholz, B.C.; Bauer, M.E. Land Cover Classification and Change Analysis of the Twin Cities (Minnesota) Metropolitan Area by Multitemporal Landsat Remote Sensing. Remote Sens. Environ. 2005, 98, 317–328. [Google Scholar] [CrossRef]
- Apollo, M.; Jakubiak, M.; Nistor, S.; Lewinska, P.; Krawczyk, A.; Borowski, L.; Specht, M.; Krzykowska-Piotrowska, K.; Marchel, Ł.; Pęska-Siwik, A.; et al. Geodata in Science—A Review of Selected Scientific Fields. Acta Sci. Pol. Form. Circumiectus 2023, 22, 17–40. [Google Scholar] [CrossRef]
- Bayram, B.; Seker, D.Z.; Akpinar, B. Efficiency of Different Machine Learning Methods for Shoreline Extraction from UAV Images. In Proceedings of the 40th Asian Conference on Remote Sensing (ACRS 2019), Daejeon, Republic of Korea, 14–18 October 2019. [Google Scholar]
- Del Pizzo, S.; Angrisano, A.; Gaglione, S.; Troisi, S. Assessment of Shoreline Detection Using UAV. In Proceedings of the 2020 IMEKO TC-19 International Workshop on Metrology for the Sea (MetroSea 2020), Naples, Italy, 5–7 October 2020. [Google Scholar]
- Huang, C.; Zhang, H.; Zhao, J. High-efficiency Determination of Coastline by Combination of Tidal Level and Coastal Zone DEM from UAV Tilt Photogrammetry. Remote Sens. 2020, 12, 2189. [Google Scholar] [CrossRef]
- Templin, T.; Popielarczyk, D.; Kosecki, R. Application of Low-cost Fixed-wing UAV for Inland Lakes Shoreline Investigation. Pure Appl. Geophys. 2018, 175, 3263–3283. [Google Scholar] [CrossRef]
- Wilkowski, W.; Lisowski, M.; Wyszyński, M.; Wierzbicki, D. The Use of Unmanned Aerial Vehicles (Drones) to Determine the Shoreline of Natural Watercourses. J. Water Land Dev. 2017, 35, 259–264. [Google Scholar] [CrossRef]
- IHO. IHO Standards for Hydrographic Surveys, 6th ed.; IHO Publication No. 44; IHO: Monte Carlo, Monaco, 2020. [Google Scholar]
- Specht, M.; Specht, C.; Wąż, M.; Dąbrowski, P.; Skóra, M.; Marchel, Ł. Determining the Variability of the Territorial Sea Baseline on the Example of Waterbody Adjacent to the Municipal Beach in Gdynia. Appl. Sci. 2019, 9, 3867. [Google Scholar] [CrossRef]
- Maritime Office in Gdynia. Draft Plan for the Spatial Development of Water of the Sea Port in Gdynia, Preliminary Draft Plan Version (v.0). Available online: https://www.umgdy.gov.pl/wp-content/uploads/2020/11/PZP.GDY_3_prognoza_v0.pdf (accessed on 6 August 2023). (In Polish)
- Maritime Office in Gdynia. Draft Plan for the Spatial Development of Internal Waters of the Gulf of Gdańsk Together with an Environmental Impact Forecast. Available online: https://www.umgdy.gov.pl/wp-content/uploads/2020/10/pzp-zgd-v0-2_projekt_planu_prognoza_prezent.pdf (accessed on 6 August 2023). (In Polish)
- Medvedev, I.P.; Rabinovich, A.B.; Kulikov, E.A. Tidal Oscillations in the Baltic Sea. Oceanology 2013, 53, 526–538. [Google Scholar] [CrossRef]
- Specht, M.; Specht, C.; Wąż, M.; Naus, K.; Grządziel, A.; Iwen, D. Methodology for Performing Territorial Sea Baseline Measurements in Selected Waterbodies of Poland. Appl. Sci. 2019, 9, 3053. [Google Scholar] [CrossRef]
- Mujabar, S.; Chandrasekar, N. A Shoreline Change Analysis along the Coast between Kanyakumari and Tuticorin, India, Using Digital Shoreline Analysis System. Geo-Spat. Inf. Sci. 2011, 14, 282–293. [Google Scholar]
- USGS. Digital Shoreline Analysis System (DSAS). Available online: https://www.usgs.gov/centers/whcmsc/science/digital-shoreline-analysis-system-dsas (accessed on 6 August 2023).
- Kacprzak, M.; Wodziński, K. Execution of Photo Mission by Manned Aircraft and Unmanned Aerial Vehicle. Trans. Inst. Aviat. 2016, 2, 130–141. (In Polish) [Google Scholar] [CrossRef]
- Witek, M.; Jeziorska, J.; Niedzielski, T. Possibilities of Using Unmanned Air Photogrammetry to Identify Anthropogenic Transformations in River Channel. Landf. Anal. 2013, 24, 115–126. (In Polish) [Google Scholar] [CrossRef]
- Specht, M.; Specht, C.; Lewicka, O.; Makar, A.; Burdziakowski, P.; Dąbrowski, P. Study on the Coastline Evolution in Sopot (2008–2018) Based on Landsat Satellite Imagery. J. Mar. Sci. Eng. 2020, 8, 464. [Google Scholar] [CrossRef]
- Farris, A.S.; Weber, K.M.; Doran, K.S.; List, J.H. Comparing Methods Used by the U.S. Geological Survey Coastal and Marine Geology Program for Deriving Shoreline Position from LiDAR Data. Available online: https://pubs.usgs.gov/of/2018/1121/ofr20181121.pdf (accessed on 6 August 2023).
- Xu, S.; Ye, N.; Xu, S. A New Method for Shoreline Extraction from Airborne LiDAR Point Clouds. Remote Sens. Lett. 2019, 10, 496–505. [Google Scholar] [CrossRef]
Figure 1.
The location of coastline measurements conducted on 13 June 2023 in the coastal zone at the public beach in Gdynia.
Figure 1.
The location of coastline measurements conducted on 13 June 2023 in the coastal zone at the public beach in Gdynia.
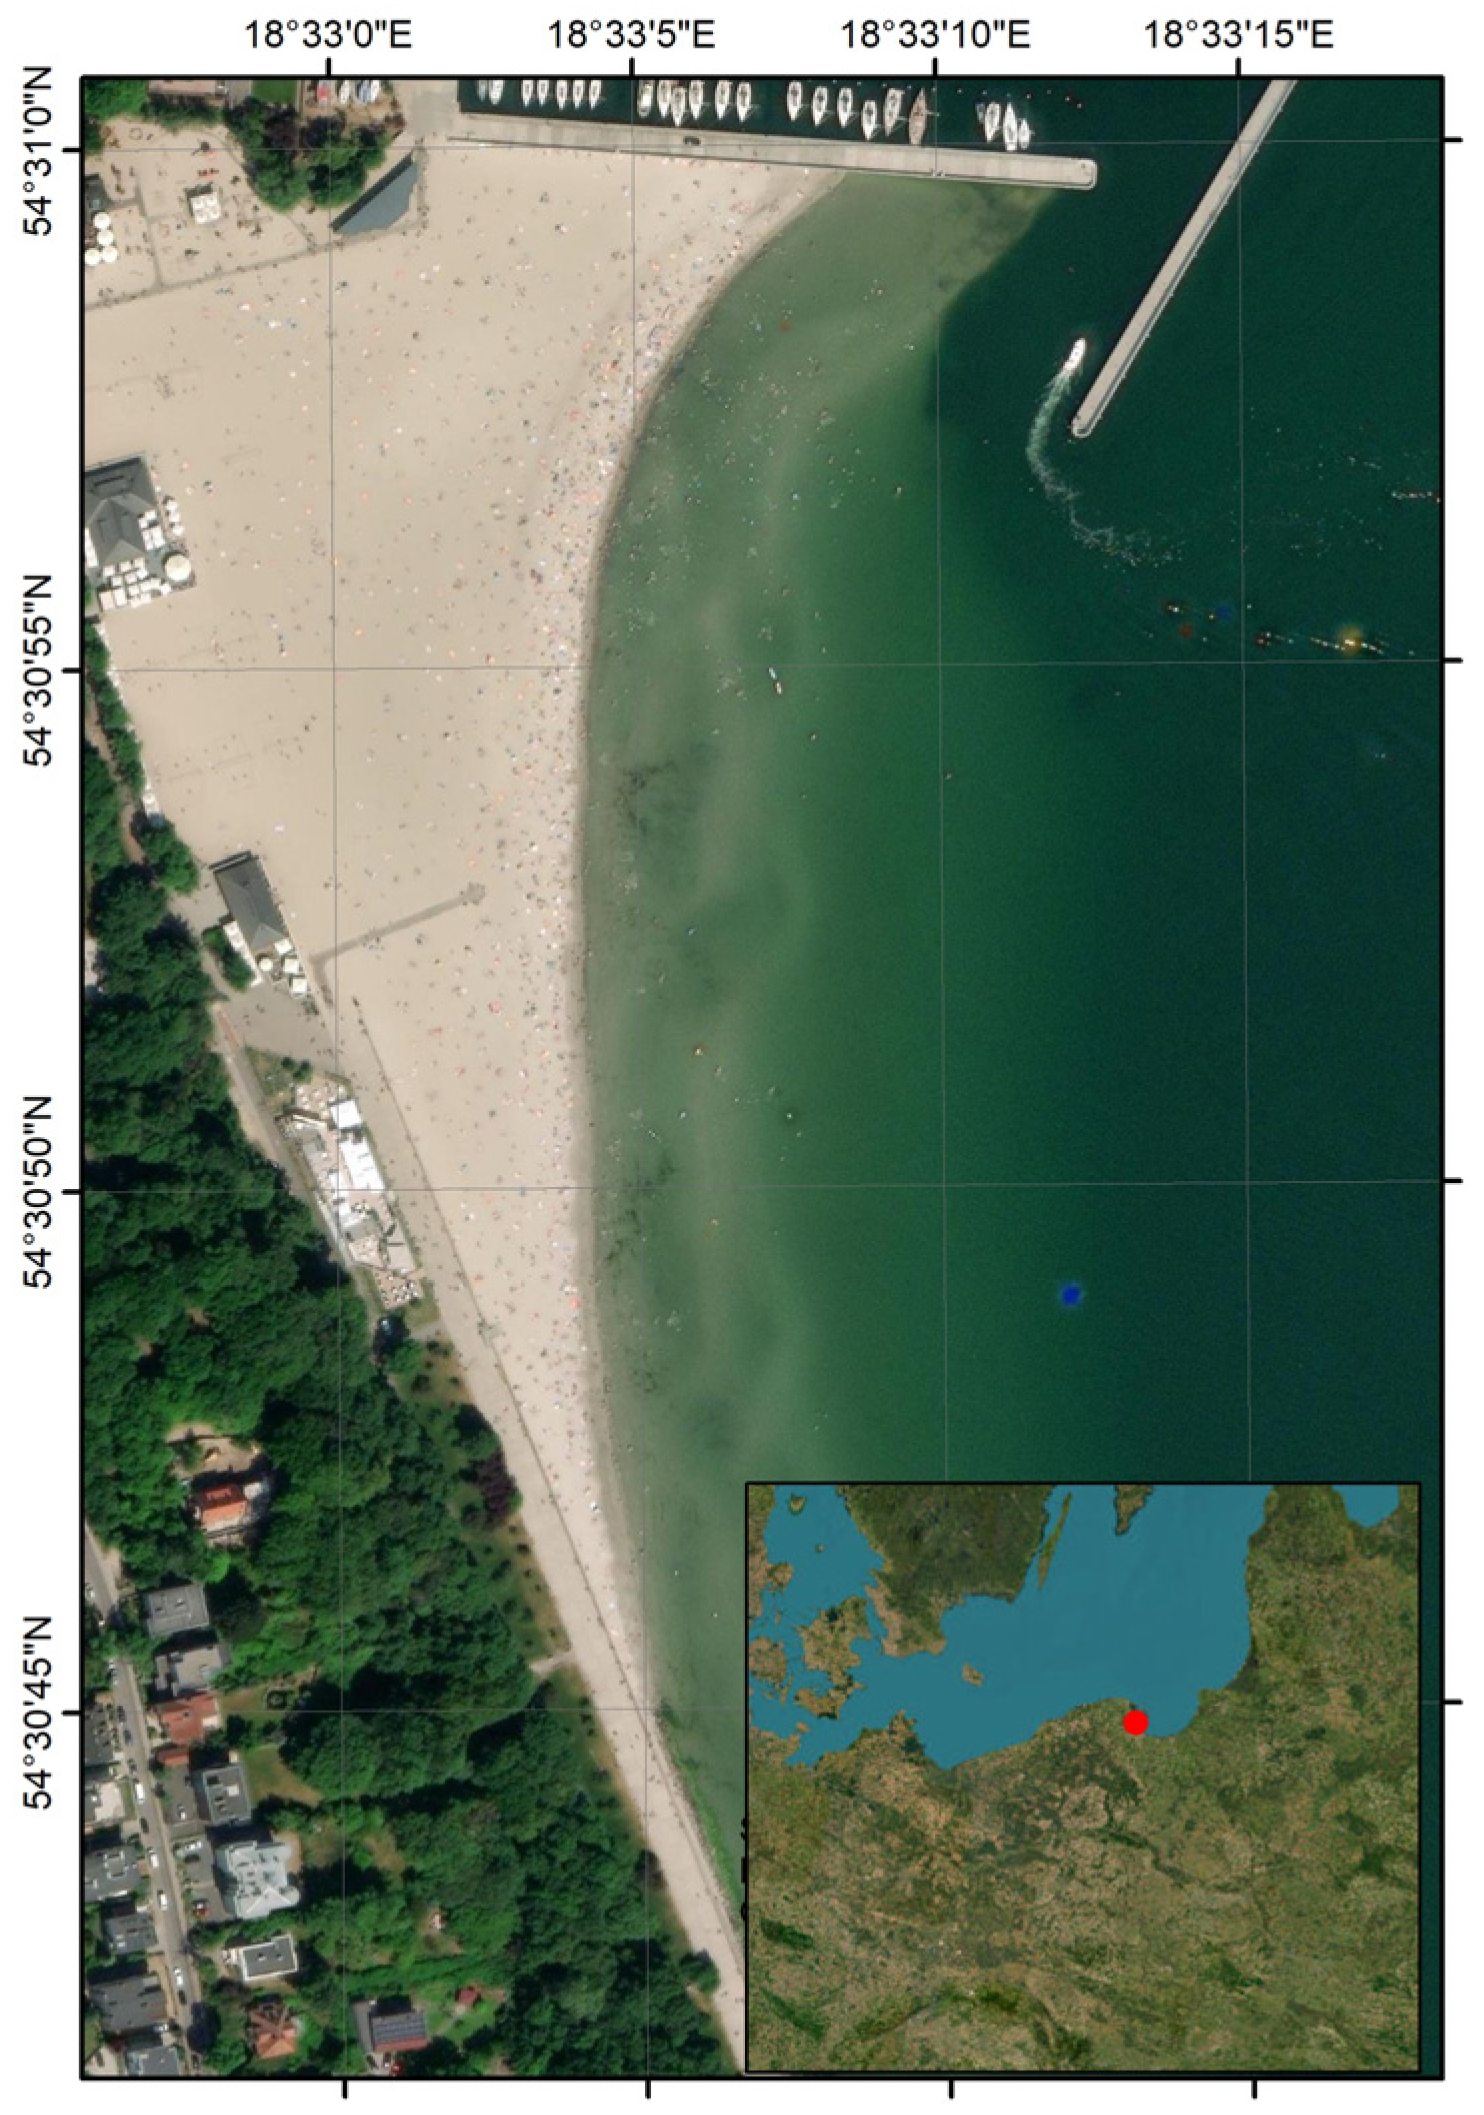
Figure 2.
UAV-based orthophotomosaic (a) and DSM (b), as well as Pléiades Neo (c) and Hexagon Europe satellite imagery (d) of the coastal zone at the public beach in Gdynia.
Figure 2.
UAV-based orthophotomosaic (a) and DSM (b), as well as Pléiades Neo (c) and Hexagon Europe satellite imagery (d) of the coastal zone at the public beach in Gdynia.
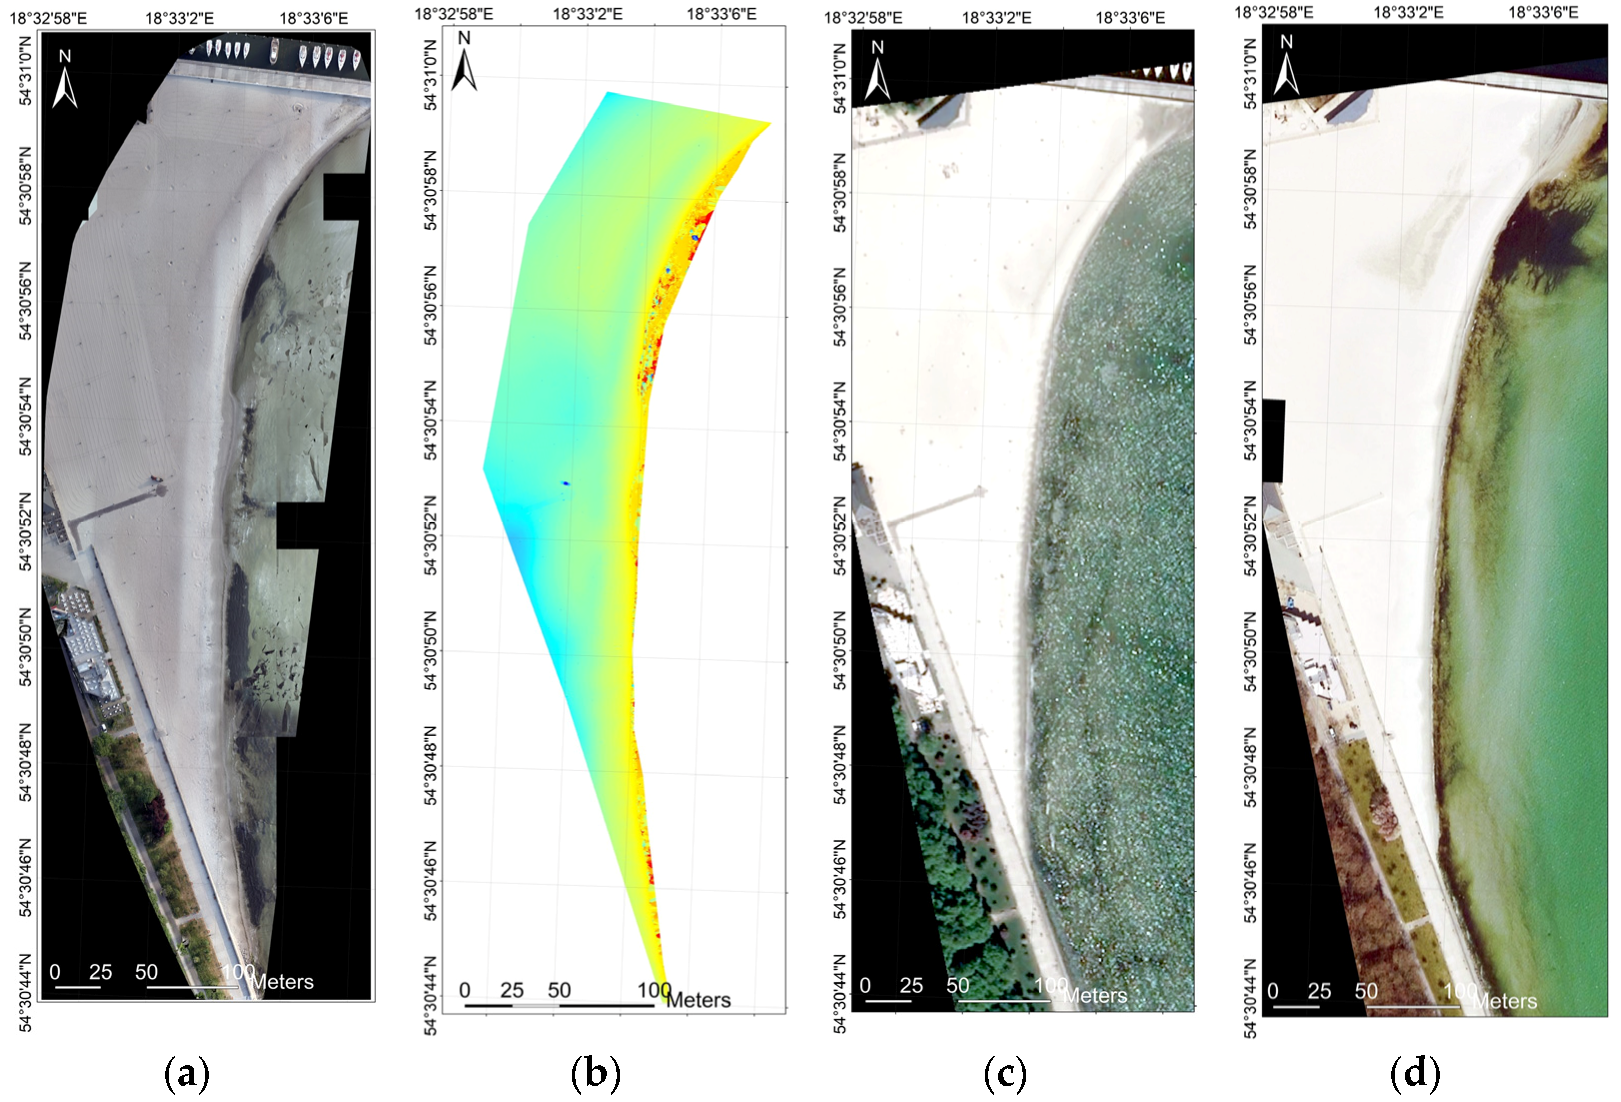
Figure 3.
DSM profile through the row of pixels of the DSM and marked place where the coastline passes.
Figure 3.
DSM profile through the row of pixels of the DSM and marked place where the coastline passes.

Figure 4.
Coastline extracted from UAV-based DSM.
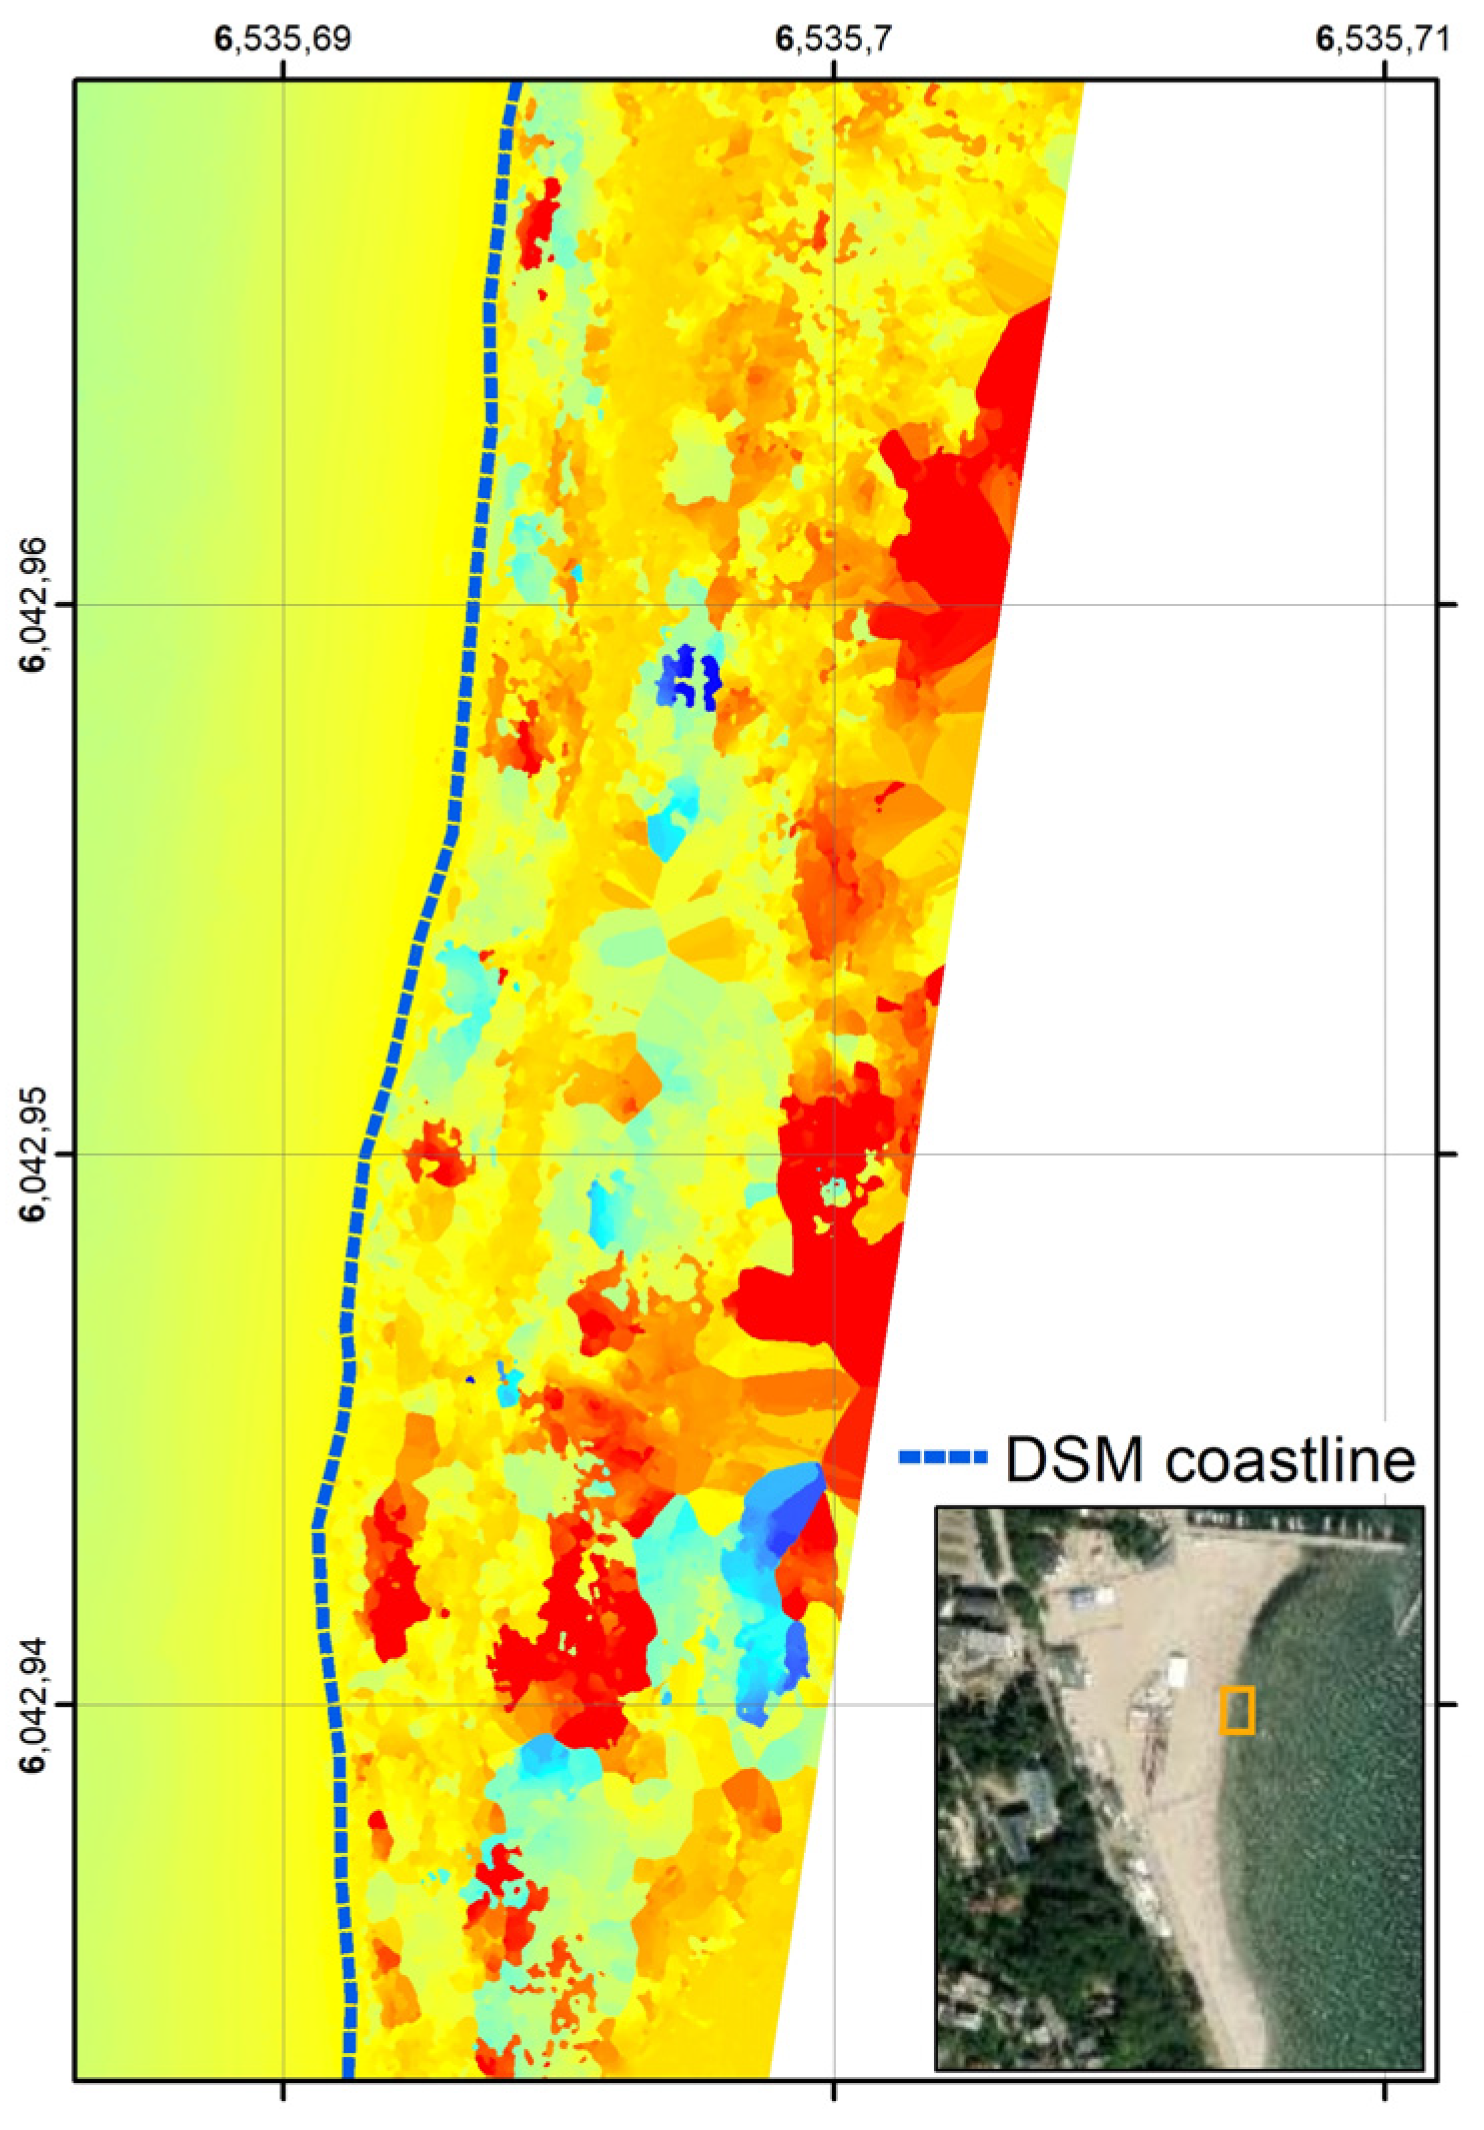
Figure 5.
Baseline and coastlines determined by various measurement methods (a), as well as lines perpendicular to the baseline and passing through the measured shorelines (b).
Figure 5.
Baseline and coastlines determined by various measurement methods (a), as well as lines perpendicular to the baseline and passing through the measured shorelines (b).

Figure 6.
Distances between the individual measurement coastlines and the reference shoreline determined by the geodetic method (a) and their histograms (b).
Figure 6.
Distances between the individual measurement coastlines and the reference shoreline determined by the geodetic method (a) and their histograms (b).

Figure 7.
Distributions of distances between the individual measurement coastlines: orthophotomosaic (a), DSM (b), Pléiades Neo (c), Hexagon Europe (d), and the reference shoreline determined by the geodetic method.
Figure 7.
Distributions of distances between the individual measurement coastlines: orthophotomosaic (a), DSM (b), Pléiades Neo (c), Hexagon Europe (d), and the reference shoreline determined by the geodetic method.


Table 1.
The summary of descriptive statistics for differences in the distance between the coastline determined by the geodetic method and the shoreline marked out by the other measurement method.
Table 1.
The summary of descriptive statistics for differences in the distance between the coastline determined by the geodetic method and the shoreline marked out by the other measurement method.
| Distance Difference | Median (m) | Standard Deviation (m) | Mean (m) | Min. (m) | Quantile 0.25 (m) | Quantile 0.50 (m) | Quantile 0.75 (m) | Max (m) |
|---|---|---|---|---|---|---|---|---|
| Δd Orthophotomosaic | 0.478 | 0.239 | 0.485 | 0.003 | 0.32 | 0.478 | 0.638 | 1.232 |
| Δd DSM | 0.459 | 0.355 | 0.503 | 0.001 | 0.206 | 0.459 | 0.717 | 1.503 |
| Δd Pléiades Neo | 5.481 | 3.249 | 5.233 | 0.002 | 2.258 | 5.481 | 7.794 | 11.922 |
| Δd Hexagon Europe | 10.519 | 4.714 | 8.533 | 0.373 | 3.708 | 10.519 | 12.647 | 14.941 |
Table 2.
Results of the statistical hypothesis testing for differences in the distance between the coastline determined by the geodetic method and the shoreline marked out by the other measurement method.
Table 2.
Results of the statistical hypothesis testing for differences in the distance between the coastline determined by the geodetic method and the shoreline marked out by the other measurement method.
| Distance Difference | Mean Test | Standard Deviation Test | |||||||||
|---|---|---|---|---|---|---|---|---|---|---|---|
| T Critical (m) | t-Statistic (m) | Conf. Interval (m) | Test Power (–) | H0 | H1 | χ2 Statistic (m) | Conf. Interval (m) | Test Power (–) | H0 | H1 | |
| Δd Orthophotomosaic | 1.648 | 402.254 | (0.4, inf) | 1.0 | No reject | Reject | 4.015 | (423.8, inf) | 1.0 | No reject | Reject |
| Δd DSM | 1.648 | 29.635 | (0.4, inf) | 1.0 | No reject | Reject | 8.679 | (417.0, inf) | 1.0 | No reject | Reject |
| Δd Pléiades Neo | 1.648 | 1.536 | (0.5, inf) | 0.2 | No reject | Reject | 742.696 | (409.4, inf) | 1.0 | Reject | No reject |
| Δd Hexagon Europe | 1.648 | 16.054 | (8.2, inf) | 1.0 | Reject | No reject | 1564.081 | (426.7, inf) | 1.0 | Reject | No reject |
Disclaimer/Publisher’s Note: The statements, opinions and data contained in all publications are solely those of the individual author(s) and contributor(s) and not of MDPI and/or the editor(s). MDPI and/or the editor(s) disclaim responsibility for any injury to people or property resulting from any ideas, methods, instructions or products referred to in the content. |
© 2023 by the authors. Licensee MDPI, Basel, Switzerland. This article is an open access article distributed under the terms and conditions of the Creative Commons Attribution (CC BY) license (https://creativecommons.org/licenses/by/4.0/).
Share and Cite
MDPI and ACS Style
Marchel, Ł.; Specht, M. Method for Determining Coastline Course Based on Low-Altitude Images Taken by a UAV. Remote Sens. 2023, 15, 4700. https://doi.org/10.3390/rs15194700
AMA Style
Marchel Ł, Specht M. Method for Determining Coastline Course Based on Low-Altitude Images Taken by a UAV. Remote Sensing. 2023; 15(19):4700. https://doi.org/10.3390/rs15194700
Chicago/Turabian StyleMarchel, Łukasz, and Mariusz Specht. 2023. "Method for Determining Coastline Course Based on Low-Altitude Images Taken by a UAV" Remote Sensing 15, no. 19: 4700. https://doi.org/10.3390/rs15194700
Note that from the first issue of 2016, this journal uses article numbers instead of page numbers. See further details here.