Technical Note

Ionosphere Total Electron Content Modeling and Multi-Type Differential Code Bias Estimation Using Multi-Mode and Multi-Frequency Global Navigation Satellite System Observations

1
College of Civil Engineering, Xiangtan University, Xiangtan 411105, China
2
National Center for Applied Mathematics in Hunan, Xiangtan 411105, China
*
Author to whom correspondence should be addressed.
Remote Sens. 2023, 15(18), 4607; https://doi.org/10.3390/rs15184607
Submission received: 4 August 2023 / Revised: 18 September 2023 / Accepted: 18 September 2023 / Published: 19 September 2023
(This article belongs to the Special Issue BDS/GNSS for Earth Observation: Part II)

Abstract

:
With the rapid development of multi-mode and multi-frequency GNSSs (including GPS, GLONASS, BDS, Galileo, and QZSS), more observations for research on ionosphere can be provided. The Global Ionospheric Map (GIM) products are generated based on the observation of multi-mode and multi-frequency GNSSs, and comparisons with other GIMs provided by the ionosphere analysis centers are provided in this paper. Taking the CODE (Center of Orbit Determination in Europe) GIM as a reference during 30 days in January 2019, for the GIMs from JPL (Jet Puls Laboratory), UPC (Technical University of Catalonia), ESA (European Space Agency), WHU (Wuhan University), CAS (Chinese Academy of Sciences), and MMG (The multi-mode and multi-frequency GNSS observations used in this paper), the mean bias with respect to CODE products is 1.87, 1.30, −0.10, 0.01, −0.02, and −0.71 TECu, and the RMS is 2.12, 2.00, 1.33, 0.88, 0.88, and 1.30 TECu, respectively. The estimated multi-type DCB is also in good agreement with the DCB products provided by the MGEX.

1. Introduction

High-precision monitoring and modeling of ionospheric TEC is of great significance, which is mainly reflected in the following aspects [1,2]: (1) high-precision ionospheric TEC modeling can provide ionospheric delay correction for GNSS positioning and navigation, improve the positioning accuracy of the GNSS system, and expand the related applications of GNSSs [3,4,5,6,7,8]; (2) modeling and monitoring of ionospheric TEC can allow the study of its distribution and variations and, furthermore, the relationship with solar activity and geomagnetic field changes, etc., [9,10,11]; (3) high-precision ionospheric TEC modeling provides the possibility of in-depth study of the fine changes in the ionosphere, and the coupling relationship and mechanism between ionospheric TEC changes and earthquakes, tsunamis, typhoons, and unusual weather changes, etc., can be further investigated [12]; (4) high-precision ionospheric TEC modeling provides the possibility of efficiently and accurately calculating the code bias parameters of satellites and receivers [13,14]. GNSS observations have been used as an important means to monitor and model the ionosphere due to the global distribution of GNSSs and their continuous observation capability. Since the 1990s, IGS analysts have been using global GPS observations to monitor and model ionospheric TEC [15,16]. With the rapid development of multi-system GNSSs, the multi-mode and multi-frequency GNSS observation capability has been gradually formed, providing more observation data for GNSS ionospheric monitoring and modeling [17,18,19]. Since the distribution of Ionospheric Pierce Points (IPPs) also has an important influence on ionospheric modeling, in addition to the influence of mathematical models, projection functions, and ionospheric TEC extraction accuracy, etc., [20], the IGS has established an observation network for multi-mode and multi-frequency GNSSs (MGEX) since 2016 [19], which can currently provide GPS, GLONASS, BDS, Galileo, and QZSS observations (GLONASS is still for dual-frequency observations only) [21]. Together with the original IGS network, which mainly provides GPS and GLONASS data, more than 400 stations can track multi-system GNSS observation signals every day (as of January 2019), which provides much usable data for multi-mode and multi-frequency GNSS ionospheric monitoring and modeling.
In view of this, in this paper, based on the multi-mode multi-frequency GNSS observation data, the phase-smoothing pseudorange extraction of ionospheric observations and the use of the spherical harmonic function are used to establish the global ionospheric grid model, and the observation data provided by the MGEX and the IGS in January 2019 are used to analyze and compare the accuracies of the global ionospheric grid maps provided by different analysis centers of the IGS, with the ionospheric grid maps provided by the CODE as a reference.
In the following, the method of ionospheric TEC modeling and DCB estimation is described in detail in Section 2, and 30 days of observations from more than 400 multi-GNSS experiment (MGEX) stations are collected for the ionospheric TEC modeling and DCB estimation. In Section 3, the estimated global ionospheric grid model and DCBs are compared with the IGS products for validation and evaluation. Finally, the corresponding discussion and conclusion are given in Section 4 and Section 5, respectively.

2. Methods and Data

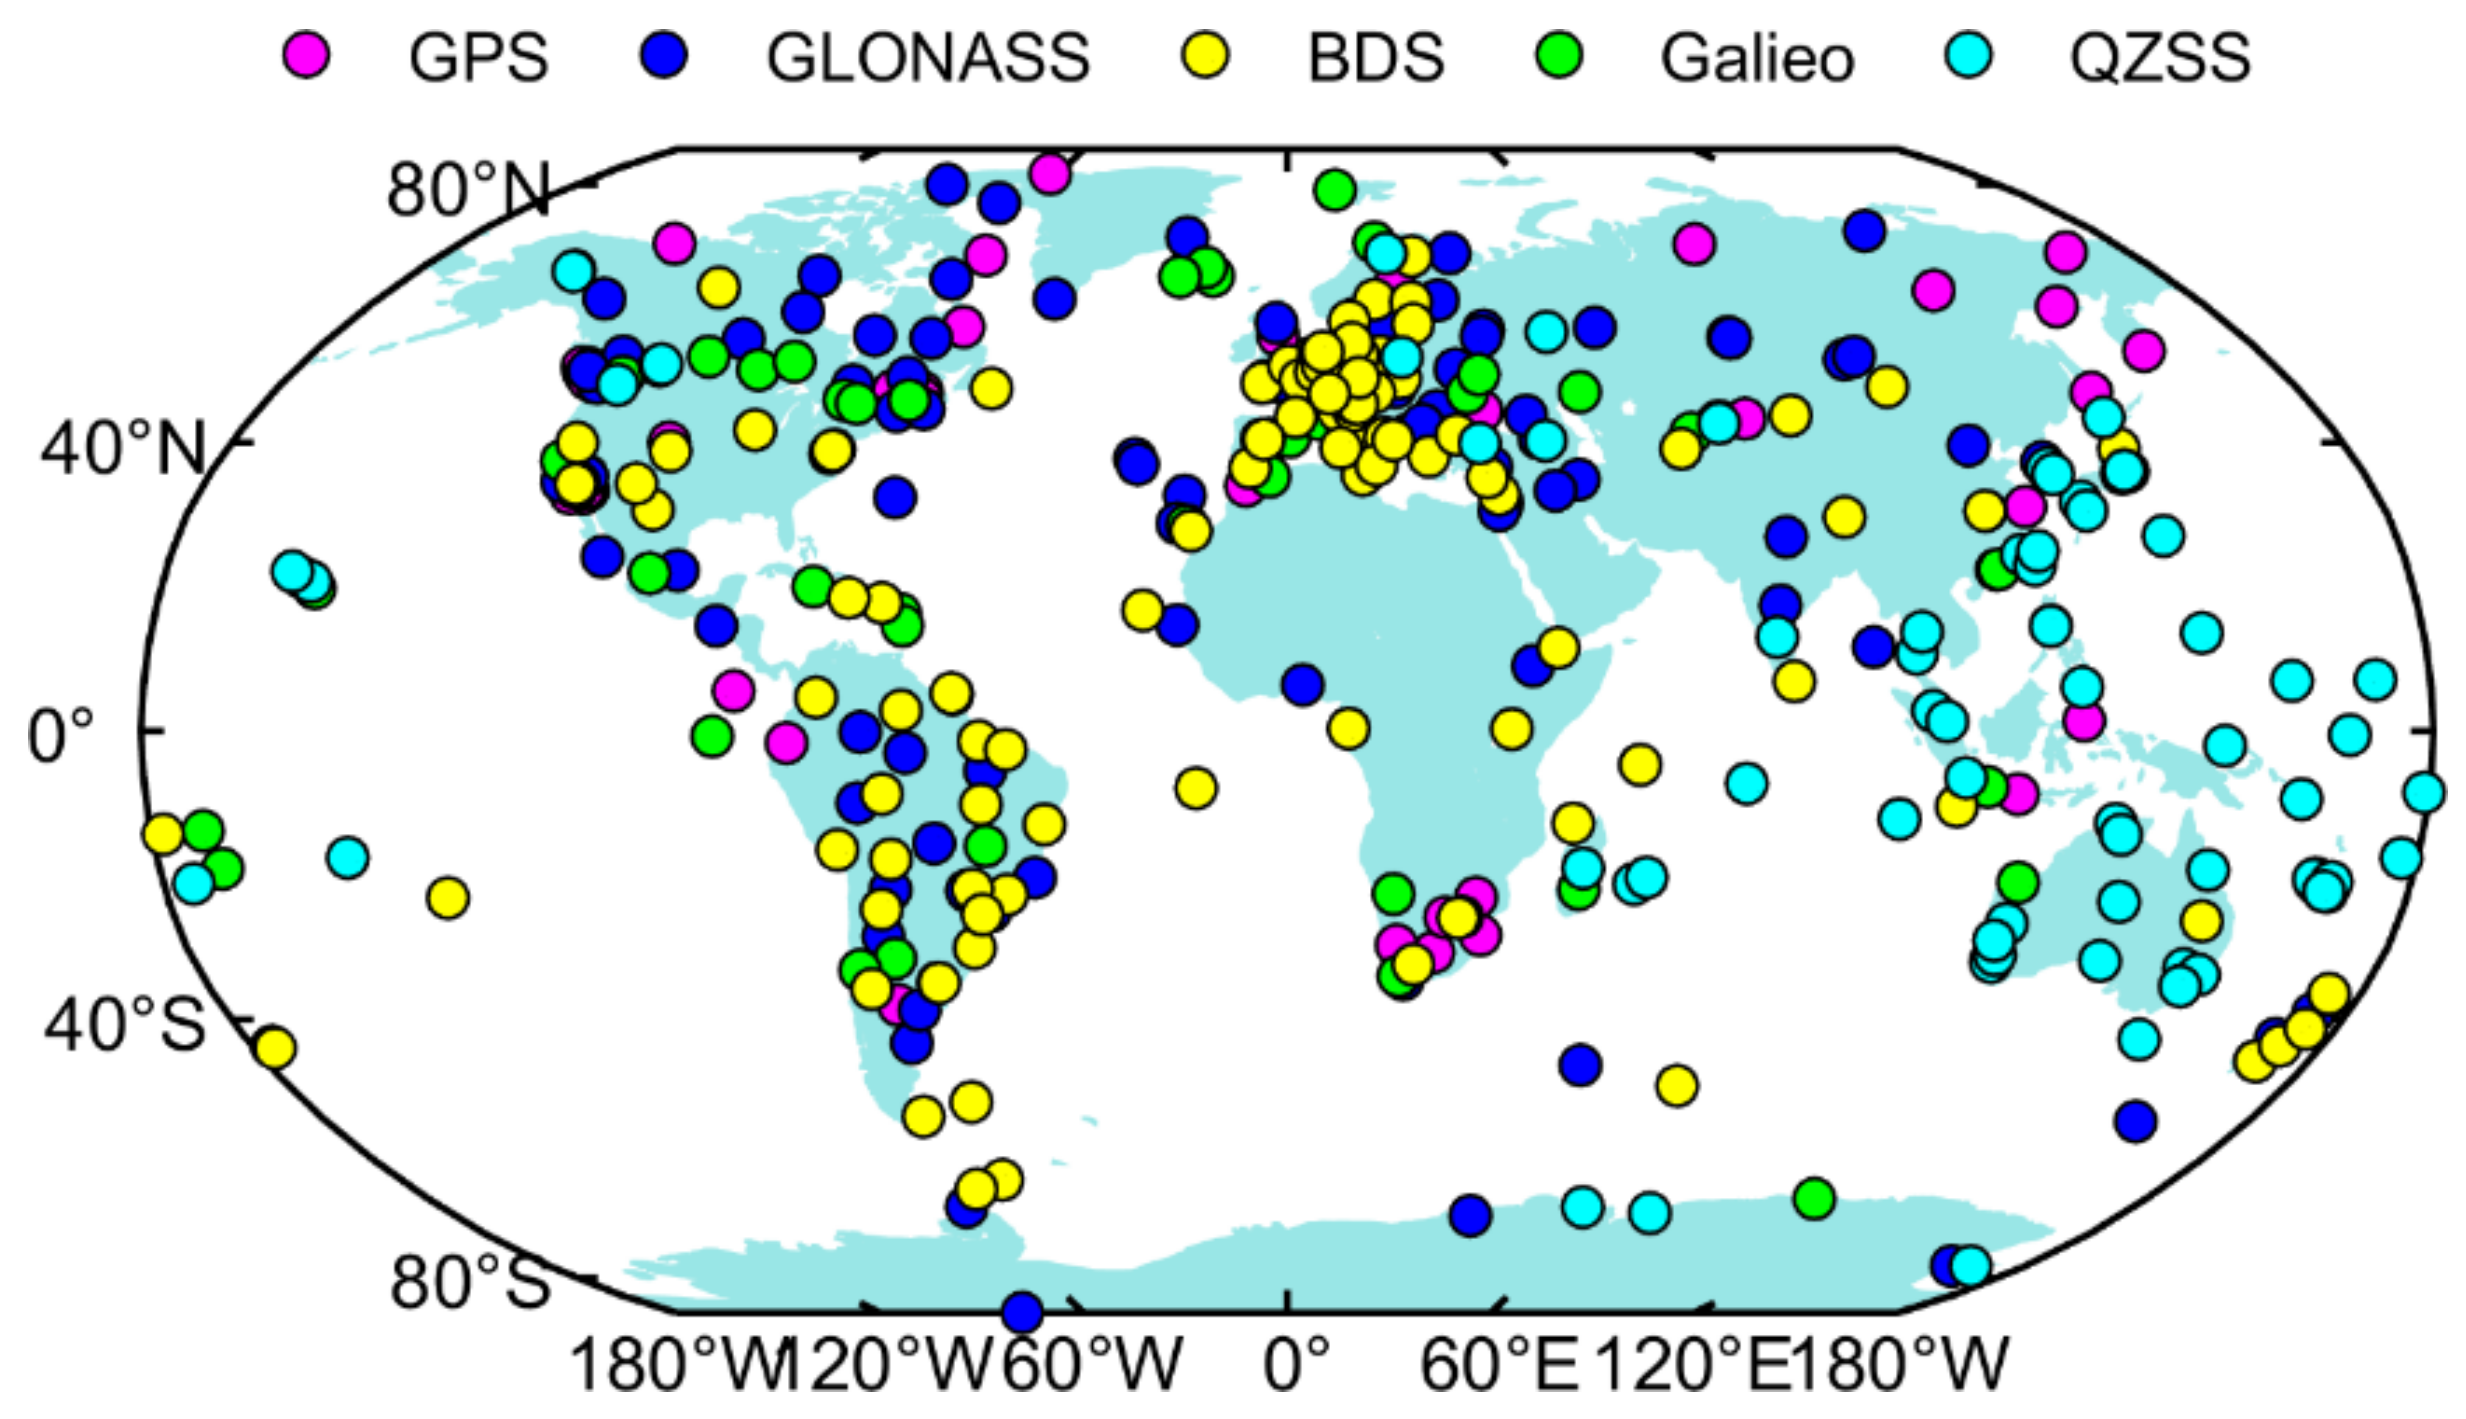
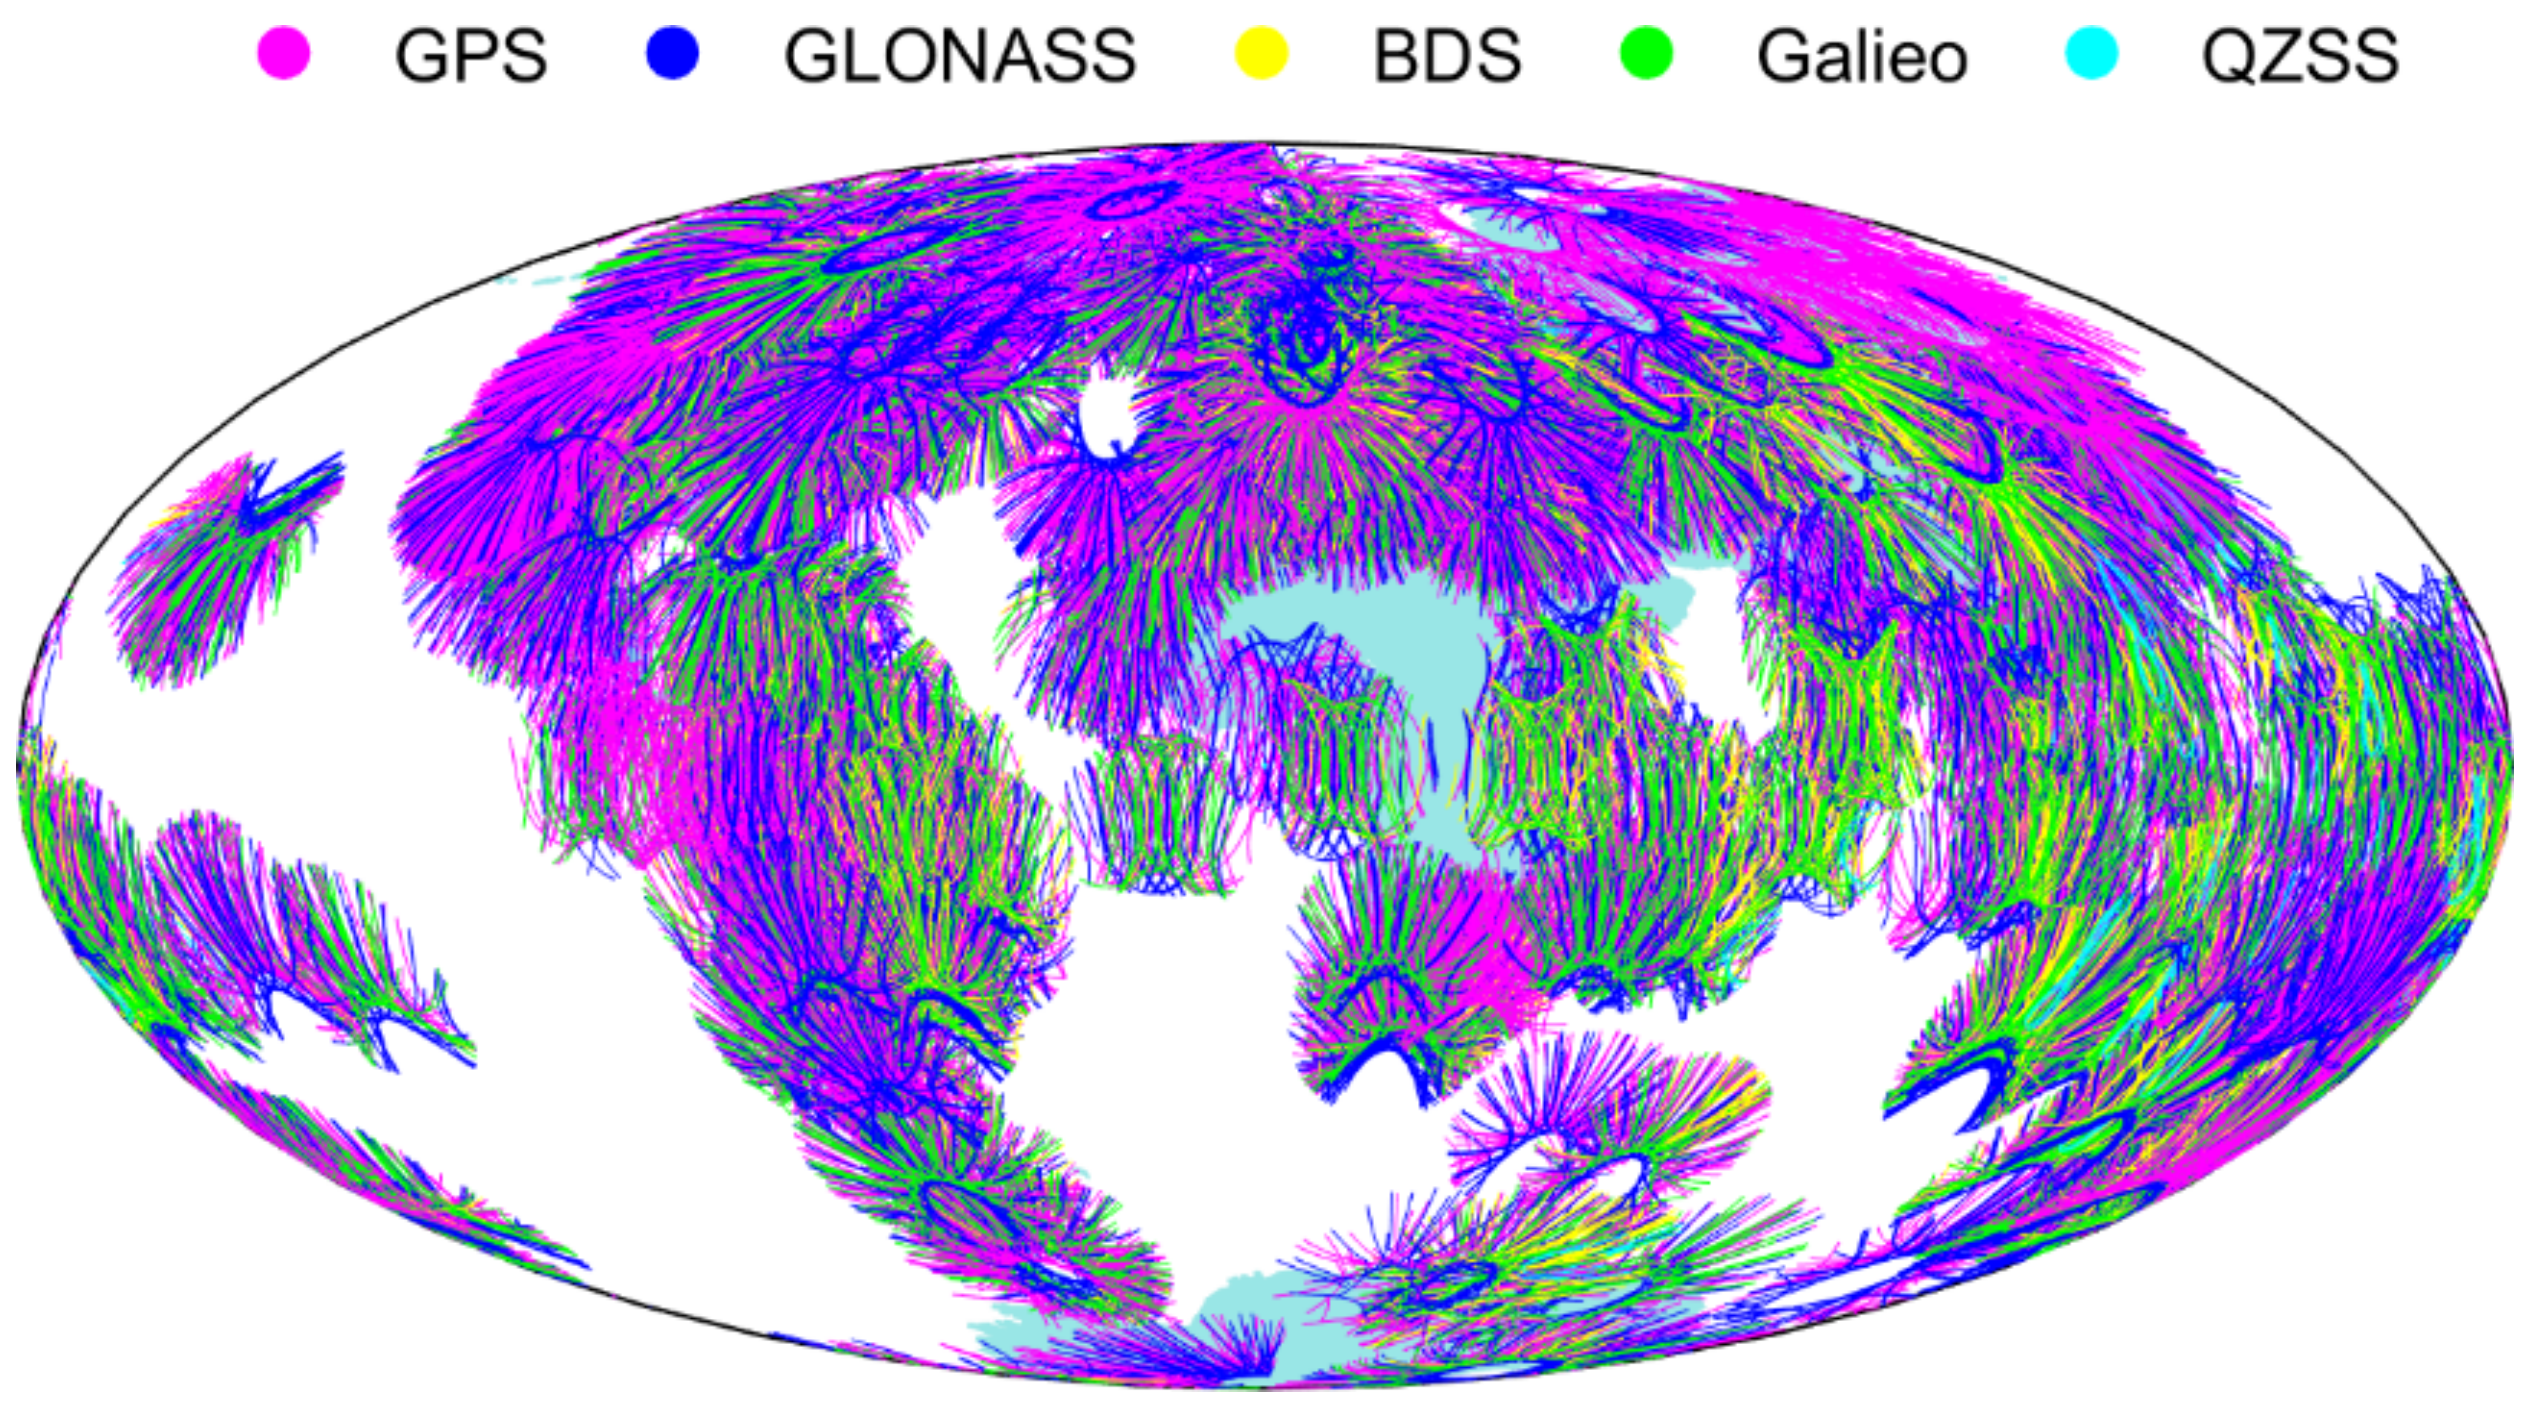
2.1. Ionospheric Observations

The GNSS pseudo range and carrier phase observations can be expressed as [22,23]
P i k , j = ρ i 0 , j + d i i o n , k , j + d i t r o p , j + c ( τ i τ j ) + d i k + d k , j + ε i P , k , j L i k , j = ρ i 0 , j d i i o n , k , j + d i t r o p , j + c ( τ i τ j ) λ ( b i k , j + N i k , j ) + ε i L , k , j
where P i k , j and L i k , j represent the pseudorange (code observation) and carrier phase observations, respectively, from station j to satellite i at frequency k . ρ i 0 , j represents the geometric distance between the station and satellite. d i i o n , k , j denotes the ionospheric delay, d i t r o p , j represents the tropospheric delay, c denotes the speed of light in a vacuum, and τ i and τ j represent the clock biases of the satellite and receiver, respectively. d i k and d k , j represent the hardware delays of the satellite and receiver at frequency k . λ represents the wavelength of the carrier phase. b i k , j represents the sum of phase biases of the satellite and receiver in the carrier phase observations. N i k , j represents the phase ambiguity of the carrier phase observations. ε i P , k , j and ε i L , k , j represent the noise in the pseudorange and carrier phase observations, respectively.
From the equations of code observations and phase observations, it can be seen that the ionospheric delay and hardware delay parameters are frequency-dependent, while other constituents such as satellite and receiver clock biases, geometric distance between the satellite and receiver, and tropospheric delay are frequency-independent. Therefore, based on this characteristic, the observations at two frequencies can be linearly combined without geometric information (taking the difference) to obtain the measurements of ionospheric delay. Ionospheric delay can be directly extracted using dual-frequency pseudorange observations or carrier phase observations. However, pseudorange observations have higher noise levels, resulting in lower precision for extracted ionospheric measurements. On the other hand, carrier phase observations have higher precision but require the fixing of ambiguity parameters, which limits their usability. Therefore, in general, the Carrier Phase Smoothing Pseudorange (CPSP) method is used to extract the ionospheric delay. The extracted measurements of ionospheric delay can be represented as [24]:
P 4 , s m = 40.3 ( 1 f 1 2 1 f 2 2 ) S T E C + c D C B i + c D C B j
where P 4 , s m is the observed ionospheric delay using dual-frequency carrier phase-smoothed pseudorange observations; the ionospheric delay in Equation (1) can be parameterized as d i i o n , k , j = 40.3 f k 2 S T E C , where S T E C is the total number of electrons on the observation path from the satellite to the station (1 TECu = 1 × 10¹⁶ electrons/m2), which is known as the slant ionospheric TEC; f 1 and f 2 are the first and the second frequencies of the observed value, respectively; and D C B i is the satellite Differential Code Bias, where D C B i = d i 1 d i 2 ; D C B j is the satellite Differential Code Bias where D C B j = d 1 , j d 2 , j . In order to facilitate the processing of ionospheric TEC parameters, the oblique ionospheric TEC is generally converted to the TEC in the vertical direction by the ionospheric TEC projection function, and the conversion equation can be expressed as [15]:
S T E C = F ( z ) V T E C = 1 / cos ( arcsin ( R R + H sin ( α z ) ) ) V T E C
where F ( z ) is the ionospheric projection function, which is considered under the single layer assumption; R is the mean radius of the Earth; H is the height of the hypothetical thin ionosphere; z is the zenith distance of the receiver-to-satellite direction at the hypothetical thin ionosphere; and α is the tuning factor, which generally takes the value of 0.9782. Therefore, Equation (2) can be further expressed as follows [24,25]:
P 4 , s m = F ( f ) F ( z ) V T E C + c D C B i + c D C B j
From Equation (4), it can be observed that for a particular station at a given epoch, each observation for every satellite (i.e., each piercing point) contains two parameters: ionospheric Vertical Total Electron Content (VTEC) and the combination of Differential Code Biases of satellite and receiver. If station j can observe i satellites with N observations, the number of parameters to be estimated is N + i, which consists of N ionospheric VTEC values and i combinations of satellite and receiver DCBs. Here, the DCB values for the satellites and receiver are considered as a single parameter to be estimated per day. Clearly, direct solving of Equation (4) is not possible. To estimate the DCB parameters, common methods include modeling the VTEC or using available Global Ionospheric Maps (GIMs) to eliminate the VTEC parameters and obtain the DCB parameters.

2.2. Ionospheric TEC Modeling and DCB Estimation

Ionospheric modeling frequently employs spherical harmonic functions, and in this study, a 15th-order spherical harmonic function is used for global ionospheric Total Electron Content (TEC) modeling. Combining this with Equation (4), the observation equation for spherical harmonic function modeling can be represented as [26,27]:
n = 0 n max m = 0 n P ˜ n m ( sin β ) ( a n m cos m s + b n m sin m s ) F ( f ) F ( z ) + c D C B j + c D C B i = P 4 , s m
where n and m represent the degree and order of the spherical harmonic function, β and m s represent the geomagnetic latitude and daily fixed longitude of the piercing point, and a n m and b n m represent the unknown coefficients of the model.
In this study, the sampling rate of the GNSS observation data for ionospheric Total Electron Content (TEC) modeling is set to 30 s, with a cutoff elevation angle of 10 degrees. Due to the relationship between the accuracy of the Carrier Phase Smoothing Pseudorange (CPSP) method and the length of the continuous arc segment, observations with less than 120 epochs are removed during the smoothing process. Precise ephemeris data (obtained from MGEX products provided by Wuhan University) are used to calculate the coordinates of the piercing points. The spherical harmonic function model, which is currently employed by most IGS analysis centers, is selected for global ionospheric TEC modeling. The specific formula for the spherical harmonic model is as described in the previous text. A 15 × 15 order is chosen for the spherical harmonic model, with a thin ionospheric layer height set at 450 km [26,27].
For modeling spherical harmonics, a set of spherical harmonic coefficients is estimated every 2 h and divided into 12 intervals, resulting in 13 sets of coefficients estimated per day. A piecewise linear (PWL) strategy is employed to handle the coefficients of adjacent nodes. Simultaneously, the coefficients of the spherical harmonic functions and the satellite and receiver Differential Code Bias (DCB) values are estimated. Due to the correlation between satellite and receiver DCB values, which can cause a rank deficiency in the equations, a zero-mean constraint is applied to the satellite DCBs for each set of DCB values derived from dual-frequency observations. Since each piercing point generates an observation equation, the dimensionality of the observation equations is large. To facilitate the adjustment process, a normal equation stacking technique is used for adjustment estimation, which reduces matrix storage requirements and improves computational speed. Additionally, to prevent negative Total Electron Content (TEC) values in the output grid model, inequality constraint equations are added during the adjustment process [26]. Therefore, the final estimated parameters consist of 13 sets of spherical harmonic coefficients and values for various receiver and satellite DCB classes.

2.3. Data

In order to verify the accuracy of multi-mode and multi-frequency GNSS ionospheric modeling, the data provided by the IGS and the MGEX are used; the IGS mainly provides GPS and GLONASS observations, and the MGEX provides multi-frequency observations from other systems; the number of stations is more than 400, and the study period covers the month of January 2019 (days of the year 001–030). The distribution of GNSS stations is given in Figure 1, where different GNSS systems are indicated by different colored dots, and almost all stations can track GPS and GLONASS signals. It can be seen that the GNSS stations are basically evenly distributed in the land area, while the ocean area has fewer stations distributed in it. Figure 2 shows the distribution of GNSS satellite IPPs on 002, 2019, also using different colors to distinguish different GNSS systems. From the figure, it can be seen that the IPPs can cover most of the global land areas, with GPS and GLONASS observations contributing the main part, while other systems can also be found to play an augmenting role in some regions, for example, BDS and Galileo in the Asian and European regions and QZSS in the Asia–Pacific region.

3. Results

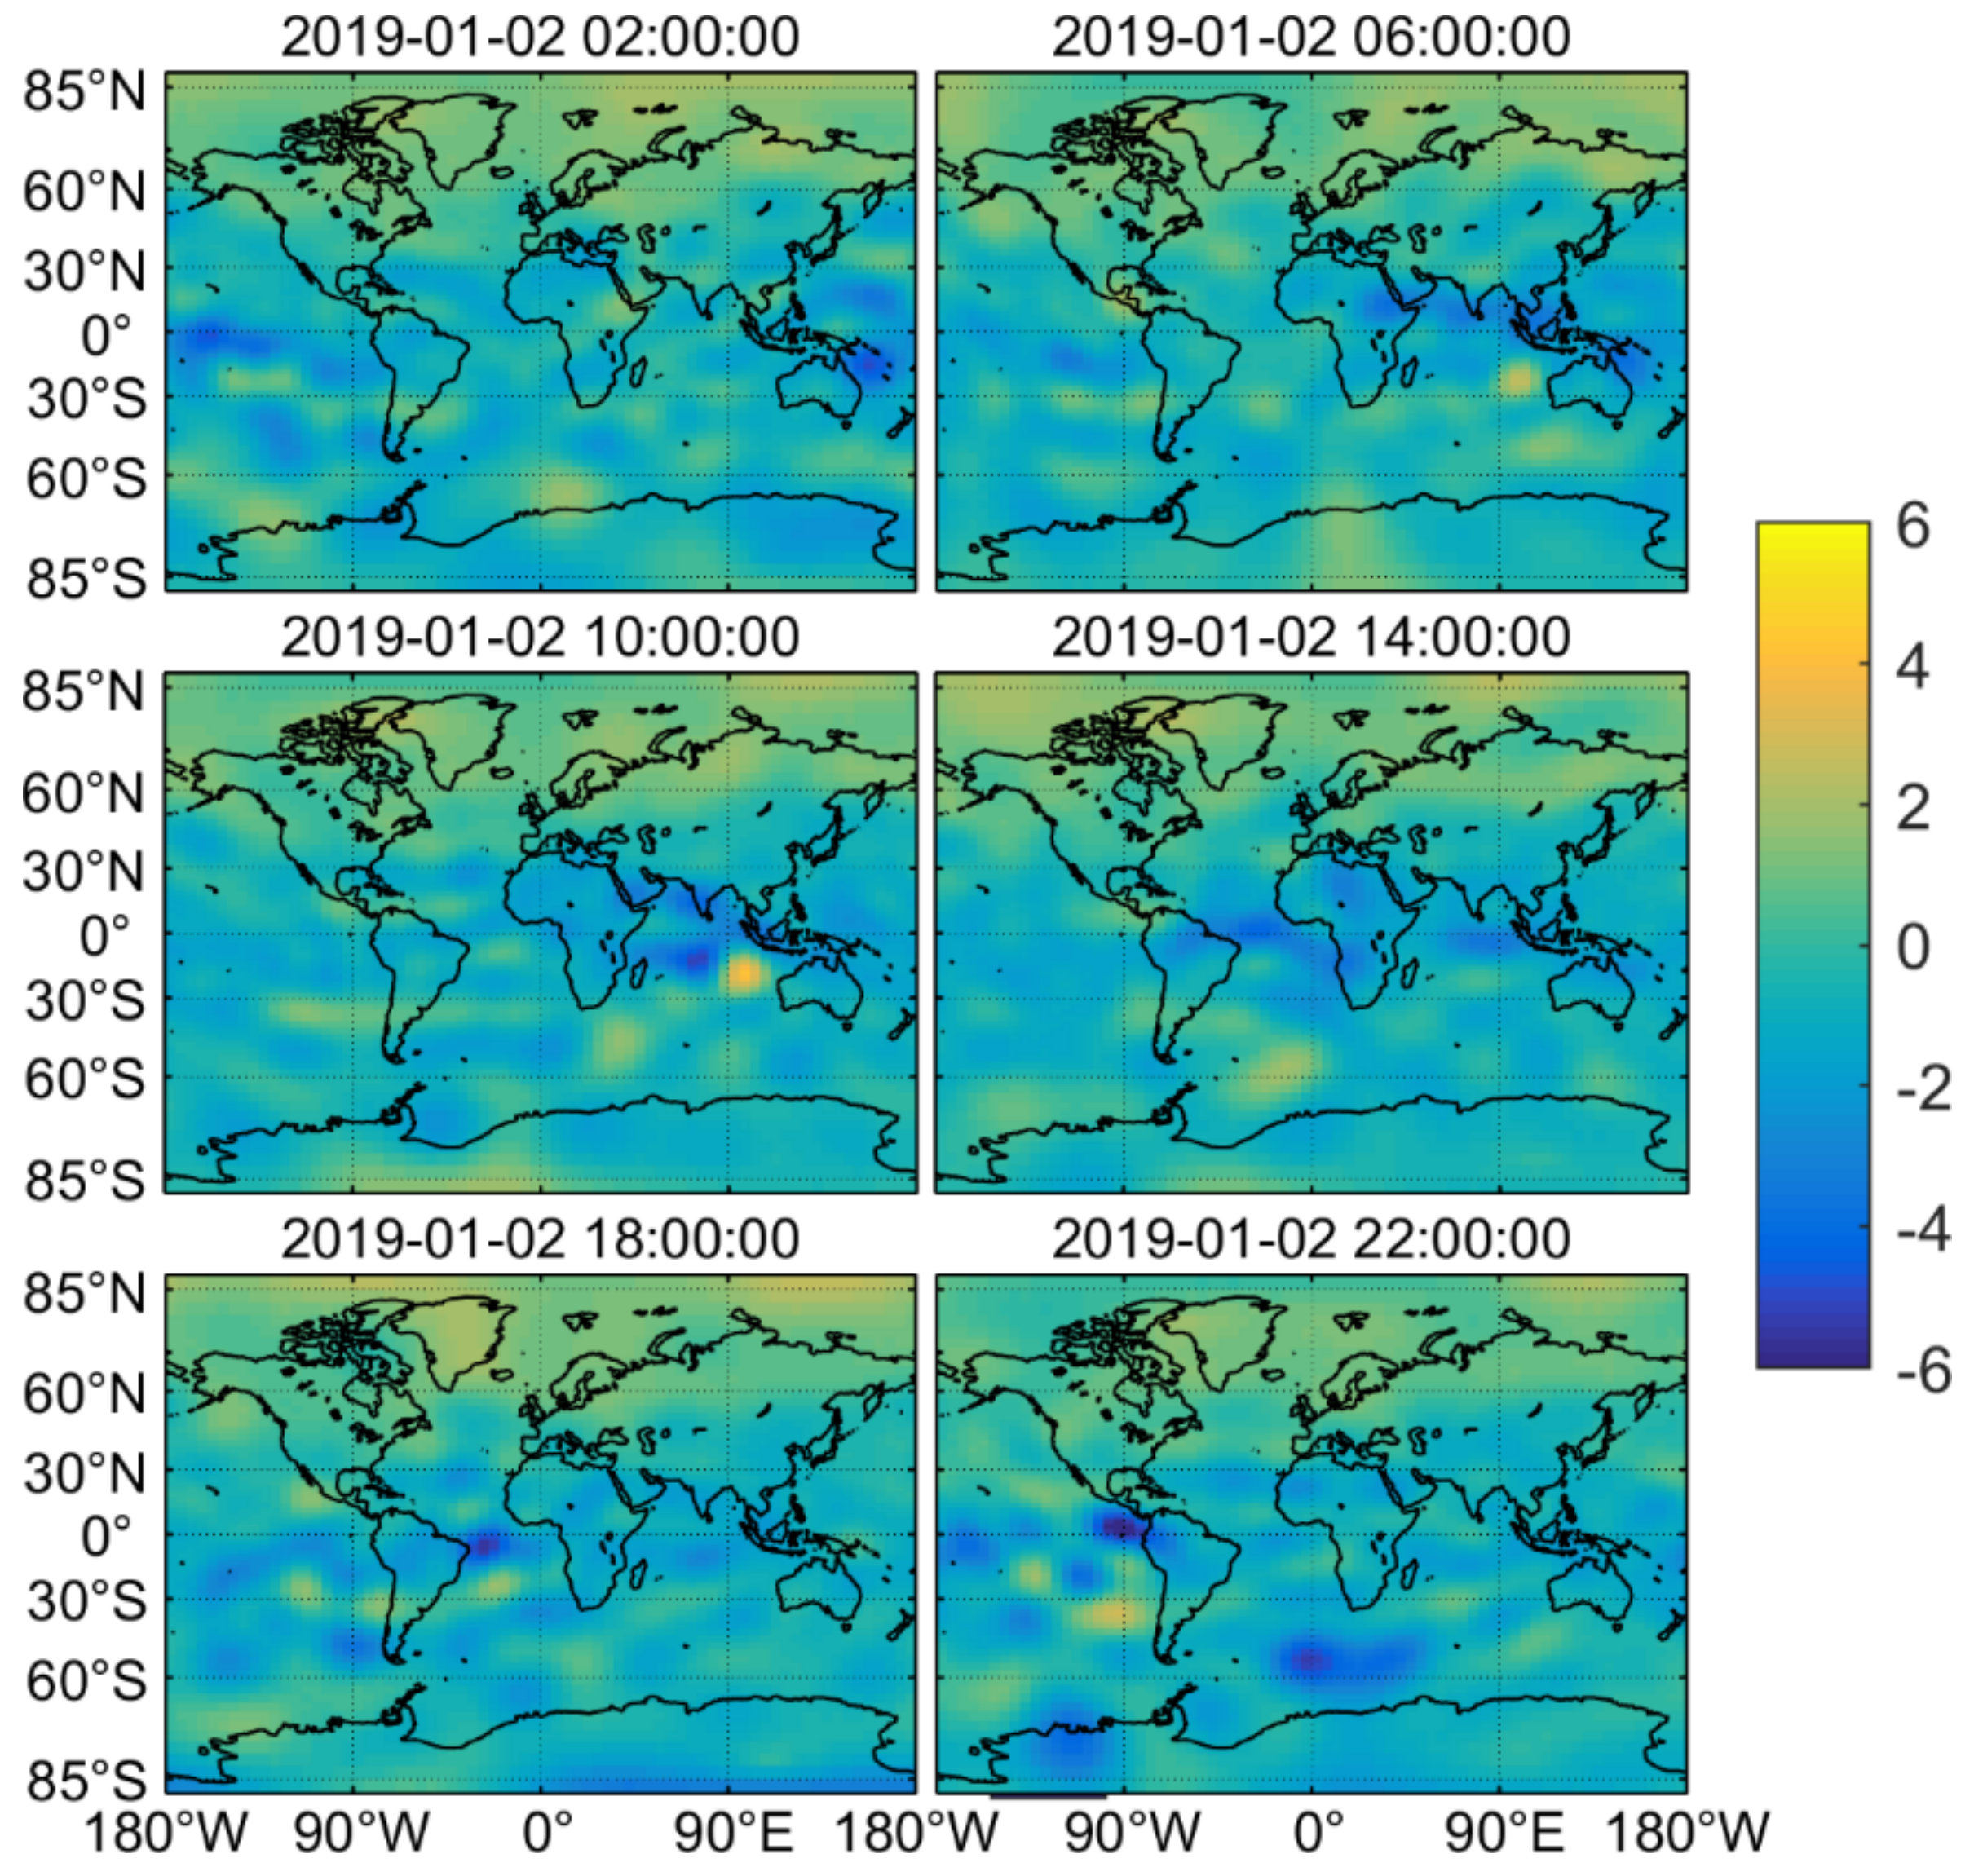
3.1. Ionospheric TEC Modeling

The global ionospheric grid model for January 2019 is generated using multi-mode and multi-frequency GNSS observations based on the methodology described in the previous section, and the spatial distribution of the global ionospheric TEC for a total of 6 epochs on day 002/2019, namely, 02, 06, 10, 14, 18, and 22, is given in Figure 3. From the figure, it can be seen that the maximum value of ionospheric TEC is approximately 30 TECu in that day, and the maximum TEC value can be found in the region of low latitude (especially near the equator) in each moment, while the TEC values more to the north and south are lower, and some values are close to 0.
In order to further analyze the accuracy of the estimated ionospheric grid model, the difference maps of the ionospheric lattice TEC for the six epochs described in the previous section were plotted using the ionospheric gride map provided by the CODE as a reference, as shown in Figure 4. From the figure, it can be seen that the difference between the ionospheric TEC at different epochs and the CODE’s product is within ±6 TECu, and within ±2 TECu in most regions. This indicates that the global ionospheric grid map estimated in this paper is in good agreement with the product provided by the CODE.
In order to further validate the accuracy of the global ionospheric grid model estimated in this paper, the bias and RMS between our estimated results and the GIM products provided by the CODE were statistically calculated, as shown in Figure 5, which also demonstrates the bias and RMS of the GIMs generated by other analyzing organizations relative to the CODE, where the GIM indicates the results of this paper. From the figure, it can be seen that the GIMs provided by JPL and UPC have obvious systematic deviations from the CODE, which are approximately 2 TECu. The GIMs from WHU and CAS are in best agreement with the CODE, which is due to the fact that all of them use the same modeling strategy and all of them use GPS + GLONASS dual-frequency observations. The results of this paper are comparable to the accuracy of ESA and slightly lower than WHU and CAS, although this paper also uses the same modeling strategy as the CODE but uses multi-mode and multi-frequency observations, so there is some bias, which can also be seen in the average deviation of the statistics, and the mean bias of the GIM estimated in this paper relative to the CODE ranges from −0.5 to −1 TECu. The one-month statistics show that the mean deviations of the GIM estimated by JPL/UPC/ESA/WUH/CAS and in this paper relative to the GIM of the CODE are 1.87, 1.30, −0.10, 0.01, −0.02, and −0.71 TECu, respectively, and the RMS is 2.12, 2.00, 1.33, 0.88, 0.88, 1.30 TECu. Although dual-frequency observations from GPS and GLONASS are commonly used for ionospheric modeling by IGS analysts at present, with the rapid development of multi-mode and multi-frequency GNSS, it will become a trend to use more GNSS observations in GNSS ionospheric modeling in the future.

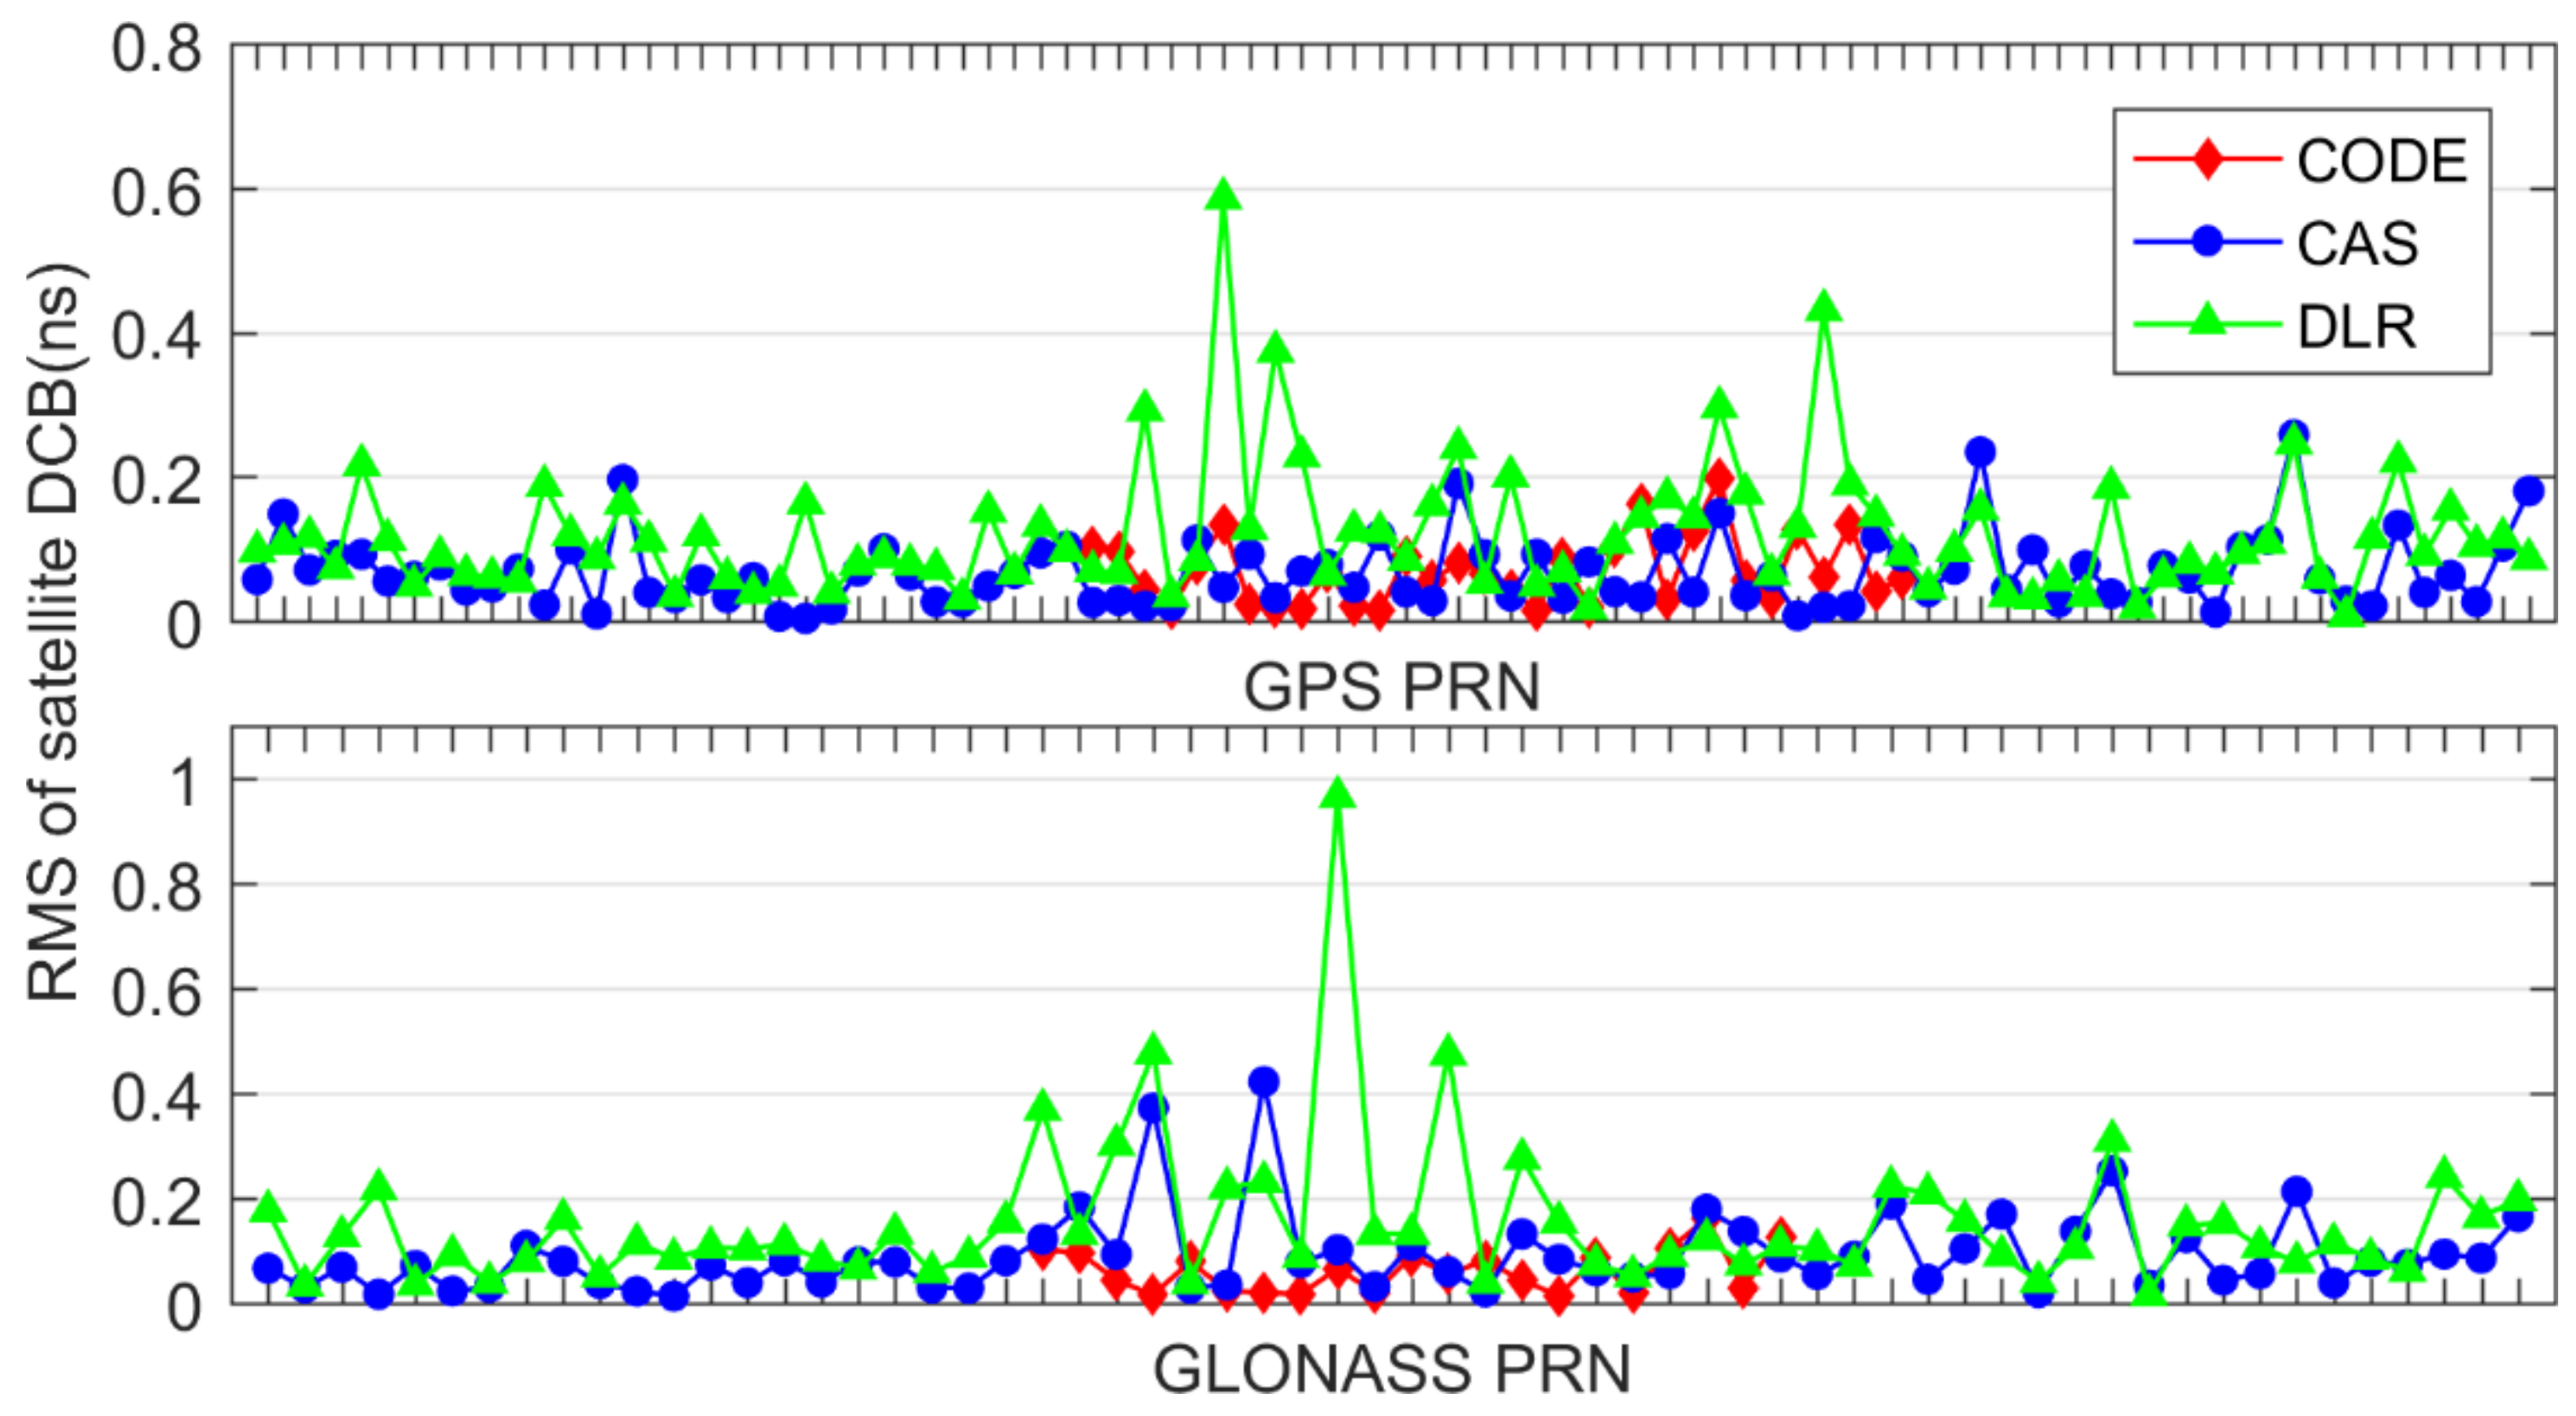
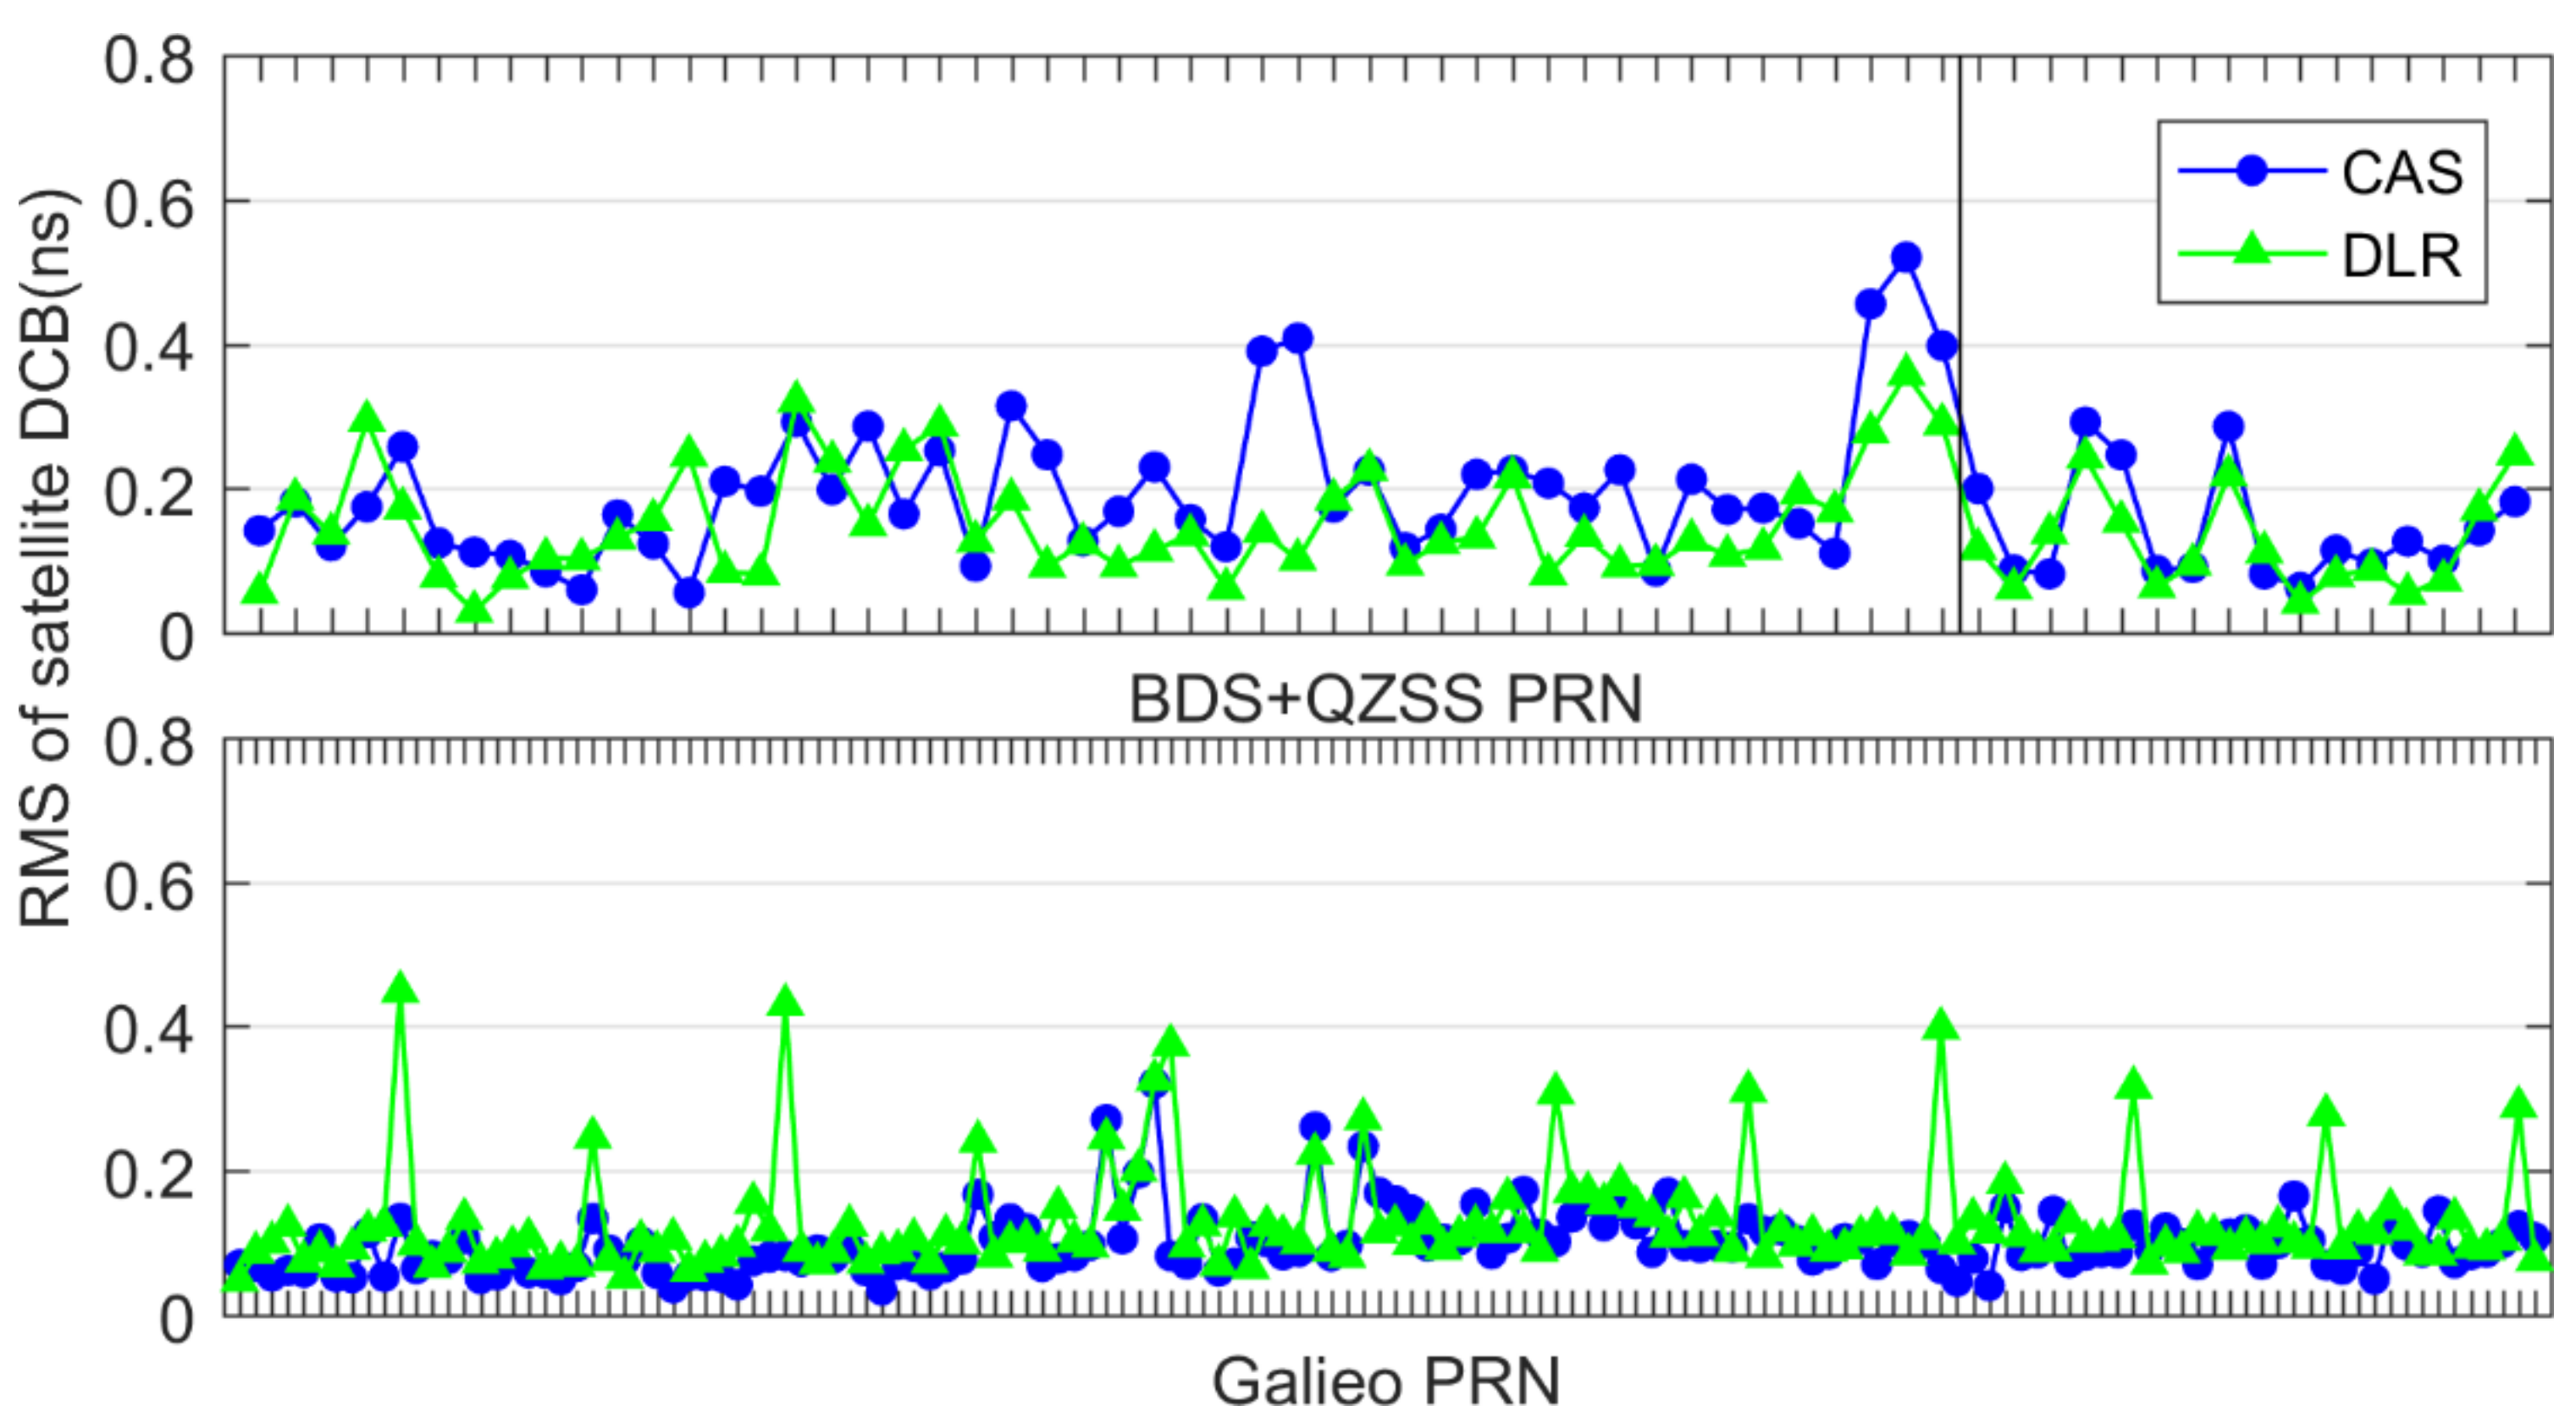
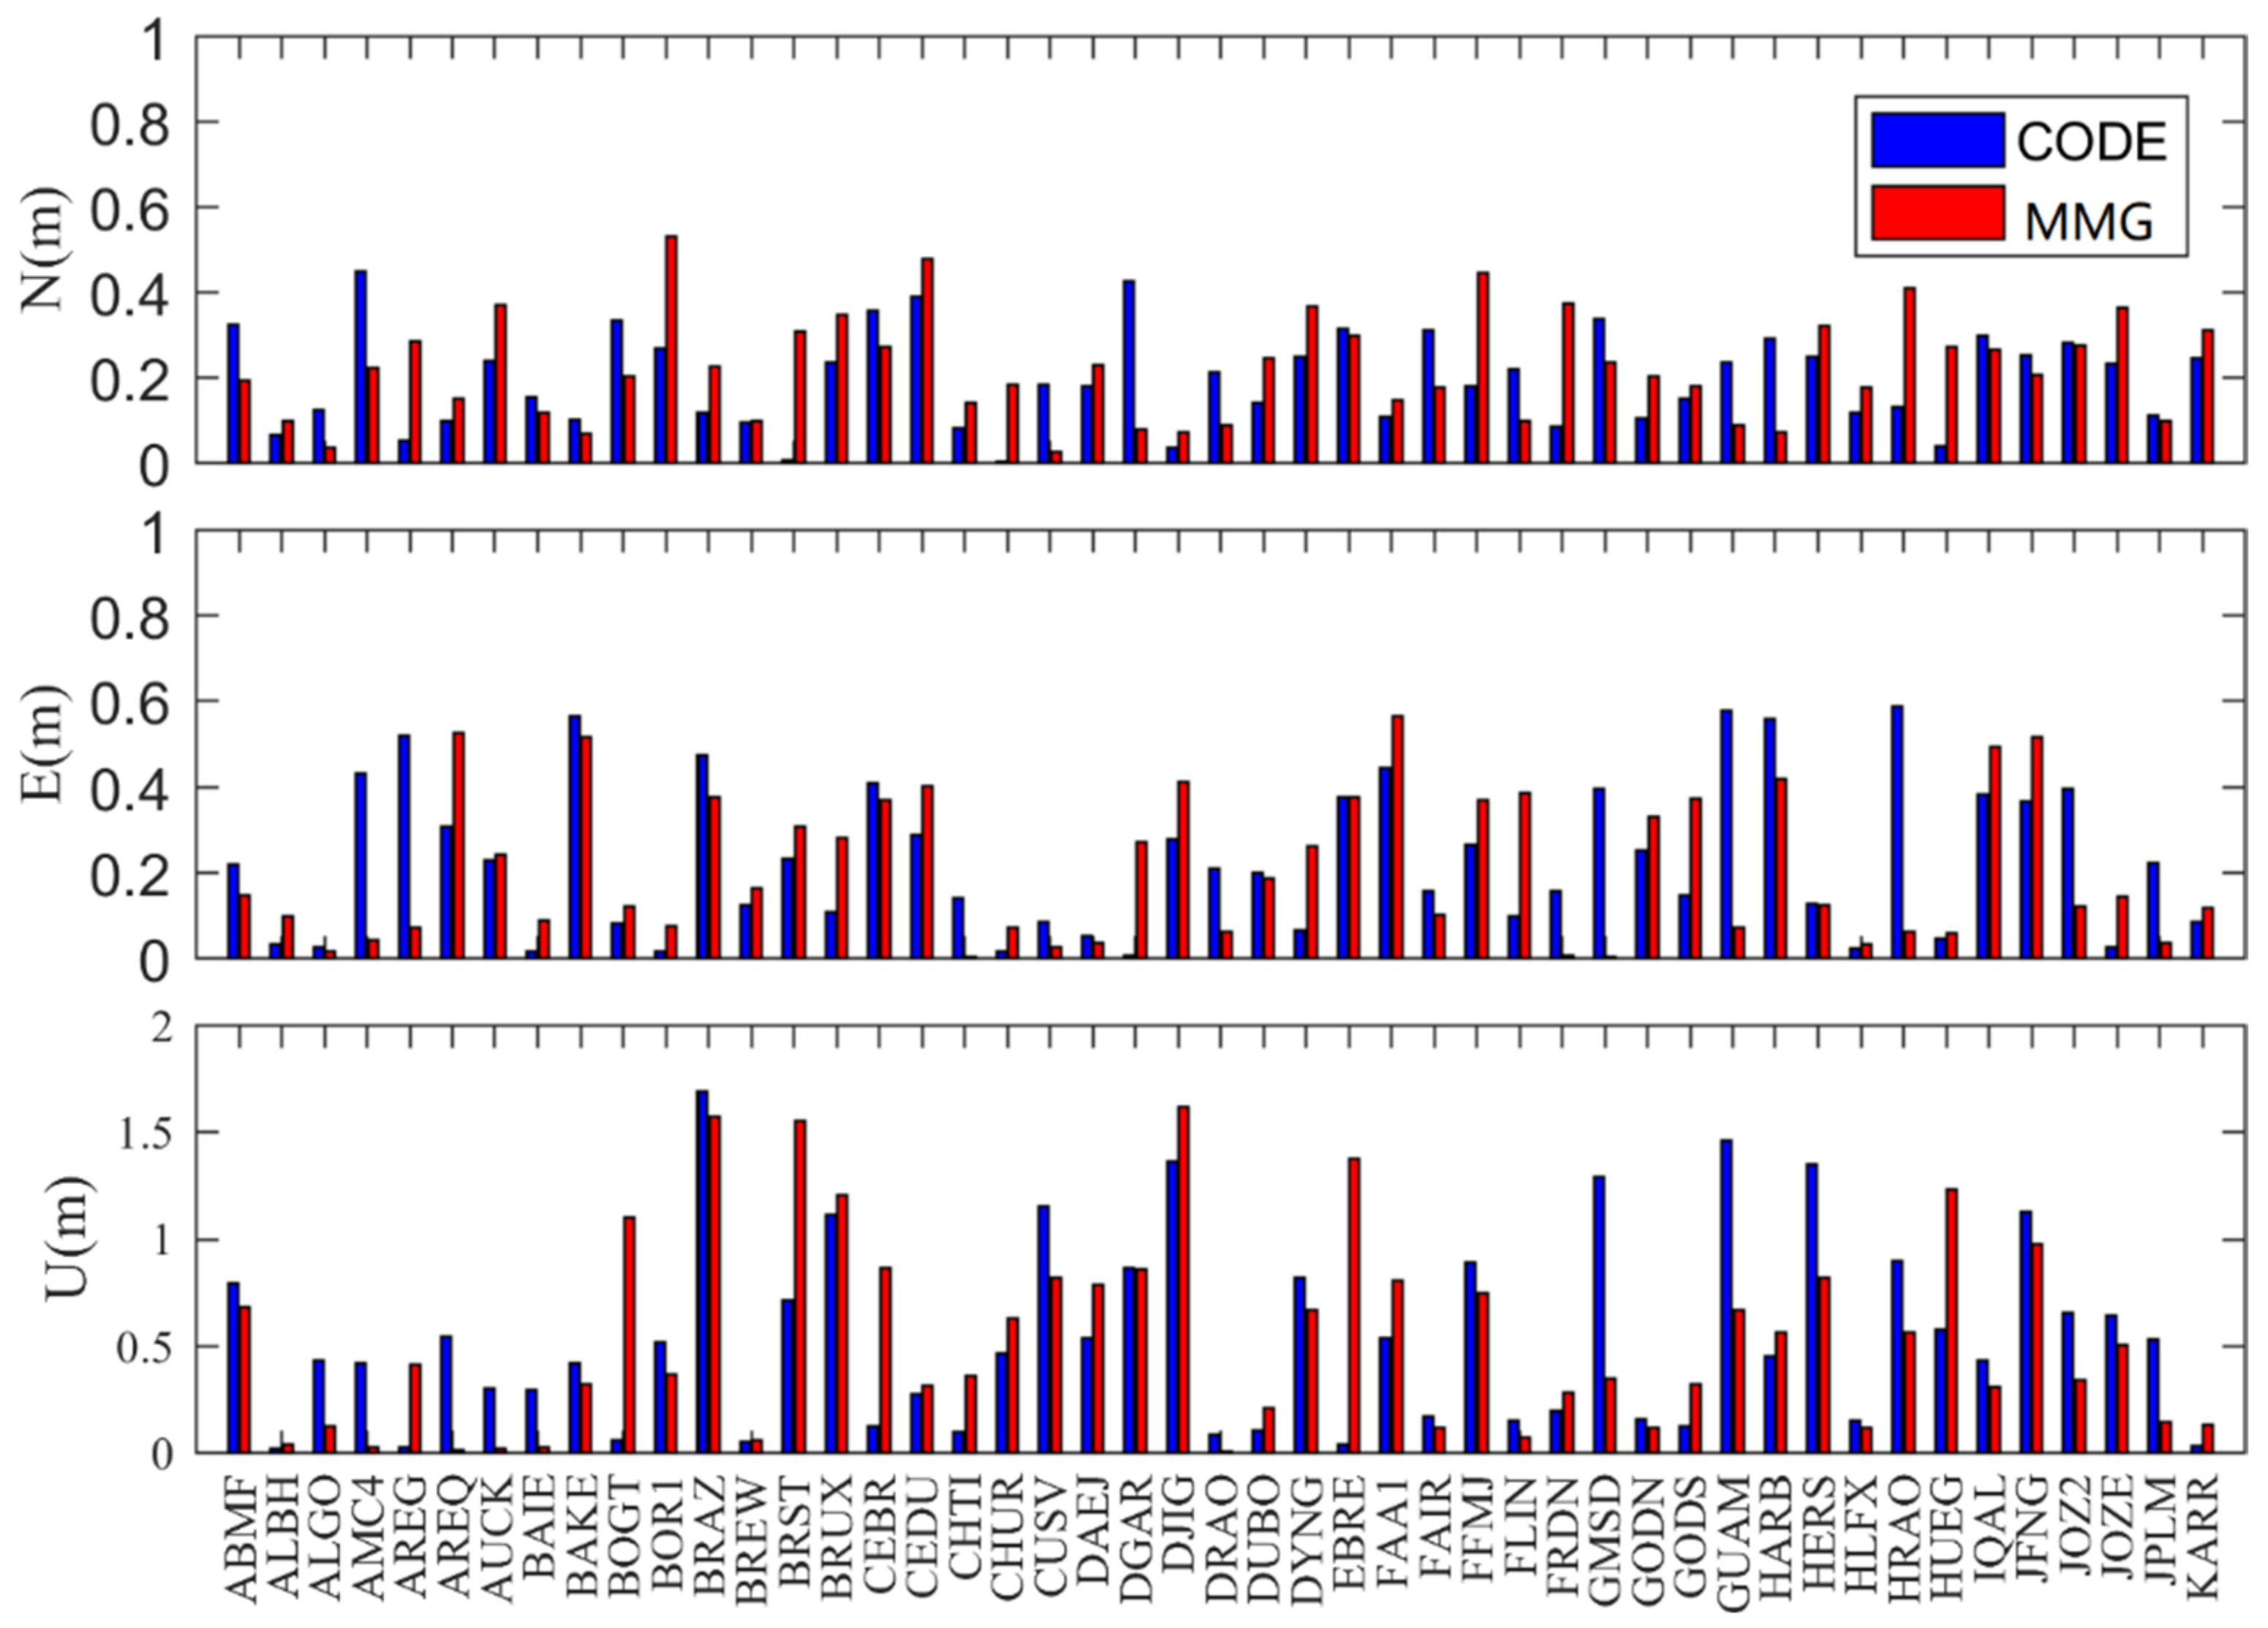
3.2. Satellite and Receiver DCB Estimation

Ionospheric modeling using multiple types of GNSS observations (19 types are used in this paper) also needs to determine different types of GNSS satellite and receiver DCB values, which can be seen in the Table 1. The accuracy of the VTEC modeling is heavily dependent on the accuracy of the DCB valuation as well. The RMS results of the statistically estimated satellite DCB values are obtained using the DCB product values provided by DLR, CAS, and the CODE (CODE delivers only C1W-C2W for GPS and C1P-C2P for GLONASS) as references.
The RMS values of the satellite DCBs of GPS and GLONASS estimated in this paper with respect to the MGEX product are given in Figure 6, where the upper figure shows the results of the four types of DCBs of GPS and the lower figure shows the results of the three types of DCBs of GLONASS, with the horizontal coordinates arranged in order of the satellites corresponding to the different DCB types. Taking GPS PRN as an example, this represents the satellite numbers of four types of satellite DCBs along the X-axis. From the figure, it can be seen that most of the RMS values of the four types of satellite DCBs of GPS are within 0.2 ns, especially the RMS values of C1W-C2W relative to the CODE, which are basically within 0.1 ns, which indicates that the consistency of the DCBs with the CODE is very good. Most of the RMS values of satellite DCBs of GLONASS are within 0.2 ns, and the RMS values of C1P-C2P relative to the CODE are also smaller. The RMS of C1P-C2P is also smaller. This is related to the fact that the spherical harmonic function is used in ionospheric modeling as in the CODE in this paper. From the RMS of the DCBs of GPS and GLONASS relative to that of DLR, some larger values can be found, mainly for the second type of DCBs (C1W-C2W and C1P-C2P) of GPS and GLONASS, which may be related to the fact that these two types of DCBs of DLR are not provided as products directly but are computed from other types of DCBs.
The RMS of the BDS, QZSS, and Galileo satellite DCBs estimated in this paper with respect to the DCB products provided by the MGEX is given in Figure 7, where the upper figure shows the RMS of the two types of BDS DCBs and the four types of QZSS DCBs separated by a solid line, and the lower figure shows the RMS of the six types of Galileo satellite DCBs, with all the horizontal coordinates arranged in the order of the satellites corresponding to the several types of DCBs. From the figure, it can be seen that most of the RMS values of the satellite DCBs of the three systems are within 0.2 ns relative to the MGEX products, and the largest value is approximately 0.6 ns.
Table 2 gives the estimated average RMS of DCBs for all types of satellites with respect to MGEX products, from which it can be seen that the RMS of several types of DCBs for GPS is mostly less than 0.1 ns, the RMS of three types of DCBs for GLONASS is mostly less than 0.2 ns, the RMS of DCBs of receivers for BDS is less than 0.2 ns, the value for Galileo and QZSS is in the range of 0.1 ns, and for Galileo and QZSS, it is approximately 0.1 ns. The RMS of the DCBs for Galileo and QZSS receivers is approximately 0.1 ns. This indicates that the satellite DCBs estimated simultaneously using ionospheric modeling are in good agreement with the products provided by the MGEX, and the estimated DCBs of GPS and GLONASS are more accurate. The accuracy of the satellite DCBs for GPS and GLONASS estimated in this paper is better when compared with the CODE product. On the one hand, this is due to the higher number of stations used in this section and to the fact that the global ionospheric modeling used in this section is the same strategy as CODE’s. On the other hand, the estimated BDS, Galileo, and QZSS have comparable accuracies.
Figure 8 gives the RMS values of the GNSS receiver DCBs relative to the MGEX products for the 13 selected MGEX stations, all of which are able to receive one class of observations from at least four systems simultaneously, including C1W-C2W for GPS, C1C-C2P for GLONASS, C2I-C7I for BDS, C1X-C5X for Galileo, and QZSS for C1X-C2X, where only two stations can receive the signal from QZSS, and the RMS values of different systems are indicated by different colors. From the figure, it can be seen that the RMS values of the receiver DCBs of most stations are within 1 ns, among which the RMS values of the receiver DCBs of GPS and GLONASS are relatively smaller, which is related to their more abundant observation data. Overall, the estimated receiver DCBs are in good agreement with the products provided by the MGEX. From the above analysis of the accuracy of the synchronized estimated satellite and receiver DCBs, it can be concluded that the accuracy of the estimated DCBs is comparable to that of the products provided by the MGEX.

4. Discussion

A comparison of our model with the GIM model provided by the IGS analysis center described in the foregoing section and the verification of the accuracy of the DCB estimated in this paper show that the estimated GIM is in good agreement with the product of the IGS analysis center and has comparable accuracy. In order to further verify the accuracy of the GIM generated in this paper, the observation data from 47 globally distributed stations for 30 days in January 2019 are used to conduct GPS dynamic single-frequency PPP experiments, and the experimental results of the GIM generated in this paper and the GIM provided by CODE in the single-frequency PPP are compared to statistically calculate the average RMS value of each station in the N, E, and U directions, as shown in Figure 9, where blue color represents the experimental results using CODE’s GIM and red color represents the results using the GIM in this paper.
From the figure, it becomes obvious that for all the stations in the plane position localization accuracy, most of the results using the CODE and the GIM in this paper are within 0.4 m, while the deviations in the up component are larger, and the RMS of some stations is more than 1 m. From a comparison of the results using the CODE and the GIM in this paper, it can be found that there is not a big difference between the two models in most of the stations, and there is no significant improvement in the accuracy of either one of them. In general, there is no obvious improvement in accuracy between the two. Some stations use the GIM of this paper with higher positioning accuracy than that of the CODE, but the results of some stations are not as good as those of the CODE, which indicates that the accuracy of the GIM generated from the multi-mode and multi-frequency GNSS observations used in this paper is comparable with that of the CODE, and the multi-type observation data does not show any special advantage, but the positioning accuracy of some stations is not as good as that of the CODE. This is usually related to the varying quality of the station receivers which track the satellite observations. But it may also be related to the accuracy of the GIM generated from the multi-mode and multi-frequency GNSS observations of different satellites of different systems. This may be related to the inconsistency of the accuracy of different types of observation data from different satellites, which is not considered in the modeling of this paper, and this needs to be further studied in the next step.
It should be noted that our objective is to test the performance of simultaneous ionospheric TEC modeling and satellite and receiver DCB estimation using multi-mode and multi-frequency GNSS observations. Therefore, the method of estimating only stations’ DCB and STEC using satellite DCBs provided by IGS was not adopted. Unlike IGS analysis centers such as the CODE, we use multi-mode and multi-frequency GNSS observation data, and it can be seen from the analysis results that the estimated TEC is reliable. However, the data used in this paper is in the quiet period of solar activity and the latest data are not used. More comparative studies during periods of active solar activity will continue in the next step.

5. Conclusions

Based on multi-mode and multi-frequency GNSS observation data, the method of phase smoothing pseudorange extraction of ionospheric observations and spherical harmonic modeling are used to establish the global ionospheric grid model, and the accuracy of the global ionospheric grid map provided by different IGS analysis institutions is analyzed and compared. Using the observations provided by the MGEX and IGS in January 2019 and the ionospheric grid map provided by the CODE as a reference, the statistical results show that the average deviations of the GIMs estimated by JPL/UPC/ESA/WUH/CAS and this paper relative to the GIMs of the CODE are 1.87, 1.30, −0.10, 0.01, −0.02, and −0.71 TECu; the RMS is 2.12, 2.00, 1.33, 0.88, 0.88, and 1.30 TECu. The simultaneous estimated satellite and receiver DCBs are in good agreement with the DCB products provided by the MGEX, and the experiments with single-frequency PPP also show that the GIM generated from the multi-mode and multi-frequency GNSS observations used in this paper is comparable to the accuracy of the CODE, but the multiple-type observation data do not show any special advantage; however, the positioning accuracy of some stations is not as good as the CODE, which may be related to the inconsistency of the accuracy of different types of observation data from different satellites of different systems; this is not taken into account in the modeling of this paper, which needs to be continued in the next step of the study.

Author Contributions

Conceptualization of the manuscript idea: Q.W.; methodology and software: Q.W. and J.Z.; writing―original draft preparation: Q.W. and F.H.; supervision and funding acquisition: Q.W. All authors have read and agreed to the published version of the manuscript.

Funding

This research was funded by the Outstanding Youth Project of the Education Department of Hunan Province (No. 22B0176) and the Key Laboratory of Geospace, Environment, and Geodesy, Ministry of Education, Wuhan University (No. 21-01-06).

Data Availability Statement

The GNSS observation data from IGS MGEX networks can be obtained at https://cddis.nasa.gov/archive/gps/data/daily/ (accessed on 1 June 2023). The precise orbit products from GFZ are available at https://www.gfzpotsdam.de/GNSS/products/mgex/ (accessed on 1 June 2023). The GIM products from the CODE are available at https://cddis.nasa.gov/archive/gnss/products/ionex/ (accessed on 1 June 2023). The DCB products provided by CAS and DLR can be obtained at https://cddis.nasa.gov/archive/gnss/products/bias/ (accessed on 1 June 2023).

Acknowledgments

The authors gratefully acknowledge the DLR and CAS for providing products and IGS for providing MGEX data.

Conflicts of Interest

The authors declare no conflict of interests.

References

  1. Hernández-Pajares, M.; Juan, J.M.; Sanz, J.; Aragón-Àngel, À.; García-Rigo, A.; Salazar, D.; Escudero, M. The ionosphere: Effects, GPS modeling and the benefits for space geodetic techniques. J. Geod. 2011, 85, 887–907. [Google Scholar] [CrossRef]
  2. Jin, S.; Occhipinti, G.; Jin, R. GNSS ionospheric seismology: Recent observation evidences and characteristics. Earth-Sci. Rev. 2015, 147, 54–64. [Google Scholar] [CrossRef]
  3. Yuan, Y.; Tscherning, C.C.; Knudsen, P.; Xu, G.; Ou, J. The ionospheric eclipse factor method (IEFM) and its application to determining the ionospheric delay for GPS. J. Geod. 2008, 82, 1–8. [Google Scholar] [CrossRef]
  4. Klobuchar, J.A. Ionospheric Time-Delay Algorithm for Single-Frequency GPS Users. IEEE Trans. Aerosp. Electron. Syst. 1987, AES-23, 325–331. [Google Scholar] [CrossRef]
  5. Prieto-Cerdeira, R.; Orús-Pérez, R.; Breeuwer, E.; Lucas-Rodriguez, R.; Falcone, M. Performance of the Galileo Single-Frequency Ionospheric Correction During In-Orbit Validation. GPS World 2014, 6, 53–58. [Google Scholar]
  6. Yuan, Y.; Wang, N.; Li, Z.; Huo, X. The BeiDou global broadcast ionospheric delay correction model (BDGIM) and its preliminary performance evaluation results. Navigation 2019, 66, 55–69. [Google Scholar] [CrossRef]
  7. Su, K.; Jin, S. Analytical performance and validations of the Galileo five-frequency precise point positioning models. Measurement 2021, 172, 108890. [Google Scholar] [CrossRef]
  8. Rovira-Garcia, A.; Ibáñez-Segura, D.; Orús-Perez, R.; Juan, J.M.; Sanz, J.; González-Casado, G. Assessing the quality of ionospheric models through GNSS positioning error: Methodology and results. GPS Solut. 2019, 24, 4. [Google Scholar] [CrossRef]
  9. Feng, J.; Zhang, Y.; Li, W.; Han, B.; Zhao, Z.; Zhang, T.; Huang, R. Analysis of ionospheric TEC response to solar and geomagnetic activities at different solar activity stages. Adv. Space Res. 2023, 71, 2225–2239. [Google Scholar] [CrossRef]
  10. Li, W.; Yue, J.; Yang, Y.; Li, Z.; Guo, J.; Pan, Y.; Zhang, K. Analysis of ionospheric disturbances associated with powerful cyclones in East Asia and North America. J. Atmos. Sol.-Terr. Phys. 2017, 161, 43–54. [Google Scholar] [CrossRef]
  11. Tariq, M.A.; Shah, M.; Inyurt, S.; Shah, M.A.; Liu, L. Comparison of TEC from IRI-2016 and GPS during the low solar activity over Turkey. Astrophys. Space Sci. 2020, 365, 179. [Google Scholar] [CrossRef]
  12. Li, W.; Yue, J.; Wu, S.; Yang, Y.; Li, Z.; Bi, J.; Zhang, K. Ionospheric responses to typhoons in Australia during 2005–2014 using GNSS and FORMOSAT-3/COSMIC measurements. GPS Solut. 2018, 22, 61. [Google Scholar] [CrossRef]
  13. Wang, Q.; Jin, S.; Ye, X. A Novel Method to Estimate Multi-GNSS Differential Code Bias without Using Ionospheric Function Model and Global Ionosphere Map. Remote Sens. 2022, 14, 2002. [Google Scholar] [CrossRef]
  14. Wang, N.; Li, Z.; Duan, B.; Hugentobler, U.; Wang, L. GPS and GLONASS observable-specific code bias estimation: Comparison of solutions from the IGS and MGEX networks. J. Geod. 2020, 94, 74. [Google Scholar] [CrossRef]
  15. Schaer, S. Mapping and Predicting the Earth’s Ionosphere Using the Global Positioning System; Astronomical Institute, University of Berne: Bern, Switzerland, 1999. [Google Scholar]
  16. Roma-Dollase, D.; Hernández-Pajares, M.; Krankowski, A.; Kotulak, K.; Ghoddousi-Fard, R.; Yuan, Y.; Li, Z.; Zhang, H.; Shi, C.; Wang, C.; et al. Consistency of seven different GNSS global ionospheric mapping techniques during one solar cycle. J. Geod. 2018, 92, 691–706. [Google Scholar] [CrossRef]
  17. Rizos, C.; Montenbruck, O.; Weber, R.; Weber, G.; Neilan, R.; Hugentobler, U. The IGS MGEX experiment as a milestone for a comprehensive multi-GNSS service. In Proceedings of the ION PNT, Honolulu, HI, USA, 23–25 April 2013; pp. 289–295. [Google Scholar]
  18. Montenbruck, O.; Steigenberger, P.; Khachikyan, R.; Weber, G.; Langley, R.; Mervart, L.; Hugentobler, U. IGS-MGEX: Preparing the ground for multi-constellation GNSS science. Inside Gnss 2014, 9, 42–49. [Google Scholar]
  19. Montenbruck, O.; Steigenberger, P.; Prange, L.; Deng, Z.; Zhao, Q.; Perosanz, F.; Romero, I.; Noll, C.; Stürze, A.; Weber, G. The Multi-GNSS Experiment (MGEX) of the International GNSS Service (IGS)–achievements, prospects and challenges. Adv. Space Res. 2017, 59, 1671–1697. [Google Scholar] [CrossRef]
  20. Yuan, L.; Jin, S.; Hoque, M. Estimation of LEO-GPS receiver differential code bias based on inequality constrained least square and multi-layer mapping function. GPS Solut. 2020, 24, 57. [Google Scholar] [CrossRef]
  21. Wang, Q.; Jin, S.; Hu, Y. Estimation of QZSS differential code biases using QZSS/GPS combined observations from MGEX. Adv. Space Res. 2020, 67, 1049–1057. [Google Scholar] [CrossRef]
  22. Leick, A.; Rapoport, L.; Tatarnikov, D. GPS Satellite Surveying, 4th ed.; Wiley: Hoboken, NJ, USA, 2015. [Google Scholar]
  23. Schaer, S.; Steigenberger, P. Determination and Use of GPS Differential Code Bias Values. pp. 8–11. Available online: https://files.igs.org/pub/resource/pubs/06_darmstadt/IGS%20Presentations%20PDF/2_2_Schaer.pdf (accessed on 1 September 2023).
  24. Jin, R.; Jin, S.G.; Feng, G.P. M_DCB: Matlab code for estimating GNSS satellite and receiver differential code biases. Gps Solut. 2012, 16, 541–548. [Google Scholar] [CrossRef]
  25. Zhang, H.; Xu, P.; Han, W.; Ge, M.; Shi, C. Eliminating negative VTEC in global ionosphere maps using inequality-constrained least squares. Adv. Space Res. 2013, 51, 988–1000. [Google Scholar] [CrossRef]
  26. Wang, C.; Shi, C.; Fan, L.; Zhang, H. Improved Modeling of Global Ionospheric Total Electron Content Using Prior Information. Remote Sens. 2018, 10, 63. [Google Scholar] [CrossRef]
  27. Ren, X.; Chen, J.; Li, X.; Zhang, X. Multi-GNSS contributions to differential code biases determination and regional ionospheric modeling in China. Adv. Space Res. 2020, 65, 221–234. [Google Scholar] [CrossRef]
Figure 1. Distribution of the selected stations (red = GPS only, blue = GPS + GLONASS, yellow = GPS + GLONASS + BDS, and so on).
Remotesensing 15 04607 g001
Figure 2. Distribution of the IPPs for different constellations (DOY 002, 2019).
Remotesensing 15 04607 g002
Figure 3. Global VTEC maps of MMG for DOY 002, 2019.
Remotesensing 15 04607 g003
Figure 4. VTEC difference between MMG and CODE for DOY 002, 2019.
Remotesensing 15 04607 g004
Figure 5. The bias and RMS of GIM estimated by different IGS analysis centers and MMG, relative to the GIM provided by CODE.
Remotesensing 15 04607 g005
Figure 6. The RMS of MMG estimated satellite DCB of GPS and GLONASS relative to the DCB product provided by MGEX.
Remotesensing 15 04607 g006
Figure 7. The RMS of MMG estimated satellite DCB of BDS and Galileo relative to the DCB product provided by MGEX.
Remotesensing 15 04607 g007
Figure 8. The RMS of MMG estimated receiver DCB for some elected stations relative to the DCB product provided by MGEX.
Remotesensing 15 04607 g008
Figure 9. Single frequency PPP accuracy comparison, while using the TEC from CODE and this paper.
Remotesensing 15 04607 g009
Table 1. The 19 types of DCBs of GNSSs.
No.SystemBias TypeNo.SystemBias Type
1GPSC1C-C2W10GalileoC1X-C5X
2C1W-C2W11C1X-C7X
3C1C-C5X12C1X-C8X
4C1C-C5Q13C1C-C5Q
5GLONASSC1C-C2P14C1C-C7Q
6C1P-C2P15C1C-C8Q
7C1C-C2C16QZSSC1X-C2X
8BDSC2I-C7I17C1X-C5X
9C2I-C6I18C1C-C2L
19C1C-C5Q
Table 2. The mean RMS of estimated satellite DCBs relative to the DCB product provided by MGEX.
SystemDCBCASDLRCODESystemDCBCASDLR
GPSC1C-C2W0.060.09 GALC1X-C5X0.060.11
C1W-C2W0.060.160.07C1X-C7X0.070.11
C1C-C5X0.070.08 C1X-C8X0.080.12
C1C-C5Q0.100.13 C1C-C5Q0.100.11
GLOC1C-C2P0.120.12 C1C-C7Q0.070.10
C1P-C2P0.140.220.15C1C-C8Q0.080.10
C1C-C2C0.170.13 QZSSC1X-C2X0.070.16
BDSC2I-C7I0.150.14 C1X-C5X0.070.10
C2I-C6I0.190.13 C1C-C2L0.110.12
C1C-C5Q0.090.18
Disclaimer/Publisher’s Note: The statements, opinions and data contained in all publications are solely those of the individual author(s) and contributor(s) and not of MDPI and/or the editor(s). MDPI and/or the editor(s) disclaim responsibility for any injury to people or property resulting from any ideas, methods, instructions or products referred to in the content.

