Article

A Case Study on the Convection Initiation Mechanisms of an Extreme Rainstorm over the Northern Slope of Kunlun Mountains, Xinjiang, Northwest China

1
Xinjiang Key Laboratory of Oasis Ecology, College of Geography and Remote Sensing Sciences, Xinjiang University, Urumqi 830017, China
2
Institute of Desert Meteorology, China Meteorological Administration (CMA), Urumqi 830002, China
3
National Observation and Research Station of Desert Meteorology, Taklimakan Desert of Xinjiang, Urumqi 830002, China
4
Taklimakan Desert Meteorology Field Experiment Station of China Meteorological Administration, Urumqi 830002, China
5
Xinjiang Key Laboratory of Desert Meteorology and Sandstorm, Urumqi 830002, China
6
Field Scientific Observation Base of Cloud Precipitation Physics in West Tianshan Mountains, Urumqi 830002, China
7
Xinjiang Cloud Precipitation Physics and Cloud Water Resources Development Laboratory, Urumqi 830002, China
8
Xinjiang Meteorological Observatory, Urumqi 830002, China
*
Author to whom correspondence should be addressed.
These authors contributed equally to this work.
Remote Sens. 2023, 15(18), 4505; https://doi.org/10.3390/rs15184505
Submission received: 14 August 2023 / Revised: 7 September 2023 / Accepted: 8 September 2023 / Published: 13 September 2023

Abstract

:
Extreme precipitation events have been occurring frequently worldwide, and their causative factors and convection initiation (CI) mechanisms have been attracting more and more attention in recent years. As a comprehensive study on the CI mechanisms of extreme rainstorms over the northern slope of the Kunlun Mountains (KLM), Xinjiang, based on both observational and high tempo-spatial numerical simulation, the major findings of this work are as follows: A cold pool (CP) was formed in the northwestern Tarim Basin under the influence of early precipitation evaporation, and it moved towards the northern slope of the KLM several hours before the CI. With the movement of the CP, a significant vertical temperature gradient was formed close to the leading edge of the CP, thereby enhancing local convective instability (up to ~10 PVU). In addition, the vertical shear of the horizontal winds at the leading edge of the CP led to a notable increase in the baroclinic component of moist potential vorticity, thus reinforcing the local conditional symmetric instability (up to ~8 PVU), providing another important unstable energy for the CI. In addition, the combined effect of the convergent lifting of a boundary layer jet (BLJ, the maximum wind speed below 1 km exceeding 10 m s−1) and the significant frontogenetical forcing (up to ~100 × 10−8 K m−1 s−1) at the leading edge of the CP were the causes of the release of the unstable energies. Further analysis of the frontogenetical forcing associated with the CP indicates that the convergence (up to ~2 × 10⁻³ s−1), diabatic heating and slantwise terms (indicates the baroclinicity and inhomogeneity of the vertical momentum in horizontal direction) were the major contributors, whereas the deformation term at the leading edge of the CP provided a relatively weaker contribution.

1. Introduction

In the context of global climate warming, extreme precipitation events have become more frequent, leading to a significant increase in heavy precipitation [1,2,3,4,5]. Consequently, associated natural hazards such as flash floods, urban waterlogging, landslides, and debris flows are posing serious threats to society, the economy, and personal safety [6,7,8,9]. Despite substantial progress in comprehending the structure and lifespan of convective systems, accurately forecasting the convective initiation (CI, which refers to the process by which air particles gain and maintain positive buoyancy after being lifted above the level of free convection, eventually forming deep convective clouds) remains one of the biggest challenges in meteorology [10,11,12,13,14,15,16,17,18,19,20,21].
The mechanisms of the CI and convection development of the extreme precipitation events are influenced by many factors such as atmospheric circulation, solar radiation, terrain, and underlying surface properties, and boundary layer convergence zones, etc., resulting its spatial and temporal distribution characteristics highly complex [22,23,24,25,26,27,28,29]. Among these factors, the formation and maintenance mechanisms of terrain-induced precipitation have been extensively studied by many researchers to analyze the impact of terrain on precipitation. Kirshbaum et al. [22] found that strong precipitation occurs both in the warm front and warm sector when a mid-latitude frontal system passes, with terrain amplifying precipitation more significantly in the warm sector. McMurdie et al. [23] compared cloud structures over the ocean and the windward slope of the Olympic Mountains in the Unites States, and they observed significantly intense radar echoes within the range of 2–8 km above the windward slope. Mulholland et al. [24] analyzed a case of heavy rainfall event in northern Argentina, South America, and found that changes in terrain height can significantly affect the blocking effect of the terrain on the cold pool (CP) and modify environmental conditions under certain conditions.
Numerous studies employing numerical simulations have also focused on extreme rainstorms associated with the CP in China [13,25,26,27,30]. For example, Du et al. [21] used dynamic and thermodynamic analysis methods and a number of numerical simulation experiments to explore the effects of the topography, coastline, and CP on the formation of CI. The CP outflows resulting from the evaporation of precipitation propagate southeastward rather than along the background southerlies due to the obstacle of the coastal SW–NE-oriented terrain, which vitally affects the growth and movement of the mesoscale convective system. Xu et al. [25] discovered that the CP generated by earlier precipitation was trapped by the terrain of Taiwan Island and remained fixed in the lower altitude on the southwest side of the island. This led to the lifting of unstable airflows over the CP during the precipitation process. Wei et al. [26] analyzed a balance was established between the eastward dispersion of the CP and the easterly inflow, restraining the storm’s eastward progression, resulting in the unprecedented extreme rainfall over Zhengzhou, China. Kang et al. [27] discovered that the interaction between the mesocyclone and mesoscale topography leads to the CI along a shear line, and it is also influenced by terrain, a CP, and the outer flow of the mesocyclone. This ultimately results in orographic forcing and CP augmentation, intensifying the precipitation event over the Taihang Mountains.
Unstable energy and frontogenetical forcing are important environmental conditions for the CI, and the convergence lifting along the leading edge of a CP can usually cause CI [31,32]. The CI and convection development of convective systems is closely related to atmospheric stabilities and moist potential vorticity (MPV, a comprehensive diagnostic physical quantity that characterizes the dynamic and thermal conditions of the atmosphere), which have been widely used in studying the mechanisms of heavy precipitation events in mid-latitude regions to diagnose atmospheric instability [33,34,35]. For instance, Liu et al. [36] analyzed the characteristics of the MPV in their investigation on the CI mechanisms of a rainstorm event in Beijing, and they concluded that convective instability (CIns, i.e., an instability due to the buoyancy force of heavy fluid over light fluid overcoming the stabilizing influence of viscous forces) is released after precipitation, while conditional symmetric instability [37] (CSI, i.e., an instability which is recognized as the contributor to the slantwise convection and which can occur in baroclinic flows in which the slantwise-upward displacement of air parcels, elongated in the direction of the thermal wind, results in a vector combination of buoyancy and Coriolis (or centrifugal) and pressure-gradient accelerations that drive the parcel in the same direction as the displacement) maintains precipitation. Huang et al. [38] found that negative MPV areas serve as precursors for heavy precipitation in their study of a rainstorm process in the Ili Valley of Xinjiang. In their research on a rainstorm event in Shanxi, Li et al. [34] stated that the CSI (calculated based on high resolution simulation data) near the frontogenesis (i.e., the formation process of the front) zone indicates a certain connection between frontogenesis and the release of unstable energy.
Despite there being continuous improvements in weather forecasting and numerical simulation technologies, the prediction of localized short-term heavy precipitation remains a challenge due to the sparse observation stations and complex terrains in Xinjiang, especially in southern Xinjiang. Furthermore, in contrast to the relatively comprehensive and thorough investigations on intense rainfall events over the mid-eastern part of China [10,13,38,39,40,41,42,43], there are relatively few studies on extreme rainfall events over the northern slope region of the Kunlun Mountains (KLM) in Xinjiang. In addition, to the authors knowledge, there has been no previous comprehensive and systematic study on the CI mechanisms of heavy rainfall in the northern slope region of the KLM based on high tempo-spatial resolution numerical simulations. Therefore, the present study aims to investigate the mechanisms of CI associated with the interactions between a CP, boundary level jet (BLJ), and unstable energy within an extreme rainfall event, in order to deepen or fill the gap in the understanding of these kinds of CI mechanisms over the northern slope region of the KLM.
The rest of this paper is organized as follows: Section 2 introduces the data and methodology, and Section 3 gives a brief overview of the rainfall event along with associated environmental conditions. Section 4 presents the evaluation of numerical simulation results. The mechanism of CI is documented in Section 5, according to the analysis of MPV and frontogenetical forcing. Finally, discussions and conclusions are presented in Section 6 and Section 7, respectively.

2. Data and Methodology

2.1. Dataset

The dataset employed in this study include observational data from the Fengyun-4A meteorological satellite (FY-4A) and ground-based automatic weather stations (AWSs) (with a time resolution of 1 h), sourced from the National Meteorological Center of the China Meteorological Administration. It also incorporates ERA5 reanalysis data from the European Centre for Medium-Range Weather Forecasts (ECMWF) and 1° × 1° FNL reanalysis data from the National Centers for Environmental Prediction/National Center for Atmospheric Research (NCEP/NCAR) (https://rda.ucar.edu/datasets/ds083.2/ accessed on 14 July 2022).

2.2. Methodology

Numerical simulations were conducted using the Weather Research and Forecasting (WRF) model (version 4.0) [44], where the initial and boundary conditions for the model were provided by the National Centers for Environmental Prediction/National Center for Atmospheric Research (NCEP/NCAR) 1° × 1° resolution reanalysis data, available every 6 h. The simulation employed a three-level nested grid, with the innermost domain (d03) covering the entire region of the heavy precipitation event (as shown in Figure 1a). The horizontal grid resolutions were set at 9 km, 3 km, and 1 km, respectively (as shown in Figure 1b), while the vertical levels comprised 50 levels, with a time step of 30 s. The microphysics parameterization adopted the WSM 6-class scheme [45], the cumulus parameterization used the Kain–Fritsch scheme (cumulus parameterization turned off in d03), the boundary layer scheme used the Yonsei University (YSU) scheme [46], and both longwave and shortwave radiation schemes were set to the RRTMG scheme [47,48]. The land surface processes were utilized the Noah scheme [47]. The integration time covered from 1200 UTC on 14 June to 1200 UTC on 15 June, with the output data from d03 available at 3 min intervals.
According to previous studies [36,49,50,51,52], assuming that the vertical change in velocity is much smaller than the vertical shear of horizontal velocity, MPV in the pressure coordinate system can be expressed as follows:
M P V = g ( ζ + ƒ ) θ e p + g v p θ e x g u p θ e y
where u and v represent the horizontal wind speeds in the x and y directions, respectively. θ e stands for the equivalent potential temperature, g denotes the gravitational coefficient, f is the Coriolis parameter, and ζ represents the relative vorticity. The units of MPV is PUV, where PVU = 10−6 m2 K s−1 kg−1.
According to previous research on MPV [36,50,51,52], it can be divided into two components, i.e., the MPV1 and MPV2 as shown in Equations (2) and (3) below. MPV1 is the positive pressure component of MPV, reflecting the combination effects of inertial stability and convective stability. In the Northern Hemisphere, absolute vorticity is generally positive, so the atmosphere with negative MPV1 is considered as revealing the CIns [36,51]. The MPV2, as the other component of the MPV, indicates the CSI when it shows negative values, and it includes the effects of moist static stability and horizontal wind vertical shear (i.e., dynamic instability) [36,49]. The CSI is considered as an important factor in the physical mechanism for the development of heavy precipitation and intense convection near fronts [36,38].
M P V 1 = g ( ζ + ƒ ) θ e p
M P V 2 = g v p θ e x g u p θ e y
The frontogenesis function quantifies the thermal and dynamic characteristics in the atmosphere, and thus, we calculated and analyzed the frontogenesis function to further study the frontogenetical forcing mechanisms which may responsible for the release of the unstable energy. Based on previous studies [53,54,55,56], we adopted a frontogenesis function that includes water vapor, the frontogenesis function is expressed as follows:
Ft = d d t | θ | = F 1 + F 2 + F 3 + F 4
where F1, F2, F3, and F4 are defined, respectively, as:
F 1 = 1 | θ e | [ ( θ e · ) ( d θ e d t ) ]
F 2 = 1 2 1 | θ e | ( θ e ) 2 ( u x + y y )
F 3 = 1 2 1 | θ e | [ ( θ e x ) 2 ( θ e y ) 2 ] ( u x v y ) + 2 θ e x θ e y ( v x + u y )
F 4 = 1 | θ e | [ θ e p ( θ e x ω x + θ e y ω y ) ]
where θ e represents the equivalent potential temperature, u is the meridional wind component, v is the zonal wind component, and ω is the vertical velocity in the p-coordinate system. Ft represents the total frontogenesis, while F1, F2, F3, and F4 represent diabatic heating, convergence, deformation, and slantwise terms, respectively. Ft > 0 indicates frontogenesis, while Ft < 0 indicates frontolysis. Subsequently, we will examine the spatial and temporal variations of the frontogenesis function (Ft) and its four components prior to and subsequent to the CI.

3. Case Overview

3.1. Introduction to the Rainfall Event

From 14 to 17 June 2021, a heavy precipitation event occurred over the northern slope of the Kunlun Mountains (KLM), northwest China (the main study area is shown in Figure 1a). This event was classified as an extreme rainfall event (due to the arid and semi-arid climate of Xinjiang, the local meteorologists put forward a precipitation standard which is suitable for the climate of Xinjiang [57]), with the 24 h accumulated precipitation record of 148 stations reporting rainstorm (>24.1 mm), 36 stations reporting heavy rainstorm (>48.1 mm), and 2 stations reporting torrential rainstorm (>96 mm). Among them, Hotan station recorded a daily precipitation of 45.5 mm, while Pishan station recorded a daily precipitation of 56.6 mm on 15 June 2021, and both of them had broken the local meteorological records for single-day rainfall. The Luopu station experienced a daily precipitation of 86.2 mm on 15 June 2021, with some localized areas receiving over 100 mm of rainfall during the 4-day period of the heavy precipitation event, reaching the level of torrential rainstorm, equivalent to twice the local annual precipitation. This heavy precipitation event affected more than 126,100 people, damaged 10,800 hectares of crops, and led to a direct financial loss amounting to 108 million yuan [58].
Figure 2 shows that the maximum accumulated precipitation during the heavy precipitation event is mainly concentrated in the vicinity of the northern slope of the KLM. Cumulative precipitation for the process exceeded 80 mm at 13 automatic weather stations (AWSs), which suggests that this rainstorm, like previous rainstorms in this region [59,60,61,62,63], is closely related to the topography of the north slope of the KLM. It was found from the observations at nine stations (Figure 2b) that the accumulated precipitation during the heavy precipitation event significantly exceeded the over 50 years (1966–2018) of climatologically averaged accumulated precipitation intensity in June at all 9 stations. For instance, the 4-day accumulated precipitation at Pishan station reached 81.1 mm, while the climatologically averaged precipitation in June was only 9.2 mm. This indicates that the 4-day accumulated precipitation during the heavy precipitation event at Pishan station nearly reached nine times that of the climatologically averaged precipitation. Hourly precipitation analysis revealed that after 15 June, Pishan, Luopu, Hotan, and Moyu stations started experiencing hourly accumulated precipitation exceeding 10 mm, which indicates the occurrence of short-time heavy rainfall. The Pishan was the earliest station which had broken the record during the heavy precipitation event, with a 1 h accumulated precipitation reaching 17.1 mm. Therefore, this study focuses on the CI mechanisms of this early period of the heavy precipitation near the Pishan station as the primary research object.

3.2. Environmental Conditions

To examine the environmental conditions during this rainstorm event, the ERA5 dataset was utilized for further analysis of the dynamic and thermal conditions at 200 and 500 hPa. At 1800 UTC on 14 June 2021 (Figure 3a), the 200 hPa level exhibited a “double-center” jet stream (i.e., upper level jet, ULJ), with the eastern core of the jet stream located over the northern part of the Qinghai Province. Its western part was in the vicinity of the discontinuous area of the ULJ and the entrance region of the eastern segment of the ULJ. At 0000 UTC on 15 June (Figure 3b), the high-pressure center to the east of the Tibetan Plateau strengthened and expanded to some extent, accompanied by an increase in the strength of the ULJ, with maximum wind speeds exceeding 42 m s−1 and significant upper-level divergent occurred near the right-hand side of the entrance region of the ULJ over the southern Xinjiang. From 10 June 2021, a deepening trough persisted over the area from Siberia to Central Asia at 500 hPa level. On 14 June (Figure 3c), during the eastward movement of the trough, a shortwave trough (in close proximity to the southwestern edge of the study area). The northern part of the trough moved near Lake Baikal, while the northern and eastern parts of Xinjiang were situated below the bottom of the trough. The lower portion of the trough traversed the plateau and proceeded into the western part of southern Xinjiang. On 15 June (Figure 3d), both the northern and southern segments of the trough further intensified to some extent, producing some favorable condition for the heavy rainfall over the northern slope of the KLM.
Yin et al. [64] also studied this heavy rainfall and pointed out that the water vapor source of this heavy rainstorm mainly came from 700–850 hPa. The strong northerly winds passed through the Altai Mountains and Tianshan Mountains to bring sufficient water vapor. In summary, the presence of ample moisture, convergence at lower levels, and divergence at mid–high levels may provide favorable conditions for the CI and convection development of this heavy precipitation event.
Figure 4 shows the atmospheric stratification conditions during the period of CI and convection development near the Pishan. Due to the lack of conventional sounding data in Pishan County, we used NCEP·FNL data from a location (38°N, 78°E; indicated by the pentagon symbol in Figure 1a) near the Pishan meteorological station for the Skew-T diagram. At 0000 UTC on 15 June (Figure 4a), the lower layers showed relatively dry conditions, with a dew point depression (TTd) of ~10 K, and this relatively dry condition persisted up to about 450 hPa (TTd < 10 K). At this time, the convective available potential energy (CAPE) was 750 J kg−1. Additionally, the wind speed increases slightly (from ~6 m s−1 to ~8 m s−1) with the increase in altitude at around 1–2 km above sea level (ASL), while the wind direction showed uniform northeasterlies. At 800–600 hPa heights, wind direction exhibited a clockwise rotation with the increase in altitude (i.e., veering vertical wind shear), indicating the presence of a pronounced warm advection at this level. At 0600 UTC (Figure 4b), the near-surface air was dominated by northerlies, and the air in the low level below 700 hPa exhibited rather wet conditions with the dew point depression of 2–3 K. The atmosphere from ~700 hPa to 300 hPa showed a near saturated condition. There was still significant warm advection depicted by the veering vertical wind shear wind direction near the level of 700 hPa, and with the CAPE of 713 J kg−1. At 1200 UTC on 15 June (Figure 4c), the dew point depression in the layer between 600–450 hPa increased to about 2 K but generally still showed rather wet condition in the layer of 825–300 hPa. Meanwhile, a warm advection was still present at the level 850–500 hPa, with CAPE weakening to 269 J kg−1. Although the CAPE at the previous two times are not so high, the decrease in the CAPE at this time indicates the release of the instable energy above the study area after the CI. In general, the layer above 300 hPa is rather dry at all three times, and the presence of a condition with dry air above and moist air below was highly favorable for the CI of convective weather.
To examine the progression of fundamental meteorological elements in this period of heavy rainstorm, we selected three meteorological stations in Pishan County (labelled as S1, S2, and S3 in Figure 1a) for further analysis. The precipitation began to occur at S1 station around 0500 UTC, and it reached its maximum hourly rainfall of about 17 mm at 0600 UTC, and then it decreased significantly, indicating the end of the first round of precipitation (shown in Figure 5a). Prior to the onset of the precipitation, significant changes also occurred in other basic meteorological elements. For instance, wind speed significantly increased from 2 m s−1 to 6 m s−1 in the period between 0200 and 0500 UTC, and wind direction changed from westerly to northerly at about 0200 UTC. In addition, relative humidity increased from 56% to 90% in the period between 0400 and 0600 UTC, while the temperature gradually decreased by around 6 °C. Moreover, the atmospheric pressure showed a noticeable increasing trend in the 6 h prior until the occurrence of the heaviest precipitation.
It can be seen from the observations from Station S2 (Figure 5b) that the precipitation also occurred in the period from 0500 to 0700 UTC, reaching its maximum value at 0600 UTC. The wind speed significantly increased from ~2 m s−1 to ~8 m s−1 at between 0200 and 0300 UTC, and the wind direction shifted to east at about 0500 UTC. The changes in relative humidity, atmospheric pressure, and temperature were consistent with those observed at station S1, possibly due to their close geographical locations. At Station S3 (Figure 5c), the precipitation occurred at a similar time period as that of the S1 and S2, but it reached its maximum value at 0500 UTC. The wind speed at S3 increased notably from 1 m s−1 to 6 m s−1 in the period between 0100 and 0200 UTC, and the wind direction shifted to the east at 0200 UTC. The relative humidity demonstrated a more significant variation, rising from about 52% to 90%.
Overall, the variation trends of basic meteorological elements observed at the three weather stations were roughly similar, which indicates the influence of a cold pool and a BLJ in the study area before the occurrence of the precipitation. However, because of the limitations in the spatial–temporal resolution of the observation data and other reanalysis data as ERA5 data, the specific mechanisms of the CI associated with the impacts of the BLJ and CP in the study area remain unclear. Therefore, in order to further analyze the CI mechanisms of this heavy rainfall event, we conducted high spatiotemporal resolution numerical simulations using the WRF model, and do some further analysis based on the numerical simulation data in the following.

4. Evaluation of Simulation

Figure 6 shows the 3 h accumulated precipitation observed by AWSs and obtained from the model simulation. Because the sparse and uneven distribution of the AWSs over the northern slope of the KLM, the interpolation of accumulated precipitation has poor performance. Hence, distinct colored dots are employed to indicate the value of the accumulated precipitation at each of the stations. As shown in Figure 6a, during the period from 0500 to 0800 UTC on 15 June, the observed distribution of accumulated precipitation along the northern slope of the KLM exhibits a clear northwest–southeast-oriented banding pattern, and three main areas of high precipitation values can be identified (indicated by red dotted ellipticals in Figure 6a). It can be seen from the corresponding simulation results (Figure 6b) that the simulated precipitation band also shows a distinct northwest–southeast-oriented pattern, with three corresponding high-value areas (indicated by the red dotted ellipticals in Figure 6b). Due to the scarcity of the AWSs over the northern slope of the KLM, the range of high precipitation values shown in Figure 6a seemed to be less than those in the simulation result. However, the relatively high precipitation may also have occurred over the areas beyond the locations of the AWSs. The pattern and magnitude of the simulated precipitation align well with the observed precipitations, which indicates a good representation of the heavy precipitation event in the simulation.
Figure 7a–c shows the temperature of the black body (TBB) over the top of the precipitation clouds observed by FY-4A at 0300, 0400, and 0500 UTC on 15 June 2021. It can be seen that the rainfall clouds formed at about 0300 UTC and were independent of the convective system on the northwest side of the Tarim basin. Figure 7d–f displayed the simulated composite reflectivity along with the horizontal wind field at 2500 m ASL at 0330, 0430, and 0530 UTC on 15 June 2021. Similarly, as shown in Figure 6b, an isolated convective cell (indicated by the red arrow) which corresponds to the region of high precipitation region can be identified. In addition, a distinct mesoscale vortex (roughly indicated by a black dashed arrow) can be identified at this height (2500 m ASL). Although the time of the simulated composite reflectivity and the TBB observed by the FY-4A lag by about half an hour, they still successfully captured the essential features of the convections, which indicates a good performance of the simulation. In order to clearly identify the occurrence of the CI near the Pishan, the major area (indicated by the black rectangular box in Figure 7d–f) where the CI occurred is further magnified, and this is shown in Figure 7g–i. The composite reflectivity value above the 35 dBZ is plotted with colors in Figure 7g–i, because the occurrence of the CI is confirmed when the composite reflectivity reached the value of 35 dBZ for the first time in the newly generated convective cell [31,32,39]. The results showed that although more than one convective cell triggered over Pishan at 0430UTC, only the cell we selected (indicated by the red arrow in Figure 7h) continuously developed into an intense convective system, causing heavy precipitation in the study area. The convective cell indicated by the red solid arrow in Figure 7h is believed to the major convective cell that responsible for the heavy precipitation over the Pishan.

5. Convection Initiation

In order to further analyze the CI mechanisms of the convective cell, we conducted a further analysis based on the simulated data from the innermost domain (d03, with horizontal resolution of 1 km) of the model. The convective cell which mainly responsible for the heavy precipitation over the Pishan was initiated at 0430UTC; therefore, we mainly focus on the time period before the CI in the following. It can be seen from the potential temperature fields (Figure 8a,b) at the lowest layer of the model ( η = 0.9970323) (the potential temperature on the lowest mode layer was plotted because the CP often moves and almost sticks to the surface) that a CP generated due to the influence of previous precipitation was moving from north to south (indicated by the black hollow arrow) in the western Tarim Basin. At 0330 UTC on 15 June 2021, the thermal boundary of the leading edge of the CP (i.e., 305 K isoline) had not yet reached the CI area mentioned above. At this time, the movement of the CP was slowed down due to the blocking effect of the terrain, while the leading edge of the CP reached the CI area at 0400 UTC. Meanwhile, the horizontal wind field at 2500 m ASL (horizontal wind fields are affected by topography to some extent, and it varies significantly with height; therefore, the constant-height surface was used to investigate the horizontal wind features) revealed the existence of a boundary layer jet (BLJ) in the region. At 0330 UTC (Figure 8c), as mentioned in our Supplementary Materials, areas of high values (exceeding 10 m s−1) of horizontal wind speeds occur on the windward slopes of the study area due to pressure gradient forces and valley winds. The horizontal wind speeds in the CI area enhanced (indicated by the black hollow arrow) to some extent at 0400 UTC (Figure 8d). In order to further figure out the roles of the CP and BLJ in the CI mechanisms, the related dynamic and thermal conditions reflected by the vertical cross-sections in the CI area (line segment AB in Figure 7h) are further investigated in the following (Figure 9).
Figure 9 shows the potential temperature ( θ ), horizontal wind speed, and divergence on the vertical cross-section along the line AB during a 1 h period before the occurrence of the CI (i.e., 0330–0430 UTC). The vertical cross-section along the line segment AB went through the center of heavy precipitation and the leading edge of the CP (as shown in Figure 7h and Figure 8), which helped us to obtain a clearer insight of the CI process in this case. The CP was advancing roughly from the north direction towards the windward slope of the KLM (Figure 9a–c). The potential temperature within the CP remains below 302 K below an altitude of 2800 m ASL. The 304 K and 305 K isotherms can be identified as the thermal boundary of the leading edge of the CP (represented by a dotted red arrow). Simultaneously, from the vertical distribution of horizontal wind speed (Figure 9d–f), it can be seen that along with the movement of the CP, there is a region of higher wind speeds (exceeding 10 m s−1) along the leading edge of the CP below ~1 km AGL (above ground level) during this period. Additionally, there is also a region of higher wind speeds (indicated by the red solid line arrows) at around 2500 m ASL on the windward slope at 0330 and 0400 UTC (it coincides with the analysis of the BLJ mentioned above).
It can be seen from the vertical distribution of the divergence (Figure 9g–i) that there is a significant convergence (around −1.5 × 10⁻³ s−1) that occurred near the leading edge of the CP, and a similar significant convergence can be found in the area influenced by BLJ. At 0400 UTC, the leading edge of the CP and BLJ are located in almost the same area, and some local rainfall cloud clusters are generated with a vertical velocity up to 1 m s−1 along the leading edge of the CP. At 0430 UTC, the leading edge of the CP completely reached to the area where the CI occurred, probably due to the combined convergent lifting effect associated with the leading edge of the CP and BLJ, leading to generation of convective clouds accompanied by the vertical velocities reaching to about 1.8 m s−1. In general, it can be concluded from the characteristics of the vertical cross sections of potential temperature, horizontal wind speed, and divergence that the CP seemed to had provided a dynamical forcing (i.e., convergence) conditions for CI during its movement to the study area, along with the similar dynamic forcing generated due to the convergence near the leading edge of the BLJ over the north slope of the KLM.
MPV is a physical quantity that reflects atmospheric dynamics, thermodynamics, and moisture properties, and it can also characterize the atmospheric instability. In recent years, it has been widely used in the study of heavy precipitation events [49,50,51,52]. Therefore, in order to further investigate the CI mechanisms, the MPV was calculated and its vertical cross section along the line segment AB is analyzed in the following. The negative MPV values serve as indicators of atmospheric instability, especially in the context of heavy precipitation events, such as frontal systems. According to some previous studies [36,38,51,52], the negative values of MPV can provide predictive indications for precipitation areas, and negative MPV1 represents the CIns, while negative MPV2 represents the CSI. Therefore, we will mainly focus on the spatial variations of negative values of the MPV during the CI process.
In order to better illustrate the atmospheric instability, we only show the negative values of MPV, MPV1, and MPV2 in Figure 10. At the early period before the CI (i.e., at 0330 UTC, Figure 10a), there are mainly two negative MPV maxima regions along the leading edge of the CP. Additionally, there is another negative MPV center (represented by three purple dashed ellipses) within the area influenced by the BLJ on the windward slope. The negative values of MPV in the area affected by the BLJ on the windward slope are relatively weak, while a relatively large negative MPV region (with an intensity of about −10 PVU) exists along the leading edge of CP, extending to an altitude of ~4 km ASL. At 0400 UTC, the movement of the CP caused the convergence near the leading edge of the CP and the area affected by the BLJ, resulting in a relatively large negative MPV center (with an intensity of about −10 PVU). At this time, rainfall cloud clusters started to form, and the intensity of the negative MPV center above the CP weakened (represented by two purple dashed ellipses). When the CI occurred at 0430 UTC, the negative center along the leading edge of the CP significantly weakened compared to the previous two times, while the negative MPV center above the CP still existed. Meanwhile, a large area of negative MPV within the CP continued to transport towards the study area.
At 0400 UTC (Figure 10e), as the CP moved forward, and the rainfall cloud clusters had further developed, and the intensity and size of the negative MPV1 (represents the CIns) decreased to some extent. The CIns indicates the influence of thermodynamic instability, and as the CP further moved forward, the rainfall cloud clusters continue to develop, leading to the occurrence of the CI at 0430 UTC. At the period of occurrence of the CI (Figure 10f), the negative values of the MPV1 along the leading edge of the CP further weakened, which indicates that the development of rainfall cloud clusters consumes the CIns energy. In addition, there is an area of persistent and relatively strong negative MPV2 above the CP, with both its height and intensity showing a weakening trend before the CI. It can be deduced that the negative MPV2 area indicated the CSI (suggesting the presence of a strong vertical wind shear above the CP) had played a significant role in supporting the CI.
In general, at the early stages before the CI, the instability energy on the windward slope is mainly controlled by CIns and CSI. The CIns played a significant role mainly in the lower layer below 3 km ASL along the leading edge of the CP, while the CSI makes a certain contribution within the range of 3~5 km ASL above the CP. At the CI period, the intensity and extent of the CIns noticeably weakened compared to that of the period before the CI, while the CSI retains significant values above the CP, providing favorable conditions for the CI of rainfall cloud clusters.
As mentioned in the introduction above, the release of unstable energy is closely related to the frontogenetical forcing, and the leading edge of the CP acts similarly to a small-scale cold front. The convergence of cold and warm air at the leading edge of CP provided favorable conditions for frontogenesis. The frontogenesis process led to upward motion of the thermal circulation, which is one of the important reasons for the CI. In order to further study the frontogenetical forcing mechanisms responsible for the release of those unstable energies, the frontogenesis function (which is a method of quantifying the characteristics of the thermal and dynamic forcing related to the formation of a front) was calculated and analyzed in the vertical cross section along the line AB in the following.
Before the CI (i.e., 0330 UTC), the significant high values of Ft are mainly located near the leading edge and inside of the CP, and in some areas, they are influenced by the BLJ (as indicated by the blue dashed ellipses in Figure 11a). The overall strength of F1 is comparatively low, primarily distributed at the leading edge and inside of the CP (as indicated by the blue dashed ellipses in Figure 11b). The major centers of F2 are located in the low layers below ~2500 m ASL at the leading edge of the CP, exhibiting a similar distribution pattern as that of F1. There are no significant high-value centers of F3 below 4 km ASL. Meanwhile, the overall distribution of F4 is closely similar to that of the Ft, with two apparent high-value centers inside the CP and at ~2.5 km ASL on the windward slope of the KLM (as indicated by the blue ellipses).
At the CI period (i.e., 0430 UTC), a prominent high-value center of Ft can be identified on the windward slope (as shown in Figure 11f), while the significant center observed at 0330 UTC has completely disappeared. During this time, the intensity of F1 (Figure 11g) remains relatively weak, but there is a relatively high-value center inside the convective cloud cluster (as indicated by the blue dashed ellipse). The distribution of F2 (Figure 11h) indicates that the significant high-value center identified at the leading edge of the CP at 0330 UTC has vanished, and only a weak high-value center exists inside the convective cloud cluster (as indicated by the blue dashed ellipse). There are still no significant high-value centers of F3 in the lower layers. The intensity and distribution range of F4 (Figure 11j) are consistent with that of the Ft, with significant high-value centers existing inside the convective cloud cluster over the windward slope and above the CP.
Overall, throughout the entire process of the CI, F4 makes a more significant contribution to the Ft. Before the CI, except for the dominance of F4 at the leading edge of the CP and ~2.5 km ASL on the windward slope, F1 and F2 also make relatively weaker contributions at the leading edge of the CP. F3 makes a minor contribution in the lower layers. During the CI stage, F1 and F2 make relatively weaker contributions inside the convective cloud cluster, while F4 makes significant contributions to the Ft over the windward slope and inside the cloud cluster.
F1 and F2 mainly represent the latent heat released by condensation and local convergence, respectively. Based on the above analysis, F1 may be caused by the latent heat released from condensation inside the rainfall cloud cluster, while F2 may be attributed to the convergence at the leading edge of the CP and the blocking effect of the windward slope topography. According to Equation (8), F4 reflects the combined effects of CIns, horizontal gradient of the equivalent potential temperature (i.e., HG θ e , shading, units: K km−1), and the horizontal gradient of vertical velocity (i.e., ω / x + ω / y , denoted as HG ω , indicating the non-uniformity of vertical velocity in the horizontal direction). From the previous analysis, most regions along the vertical profile of the line segment AB show negative CIns values (as shown in Figure 10d–f). Therefore, the values of F4 are primarily influenced by HG ω and HG θ e . To further investigate the physical processes contributing to F4, we will analyze the characteristics of HG ω and HG θ e in the following passages.
Before the CI (i.e., 0330 UTC), it can be seen from the vertical cross section of the HG ω (Figure 12a) that there are two high-value centers over the windward slope, one is located near the leading edge of the CP, and the other one is influenced by the BLJ. At the time of CI (i.e., 0430 UTC), two high-value centers are presented inside the cloud cluster (indicated by blue dashed ellipses), which indicates a significant horizontal gradient of vertical velocity at the leading edge of the CP. These high-value centers are highly consistent with the distribution of F4. In the lower layers below 3 km ASL, there is a prominent high-value center of HG θ e near the leading edge of the CP before the CI (i.e., 0330 UTC) (indicated by a blue dashed ellipse). At the CI time (i.e., 0430 UTC), with the southward movement of the CP, the high-value center of the HG θ e also moved to above the windward slope (indicated by a blue dashed ellipse). There is also a high-value center inside the rainfall cloud cluster (indicated by a blue dashed ellipse). The high value of HG θ e in the lower layers is mainly due to the horizontal gradients of the temperature and humidity at the leading edge of the CP, while the high-value centers inside the rainfall cloud cluster may be caused by the process of latent heat release. During the CI stage, the overall strength of HG θ e appears to be higher than that of HG ω , which indicated that the contribution of HG θ e may be greater than that of HG ω . In general, the strong convergence area in the leading of the CP and the intense vertical gradient of horizontal equivalent potential temperature near the leading edge of the CP contributed to F4 together.

6. Discussion

In this paper, our main findings can be summarized as follows: The CP generated by the early precipitation not only contributes to the CI from the perspective of unstable energy but also played an important role in frontogenetical forcing during its movement towards the northern slope of the KLM. Furthermore, we conducted a detailed analysis of the specific contributions of the four components of the frontogenetical forcing. These mechanisms are succinctly illustrated in the schematic diagram depicted in Figure 13.
The MPV and frontogenesis functions are widely used in weather diagnosis around the world; however, these methods have been used to analyze the CI mechanisms in the northern slope of the KLM based on high tempo-spatial numerical simulation for the first time. Huang et al. [38] pointed out that CI releases CIns unstable energy, and atmospheric CSI gradually strengthens, enhancing precipitation under the influence of CSI in their study on an extreme rainfall event occurred in the Ili River Valley of Xinjiang. Our findings about the unstable energy in this work is consistent with their findings. However, the difference between the findings in our present study and Huang et al. [38] is that the CSI is not located near the surface but above the CP. This is in line with the study by Xu et al. [25], and they mentioned that the existence of a CP that extended the terrain indirectly caused the lifting of unstable energy. Additionally, some other studies [53,54,55,56] have analyzed extreme rainfall processes based on the frontogenesis function, but they did not discuss its correlation with the release of unstable energy. In line with our research findings, they also highlighted that the slantwise term predominantly contributes to the total frontogenesis. Consistent with our research conclusion, they also pointed out that the slantwise term is the main contributor to the total frontogenesis. The difference between their findings and our work is that we have further analyzed the vertical gradient of horizontal equivalent potential temperature. And the contribution of HG θ e is greater than HG ω . Hence, our current study presents some novel findings.
However, as a case study, the findings of this work need to be verified by some more similar cases. Although we have provided some explanations of the CI mechanisms of this extreme rainfall event, the reason for the formation of the BLJ, specific contributions of the terrain on the CI still remain unclear. Therefore, further investigations on effects of the multi-scale topography and special underlying surface properties on the CI mechanisms over the north slope of the KLM can be conducted in the future.

7. Conclusions

This study investigates the convection initiation (CI) mechanisms of an extreme rainfall event on 15 June 2021, over the northern slope of the Kunlun Mountains (KLM) in Xinjiang, China, associated with a cold pool (CP) and boundary layer jet (BLJ). Through the diagnostic analysis of the atmospheric instability and related frontogenetical forcing mechanisms, it is confirmed that the dynamical and thermal contributions of the CP along with the dynamical forcing due to the BLJ near the complex terrain are important factors in the CI mechanisms in arid and semi-arid regions over the northern slope of KLM, and the following conclusions are drawn:
(1)
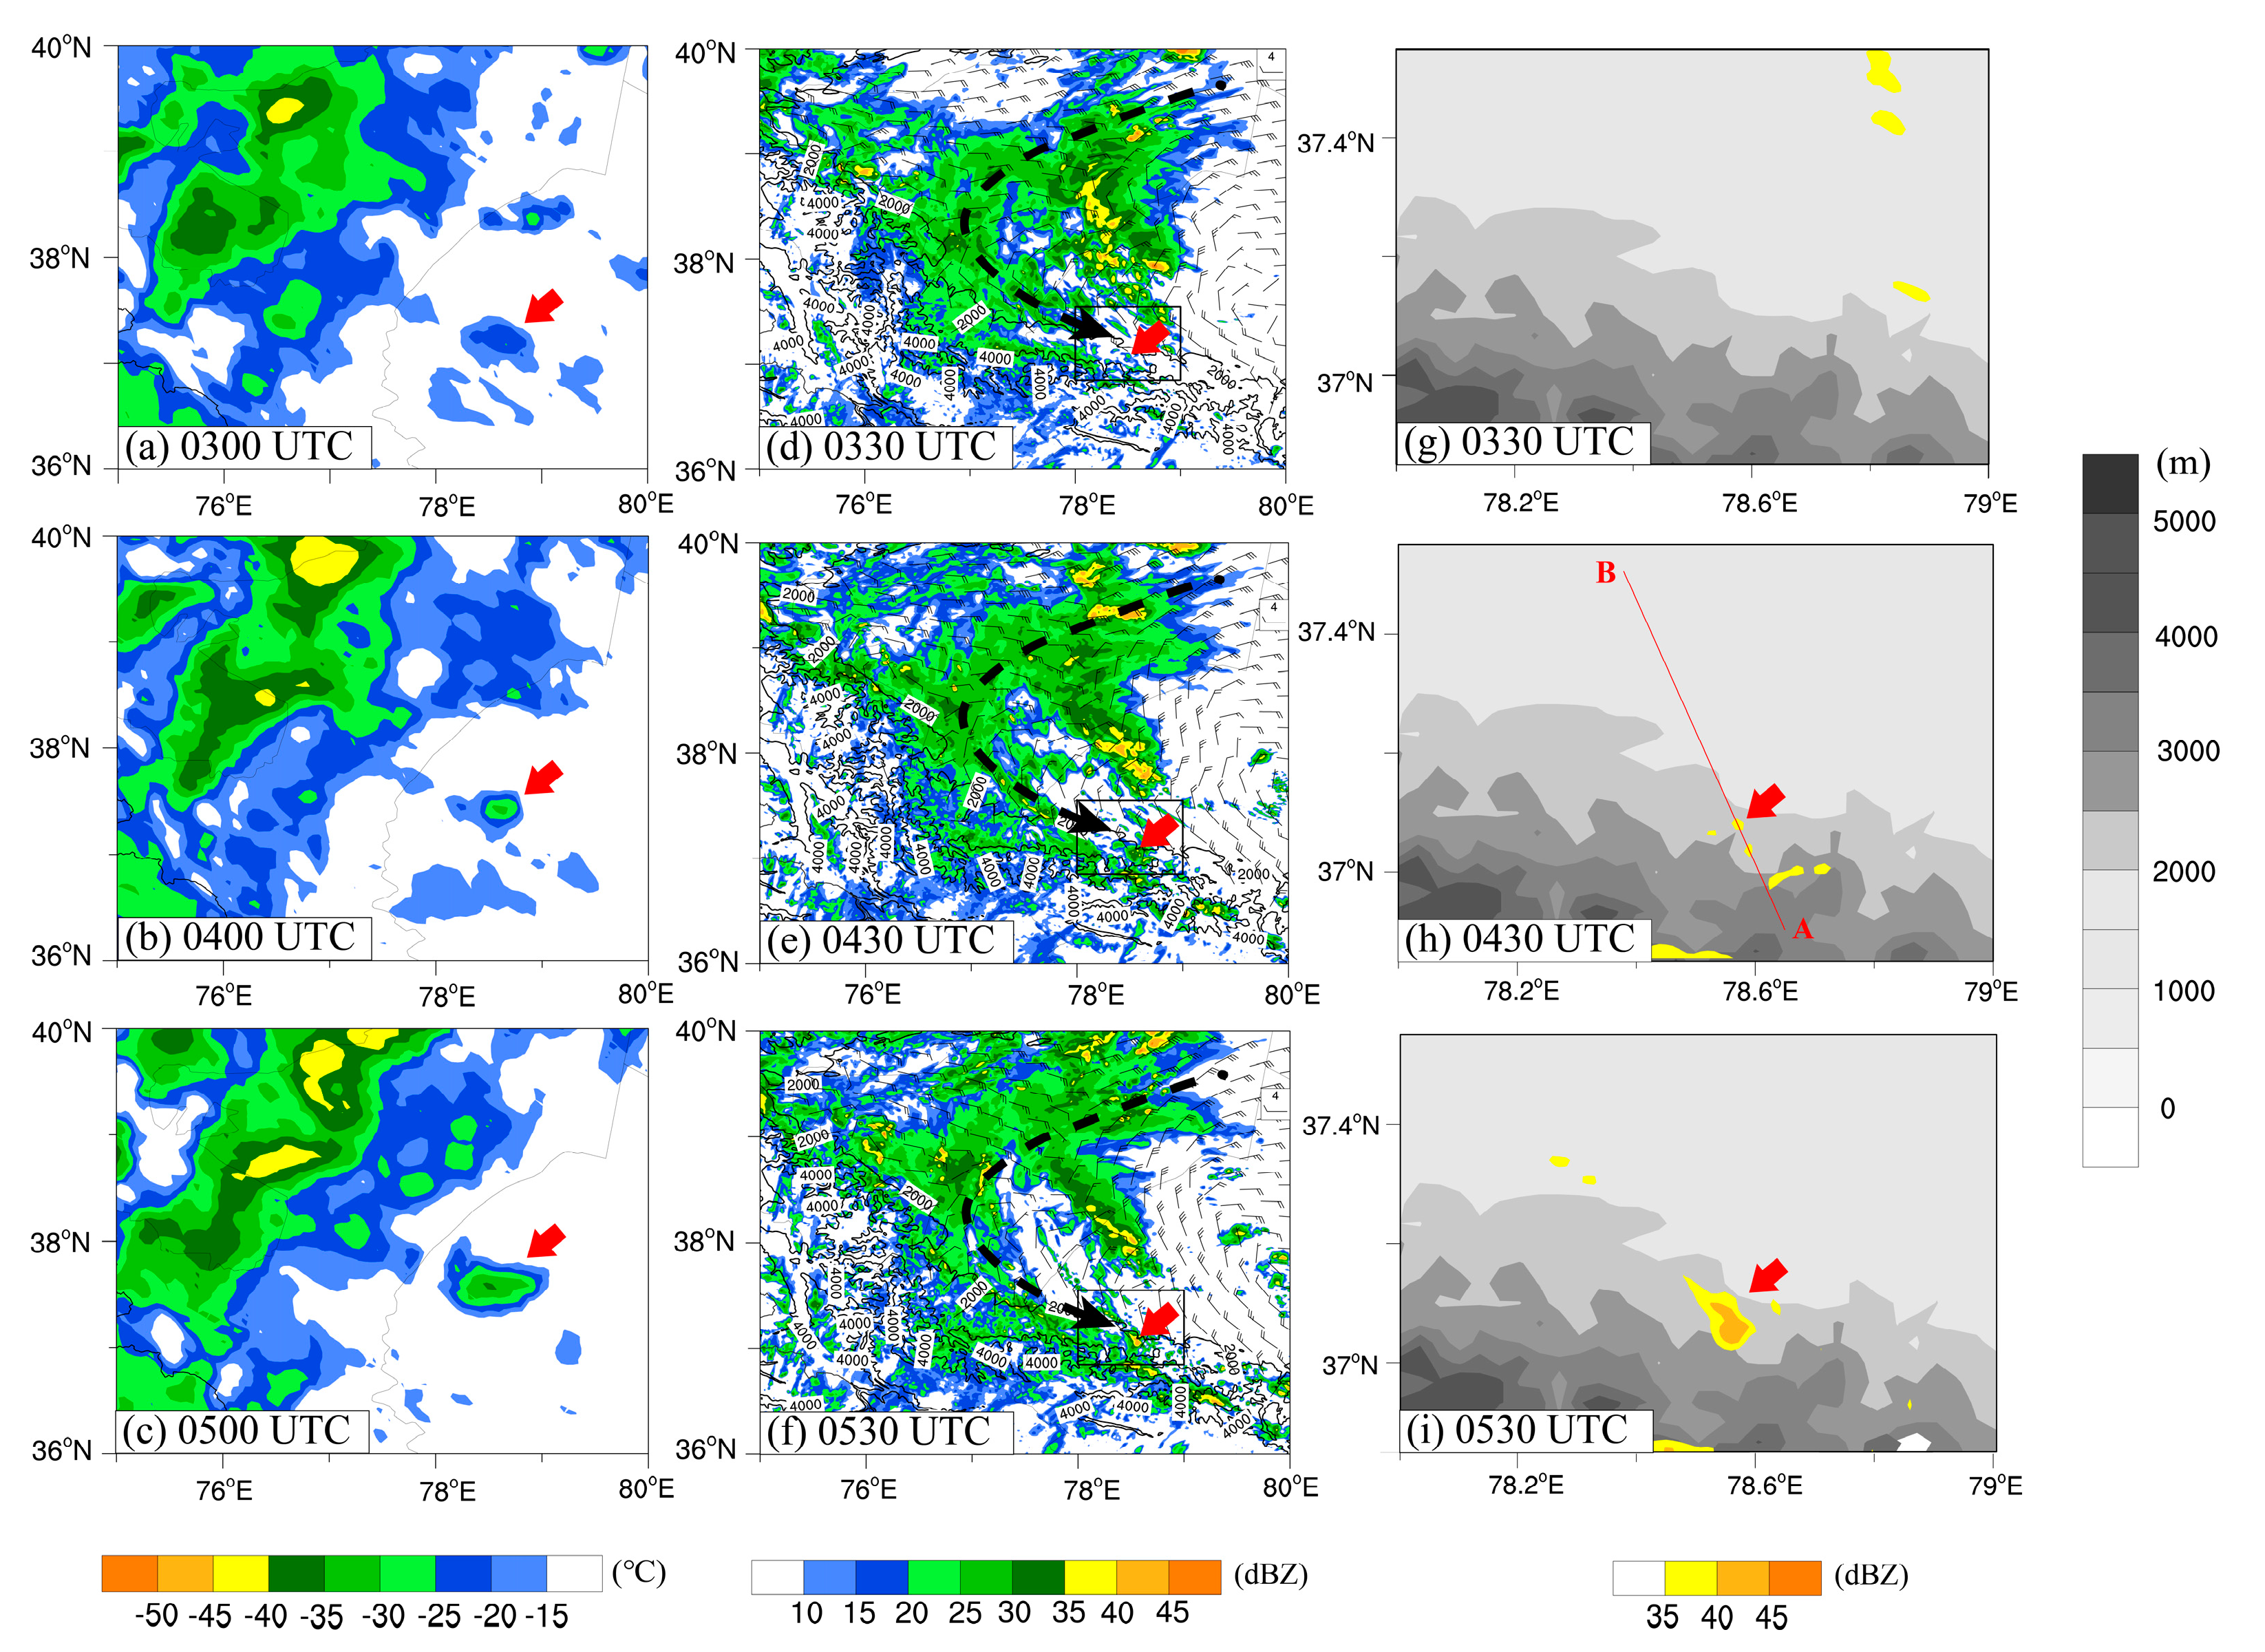
The persistence of mesoscale cloud clusters with TBB ≤ −35 °C for about 3 h gave rise to persistent rainfall in the vicinity of Pishan County on the northern slope of KLM. Subsequently, the cloud clusters were influenced by a mesoscale vortex and moved towards the northwest edge of the Tarim Basin.
(2)
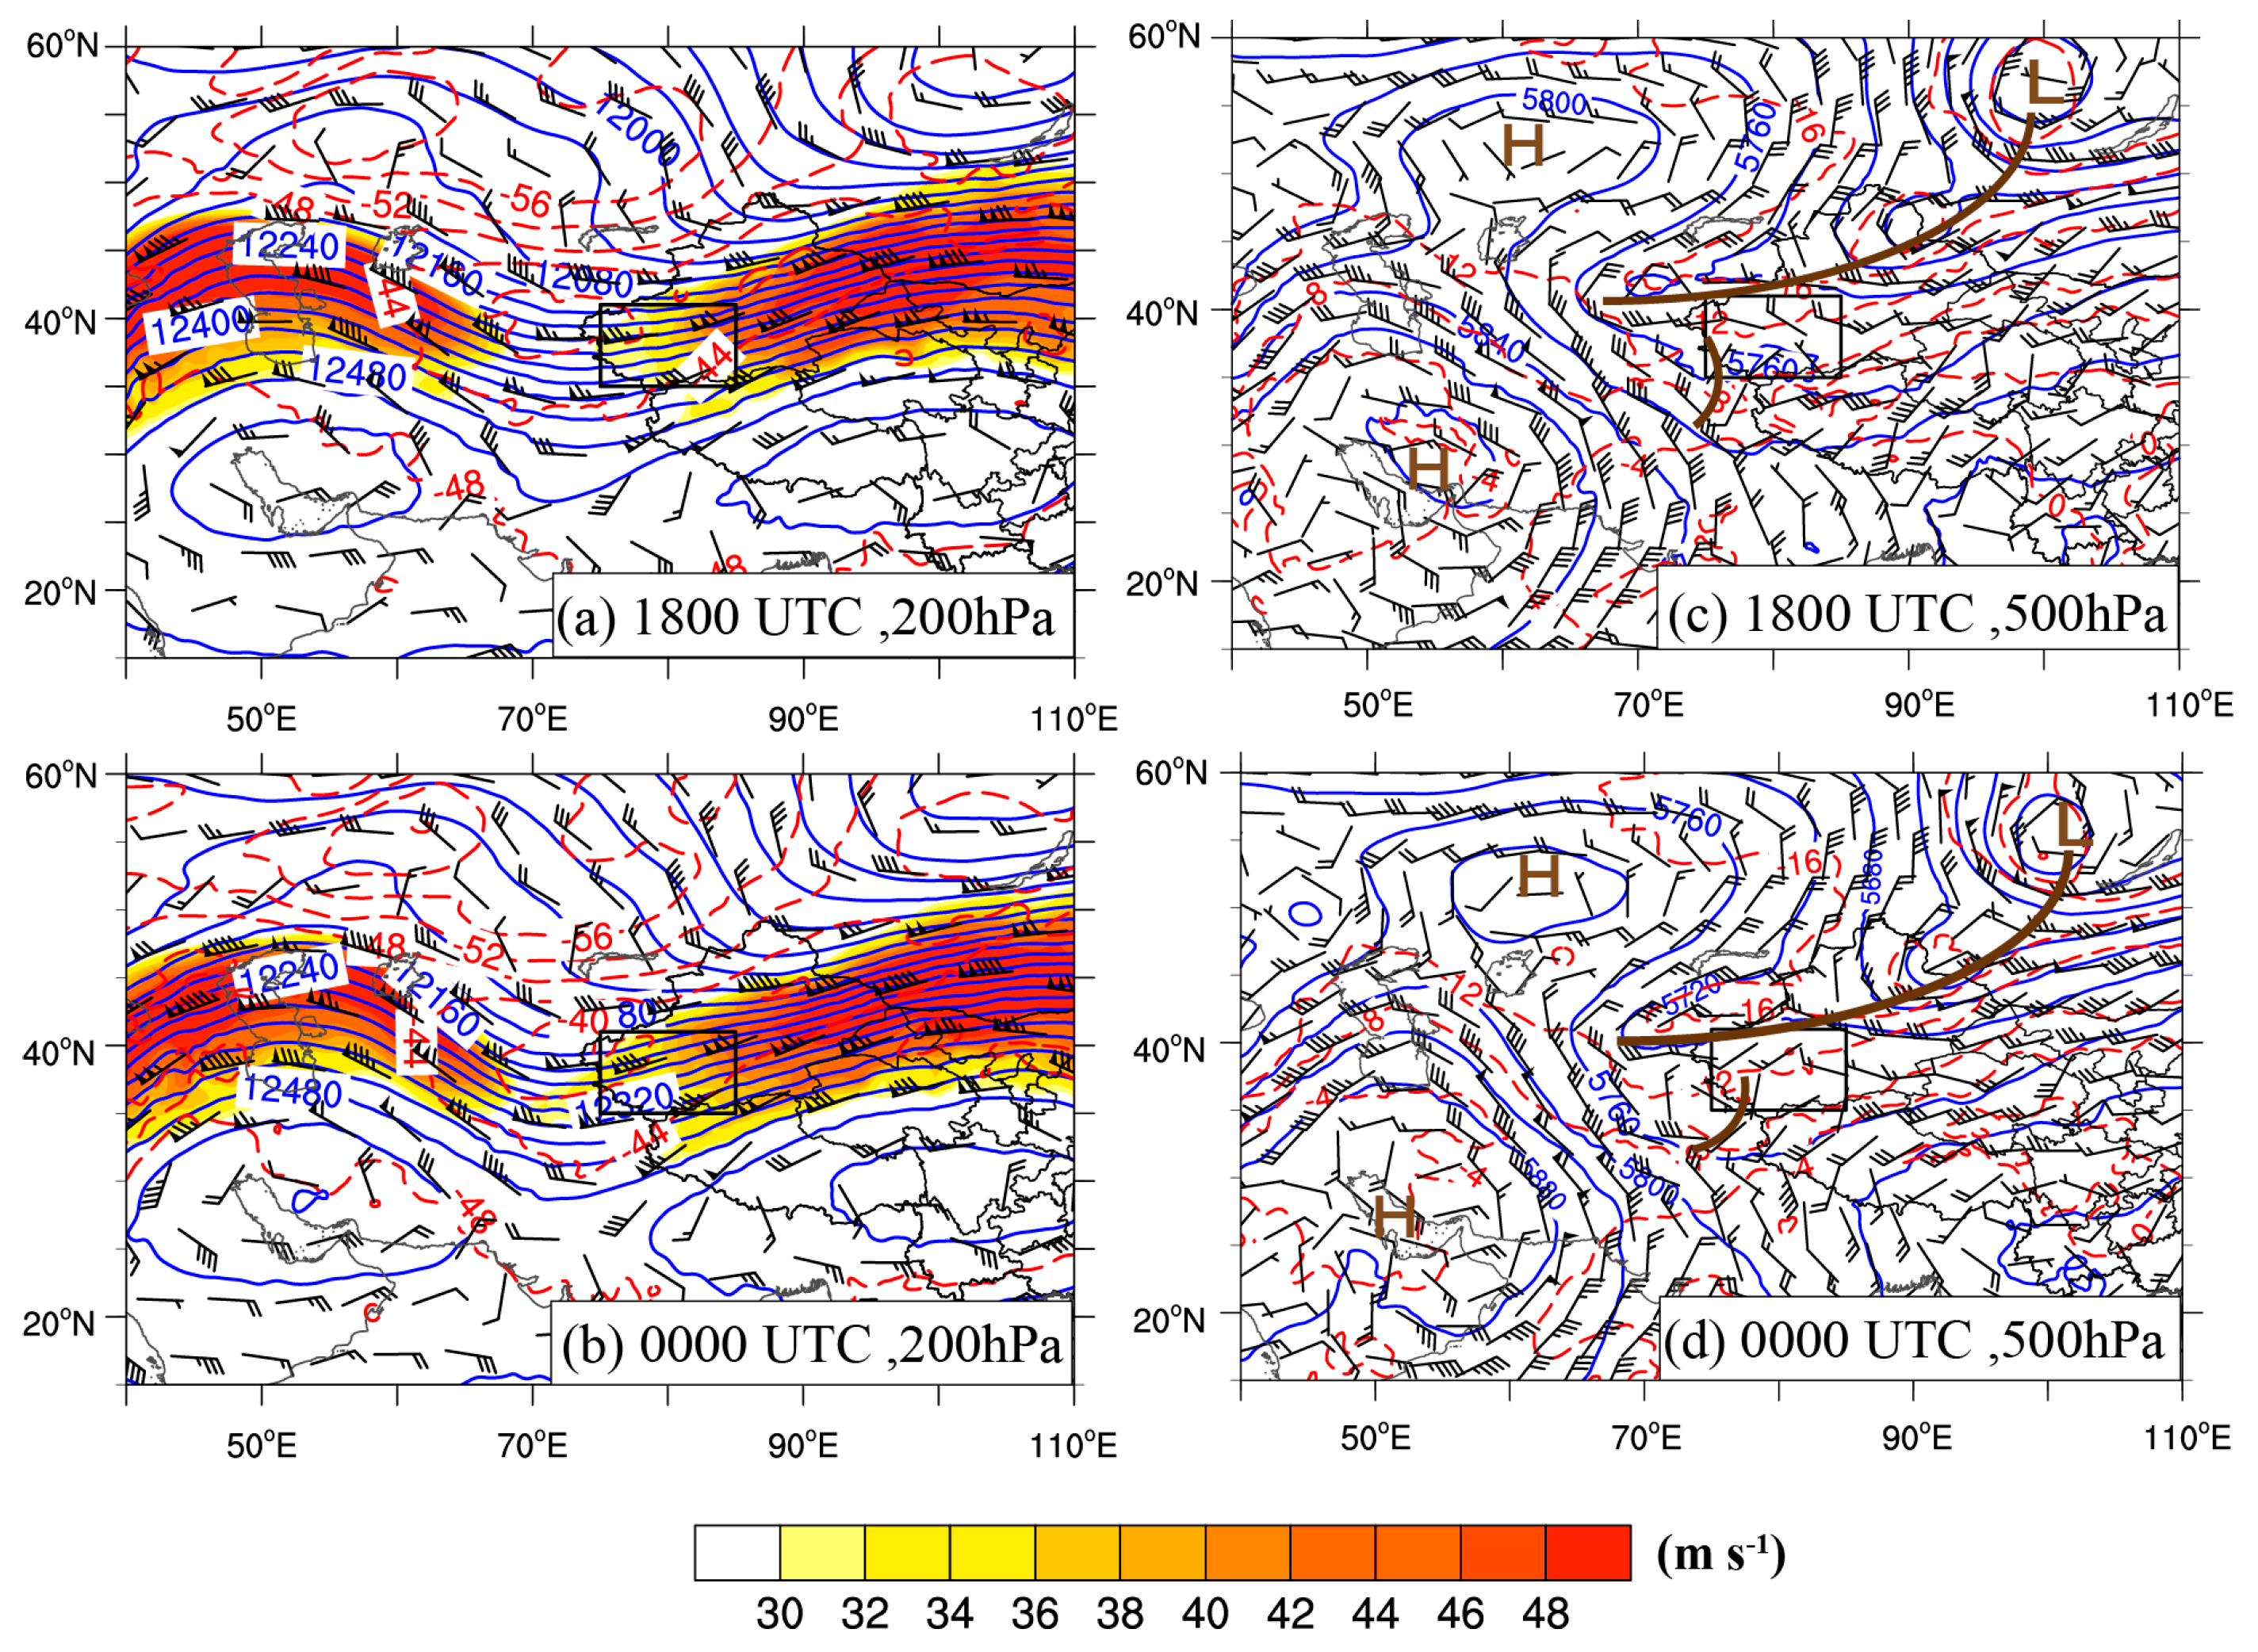
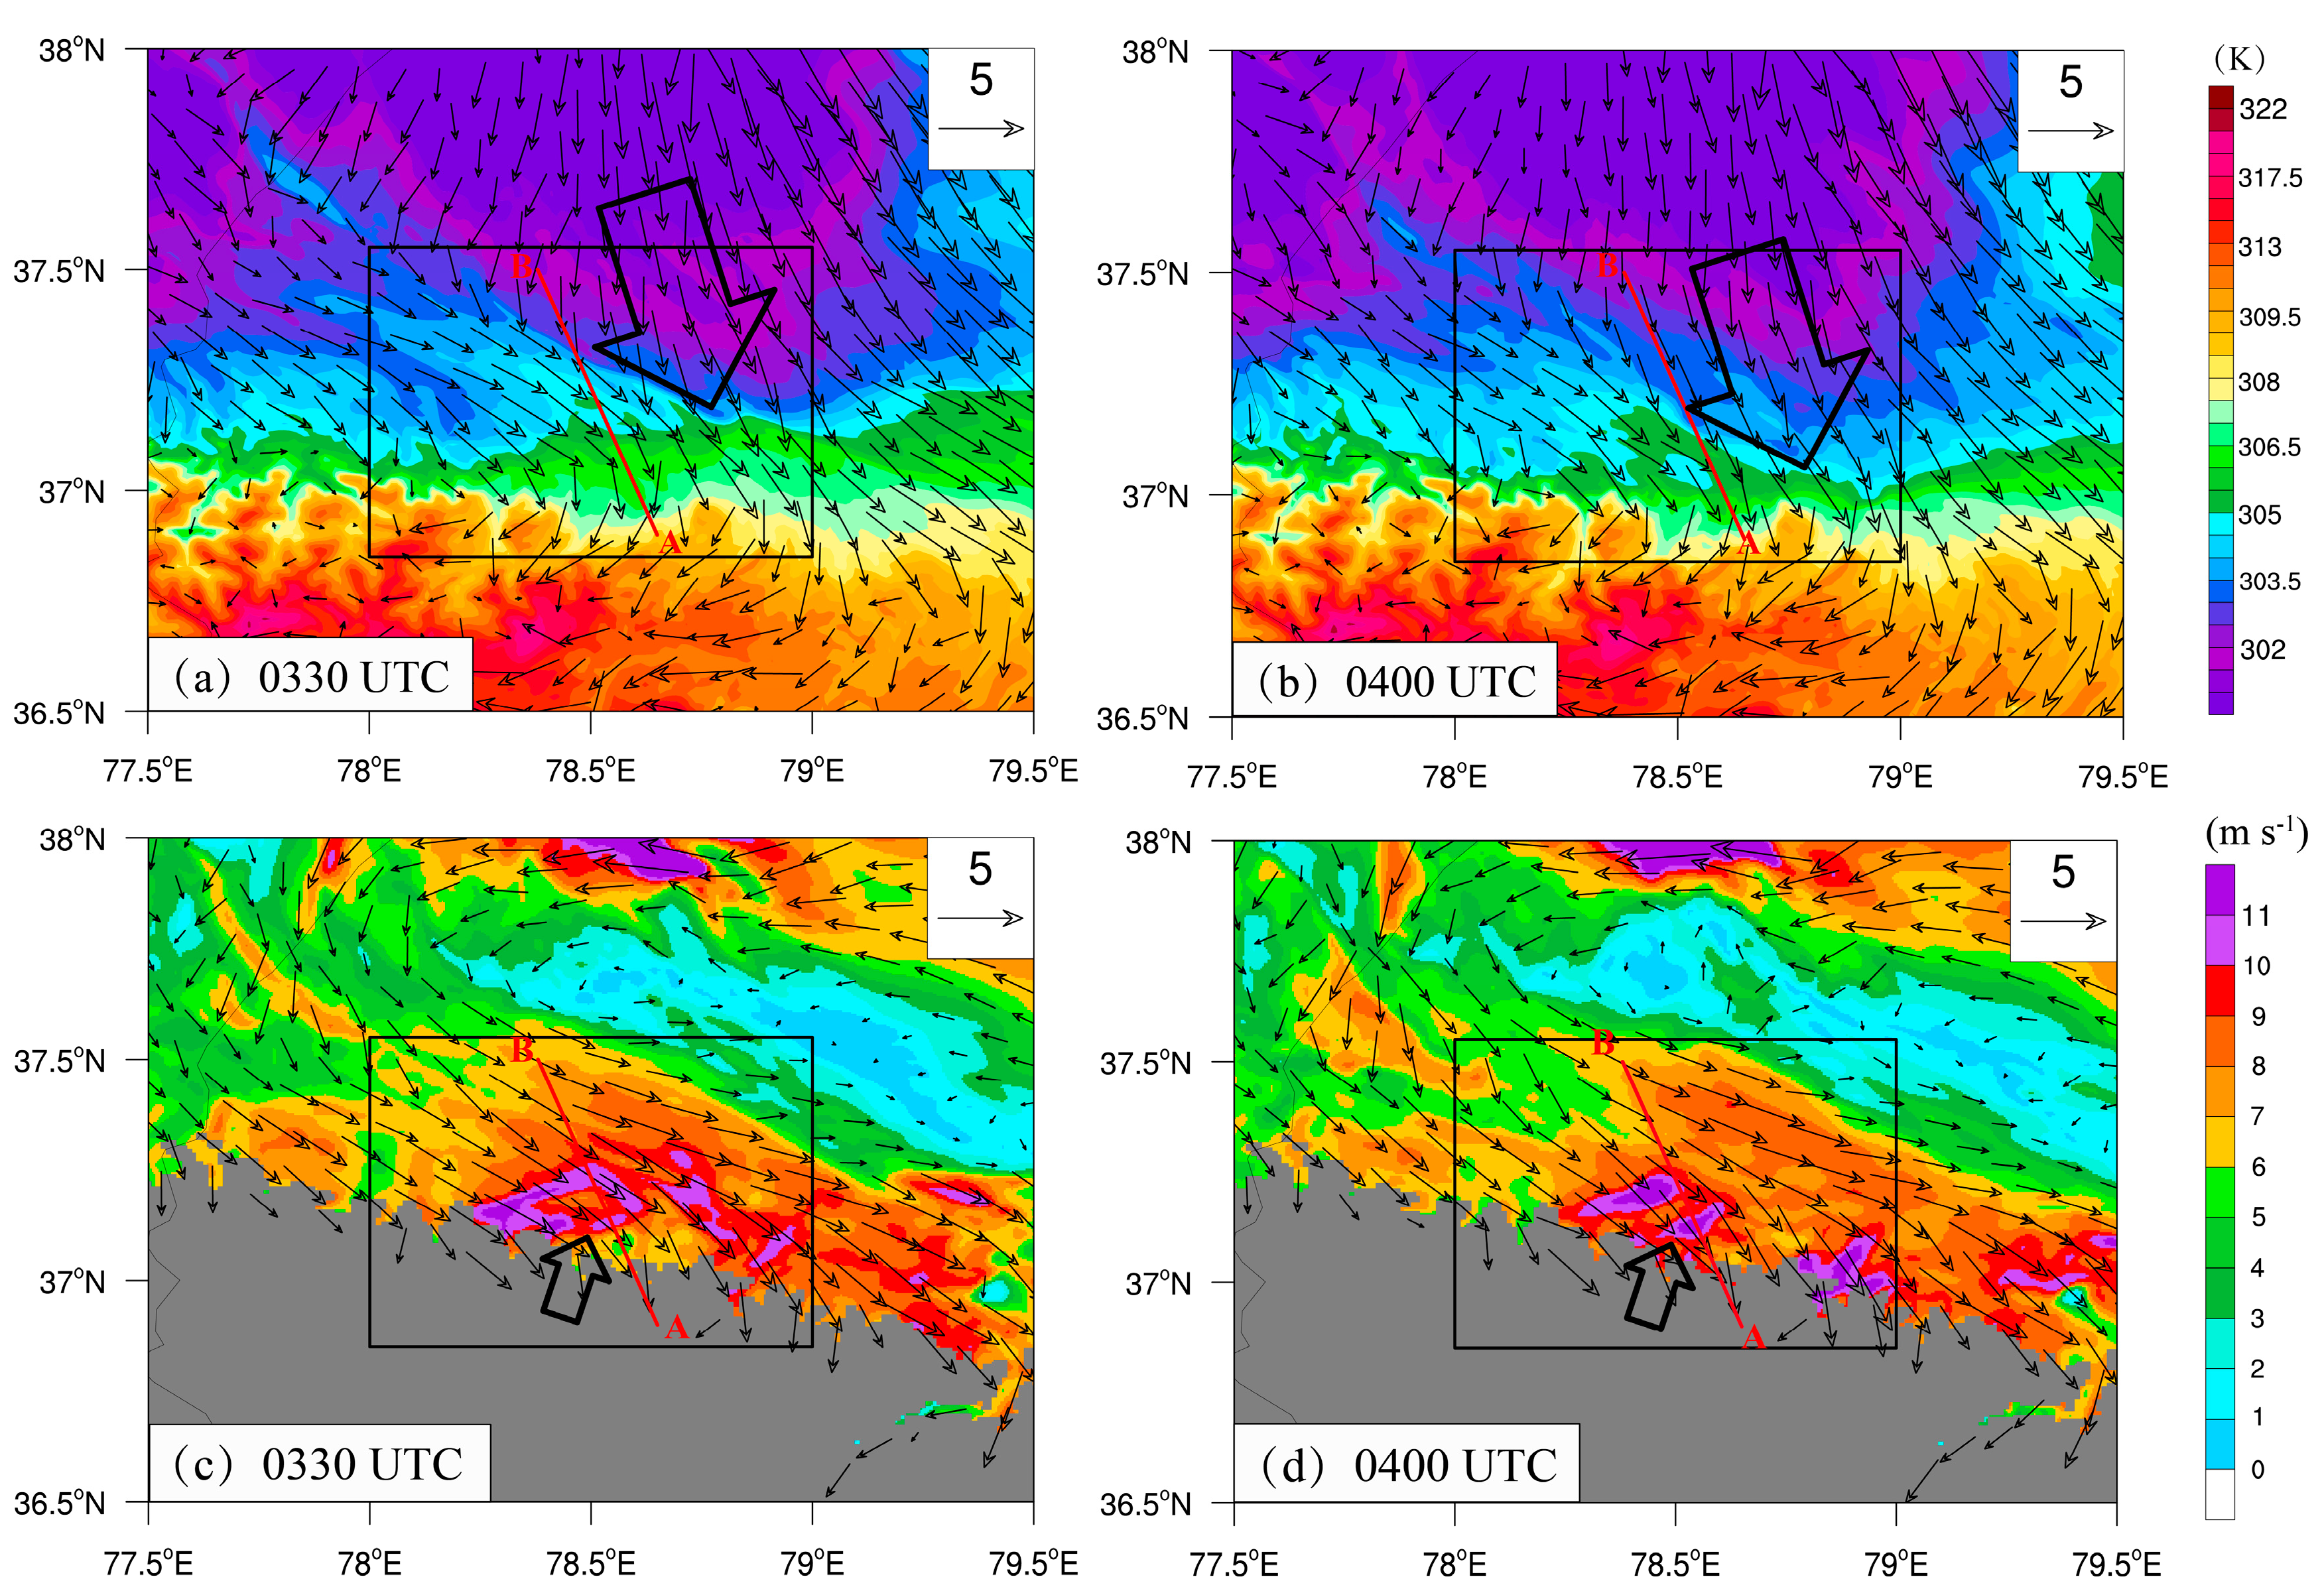
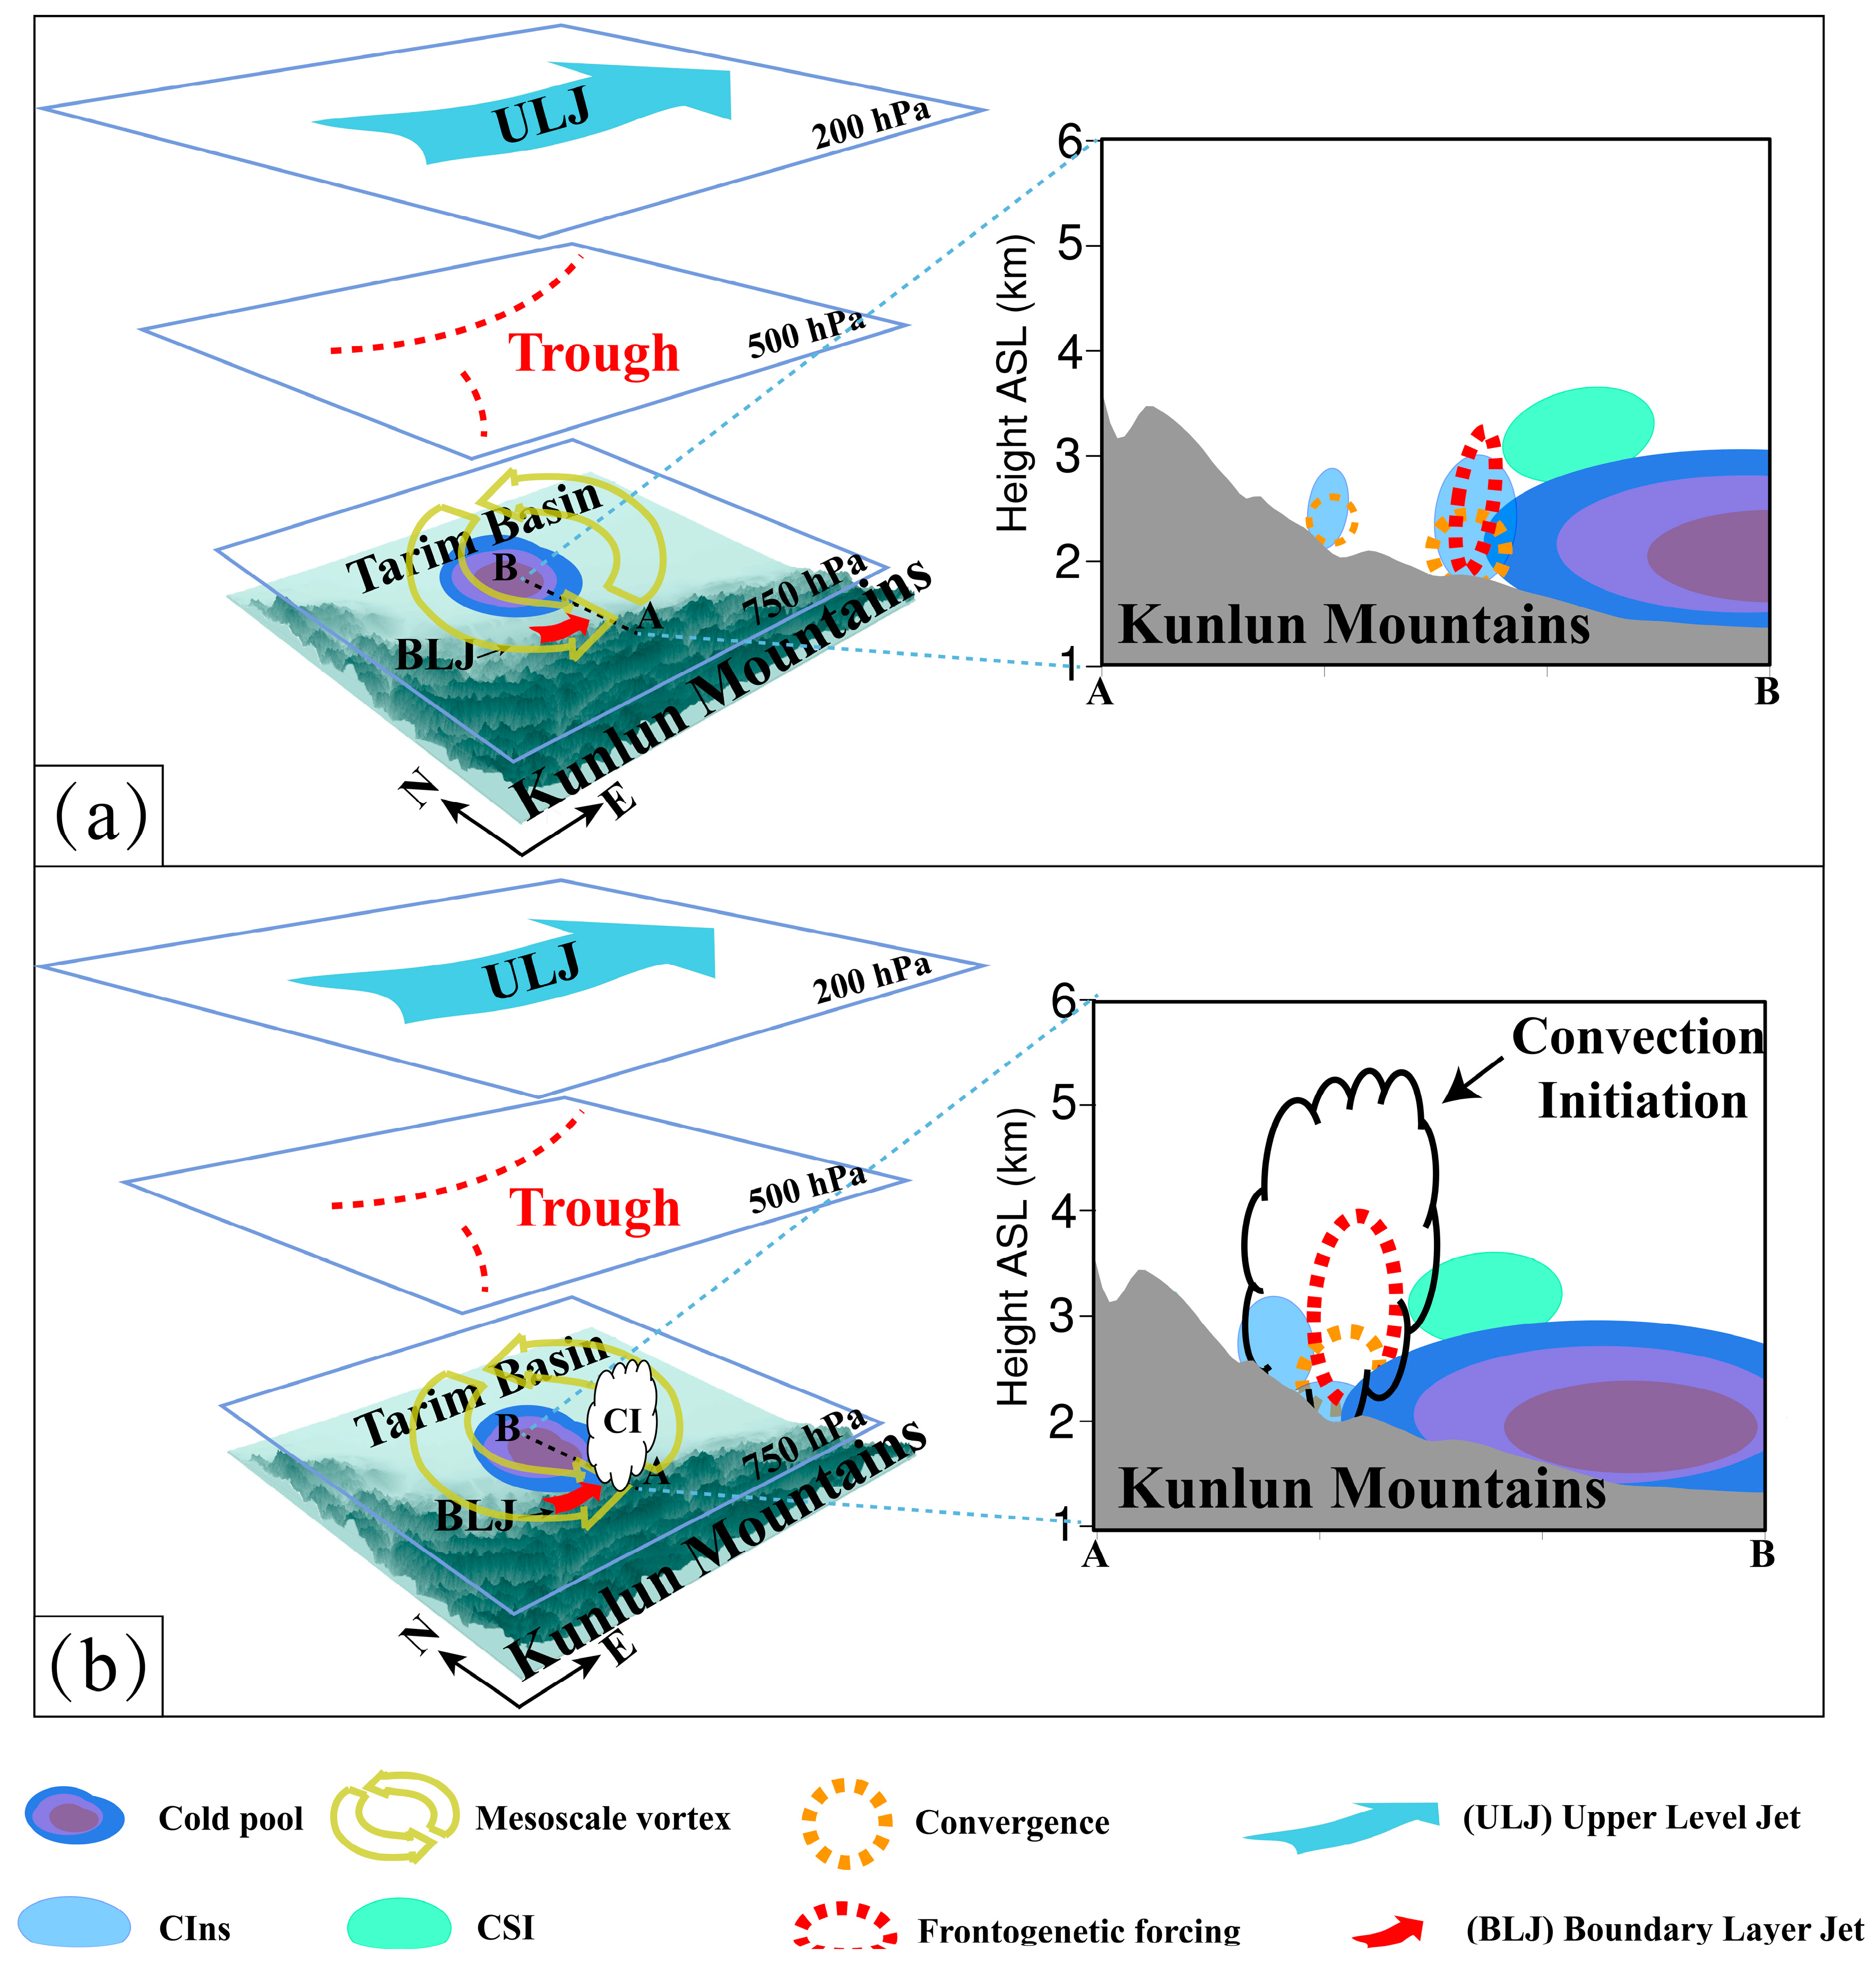
An upper-level jet (ULJ) at 200 hPa and a shortwave trough at 500 hPa delivered favorable conditions for the CI and convection development of the rainstorm event in the mid–higher level of the troposphere. In addition, the combined convergent lifting located at the leading edge of a cold pool (CP) and a boundary layer jet (BLJ) in the low level below ~1 km AGL played an important role for the CI.
(3)
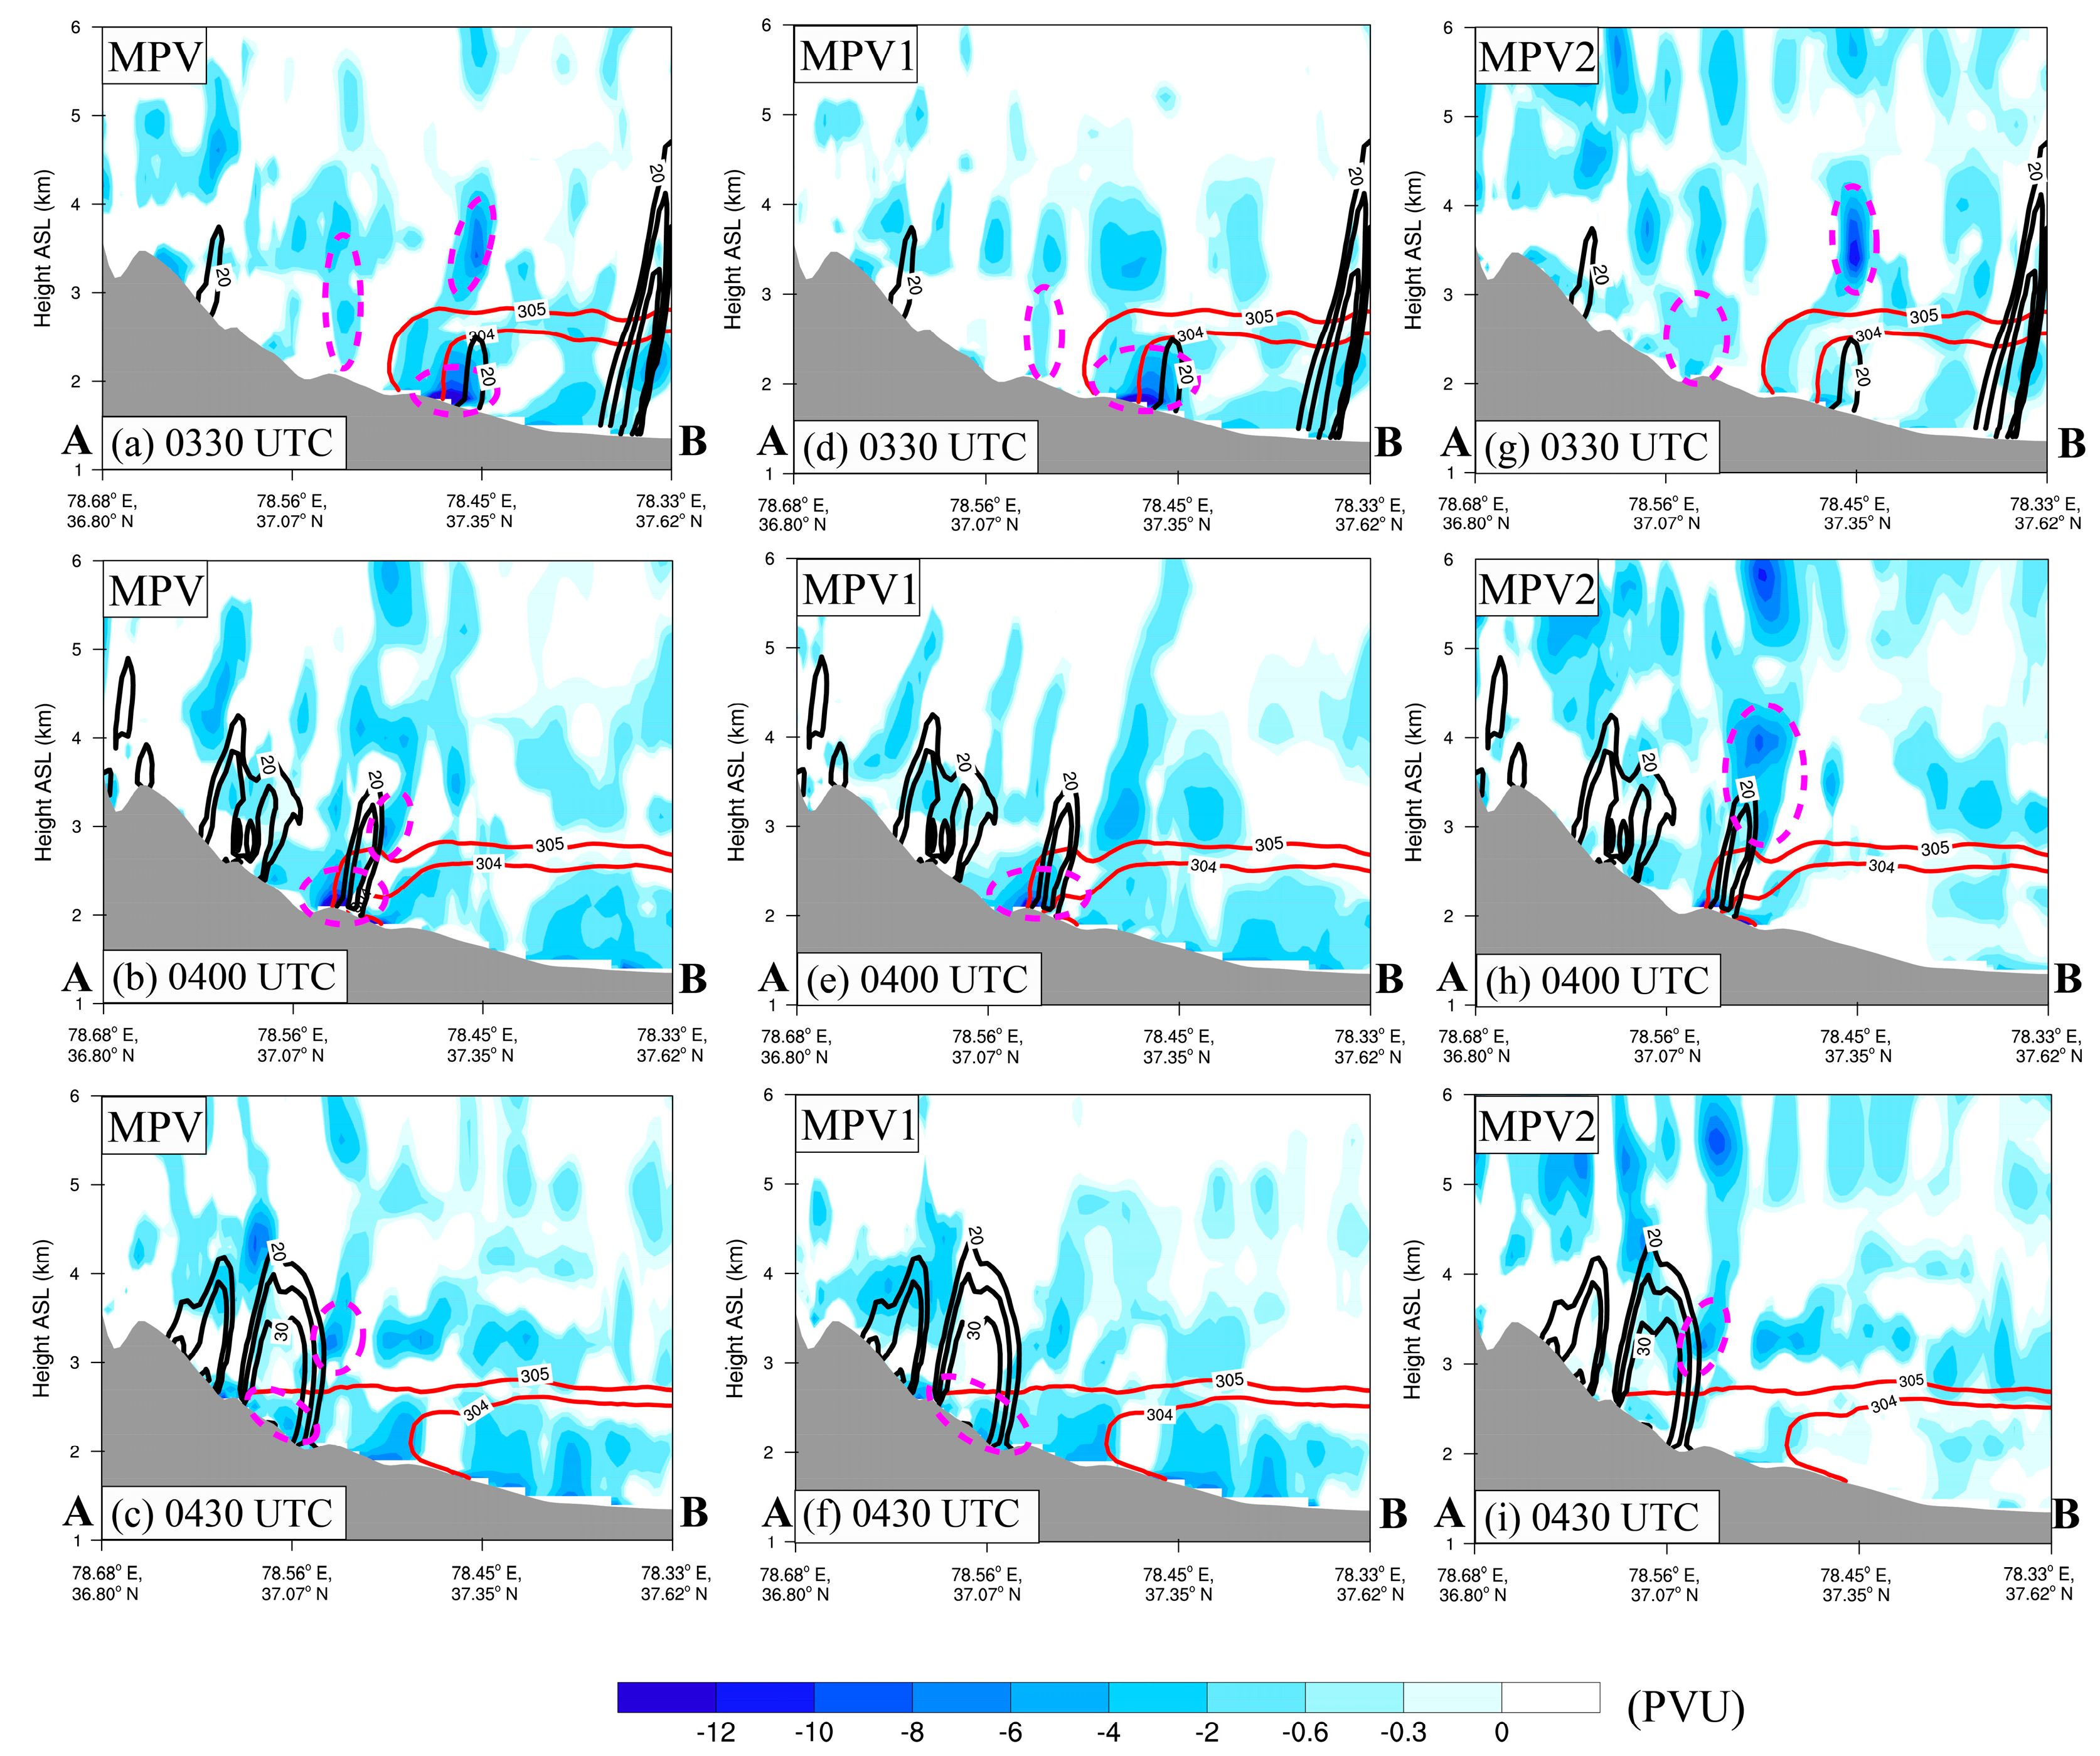
Further investigations based on the MPV revealed that significant atmospheric instability indicated by strong negative MPV values (up to ~−12 PVU) appeared near the leading edge of CP, and the windward slope was influenced by BLJ before the heavy precipitation. As rainfall cloud clusters developed, the unstable energy was released (revealed by the significant decrease in both size and intensity of the negative MPV).
(4)
During the early stage, the main unstable energy on the windward slope was convective instability (CIns, up to ~−12 PVU) and conditional symmetric instability (CSI, up to ~−10 PVU). The CIns played a significant role below ~3 km ASL near the leading edge of the CP, while the CSI made a certain contribution in the 3–5 km ASL height above the CP. During the CI period, the both size and intensity of the CIns significantly decreased compared to the situation before the CI, while CSI still retained relatively high values (up to ~−10 PVU) above the CP, providing favorable conditions of unstable energy for the CI of rainfall cloud clusters.
(5)
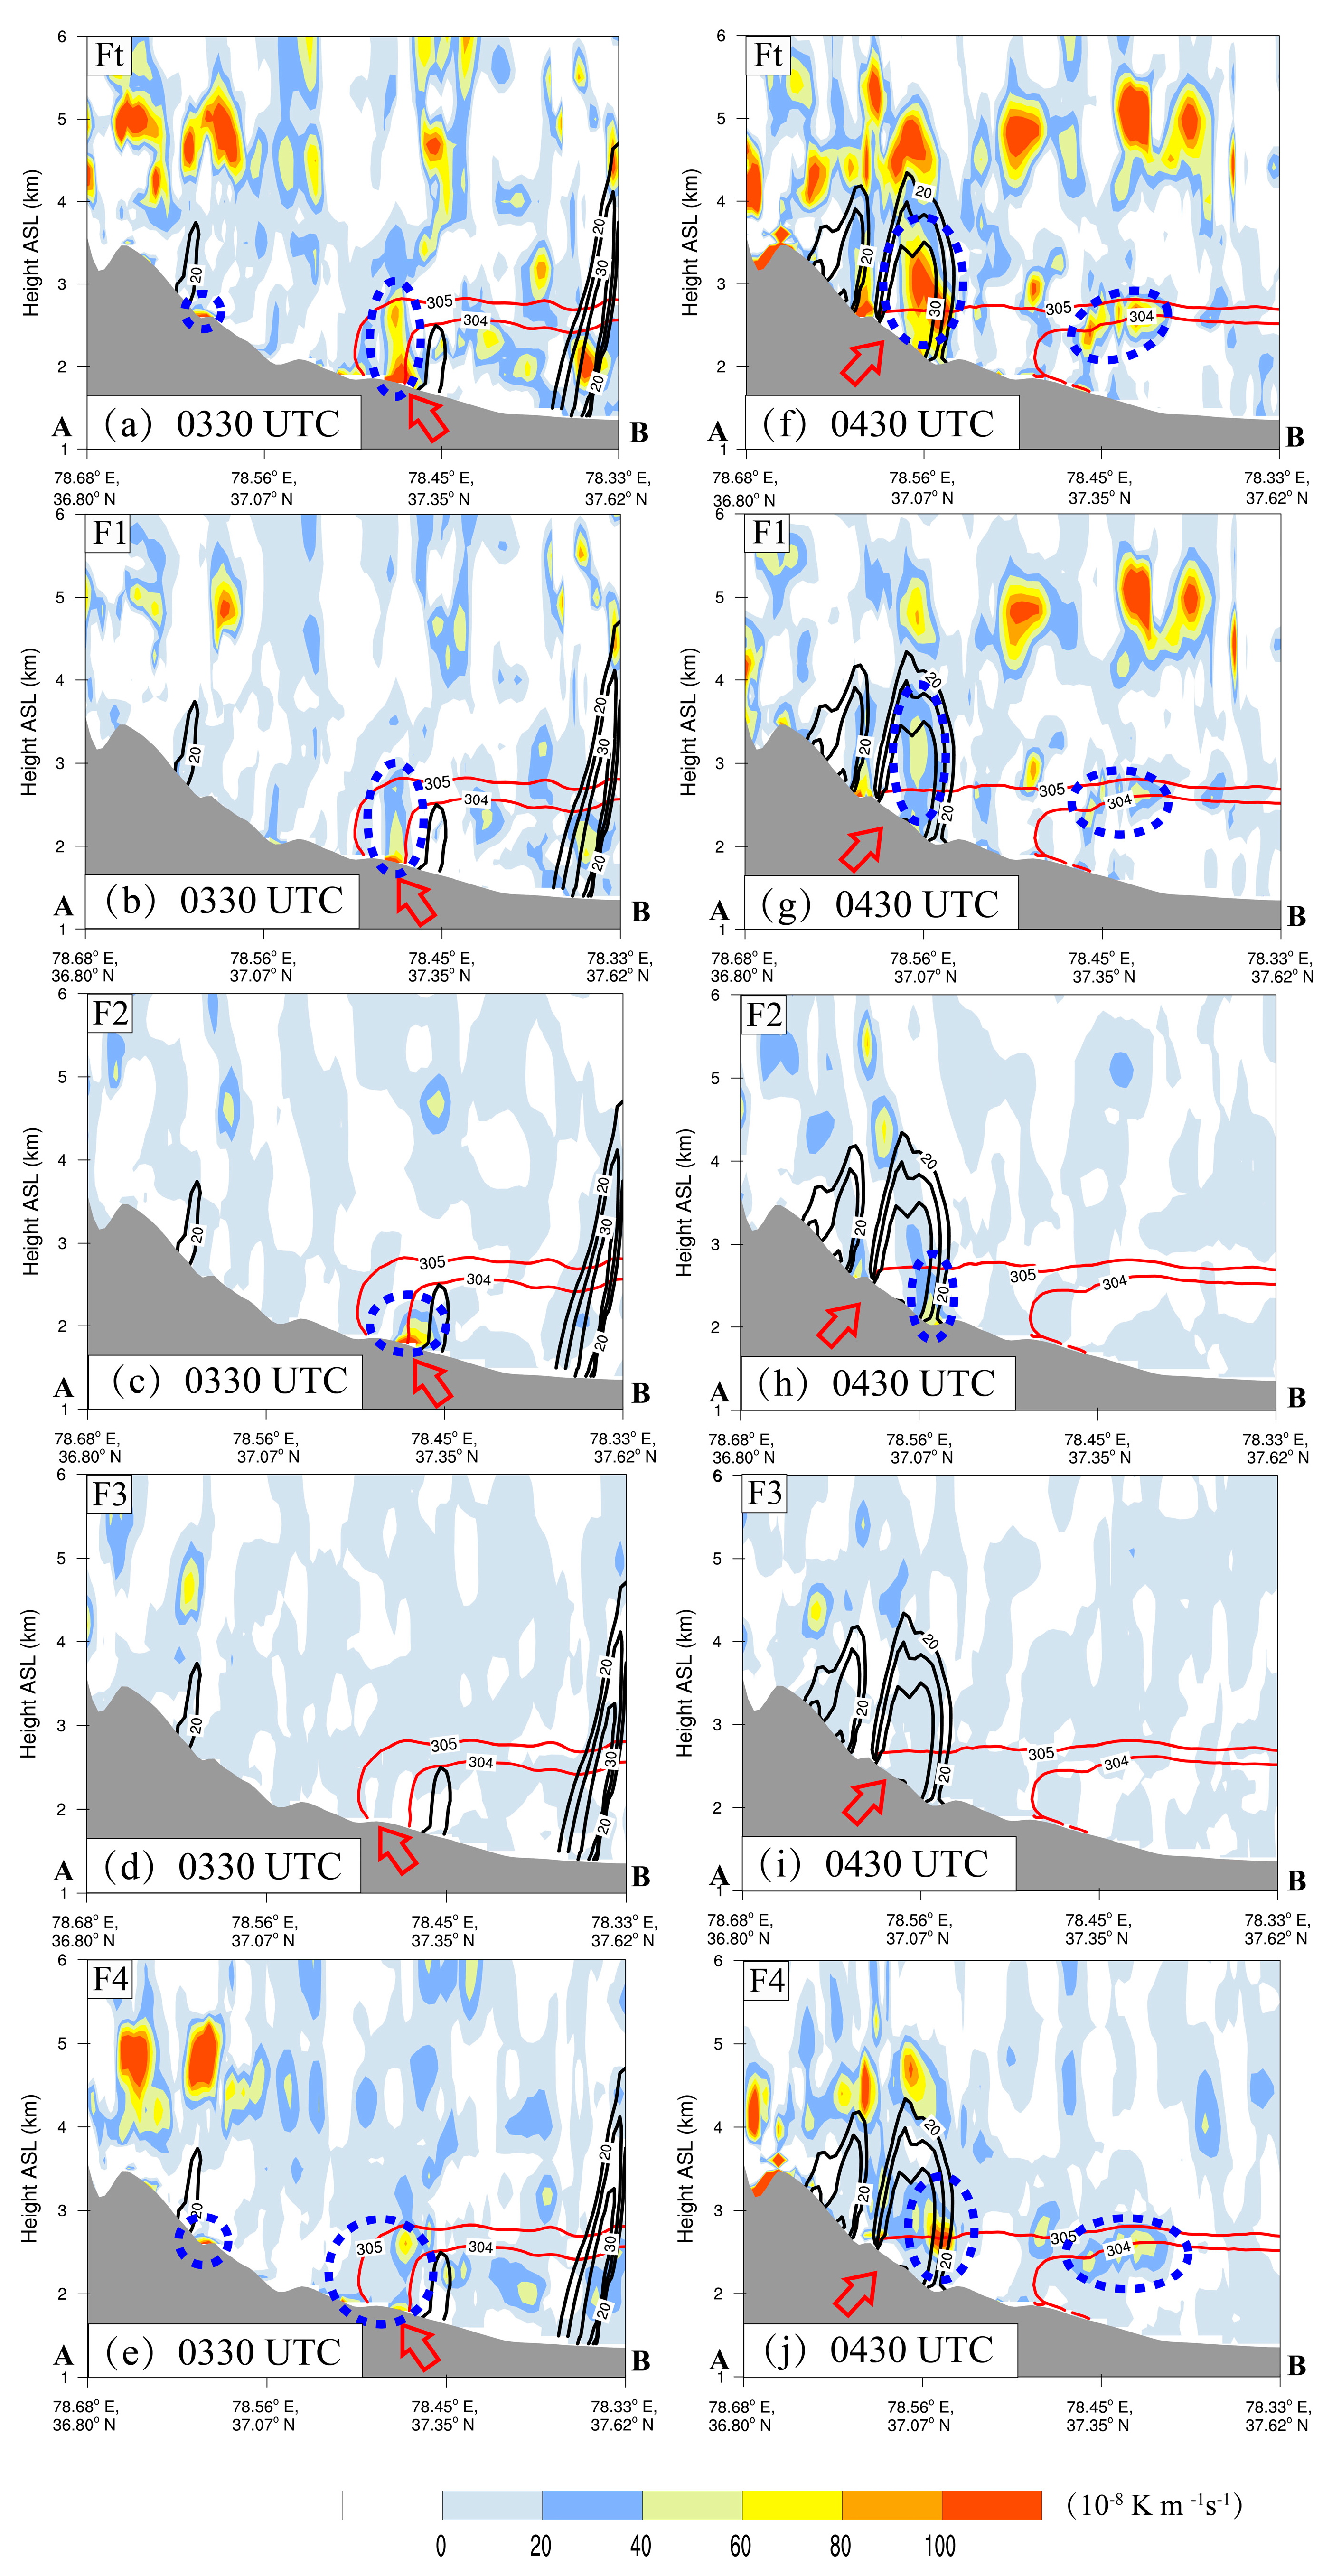
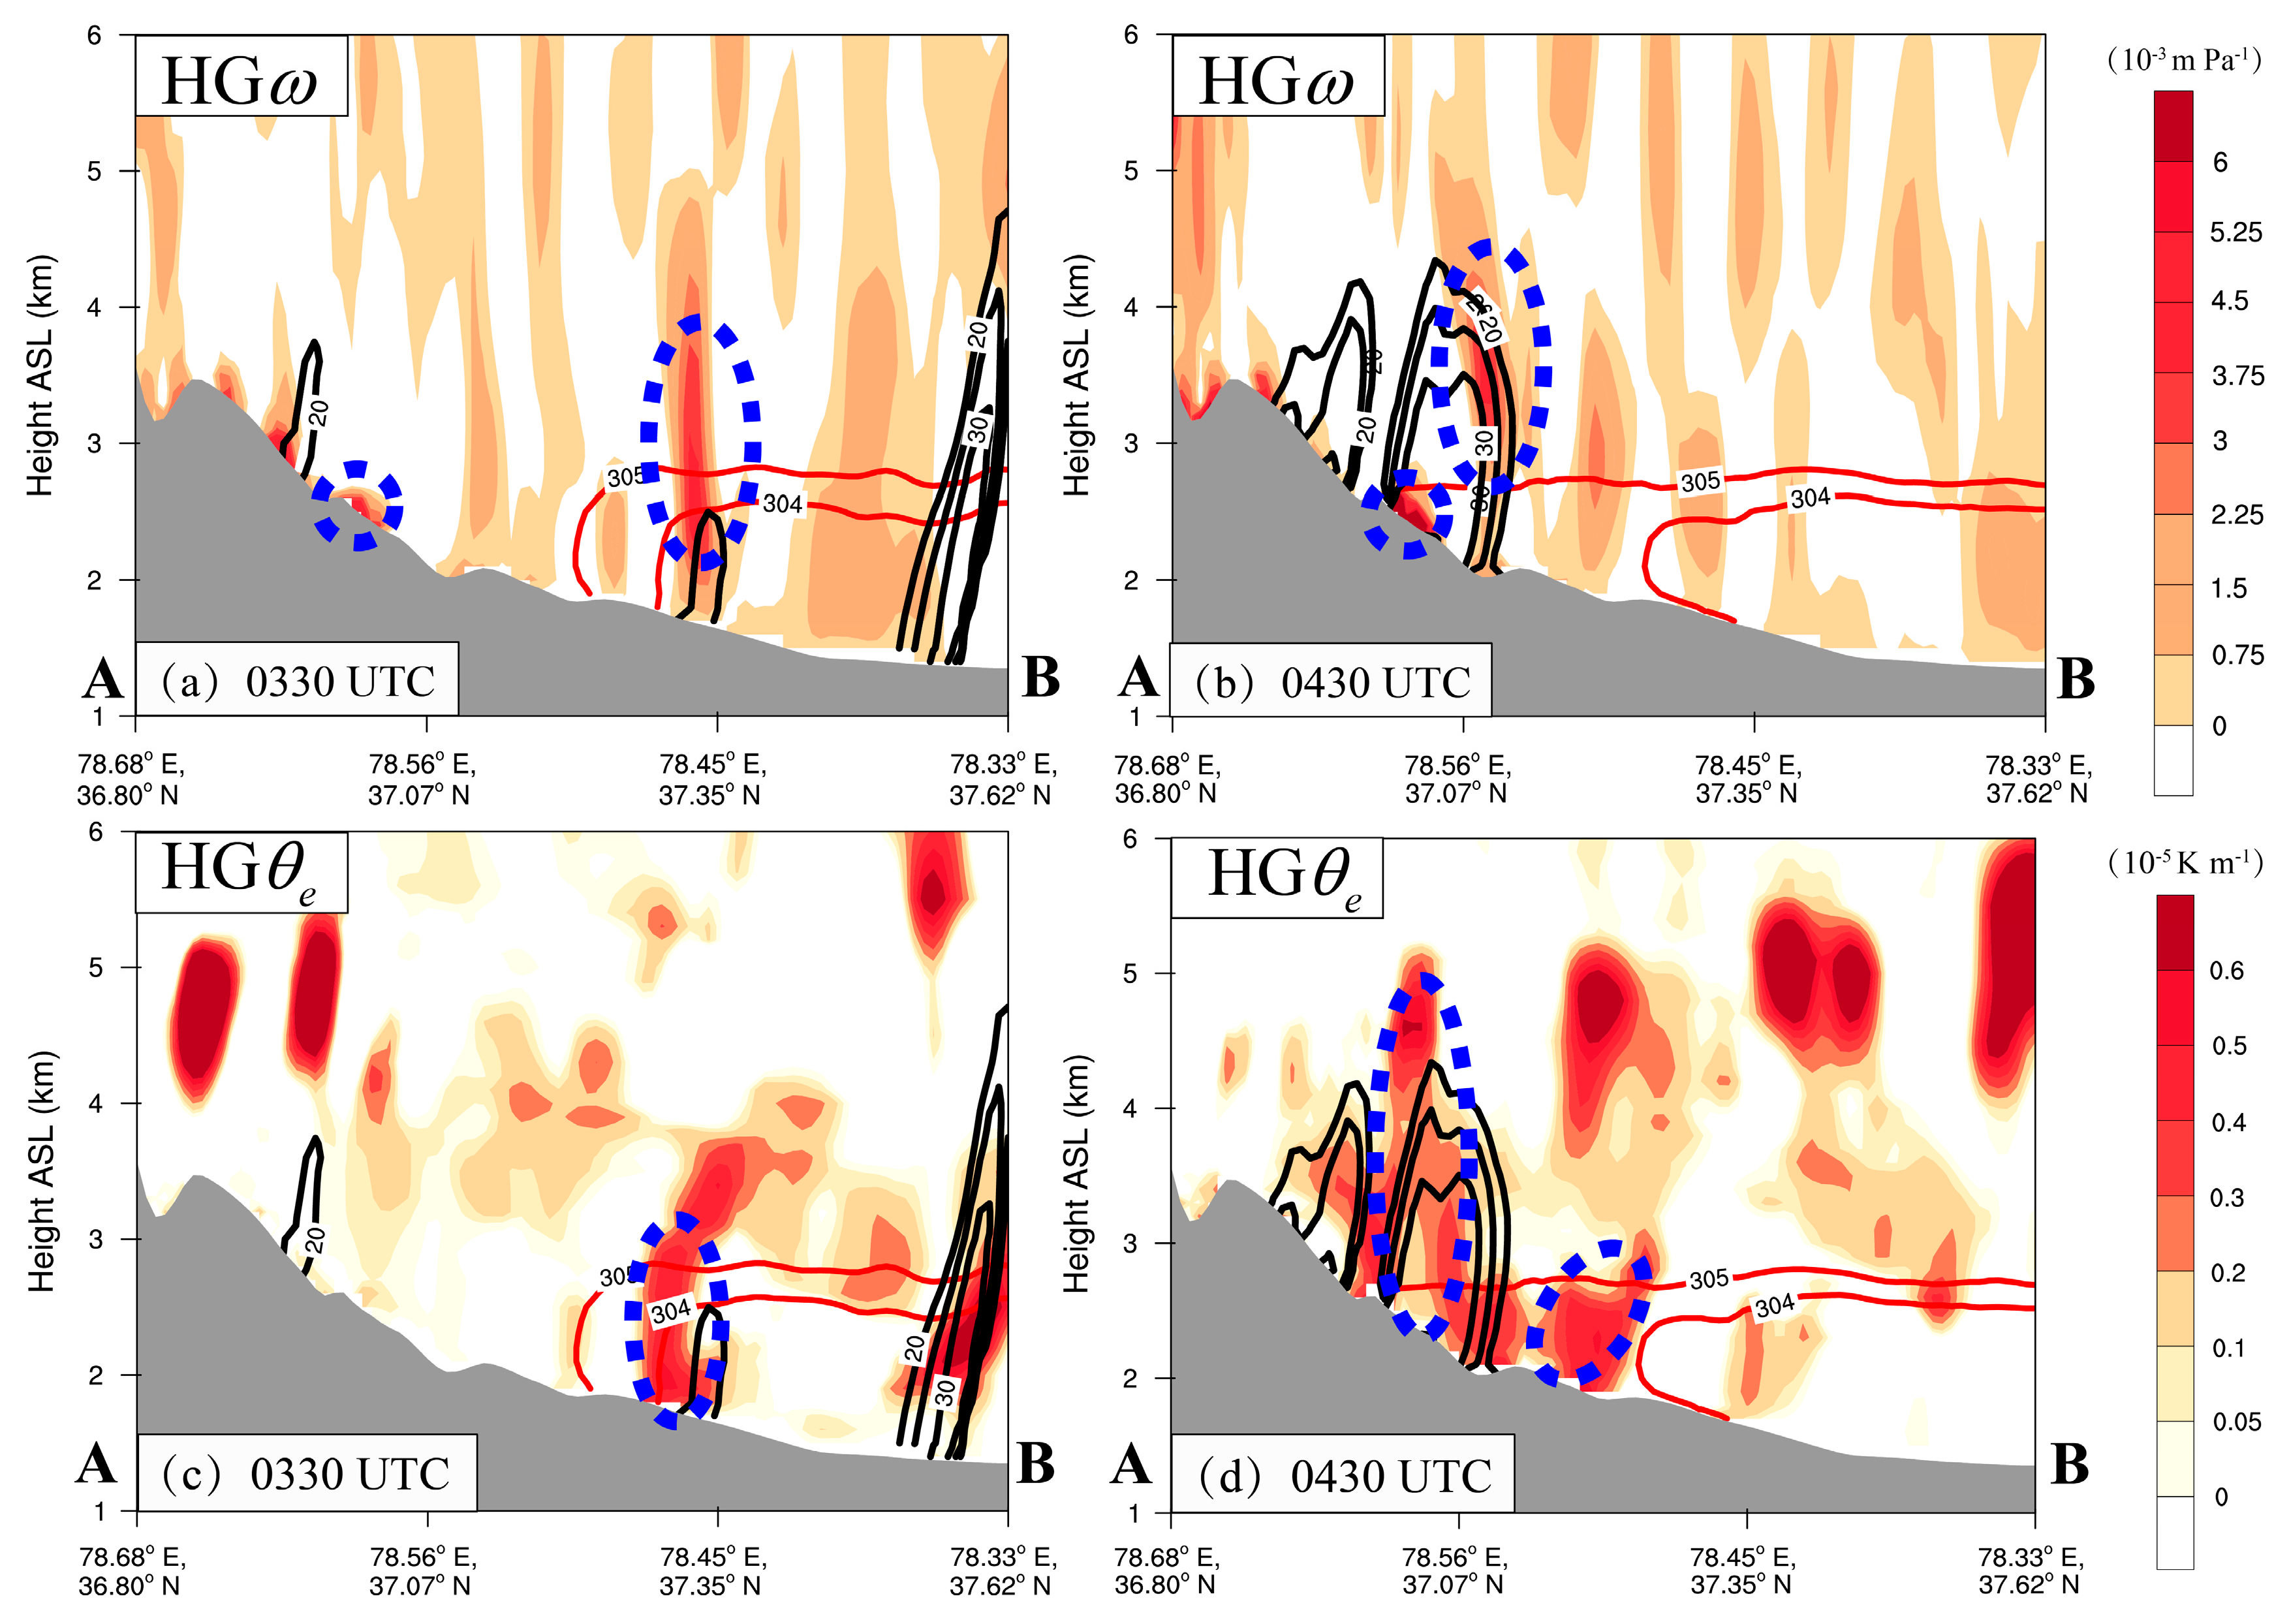
The frontogenetical forcing features associated with the CI showed that the total frontogenesis was mainly dominated by the slantwise term. At the early stage, in addition to the slantwise term (up to ~10−6 K m−1 s−1), the diabatic heating term also contributed weakly along the leading edge of CP, while the convergence and deformation term had weak contributions. By the time of the CI period, besides the slantwise term, the diabatic heating term played an important role within the rainfall cloud cluster (i.e., about 2–5 km ASL), and the convergence had significant contributions at the bottom of the rainfall cloud clusters. The convergence is induced at the leading edge of the CP and the orographic blocking effect. Additionally, the slantwise term was commonly determined by the horizontal gradience of vertical velocity ( HG ω ) and the vertical gradient of potential temperature ( HG θ e ). At the CI time, the contribution of HG θ e was greater than that of HG ω .

Supplementary Materials

The following supporting information can be downloaded at: https://www.mdpi.com/article/10.3390/rs15184505/s1, Figures S1–S7. References [52,65,66,67,68,69,70,71] are cited in the supplementary materials.

Author Contributions

Data curation: Q.S.; formal analysis: Q.S. and A.A.; investigation: Q.S. and A.A.; methodology: A.A.; project administration: A.A.; resources: J.Y., A.M., Y.Z. and R.L.; software: Q.S. and Z.L.; supervision: A.A., A.M. and R.L.; validation: Q.S. and A.A.; writing—original draft: Q.S. and A.A.; writing—review and editing: Q.S., A.A., A.M., D.A. and L.Y. All authors have read and agreed to the published version of the manuscript.

Funding

This work was sponsored by the National Natural Science Foundation of China (No. 42265003), Natural Science Foundation of Xinjiang Uygur Autonomous Region (No. 2022D01D86, No. 2022D01C359), Scientific and Technological Innovation Team (Tianshan Innovation Team) project (Grant No. 2022TSYCTD0007), The Sub-project of the Third Xinjiang Scientific Expedition (No. 2022xjkk030502), National Key Research and Development Program of China (No. 2019YFC151050102, No. 2018YFC1507103), Second Tibetan Plateau Scientific Expedition and Research (STEP) program (No. 2019QZKK010206), 100 Young Doctors Intro-duction Program of Xinjiang (Tianchi Doctor Program) Foundation (No. 50500/04231200737), and Doctoral Research Startup Foundation of Xinjiang University (No. 50500/62031224618).

Data Availability Statement

The NCEP FNL data can be downloaded from https://rda.ucar.edu/datasets/ds083.2, accessed on 14 July 2022. The ERA5 data can be downloaded from https://cds.climate.copernicus.eu/#!/home, accessed on 22 July 2022.

Acknowledgments

We thank the three anonymous reviewers and all editors for their valuable comments, suggestions and efforts during the handling of our manuscript. We also thank for the High-Performance Computing Center of Nanjing University for performing the numerical calculations in this paper on its IBM Blade cluster system.

Conflicts of Interest

The authors declare no conflict of interest.

References

  1. Marengo, J.A.; Alcantara, E.; Cunha, A.P.; Seluchi, M.; Nobre, C.A.; Dolif, G.; Goncalves, D.; Assis Dias, M.; Cuartas, L.A.; Bender, F.; et al. Flash Floods and Landslides in the City of Recife, Northeast Brazil after Heavy Rain on May 25–28, 2022: Causes, Impacts, and Disaster Preparedness. Weather Clim. Extrem. 2023, 39, 100545. [Google Scholar] [CrossRef]
  2. Masson-Delmotte, V.; Zhai, P.; Pirani, A.; Connors, S.L.; Péan, C.; Berger, S.; Caud, N.; Chen, Y.; Goldfarb, L.; Gomis, M.I. Climate Change 2021: The Physical Science Basis; Cambridge University Press: Cambridge, UK, 2021; Volume 2. [Google Scholar]
  3. Oguz Altunel, A.; Kara, F. Tracing the Culprits over the Destruction of Three Coastal Communities during a Rouge Rainstorm on August 2021 in North Central Türkiye. Ocean Coast. Manag. 2023, 241, 106630. [Google Scholar] [CrossRef]
  4. Nanditha, J.S.; Kushwaha, A.P.; Singh, R.; Malik, I.; Solanki, H.; Chuphal, D.S.; Dangar, S.; Mahto, S.S.; Vegad, U.; Mishra, V. The Pakistan Flood of August 2022: Causes and Implications. Earths Future 2023, 11, e2022EF003230. [Google Scholar] [CrossRef]
  5. Li, Z.; Abulikemu, A.; Zhu, K.; Mamtimin, A.; Zeng, Y.; Li, J.; Abulimiti, A.; Kadier, Z.; Abuduaini, A.; Li, C.; et al. Diurnal Variation Characteristics of Summer Precipitation and Related Statistical Analysis in the Ili Region, Xinjiang, Northwest China. Remote Sens. 2023, 15, 3954. [Google Scholar] [CrossRef]
  6. Terry, J.P.; Al Ruheili, A.; Almarzooqi, M.A.; Almheiri, R.Y.; Alshehhi, A.K. The Rain Deluge and Flash Floods of Summer 2022 in the United Arab Emirates: Causes, Analysis and Perspectives on Flood-Risk Reduction. J. Arid. Environ. 2023, 215, 105013. [Google Scholar] [CrossRef]
  7. Dalagnol, R.; Gramcianinov, C.B.; Crespo, N.M.; Luiz, R.; Chiquetto, J.B.; Marques, M.T.A.; Neto, G.D.; de Abreu, R.C.; Li, S.; Lott, F.C.; et al. Extreme Rainfall and Its Impacts in the Brazilian Minas Gerais State in January 2020: Can We Blame Climate Change? Clim. Resil. Sustain. 2022, 1, e15. [Google Scholar] [CrossRef]
  8. Chalov, S.; Platonov, V.; Erina, O.; Moreido, V.; Samokhin, M.; Sokolov, D.; Tereshina, M.; Yarinich, Y.; Kasimov, N. Rainstorms Impacts on Water, Sediment, and Trace Elements Loads in an Urbanized Catchment within Moscow City: Case Study of Summer 2020 and 2021. Theor. Appl. Climatol. 2023, 151, 871–889. [Google Scholar] [CrossRef]
  9. Huang, W.; Feng, S.; Chen, J.; Chen, F. Physical Mechanisms of Summer Precipitation Variations in the Tarim Basin in Northwestern China. J. Clim. 2015, 28, 3579–3591. [Google Scholar] [CrossRef]
  10. He, X.; Abulikemu, A.; Mamtimin, A.; Li, R.; Abulimiti, A.; An, D.; Aireti, M.; Zhou, Y.; Sun, Q.; Li, Z.; et al. On the Mechanisms of a Snowstorm Associated with a Low-Level Cold Front and Low-Level Jet in the Western Mountainous Region of the Junggar Basin, Xinjiang, Northwest China. Atmosphere 2023, 14, 919. [Google Scholar] [CrossRef]
  11. Abulikemu, A.; Xu, X.; Wang, Y.; Ding, J.; Wang, Y. Atypical Occlusion Process Caused by the Merger of a Sea-Breeze Front and Gust Front. Adv. Atmos. Sci. 2015, 32, 1431–1443. [Google Scholar] [CrossRef]
  12. Abulikemu, A.; Xu, X.; Wang, Y.; Ding, J.; Zhang, S.; Shen, W. A Modeling Study of Convection Initiation Prior to the Merger of a Sea-Breeze Front and a Gust Front. Atmos. Res. 2016, 182, 10–19. [Google Scholar] [CrossRef]
  13. Abulikemu, A.; Ming, J.; Xu, X.; Zhuge, X.; Wang, Y.; Zhang, Y.; Zhang, S.; Yu, B.; Aireti, M. Mechanisms of Convection Initiation in the Southwestern Xinjiang, Northwest China: A Case Study. Atmosphere 2020, 11, 1335. [Google Scholar] [CrossRef]
  14. Ukkonen, P.; Manzato, A.; Mäkelä, A. Evaluation of Thunderstorm Predictors for Finland Using Reanalyses and Neural Networks. J. Appl. Meteorol. Climatol. 2017, 56, 2335–2352. [Google Scholar] [CrossRef]
  15. Chen, G.; Zhao, K.; Lu, Y.; Zheng, Y.; Xue, M.; Tan, Z.-M.; Xu, X.; Huang, H.; Chen, H.; Xu, F. Variability of Microphysical Characteristics in the “21· 7” Henan Extremely Heavy Rainfall Event. Sci. China Earth Sci. 2022, 65, 1861–1878. [Google Scholar]
  16. Chen, X.; Zhang, F.; Zhao, K. Diurnal Variations of the Land–Sea Breeze and Its Related Precipitation over South China. J. Atmos. Sci. 2016, 73, 4793–4815. [Google Scholar]
  17. Zhang, S.; Parsons, D.B.; Xu, X.; Wang, Y.; Liu, J.; Abulikemu, A.; Shen, W.; Zhang, X.; Zhang, S. A Modeling Study of an Atmospheric Bore Associated with a Nocturnal Convective System over China. J. Geophys. Res. Atmos. 2020, 125, e2019JD032279. [Google Scholar] [CrossRef]
  18. Zhang, S.; Parsons, D.B.; Xu, X.; Sun, J.; Wu, T.; Abulikemu, A.; Xu, F.; Chen, G.; Shen, W.; Liu, L. Dynamics Governing a Simulated Bow-and-Arrow-Type Mesoscale Convective System. Mon. Weather Rev. 2023, 151, 603–623. [Google Scholar]
  19. Bai, L.; Meng, Z.; Huang, Y.; Zhang, Y.; Niu, S.; Su, T. Convection Initiation Resulting from the Interaction between a Quasi-stationary Dryline and Intersecting Gust Fronts: A Case Study. J. Geophys. Res. Atmos. 2019, 124, 2379–2396. [Google Scholar] [CrossRef]
  20. Lin, G.; Grasmick, C.; Geerts, B.; Wang, Z.; Deng, M. Convection Initiation and Bore Formation Following the Collision of Mesoscale Boundaries over a Developing Stable Boundary Layer: A Case Study from PECAN. Mon. Weather Rev. 2021, 149, 2351–2367. [Google Scholar] [CrossRef]
  21. Du, Y.; Chen, G.; Han, B.; Bai, L.; Li, M. Convection Initiation and Growth at the Coast of South China. Part II: Effects of the Terrain, Coastline, and Cold Pools. Mon. Weather Rev. 2020, 148, 3871–3892. [Google Scholar]
  22. Kirshbaum, D.J.; Adler, B.; Kalthoff, N.; Barthlott, C.; Serafin, S. Moist Orographic Convection: Physical Mechanisms and Links to Surface-Exchange Processes. Atmosphere 2018, 9, 80. [Google Scholar] [CrossRef]
  23. McMurdie, L.A.; Rowe, A.K.; Houze, R.A.; Brodzik, S.R.; Zagrodnik, J.P.; Schuldt, T.M. Terrain-Enhanced Precipitation Processes Above the Melting Layer: Results From OLYMPEX. J. Geophys. Res. Atmos. 2018, 123, 12194–12209. [Google Scholar] [CrossRef] [PubMed]
  24. Mulholland, J.P.; Nesbitt, S.W.; Trapp, R.J. A Case Study of Terrain Influences on Upscale Convective Growth of a Supercell. Mon. Weather Rev. 2019, 147, 4305–4324. [Google Scholar] [CrossRef]
  25. Xu, W.; Zipser, E.E.; Chen, Y.L.; Liu, C.; Liou, Y.C.; Lee, W.C.; Jou, B.J.D. An Orography-Associated Extreme Rainfall Event during TiMREX: Initiation, Storm Evolution, and Maintenance. Mon. Weather Rev. 2012, 140, 2555–2574. [Google Scholar] [CrossRef]
  26. Wei, P.; Xu, X.; Xue, M.; Zhang, C.; Wang, Y.; Zhao, K.; Zhou, A.; Zhang, S.; Zhu, K. On the Key Dynamical Processes Supporting the 21.7 Zhengzhou Record-Breaking Hourly Rainfall in China. Adv. Atmos. Sci. 2023, 40, 337–349. [Google Scholar] [CrossRef]
  27. Kang, Y.; Peng, X.; Wang, S.; Hu, Y.; Shang, K.; Lu, S. Observational Analyses of Topographic Effects on Convective Systems in an Extreme Rainfall Event in Northern China. Atmos. Res. 2019, 229, 127–144. [Google Scholar] [CrossRef]
  28. Rao, X.; Zhao, K.; Chen, X.; Huang, A.; Hu, S.; Hu, D.; Liu, X. Roles of Multi-Scale Orography in Triggering Nocturnal Convection at a Summer Rainfall Hotspot Over the South China Coast: A Case Study. J. Geophys. Res. Atmos. 2022, 127, e2022JD036503. [Google Scholar] [CrossRef]
  29. Fu, P.; Zhu, K.; Zhao, K.; Zhou, B.; Xue, M. Role of the Nocturnal Low-Level Jet in the Formation of the Morning Precipitation Peak over the Dabie Mountains. Adv. Atmos. Sci. 2019, 36, 15–28. [Google Scholar] [CrossRef]
  30. Hua, S.; Xu, X.; Chen, B. Influence of Multiscale Orography on the Initiation and Maintenance of a Precipitating Convective System in North China: A Case Study. J. Geophys. Res. Atmos. 2020, 125, e2019JD031731. [Google Scholar] [CrossRef]
  31. Abulikemu, A.; Wang, Y.; Gao, R.; Wang, Y.; Xu, X. A Numerical Study of Convection Initiation Associated With a Gust Front in Bohai Bay Region, North China. J. Geophys. Res. Atmos. 2019, 124, 13843–13860. [Google Scholar] [CrossRef]
  32. Zheng, J.; Abulikemu, A.; Wang, Y.; Kong, M.; Liu, Y. Convection Initiation Associated with the Merger of an Immature Sea-Breeze Front and a Gust Front in Bohai Bay Region, North China: A Case Study. Atmosphere 2022, 13, 750. [Google Scholar] [CrossRef]
  33. Li, N.; Jiao, B.; Ran, L.; Gao, Z.; Gao, S. Influence of the Upstream Terrain on the Formation of a Cold Frontal Snowband in Northeast China. Asia Pac. J. Atmos. Sci. 2022, 58, 243–264. [Google Scholar] [CrossRef]
  34. Li, R.; Wang, X.; Yang, X.; Zhou, J. Study on Formation Mechanism of a Summer Cold Sector Torrential Rainfall. Chin. J. Meteorol. Mon. 2019, 45, 50–60. [Google Scholar]
  35. Cui, X.; Chen, M.; Qin, R.; Han, L. Research Advances in the Convective Initiation Mechanisms. Chin. J. Meteorol. Mon. 2021, 47, 1297–1318. [Google Scholar]
  36. Liu, L.; Ran, L.; Gao, S. Evolution of Instability before and during a Torrential Rainstorm in North China. Adv. Atmos. Sci. 2016, 33, 110–120. [Google Scholar] [CrossRef]
  37. Shou, S. Mesoscale Atmospheric Dynamics; Higher Education Press: Beijing, China, 2009. [Google Scholar]
  38. Huang, X.; Zhou, Y.; Ran, L.; Kalim, U.; Zeng, Y. Analysis of the Environmental Field and Unstable Conditions on A Rainstorm Event in the Ili Valley of Xinjiang. Chin. J. Atmos. Sci. 2021, 45, 148–164. [Google Scholar] [CrossRef]
  39. Kong, M.; Abulikemu, A.; Zheng, J.; Aireti, M.; An, D. A Case Study on Convection Initiation Associated with Horizontal Convective Rolls over Ili River Valley in Xinjiang, Northwest China. Water 2022, 14, 1017. [Google Scholar] [CrossRef]
  40. Hu, S.; Xerinay, T.; Li, N.; Ran, L.; Chang, Y. Comparative Analysis of Two Extreme Rainstorms in the Arid Area of Western South Xinjiang. Chin. J. Atmos. Sci. 2022, 46, 1177–1197. [Google Scholar] [CrossRef]
  41. Zeng, Y.; Zhou, Y.; Yang, L. A Preliminary Analysis of the Formation Mechanism for a Heavy Rainstorm in Western Xinjiang by Numerical Simulation. Chin. J. Atmos. Sci. 2019, 43, 372–388. [Google Scholar] [CrossRef]
  42. Zhuang, X.; Zhao, J.; Li, B.; Zhang, Y. Characteristics of Water Vapor Source and Transport during Rainstorm in Western Southern Xinjiang. Chin. J. Torrential Rain Disasters 2021, 41, 544–555. [Google Scholar]
  43. Xie, Z.; Zhou, Y.; Yang, L. Review of Study on Precipitation in Xinjiang. Chin. J. Torrential Rain Disasters 2018, 37, 204–212. [Google Scholar] [CrossRef]
  44. Skamarock, W.C.; Klemp, J.B.; Dudhia, J.; Gill, D.O.; Liu, Z.; Berner, J.; Wang, W.; Powers, J.G.; Duda, M.G.; Barker, D.M. A Description of the Advanced Research WRF Version 4; NCAR: Boulder, CO, USA, 2019; Volume 145. [Google Scholar]
  45. Hong, S.-Y.; Noh, Y.; Dudhia, J. A New Vertical Diffusion Package with an Explicit Treatment of Entrainment Processes. Mon. Weather Rev. 2006, 134, 2318–2341. [Google Scholar] [CrossRef]
  46. Jiménez, P.A.; Dudhia, J.; González-Rouco, J.F.; Navarro, J.; Montávez, J.P.; García-Bustamante, E. A Revised Scheme for the WRF Surface Layer Formulation. Mon. Weather Rev. 2012, 140, 898–918. [Google Scholar] [CrossRef]
  47. Chen, F.; Dudhia, J. Coupling an Advanced Land Surface–Hydrology Model with the Penn State–NCAR MM5 Modeling System. Part I: Model Implementation and Sensitivity. Mon. Weather Rev. 2001, 129, 569–585. [Google Scholar] [CrossRef]
  48. Iacono, M.J.; Delamere, J.S.; Mlawer, E.J.; Shephard, M.W.; Clough, S.A.; Collins, W.D. Radiative Forcing by Long-lived Greenhouse Gases: Calculations with the AER Radiative Transfer Models. J. Geophys. Res. Atmos. 2008, 113, D13103. [Google Scholar] [CrossRef]
  49. Ran, L.; Li, N.; Gao, S. Diagnostic Analysis of Precipitating Convective Process in East China with Moist Baroclinic Vorticity Parameters. Chin. J. Atmos. Sci. 2013, 37, 1261–1273. [Google Scholar]
  50. Liu, L.; Ran, L.; Zhou, Y.; Gao, S. Analysis on the Instability and Trigger Mechanism of Torrential Rainfall Event in Beijing on 21. Chin. J. Atmos. Sci. 2015, 39, 583–595. [Google Scholar]
  51. Liu, J.; Zhou, Y.; Yang, L.; Zeng, Y.; Liu, W. The Instability and Its Trigger Mechanism of Extreme Precipitation Event in the Yili River Valley on 31 July 2016. Chin. J. Atmos. Sci. 2019, 43, 1204–1218. [Google Scholar] [CrossRef]
  52. Liu, J.; Liu, Z.; Zhang, J.; Liu, F.; Li, J.; Zeng, Y.; Tong, Z.; Jiang, Y.; Yang, L.; Zhou, Y. Comparison of Convective Triggering Mechanisms of Typical Rainstorm Events in the Hami Area of East Tianshan Mountains. Chin. J. Atmos. Sci. 2022, 46, 965–988. [Google Scholar] [CrossRef]
  53. Xu, Y.; Wu, S.; Yang, W.; Liu, X.; Huang, Y. Analysis of Frontogenesis and Circulation Characteristics of the Meiyu Front with Heavy Precipitation in Zhejiang Province. Chin. J. Atmos. Sci. 2019, 43, 1219–1232. [Google Scholar] [CrossRef]
  54. Ninomiya, K. Large-and Meso-u-Scale Characteristics of Meiyu/Baiu Front. J. Meteorol. Soc. Jpn. 2000, 78, 141–157. [Google Scholar] [CrossRef]
  55. Yang, S.; Gao, S.; Lu, C. Investigation of the Mei-Yu Front Using a New Deformation Frontogenesis Function. Adv. Atmos. Sci. 2015, 32, 635–647. [Google Scholar] [CrossRef]
  56. Wang, Z.; Ding, Y.; Zhang, Y.; Tian, L.; Li, J. Analysis of Convective-Symmetric Instabilities and Frontogenesis in a convective Rain Band on the Northwest Edge of WPSH. Chin. J. Atmos. Sci. 2014, 38, 133–145. [Google Scholar]
  57. Duolaiti, X. Formulation of Precipitation Intensity Standard of Xinjiang. Chin. J. Desert Oasis Meteorol. 2005, 28, 7–8. [Google Scholar]
  58. Tang, P.; Huang, Y.; Zhang, L.; Chen, T.; Yang, X. Causation Analysis of An Extreme Torrentaial Rain Onthe Slope of Middle Kunlun Mountains. Chin. J. Desert Oasis Meteorol. 2022, 16, 34–41. [Google Scholar]
  59. Sun, Y.; Zhou, Y.; Wang, Y. Analysis of Dynamic Process and Moisture Source on a Heavy Precipitation Event in Southern Xinjiang Associated with the Double Upper-Level Jet. Chin. J. Atmos. Sci. 2019, 43, 1041–1054. [Google Scholar] [CrossRef]
  60. Jiao, B.; Ran, L.; Li, S.; Zhou, K. Diagnosis of the Mesoscale Vortex Development Mechanism in a Heavy Rain Event. Chin. J. Atmos. Sci. 2022, 46, 762–774. [Google Scholar] [CrossRef]
  61. Zhou, K.; Ran, L.; Cai, R.; Qu, T.; Chen, L. Diagnostic Analysis of Terrain Following Vertical Motion Equation in Southern Xinjiang Extreme Rainstorms. Chin. J. Atmos. Sci. 2022, 46, 745–761. [Google Scholar] [CrossRef]
  62. Li, R.; Li, J.; Wang, J.; Sun, M.; Zhao, K. Dynamic and Thermal Structure Characteristics of the rainstorms in the West of South Xinjiang. Chin. J. Arid. Land Geogr. 2018, 41, 9–16. [Google Scholar]
  63. Zhang, Y.; Li, H.; Lin, X.; Abulimiti; Yu, B. Analysis of Continuous Rainstorm Circulation Background Anthe Dynamic Process of Synoptic Scale in West of Southern Xinjian. Chin. J. Meteorol. Mon. 2015, 41, 816–824. [Google Scholar]
  64. Yin, G.; Zhang, Z.; Zhu, B.; Li, Q.; Mao, M.; Xing, W.; Hu, Z.; Chen, X. Characteristics and Physical Mechanisms of a Rainstorm in Hotan, Xinjiang, China. Front. Environ. Sci. 2022, 10, 46882. [Google Scholar] [CrossRef]
  65. Zhang, D.L.; Cho, H.R. The development of negative moist potential vorticity in the stratiform region of a simulated squall line. Mon. Weather Rev. 1992, 120, 1322–1341. [Google Scholar] [CrossRef]
  66. Wu, G.; Cai, Y.; Tang, X. Moist potential vorticity and slantwise vorticity development. Acta Meteorol. Sin. 1995, 53, 387–405. (In Chinese) [Google Scholar]
  67. Yao, X.; Gao, Y.; Ma, J. MPV-Q⁎ view of vorticity development in a saturated atmosphere. Atmos. Res. 2020, 244, 105058. [Google Scholar] [CrossRef]
  68. Gao, S.T.; Lei, T.; Zhou, Y. Moist potential vorticity anomaly with heat and mass forcings in torrential rain systems. Chin. Phys. Lett. 2002, 19, 878–880. [Google Scholar] [CrossRef]
  69. Schultz, D.M.; Schumacher, P.N. The use and misuse of conditional symmetric instability. Mon. Weather Rev. 1999, 127, 2709–2732. [Google Scholar] [CrossRef]
  70. Ullah, K.; Gao, S. A diagnostic study of convective environment leading to heavy rainfall during the summer monsoon 2010 over Pakistan. Atmos. Res. 2013, 120, 226–239. [Google Scholar] [CrossRef]
  71. Du, Y.; Zhang, Q.; Chen, Y.; Zhao, Y.; Wang, X. Numerical simulations of spatial distributions and diurnal variations of low-level jets in China during early summer. J. Clim. 2014, 27, 5747–5767. [Google Scholar] [CrossRef]
Figure 1. (a) Geographical position and surface altitude (shading, units: m) of the study area where the rainstorm took place. The blue five-pointed star (☆) represent the position of the NCEP·FNL sounding grid point, and the black and red dots indicate the positions of the ground-based automatic weather stations (AWSs) (i.e., S1, S2, and S3). The black rectangular box represents the primary study area. The national boundaries are depicted by solid black lines, while the district boundaries are illustrated using thin gray lines. (b) Geographical positions and surface altitude (shading, units: m) of the WRF model domains.
Remotesensing 15 04505 g001
Figure 2. (a) The spatial distribution of 4-day accumulated precipitation (units: mm) over the northern slope of Kunlun Mountains from 14 to 17 June 2021. (b) The 4-day accumulated precipitation intensity (orange bars) at 9 stations and the over 50 years (1966–2018) of climatologically averaged accumulated precipitation (green bars) in June from 1990 to 2020. (c) Hourly variations of precipitation at the 9 stations from 0000 UTC on 15 June to 2300 UTC on 16 June. The red arrows point to the Pishan Station and the precipitation observed at the Pishan Station which is located in the major focused area of this study.
Remotesensing 15 04505 g002
Figure 3. (ad) Geopotential height (indicated by blue solid lines, units: gpm), temperature (depicted with red dashed lines, units: °C), and wind field (half barbs, full barbs, and flags represent 2, 4, and 20 m s−1, respectively) for both 14 and 15 June 2021, obtained from ERA5 data. The regions shaded in color in (a,b) indicate that the upper-level jet (units: m s−1) exceeded 30 m s−1. The thick brown dashed lines in (c,d) indicate the trough, and the letters “H” and “L” indicate the high- and low-pressure centers, respectively. The particular time and altitude level corresponding to each of the panels are denoted in their lower right corner. The black box represents the innermost layer of the model simulation.
Remotesensing 15 04505 g003
Figure 4. (ac) Skew T-logP diagrams derived from the NCEP·FNL reanalysis data at the location (38°N, 78°E) near Pishan on 15 June 2021 (indicated by the “☆” symbol in Figure 1a). The particular time and altitude level corresponding to each of the panels are denoted in their upper right corner.
Remotesensing 15 04505 g004
Figure 5. Time variations in precipitation (depicted by blue bars, units: mm), temperature (represented by black lines, units: °C), relative humidity (indicated by green lines, units: %), pressure (indicated by pale brown lines, units: hPa), and wind information (depicted by wind barbs, half barbs, full barbs, and flags represent 2, 4, and 20 m s−1, respectively; red lines denote wind speed, units: m/s) observed by AWSs at locations (a) S1, (b) S2, and (c) S3 (the locations of the S1, S2, and S3 are shown in Figure 1a) from 0000 UTC to 2300 UTC on 15 June 2021.
Remotesensing 15 04505 g005
Figure 6. (a) Observed 3 h accumulated precipitation (color-coded dots, units: mm) observed by AWSs between 0500 UTC and 0800 UTC on 15 June 2021. (b) Simulated 3 h accumulated precipitation (shading, units: mm) during the same time period as (a).
Remotesensing 15 04505 g006
Figure 7. (ac) The temperature of the black body (TBB, shading, units: °C) over the top of the rainfall clouds observed by the FY-4A meteorological satellite on 15 June 2021. (df) Simulated composite radar reflectivity (shading, units: dBZ), the height of topography (black solid contours, units: m), and wind field (half barbs, full barbs, and flags represent 2, 4, and 20 m s−1, respectively) at 2500 m ASL on 15 June 2021. (gi) Simulated composite radar reflectivity (colorful shading, units: dBZ) terrain height (gray shading, units: m) at the same time as (df). The red line segment AB shows the position of the verticalcross section which will be shown Figures 9–12 in following section. The red solid arrow points to the cloud cluster which represent the major convection initiation (CI) over the Pishan area. The specific time and height level corresponding to the each of the panels are shown in their lower left corner.
Remotesensing 15 04505 g007
Figure 8. (a,b) Potential temperature (shading, units: K) at the WRF model layer η = 0.9970323 and the horizontal wind field (black vector arrows) on 15 June 2021. (c,d) Horizontal wind speed (shading, units: m s−1) and the horizontal wind field (black vector arrows) at 2500 m ASL at the same times as (a,b). The gray shaded area indicates altitudes higher than 2500 m ASL. The black rectangular box represents the area which will be shown in Figure 7g–i. The red line segment AB is the same one shown in Figure 7h, indicating the locations of the vertical cross-sections in Figure 9, Figure 10, Figure 11 and Figure 12 in following section. The specific time and height level corresponding to each of the panels are shown in their lower left corner.
Remotesensing 15 04505 g008
Figure 9. (ac) Vertical cross section of the potential temperature (θ, shading, units: K), along the line AB (shown in Figure 8) at 0330, 0400, and 0430 UTC on 15 June 2021, composite reflectivity (black contour lines, units: dBZ), and horizontal wind speed (black vector arrows). Images (df) are the same as (ac), but represent horizontal wind speed (shading, units: m s−1) and composite reflectivity (black contour lines, units: dBZ). Images (gi) are the same as (ac), but represent divergence (shading, units: 10−3 s−1), vertical velocity (purple contour lines, units: m s−1), composite reflectivity (black contour lines, units: dBZ), and horizontal wind speed (black vector arrows). The red solid lines (304 K and 305 K isotherms) represent the thermal boundary of the CP, the red solid arrows indicate the region affected by BLJ, and the red hollow arrows indicate the position of the leading edge of the CP. The gray shading represents the terrain, and the specific time is displayed in the lower left corner of each panel.
Remotesensing 15 04505 g009
Figure 10. (ac) Vertical cross section of the moist potential vorticity (MPV, shading, units: PVU, where 1 PVU = 10−6 m2 K s−1 kg−1) and composite reflectivity (solid black contours, units: dBZ) along the line AB at 0330, 0400, and 0430 UTC on 15 June 2021, respectively. Images (df) are the same as (ac), except for the MPV1 (shading, units: PVU, where 1 PVU = 10−6 m2 K s−1 kg−1), and (gi) are the same as (ac), except for the MPV2 (shading, units: PVU, where 1 PVU = 10−6 m2 K s−1 kg−1). The red solid lines (304 K and 305 K isotherms) indicate the thermal boundary of the leading edge of the CP, and the gray shading represents the terrain, and the specific time is shown in the lower left corner of each panel.
Remotesensing 15 04505 g010
Figure 11. (a) Vertical cross section of the total frontogenesis (Ft) (shading, units: 10−8 K m−1 s−1) and composite reflectivity (solid black contours, units: dBZ) along the line AB at 0330 UTC on 15 June 2021. Images (be) are the same as (a) but for the four components of the Ft (F1, F2, F3, and F4, respectively). Images (fj) are the same as (ae) but for the time at 0430 UTC. The red solid lines (304 K and 305 K isotherms) indicate the thermal boundary of the leading edge of the CP, and the red hollow arrow indicates the location of the leading edge of the CP. The gray shading represents the terrain, and the specific time is displayed in the lower left corner of each panel.
Remotesensing 15 04505 g011
Figure 12. (a,b) Vertical profile of the vertical velocity’s horizontal gradient (i.e., HGω shading, units: 10−3 Pa s−1 m−1) and composite reflectivity (black contours, units: dBZ). Images (c,d) replicate the conditions of (a,b), with the exception of the horizontal gradient of equivalent potential temperature. (i.e., HGθe, shading, units: K km−1). The red solid lines (304 K and 305 K isotherms) indicate the thermal boundary of the CP, the gray shading represents the terrain, and the precise time is displayed in the lower right corner of each section.
Remotesensing 15 04505 g012
Figure 13. Schematic diagram outlining the convective initiation mechanism of the rainstorm event examined in this study. (a) Early Stage; (b) CI Stage.
Remotesensing 15 04505 g013
Disclaimer/Publisher’s Note: The statements, opinions and data contained in all publications are solely those of the individual author(s) and contributor(s) and not of MDPI and/or the editor(s). MDPI and/or the editor(s) disclaim responsibility for any injury to people or property resulting from any ideas, methods, instructions or products referred to in the content.

