Article

Wheat Yield Estimation at High Spatial Resolution through the Assimilation of Sentinel-2 Data into a Crop Growth Model

by
El houssaine Bouras
1,*,
Per-Ola Olsson
1,
Shangharsha Thapa
1,
Jesús Mallol Díaz
1,
Johannes Albertsson
2 and
Lars Eklundh
1
1
Department of Physical Geography and Ecosystem Science, Lund University, 223 62 Lund, Sweden
2
Department of Biosystems and Technology, University of Agricultural Sciences (SLU), 234 22 Lomma, Sweden
*
Author to whom correspondence should be addressed.
Remote Sens. 2023, 15(18), 4425; https://doi.org/10.3390/rs15184425
Submission received: 10 July 2023 / Revised: 25 August 2023 / Accepted: 4 September 2023 / Published: 8 September 2023

Abstract

:
Monitoring crop growth and estimating crop yield are essential for managing agricultural production, ensuring food security, and maintaining sustainable agricultural development. Combining the mechanistic framework of a crop growth model with remote sensing observations can provide a means of generating realistic and spatially detailed crop growth information that can facilitate accurate crop yield estimates at different scales. The main objective of this study was to develop a robust estimation methodology of within-field winter wheat yield at a high spatial resolution (20 m × 20 m) by combining a light use efficiency-based model and Sentinel-2 data. For this purpose, Sentinel-2 derived leaf area index (LAI) time series were assimilated into the Simple Algorithm for Yield Estimation (SAFY) model using an ensemble Kalman filter (EnKF). The study was conducted on rainfed winter wheat fields in southern Sweden. LAI was estimated using vegetation indices (VIs) derived from Sentinel-2 data with semi-empirical models. The enhanced two-band vegetation index (EVI2) was found to be a useful VI for LAI estimation, with a coefficient of determination (R2) and a root mean square error (RMSE) of 0.80 and 0.65 m2/m2, respectively. Our findings demonstrate that the assimilation of LAI derived from Sentinel-2 into the SAFY model using EnKF enhances the estimation of within-field spatial variability of winter wheat yield by 70% compared to the baseline simulation without the assimilation of remotely sensed data. Additionally, the assimilation of LAI improves the accuracy of winter wheat yield estimation by decreasing the RMSE by 53%. This study demonstrates an approach towards practical applications of freely accessible Sentinel-2 data and a crop growth model through data assimilation for fine-scale mapping of crop yield. Such information is critical for quantifying the yield gap at the field scale, and to aid the optimization of management practices to increase crop production.

Graphical Abstract

1. Introduction

The expected increase in the frequency and intensity of extreme weather events due to climate change will negatively impact global crop production, and create added uncertainty for the farming economy [1,2,3]. In addition, a growing global population further increases the need for higher food production. A reliable system for monitoring agricultural production is therefore needed to ensure food security [4]. This includes accurate and spatially detailed information on crop growth and yield, which helps stakeholders such as farmers, agricultural agencies, and planners to improve management practices and strategic decision making [5].
Crop growth models permit the simulation of crop growth dynamics and crop yield at the field scale, but require detailed input data on weather, soil, crop varieties, and management practices [6]. Therefore, when using a crop growth model to estimate crop growth and production at high spatial resolution, due to the spatial heterogeneity, the accuracy of the model is often restricted by the quantity and the quality of the input data [7]. Furthermore, crop growth models require high spatial resolution of inputs to estimate the spatial variability of within-field crop growth and yield. However, uncertainties in the spatial variability of canopy state variables, soil properties, and meteorological conditions make spatial crop yield estimation challenging [8]. These uncertainties may have a significant impact on the simulation of crop growth, often leading to large errors in crop yield estimation.
The paucity of spatial field observations within the field, or at a regional scale, can be partly overcome by remotely sensed observations [9]. The accuracy of crop yield estimation has improved thanks to the assimilation of remote sensing observation into crop growth models at field [10,11] and regional scales [8,12,13,14]. Data assimilation exploits the advantages of process-based crop growth models in physiological simulations of crop growth and development in combination with remote sensing data that provide near-continuous estimation of land surface variables during the entire growing season at different spatial and temporal scales [13,15,16,17]. Several review papers have described three main methods to integrate remotely sensed observations into crop growth models [16,18,19]: (1) replacing the state variables in the crop growth model (e.g., LAI, biomass) using remotely sensed observations [15]; (2) re-calibrating and adjusting the model parameters (e.g., canopy and growth parameters) or initial inputs (e.g., sowing date and density) to obtain an optimal agreement between the estimated state variables from the model and the remotely sensed variables [15]; and (3) updating the crop growth model state variables when an observation from a remote sensing instrument is available. The last method is called sequential data assimilation [18]. In method 1, the model ignores its own information and adopts the observed state variable when remote sensing observations are used to replace the simulated state variable. This can potentially propagate errors from remotely sensed observations to the model [15,18]. Re-calibration (method 2) can be applied if there is a sufficient number of observations; however, the major drawback of this method is the large computational cost because of the optimization procedure [8,15,18]. Compared with the calibration method, the update method (method 3) significantly reduces the computational time and it assumes that an improved estimation of the state variable on a particular date will also improve the accuracy of the simulated state variable on succeeding days.
One widely used method to perform data assimilation to sequentially update a model’s state variable when an observation is available is Monte Carlo-based Ensemble Kalman Filtering (EnKF) [20]. Several studies have implemented EnKF for crop yield estimation at different scales by assimilating remotely sensed observations into crop growth models [8,12,13,17,21,22,23,24]. However, to the best of our knowledge, this approach has not yet been evaluated for estimating within-field winter wheat yield at high resolution in Northern Europe.
Leaf area index (LAI) is a key parameter for monitoring crop growth and assessing the final crop yield. In addition, LAI is well simulated by most crop models, such as WOFOST [25], EPIC [26], and SAFY [27]. Therefore, several studies have assimilated LAI from remotely sensed data into crop models for crop yield estimation for different crops such as winter wheat [12,14,17,22,28,29], maize [8,13,14,21,30], sugarcane [31], and soybean [14,32,33,34,35]. The Copernicus Sentinel-2 missions provide freely available data that can be used to estimate crop biophysical variables such as LAI at high spatial and temporal resolution [36,37,38]. The 2-to-3-day revisit time of Sentinel-2 in northern Europe enhances the possibility of obtaining cloud-free observations at key phenological growth stages during the crop growing season, although several data sources (drones, radar satellites, etc.) may provide input for LAI estimation beyond freely available data at suitable spatial and temporal resolutions. The large range of spectral indices that can be formed from Sentinel-2 data directly relates to the seasonal development of plant canopies through photosynthesis. In addition, the global coverage of Sentinel-2 data enables use at local (field) scale as well as across larger regions [36,37,38,39]. LAI estimation methods based on optical remote sensing include (i) empirical and semi-empirical models, (ii) biophysical models, and (iii) hybrid inversion methods [40,41]. Empirical and semi-empirical approaches are based on the development of statistical models based on vegetation indices (VIs) and LAI ground measurements. Several VIs indices have been used for LAI estimation, such as the normalized difference vegetation index (NDVI) [42], the optimized soil-adjusted vegetation index (OSAVI) [43], and the two-band version of the enhanced vegetation index (EVI2) [44]. The second approach is based on the inversion of radiative transfer models (e.g., PROSAIL), which simulates canopy reflectance. The third approach combines statistical and physical models for LAI estimation. Compared to the first approach, the last two approaches are considered to be more accurate in estimating LAI; however, they are considerably more time- and data-consuming [41]. Hence, for practical reasons, the approach based on empirical models between VIs and LAI is widely used for LAI estimation [36,41,45].
The main objective of this study is to develop a robust methodology for within-field winter wheat yield estimation in South Sweden, which is an important region in Swedish agricultural production. Winter wheat is an important crop globally, and the main crop in Northern Europe [46]. In Sweden, winter wheat accounts for 48% of the total grain production, and 19% of the total crop area (Swedish Board of Agriculture, 2019 [47]). More than 90% of the cultivated land is rainfed, which makes cereal production vulnerable to climatic conditions [48,49]. To accomplish the study objective, Sentinel-2 data were assimilated into a crop growth model. To limit model complexity, we have chosen a semi-empirical approach that can be applied at a larger regional scale and therefore has the potential to provide a methodology applicable over agricultural lands across South Sweden. Specifically, our study aims to answer the following questions: (a) Which is the best vegetation index for estimating LAI from Sentinel-2 data over rainfed winter wheat? (b) How much is the estimation of within-field crop yield variability improved by assimilation of remote sensing-derived LAI into a simple crop growth model?

2. Materials and Methods
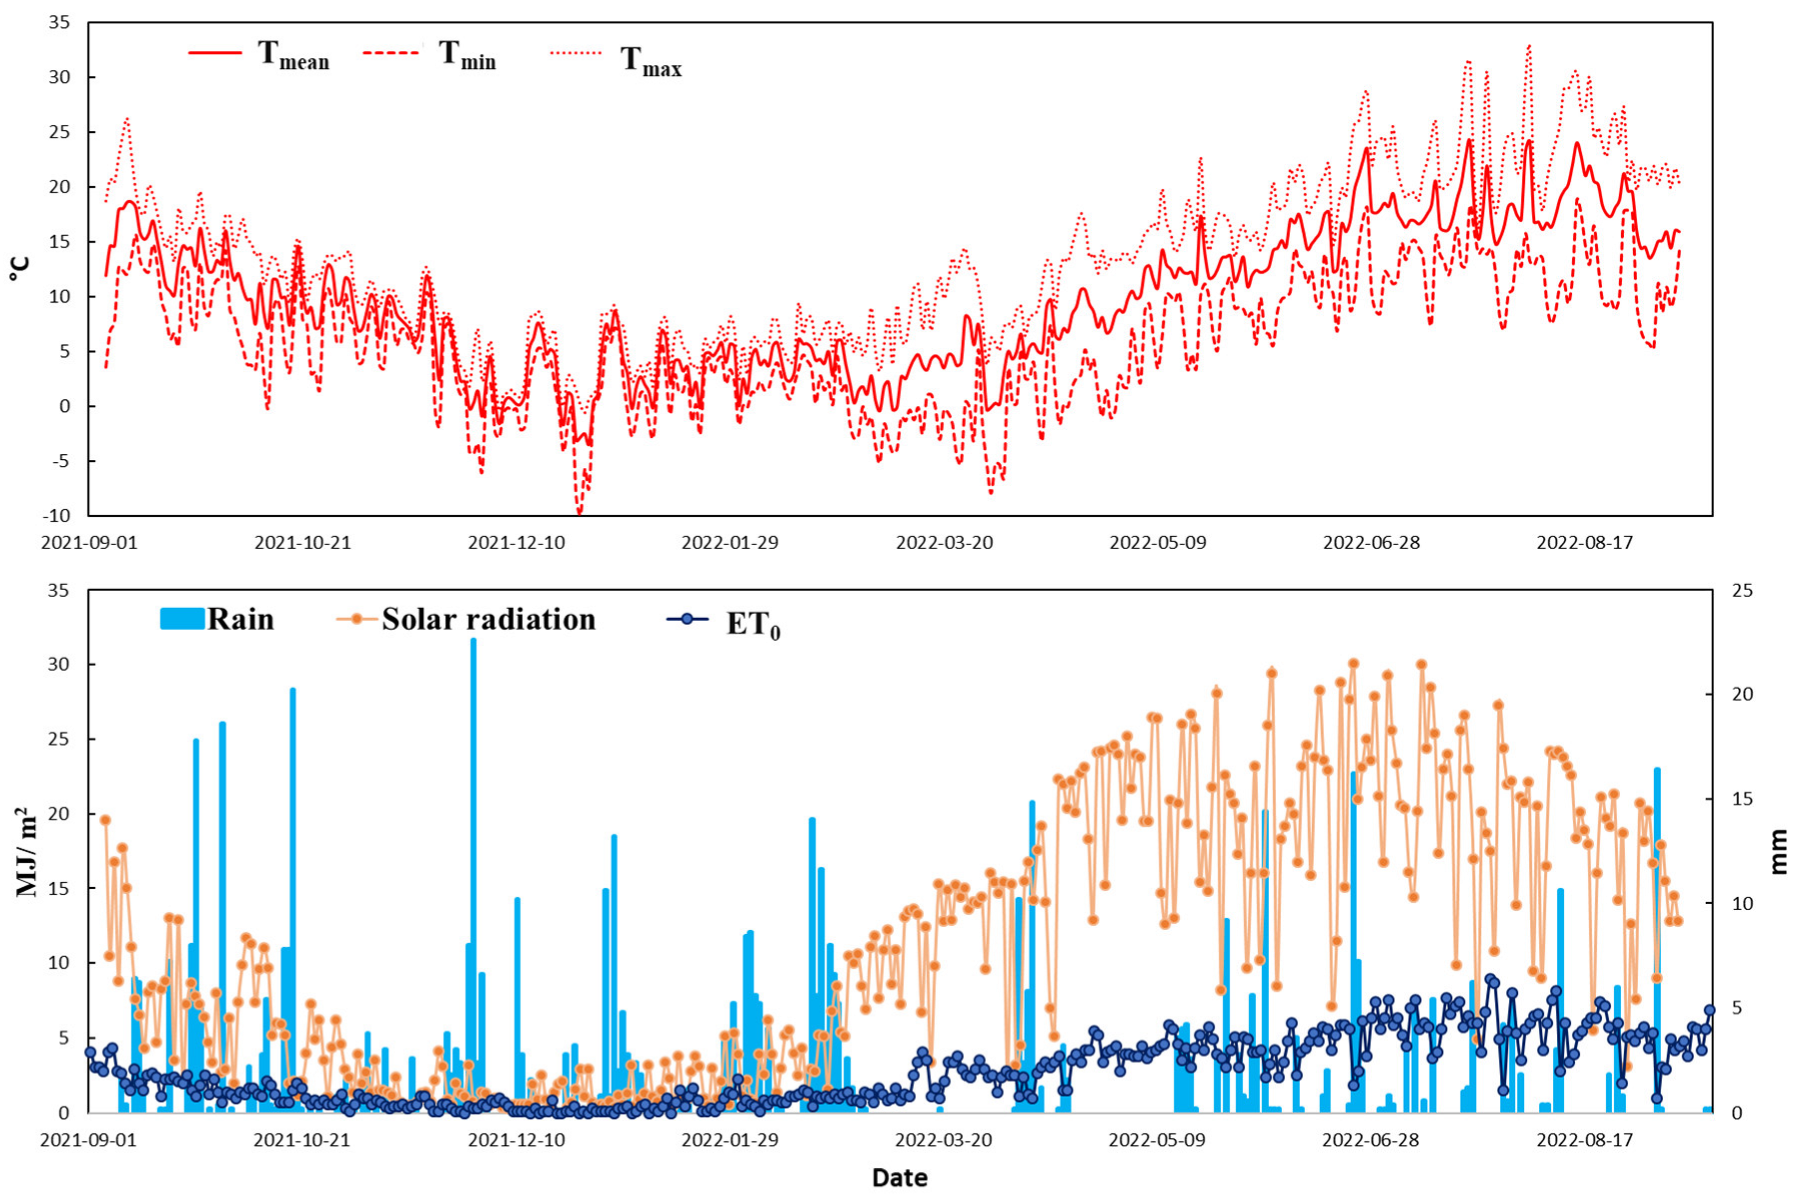
2.1. Study Area

The study was conducted at Alnarp egendom, near SITES Lönnstorp research station (Swedish University of Agricultural Sciences) in South Sweden (Figure 1). Two rainfed winter wheat fields were monitored during the 2021–2022 growing season: Field 1 with an area of 27 ha, and Field 2 with an area of 19 ha. The sowing date was around the end of September 2021, and the harvest took place on August 2022. Weather data were obtained from a weather station located 2.5 km from the study area (Figure 2). During the winter wheat growing season (September to August), the average cumulated rainfall in the study area from 2007 to 2022 was approximately 650 mm, and the average daily temperatures ranged from 1.5 °C (December) to 18.9 °C (July).

2.2. Ground Measurements and Data Collections

Ground data measurements included LAI (m2/m2), aboveground biomass, and grain yield (t/ha). These data were collected every two weeks during the winter wheat growing season. In each field, two 60 m × 60 m plots were marked with flags (4 plots for both fields). Within each plot, 5 points were randomly selected each time to ensure that the average was representative of the plot for LAI measurements using digital oblique photos [50]. A tripod held vertically with a spirit level carried a platform tilted at a 57.5° zenith angle on which the camera was mounted, looking down. The camera was set at approximately 1.8 m above the ground. The images were processed using the CAN-EYE software to estimate LAI (https://www6.paca.inra.fr/can-eye, accessed on 21 August 2023). The total biomass (root, stem, leaves, and grain) of 30 winter wheat shoots was collected at each plot. In addition, a 0.25 m2 quadrat was used to count the density of shoots per square meter at each plot. After the field measurements, the winter wheat samples were processed in the laboratory. They were first weighed to estimate fresh weight, then placed in paper bags and oven-dried at 75 °C. Once the weight of the sample had become constant (around 48 h), they were weighed again to measure the dry mass. Biomass per unit area was then estimated from the measured dry weight of the sample and shoot density. Grain yield was harvested and measured two weeks before the harvest date. A 0.25 m2 quadrat was used to sample wheat ears.

2.3. Spatial Crop Yield Data

The spatial information on the observed winter wheat yield was mapped using a yield monitoring system mounted on the harvesting machine (CLAAS telematics https://www.claas.co.uk/, accessed on 21 August 2023). The yield monitor collected information from various systems, including RTK-GPS, yield, and moisture sensors, for mapping crop yield by measuring the amount of grain, the distance traveled, and the specified working width. The raw crop yield data were cleaned to remove erroneous measurements following previous studies [51,52,53]. First, points with identical coordinates and points where the yield monitor was turned off were removed, and a buffer of 30 m from the edge was ignored to avoid edge effects. Next, threshold-based cleaning was applied to remove outliers based on their frequency and the minimum and maximum biological crop yield limits. Finally, the yield data points were interpolated using the kriging procedure, and the yield data map obtained was averaged to 20 × 20 m. The crop yield estimated by the harvester was compared with in situ crop yield measurements, and a high correlation was found (R2 0.82 and RMSE 0.35 t/ha).

2.4. Sentinel-2 Data

The Sentinel-2 Multispectral Instrument (MSI) comprises two satellites (2A and 2B) that observe the earth at 10 m, 20 m, and 60 m spatial resolutions with 13 spectral bands that cover a spectrum range from 442 nm to 2100 nm. In this study, we used the bottom-of-atmosphere surface reflectance (Level-2A products), which has been atmospherically calibrated with the Sen2Cor processor [54]. More details about this product can be found in the Copernicus web site (https://sentinels.copernicus.eu/web/sentinel/user-guides/sentinel-2-msi/product-types/level-2a, accessed on 21 August 2023). The images were visually inspected online (https://www.sentinel-hub.com/, accessed on 21 August 2023), and all available cloud-free images from the two Sentinel-2 satellites for the whole winter wheat growing season were downloaded via the Google Earth Engine platform [55]. MATLAB 2022a software was used to process the Sentinel-2 data.

2.5. LAI Estimation

In this study, LAI was estimated from Sentinel-2 data by using six widely used vegetation indices (Table 1). The relationship between these VIs and LAI can be expressed as a semi-empirical model in the form of the modified Beer’s law as follows:
V I = V I + V I V I g e x p K V I L A I
where V I represents the VI value for a very dense canopy, V I g represents bare soil and K V I is equivalent to the extinction coefficient in Beer’s law. For each VI, these parameters were fitted against measured LAI, based on Equation (1) [45,56].

2.6. SAFY Model Description and Calibration

The SAFY model [27] is a semi-empirical crop growth model developed originally for winter wheat, and based on the light-use efficiency theory of Monteith (1977) [60]. The model simulates the daily dynamic changes in LAI, dry aboveground biomass (DAM), and crop yield. In the SAFY model, the DAM production is driven by the absorbed photosynthetically active radiation (APAR) (Equation (2)), the effective light use efficiency (ELUE), and constrained by an air temperature stress function F T ( T a ) (Equation (3)). The final grain yield (GY) (Equation (4)) is estimated by multiplying the maximum dry aboveground biomass (DAMmax) with a harvest index (HI). Two phenological stages, vegetative and productive, identified through the use of a degree–day approach based on the accumulated summary temperature (SMT), control the partitioning of accumulated carbon to leaves and grains. The dynamics of LAI are simulated by estimating the extent of leaf coverage during growth (Equation (5)) (∆LAI+) and the decrease in LAI during senescence (Equation (6)) (∆LAI).
A P A R = ( 1 e K L A I ) ε R g
D A M = E L U E A P A R F T T a
G Y = D A M m a x H I
L A I + = D A M P l S L A
L A I = L A I ( S M T S S T ) / R s
where K is the light interception, ε is the climate efficiency factor, Rg is the daily radiation, Pl is the proportion of biomass allocated to leaf, SLA is the specific leaf area, Rs is the coefficient of leaf senescence, and SST is the senescence temperature threshold.
The SAFY model has a low level of complexity compared to other crop growth models, with only 13 required parameters, in order to simplify the optimization of unknown parameters using few observations [27]. Among those parameters, six are considered free. Two of the six free parameters, the day of emergence (D0) and ELUE, depend on the agro-environmental conditions. The other four free parameters describe the crop phenological stages (PLa, PLb, SenA, and SenB) and are related to the genetic characteristics of a specific crop type. These parameters play a crucial role in describing the growth and development of the crop and can be adjusted to improve the accuracy of the SAFY model predictions. Based on previous studies, other parameters are assumed to be constant [21,27,61,62,63]. To calibrate the SAFY model parameters, ground-based observations were used instead of remotely sensed observations. The parameters were optimized by minimizing the difference between the simulated and observed LAI and DAM. This was achieved by defining an objective function that ran the model 1000 times with a given set of parameters and then calculated the Root Mean Square Error (RMSE) between the simulations and observations. The combination of parameters that resulted in the lowest RMSE was then selected.

2.7. Data Assimilation with Ensemble Kalman Filter

The Ensemble Kalman Filter (EnKF) is a common method for sequential data assimilation [20]. The EnKF is based on the Monte Carlo approach, where an ensemble of the model simulation is used to represent the probability distribution of the true state. This ensemble (the ‘forecast’) is then updated using a Kalman filter, which incorporates observations to produce an optimal estimate (the ‘analysis’) considering both observations and simulation errors [64]. The basic principles of EnKF can be described as follows:
An observation x t is related to the state variable Y t at time t:
Y t = H x t + ε t
where ε t is a Gaussian random white noise, with a mean of zero and observation error covariance R; H is the measurement operator that maps the model variable space to the observation space. At the current time t, an ensemble of N forecasts with mean x t f ¯ and error covariance P t f are generated by the model (Equation (8)):
x t f = x 1 . t f , x 2 , t f , , x N , t f
The forecasted state variable and error covariance are updated when new observations are available as:
x t f = F x t 1 a
x t a = x t f + k ( y t H x t f ¯ )
where F is the function that transfers the state variable from t − 1 to t (the SAFY model in our case), and x t a is the updated ensemble at time t. K t is the Kalman gain, which determines the weight given to the observed and the forecasted state estimate in the updating, calculated as:
K t = P t f H T / ( H T P t f H T + R t )
In our study, the LAI estimated from Sentinel-2 data was assimilated into the SAFY model, and the observation operator H was an identity matrix. Equations (9) and (10) can be then rewritten as:
L A I t f = S A F Y L A I t 1 a
L A I t a = L A I t f + P t f P t f + R t ( L A I t o b s L A I t f ¯ )
To obtain an ensemble forecast, a number of SAFY parameters were selected to be perturbed. These free parameters were selected based on previous studies. Fifty ensemble forecasts of LAI (fLAI1, fLAI2, …, fLAI50) were generated by running the SAFY model with varying combinations of the free parameters. If there was an LAI observation from Sentinel-2 at time t, the observation ensemble OLAI (OLAI1, OLAI2, …, OLAI50) was generated by adding a Gaussian perturbation ensemble. The forecasted and the observed LAI ensembles were then assimilated using EnKF to obtain the optimal estimation of LAI, which was incorporated into the SAFY model to obtain the forecast ensemble at time t + 1. If no LAI observation existed for time t, the forecasted LAI ensemble was directly integrated into the SAFY model.

2.8. Performance Assessment

To evaluate the performance of the proposed methodology, several statistical parameters were used in this study: the mean absolute error (MAE), which indicates the average absolute difference between the simulations and observations, the root mean square error (RMSE), which measures the discrepancy of simulated values around observed ones, and the normalized root mean square error (NRMSE). In addition, to evaluate the added value of assimilating LAI into the SAFY model compared to the SAFY model only (open loop), the assimilation efficiency index (AE) [35] was used, computed from Relative Mean Absolute Error (RMAE) estimated for simulation with assimilation using EnKF (RMAEEnKF) and without assimilation (RMAEi). The AE estimates the average reduction in yield estimation errors. A positive AE value signifies that assimilation leads to better yield estimates, and a negative value indicates that yield estimate errors are higher than those in open-loop simulations.
M A E = 1 n i = 1 n S i O i
R M S E = 1 n i = 1 n ( S i O i ) 2
N R M S E = 1 O ¯ i = 1 n ( S i O i ) 2 n × 100
R M A E = i = 1 n S i O i O i
A E ( i ) = 1 R M A E E n K F ( i ) R M A E O L ( i ) 100
where O i is the observations, S i is the model simulations, and O ¯ is the average of observations.

3. Results

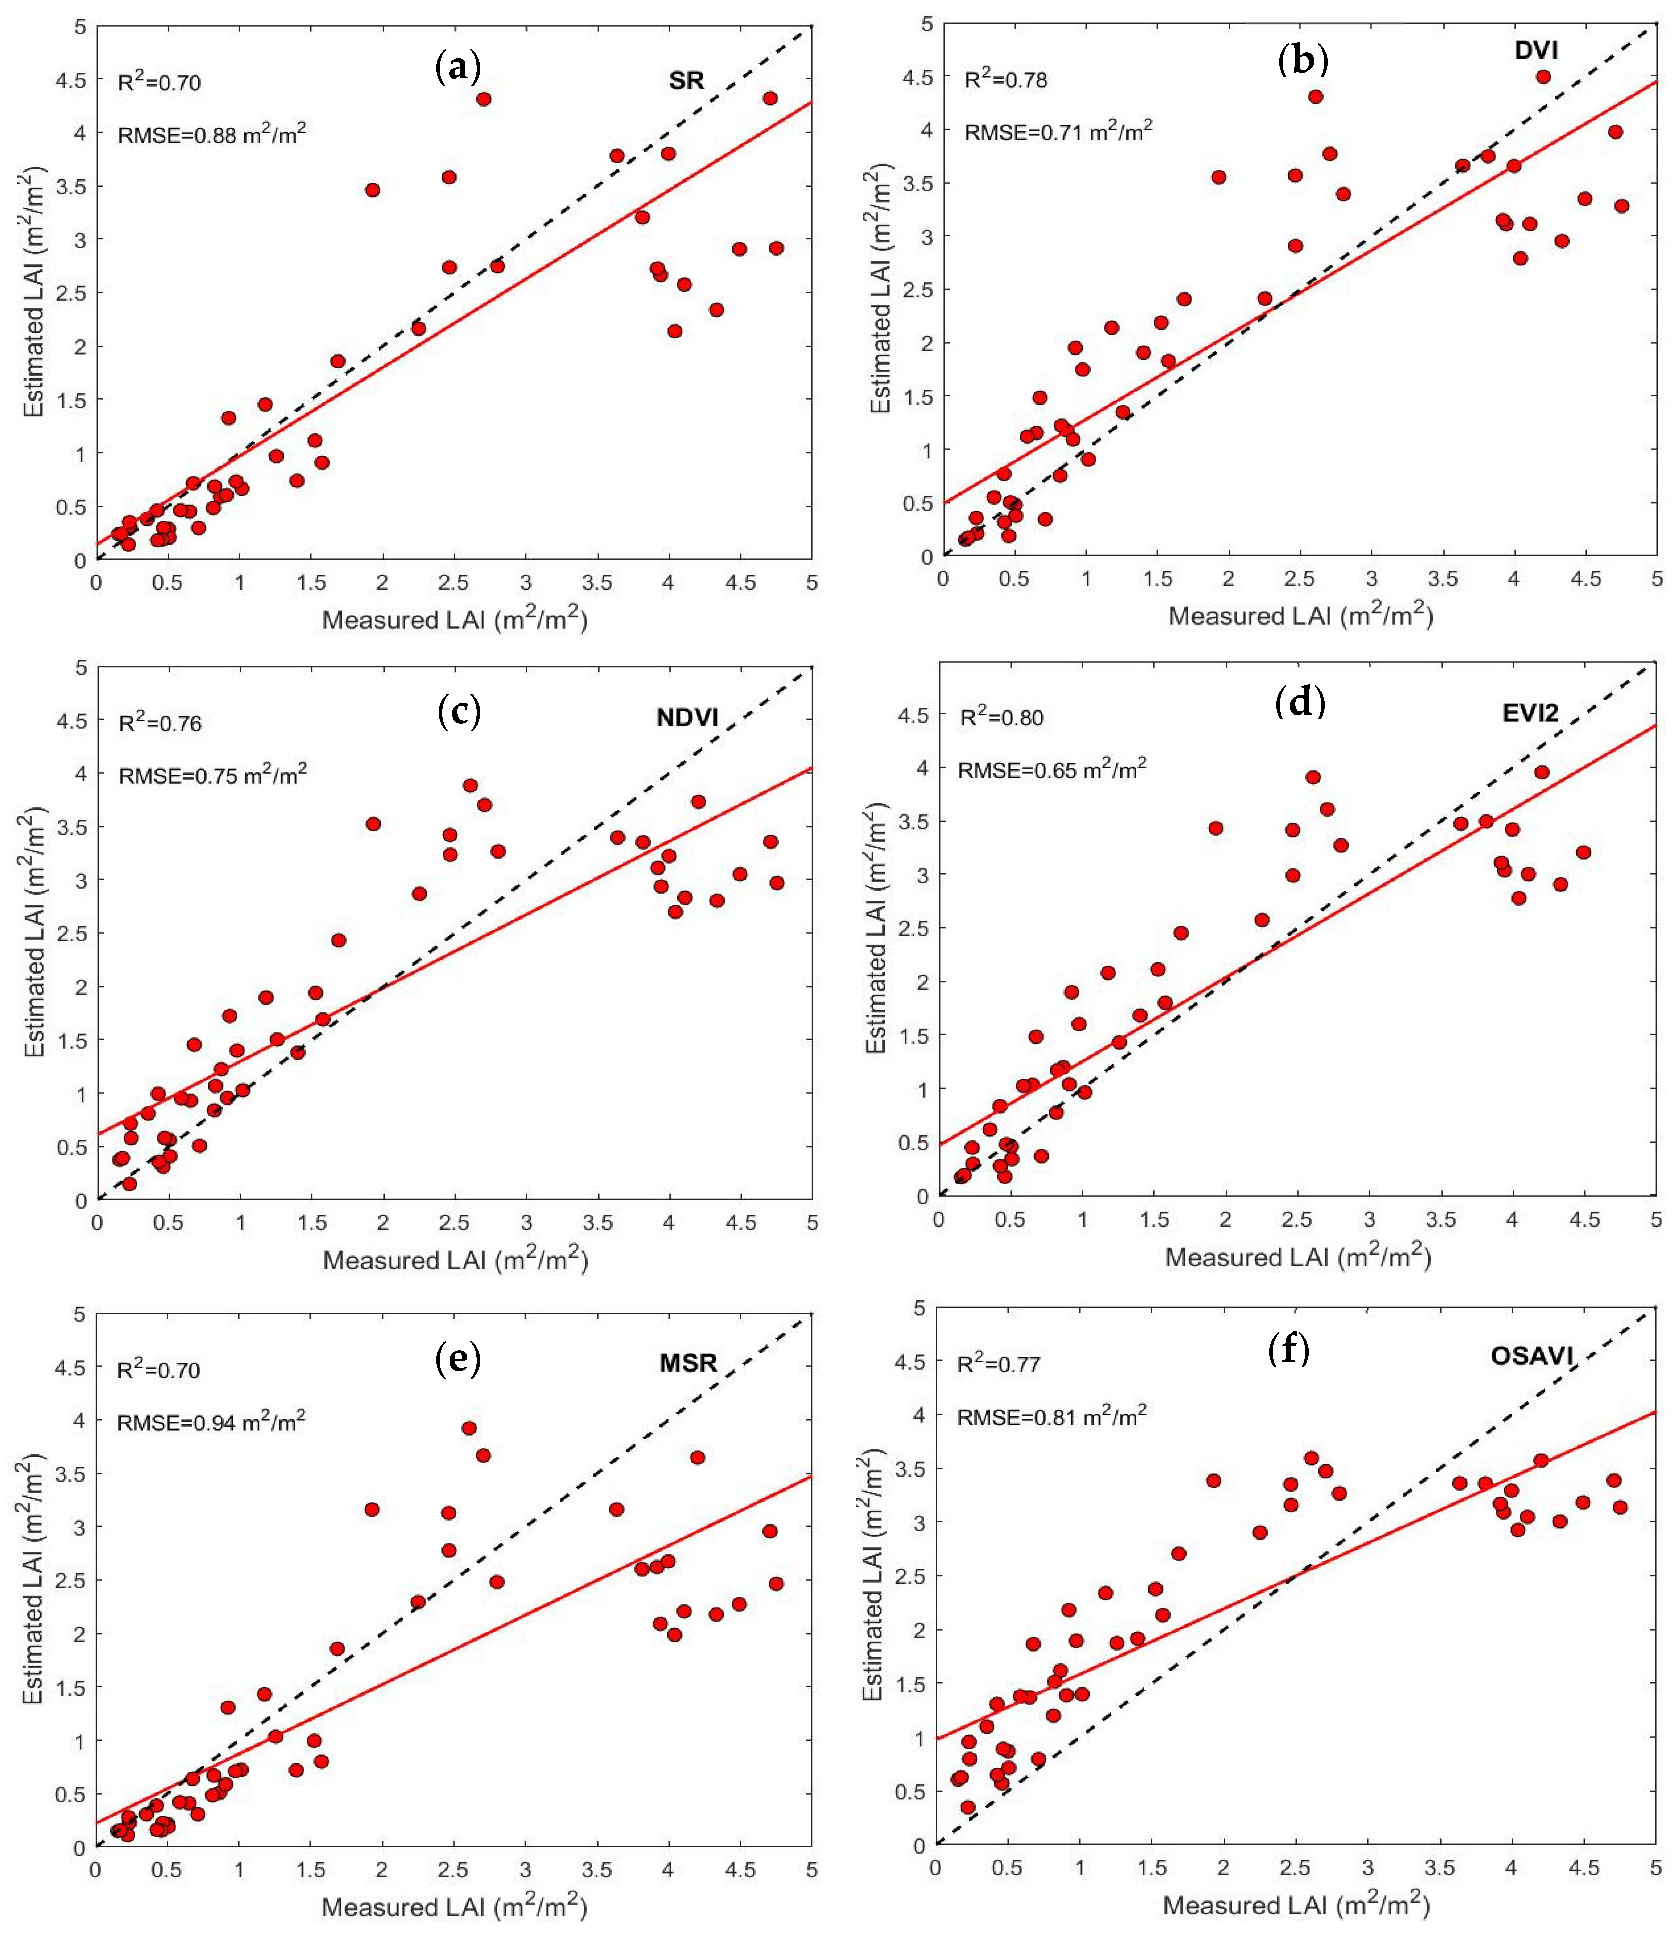
3.1. LAI Estimation from Sentinel-2 Data

Vegetation indices from Sentinel-2, in situ measurements, and a semi-empirical model were used to estimate LAI (Figure 3). The parameters of the semi-empirical models estimated by fitting Equation (4) with LAI measurements and VIs from Sentinel-2 for each vegetation index and their performances are presented in Table 2. The results show that the EVI2-based model had the best performance in LAI estimation and was able to explain 80% of winter wheat LAI variability during the growing season, with an RMSE of approximately 0.65 m2/m2. The MSR-based model, with R2 and RMSE of 0.70 and 0.95 m2/m2, respectively, was the weakest model for LAI estimation. All vegetation indices show saturation in LAI estimation. However, NDVI and MSR showed decreased sensitivity to LAI due to an early saturation for LAI values higher than 2.5. All other vegetation indices showed high accuracy in crop LAI estimation, but the model based on EVI2 had the best performance (explaining 80% of LAI variability during the growing season). The EVI2-based model was then used to generate LAI maps from Sentinel-2 data at 20 m × 20 m spatial resolution, the same as for crop yield data, for cloud-free days during the wheat growing season.

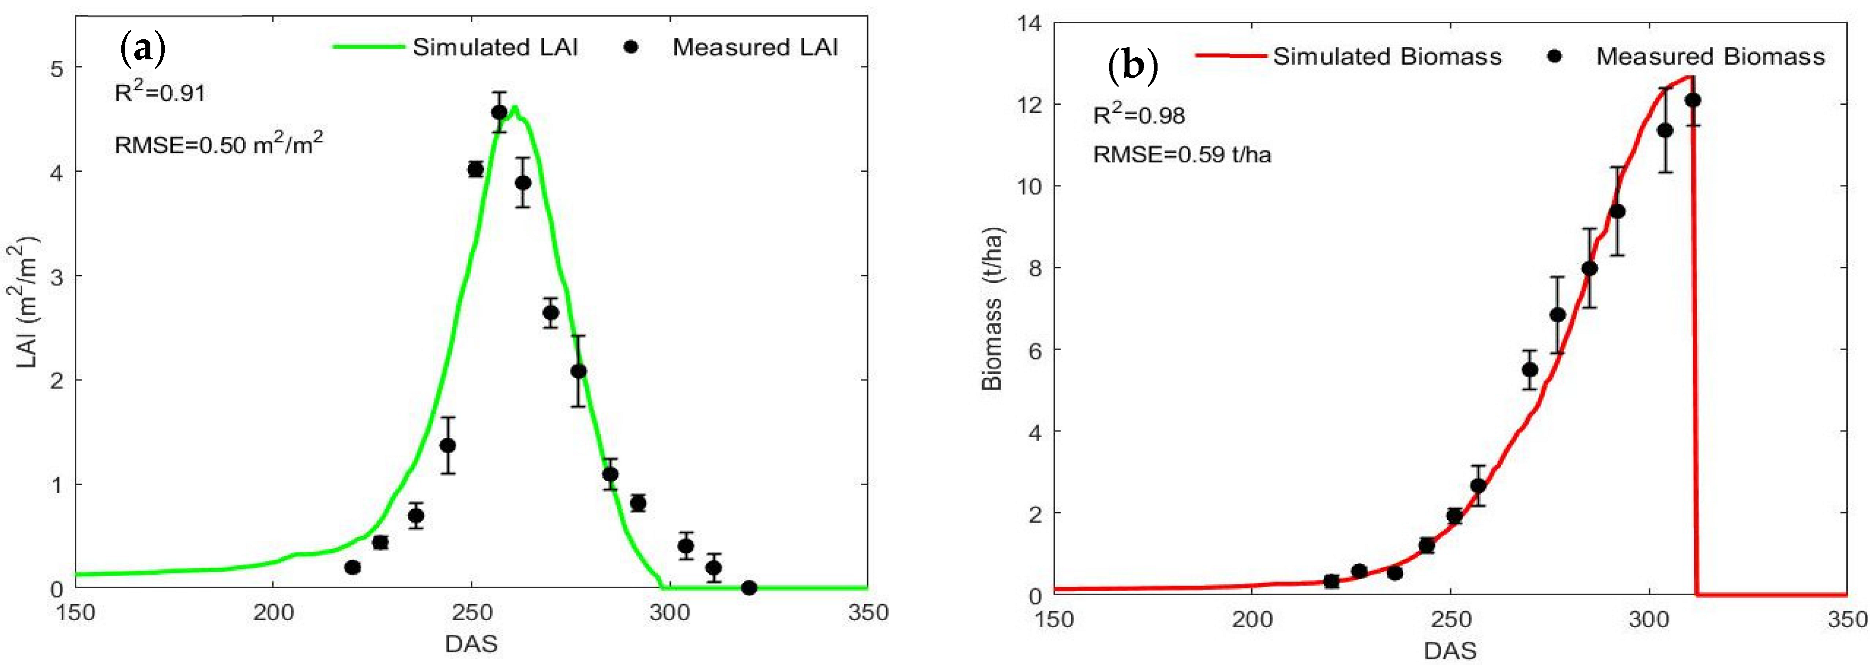
3.2. SAFY Model Calibration

The ground measurements of LAI and DAM were used to calibrate the SAFY model in the study area. For the fixed parameters, a priori values were identified on the basis of previous studies. In general, as reported in several studies, incoming photosynthetically active radiation (PAR) accounts for approximately 50% of the overall incoming radiation (Rg) [65,66]. Hence, the climatic efficiency (ε) was set to a value of 0.48 [22,27,29]. For the light-interception coefficient (k), which affects the fractional photosynthetically active radiation absorbed by the canopy (fAPAR), a value of 0.5 was chosen according to previous studies [27,29,67]. Winter wheat has an optimal temperature range of 17–23 °C, with minimum and maximum temperatures of 0 °C and 37 °C, beyond which growth will stop [68]. Therefore, for this study, the minimum, optimum, and maximum temperatures for winter wheat growth were set at 0, 17, and 30 °C, respectively. The specific leaf area (SLA) was estimated from measurements of leaf biomass and leaf area during the growing season, with an average SLA of 0.024 g m−2, which is in line with other values found in the literature [27,69]. The phenological parameters of the model (PLa, PLb, STT, and Rs) are all mainly related to the genetic characteristics of the crop. The results of these four parameters were calibrated for winter wheat. The calibrated ELUE varied between 1.6 and 2.5 g MJ−1, which is within the range found in the literature for winter wheat [27,70,71].
The calibration results of the SAFY model for winter wheat show that the model was able to explain 91% of the seasonal LAI variability during the growing season, with an RMSE of 0.50 m2/m2 (10% of the maximum observed LAI), and demonstrating that the LAI observations are accurately captured by the SAFY model (Figure 4a). Similarly, the correlation between the observed and simulated DAM reached 0.98 with an RMSE of approximately 0.59 t/ha (Figure 4b).

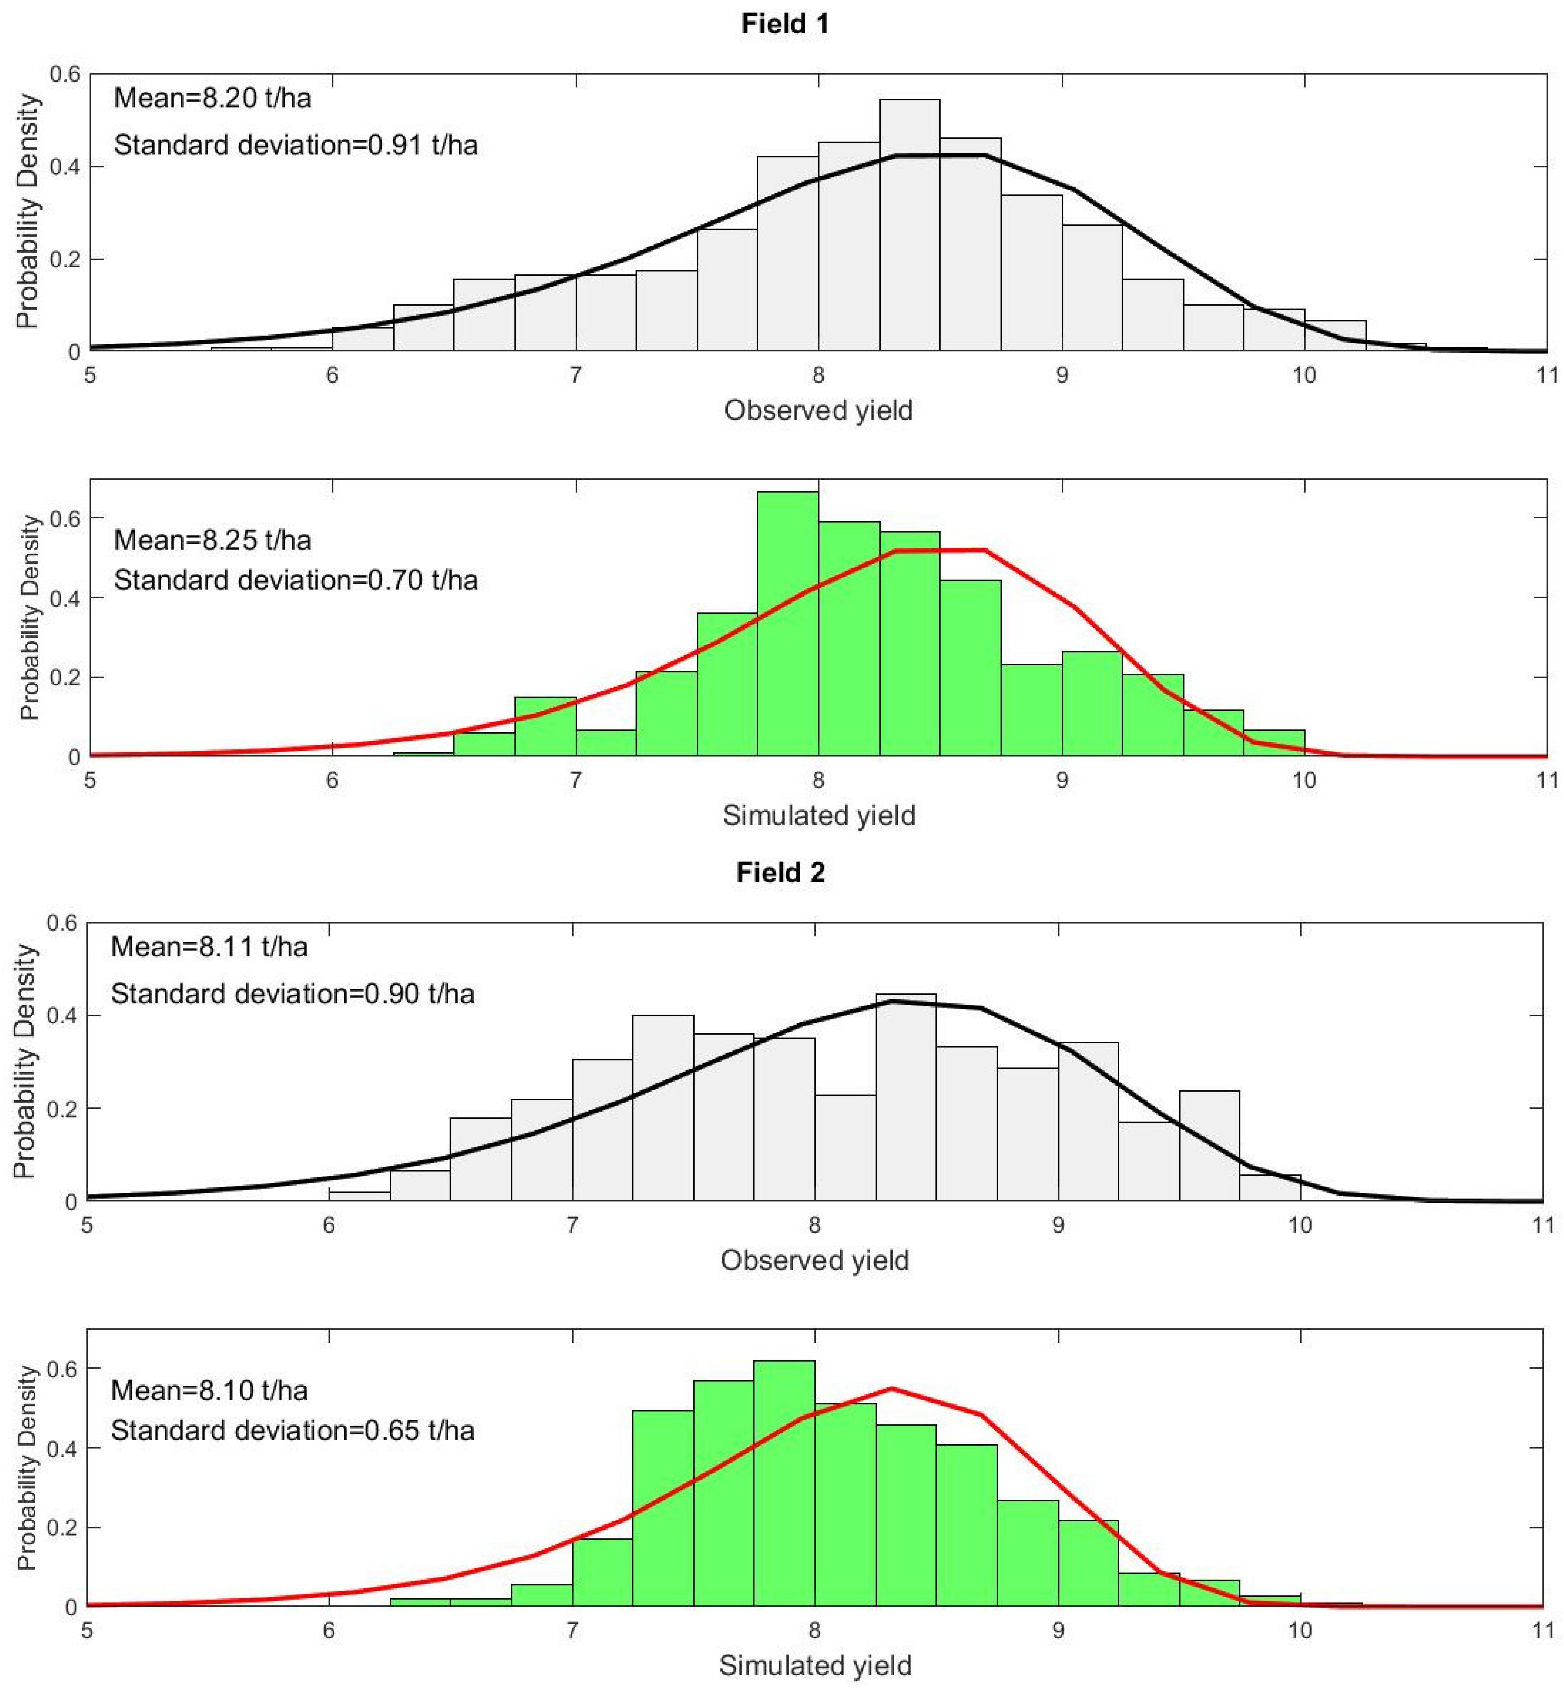
3.3. Spatial Estimation of Crop Yield

Crop yield variation within a field reflects various environmental factors resulting from combinations of weather conditions, soil, and management practices. Scatter plots of wheat yield measured by the harvester, and wheat yield estimated at the pixel scale (20 m × 20 m) using the SAFY model only and the SAFY model with assimilation of Sentinel-2 LAI time series with EnKF are shown in Figure 5. The open-loop simulations (SAFY model only) were unable to explain the within-field crop yield variability and showed considerable error against the observed wheat yield, resulting in an RMSE of 1.09 t/ha for Field 1 and 1.14 t/ha for Field 2 (Figure 5). However, the assimilation of the satellite-derived LAI time series into the SAFY model using EnKF significantly improved the accuracy of the spatial wheat yield estimation for both fields. Furthermore, spatial modeling improved the model accuracy and reduced fitting errors, e.g., reducing RMSE by 45% for Field 1 (from 1.09 to 0.60 t/ha) and 40% for Field 2 (from 1.14 to 0.68 t/ha). At the field scale, the observed crop yield was about 8.25 and 8.10 t/ha for Fields 1 and 2, respectively (Figure 6). With the open-loop simulation, the estimated crop yield was approximately 8.9 t/ha for both fields with a bias of about 0.65 and 0.79 t/ha for Fields 1 and 2, respectively. Aggregated over whole fields, assimilation with EnKF improved the crop yield estimate by reducing the bias between observed and estimated crop yields. The simulated yields using the assimilation model were about 8.20 and 8.11 t/ha, respectively, for Fields 1 and 2, with a bias of only 0.025 and 0.01 t/ha compared to the observed yield.
The assimilation of LAI into the SAFY model was able to approximately preserve the distributional properties of the observed wheat yield by the harvester for all fields (Figure 6). The probability density functions (PDF) of the estimated yield were similar to the PDF of the observed yield, with the observed yield ranging between 5.5 and 10.5 t/ha for Field 1 and between 6 and 10 t/ha for Field 2, and the estimated yield between 6.2 and 10 t/ha for both fields. The estimated wheat yield using assimilation with EnKF had a lower standard deviation than the yield measured by the harvester for all fields. This implies that the assimilation of the LAI time series into the SAFY model did not capture the full variability of the observed yield. Figure 7 presents maps of the observed yield and simulated yield with the assimilation of LAI for Fields 1 and 2. The assimilation efficiency (AE) was calculated at the pixel level to evaluate the added value of the assimilation of LAI compared to an open-loop simulation. For Fields 1 and 2, 68% and 70% pixels had positive results, respectively. This demonstrates that incorporating LAI derived from Sentinel-2 using an EVI2-based model into the SAFY model improves the estimation of the spatial variability of winter wheat yield by around 70% compared to the estimation by the model alone.

4. Discussion

This study shows that the SAFY model was able to simulate winter wheat growth and production with high accuracy at the field scale. Furthermore, LAI and accumulated biomass were accurately estimated by the model at the field scale, with high R2 values of 0.91 for LAI and 0.98 for dry aboveground biomass (Figure 4). In addition, the findings demonstrate that the SAFY model correctly simulates winter wheat yield at the field scale, as indicated by the close agreement between observed and estimated wheat yields, i.e., an observed yield of 8.25 t/ha vs. an estimated yield of 8.80 t/ha for Field 1. The model’s competence is important because yield estimation is an essential component of crop management and can help farmers make informed decisions about crop production at the field scale [72]. In line with our findings, several studies have shown good performance of the SAFY model for estimating crop growth, LAI, DAM, and crop yield at the field scale for different crops and climatic conditions around the globe [11,21,29,63,67,73].
Nevertheless, when using the SAFY model without assimilation of the satellite data, the results show that the SAFY model alone was not able to explain the within-field spatial variability of wheat yield (Figure 5), but still gives a good estimation of wheat yield at the field scale. The assimilation of LAI time series derived from Sentinel-2 into the SAFY model improves the estimate of within-field spatial variability of winter wheat yield by 73%. In addition, the results show that LAI assimilation reduced the bias in the estimated yield at the field scale compared with the open-loop (SAFY model only). This indicates possible practical applications of the assimilation of Sentinel-2 data into a crop growth model for crop yield estimation at the field scale and within the field.
Our results are consistent with those reported by Gaso et al. (2023) [10], who demonstrated that assimilating LAI into a soybean growth model using EnKF improved within-field soybean yield estimation by 42%. Also, Ziliani et al. (2022) [74] accurately estimated maize yield with a spatial resolution of 3 m by incorporating CubeSat-derived LAI into the APSIM model. Similarly to our study, Manivasagam et al. (2021) [11] found that direct integration of LAI from Sentinel-2 and PlanetScope into the SAFY model allows for estimation of spring wheat yield at high resolution, with RMSEs ranging between 0.68 and 0.88 t/ha. By the assimilation of LAI derived from UAV multispectral data into the SAFY model, Peng et al. (2021) [21] estimated corn yield at high spatial resolution under different water treatments with an RMSE of 0.69 t/ha.
Crop yield information with high spatial resolution is crucial for quantifying the yield gap within a field and to improve crop management practices to reduce this gap [75]. The results of our study demonstrate that the assimilation of LAI derived from freely accessible Sentinel-2 data into a simple semi-empirical crop growth model provides a practical tool to generate high-resolution yield maps (Figure 7), and it can provide a means to close spatially explicit yield gaps. Thus, it has the potential to help farmers improve crop management practices, even in the absence of expensive machinery for within-field crop yield estimation [76,77].
Despite the fact that the spatial variability of yield within the field was well captured, the estimated yields did not accurately reproduce some extreme high and low values of the measured yield (Figure 7). This may be due to the uncertainty of the LAI estimate using EVI2 from Sentinel-2 data, especially at high LAI values caused by the saturation of vegetation indices [74,75]. It should also be noted that there might be uncertainties in the ground-based yield map generated by possible yield loss by the harvester, which may explain some differences between the observed and estimated yield maps (Figure 7). Furthermore, the fixed value of the harvest index for an entire field may have influenced the final yield estimation, since the growth condition of the crop may have an impact on the harvest index within the field [78]. In this study, the harvest index was calculated from the average harvest index derived from 10 sampling points. Furthermore, other environmental variables, such as soil moisture, have an influence on crop growth and affect the final yield, and integrating this information into crop models may further improve crop yield estimation within field and at field scale [8,13].
In this study, we found that the difference in LAI is the main source of spatial variability in winter wheat yield within the field. However, uncertainties related to LAI estimation from Sentinel-2 data necessitate further examination, and could be improved using machine learning algorithms [79] or by combining Sentinel-1 and 2 data [80,81], which could provide a continuous estimate of LAI during the growth cycle regardless of weather conditions. In addition, in order to further improve crop yield estimation at high spatial resolution, it might be useful to assimilate other environmental variables derived from satellite observations; for example, soil moisture from Sentinel-1 data [82], and land surface temperature [83], which may improve the quantification of water stress. Since this study only encompasses field data collected during one growing season, the current model parameterizations and validation do not represent the anticipated range of environmental variability. It will be necessary to apply and validate the model across a larger range of situations to estimate robustness and accuracy under operational conditions. Furthermore, applying this approach at the regional scale and for other locations might require estimation and calibration of additional parameters of the SAFY model; for example, emergence dates, which are generally unknown at the regional scale. Wheat growth and yield are highly sensitive to the sowing date [84,85]; therefore, it is essential to estimate the emergence dates on a regional scale as a first step to ensure accurate crop yield estimation. In addition, the SAFY model does not currently account for the effects of management practices such as fertilization and water stress on the harvest index and final yield. To improve the accuracy and robustness of the model under varying field conditions, further optimization of the model parameters using ground measurements from a larger range of sites and years is required.

5. Conclusions

Monitoring crop growth and estimating crop yield at high spatial resolution within agricultural fields provides critical information that enables farmers to make decisions to increase crop production by improving their agricultural practices. The main objective of our study was to develop a robust approach to estimate winter wheat yield at high spatial resolution (20 m × 20 m) through the assimilation of remotely sensed LAI derived from freely accessible Sentinel-2 data into a simple growth model. LAI was estimated using a semi-empirical model and vegetation indices (VIs). Among the VIs tested, EVI2 was found to be the best VI for LAI estimation with an R2 of 0.80. The estimated LAI time series were assimilated into the SAFY model using Ensemble Kalman Filtering (EnKF). The results showed that the method improved the accuracy of winter wheat yield estimation both at the field scale and within the fields, with an RMSE of about 0.60 t/ha with assimilation and an RMSE of 1.09 with the model only. Furthermore, by employing the developed approach, highly detailed crop yield maps with 20 m × 20 m spatial resolution were generated. These maps provide valuable information that can be used as decision-support tools in improving crop production and optimizing management practices.

Author Contributions

Conceptualization, E.h.B. and L.E.; methodology, E.h.B.; software, E.h.B.; data curation, E.h.B., J.M.D., P.-O.O. and J.A.; writing—original draft preparation, E.h.B.; writing—review and editing, L.E., S.T., P.-O.O., J.M.D. and J.A.; supervision, L.E.; project administration, L.E.; funding acquisition, L.E. All authors have read and agreed to the published version of the manuscript.

Funding

This research was financed by the Swedish National Space Agency, grant no. 2020-00138 to L.E.

Data Availability Statement

Not applicable.

Acknowledgments

The authors acknowledge the support of the Swedish University of Agricultural Sciences for field data sampling through the collaboration with the Swedish Infrastructure for Ecosystem Science (SITES) Lönnstorp. SITES receives funding through the Swedish Research Council under the grant no 2017-00635. We also acknowledge support by the NordPlant project, financed by NordForsk, project no. 84597. Finally, we would like to acknowledge Leif Bengtsson, operational manager at Alnarps egendom (Swedish University of Agricultural Sciences), for providing yield data from fields used in this study.

Conflicts of Interest

The authors declare no conflict of interest.

References

  1. Asseng, S.; Ewert, F.; Martre, P.; Rötter, R.P.; Lobell, D.B.; Cammarano, D.; Kimball, B.A.; Ottman, M.J.; Wall, G.W.; White, J.W.; et al. Rising Temperatures Reduce Global Wheat Production. Nat. Clim. Chang. 2015, 5, 143–147. [Google Scholar] [CrossRef]
  2. Kogan, F. Vegetation Health for Insuring Drought-Related Yield Losses and Food Security Enhancement. In Remote Sensing for Food Security; Springer: Cham, Switzerland, 2019. [Google Scholar]
  3. Vicente-Serrano, S.M.; Quiring, S.M.; Peña-Gallardo, M.; Yuan, S.; Domínguez-Castro, F. A Review of Environmental Droughts: Increased Risk under Global Warming? Earth Sci. Rev. 2020, 201, 102953. [Google Scholar] [CrossRef]
  4. FAO. Climate Change and Food Security: Risks and Responses; FAO: Rome, Italy, 2016; ISBN 9789251089989. [Google Scholar]
  5. Basso, B.; Liu, L. Seasonal Crop Yield Forecast: Methods, Applications, and Accuracies. In Advances in Agronomy; Academic Press: Cambridge, MA, USA, 2019. [Google Scholar]
  6. Todorovic, M.; Albrizio, R.; Zivotic, L.; Abi Saab, M.T.; Stöckle, C.; Steduto, P. Assessment of Aquacrop, Cropsyst, and WOFOST Models in the Simulation of Sunfl Ower Growth under Different Water Regimes. Agron. J. 2009, 101, 509–521. [Google Scholar] [CrossRef]
  7. Therond, O.; Hengsdijk, H.; Casellas, E.; Wallach, D.; Adam, M.; Belhouchette, H.; Oomen, R.; Russell, G.; Ewert, F.; Bergez, J.E.; et al. Using a Cropping System Model at Regional Scale: Low-Data Approaches for Crop Management Information and Model Calibration. Agric. Ecosyst. Environ. 2011, 142, 85–94. [Google Scholar] [CrossRef]
  8. Ines, A.V.M.; Das, N.N.; Hansen, J.W.; Njoku, E.G. Assimilation of Remotely Sensed Soil Moisture and Vegetation with a Crop Simulation Model for Maize Yield Prediction. Remote Sens. Environ. 2013, 138, 149–164. [Google Scholar] [CrossRef]
  9. Weiss, M.; Jacob, F.; Duveiller, G. Remote Sensing for Agricultural Applications: A Meta-Review. Remote Sens. Environ. 2020, 236, 111402. [Google Scholar] [CrossRef]
  10. Gaso, D.V.; de Wit, A.; Berger, A.G.; Kooistra, L. Predicting Within-Field Soybean Yield Variability by Coupling Sentinel-2 Leaf Area Index with a Crop Growth Model. Agric. For. Meteorol. 2021, 308–309, 108553. [Google Scholar] [CrossRef]
  11. Manivasagam, V.S.; Sadeh, Y.; Kaplan, G.; Bonfil, D.J.; Rozenstein, O. Studying the Feasibility of Assimilating Sentinel-2 and Planetscope Imagery into the SAFY Crop Model to Predict within-Field Wheat Yield. Remote Sens. 2021, 13, 2395. [Google Scholar] [CrossRef]
  12. Kang, Y.; Özdoğan, M. Field-Level Crop Yield Mapping with Landsat Using a Hierarchical Data Assimilation Approach. Remote Sens. Environ. 2019, 228, 144–163. [Google Scholar] [CrossRef]
  13. Mishra, V.; Cruise, J.F.; Mecikalski, J.R. Assimilation of Coupled Microwave/Thermal Infrared Soil Moisture Profiles into a Crop Model for Robust Maize Yield Estimates over Southeast United States. Eur. J. Agron. 2021, 123, 126208. [Google Scholar] [CrossRef]
  14. de Wit, A.J.W.; van Diepen, C.A. Crop Model Data Assimilation with the Ensemble Kalman Filter for Improving Regional Crop Yield Forecasts. Agric. For. Meteorol. 2007, 146, 38–56. [Google Scholar] [CrossRef]
  15. Jin, X.; Kumar, L.; Li, Z.; Feng, H.; Xu, X.; Yang, G.; Wang, J. A Review of Data Assimilation of Remote Sensing and Crop Models. Eur. J. Agron. 2018, 92, 141–152. [Google Scholar] [CrossRef]
  16. Huang, J.; Gómez-Dans, J.L.; Huang, H.; Ma, H.; Wu, Q.; Lewis, P.E.; Liang, S.; Chen, Z.; Xue, J.H.; Wu, Y.; et al. Assimilation of Remote Sensing into Crop Growth Models: Current Status and Perspectives. Agric. For. Meteorol. 2019, 276–277, 107609. [Google Scholar] [CrossRef]
  17. Zhang, Y.; Walker, J.P.; Pauwels, V.R.N.; Sadeh, Y. Assimilation of Wheat and Soil States into the Apsim-Wheat Crop Model: A Case Study. Remote Sens. 2022, 14, 65. [Google Scholar] [CrossRef]
  18. Dorigo, W.A.; Zurita-Milla, R.; de Wit, A.J.W.; Brazile, J.; Singh, R.; Schaepman, M.E. A Review on Reflective Remote Sensing and Data Assimilation Techniques for Enhanced Agroecosystem Modeling. Int. J. Appl. Earth Obs. Geoinf. 2007, 9, 165–193. [Google Scholar] [CrossRef]
  19. Delécolle, R.; Maas, S.J.; Guérif, M.; Baret, F. Remote Sensing and Crop Production Models: Present Trends. ISPRS J. Photogramm. Remote Sens. 1992, 47, 145–161. [Google Scholar] [CrossRef]
  20. Evensen, G. The Ensemble Kalman Filter: Theoretical Formulation and Practical Implementation. Ocean. Dyn. 2003, 53, 343–367. [Google Scholar] [CrossRef]
  21. Peng, X.; Han, W.; Ao, J.; Wang, Y. Assimilation of Lai Derived from UAV Multispectral Data into the SAFY Model to Estimate Maize Yield. Remote Sens. 2021, 13, 1094. [Google Scholar] [CrossRef]
  22. Silvestro, P.C.; Pignatti, S.; Pascucci, S.; Yang, H.; Li, Z.; Yang, G.; Huang, W.; Casa, R. Estimating Wheat Yield in China at the Field and District Scale from the Assimilation of Satellite Data into the Aquacrop and Simple Algorithm for Yield (SAFY) Models. Remote Sens. 2017, 9, 509. [Google Scholar] [CrossRef]
  23. Zhuo, W.; Huang, J.; Li, L.; Zhang, X.; Ma, H.; Gao, X.; Huang, H.; Xu, B.; Xiao, X. Assimilating Soil Moisture Retrieved from Sentinel-1 and Sentinel-2 Data into WOFOST Model to Improve Winter Wheat Yield Estimation. Remote Sens. 2019, 11, 1618. [Google Scholar] [CrossRef]
  24. Bai, T.; Wang, S.; Meng, W.; Zhang, N.; Wang, T.; Chen, Y.; Mercatoris, B. Assimilation of Remotely-Sensed LAI into WOFOST Model with the SUBPLEX Algorithm for Improving the Field-Scale Jujube Yield Forecasts. Remote Sens. 2019, 11, 1945. [Google Scholar] [CrossRef]
  25. de Wit, A.; Boogaard, H.; Fumagalli, D.; Janssen, S.; Knapen, R.; van Kraalingen, D.; Supit, I.; van der Wijngaart, R.; van Diepen, K. 25 Years of the WOFOST Cropping Systems Model. Agric. Syst. 2019, 168, 154–167. [Google Scholar] [CrossRef]
  26. Gaiser, T.; de Barros, I.; Sereke, F.; Lange, F.M. Validation and Reliability of the EPIC Model to Simulate Maize Production in Small-Holder Farming Systems in Tropical Sub-Humid West Africa and Semi-Arid Brazil. Agric. Ecosyst. Environ. 2010, 135, 318–327. [Google Scholar] [CrossRef]
  27. Duchemin, B.; Maisongrande, P.; Boulet, G.; Benhadj, I. A Simple Algorithm for Yield Estimates: Evaluation for Semi-Arid Irrigated Winter Wheat Monitored with Green Leaf Area Index. Environ. Model. Softw. 2008, 23, 876–892. [Google Scholar] [CrossRef]
  28. Ma, G.; Huang, J.; Wu, W.; Fan, J.; Zou, J.; Wu, S. Assimilation of MODIS-LAI into the WOFOST Model for Forecasting Regional Winter Wheat Yield. Math. Comput. Model. 2013, 58, 634–643. [Google Scholar] [CrossRef]
  29. Ma, C.; Liu, M.; Ding, F.; Li, C.; Cui, Y.; Chen, W.; Wang, Y. Wheat Growth Monitoring and Yield Estimation Based on Remote Sensing Data Assimilation into the SAFY Crop Growth Model. Sci. Rep. 2022, 12, 5473. [Google Scholar] [CrossRef]
  30. Lu, Y.; Chibarabada, T.P.; Ziliani, M.G.; Onema, J.M.K.; McCabe, M.F.; Sheffield, J. Assimilation of Soil Moisture and Canopy Cover Data Improves Maize Simulation Using an Under-Calibrated Crop Model. Agric. Water Manag. 2021, 252, 106884. [Google Scholar] [CrossRef]
  31. Fattori Junior, I.M.; dos Santos Vianna, M.; Marin, F.R. Assimilating Leaf Area Index Data into a Sugarcane Process-Based Crop Model for Improving Yield Estimation. Eur. J. Agron. 2022, 136, 126501. [Google Scholar] [CrossRef]
  32. Gaso, D.V.; de Wit, A.; de Bruin, S.; Puntel, L.A.; Berger, A.G.; Kooistra, L. Efficiency of Assimilating Leaf Area Index into a Soybean Model to Assess Within-Field Yield Variability. Eur. J. Agron. 2023, 143, 126718. [Google Scholar] [CrossRef]
  33. Zhuo, W.; Huang, H.; Gao, X.; Li, X.; Huang, J. An Improved Approach of Winter Wheat Yield Estimation by Jointly Assimilating Remotely Sensed Leaf Area Index and Soil Moisture into the WOFOST Model. Remote Sens. 2023, 15, 1825. [Google Scholar] [CrossRef]
  34. Zhao, Y.; Chen, S.; Shen, S. Assimilating Remote Sensing Information with Crop Model Using Ensemble Kalman Filter for Improving LAI Monitoring and Yield Estimation. Ecol. Modell. 2013, 270, 30–42. [Google Scholar] [CrossRef]
  35. Curnel, Y.; de Wit, A.J.W.; Duveiller, G.; Defourny, P. Potential Performances of Remotely Sensed LAI Assimilation in WOFOST Model Based on an OSS Experiment. Agric. For. Meteorol. 2011, 151, 1843–1855. [Google Scholar] [CrossRef]
  36. Pasqualotto, N.; Delegido, J.; Van Wittenberghe, S.; Rinaldi, M.; Moreno, J. Multi-Crop Green LAI Estimation with a New Simple Sentinel-2 LAI Index (SeLI). Sensors 2019, 19, 904. [Google Scholar] [CrossRef] [PubMed]
  37. Frampton, W.J.; Dash, J.; Watmough, G.; Milton, E.J. Evaluating the Capabilities of Sentinel-2 for Quantitative Estimation of Biophysical Variables in Vegetation. ISPRS J. Photogramm. Remote Sens. 2013, 82, 83–92. [Google Scholar] [CrossRef]
  38. Segarra, J.; Araus, J.L.; Kefauver, S.C. Farming and Earth Observation: Sentinel-2 Data to Estimate within-Field Wheat Grain Yield. Int. J. Appl. Earth Obs. Geoinf. 2022, 107, 102697. [Google Scholar] [CrossRef]
  39. Gascon, F.; Bouzinac, C.; Thépaut, O.; Jung, M.; Francesconi, B.; Louis, J.; Lonjou, V.; Lafrance, B.; Massera, S.; Gaudel-Vacaresse, A.; et al. Copernicus Sentinel-2A Calibration and Products Validation Status. Remote Sens. 2017, 9, 584. [Google Scholar] [CrossRef]
  40. Zheng, G.; Moskal, L.M. Retrieving Leaf Area Index (LAI) Using Remote Sensing: Theories, Methods and Sensors. Sensors 2009, 9, 2719–2745. [Google Scholar] [CrossRef]
  41. Verrelst, J.; Camps-Valls, G.; Muñoz-Marí, J.; Rivera, J.P.; Veroustraete, F.; Clevers, J.G.P.W.; Moreno, J. Optical Remote Sensing and the Retrieval of Terrestrial Vegetation Bio-Geophysical Properties—A Review. ISPRS J. Photogramm. Remote Sens. 2015, 108, 273–290. [Google Scholar] [CrossRef]
  42. Richardson, A.J.; Wiegand, C.L. Distinguishing Vegetation from Soil Background Information. Photogramm. Eng. Remote Sens. 1977, 43, 1541–1552. [Google Scholar]
  43. Rondeaux, G.; Steven, M.; Baret, F. Optimization of Soil-Adjusted Vegetation Indices. Remote Sens. Environ. 1996, 55, 95–107. [Google Scholar] [CrossRef]
  44. Jiang, Z.; Huete, A.R.; Didan, K.; Miura, T. Development of a Two-Band Enhanced Vegetation Index without a Blue Band. Remote Sens. Environ. 2008, 112, 3833–3845. [Google Scholar] [CrossRef]
  45. Baret, F.; Guyot, G. Potentials and Limits of Vegetation Indices for LAI and APAR Assessment. Remote Sens. Environ. 1991, 35, 161–173. [Google Scholar] [CrossRef]
  46. Wolters, S.; Söderström, M.; Piikki, K.; Reese, H.; Stenberg, M. Upscaling Proximal Sensor N-Uptake Predictions in Winter Wheat (Triticum aestivum L.) with Sentinel-2 Satellite Data for Use in a Decision Support System. Precis. Agric. 2021, 22, 1263–1283. [Google Scholar] [CrossRef]
  47. Swedish Board of Agriculture. Use of Agricultural Land 2019, Final Statistics. Available online: www.jordbruksverket.se (accessed on 3 September 2023).
  48. Grusson, Y.; Wesström, I.; Joel, A. Impact of Climate Change on Swedish Agriculture: Growing Season Rain Deficit and Irrigation Need. Agric. Water Manag. 2021, 251, 106858. [Google Scholar] [CrossRef]
  49. Bouras, E.H.; Jarlan, L.; Er-Raki, S.; Albergel, C.; Richard, B.; Balaghi, R.; Khabba, S. Linkages between Rainfed Cereal Production and Agricultural Drought through Remote Sensing Indices and a Land Data Assimilation System: A Case Study in Morocco. Remote Sens. 2020, 12, 4018. [Google Scholar] [CrossRef]
  50. Baret, F.; de Solan, B.; Lopez-Lozano, R.; Ma, K.; Weiss, M. GAI Estimates of Row Crops from Downward Looking Digital Photos Taken Perpendicular to Rows at 57.5° Zenith Angle: Theoretical Considerations Based on 3D Architecture Models and Application to Wheat Crops. Agric. For. Meteorol. 2010, 150, 1393–1401. [Google Scholar] [CrossRef]
  51. Lyle, G.; Bryan, B.A.; Ostendorf, B. Post-Processing Methods to Eliminate Erroneous Grain Yield Measurements: Review and Directions for Future Development. Precis. Agric. 2014, 15, 377–402. [Google Scholar] [CrossRef]
  52. Hunt, M.L.; Blackburn, G.A.; Carrasco, L.; Redhead, J.W.; Rowland, C.S. High Resolution Wheat Yield Mapping Using Sentinel-2. Remote Sens. Environ. 2019, 233, 111410. [Google Scholar] [CrossRef]
  53. Kharel, T.P.; Swink, S.N.; Maresma, A.; Youngerman, C.; Kharel, D.; Czymmek, K.J.; Ketterings, Q.M. Yield Monitor Data Cleaning Is Essential for Accurate Corn Grain and Silage Yield Determination. Agron. J. 2019, 111, 509–516. [Google Scholar] [CrossRef]
  54. Louis, J.; Debaecker, V.; Pflug, B.; Main-Knorn, M.; Bieniarz, J.; Mueller-Wilm, U.; Cadau, E.; Gascon, F. Sentinel-2 SEN2COR: L2A Processor for Users. In Proceedings of the European Space Agency, (Special Publication) ESA SP, Prague, Czech Republic, 9–13 May 2016; ESTEC: Noordwijk, The Netherlands, 2016; Volume SP-740. [Google Scholar]
  55. Gorelick, N.; Hancher, M.; Dixon, M.; Ilyushchenko, S.; Thau, D.; Moore, R. Google Earth Engine: Planetary-Scale Geospatial Analysis for Everyone. Remote Sens. Environ. 2017, 202, 18–27. [Google Scholar] [CrossRef]
  56. Jiang, J.; Weiss, M.; Liu, S.; Baret, F. Effective GAI Is Best Estimated from Reflectance Observations as Compared to GAI and LAI: Demonstration for Wheat and Maize Crops Based on 3D Radiative Transfer Simulations. Field Crops Res. 2022, 283, 108538. [Google Scholar] [CrossRef]
  57. Jordan, C.F. Derivation of Leaf-Area Index from Quality of Light on the Forest Floor. Ecology 1969, 50, 663–666. [Google Scholar] [CrossRef]
  58. Rouse, W.; Haas, R.H.; Deering, D.W. Monitoring Vegetation Systems in the Great Plains with ERTS, NASA SP-351. In Proceedings of the Goddard Space Flight Center Third ERTS-1 Symposium, Washington, DC, USA, 10–14 December 1974. [Google Scholar]
  59. Chen, J.M. Evaluation of Vegetation Indices and a Modified Simple Ratio for Boreal Applications. Can. J. Remote Sens. 1996, 22, 229–242. [Google Scholar] [CrossRef]
  60. Monteith, J.L. Climate and the Efficiency of Crop Production in Britain. Philos. Trans. R. Soc. Lond. B Biol. Sci. 1977, 281, 277–294. [Google Scholar] [CrossRef]
  61. Claverie, M.; Demarez, V.; Duchemin, B.; Hagolle, O.; Ducrot, D.; Marais-Sicre, C.; Dejoux, J.F.; Huc, M.; Keravec, P.; Béziat, P.; et al. Maize and Sunflower Biomass Estimation in Southwest France Using High Spatial and Temporal Resolution Remote Sensing Data. Remote Sens. Environ. 2012, 124, 844–857. [Google Scholar] [CrossRef]
  62. Dong, T.; Liu, J.; Qian, B.; Zhao, T.; Jing, Q.; Geng, X.; Wang, J.; Huffman, T.; Shang, J. Estimating Winter Wheat Biomass by Assimilating Leaf Area Index Derived from Fusion of Landsat-8 and MODIS Data. Int. J. Appl. Earth Obs. Geoinf. 2016, 49, 63–74. [Google Scholar] [CrossRef]
  63. Silvestro, P.C.; Pignatti, S.; Yang, H.; Yang, G.; Pascucci, S.; Castaldi, F.; Casa, R. Sensitivity Analysis of the Aquacrop and SAFYE Crop Models for the Assessment of Water Limited Winter Wheat Yield in Regional Scale Applications. PLoS ONE 2017, 12, e0187485. [Google Scholar] [CrossRef]
  64. Katzfuss, M.; Stroud, J.R.; Wikle, C.K. Understanding the Ensemble Kalman Filter. Am. Stat. 2016, 70, 350–357. [Google Scholar] [CrossRef]
  65. Keating, B.A.; Carberry, P.S. Resource Capture and Use in Intercropping: Solar Radiation. Field Crops Res. 1993, 34, 273–301. [Google Scholar] [CrossRef]
  66. Monteith, J.L. Solar Radiation and Productivity in Tropical Ecosystems. J. Appl. Ecol. 1972, 9, 747–766. [Google Scholar] [CrossRef]
  67. Song, Y.; Wang, J.; Shang, J.; Liao, C. Using UAV-Based SOPC Derived LAI and SAFY Model for Biomass and Yield Estimation of Winter Wheat. Remote Sens. 2020, 12, 2378. [Google Scholar] [CrossRef]
  68. John, R.P.; Megan, G. Temperatures and the Growth and Development of Wheat: A Review. Eur. J. Agron. 1999, 10, 23–36. [Google Scholar]
  69. Rebetzke, G.J.; Botwright, T.L.; Moore, C.S.; Richards, R.A.; Condon, A.G. Genotypic Variation in Specific Leaf Area for Genetic Improvement of Early Vigour in Wheat. Field Crops Res. 2004, 88, 179–189. [Google Scholar] [CrossRef]
  70. Maas, S.J. Parameterized Model of Gramineous Crop Growth: I. Leaf Area and Dry Mass Simulation. Agron. J. 1993, 85, 348–353. [Google Scholar] [CrossRef]
  71. Khabba, S.; Er-Raki, S.; Toumi, J.; Ezzahar, J.; Hssaine, B.A.; Page, M.L.; Chehbouni, A. A Simple Light-Use-Efficiency Model to Estimate Wheat Yield in the Semi-Arid Areas. Agronomy 2020, 10, 1524. [Google Scholar] [CrossRef]
  72. Van Ittersum, M.K.; Cassman, K.G.; Grassini, P.; Wolf, J.; Tittonell, P.; Hochman, Z. Yield Gap Analysis with Local to Global Relevance-A Review. Field Crops Res. 2013, 143, 4–17. [Google Scholar] [CrossRef]
  73. Chahbi, A.; Zribi, M.; Lili-Chabaane, Z.; Duchemin, B.; Shabou, M.; Mougenot, B.; Boulet, G. Estimation of the Dynamics and Yields of Cereals in a Semi-Arid Area Using Remote Sensing and the SAFY Growth Model. Int. J. Remote Sens. 2014, 35, 1004–1028. [Google Scholar] [CrossRef]
  74. Ziliani, M.G.; Altaf, M.U.; Aragon, B.; Houburg, R.; Franz, T.E.; Lu, Y.; Sheffield, J.; Hoteit, I.; McCabe, M.F. Early Season Prediction of Within-Field Crop Yield Variability by Assimilating CubeSat Data into a Crop Model. Agric. For. Meteorol. 2022, 313, 108736. [Google Scholar] [CrossRef]
  75. Corti, M.; Cavalli, D.; Cabassi, G.; Marino Gallina, P.; Bechini, L. Does Remote and Proximal Optical Sensing Successfully Estimate Maize Variables? A Review. Eur. J. Agron. 2018, 99, 37–50. [Google Scholar] [CrossRef]
  76. Lobell, D.B. The Use of Satellite Data for Crop Yield Gap Analysis. Field Crops Res. 2013, 143, 56–64. [Google Scholar] [CrossRef]
  77. Anderson, W.K. Closing the Gap between Actual and Potential Yield of Rainfed Wheat. The Impacts of Environment, Management and Cultivar. Field Crops Res. 2010, 116, 14–22. [Google Scholar] [CrossRef]
  78. Campoy, J.; Campos, I.; Plaza, C.; Calera, M.; Bodas, V.; Calera, A. Estimation of Harvest Index in Wheat Crops Using a Remote Sensing-Based Approach. Field Crops Res. 2020, 256, 107910. [Google Scholar] [CrossRef]
  79. Kganyago, M.; Mhangara, P.; Adjorlolo, C. Estimating Crop Biophysical Parameters Using Machine Learning Algorithms and Sentinel-2 Imagery. Remote Sens. 2021, 13, 4314. [Google Scholar] [CrossRef]
  80. Wang, J.; Xiao, X.; Bajgain, R.; Starks, P.; Steiner, J.; Doughty, R.B.; Chang, Q. Estimating Leaf Area Index and Aboveground Biomass of Grazing Pastures Using Sentinel-1, Sentinel-2 and Landsat Images. ISPRS J. Photogramm. Remote Sens. 2019, 154, 189–201. [Google Scholar] [CrossRef]
  81. Bhattarai, R.; Rahimzadeh-Bajgiran, P.; Weiskittel, A.; Homayouni, S.; Gara, T.W.; Hanavan, R.P. Estimating Species-Specific Leaf Area Index and Basal Area Using Optical and SAR Remote Sensing Data in Acadian Mixed Spruce-Fir Forests, USA. Int. J. Appl. Earth Obs. Geoinf. 2022, 108, 102727. [Google Scholar] [CrossRef]
  82. Ouaadi, N.; Jarlan, L.; Ezzahar, J.; Zribi, M.; Khabba, S.; Bouras, E.; Bousbih, S.; Frison, P.-L. Monitoring of Wheat Crops Using the Backscattering Coefficient and the Interferometric Coherence Derived from Sentinel-1 in Semi-Arid Areas. Remote Sens. Environ. 2020, 251, 112050. [Google Scholar] [CrossRef]
  83. Amazirh, A.; Er-Raki, S.; Ojha, N.; Bouras, E.H.; Rivalland, V.; Merlin, O.; Chehbouni, A. Assimilation of SMAP Disaggregated Soil Moisture and Landsat Land Surface Temperature to Improve FAO-56 Estimates of ET in Semi-Arid Regions. Agric. Water Manag. 2022, 260, 107290. [Google Scholar] [CrossRef]
  84. Belaqziz, S.; Khabba, S.; Kharrou, M.H.; Bouras, E.H.; Er-Raki, S.; Chehbouni, A. Optimizing the Sowing Date to Improve Water Management and Wheat Yield in a Large Irrigation Scheme, through a Remote Sensing and an Evolution Strategy-Based Approach. Remote Sens. 2021, 13, 3789. [Google Scholar] [CrossRef]
  85. Bouras, E.; Jarlan, L.; Khabba, S.; Er-Raki, S.; Dezetter, A.; Sghir, F.; Tramblay, Y. Assessing the Impact of Global Climate Changes on Irrigated Wheat Yields and Water Requirements in a Semi-Arid Environment of Morocco. Sci. Rep. 2019, 9, 19142. [Google Scholar] [CrossRef]
Figure 1. Study area location with the two fields included in the study.
Remotesensing 15 04425 g001
Figure 2. Daily maximum, minimum, and mean temperatures; rainfall; solar radiation; and reference evapotranspiration during the growing season.
Remotesensing 15 04425 g002
Figure 3. Measured and estimated LAI (red dots) using semi-empirical models based on (a) SR, (b) DVI, (c) NDVI, (d) EVI2, (e) MSR, and (f) OSAVI. The red and the dashed black lines refer to the fitted and 1:1 line, respectively.
Remotesensing 15 04425 g003
Figure 4. The observed (points) and the simulated (continuous green line) LAI (a); the observed (points) and the simulated (continuous red line) dry aboveground biomass (DAM) (b). Error bars around points denote standard deviations of 10 measurements.
Remotesensing 15 04425 g004
Figure 5. The observed and estimated wheat yield without assimilation (open-loop) (red symbols) and with assimilation of LAI (EnKF) at pixel level (black symbols) for Field 1 and Field 2.
Remotesensing 15 04425 g005
Figure 6. Probability density functions of observed and simulated yield with EnKF for Fields 1 and 2.
Remotesensing 15 04425 g006
Figure 7. Observed and simulated wheat yield obtained by assimilation of LAI with EnKF for two fields, Field 1 (a) and Field 2 (b), at 20 m × 20 m spatial resolution.
Remotesensing 15 04425 g007
Table 1. Vegetation indices used in this study.
NameAbbreviationEquationReference
Simple ratioSR N I R R e d [57]
Difference vegetation indexDVI N I R R e d [42]
Normalized difference vegetation indexNDVI N I R R e d N I R + R e d [58]
Two-band version of the enhanced vegetation indexEVI2 2.5 N I R R e d N I R + 2.4 R e d + 1 [44]
Modified simple ratioMSR N I R / R e d 1 N I R / R e d + 1 [59]
Optimized soil-adjusted vegetation indexOSAVI N I R R E D N I R + R e d + 0.16 [43]
Table 2. Performance of semi-empirical models and estimated parameters of each model by fitting Equation (4) with LAI measurements and VIs from Sentinel-2.
V I V I g kR2RMSE
SR22.8500.0332.4630.700.88
DVI0.4040.0991.9950.780.71
NDVI0.9640.1481.4290.760.75
EVI20.7550.1542.3030.800.65
MSR14.550.5883.0900.700.95
OSAVI0.8470.1222.4030.770.81
Disclaimer/Publisher’s Note: The statements, opinions and data contained in all publications are solely those of the individual author(s) and contributor(s) and not of MDPI and/or the editor(s). MDPI and/or the editor(s) disclaim responsibility for any injury to people or property resulting from any ideas, methods, instructions or products referred to in the content.

