Article

Surveillance Video Georeference Method Based on Real Scene Model with Geometry Priors

1
College of Geodesy and Geomatics, Shandong University of Science and Technology, Qingdao 266590, China
2
College of Foreign Languages, Shandong University of Science and Technology, Qingdao 266590, China
*
Author to whom correspondence should be addressed.
Remote Sens. 2023, 15(17), 4217; https://doi.org/10.3390/rs15174217
Submission received: 27 June 2023 / Revised: 18 August 2023 / Accepted: 23 August 2023 / Published: 28 August 2023

Abstract

:
With the comprehensive promotion of digital construction in China, cameras scattered throughout the country are of great significance in obtaining first-hand data. However, their potential role is limited due to the lack of georeference information on current surveillance cameras. Provided surveillance camera images and real scenes are combined and given georeference information, this problem can be solved, allowing cameras to generate significant social benefits. This article proposed an accurate registration method based on misalignment calibration and least squares matching between real scene and surveillance camera images to address this issue. Firstly, it is necessary to convert the navigation coordinate system from which cameras obtain data to the photogrammetric coordinate system and then solve for the misalignment and internal orientation elements of the camera. Then, accurate registration is achieved using the least squares matching on pyramid images. The experiment obtained surrounding image data of two common scenes with lens pitch angles of 45°, 55°, 65°, 75°, and 85° using the surveillance camera and obtained a 3D real scene model of each scene using a low-altitude aircraft. The experiment results show that the proposed method in this paper can achieve the expected goals of accurately matching real scene and surveillance camera images and assigning georeference information. Through extensive data analysis, the success rate and accuracy rate of registration are 98.1% and 97.06%, respectively.

1. Introduction

With the rapid progress of urbanization in China, there is video surveillance on urban buildings, roads, military strongholds, factories, and so on [1,2,3], which is responsible for public security management in cities, road control, illegal invasion, and illegal operation. However, the amount of data is massive, making it difficult to observe the region of interest. When the scale of the surveillance system exceeds the monitoring capabilities of humans, security operators must mentally map each surveillance monitor image to a corresponding area in the real world. This progress is very abstract and requires prior training for viewers [4]. Thus, the traditional method of manually watching and analyzing videos is no longer applicable, and intelligent video surveillance systems have emerged as the times require. In recent years, intelligent monitoring devices have developed rapidly and have achieved integration with Geographic Information Systems (GIS). However, there is still a problem of insufficient registration accuracy, resulting in low positioning accuracy.
Although there are thousands of cameras collecting a large amount of data every day [3], their greater role has not been fully realized. The most important drawback is that existing cameras do not have georeference information. Combining the image information obtained by the camera with geographic information, the retrieval of real-time information about a certain location will be obtained quickly. Currently, China is fully promoting digital construction, and the research in this paper provides a significant theory and method for promoting Smart City. With the combination of cameras and geographic information, all cameras will no longer only play a monitoring role; instead, each camera will be a powerful data source and basis for urban resource monitoring, urban security management, forest fire prevention, and other aspects. If a traffic accident occurs somewhere in the city, the relevant surveillance video of the accident location cannot be retrieved quickly without being georeferenced [5]. Similarly, a fire in the forest or the discovery of illegal buildings in a certain location cannot be located quickly. If intelligent monitoring with thermal sensors and actuator systems are integrated, the temperature of the ignition point through thermal sensors can be monitored and provide immediate feedback to the fire department, thereby minimizing losses and even achieving the goal of preventing fires.
Therefore, this paper proposed a camera georeference method based on misalignment calibration and least squares image matching, which solves the problem that the image cannot be quickly and accurately located through the camera and achieves the effect of integrating image information and GIS information [6].
The innovation of this paper lies in proposing a new mathematical model to calculate camera parameters and misalignment parameters, as well as a method to achieve accurate registration of surveillance camera images and real scenes. Rapid and accurate matching of real scene information and surveillance camera information is realized, and the goal of quickly locating a place of interest and retrieving relevant images is achieved [7].
The remaining paper is organized as follows: Section 2 presents related works regarding video surveillance, integration of real scene information and GIS information, and camera calibration. In Section 3, the proposed methods and their key steps in detail are described, including the transformation method of the navigation coordinate system, a method of getting the internal parameters and misalignment parameters, and a method of using the least squares image matching based on pyramid images to achieve accurate registration. In Section 4, the implementation of the proposed method and the obtained experimental results are presented. Finally, Section 5 presents the conclusions and prospects for future research.

2. Related Works

As early as 1942, Siemens AG installed the first video surveillance system in Germany to monitor the launch of V-2 rockets [8]. Later, in order to combat crimes, the US installed video surveillance on its main commercial streets in 1968. The above are all traditional cameras based on a matrix of video displays, maps, and indirect controls. However, the goal of intelligent video surveillance is to efficiently extract useful information from a large amount of video surveillance by automatically detecting, tracking, and identifying objects of interest and understanding and analyzing their activities.
Modern video surveillance systems rely on automation through intelligent video surveillance and better display of surveillance data through context-aware solutions and integration with virtual GIS environments [9]. Souleiman et al. used geospatial data for camera pose estimation and conducted 3D building reconstruction. They proposed a method based on GPS measurement, video sequences, and rough 3D model registration of buildings [10]. Schall et al. proposed a method that relies on GPS and an inertial measurement unit (IMU) to perform camera attitude estimation, thereby enhancing the visualization of underground GIS infrastructure applications in reality [11]. Lewis et al. made use of georeferenced video data and focused on using Viewpoint data structures to represent video frames to enable geospatial analysis and considered the potential of spatial video as video data to represent georeferencing [12]. Xie et al. proposed the integration of GIS and moving objects in surveillance videos by using motion detection and spatial mapping [13]. Robert T. Collins et al. proposed a VSAM testbed system based on video surveillance and monitoring data for three years. The system can achieve automatic tracking of targets [4]. The purpose of the above work is to achieve the integration of image information and GIS information, with the aim of enhancing reality; however, they cannot achieve accurate matching between the real scene and surveillance camera images.
In terms of camera calibration work, Zhang proposed a simple camera calibration technique to determine radial distortion by observing a planar pattern shown at a few different orientations [14]. Lee and Nevatia developed a video surveillance camera calibration tool for urban environments that relies on vanishing point extraction [15]. Vanishing points are easily obtainable in urban environments since there are many parallel lines, such as street lines, light poles, buildings, etc. The calibration of environmental camera images by means of the Levenberg—Marquardt method has been studied by Muñoz et al. [16]. Although these correction methods are good, they do not have universality. Based on the characteristics of information obtained from real scenes and surveillance camera images, a new mathematical correction model to solve camera parameters is proposed in this paper.
In the research on automatic feature point detection, many people have compared and analyzed various extraction algorithms [17,18,19]. In addition, F Remondino et al. proposed that image matching was one of the key steps in 3D modeling and mapping in 2014 [20]. Saleem et al. conducted a study between remote sensing images and UAV imagery in 2016 [21]. In 2017, Xiaohui Yuan et al. proposed a method that uses a time-of-flight camera to detect the feature points and action tracking [22].
Although many people have proposed some good ideas and put them into practice, there are still many shortcomings.
Over the same field, they were using different feature points and determining their performance:
  • For traditional monitoring, when the scale of the surveillance system exceeds the monitoring capabilities of humans, security operators must mentally map each surveillance monitor image to a corresponding area in the real world [9];
  • This method is manually operated, so it has great automation potential;
  • This method is unable to achieve accurate registration of images and actual ground.
Our research can overcome the above problems, achieve the integration of image information and real scenes, and achieve fast and accurate matching. In recent years, our country has vigorously developed digitization, and the research can provide powerful theories and methods for the progress and development of digital cities, especially making important contributions to China’s social development and urban progress.

3. Methods

In order to achieve accurate registration of surveillance camera images and real scenes, the first step is to convert the position and attitude parameters obtained by the surveillance camera into a photogrammetric coordinate system. The second step is to calibrate the camera and misalignment parameters. Then, the surveillance camera images and real scenes are accurately registered using least squares matching based on geometry priors. The framework of the integration of surveillance video images and real scenes is shown in Figure 1.

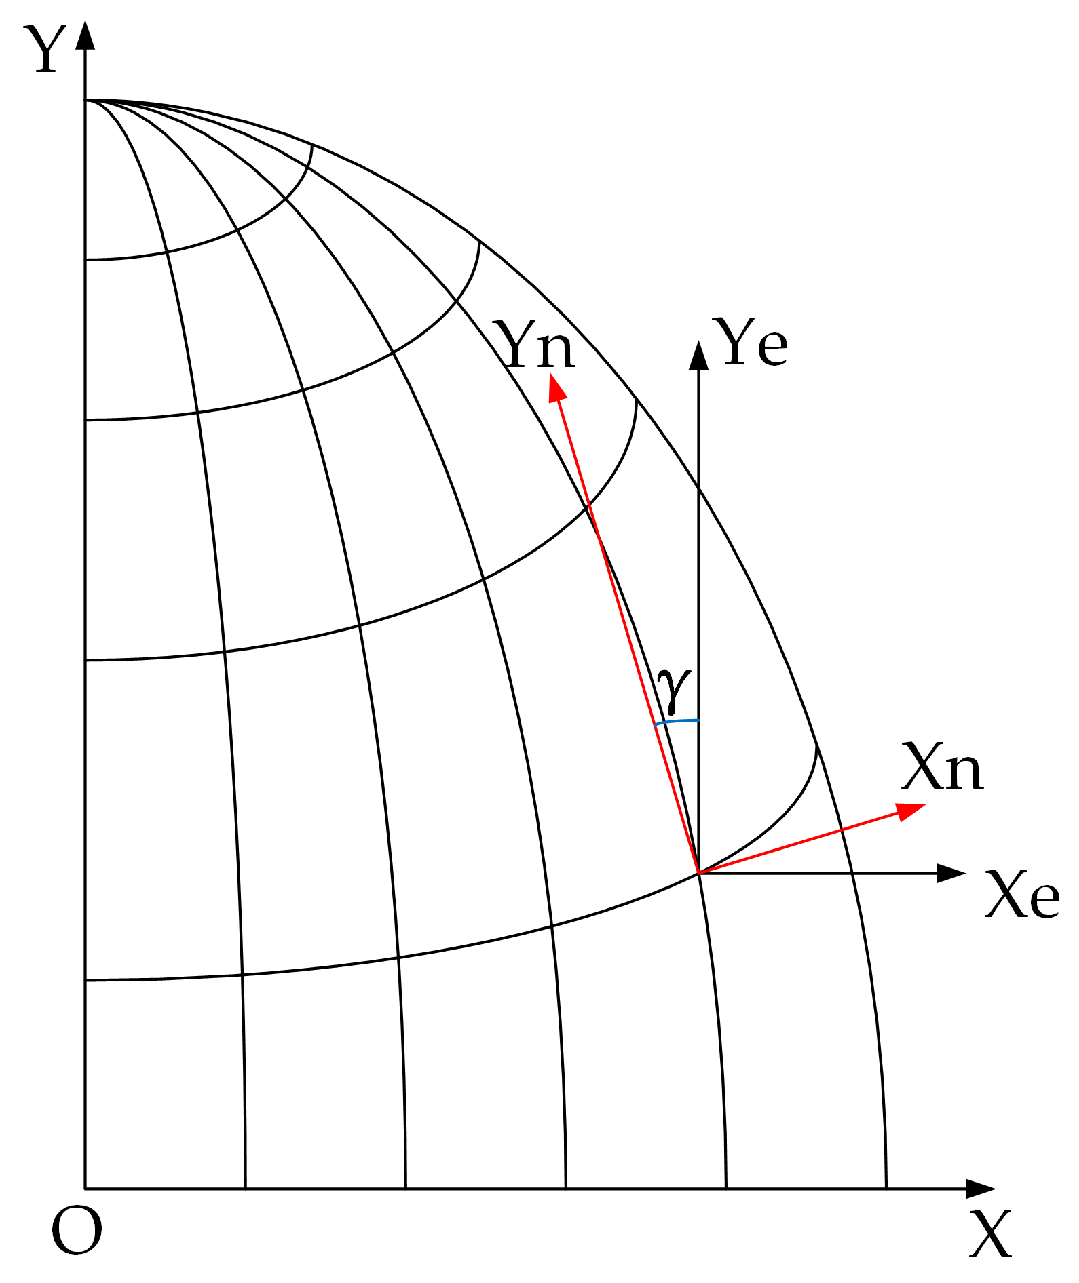
3.1. Coordinate System Transformation for Surveillance Video

In the process of the surveillance camera collecting data, the position and attitude recorded by the surveillance equipment are based on the navigation coordinate system [23]. However, the actual application is under the map projection frame, so the navigation coordinate system needs to be converted into the photogrammetric coordinate system.
Generally, the navigation coordinate system is represented by Yaw, Pitch, and Roll, while the exterior orientation parameters (EOs) of each image frame in the photogrammetric coordinate system are generally represented by ω, φ, κ, referred to as the OPK angle system. In order to convert the (Yaw, Pitch, Roll) into the (ω, φ, κ), the definition of different coordinate systems and rotation angles must be considered. The reference frames and their representation used in this paper are shown in Table 1.
In addition, it is necessary to consider the mapping system used, as well as the impact of the curvature and meridian deviations of the Earth on the angle [24]. The z-axes of the navigation coordinate system and the projection coordinate system both point upward along the ellipsoidal normal, but the y-axis of the navigation coordinate system points toward the true north direction, while the y-axis of the projection coordinate system points toward the grid north direction. Both x-axes are perpendicular to the plane composed of their respective y-axis and z-axis. And the relationship between the navigation coordinate system and the projection coordinate system is shown in Figure 2.
The meridian deviation mainly affects the orientation relative to geographic orientation [24], and the computational formula of the meridian deviation is as follows:
γ = cos β t λ + 1 3 cos 3 β t ( 1 + 3 η 2 + 2 η 4 ) λ 3 + 1 15 cos 5 β t ( 2 t 2 + 15 η 2 15 η 2 t 2 ) λ 5 + 1 315 cos 7 β t ( 17 26 t 2 + 2 t 4 ) λ 7 + O ( λ 7 )
where t = tan β , η = e cos 2 β , and e is the second eccentricity. β is the latitude of the projective point and λ is the longitudinal difference between the projective point and central meridian of the universal transverse Mercator (UTM)-coordinate system.
Due to the meridian deviation, there is a distortion in the north direction, and this distortion is recorded as γ . To eliminate the effects of the meridian deviation, the coordinate system must be rotated γ around the Zn-axis. Therefore, a transformation matrix is required to compensate for the meridian deviation. Where g’ is the navigation coordinate system that has eliminated the meridian convergence
R g g = [ cos γ sin γ 0 sin γ cos γ 0 0 0 1 ]
The lower index of all the following formulas represents the original system, while the upper index represents the target system.
Due to the different directions of the coordinate axes in navigation and in photogrammetry, two additional transformation matrices are needed to obtain an equivalent oriented system, namely from the body coordinate system (u) to the camera coordinate system (c) and from the projection coordinate system (s) to the navigation coordinate system that has eliminated the meridian convergence (g’). The two transformation matrices are shown as follows:
T u c = T s g = [ 0 1 0 1 0 0 0 0 1 ]
And from the navigation coordinate system (g) to the body coordinate system (u) is as follows:
R g u = [ 1 0 0 0 cos ϕ sin ϕ 0 sin ϕ cos ϕ ] [ cos θ 0 sin θ 0 1 0 sin θ 0 cos θ ] [ cos ψ sin ψ 0 sin ψ cos ψ 0 0 0 1 ]
where ϕ is Yaw, θ is Pitch and ψ is Roll.
Combining the above transformation matrices can get the rotation matrix R s c of photogrammetry, which is made up of the attitudinal angles of images (φ, ω, κ) as follows:
R g c = T u c R g u R g g T s g

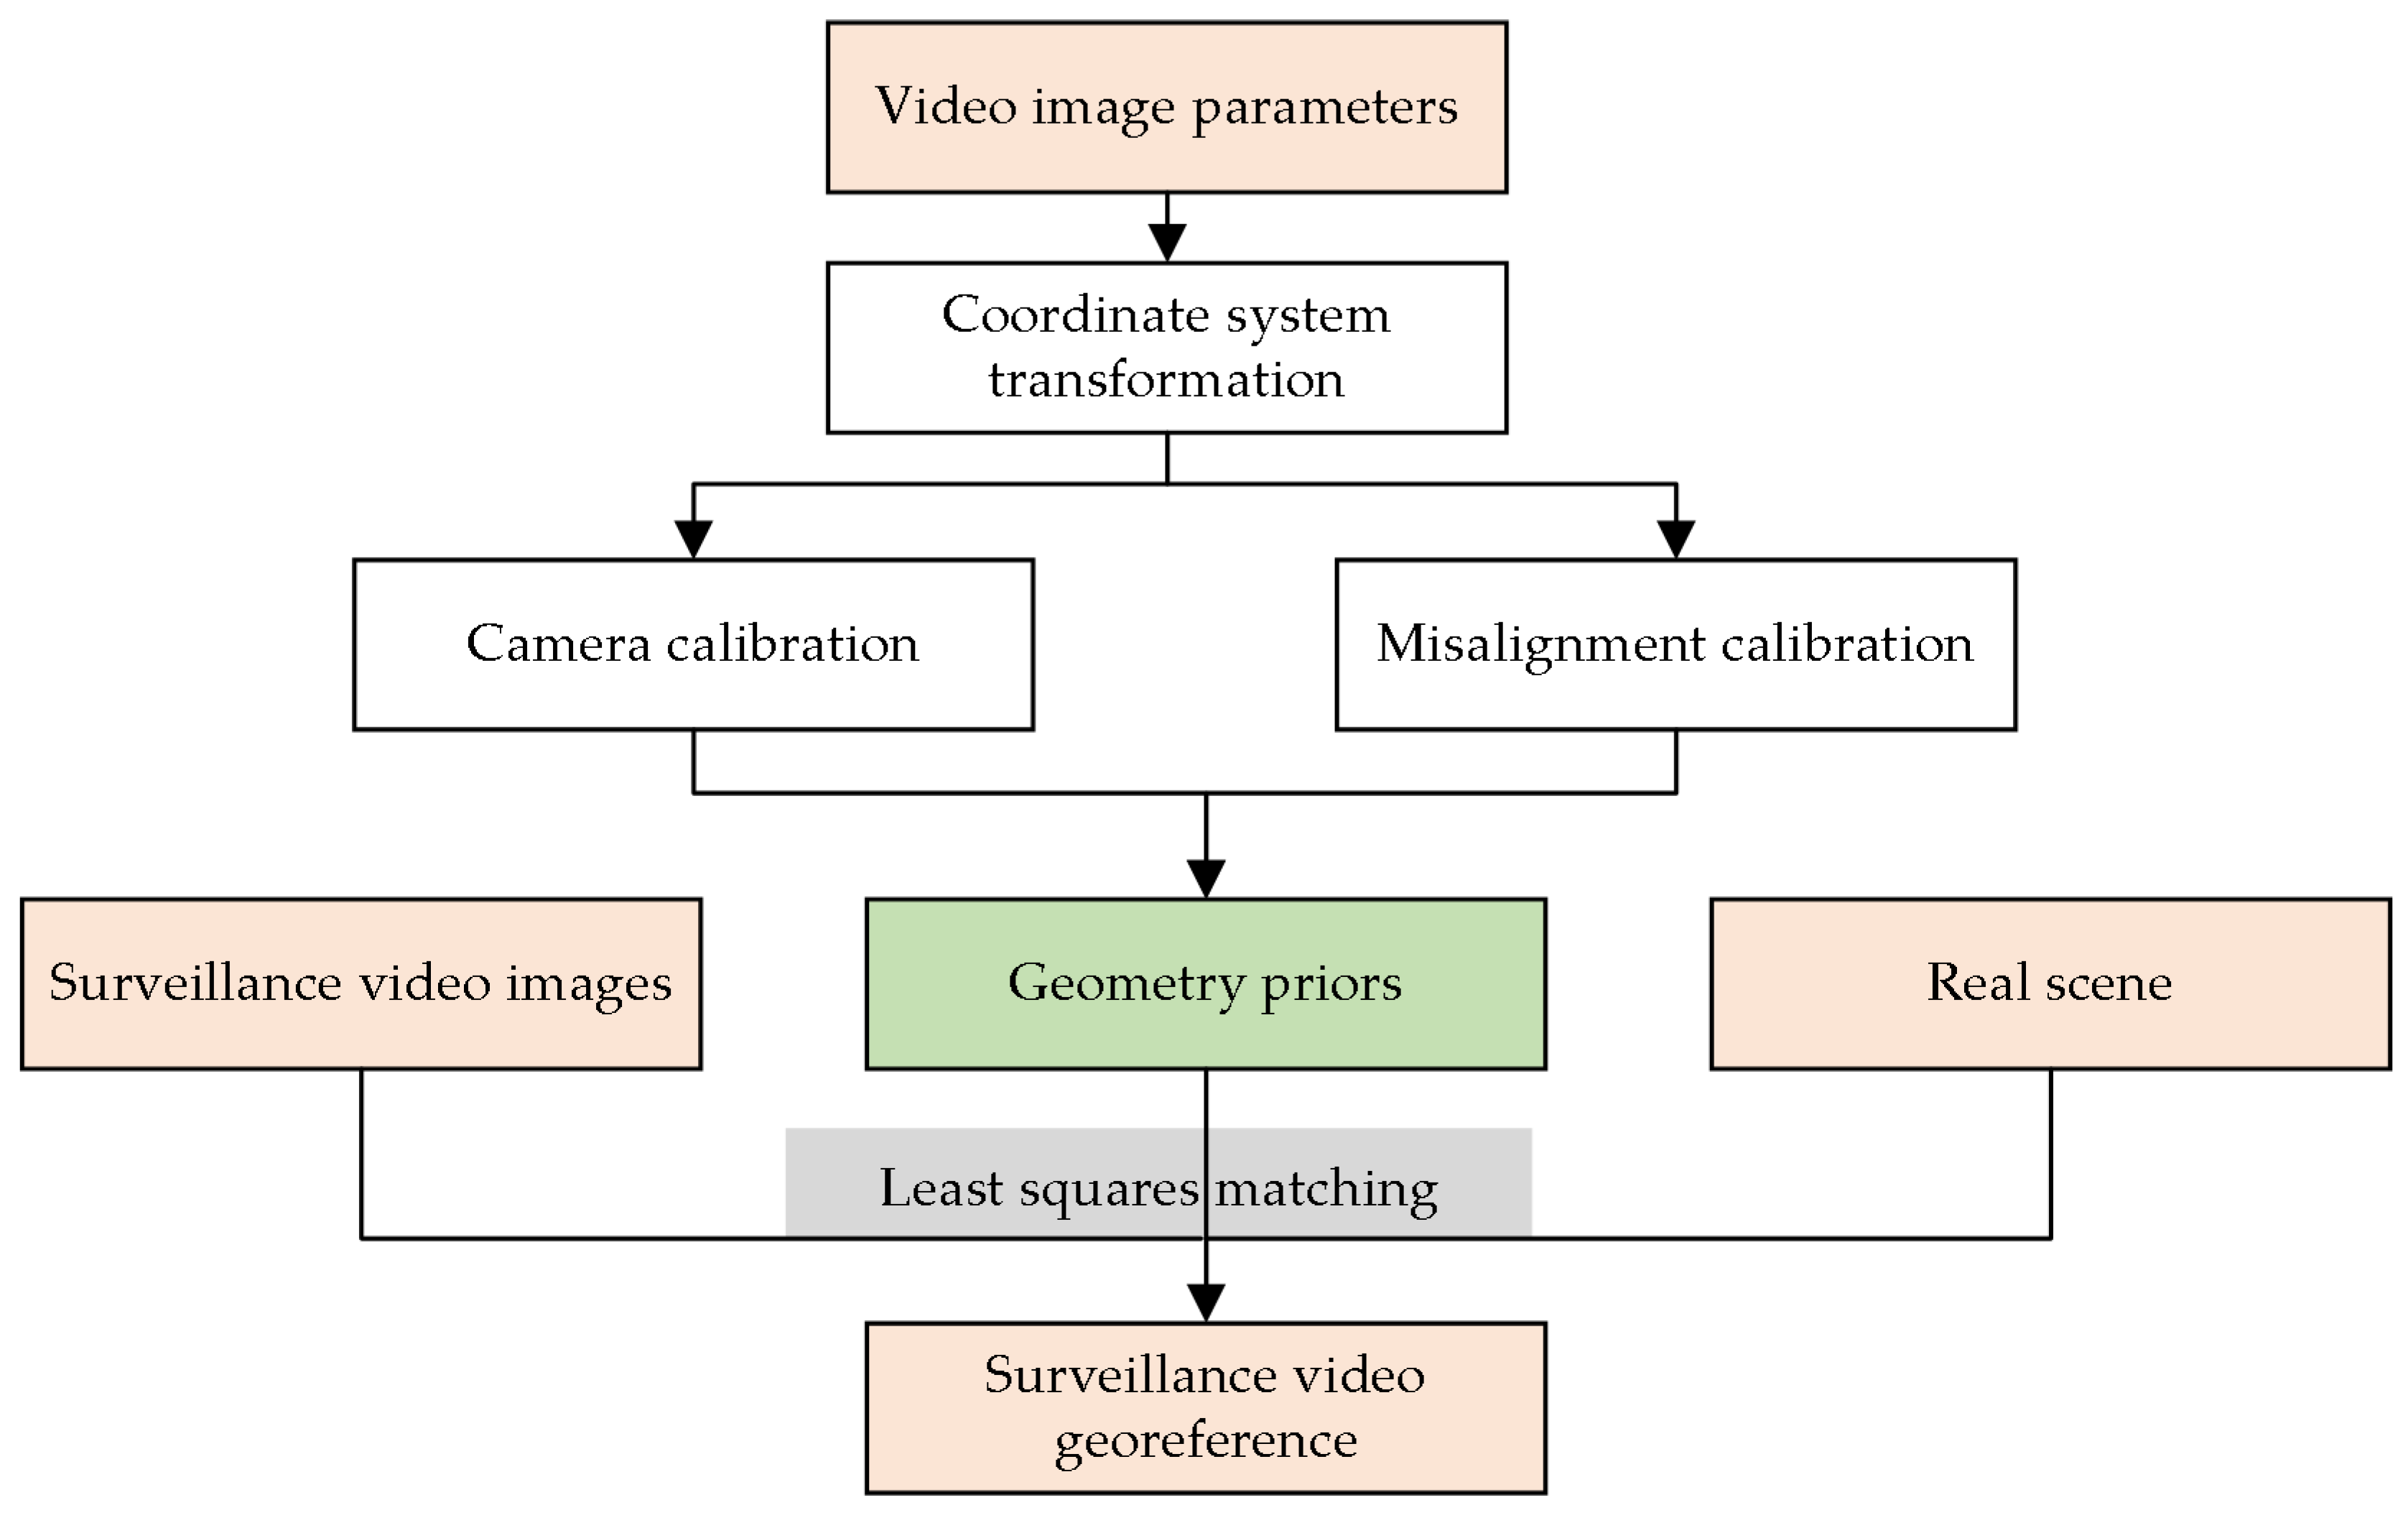
3.2. Surveillance Video Georeference Method

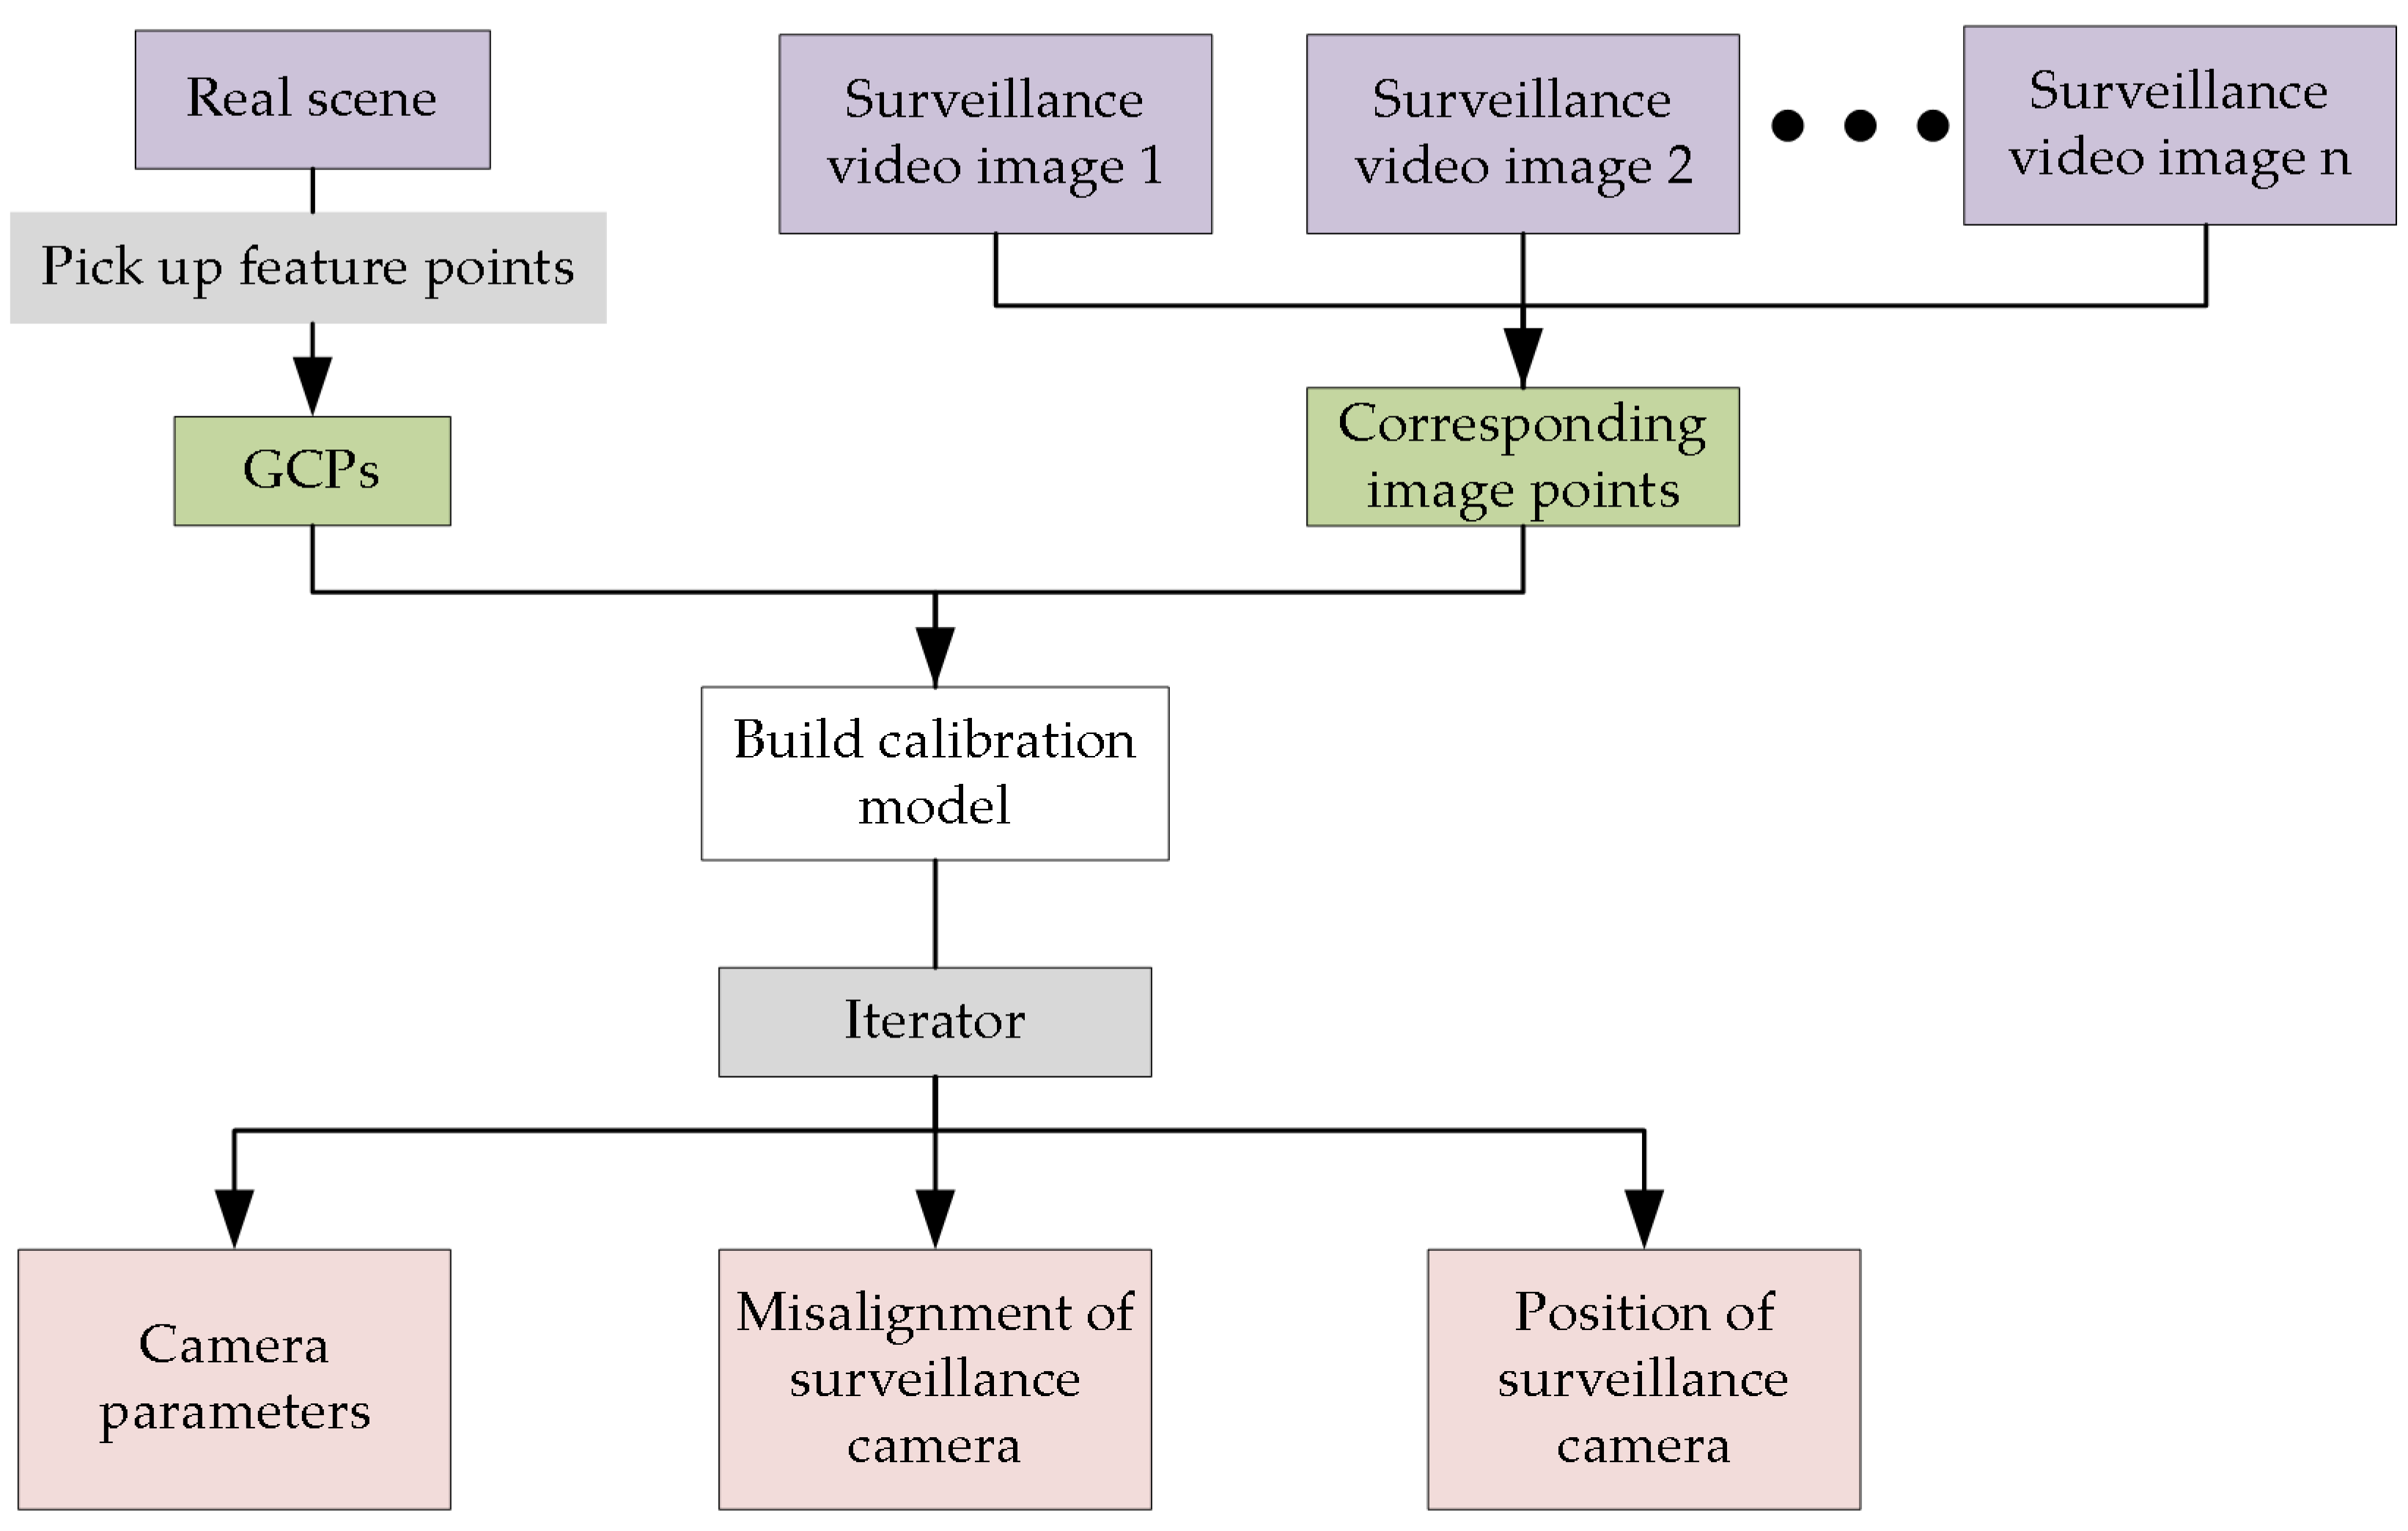
3.2.1. Camera and Misalignment Calibration for Surveillance Video

The calibration method in this paper is to use existing real scenes to pick up control points. The real scenes used in this paper are all obtained from drone images processed by ContextCapture to ensure their accuracy. However, due to the low resolution of the existing real scene model, very few feature points are extracted in weak texture regions. Relying solely on a single camera to obtain control points in one direction is not sufficient for camera calibration, so we need to obtain surrounding image data. The entire solution process model is shown in Figure 3.
The surveillance camera records the relative attitude R r e l between images with high accuracy. Moreover, due to various uncertainties during installation, the camera may have misalignment, resulting in the camera not being horizontal or not pointing to the specified zero direction. Only the camera parameters, the misalignment of the surveillance camera, and the position of the surveillance camera are considered unknowns. The initial value of the camera parameters can be obtained by the EPnP method [25]. Based on the principle of spatial resection, the model of calibration can be conducted as:
[ X Y Z ] = λ R m i s R r e l [ x x 0 y y 0 f ] + [ X S Y S Z S ]
where ( X , Y , Z ) is the coordinate of the ground control point and λ is the scaling factor. The corresponding image point ( x , y ) is the observation. The unknowns include principal distance f , principal point ( x 0 , y 0 ) , perspective center ( X S , Y S , Z S ) and misalignment R m i s . The R m i s is the rotation matrix that rotates from the placement direction to the zero direction. From the above analysis, it can be seen that this equation has nine unknowns, and each ground control point corresponds to a coordinate observation value of an image point. Two error equations can be formulated, so it is required to solve this equation with at least five non-coplanar and relatively evenly distributed control points. Take Mount Tai Square of Shandong University of Science and Technology from a low-altitude aircraft as an example. The schematic diagram is shown in Figure 4.
Linearize the above equation to obtain the error equation, and the result is shown in Equation (7). The initial values of the following parameters are φ m i s = 0 , ω m i s = 0 , κ m i s = 0 , x 0 = w i d t h / 2 , y 0 = h e i g h t / 2 , the initial values of f is the focal length of the camera, and the initial values of other parameters can be provided using the triangulation method. φ m i s , ω m i s , κ m i s are the three angles for misalignment angle, L denotes the constants, and A , B , C are coefficient matrices.
v = A [ d φ m i s d ω m i s d κ m i s ] + B [ d x 0 d y 0 d f ] + C [ d X s d Y s d Z s ] L
Then, simplify the above equation; the matrix form of the error equation can be expressed as Equation (8). And the normal equation is conducted as Equation (9).
V = A X 1 + B X 2 + C X 3 L
[ A T A A T B A T C B T A B T B B T C C T A C T B C T C ] [ X 1 X 2 X 3 ] = [ A T L B T L C T L ]
Solving the normal equation can obtain X 1 , X 2 and X 3 , which includes the internal parameters and the EOs for the first image. The correction values are added to their initial values, and the process is iterated until the obtained correction values are smaller than the allowable error.

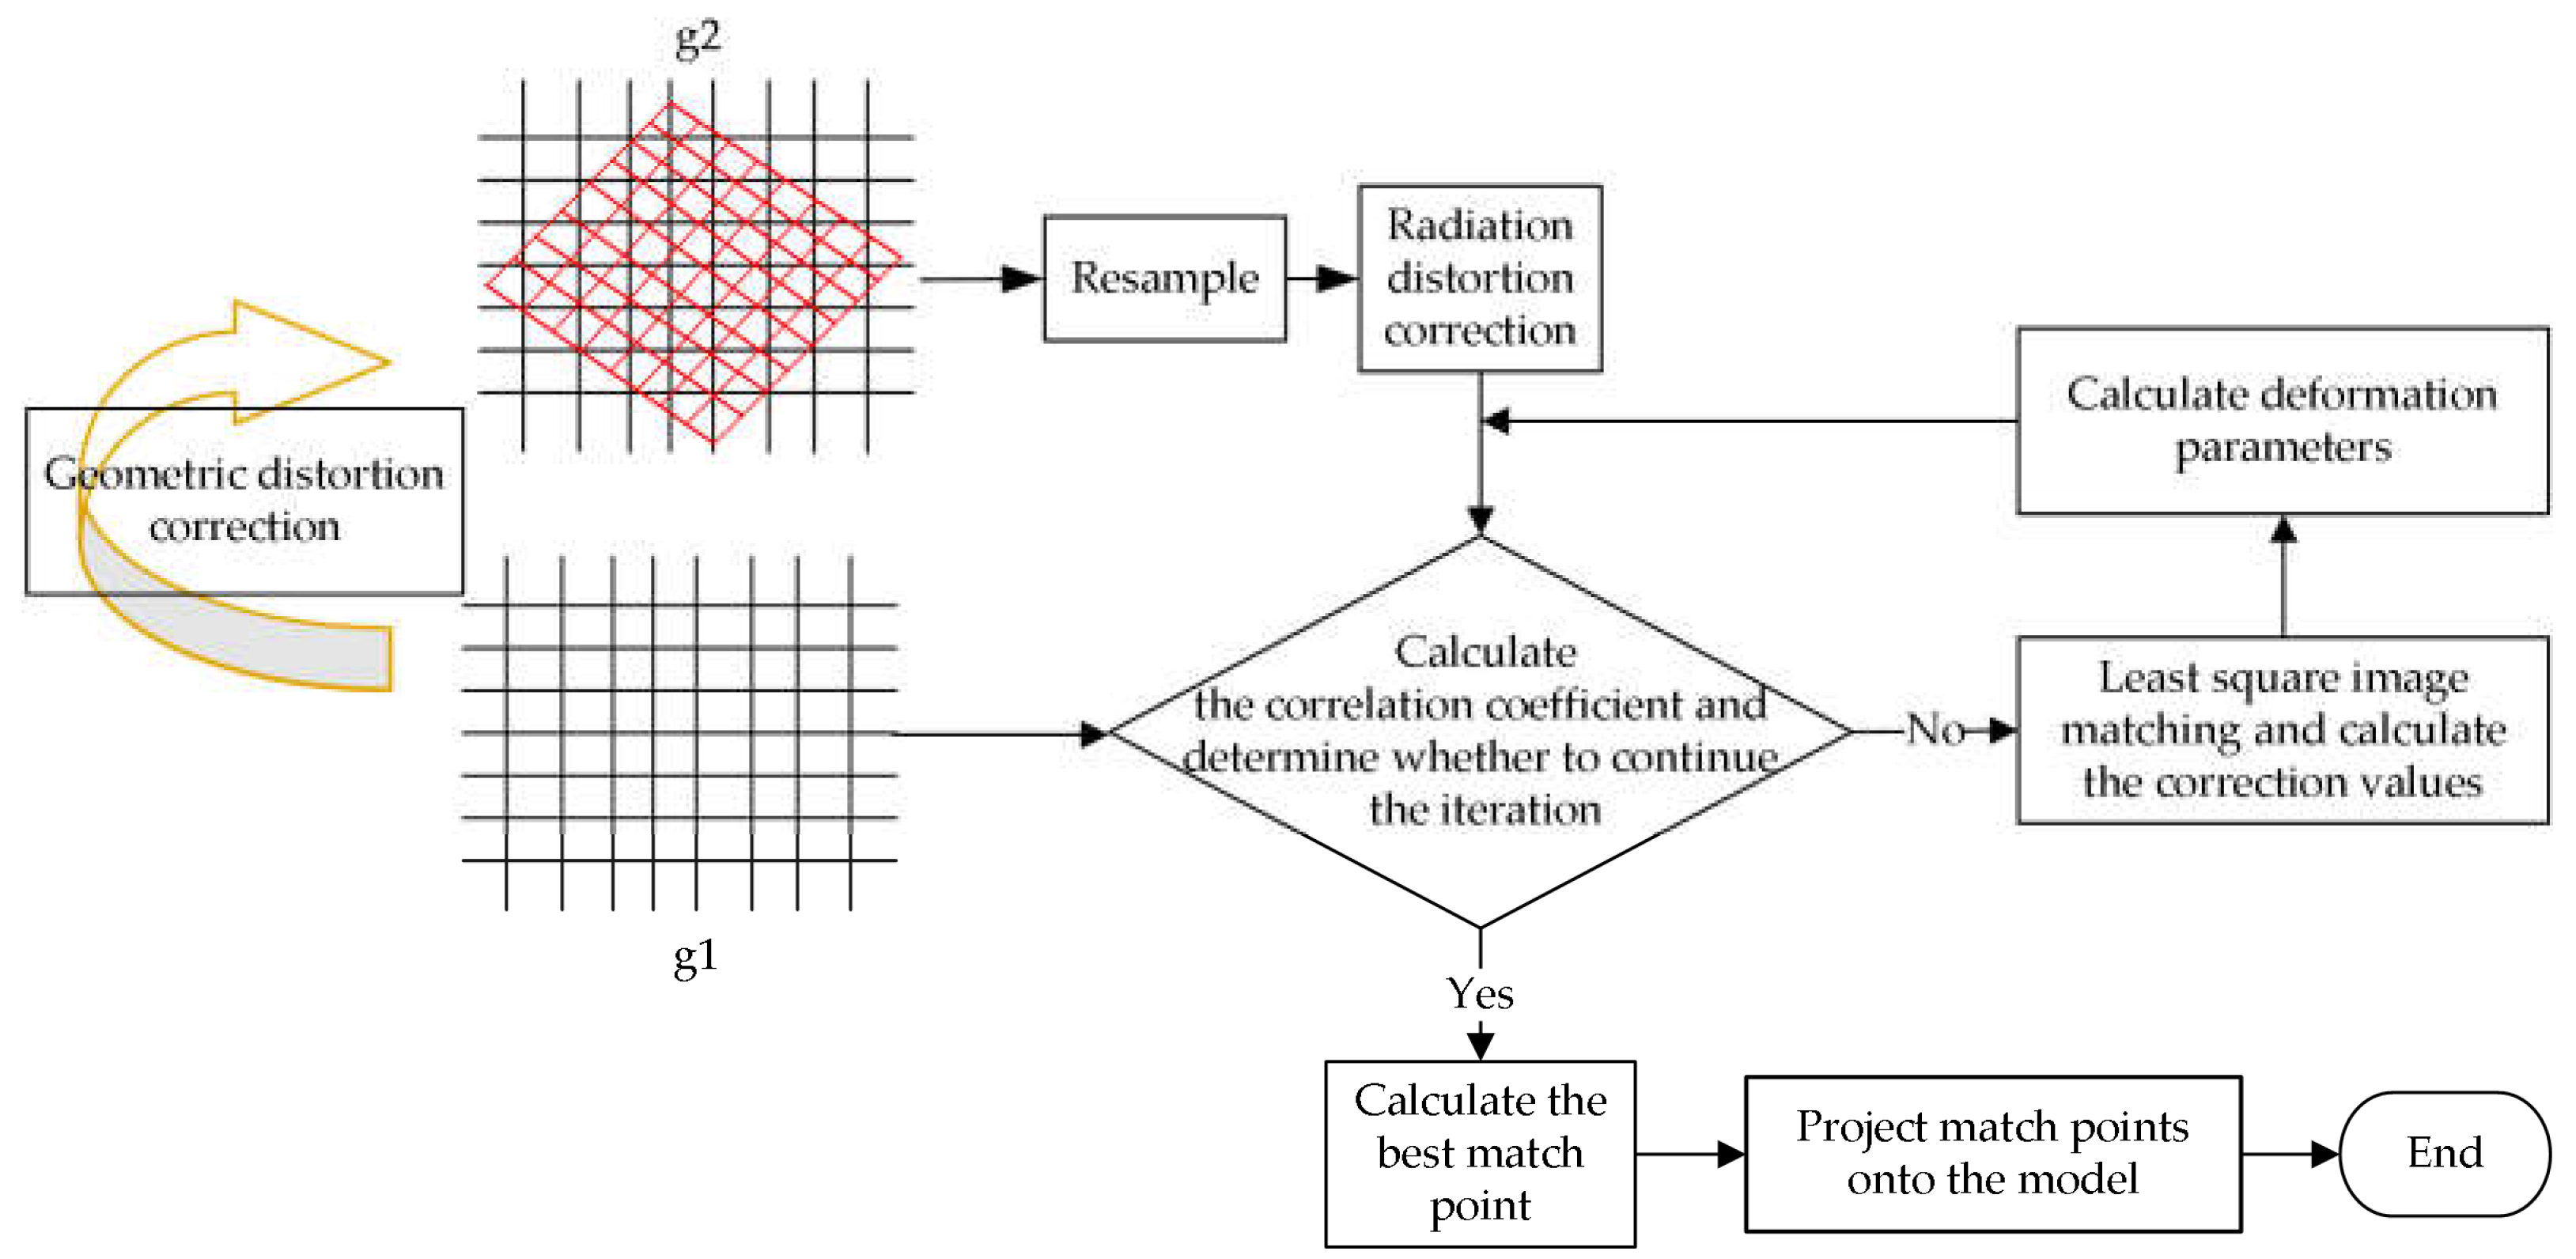
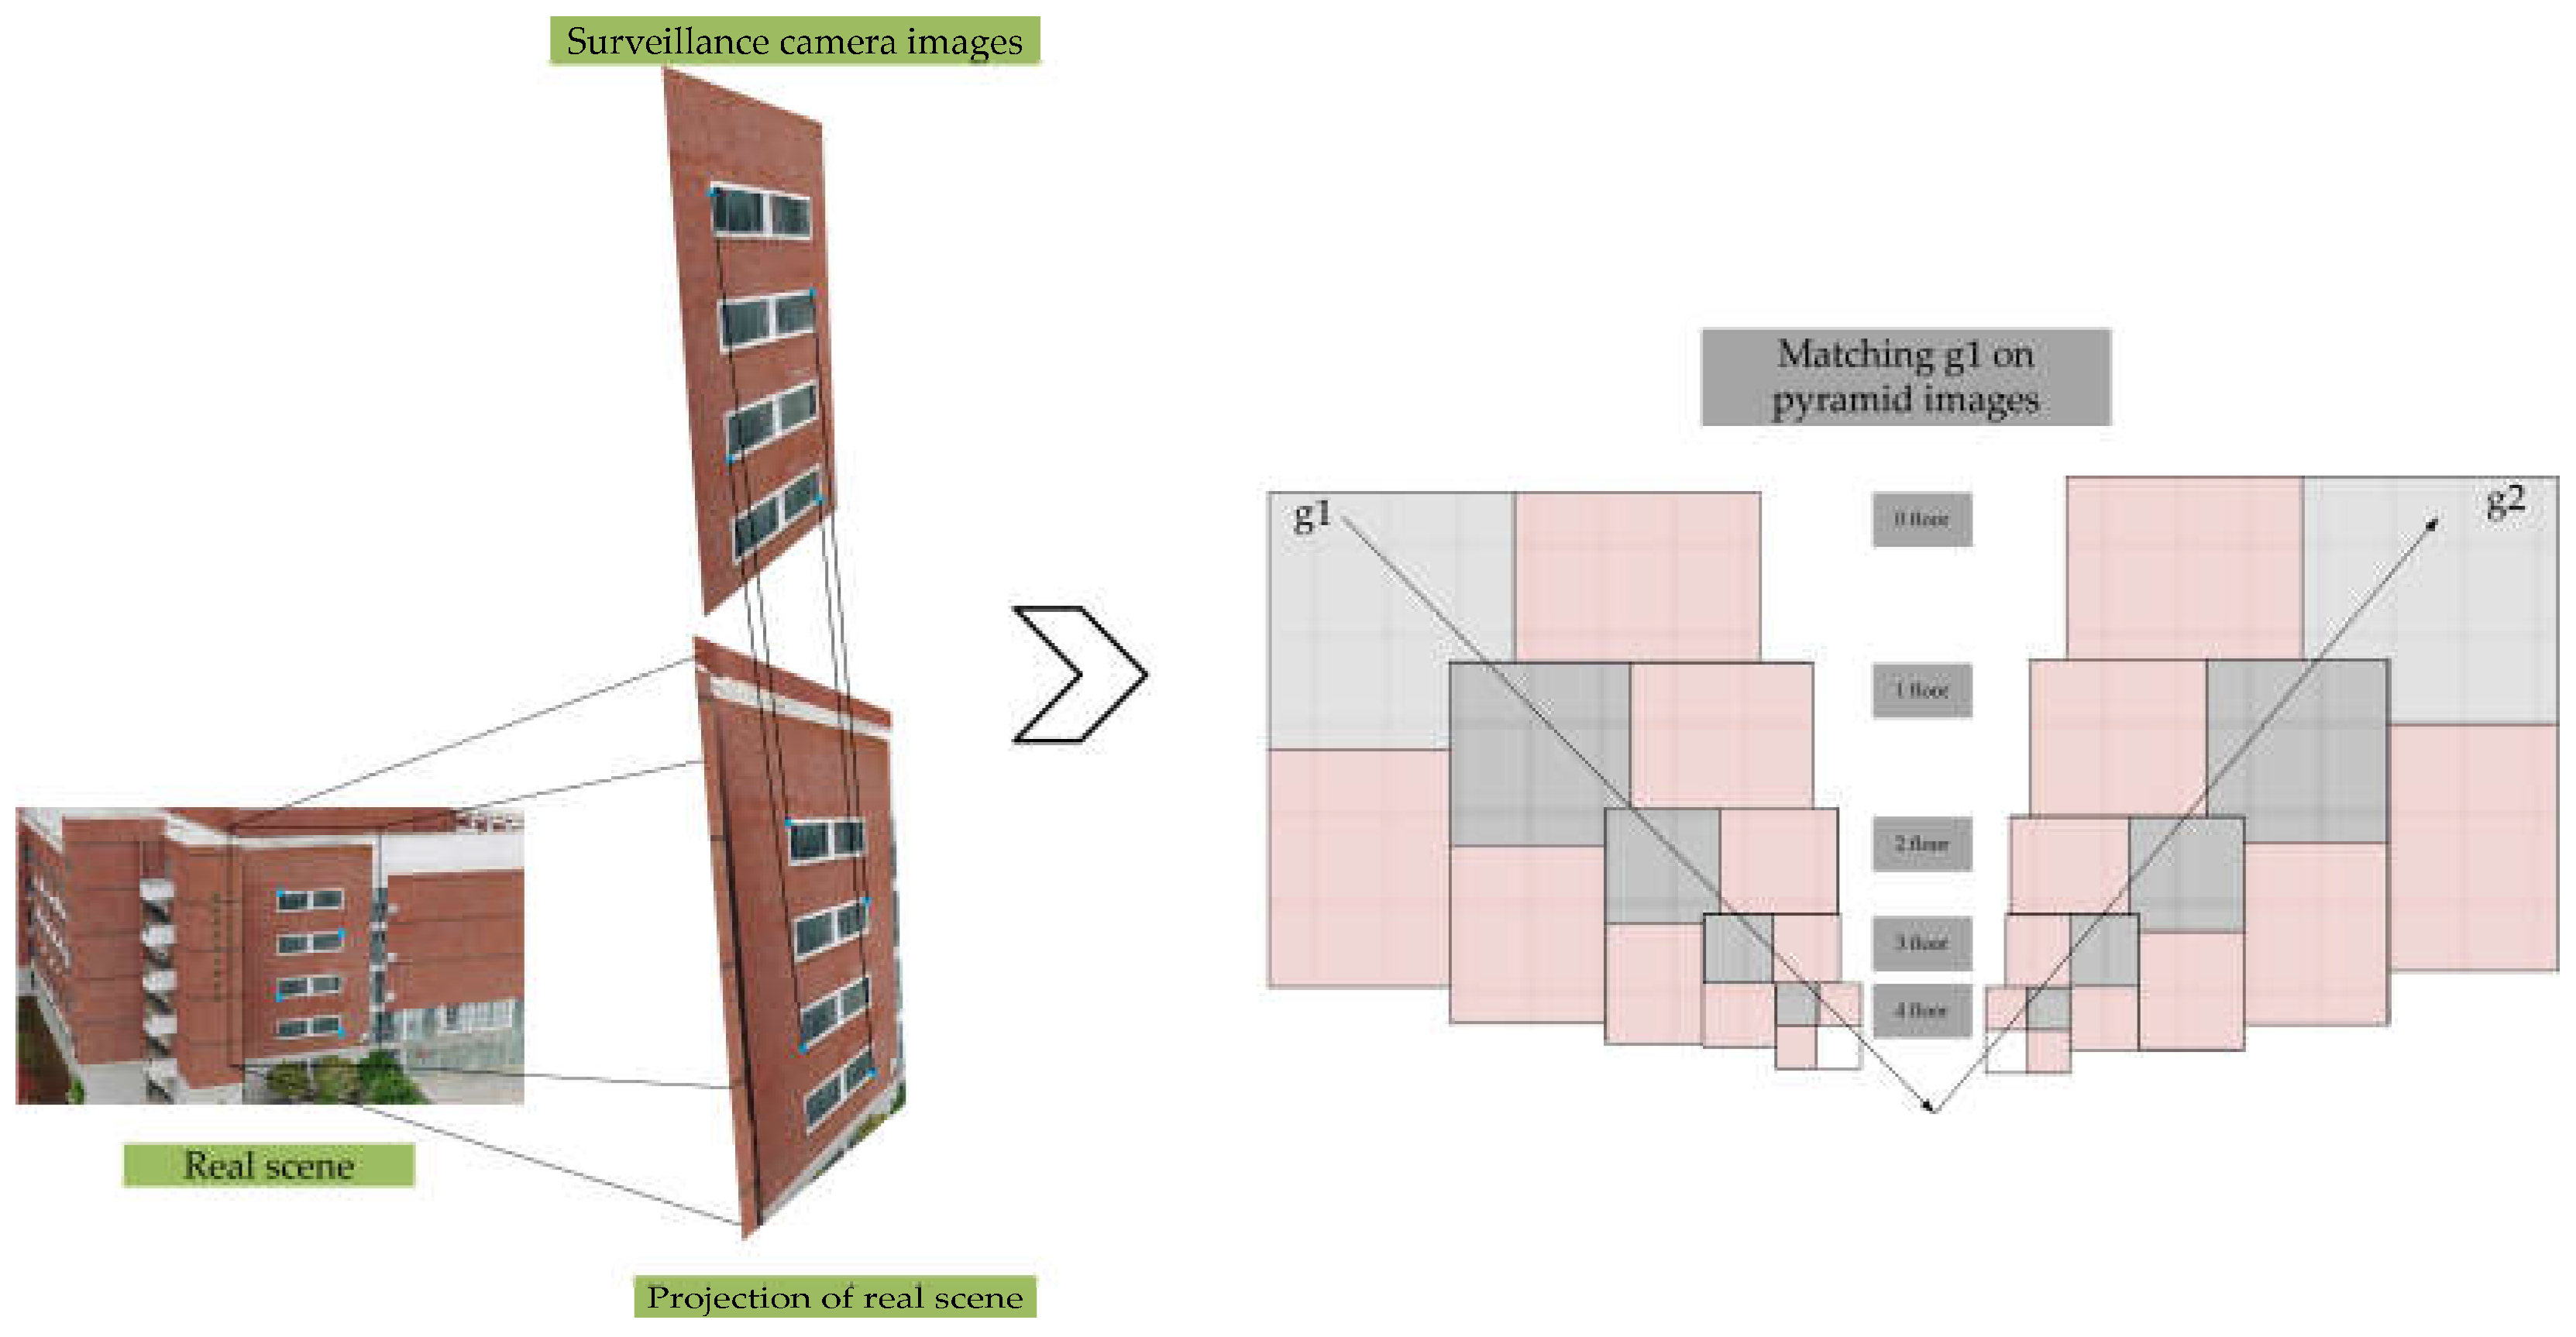
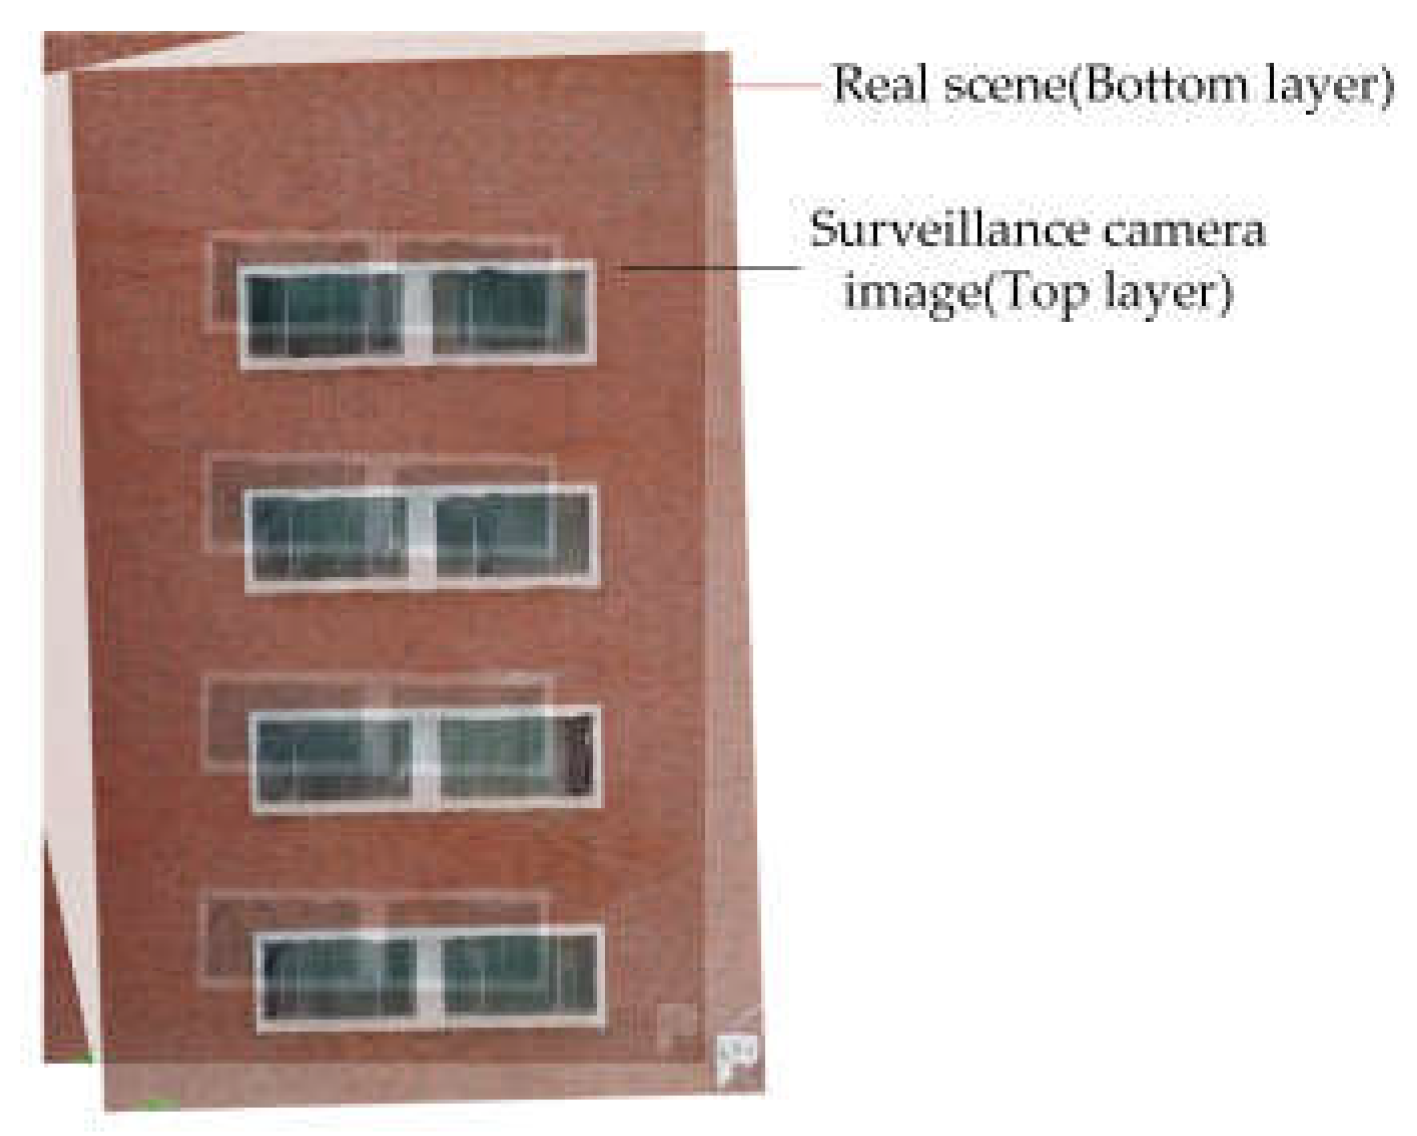
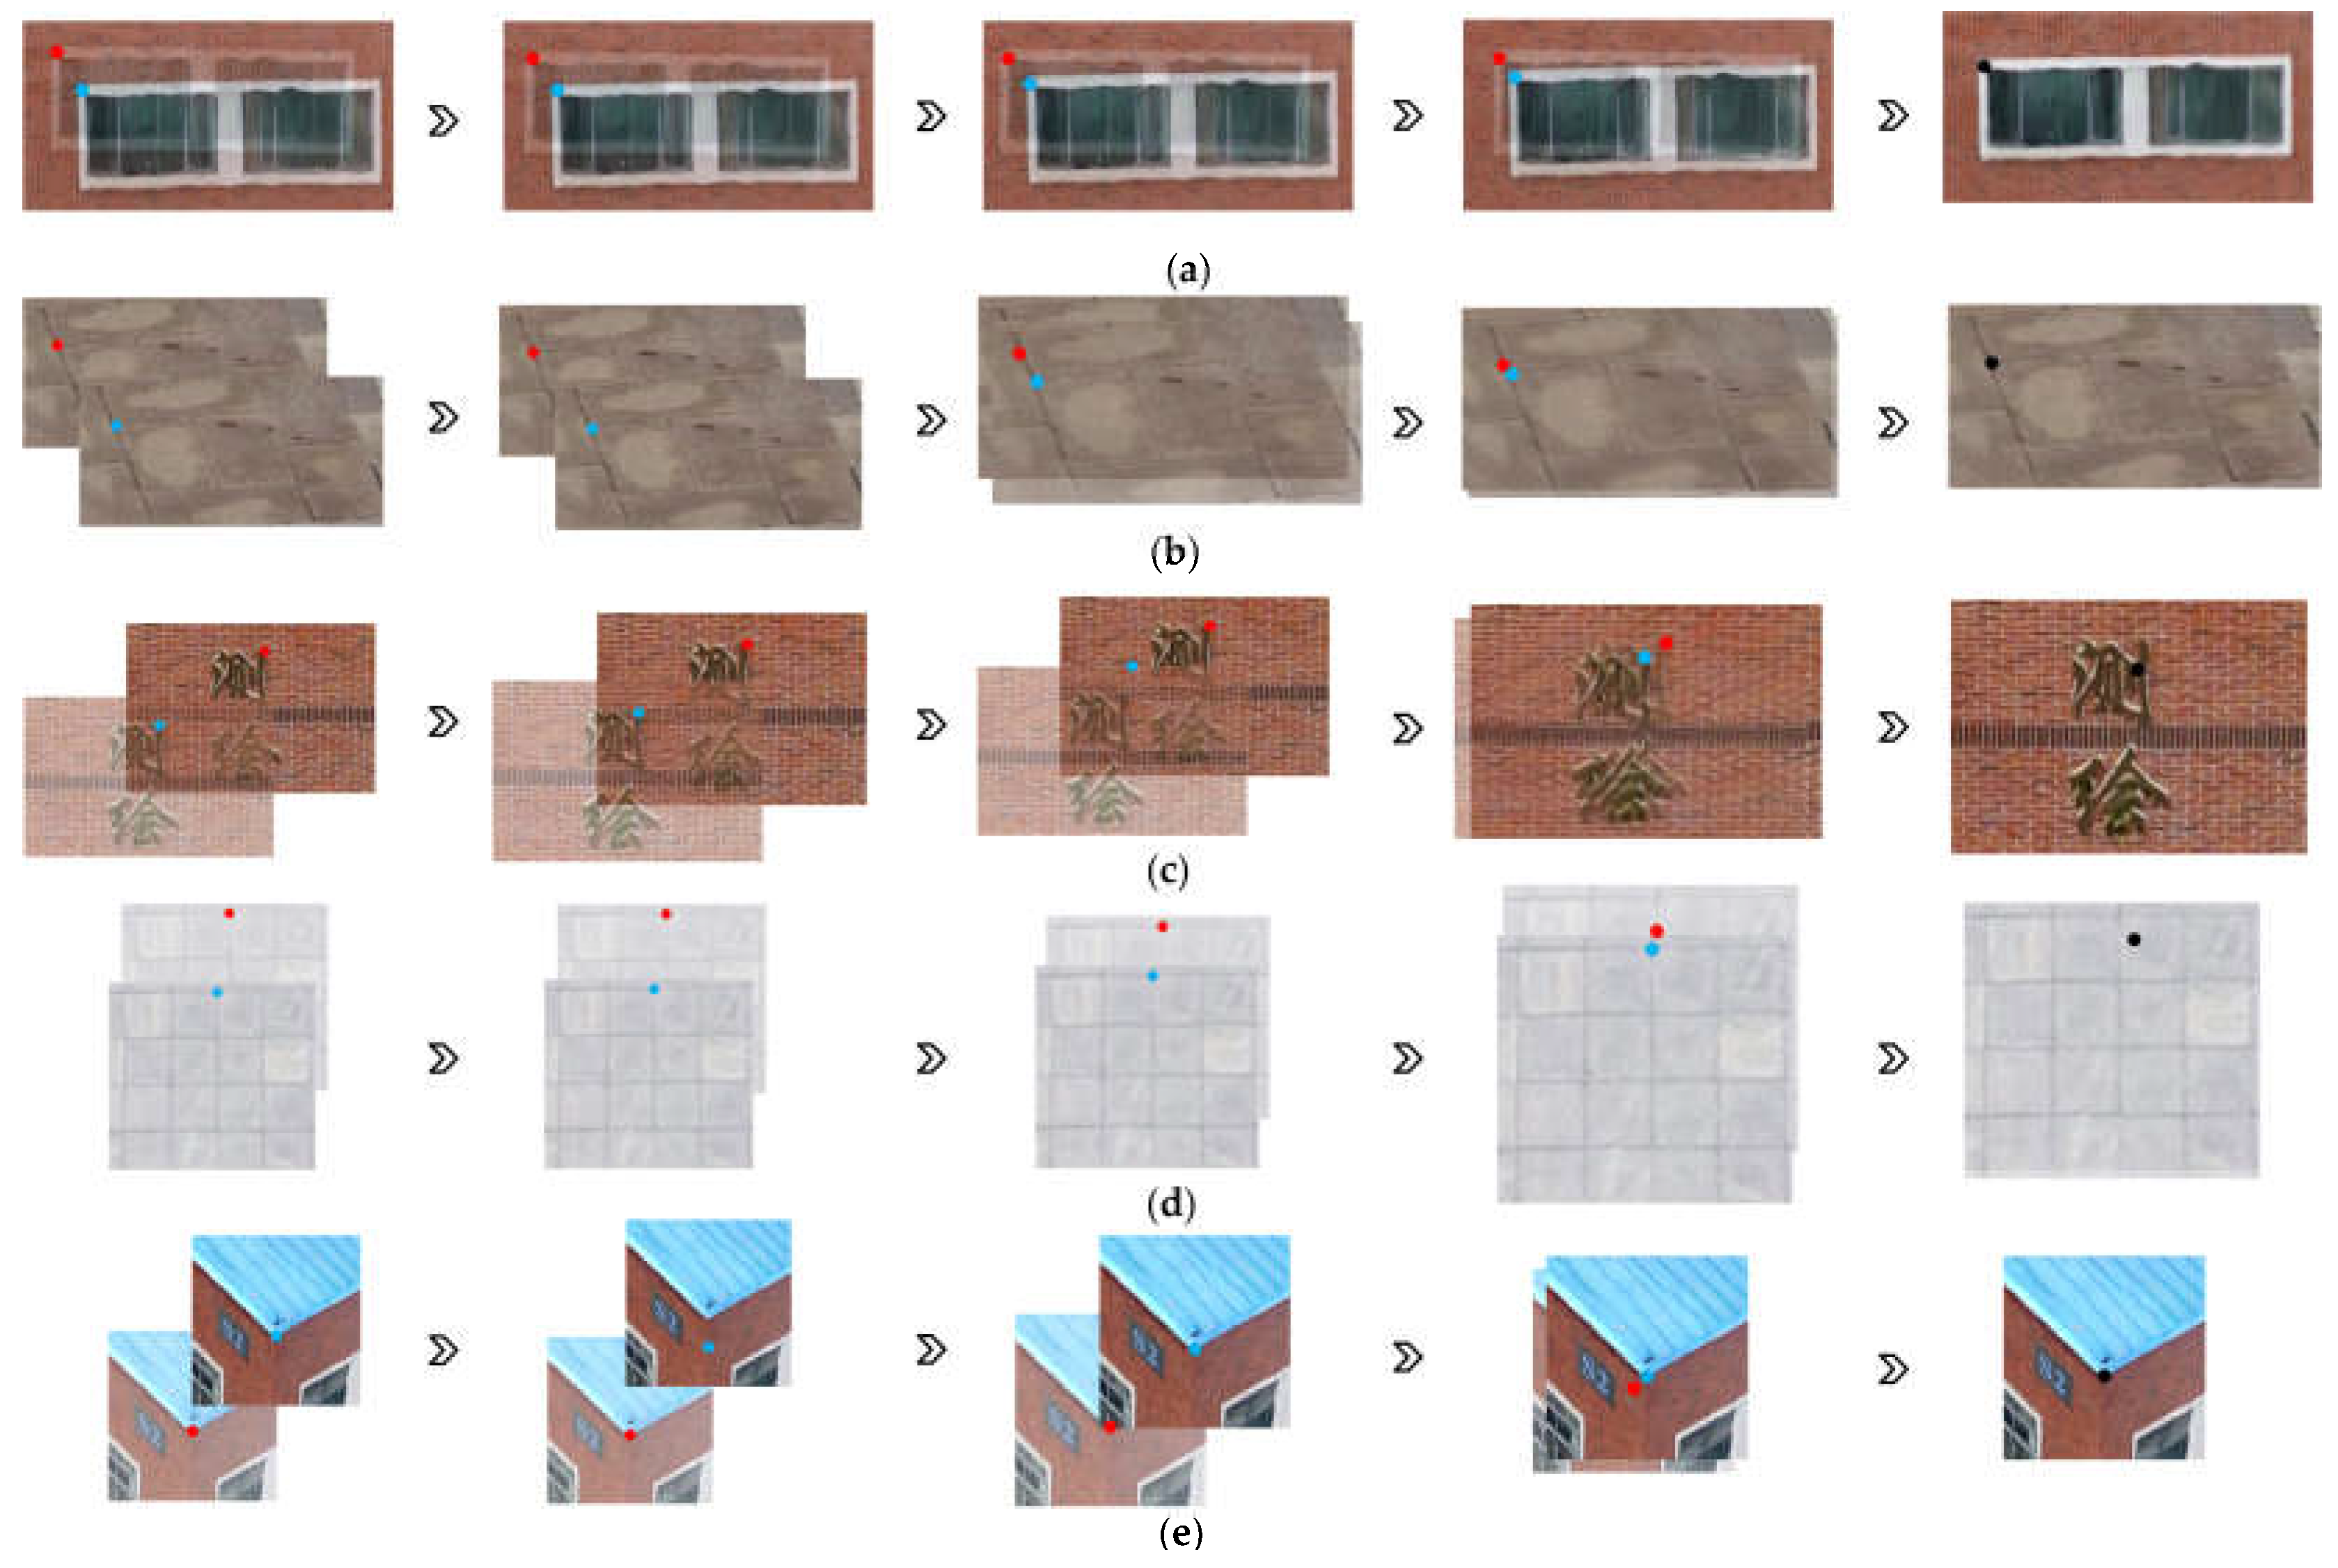
3.2.2. Accurate Registration Method with Geometry Priors

After calibration, preliminary registration of surveillance camera images and real scenes has been achieved, but due to residual attitude angle errors in the previous step, strict registration cannot be achieved. Therefore, it is also necessary to use the least squares method for accurate registration. The least squares image matching process is shown in Figure 5.
Considering the fact that projected images of real scenes may have linear gray-scale distortions compared to images captured by cameras; therefore,
g 1 ( x , y ) = h 0 + h 1 g 2 ( a 0 + f ( x ) , b 0 + f ( y ) )
where g 1 ( x , y ) represents a point on the camera image, g 2 ( a 0 + f ( x ) , b 0 + f ( y ) ) represents a point on the real scene, h 0 and h 1 is the radiation deformation correction parameter, a 0 and b 0 is the offset, f ( x ) is the x-coordinate of the point on the real scene, f ( y ) is the y-coordinate of the point on the real scene. Linearizing the equation, the error equation for least squares image matching can be obtained:
v = c 1 d h 0 + c 2 d h 1 + c 3 d a 0 + c 4 d b 0 Δ g
The initial value is set as: h 0 = 0 , h 1 = 1 , a 0 = 0 , b 0 = 0 and the observed value Δ g is the gray-scale difference of the corresponding pixels. Next, solve the coefficients of the error equation representing Equation (11) in matrix form and perform a normalization solution. Finally, compare the obtained correction number with the tolerance to determine whether to continue the iteration.
Accurate matching can be achieved by completing the above operations, but in the face of large data volumes, the matching efficiency will be greatly reduced. Therefore, pyramid image matching is considered. By constructing pyramid images, a matching strategy from top to bottom and from coarse to fine is adopted to achieve fast and accurate image matching. The basic principle is that due to low-pass filtering and sampling, the top of the pyramid retains the most obvious, energy-intensive, and large feature structure features. However, small-scale and weak textures are annihilated by multiple smoothing. Because the top of the pyramid is an image generated after multiple filters, mainly including low-frequency components. Therefore, feature matching at the highest level of the pyramid is more robust for features that are structurally large and have strong contrast. The projected image can be obtained by rasterizing the triangular mesh of the real scene. There is a function named “Raster” that can convert a triangular mesh into a depth map in OpenMVS. Based on this, the texture can be projected onto the image to ensure its projection accuracy. The entire accurate registration process is shown in Figure 6.

4. Results and Discussion

4.1. Description of Experimental Equipment

The surveillance camera equipment used in this experiment is DH-SD-8A1440XA-HNR, with a minimum focal length of 5.5 mm and a maximum focal length of 220 mm. It is equipped with a 1/1.8-inch CMOS sensor in which the image size is 2560 × 1440, and the pixel size is about 1.97 μm. It has a range of 61.4 to 2.27° horizontal and 35.99 to 1.3° vertical field of view (FOV). The heading angle can rotate continuously from 0 to 360°, and the pitch angle range is between −30 and 90° for continuous monitoring. The experimental equipment parameters are shown in Table 2
To verify the performance of the proposed method, systematic experiments and analyses are performed in this paper using surveillance camera equipment. In this experiment, surrounding image data with lens pitch angles of 45°, 55°, 65°, 75° and 85° of two common scenes are obtained, including Mount Tai Square and the south gate of Shandong University of Science and Technology. At the same time, 18 images are obtained for each pitch angle. The experimental equipment and study areas are shown in Figure 7.

4.2. Result and Analysis of Camera Calibration

Considering some weak texture fields, feature point extraction is difficult. And the limited feature points obtained by the camera in a single direction it is not sufficient for camera calibration. Therefore, the method of obtaining surrounding image data is adopted to solve the problem. Next, take Scene 1 as an example; by picking eight feature points (g1, g2, g3, g4, g5, g6, g7, g8) on a 3D real scene model and the camera captured a total of six images by obtaining surrounding image data. On the 3D real scene model, the selected feature points on the plane can obtain the control point coordinates with an accuracy of about 2 cm. At the same time, edge points cannot be picked because the error is significant. The first image contains two feature points (g1, g2), the second image contains three feature points (g2, g3, g4), the third image contains two feature points (g4, g5), the fourth image contains two feature points (g5, g6), the fifth image contains three feature points (g5, g6, g7), and the sixth image contains three feature points (g7, g8, g1). The distribution of feature points and the distribution of feature points for each image are shown in Figure 8. Moreover, the results of camera calibration are shown in Table 3 and Table 4. After the calibration is completed, the re-projection error of known ground control points and unknown points obtained from multi-view space intersections are analyzed. Through experimental analysis, it is known that the re-projection error is less than 0.2 pixels.

4.3. Result and Analysis of Position and Attitude Conversion Parameters

The camera attitudes recorded by the monitoring equipment used in this experiment are represented as (P, T, Z), where P represents the heading angle, T represents the pitch angle, and Z represents the zoom ratio of the camera. The original location information recorded by the camera is shown in Table 5.
Finally, the coordinate system conversion method proposed in this paper can be used to calculate the converted parameters, and the result of position and attitude conversion parameters is shown in Table 6.

4.4. Result and Analysis of Registration Accuracy

After coordinate system transformation and internal parameter calibration, rough registration has been achieved between the 3D real scene and surveillance camera images, but there are still small errors, as shown in Figure 9. Next, based on the OpenCV library, write C++ code to iterate several times on the pyramid image for registration; the iterative process is shown in Figure 10. The experiment used 20 sets of data from two common scenes, collecting obvious feature points such as window corners, floor intersections, and obvious boundaries of natural features as registration points. According to the statistical results of a large amount of data, the registration success rate of the proposed method in this paper reaches 98.1%, and the accuracy rate reaches 97.06%. The success rate and accuracy rate of each group of experimental data are shown in Table 7.
The success rate is equal to dividing the successful cases by the selected cases, while the accuracy rate is equal to dividing the right cases by the successful cases. The success rate indicates how many of the sample points we have selected have been successfully registered. Successful registration may not necessarily be the samples of interest to us, and the correct registration of interest is the accuracy rate.
From the experimental results, it can be seen that some cases failed to match. Through analysis, it can be concluded that the reasons for the failure of some sample points are as follows: (1) The features are not clear enough. (2) The local deformation of the 3D real scene model where the feature points are located. This will result in incomplete elimination of the geometric deformation of the feature points relative to the image, which affects the least squares matching.

5. Conclusions

The main contribution of this paper is to propose a method for accurate registration of real scene and surveillance camera images, which solves the technical difficulty that existing cameras do not have georeference information. The conversion relationship between the navigation coordinate system and the photogrammetric coordinate system is considered firstly, unifying image information and real scenes under the same coordinate reference, and then the paper proposes a mathematical model for camera internal parameter calibration. At the same time, the misalignment angle automatic calibration method based on the collinearity equations to calculate the camera misalignment parameters is used, and then extracted feature points are used for matching. So far, the rough matching has been completed. However, due to the influence of zoom lenses, surface elevation error, and attitude angle error, accurate matching cannot be achieved. Therefore, to achieve accurate matching of real scene and surveillance camera images, a support window estimation method of using least squares image matching based on pyramid images is proposed and achieves good results.
The theory and method of accurately registering real scenes and surveillance camera images proposed in this paper have made an extremely important attempt for the development of smart cities and digital cities. Compared to the previous research, it has made great progress. If this technology is put into practice, there will be significant efficiency improvements in urban security, traffic management, and fire monitoring in China.
However, due to our pioneering research, future research can explore more application directions for integrating surveillance camera image information and real scenes, as well as finding more efficient and accurate registering methods.

Author Contributions

J.L. conceived the idea and designed the experiments.; Z.Z. performed the experiments and analyzed the data.; Z.Z. wrote the main manuscript.; J.L. and Z.Z. reviewed the paper; Y.C. obtained the experimental data; M.F. polished the language of the paper. Funding acquisition: J.L. All authors have read and agreed to the published version of the manuscript.

Funding

This research was funded by the National Natural Science Foundation of China, grant number 42171439; Qingdao Science and Technology Demonstration and Guidance Project (grant no. 22-3-7-cspz-1-nsh).

Data Availability Statement

Not applicable.

Conflicts of Interest

The authors declare no conflict of interest.

References

  1. Yaagoubi, R.; El Yarmani, M.; Kamel, A.; Khemiri, W. HybVOR: A voronoi-based 3D GIS approach for camera surveillance network placement. ISPRS Int. J. Geo-Inf. 2015, 4, 754–782. [Google Scholar] [CrossRef]
  2. Eugster, H.; Nebiker, S. UAV-based augmented monitoring-real-time georeferencing and integration of video imagery with virtual globes. IAPRSSIS 2008, 37, 1229–1235. [Google Scholar]
  3. Wang, X. Intelligent multi-camera video surveillance: A review. Pattern Recognit. Lett. 2013, 34, 3–19. [Google Scholar] [CrossRef]
  4. Collins, R.T.; Lipton, A.J.; Kanade, T.; Fujiyoshi, H.; Duggins, D.; Tsin, Y.; Tolliver, D.; Enomoto, N.; Hasegawa, O.; Burt, P. A system for video surveillance and monitoring. VSAM Final Rep. 2000, 2000, 1. [Google Scholar]
  5. Eugster, H.; Nebiker, S. Real-time georegistration of video streams from mini or micro UAS using digital 3D city models. In Proceedings of the 6th International Symposium on Mobile Mapping Technology, Presidente Prudente, São Paulo, Brazil, 21–24 July 2009. [Google Scholar]
  6. Milosavljević, A.; Rančić, D.; Dimitrijević, A.; Predić, B.; Mihajlović, V. A method for estimating surveillance video georeferences. ISPRS Int. J. Geo-Inf. 2017, 6, 211. [Google Scholar] [CrossRef]
  7. Mostafa, M.M.; Schwarz, K.-P. Digital image georeferencing from a multiple camera system by GPS/INS. ISPRS J. Photogramm. Remote Sens. 2001, 56, 1–12. [Google Scholar] [CrossRef]
  8. Nagalakshmi, T. A Study on Usage of CCTV Surveillance System with Special Reference to Business Outlets in Hyderabad. Tactful Manag. Res. J. 2012, 1, 1–12. [Google Scholar]
  9. Milosavljević, A.; Rančić, D.; Dimitrijević, A.; Predić, B.; Mihajlović, V. Integration of GIS and video surveillance. Int. J. Geogr. Inf. Sci. 2016, 30, 2089–2107. [Google Scholar] [CrossRef]
  10. Keller, M.; Lefloch, D.; Lambers, M.; Izadi, S.; Weyrich, T.; Kolb, A. Real-time 3d reconstruction in dynamic scenes using point-based fusion. In Proceedings of the 2013 International Conference on 3D Vision-3DV 2013, Seattle, WA, USA, 29 June–1 July 2013; pp. 1–8. [Google Scholar]
  11. Schall, G.; Zollmann, S.; Reitmayr, G. Smart Vidente: Advances in mobile augmented reality for interactive visualization of underground infrastructure. Pers. Ubiquitous Comput. 2013, 17, 1533–1549. [Google Scholar] [CrossRef]
  12. Lewis, P. Linking Spatial Video and GIS; National University of Ireland Maynooth: Maynooth, Ireland, 2009. [Google Scholar]
  13. Xie, Y.J.; Wang, M.Z.; Liu, X.J.; Wu, Y.G. Integration of GIS and Moving Objects in Surveillance Video. ISPRS Int. J. Geo-Inf. 2017, 6, 94. [Google Scholar] [CrossRef]
  14. Zhang, Z. A flexible new technique for camera calibration. IEEE Trans. Pattern Anal. Mach. Intell. 2000, 22, 1330–1334. [Google Scholar] [CrossRef]
  15. Lee, S.C.; Nevatia, R. Robust camera calibration tool for video surveillance camera in urban environment. In Proceedings of the CVPR 2011 WORKSHOPS, Colorado Springs, CO, USA, 20–25 June 2011; pp. 62–67. [Google Scholar]
  16. Munoz, J.C.P.; Alarcon, C.A.O.; Osorio, A.F.; Mejia, C.E.; Medina, R. Environmental applications of camera images calibrated by means of the Levenberg-Marquardt method. Comput. Geosci. 2013, 51, 74–82. [Google Scholar] [CrossRef]
  17. Mukherjee, D.; Jonathan Wu, Q.; Wang, G. A comparative experimental study of image feature detectors and descriptors. Mach. Vis. Appl. 2015, 26, 443–466. [Google Scholar] [CrossRef]
  18. Sharma, S.K.; Jain, K.; Shukla, A.K. A Comparative Analysis of Feature Detectors and Descriptors for Image Stitching. Appl. Sci. 2023, 13, 6015. [Google Scholar] [CrossRef]
  19. Forero, M.G.; Mambuscay, C.L.; Monroy, M.F.; Miranda, S.L.; Méndez, D.; Valencia, M.O.; Gomez Selvaraj, M. Comparative analysis of detectors and feature descriptors for multispectral image matching in rice crops. Plants 2021, 10, 1791. [Google Scholar] [CrossRef]
  20. Remondino, F.; Spera, M.G.; Nocerino, E.; Menna, F.; Nex, F. State of the art in high density image matching. Photogramm. Rec. 2014, 29, 144–166. [Google Scholar] [CrossRef]
  21. Saleem, S.; Bais, A.; Sablatnig, R. Towards feature points based image matching between satellite imagery and aerial photographs of agriculture land. Comput. Electron. Agric. 2016, 126, 12–20. [Google Scholar] [CrossRef]
  22. Yuan, X.; Kong, L.; Feng, D.; Wei, Z. Automatic feature point detection and tracking of human actions in time-of-flight videos. IEEE/CAA J. Autom. Sin. 2017, 4, 677–685. [Google Scholar] [CrossRef]
  23. Liu, J.C.; Xu, W.; Jiang, T.; Han, X.F. Development of an Attitude Transformation Method From the Navigation Coordinate System to the Projection Coordinate System. IEEE Geosci. Remote Sens. Lett. 2020, 17, 1318–1322. [Google Scholar] [CrossRef]
  24. Redfearn, J. Transverse mercator formulae. Emp. Surv. Rev. 1948, 9, 318–322. [Google Scholar] [CrossRef]
  25. Lepetit, V.; Moreno-Noguer, F.; Fua, P. EPnP: An accurate O(n) solution to the PnP problem. Int. J. Comput. Vis. 2009, 81, 155–166. [Google Scholar] [CrossRef]
Figure 1. The integration of surveillance video images and real scenes.
Remotesensing 15 04217 g001
Figure 2. The relationship between the navigation coordinate system and the projection coordinate system.
Remotesensing 15 04217 g002
Figure 3. The process of camera and misalignment calibration.
Remotesensing 15 04217 g003
Figure 4. The schematic diagram of internal calibration and calculate misalignment angle.
Remotesensing 15 04217 g004
Figure 5. The process of least squares image matching.
Remotesensing 15 04217 g005
Figure 6. The process of accurate registration.
Remotesensing 15 04217 g006
Figure 7. (a) Experimental equipment; (b) Scene 1; (c) Scene 2.
Remotesensing 15 04217 g007
Figure 8. The distribution of feature points on real scenes and each image.
Remotesensing 15 04217 g008
Figure 9. The rough registration of real scenes and surveillance camera images.
Remotesensing 15 04217 g009
Figure 10. Iterative process: (a) Scene 1; (b) Scene 2; (c) Scene 3; (d) Scene 4; (e) Scene 5. The first image in each group represents the source image, the second image represents 1 iteration, the third image represents 5 iterations, the fourth image represents 50 iterations, and the fifth image represents 100 iterations.
Remotesensing 15 04217 g010
Table 1. Overview of the required frames.
FramesAbbreviation
Navigation frameg
Body frameu
Camera framec
Map projection frames
Table 2. Experimental equipment parameters.
ParameterAttribute
NameDH-SD-8A1440XA-HNR
Focal length5.5 mm
Maximum focal length220 mm
Sensor1/1.8-inch CMOS
Image size2560 × 1440
Pixel size1.97 μm
FOVHorizontal: 61.4 to 2.27°
Vertical: 35.99 to 1.3°
Heading angle0 to 360°
Pitch angle −30 to 90°
Table 3. The calibration result of camera parameters.
Number x 0 (Pixel) y 0 (Pixel) f (Pixel)
Camera 11286.47717.862448.52
Camera 21282.55722.372453.71
Table 4. The calibration result of camera position and misalignment.
NumberLongitude (E)Latitude (N)Altitude (m) φ m i s (Degree) ω m i s (Degree) κ m i s (Degree)
Camera 1120.124635836.000972333.859−1.22.63.5
Camera 2120.124930935.999961135.4540.8−3.42.7
Table 5. Position parameters.
NumberPTZ
Image 120.045.0/55.0/65.0/75.0/85.01.0
Image 240.045.0/55.0/65.0/75.0/85.01.0
Image 360.045.0/55.0/65.0/75.0/85.01.0
Image 480.045.0/55.0/65.0/75.0/85.01.0
Image 5100.045.0/55.0/65.0/75.0/85.01.0
Image 6120.045.0/55.0/65.0/75.0/85.01.0
Image 7140.045.0/55.0/65.0/75.0/85.01.0
Image 8160.045.0/55.0/65.0/75.0/85.01.0
Image 9180.045.0/55.0/65.0/75.0/85.01.0
Image 10200.045.0/55.0/65.0/75.0/85.01.0
Image 11220.045.0/55.0/65.0/75.0/85.01.0
Image 12240.045.0/55.0/65.0/75.0/85.01.0
Image 13260.045.0/55.0/65.0/75.0/85.01.0
Image 14280.045.0/55.0/65.0/75.0/85.01.0
Image 15300.045.0/55.0/65.0/75.0/85.01.0
Image 16320.045.0/55.0/65.0/75.0/85.01.0
Image 17340.045.0/55.0/65.0/75.0/85.01.0
Image 18360.045.0/55.0/65.0/75.0/85.01.0
Table 6. Position and attitude conversion parameters in case of pitch angle 55.
NumberNorthingEastingAltitude φ ω κ
Image 1240819.5433913987880.875025 33.85900031.74509266650.954142676−34.226973360
Image 2240819.5433913987880.87502533.85900047.12944404238.057075507 −55.904693437
Image 3240819.5433913987880.87502533.85900054.57513974622.451284505−70.487256792
Image 4240819.5433913987880.87502533.85900057.4204309675.813279602−81.981622930
Image 5240819.5433913987880.87502533.85900056.920176724−11.042711394−92.796826270
Image 6240819.5433913987880.87502533.85900052.859705079−27.468807568−104.942423737
Image 7240819.5433913987880.87502533.85900043.416094145−42.481735575−121.202882060
Image 8240819.5433913987880.87502533.85900024.604964601−53.899705132−146.141765924
Image 9240819.5433913987880.87502533.859000−4.889093366−57.475691796178.522277674
Image 10240819.5433913987880.87502533.859000−31.745092666−50.954142676145.773026640
Image 11240819.5433913987880.87502533.859000−47.129444042−38.057075507124.095306563
Image 12240819.5433913987880.87502533.859000−54.575139746−22.451284505109.512743208
Image 13240819.5433913987880.87502533.859000−57.420430967−5.81327960298.018377070
Image 14240819.5433913987880.87502533.859000−56.92017672411.04271139487.203173730
Image 15240819.5433913987880.87502533.859000−52.85970507927.46880756875.057576263
Image 16240819.5433913987880.87502533.859000−43.41609414542.48173557558.797117940
Image 17240819.5433913987880.87502533.859000−24.60496460153.89970513233.858234076
Image 18240819.5433913987880.87502533.8590004.88909336657.475691796−1.477722326
Table 7. The success rate and accuracy rate of the experiment.
NumberSelected CasesSuccessful CasesRight CasesSuccess RateAccuracy Rate
1555554100%98.18%
2525251100%98.08%
364626096.88%96.77%
4444442100%95.45%
552504996.15%98%
666656398.48%96.92%
7585857100%98.28%
872696995.83%100%
949474495.92%93.62%
1048474797.92%100%
11666663100%95.45%
1263626098.41%96.77%
1359575696.61%98.25%
1446454597.83%100%
15555552100%94.55%
1642403795.24%92.5%
1765635996.92%93.65%
18585858100%100%
1947464497.87%95.65%
2047464597.87%97.83%
Total11081087105598.1%97.06%
Disclaimer/Publisher’s Note: The statements, opinions and data contained in all publications are solely those of the individual author(s) and contributor(s) and not of MDPI and/or the editor(s). MDPI and/or the editor(s) disclaim responsibility for any injury to people or property resulting from any ideas, methods, instructions or products referred to in the content.

