
Coastal Dynamics at Kharasavey Key Site, Kara Sea, Based on Remote Sensing Data

 ,
, 

Abstract
:1. Introduction
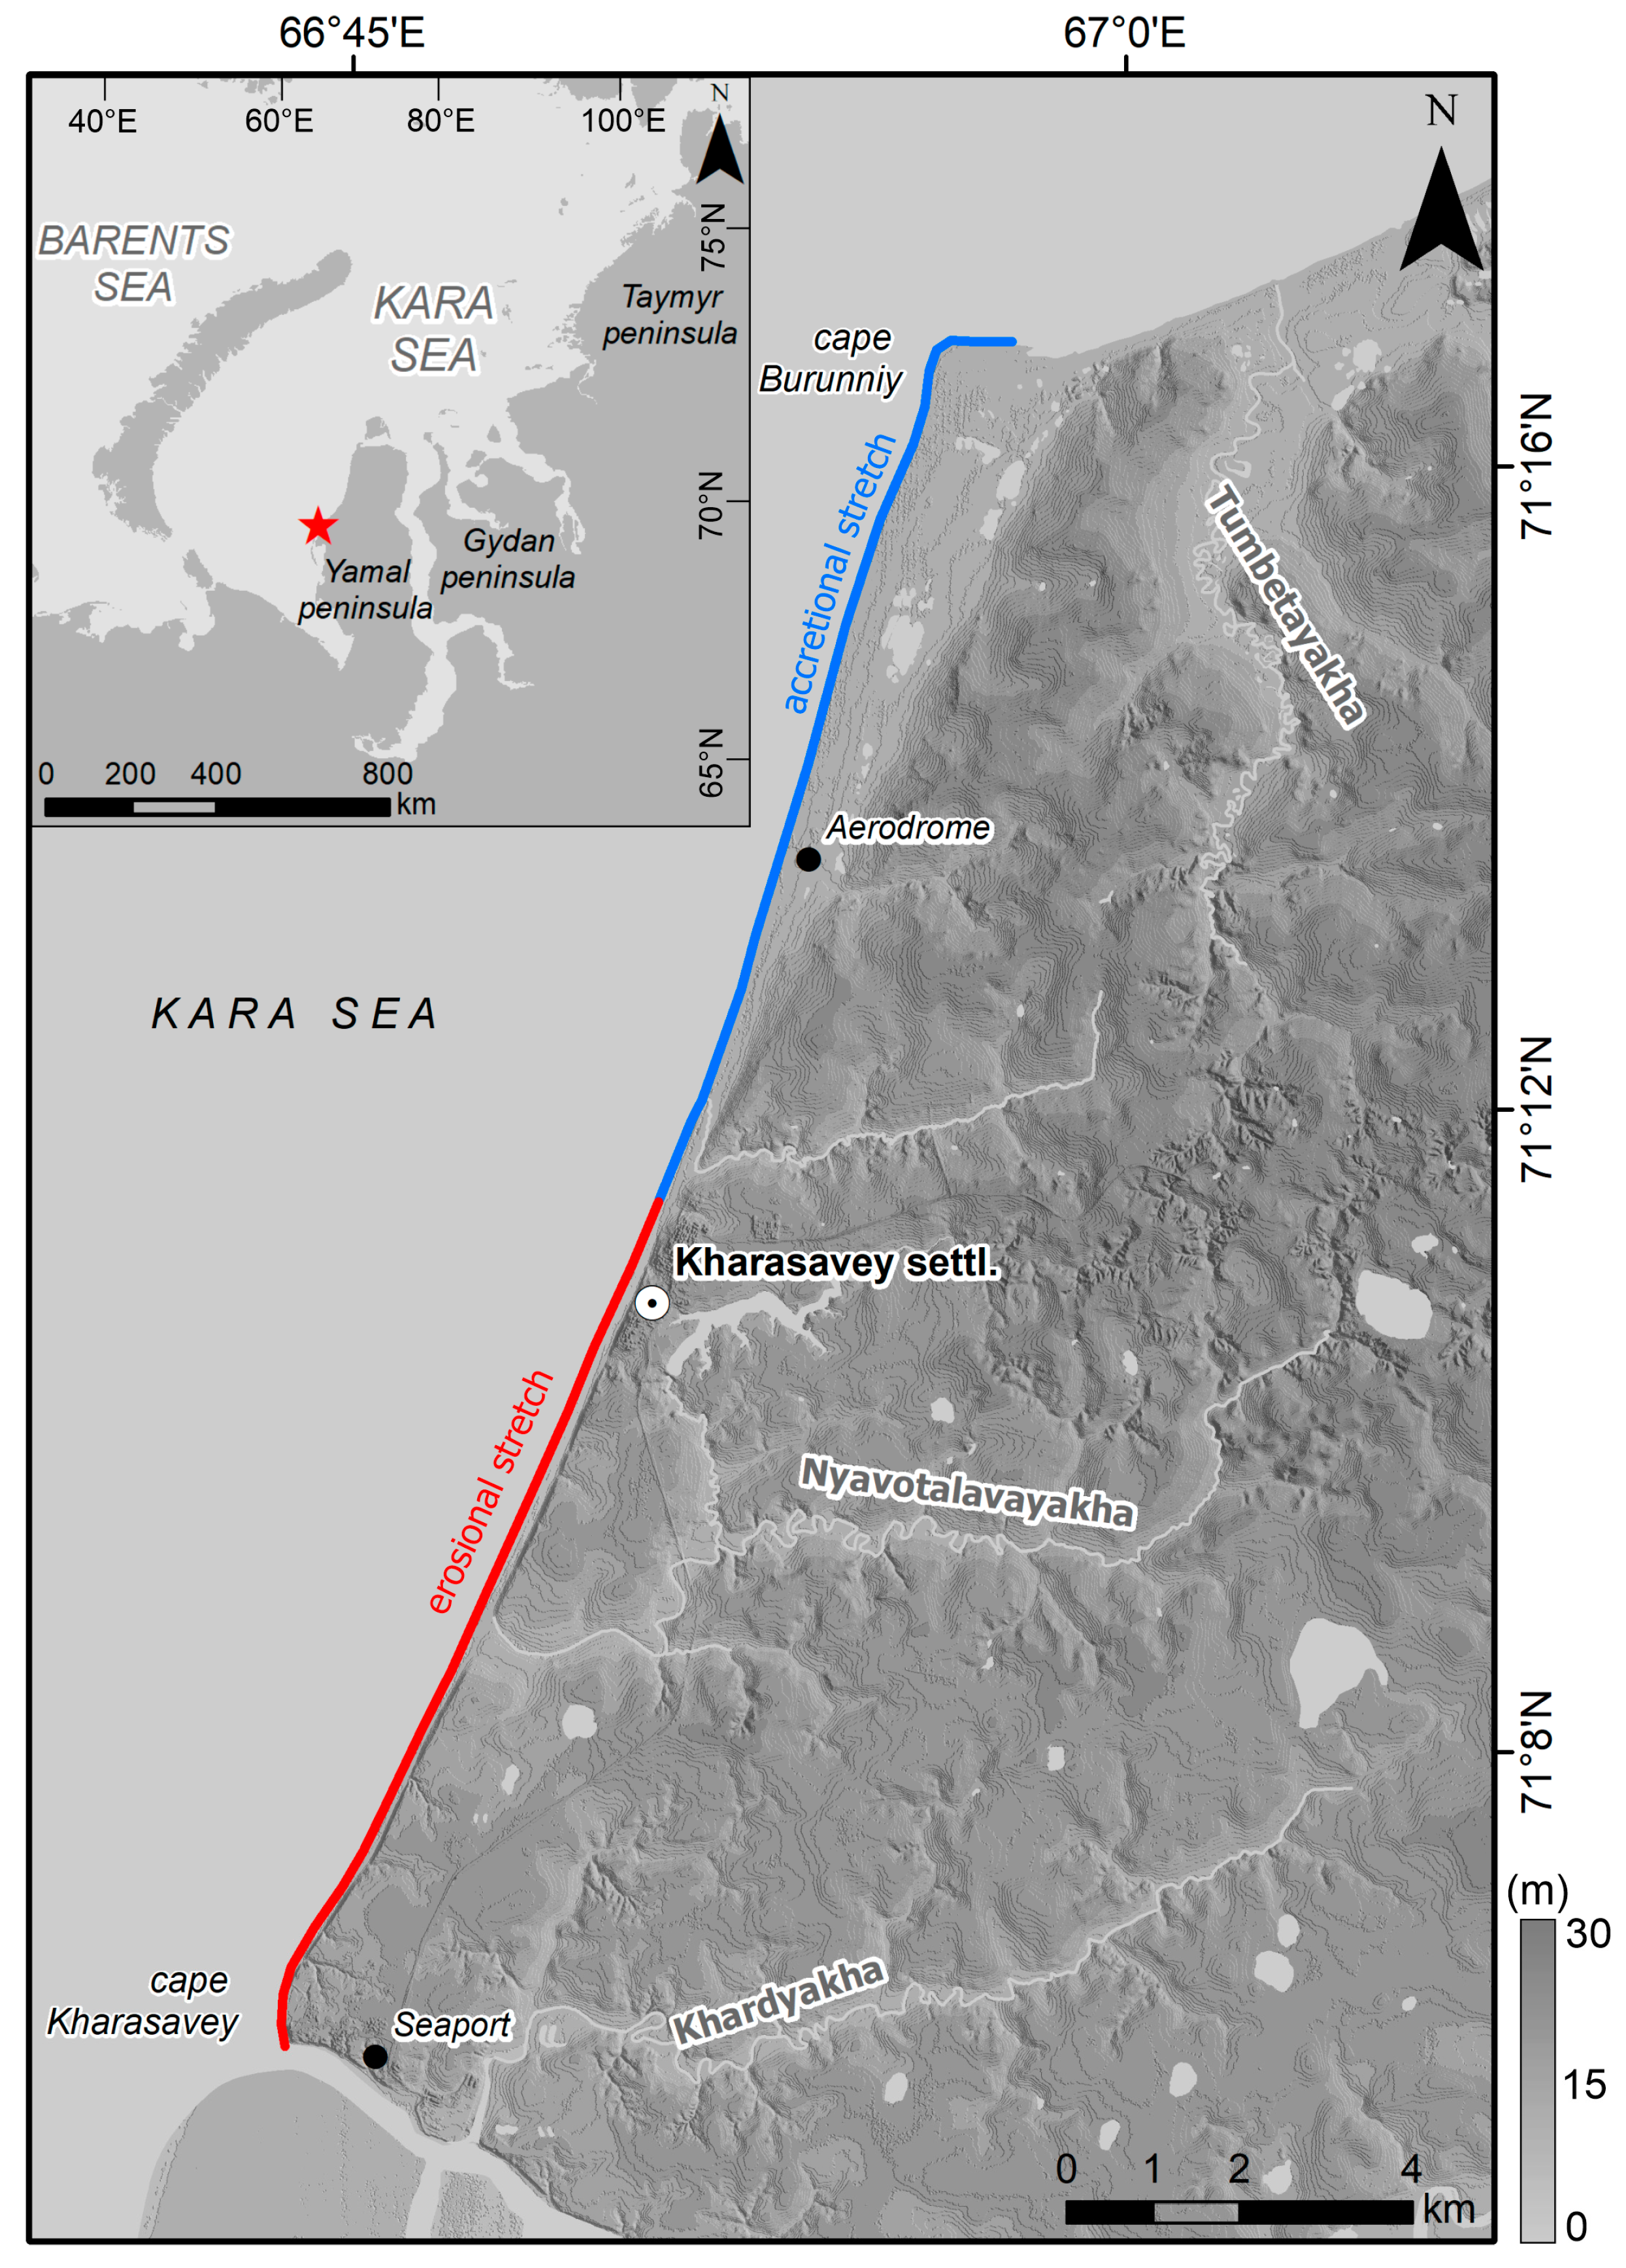
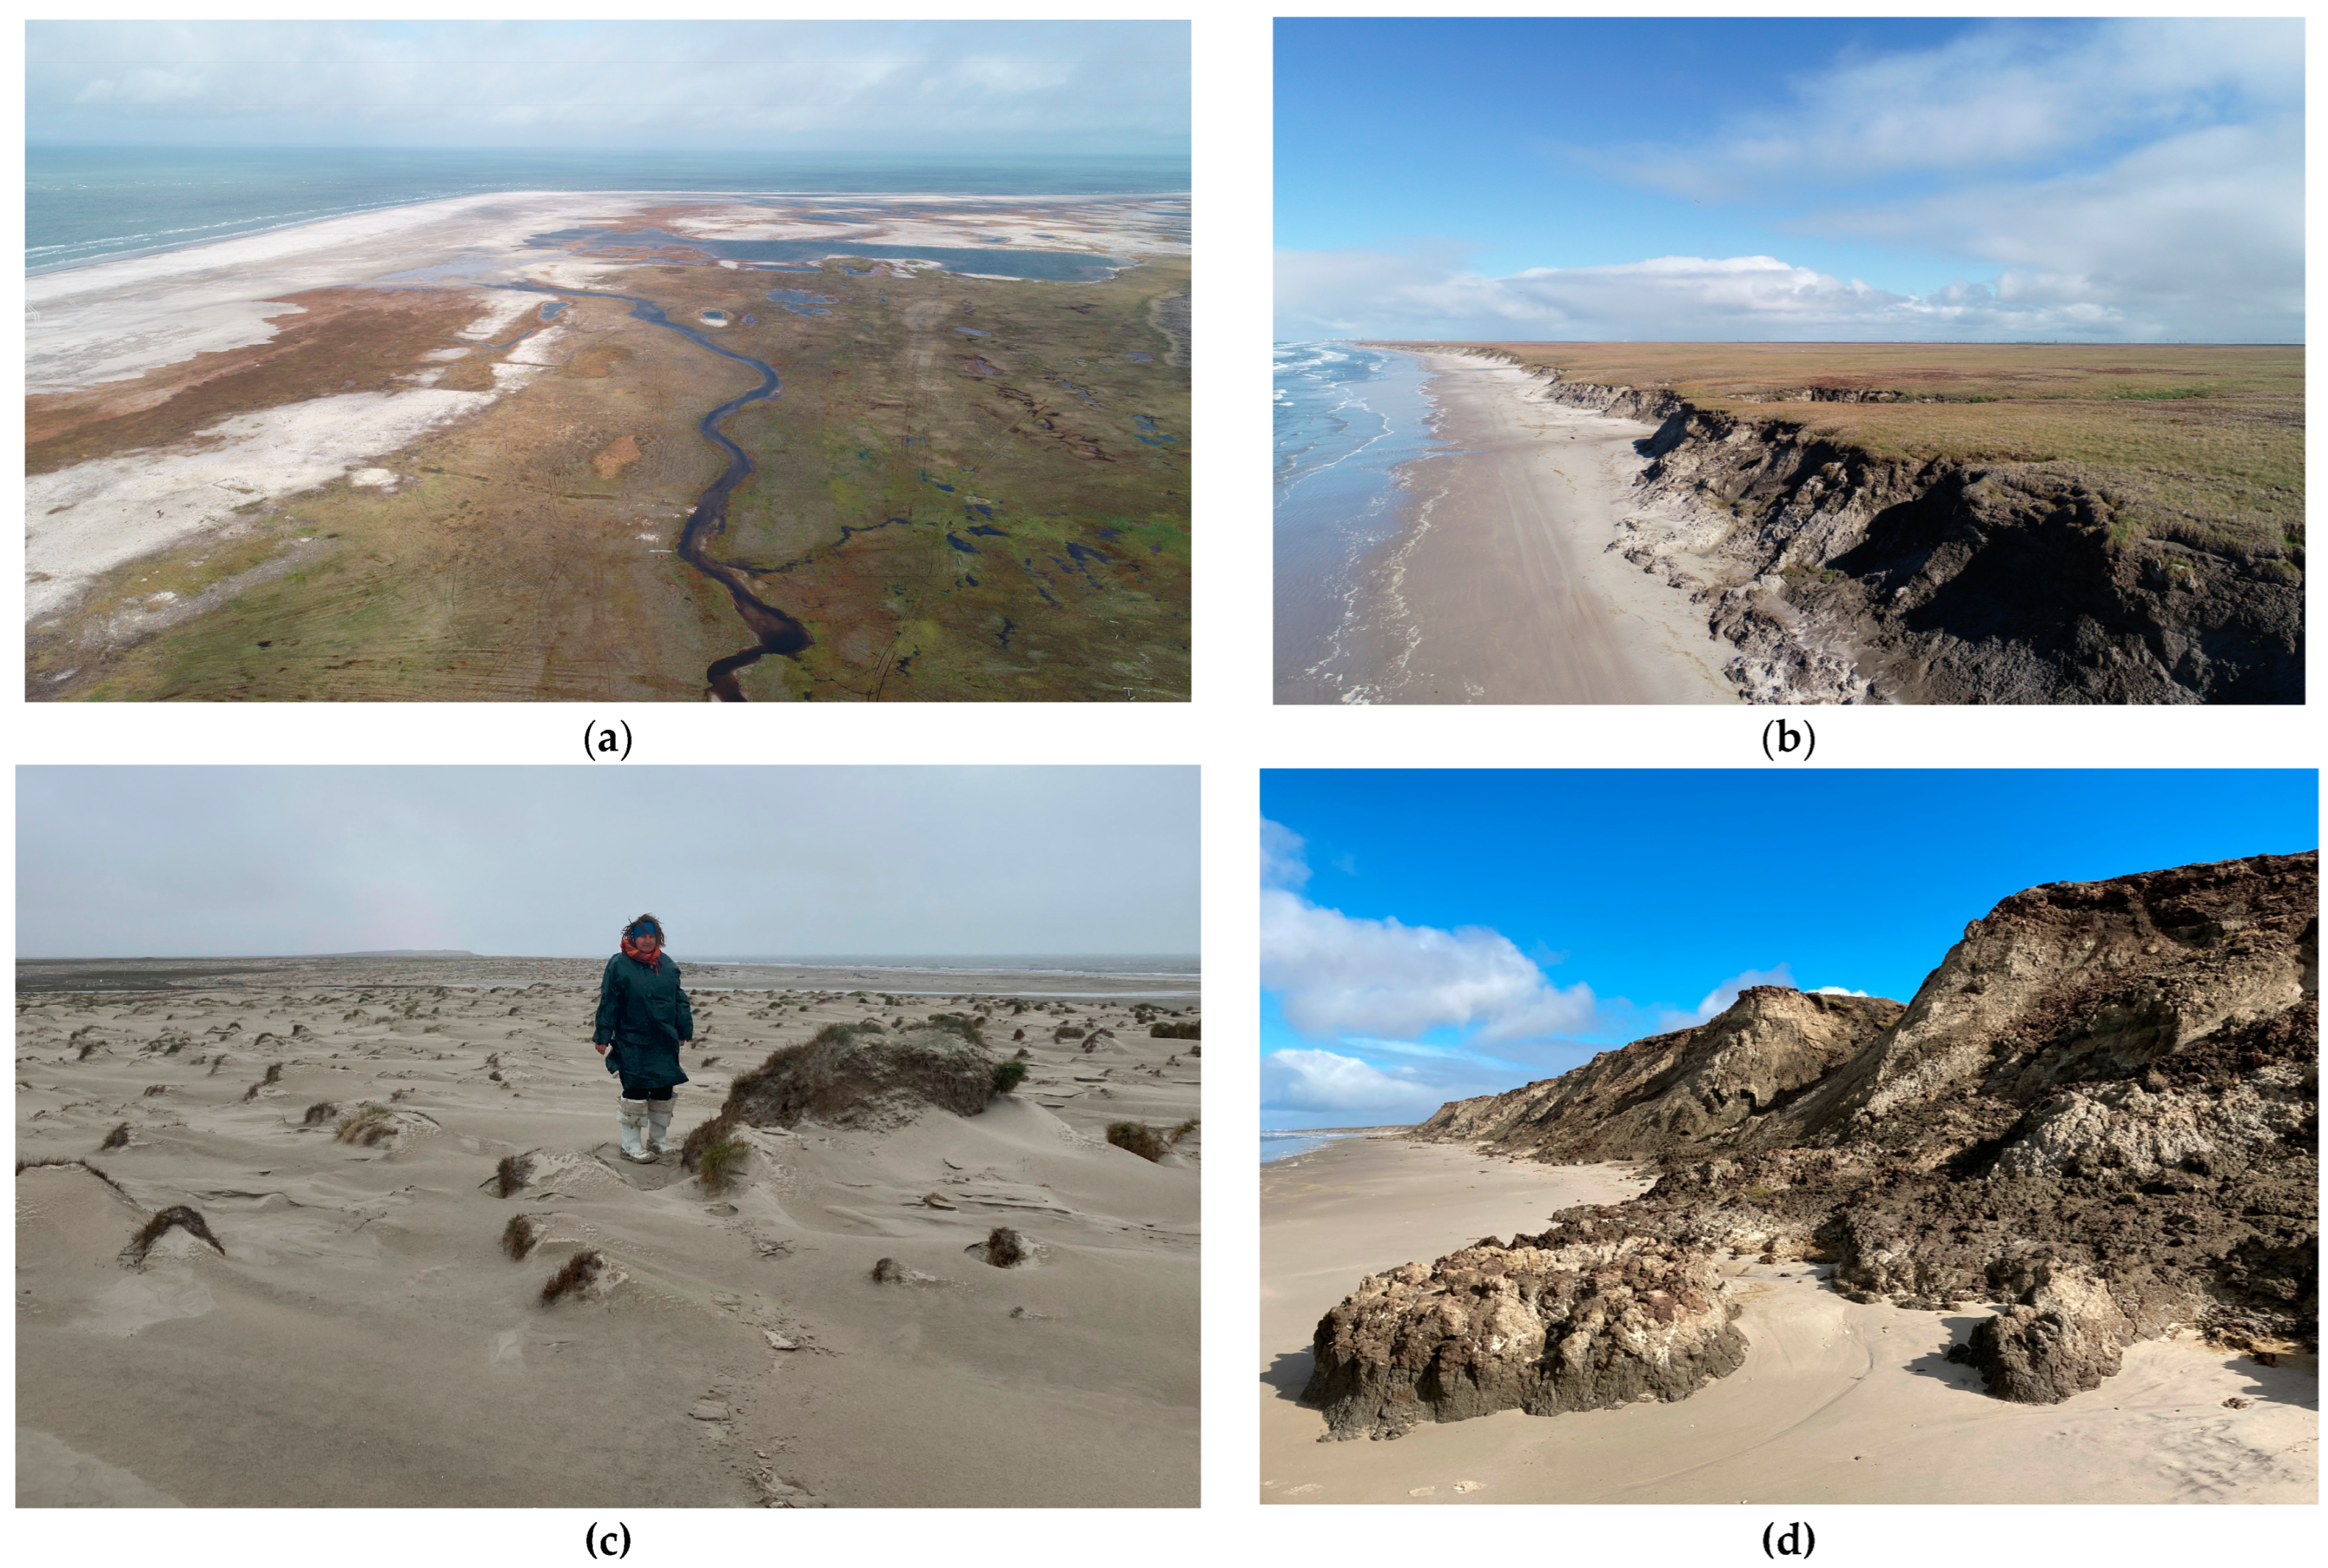
2. The Study Area
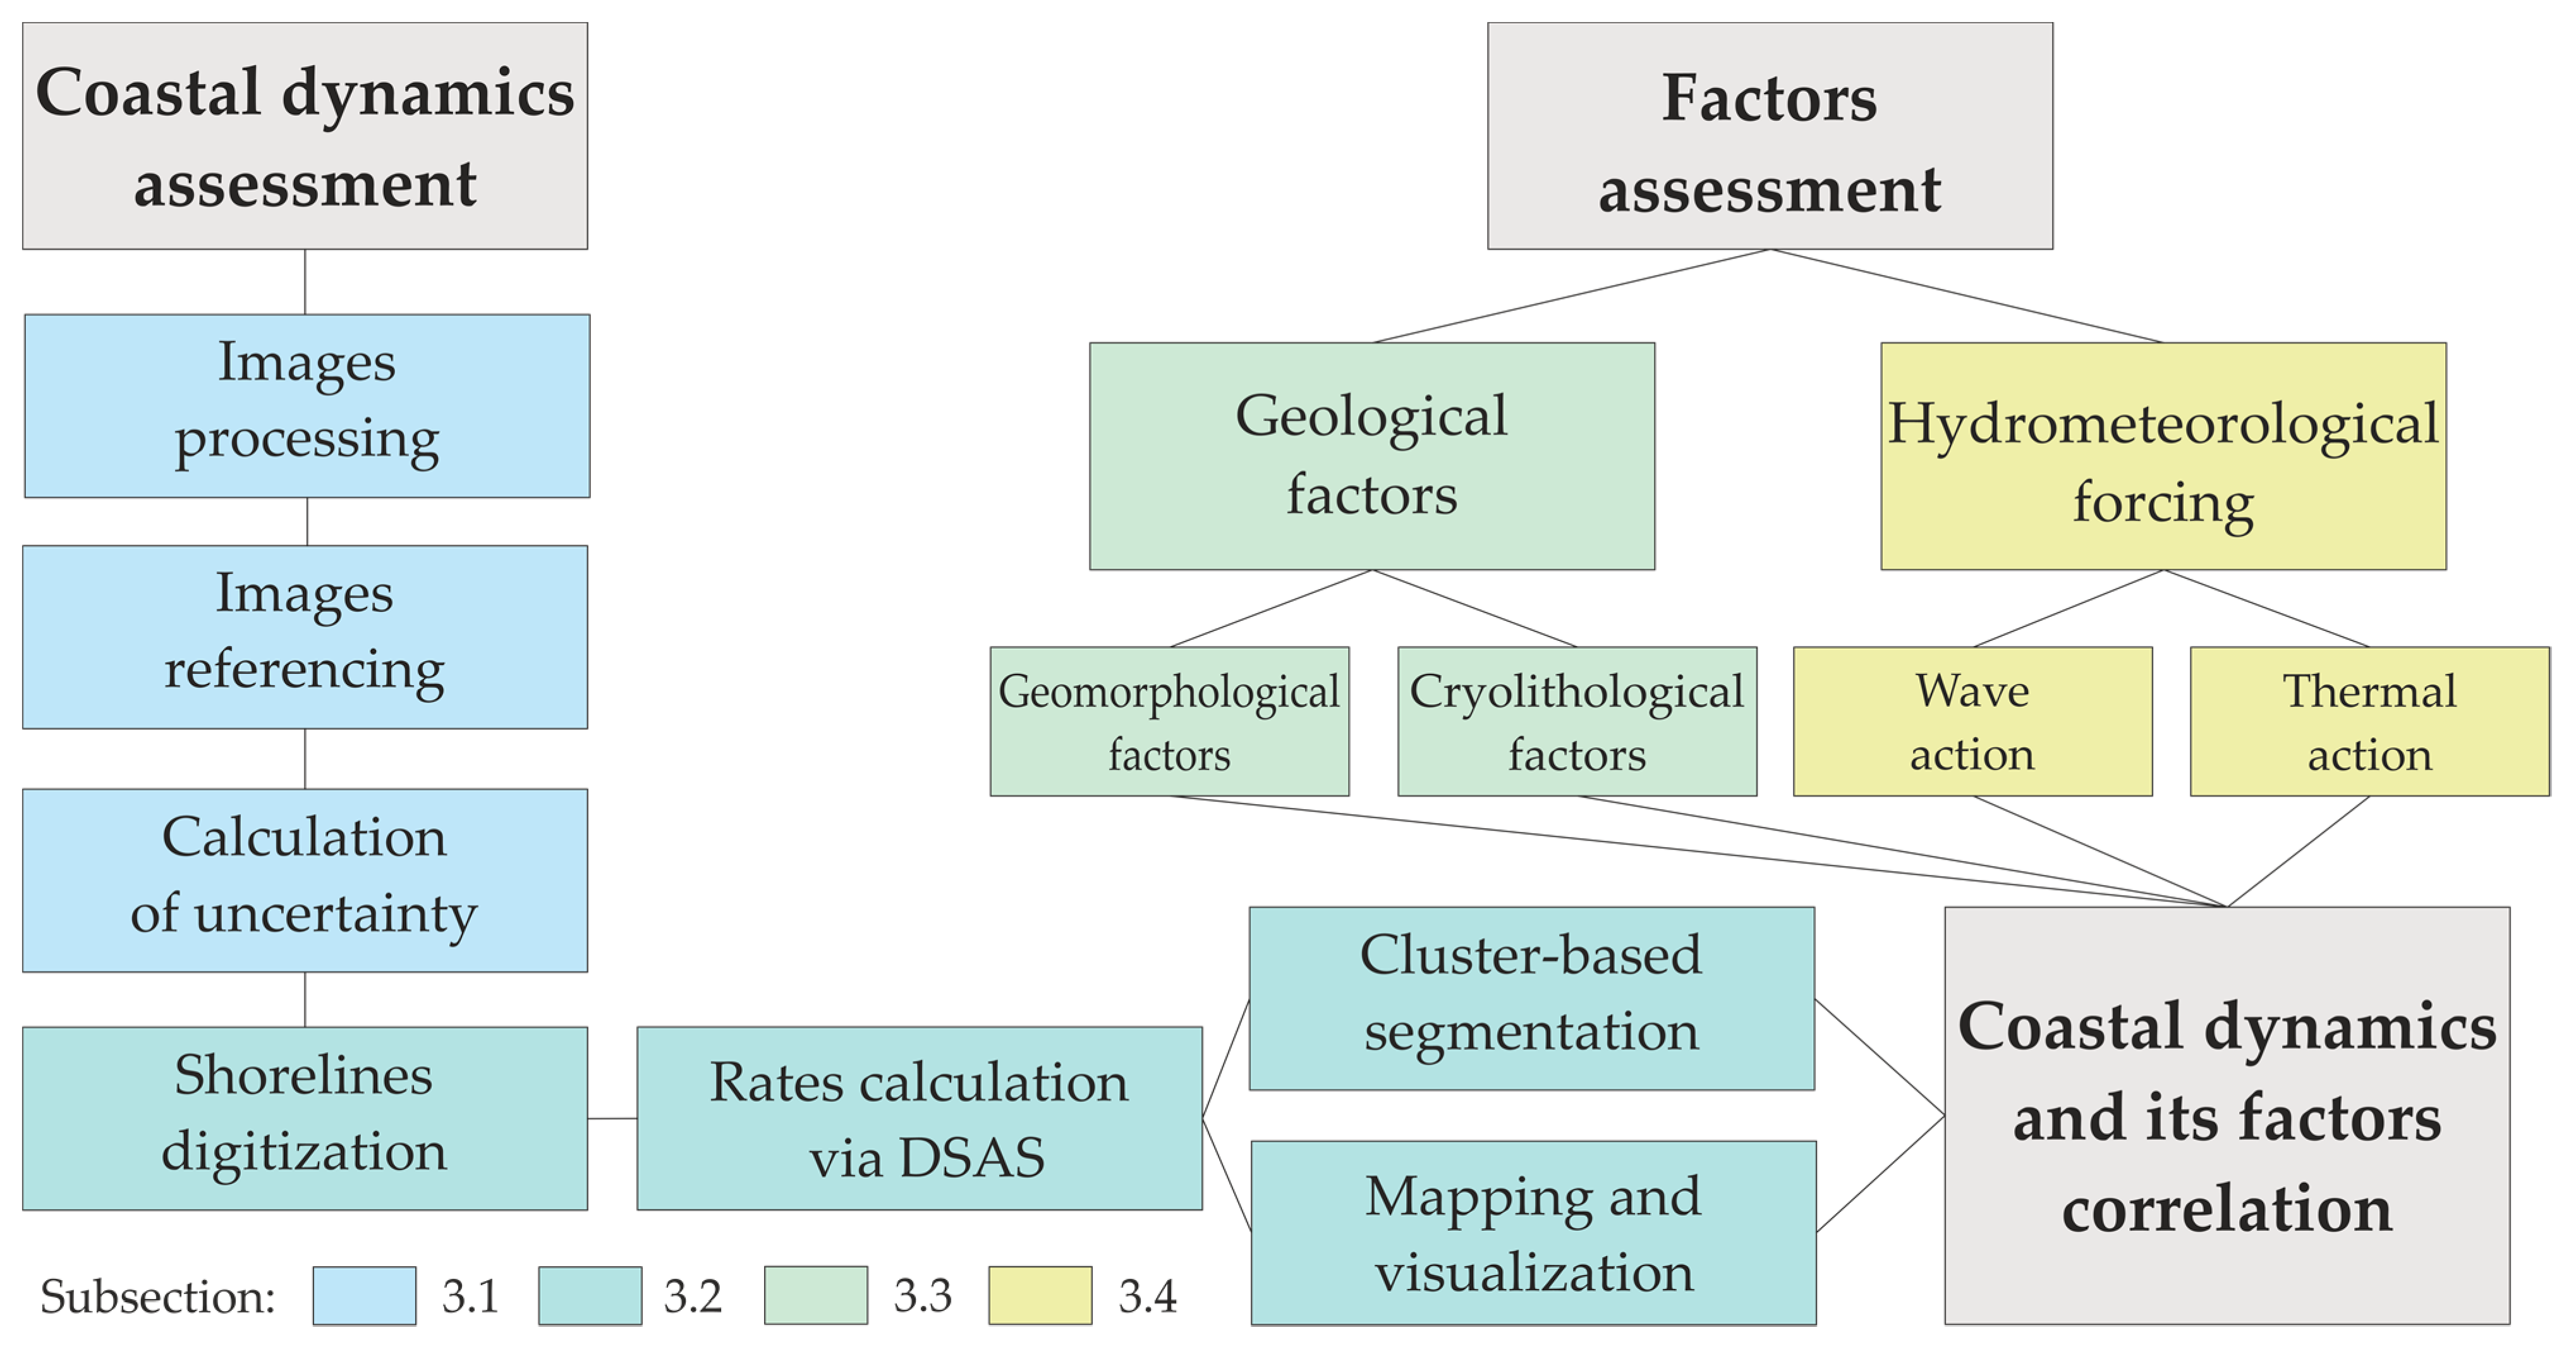
3. Materials and Methods
3.1. Remote Sensing Data
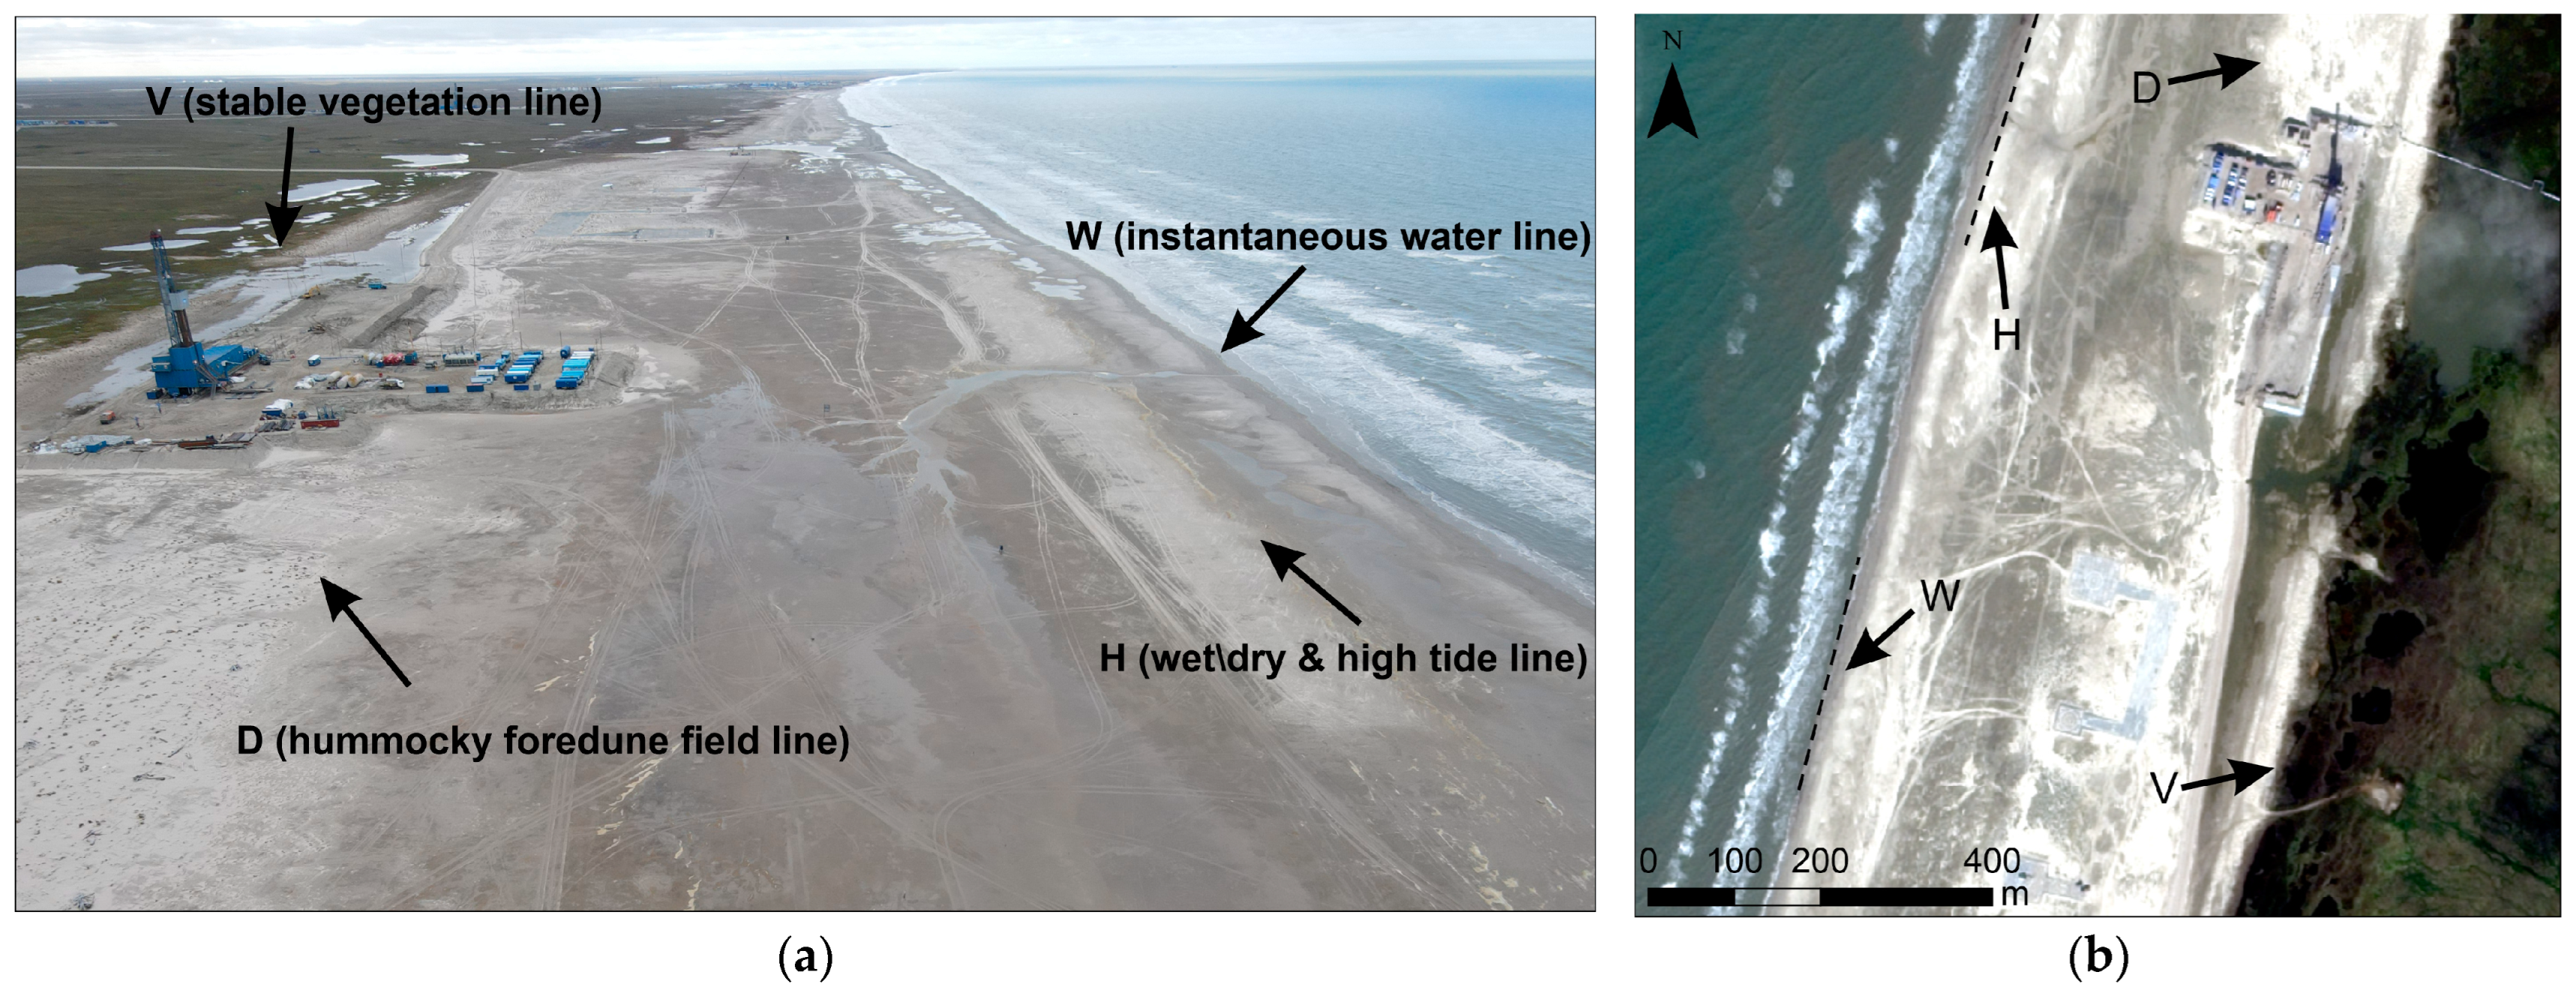
3.2. Shoreline Change Determination and Analysis
3.3. Asessment of Geological Factors
3.4. Hydrometeorological Forcing Assessment
3.4.1. Wave Action Assessment
3.4.2. Thermal Action Assessment
4. Results
4.1. Coastal Dynamics
4.1.1. Multi-Decadal Shoreline Change Rates
4.1.2. Spatiotemporal Variability of Coastal Dynamics
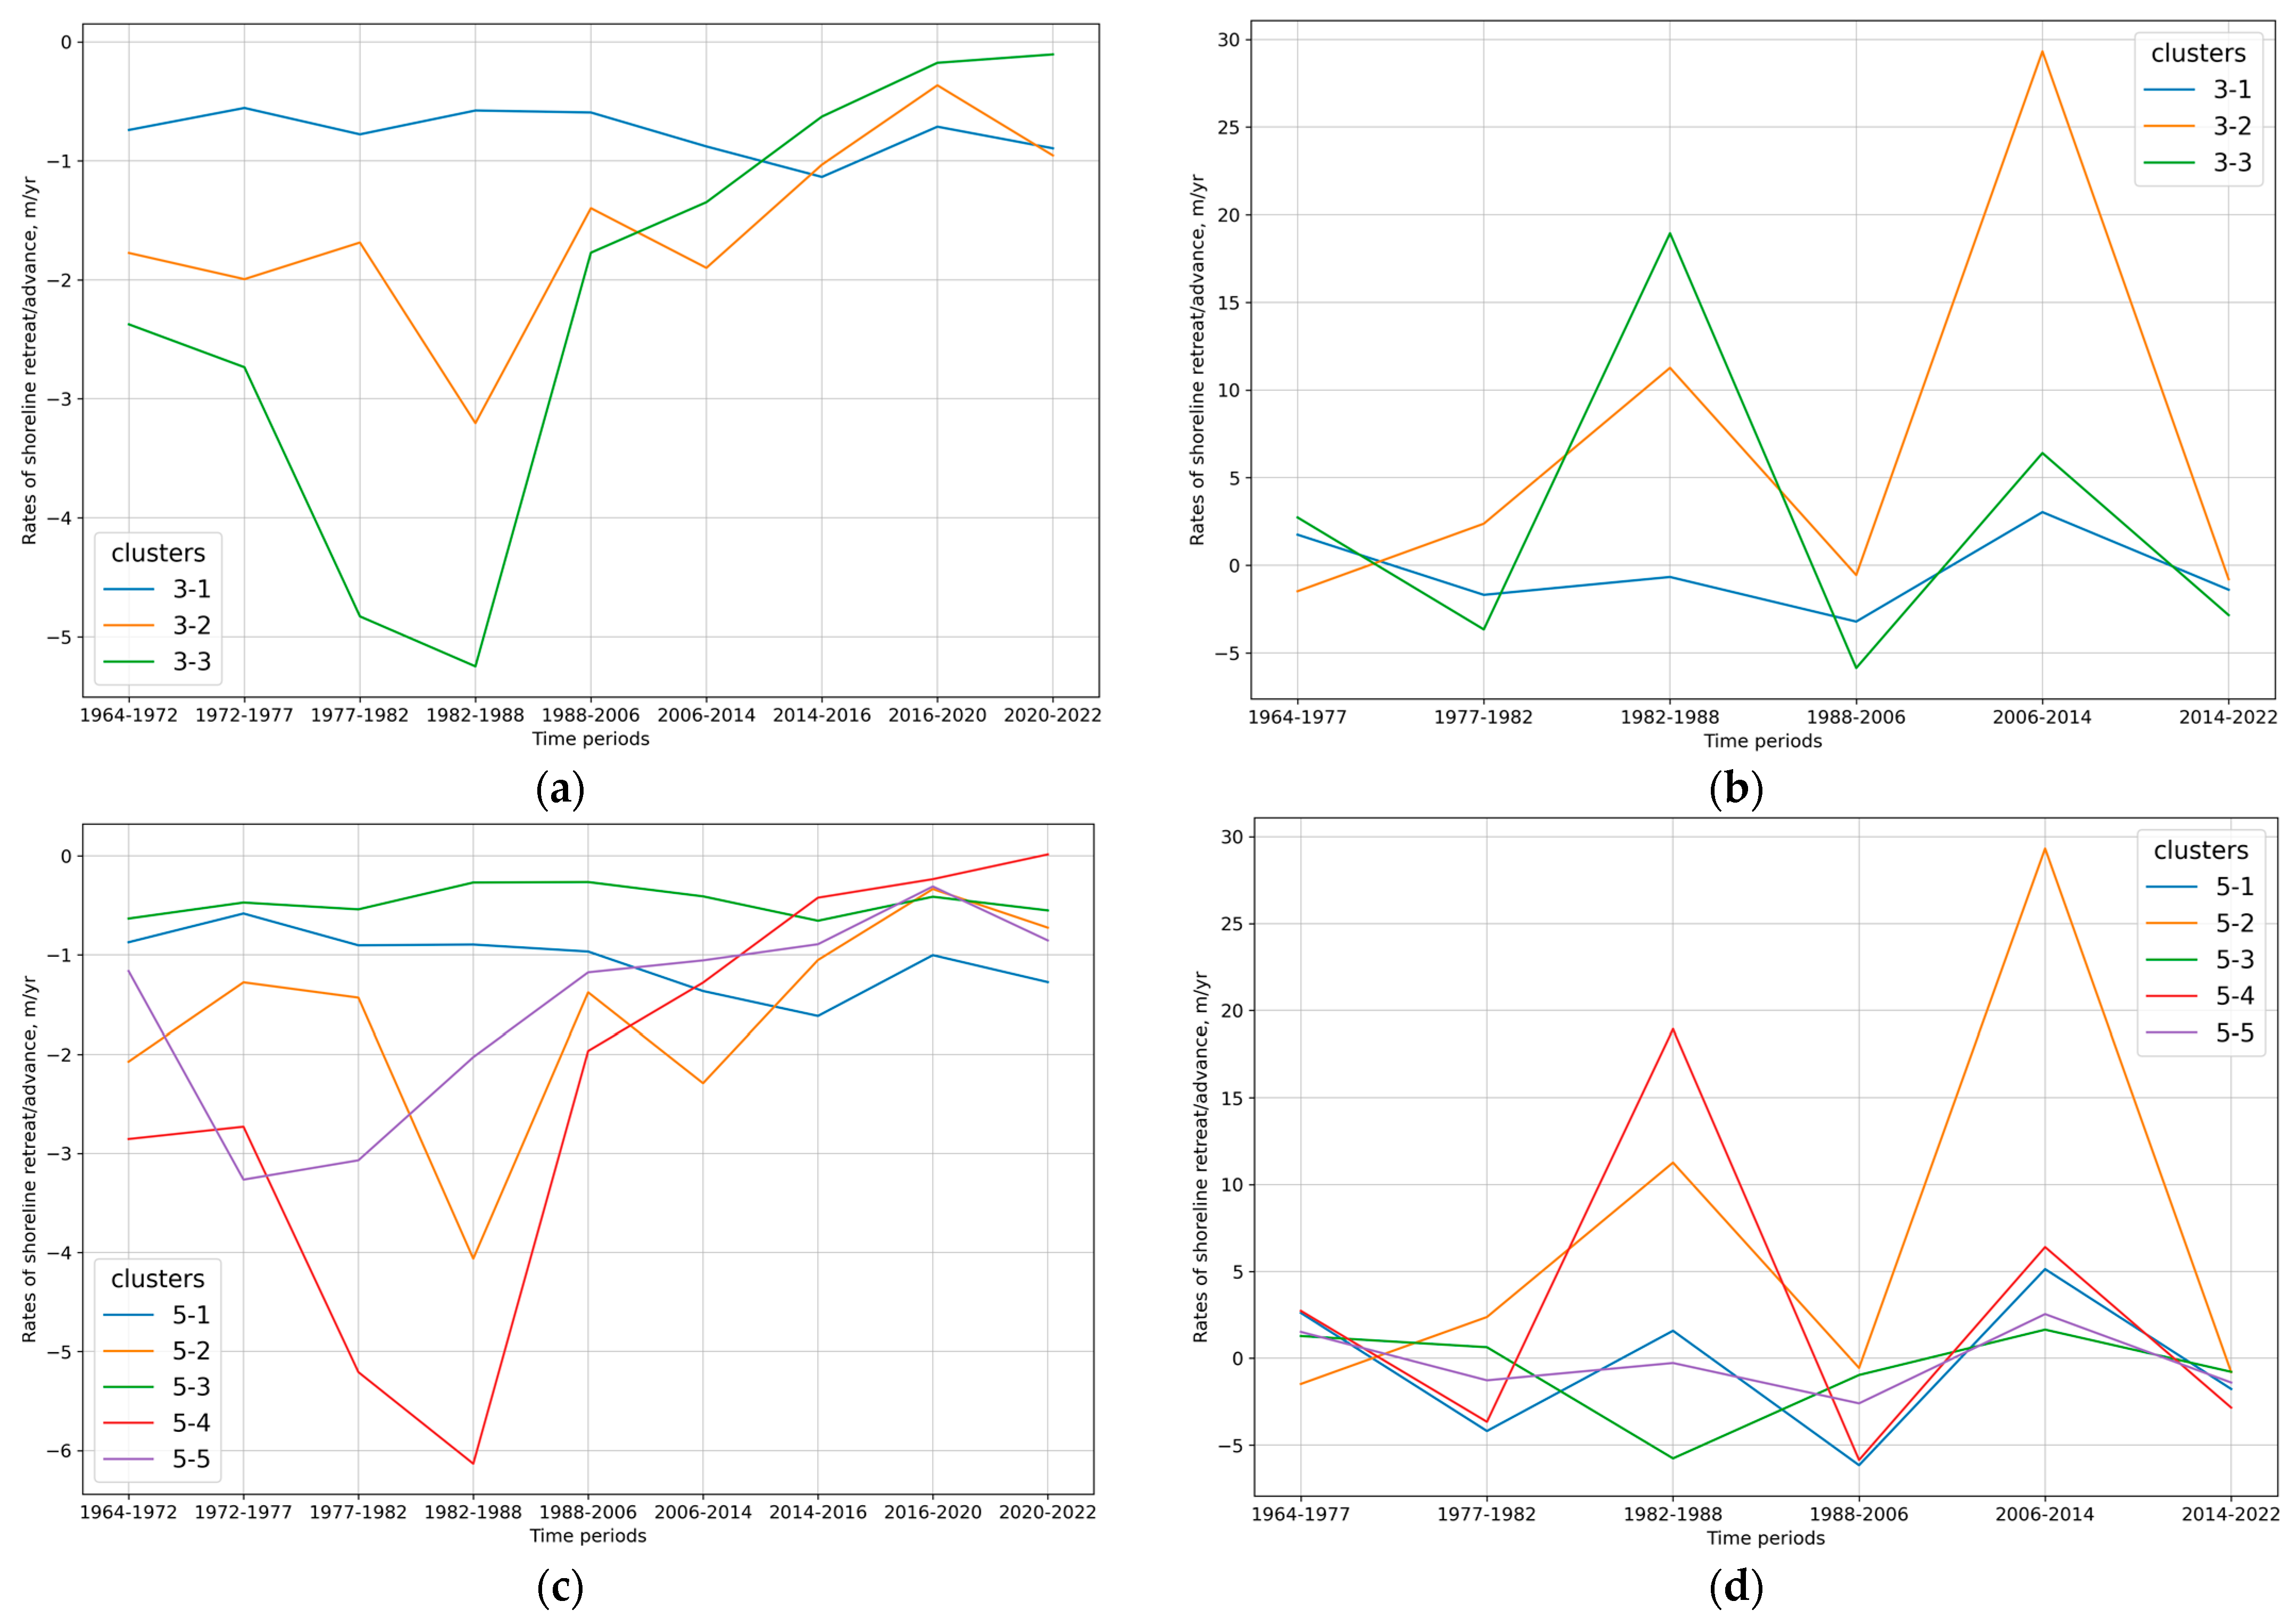
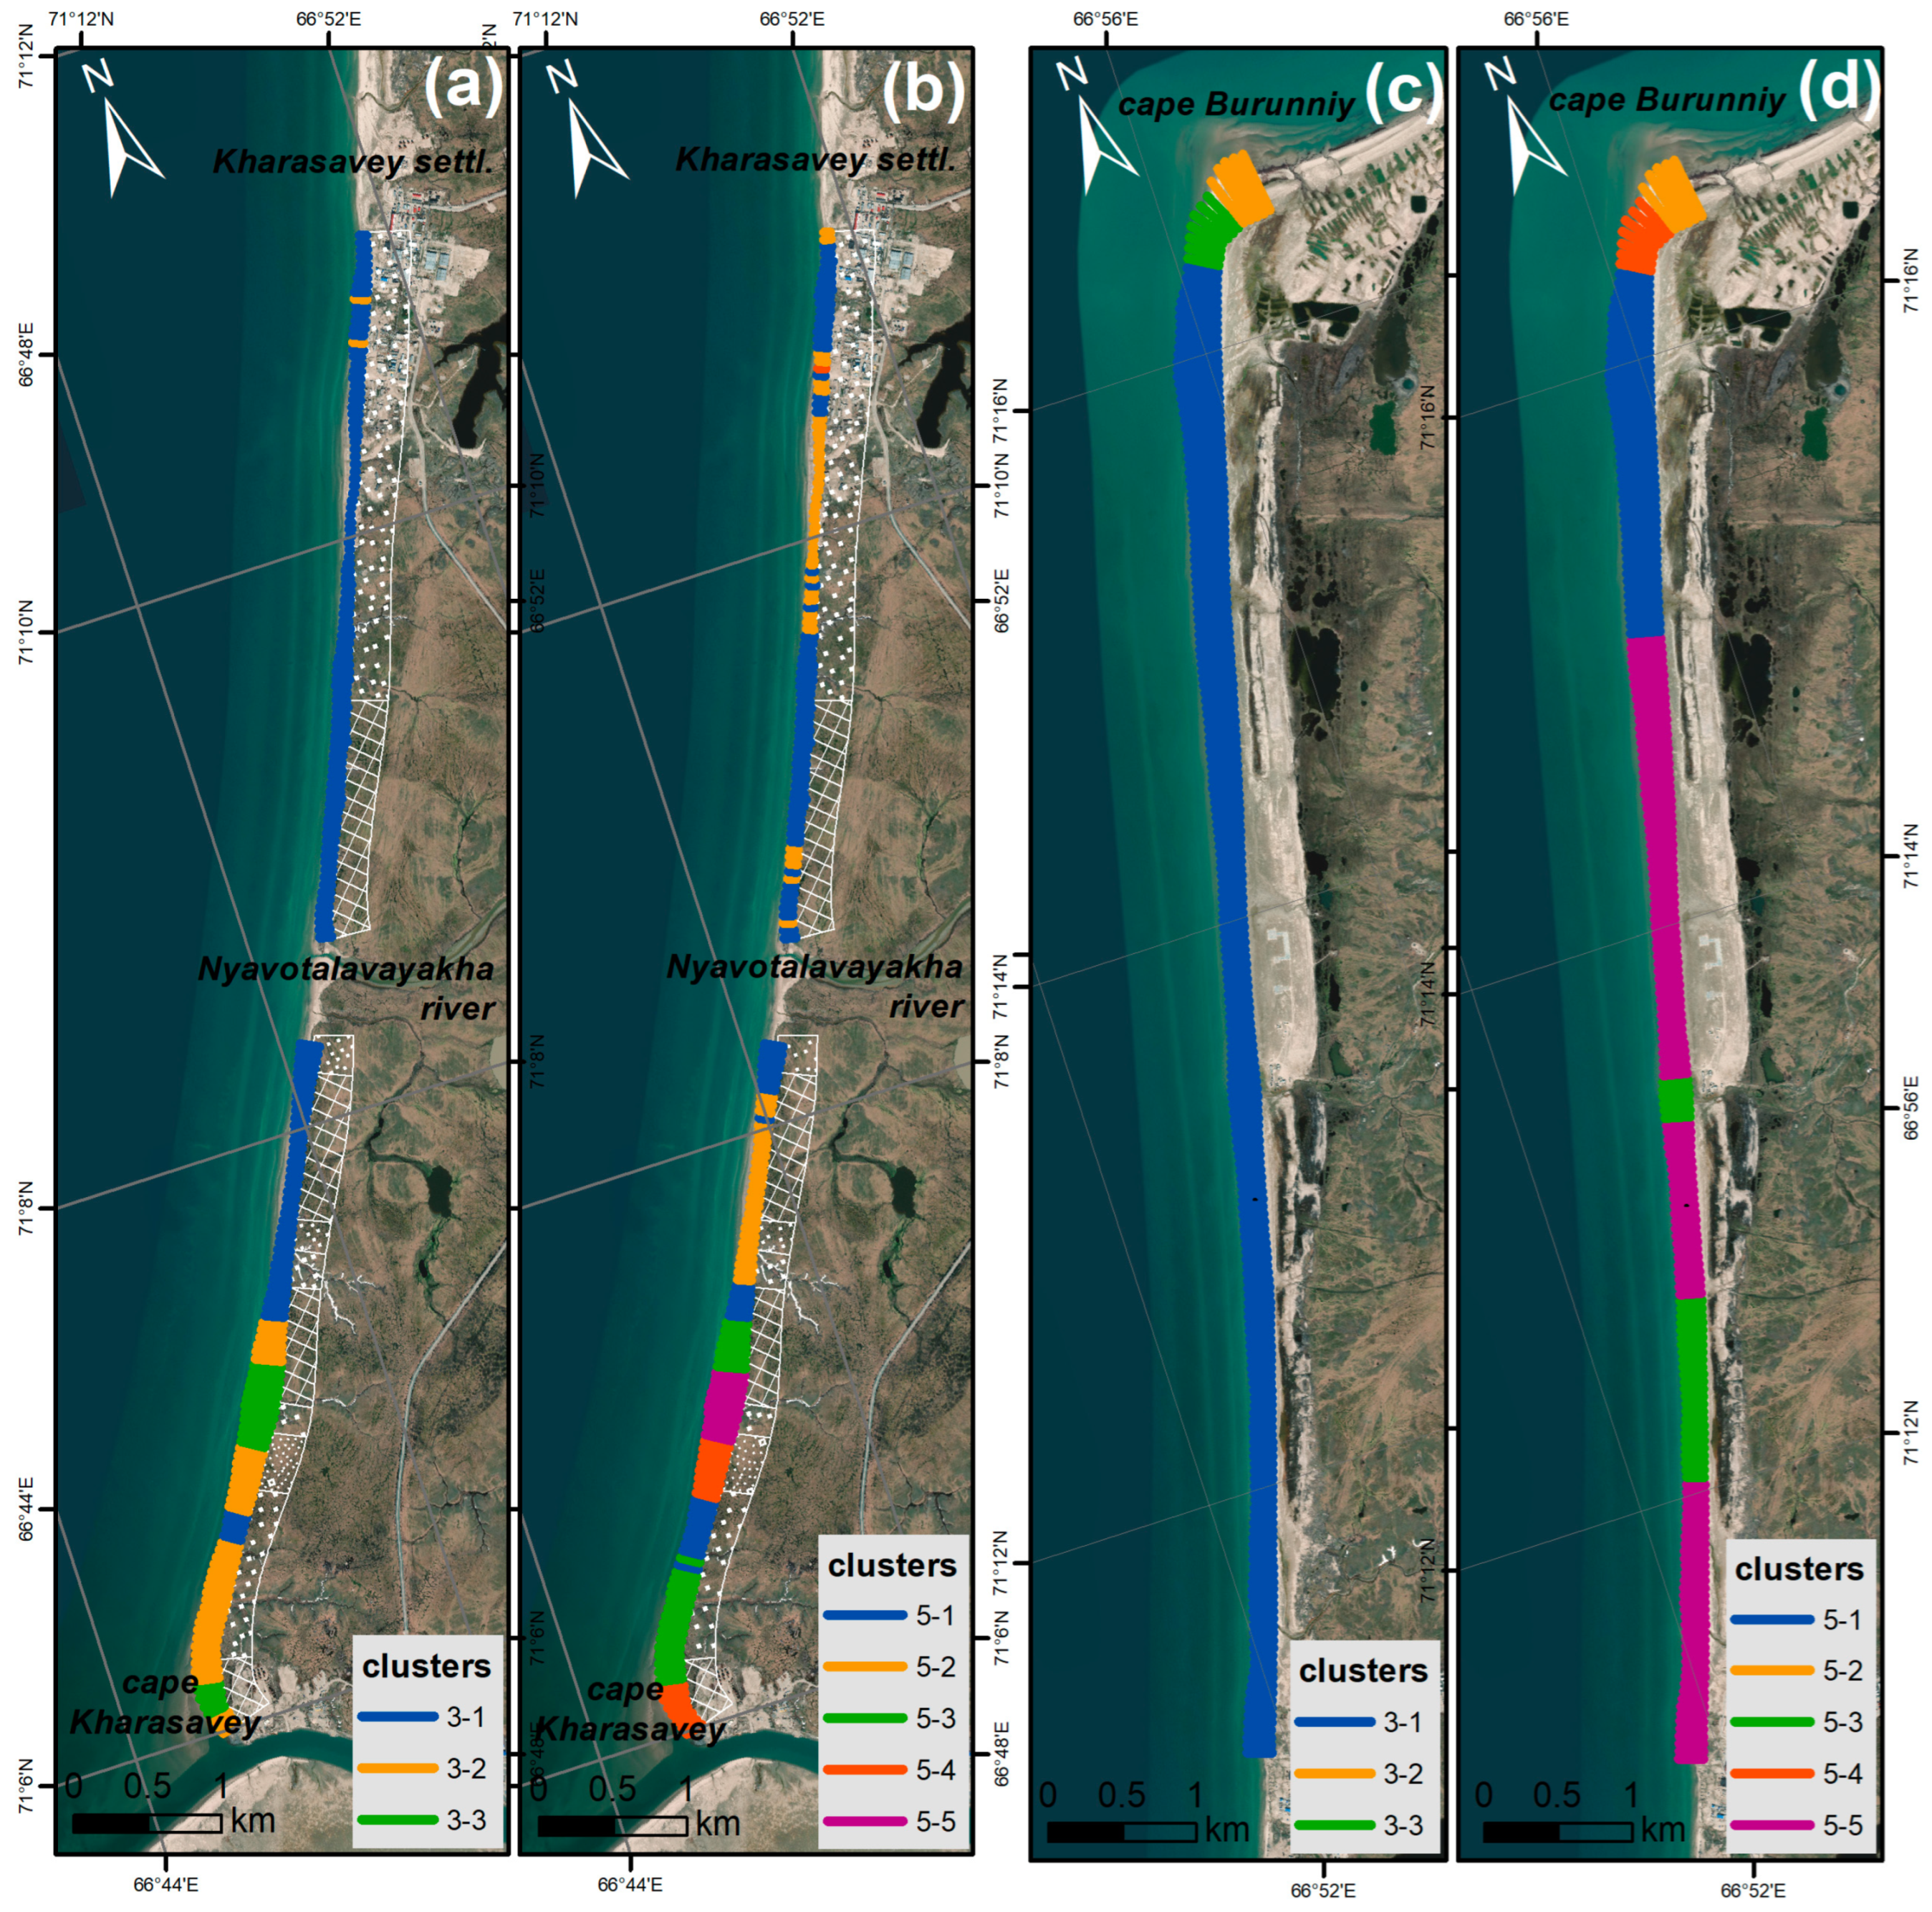
4.2. Cluster-Based Classification of Patterns of Shoreline Behavior
4.3. Geomorphic and Cryolithological Features
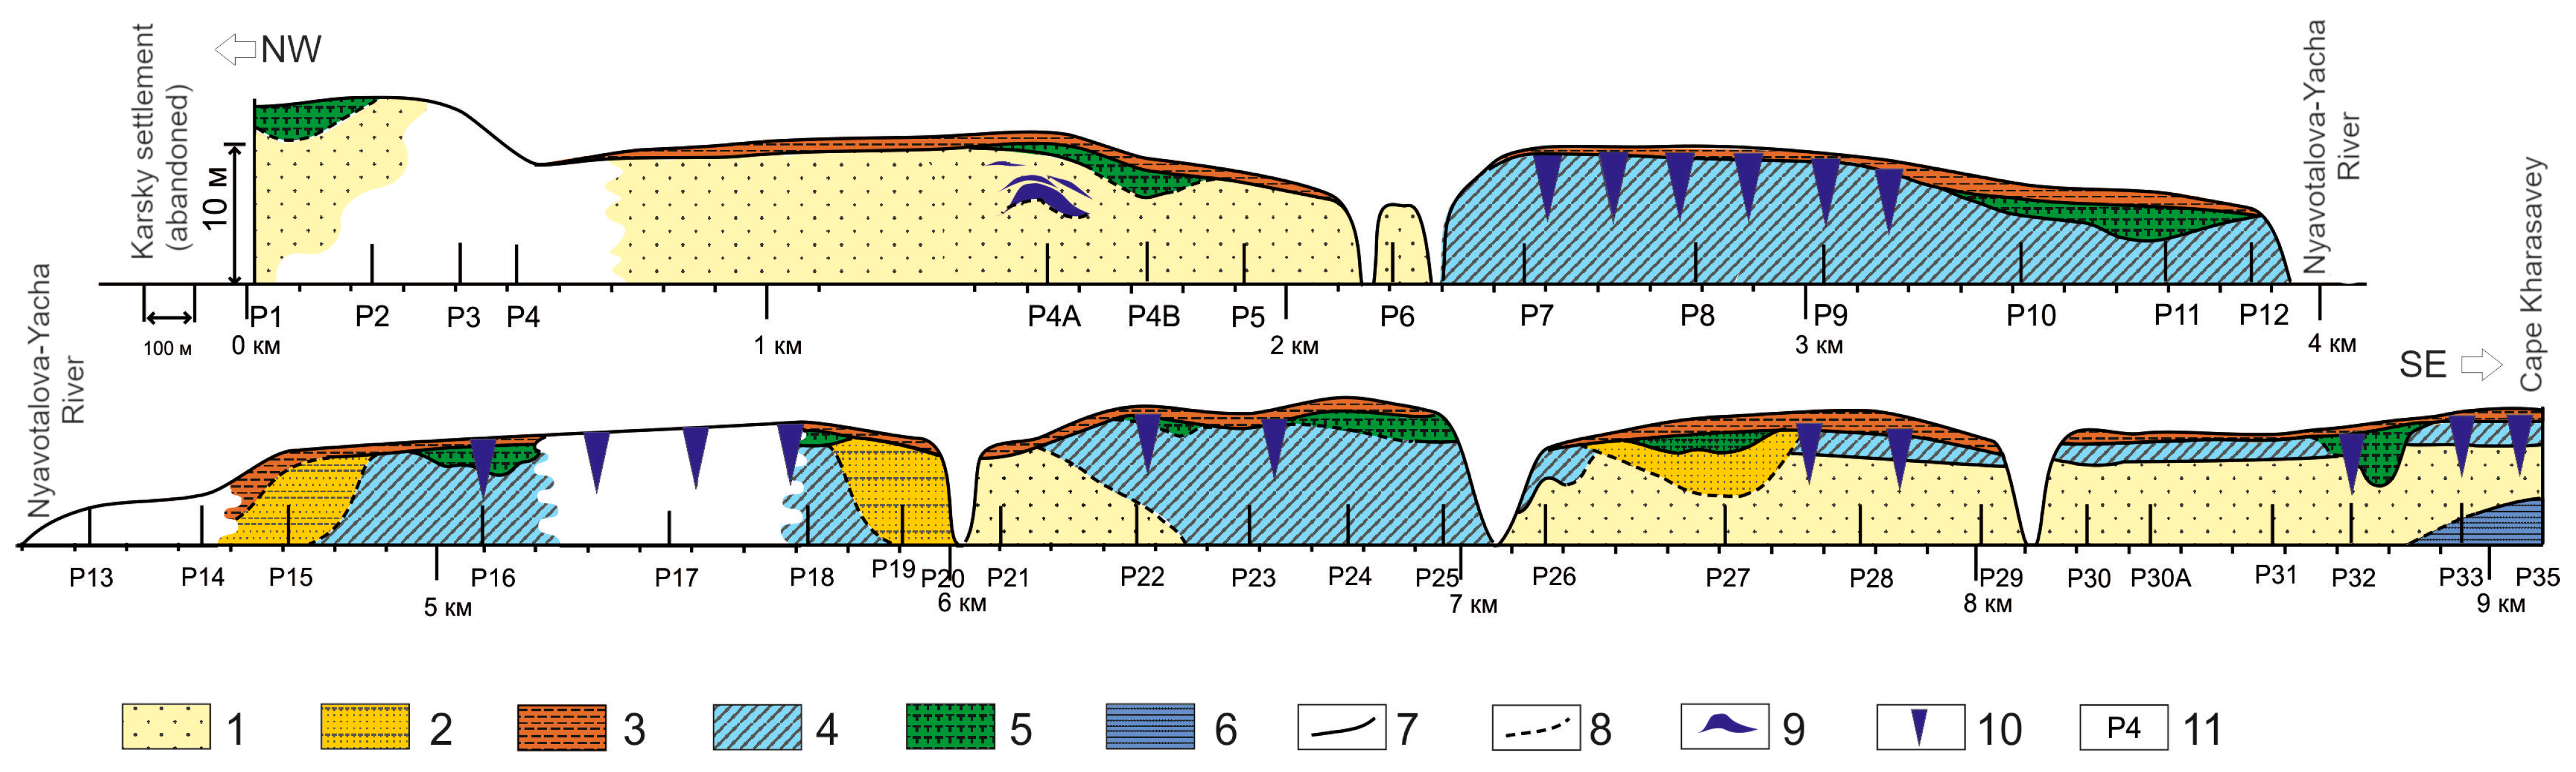
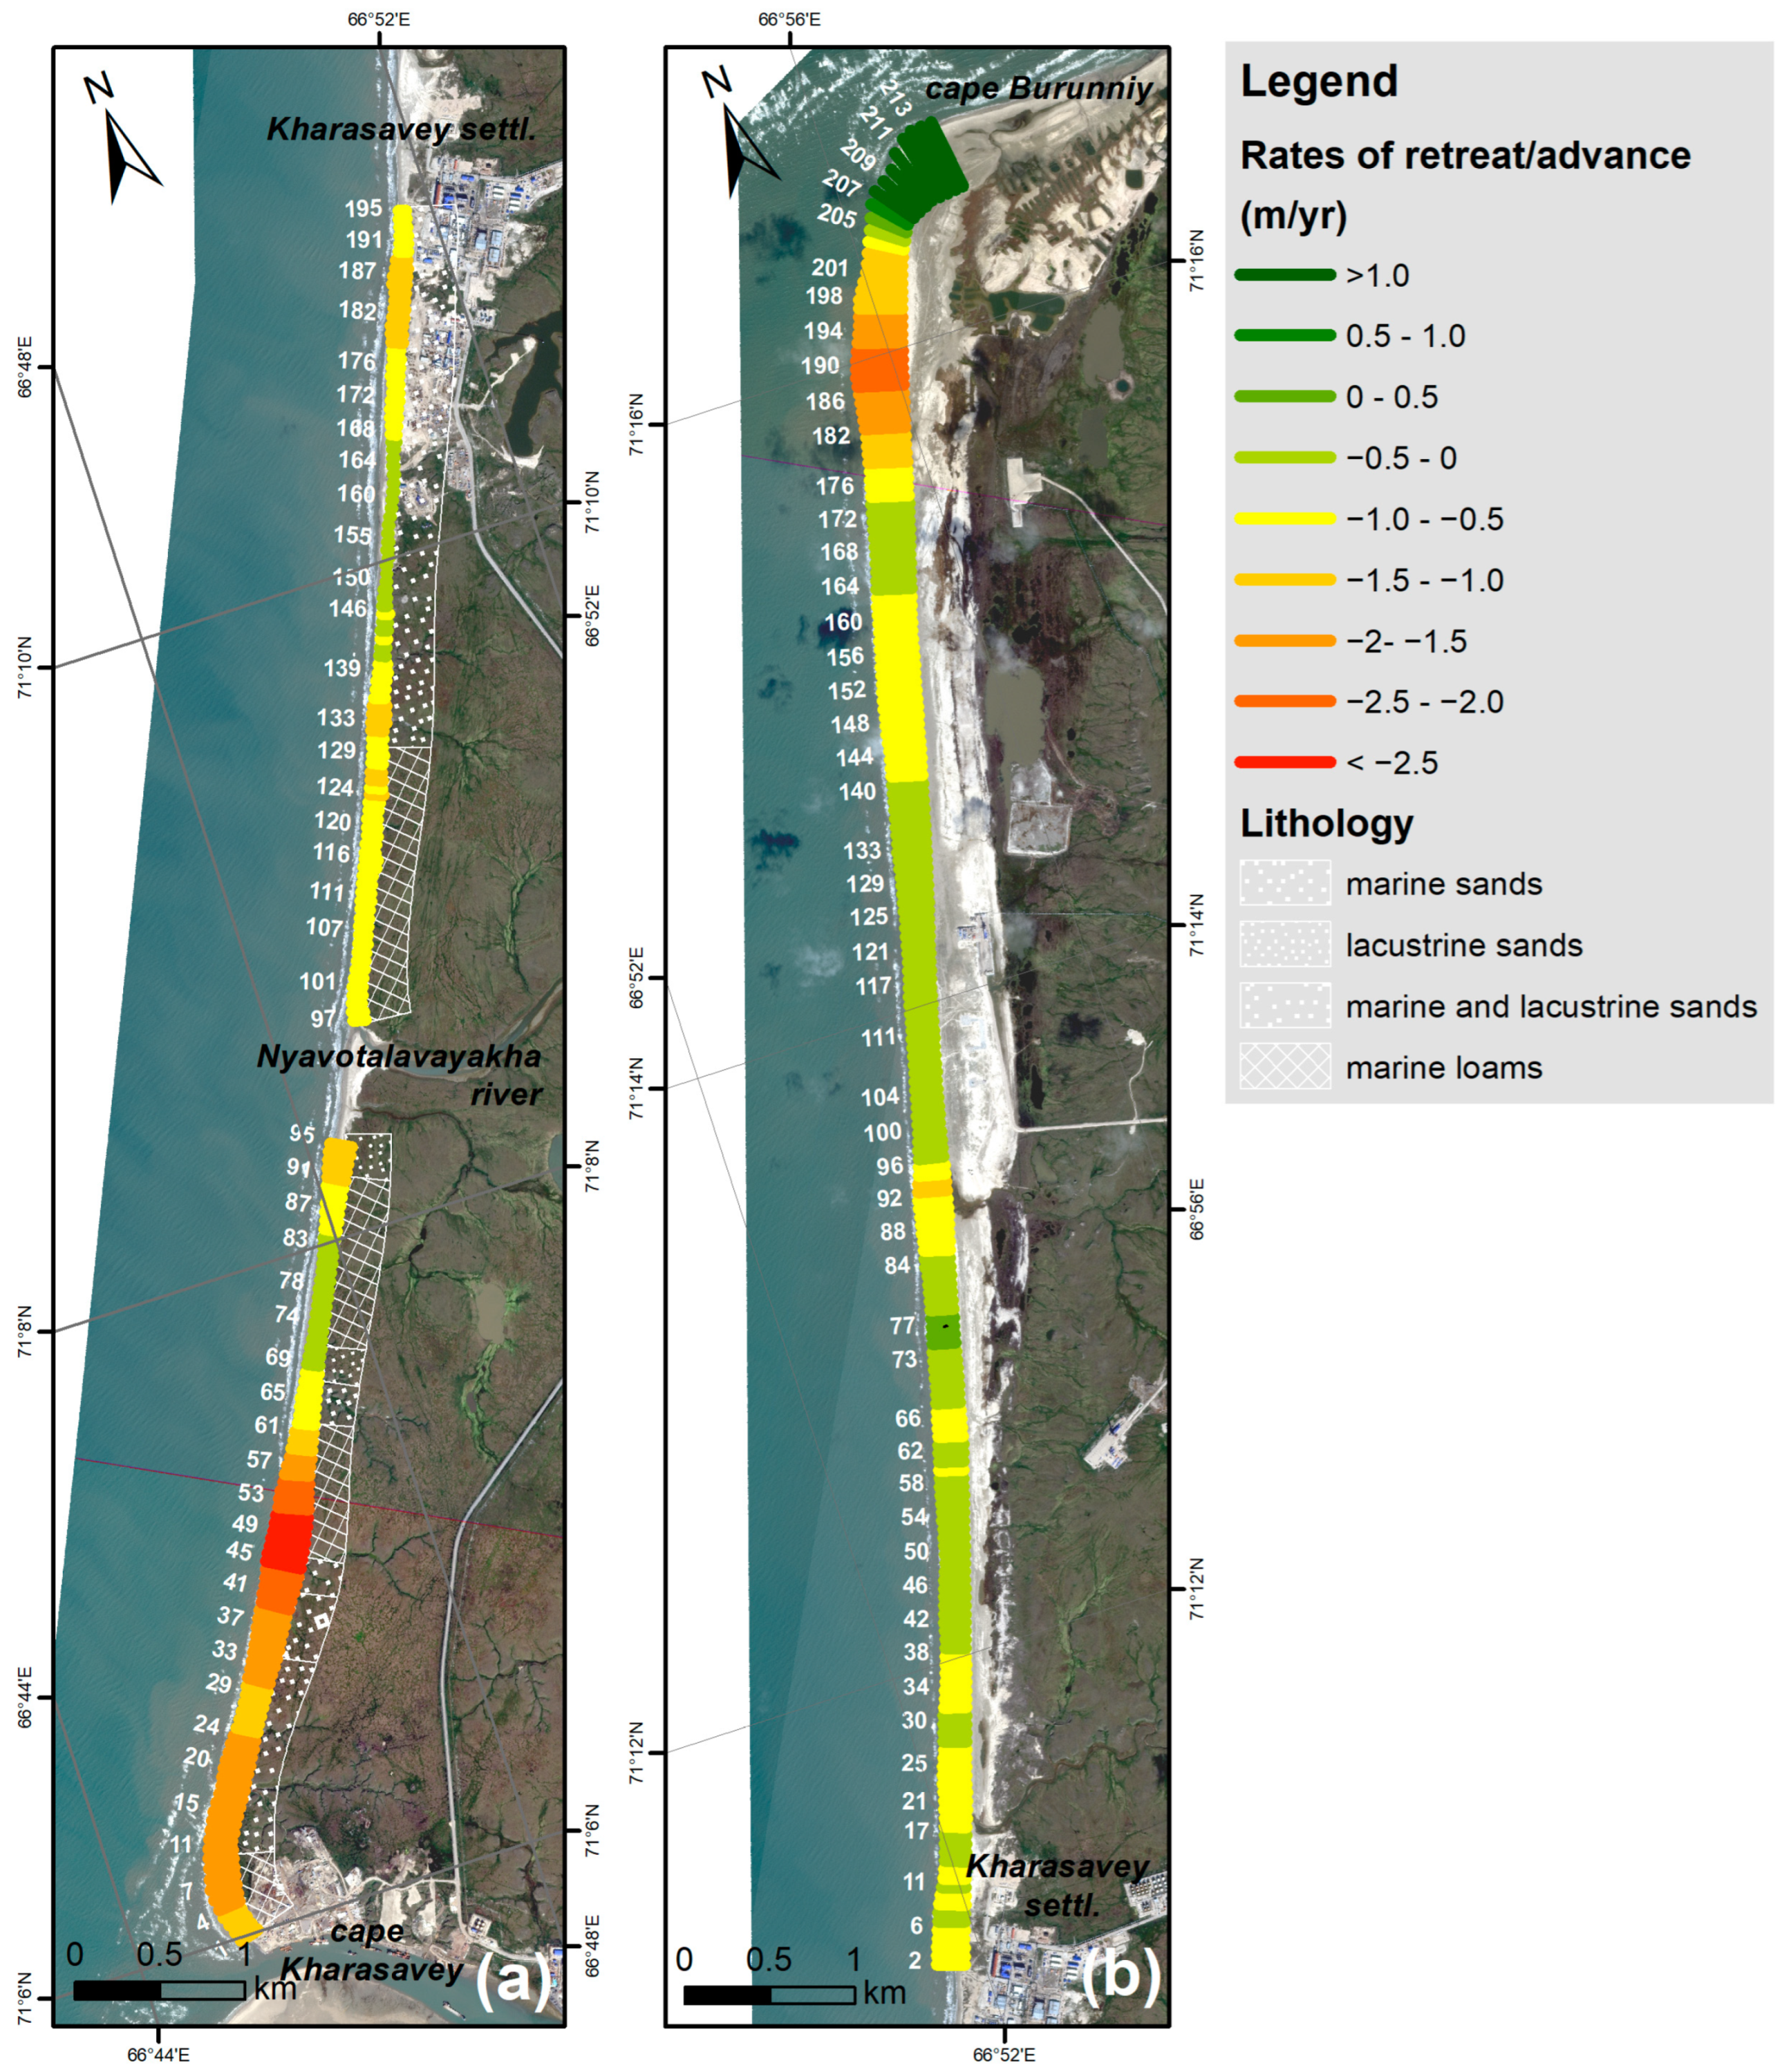
- Cryolithology. At the erosional part of the coast, we distinguished and mapped four principal types of sediments composing the cliffs: marine sands, lacustrine sands, marine and lacustrine sands and marine loams (Figure 11e).
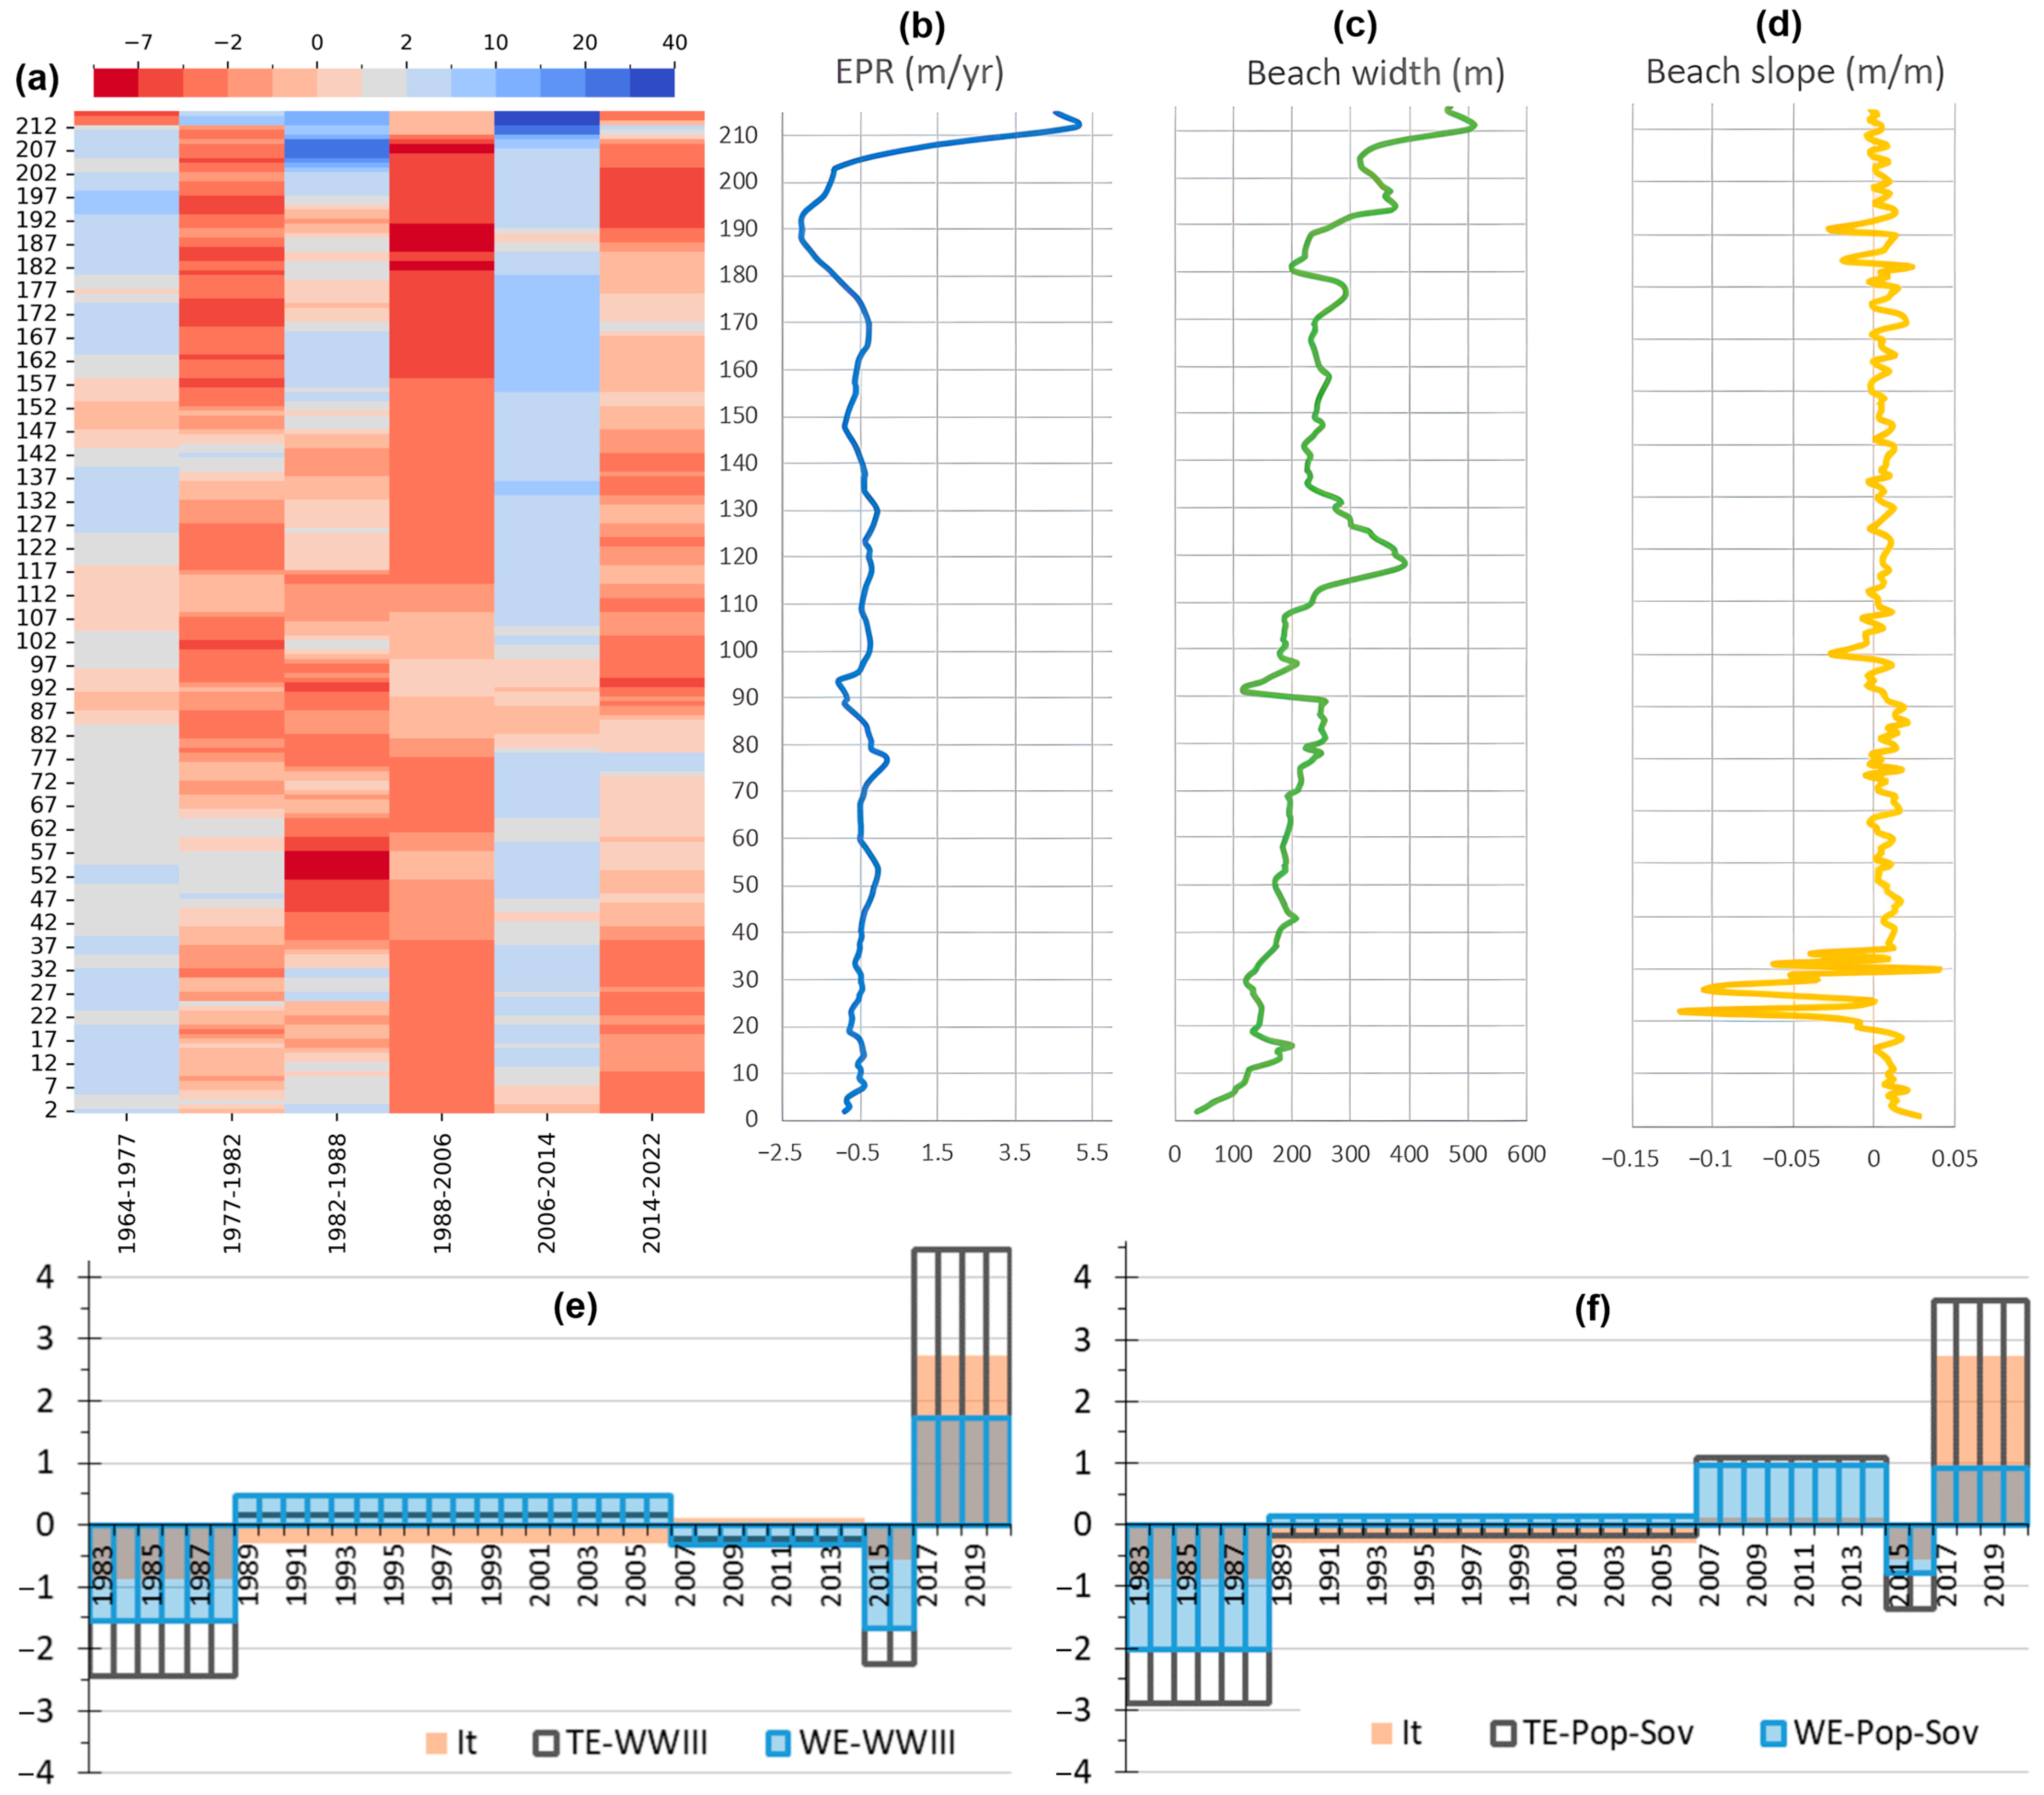
- Beach width. The width of the beach has an average value 50 m at the erosional part of the coast and approximately 234 m at the accretional stretch (Figure 11c and Figure 12c). It varies significantly, especially at the accretional coast (standard deviation is 20 m at the erosional coast and 82 m at the accretional). It reaches its maximal value of 511 m at the NE in the area of Burunniy Cape, and its minimal value of 20 m at the SW part (32 transect). In general, the width of the beach is increasing towards the capes, especially at the SE of the accretional stretch. Correlation coefficients between beach width and rates of retreat/advance values are −0.267 for erosional coasts and 0.458 for accretional coasts.
- Bluff height. The height of the cliff was measured for the erosional part of the coast (Figure 12d). It amounts to 7.5 m in average, but it varies slightly (std = 1.9 m) along the coast. It is minimal in river valleys (up to 2.3 m), and it is maximal (13.2 m) in the NE part (transect 168). The correlation coefficient between cliff height and rates of retreat/advance values of erosional coasts is −0.052.
- Beach slope. Slope of the beach was calculated for the accretional stretch of the coast (Figure 12d). It has an average value 0.002, which varies substantially (std 0.017). It is maximal (0.040) in the SW part of the section (transect 30). It’s minimal (−0.004) in the same area (transect 20) and in some other areas of the coast (around −0.03 in the areas of transects 100 and 190). The values are not precise, though they present the general view. Correlation coefficient between beach slope and rates of retreat/advance values of accretional coasts is −0.063.
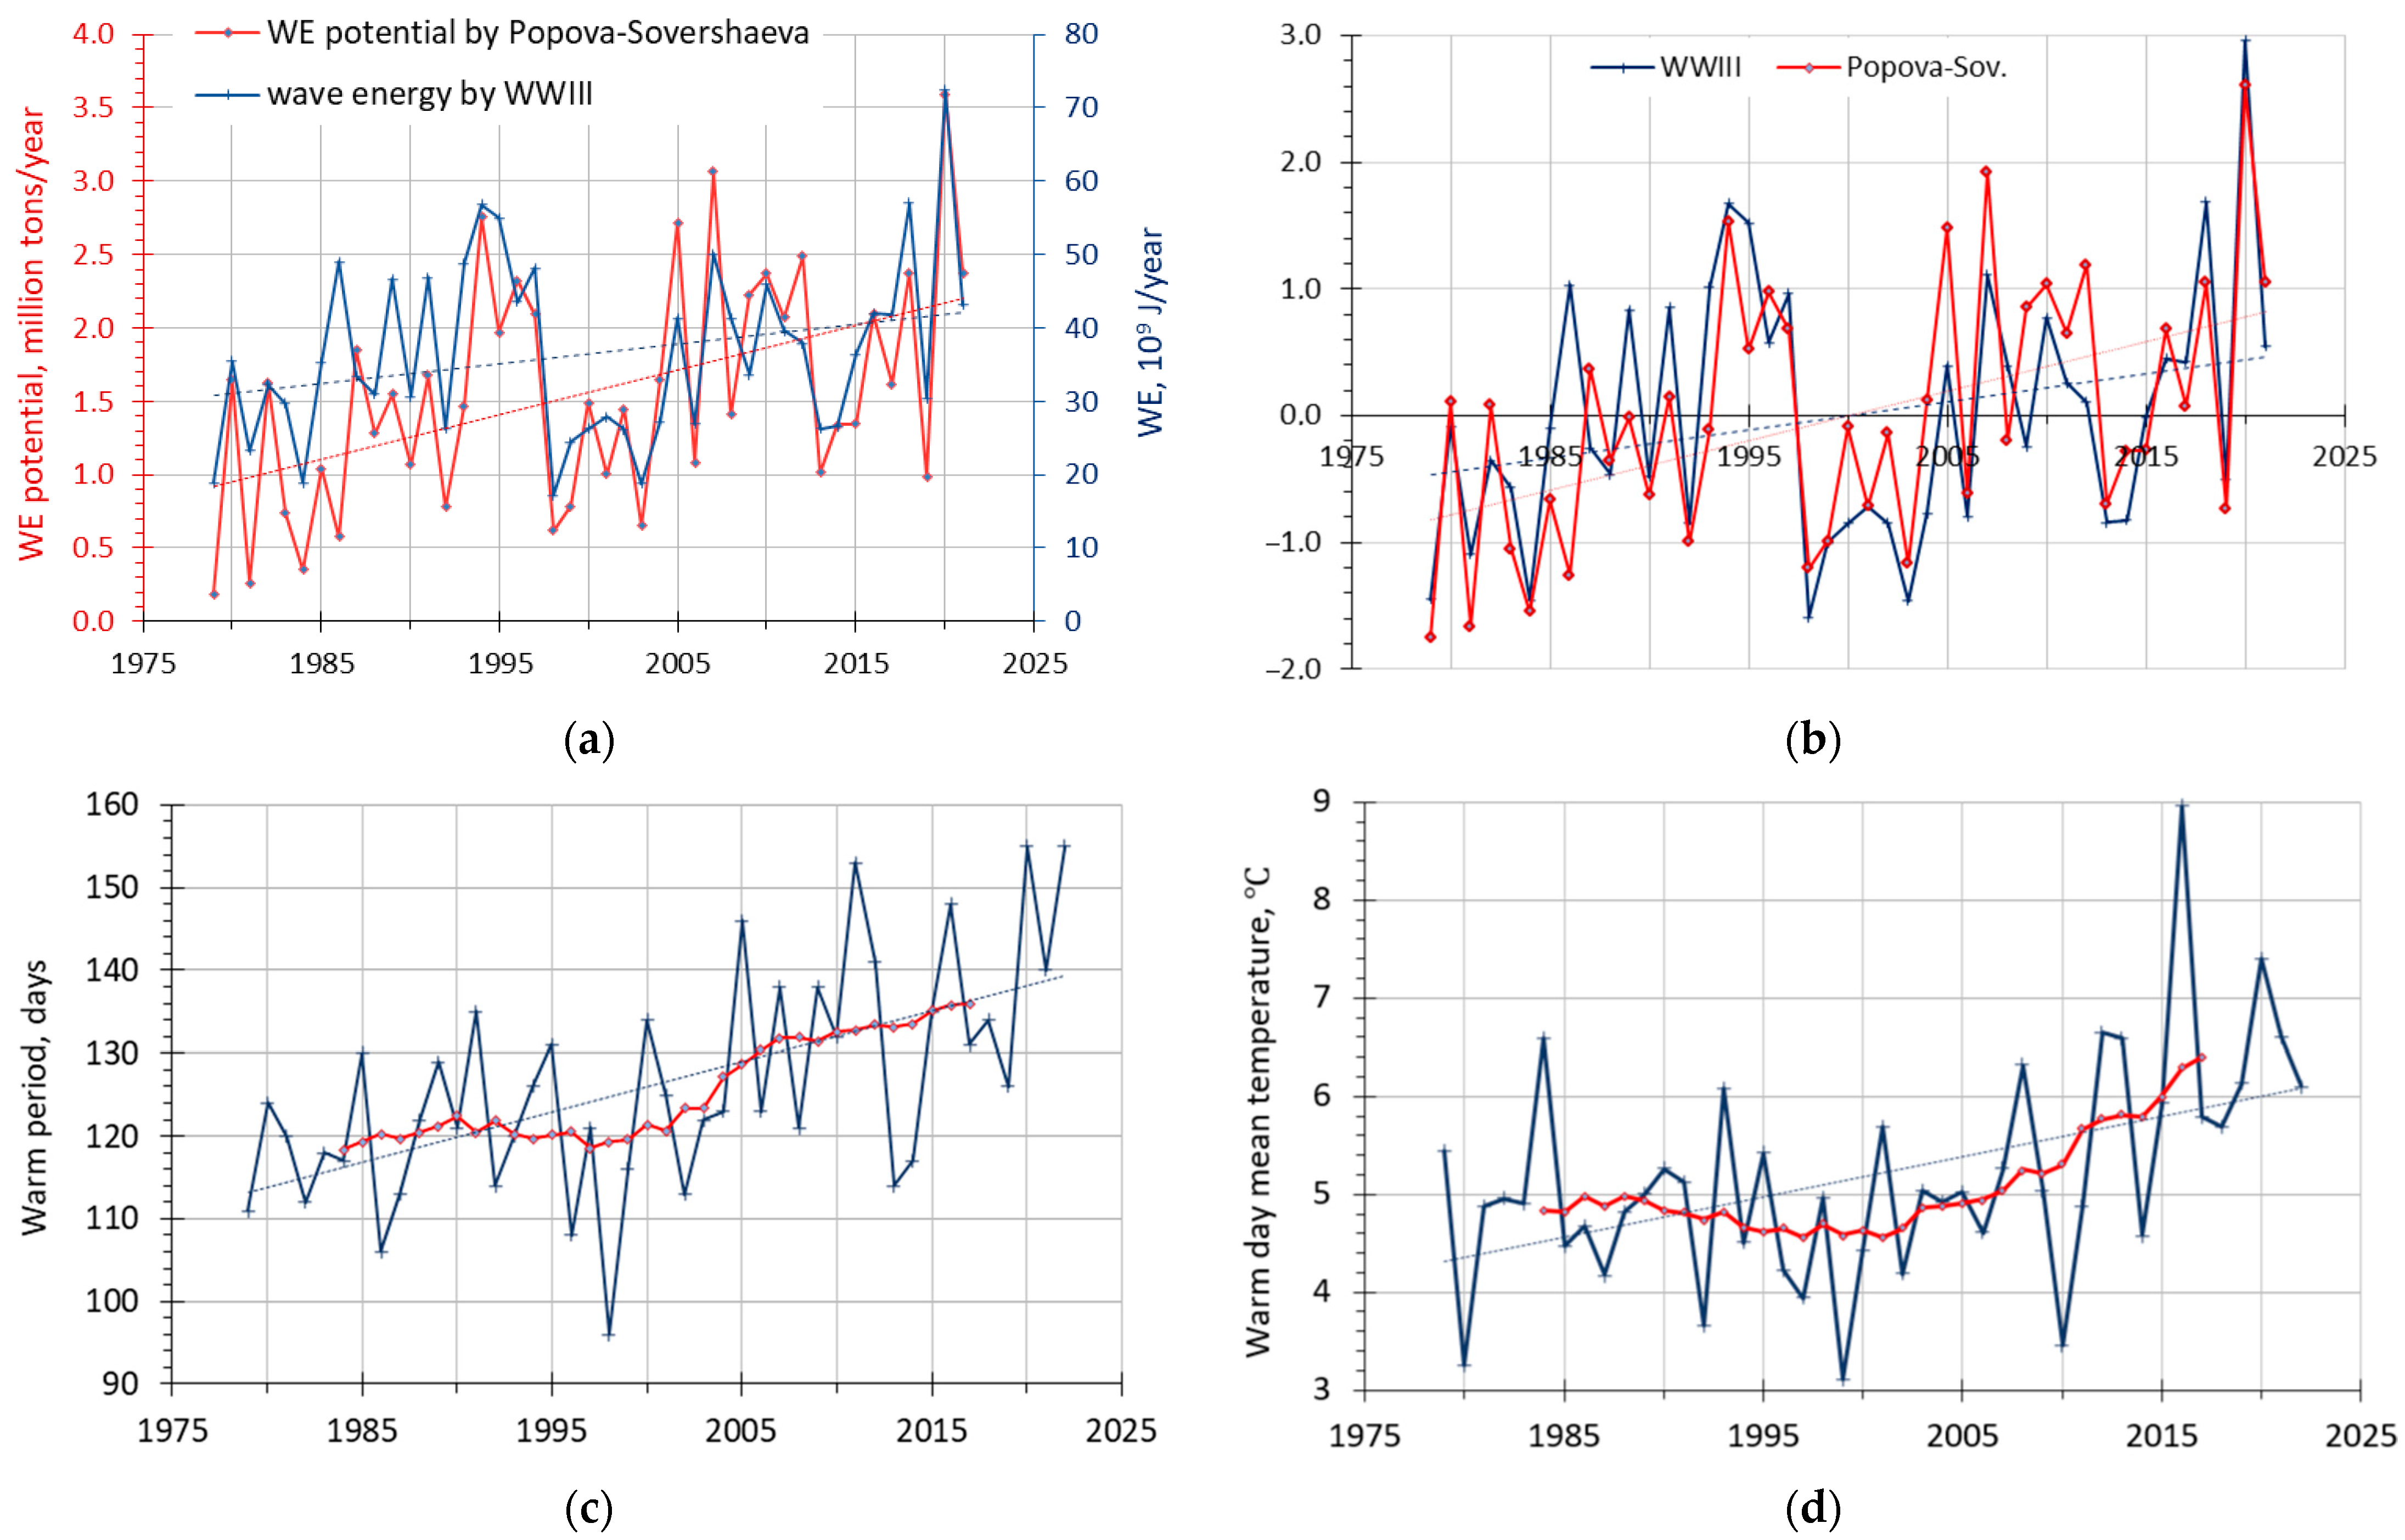
4.4. Hydrometeorological Forcing
- The main peaks coincide (especially high values in 1994, 2007, 2020 and low in 1979, 1981, 1984, 1992, 1998, 2004, 2013, 2019);
- Periods of relatively high (1994–1997, 2005–2012, 2016–2021) and low (1979−84, 1998–2003, 2013−15) values;
- Both series are characterized by high within-sample variability (for WWII it is 33% of mean value, for Popov–Sovershaev‘s WE-potential—50%);
- Both polylines have positive and statistically significant trends, which means that wave energy at Kharasavey area has increased since the beginning of the 1980s.
5. Discussion
5.1. Spatial and Temporal Patterns of Coastal Dynamics
5.2. Environmental Drivers Determining Spatial Variability of Coastal Dynamics
- Cryolithology. Lithological (grain size, consolidation, texture) and permafrost features (ice content, tabular/wedge ice presence) of coastal zone play an essential role in its dynamic, especially for permafrost coasts [26]. The cryolithological composition of the bluff varies substantially along the studied erosional coast (Figure 11e). Marine and lacustrine sands mainly have low (<30%) ice content, whereas marine loams have high (>40%) ice content [19]. Comparing the rates of retreat averaged by different types of lithology, the mostly eroded were the coasts, composed of a combination of marine and lacustrine sands (−1.9 m/yr on average). It is a small (450 m length) section of the coast between transects 35 and 41, which is why it may be confusing to compare it with larger areas of other lithological types. Transects with marine loams retreat with an average rate of 1.0 m/yr, that is slightly faster than transects with lacustrine and marine (separately) sands (−0.9 m/yr for every type). The coastal section in the SW part (45–51 transects) retreated the most considerably (Figure 6a) and is composed of marine loams with high ice content. Thus, neither average retreat rates are approximately similar, it was noted in the previous publications on this area [19,20], that this section is more prone to erosion. Lower resistivity to coastal erosion of fine-grained sediments (loams, silts, and fine sands), especially in permafrost environments (as containing more ice), compared to medium and coarse-grained sands was also determined in the other studies before [81,82].
- Beach width. One of the most important parameters influencing coastal erosion is the width of the beach, as the beach protects the coastal bluff from wave erosion. It was demonstrated for the Ural coast of Baydara Bay: after the beach width reduction with time, the rates of coastal retreat increased [11]. The correlation of beach width and the rates of retreat for both erosional and accretional coasts is extremely low (−0.267 and 0.458 for erosional and accretional stretch, respectively), that may be related to the ambiguity of beach extraction from imagery, or may indicate low significance of this parameter for coastal processes in the area (Figure 12c). However, at least at the accretional coast, we observe that as a general tendency, the higher beach corresponds to the decreased retreat rate, probably, due to the positive sediment supply.
- Bluff height. Theoretically, low coasts are more susceptible to coastal erosion than high ones, as they demand less wave energy to be eroded than the high ones, however, it does not always work [83,84]. The calculated coefficient of correlation between coastal bluff height and the rates of coastal retreat along the erosional stretch is negligible (−0.051), that may be explained by poor accuracy and reliability of the ArcticDEM that was used for calculation and due to predominance of other factors. Previous study [85] determined that at the Ural coast of Baydara Bay offshore depths and slope are the leading drivers of coastal retreat, while bluff height is of subordinate importance. Moreover, the change in bluff height along the studied section of the coast (Figure 11d) is not very substantial (std = 1.9 m), that is why in particular this factor apparently is not very crucial here.
- Beach slope. A steep slope of the beach may be both an indicator and/or a consequence of an intensive coastal erosion. The available DEM does not allow building any reliable correlation in the coastal zone: coefficient of correlation between the calculated rates of retreat/advance and beach slope for accretional stretch is −0.062. However, we see a decrease in the beach slope at the NE on Burunniy Cape, which correlates with an increase in the beach width, and with attenuation of coastal retreat, but not for every time period (Figure 12d).
5.3. Environmental Drivers Determining Temporal Variability of Coastal Behavior
5.4. Human Impact
6. Conclusions
- Both ice-rich permafrost bluffs and accretional sandy beaches exhibited a tendency towards persistent erosion. For the studied period (1964–2022), multi-decadal average rate of shoreline change is −1.03 m/yr for the erosional stretch and −0.42 m/yr for the accretional stretch. The presented rates are comparable to the other key sites with similar geomorphic features in the Kara Sea region.
- Shoreline change analysis revealed significant spatial and temporal variability of coastal retreat of the erosional stretch. The southwestern area in the alignment of Cape Kharasavey retains to be an erosional hotspot with peak retreat rates of up to −7.9 m/yr (for the period of 1982–1988). A slight recession of the annual average retreat rates was observed in recent decades. Yet, cluster analysis captured a progressive erosion along 71% of the erosional stretch. It might be due to the regional-scale intensification of wind–wave and thermal impact under conditions of ice-free period extension and permafrost thawing. In turn, the peak rates of coastal erosion are determined by local-scale, predominantly technogenic drivers. This study shows that appropriate examination of coastline behavior demands cross-proxy and intra-decadal observation of shoreline movements in order to separate contributions of long-term, regional and temporal, local-scale factors.
- On the contrary, non-linear, cyclical behavior of the accretional stretch is exerted by drastic changes in predominant winds and further reversals of the sediment fluxes during ice-free period extension. A total of 94% of the sandy beaches show a tendency to retreat. The peak rates of shoreline collapse were −8.99 m/yr (for the period of 1982–1988) and probably caused by initiation of the hydraulic sand fill works. Shoreline progradation (up to several tens of m/yr) was revealed locally, in the alignment of Cape Burunniy. Northeastern migration of this coastal reach may also be related to spit formation under the conditions of wind–wave energy fluctuations responding sea-ice decline.
- Comparative analysis of the shoreline rate change and the lithological structure revealed the highest erodibility of the permafrost bluffs that are composed of ice-rich marine loams (up to −2.75 m/yr at multi-decadal scale). However, average coastal change is similar among distinct composition (−1.0 m/yr for marine loams, −0.9 m/yr for marine and lacustrine sands). Assessment of geomorphic features suggested no clear cause-effect patterns. Correlation between shoreline behavior and coastal geomorphology is limited by low resolution and accuracy of applied data and/or by non-linear interplay of the geomorphic processes (thermal abrasion, thermal denudation, aeolian sedimentation, beach accretion, etc.) that contribute onshore morphology. High-resolution field data are required in order to further assessment of these drivers.
- Apart from the acceleration of the coastal erosion along the prevailing part of the coastline, no clear coherence of the wave and thermal impact with coastal change rates has been observed. It may be related to both human intervention, metachronous interplay of wind–wave and thermal impact and to the recession of peak wind rates during geomorphologically significant storm surges. This study revealed a rapid increase in the thermal impact in recent decades, while field investigation showed the absence of thermal-erosional niches and predominance of thermal denudation landforms. At the decadal scale, lack of the extreme wind rates is fully compensated by ice-free period extension and acceleration of thermal action. These climate changes coupled with growing exploration and development of the Arctic zone make investigation of the coastal behavior critically important.
Author Contributions
Funding
Data Availability Statement
Acknowledgments
Conflicts of Interest
References
- Irrgang, A.M.; Bendixen, M.; Farquharson, L.M.; Baranskaya, A.V.; Erikson, L.H.; Gibbs, A.E.; Ogorodov, S.A.; Overduin, P.P.; Lantuit, H.; Grigoriev, M.N.; et al. Drivers, dynamics and impacts of changing Arctic coasts. Nat. Rev. Earth Environ. 2022, 3, 39–54. [Google Scholar] [CrossRef]
- Jones, B.; Farquharson, L.; Baughman, C.; Buzard, R.; Arp, C.; Grosse, G.; Bull, D.L.; Günther, F.; Nitze, I.; Urban, F.; et al. A decade of remotely sensed observations highlight complex processes linked to coastal permafrost bluff erosion in the Arctic. Environ. Res. Lett. 2018, 1, 38–45. [Google Scholar] [CrossRef]
- Lantuit, H.; Overduin, P.P.; Couture, N.; Wetterich, S.; Are, F.; Atkinson, D.; Brown, J.; Cherkashov, G.; Drozdov, D.; Forbes, D.; et al. The Arctic Coastal Dynamics database: A new classification scheme and statistics on Arctic permafrost coastlines. Estuaries Coasts 2012, 35, 383–400. [Google Scholar] [CrossRef]
- Ogorodov, S.; Aleksyutina, D.; Baranskaya, A.; Shabanova, N.; Shilova, O. Coastal erosion of the Russian Arctic: An overview. J. Coast. Res. 2020, 95, 599–604. [Google Scholar] [CrossRef]
- Overduin, P.P.; Strzelecki, M.C.; Grigoriev, M.N.; Couture, N.; Lantuit, H.; St-Hilaire-Gravel, D.; Günther, F.; Wetterich, S. Coastal changes in the Arctic. Geol. Soc. 2014, 388, 103–129. [Google Scholar] [CrossRef]
- Günther, F.; Overduin, P.P.; Sandakov, A.V.; Grosse, G.; Grigoriev, M.N. Short- and long-term thermo-erosion of ice-rich permafrost coasts in the Laptev Sea region. Biogeosciences 2013, 10, 4297–4318. [Google Scholar] [CrossRef]
- Jones, B.M.; Arp, C.D.; Jorgenson, M.T.; Hinkel, K.M.; Schmutz, J.A.; Flint, P.L. Increase in the rate and uniformity of coastline erosion in Arctic Alaska. Geophys. Res. Lett. 2009, 36, 361–372. [Google Scholar] [CrossRef]
- Stark, N.; Green, B.; Brilli, N.; Eidam, E.; Franke, K.W.; Markert, K. Geotechnical Measurements for the Investigation and Assessment of Arctic Coastal Erosion—A Review and Outlook. J. Mar. Sci. Eng. 2022, 10, 914. [Google Scholar] [CrossRef]
- Günther, F.; Overduin, P.P.; Yakshina, I.A.; Opel, T.; Baranskaya, A.V.; Grigoriev, M.N. Observing Muostakh disappear: Permafrost thaw subsidence and erosion of a ground-ice-rich island in response to arctic summer warming and sea ice reduction. The Cryosphere 2015, 9, 151–178. [Google Scholar] [CrossRef]
- Vasiliev, A.K. Coastal Dynamics at the Barents and Kara Sea Key Sites. Geo-Mar. Lett. 2005, 25, 110–120. Available online: https://link.springer.com/article/10.1007/s00367-004-0192-z (accessed on 10 May 2023). [CrossRef]
- Novikova, A.; Belova, N.; Baranskaya, A.; Aleksyutina, D.; Maslakov, A.; Zelenin, E.; Shabanova, N.; Ogorodov, S. Dynamics of permafrost coasts of Baydaratskaya Bay (Kara Sea) based on multi-temporal remote sensing data. Remote Sens. 2018, 10, 1481. [Google Scholar] [CrossRef]
- Farquharson, L.M.; Mann, D.H.; Swanson, D.K.; Jones, B.M.; Buzard, R.M.; Jordan, J.W. Temporal and spatial variability in coastline response to declining sea-ice in northwest Alaska. Mar. Geol. 2018, 404, 71–83. [Google Scholar] [CrossRef]
- Nielsen, D.M.; Pieper, P.; Barkhordarian, A.; Overduin, P.; Ilyina, T.; Brovkin, V.; Baehr, J.; Dobrynin, M. Increase in Arctic coastal erosion and its sensitivity to warming in the twenty-first century. Nat. Clim. Chang. 2022, 12, 263–270. [Google Scholar] [CrossRef]
- Sánchez-Arcilla, A.; García-León, M.; Gracia, V.; Devoy, R.; Stanica, A.; Gault, J. Managing coastal environments under climate change: Pathways to adaptation. Sci. Total Environ. 2016, 572, 1336–1352. [Google Scholar] [CrossRef] [PubMed]
- Vasiliev, A.A.; Streletskaya, I.D.; Cherkashev, G.A.; Vanshtein, B.G. The Kara Sea coastal dynamics. Earth’s Cryosphere 2006, 10, 56–67. (In Russian) [Google Scholar]
- Vasilyev, A.A.; Shirokov, R.S.; Oblogov, G.E.; Streletskaya, I.D. Coastal dynamics of western Yamal. Earth’s Cryosphere 2010, 15, 72–75. (In Russian) [Google Scholar]
- Velikotsky, M.A.; Mudrov, Y.V. To the history of the development of perennial breeds in the north of Western Siberia. In Evolution of Eurasian cryolithozone in Upper Cenozoic; Popov, A.I., Ed.; Nauka Publication: Moscow, Russia, 1985; pp. 29–42. (In Russian) [Google Scholar]
- Popov, B.A.; Sovershaev, V.A.; Novikov, V.N.; Biryukov, V.Y.; Kamalov, A.M.; Fedorova, E.V. Coastal zone of the seas of the Pechora-Kara region. In Study of the Stability of the Geosystems of the North; Solomatin, V.I., Ed.; Moscow University Press: Moscow, Russia, 1988; pp. 176–190. (In Russian) [Google Scholar]
- Belova, N.G.; Shabanova, N.N.; Ogorodov, S.A.; Kamalov, A.M.; Kuznetsov, D.E.; Baranskaya, A.V.; Novikova, A.V. Erosion of permafrost coasts of Kara Sea near Kharasavey Cape, Western Yamal. Earth’s Cryosphere 2017, 21, 73–83. [Google Scholar]
- Belova, N.G.; Novikova, A.V.; Günther, F.; Shabanova, N.N. Spatiotemporal variability of coastal retreat rates at western Yamal Peninsula, Russia, based on remotely sensed data. J. Coast. Res. 2020, 95, 367–371. [Google Scholar] [CrossRef]
- Kaplyanskaya, F.A. Ice wedges in moraine deposits of the Western Yamal, at Kharasavey settlement. In Ice Wedges of the Cryolithozone; SO AN USSR Permafrost Institute Publication: Yakutsk, Russia, 1982; pp. 71–80. (In Russian) [Google Scholar]
- Grigoriev, N.F. Permafrost of the Western Yamal Nearshore Zone; SO AN USSR Permafrost Institute Publication: Yakutsk, Russia, 1987; 112p. (In Russian) [Google Scholar]
- Astakhov, V.I.; Kaplyanskaya, F.A.; Tarnogradsky, V.D. Pleistocene permafrost of West Siberia as a deformable glacier bed. Perm. Perigl. Proc. 1996, 7, 165–191. [Google Scholar] [CrossRef]
- Yuryev, I.V. Problems of gas facilities operations in the coastal zone of the Western Yamal. Earth’s Cryosphere 2009, 13, 46–54. (In Russian) [Google Scholar]
- Cryosphere of Oil, Gas and Condensate Fields on the Yamal Peninsula; Vol.1 Cryosphere of Kharasavey Gas Condensate Field; Vasilchuk, Y.K.; Krylov, G.V.; Podborniy, E.E. (Eds.) Nedra Publishers: St. Petersburg, Russia, 2006; p. 346. (In Russian) [Google Scholar]
- Are, F.E. Thermal abrasion of sea coasts. Polar Geogr. Geol. 1988, 12, 87–155. [Google Scholar] [CrossRef]
- Are, F.; Reimnitz, E. The A and m coefficients in the Bruun/Dean equilibrium profile equation seen from the Arctic. J. Coast. Res. 2008, 2, 243–249. [Google Scholar] [CrossRef]
- Leontiev, I.O. Forecast of coastal changes based on morphodynamical modeling. Oceanology 2006, 46, 564–572. [Google Scholar] [CrossRef]
- Gibbs, A.E.; Erikson, L.H.; Jones, B.M.; Richmond, B.M.; Engelstad, A.C. Seven Decades of Coastal Change at Barter Island, Alaska: Exploring the Importance of Waves and Temperature on Erosion of Coastal Permafrost Bluffs. Remote Sens. 2021, 13, 4420. [Google Scholar] [CrossRef]
- Tolman, H. The WAVEWATCH III Development Group User Manual and System Documentation of WAVEWATCH III Version 6.07. Tech. Note 333, NOAA/NWS/NCEP/MMAB 2019. Available online: https://www.researchgate.net/publication/336069899_User_manual_and_system_documentation_of_WAVEWATCH_III_R_version_607 (accessed on 18 December 2022).
- Popov, B.A.; Sovershaev, V.A. Some features of the coastal dynamics in the Asian Arctic. Vopr. Geogr. 1982, 119, 105–116. (In Russian) [Google Scholar]
- Shabanova, N.; Ogorodov, S.; Shabanov, P.; Baranskaya, A. Hydrometeorological forcing of western Russian Arctic coastal dynamics: XX-century history and current state. Geogr. Environ. Sustain. 2018, 11, 113–129. [Google Scholar] [CrossRef]
- Trofimov, V.T. (Ed.) Yamal Peninsula; MSU Publication: Moscow, Russia, 1975; p. 278. (In Russian) [Google Scholar]
- Kara Sea. Ecological Atlas; Pavlov, V.A.; Lebedeva, E.S.; Lakeev, V.G. (Eds.) Arctic Scientific Center LLC: Moscow, Russia, 2016. (In Russian) [Google Scholar]
- Romanenko, F.A. Regional features of Arctic coastal evolution during Holocene. Geomophologia 2012, 4, 81–92. [Google Scholar]
- Porter, C.; Morin, P.; Howat, I.; Noh, M.; Bates, B.; Peterman, K.; Keesey, S.; Schlenk, M.; Gardiner, J.; Tomko, K.; et al. ArcticDEM; Harvard Dataverse: Cambridge, MA, USA, 2018. [Google Scholar]
- German, E.V.; Kislyakov, V.N.; Reinin, I.V. Geology and geomorphology of the Yamal Peninsula—New area perspective for oil and gas investigations. Proc. VNIGRI 1963, 225, 311–329. (In Russian) [Google Scholar]
- Weather and Climate (Pogoda I Klimat), Weather Records at Marre-Sale Weather Station. Available online: http://www.pogodaiklimat.ru/history/23032.htm (accessed on 1 March 2023).
- Lopatukhin, L.I.; Bukhanovskii, A.V.; Chernysheva, E.S. Reference Data on the Wind and Wave Regime of the Japanese and Kara Seas; Russian Maritime Register of Shipping: St. Petersburg, Russia, 2009; p. 356. (In Russian) [Google Scholar]
- Ogorodov, S.A.; Shabanova, N.N.; Kessel, A.S.; Baranskaya, A.V.; Razumov, S.O. Changes of the hydrometeorological potential of thermoabrasion on the Russian Arctic sea coasts. Vest. Mosk. Univ. Ser. Geogr. 2022, 1, 26–42. (In Russian) [Google Scholar]
- Ogorodov, S.A.; Baranskaya, A.V.; Belova, N.G.; Kamalov, A.M.; Kuznetsov, D.E.; Overduin, P.; Shabanova, N.N.; Vergun, A.P. Coastal Dynamics of the Pechora and Kara Seas Under Changing Climatic Conditions and Human Disturbances. Geogr. Environ. Sustain. 2016, 3, 53–73. [Google Scholar] [CrossRef]
- Shabanov, P.A. Changes in the Ice-Free Period Duration in the Kara Sea Coastal Zone from Satellite Data. Oceanology 2022, 62, 447–457. [Google Scholar] [CrossRef]
- Ogorodov, S.; Badina, S.; Bogatova, D. Sea Coast of the Western Part of the Russian Arctic under Climate Change: Dynamics, Technogenic Influence and Potential Economic Damage. Climate 2023, 11, 143. [Google Scholar] [CrossRef]
- EarthExplorer—Home. Available online: https://earthexplorer.usgs.gov/ (accessed on 1 April 2023).
- ESRI ArcGIS Desktop, Release 10.2.2; Environmental Systems Research Institute: Redlands, CA, USA, 2014.
- Dolan, R.; Fenster, M.S.; Holme, S.J. Temporal analysis of shoreline recession and accretion. J. Coast. Res. 1991, 7, 723–744. [Google Scholar]
- Boak, E.H.; Turner, I.L. Shoreline Definition and Detection: A Review. J. Coast. Res. 2005, 21, 688–703. [Google Scholar] [CrossRef]
- Hanslow, D. Beach erosion trend measurement: A comparison of trend indicators. J. Coast. Res. 2007, 50, 588–593. Available online: https://www.jstor.org/stable/26481655 (accessed on 20 June 2023).
- Carapuço, M.M.; Taborda, R.; Silveira, T.M.; Psuty, N.P.; Andrade, C.; Freitas, M.C. Coastal geoindicators: Towards the establishment of a common framework for sandy coastal environments. Earth-Sci. Rev. 2016, 154, 183–190. [Google Scholar] [CrossRef]
- Pollard, J.A.; Spencer, T.; Brooks, S.M.; Christie, E.K.; Möller, I. Understanding spatio-temporal barrier dynamics through the use of multiple shoreline proxies. Geomorphology 2020, 354, 107058. [Google Scholar] [CrossRef]
- Irrgang, A.M.; Lantuit, H.; Manson, G.K.; Günther, F.; Grosse, G.; Overduin, P.P. Variability in rates of coastal change along the Yukon coast, 1951 to 2015. J. Geophys. Res. Earth Surf. 2018, 123, 779–800. [Google Scholar] [CrossRef]
- Himmelstoss, E.A.; Henderson, R.E.; Kratzmann, M.G.; Farris, A.S. Digital Shoreline Analysis System (DSAS) ver. 5.1 User Guide: USGS Open-File Report 2021–1091; U.S. Geological Survey: Reston, VA, USA, 2021; 104p. [CrossRef]
- Ward, J.H. Hierarchical grouping to optimize an objective function. J. Amer. Stat. As. 1963, 58, 236–244. [Google Scholar] [CrossRef]
- Hennig, C.; Meila, M.; Murtagh, F.; Rocci, R. Handbook of Cluster Analysis; Chapman and Hall/CRC: Boca Raton, FL, USA, 2015; p. 753. [Google Scholar] [CrossRef]
- Wu, J. Advances in k-Means Clustering: A Data Mining Thinking; Springer: Berlin/Heidelberg, Germany, 2012; p. 180. [Google Scholar] [CrossRef]
- GEBCO Compilation Group. GEBCO_2022 Grid; GEBCO Compilation Group: White Marsh, MD, USA, 2022. [Google Scholar] [CrossRef]
- Hersbach, H.; Bell, B.; Berrisford, P.; Hirahara, S.; Horányi, A.; Muñoz-Sabater, J.; Nicolas, J.; Peubey, C.; Radu, R.; Schepers, D.; et al. The ERA5 global reanalysis. Q. J. R. Meteorol. Soc. 2020, 146, 1999–2049. [Google Scholar] [CrossRef]
- Gelaro, R.; McCarty, W.; Suárez, M.J.; Todling, R.; Molod, A.; Takacs, L.; Randles, C.A.; Darmenov, A.; Bosilovich, M.G.; Reichle, R.; et al. The modern-era retrospective analysis for research and applications, version 2 (MERRA-2). J. Clim. 2017, 30, 5419–5454. [Google Scholar] [CrossRef]
- Meier, W.; Fetterer, F.; Windnagel, A.; Stewart, J. NOAA/NSIDC Climate Data Record of Passive Microwave Sea Ice Concentration, Version 4. [G02202]; NSIDC (National Snow and Ice Data Center): Boulder, CO, USA, 2017. [Google Scholar]
- Shabanov, P.; Shabanova, N. Ice-free period detection method in the Arctic coastal zone. Russ. J. Earth. Sci. 2020, 20, ES6016. [Google Scholar] [CrossRef]
- Rogers, W.E.; Babanin, A.V.; Wang, D.W. Observation consistent input and white capping dissipation in a model for wind generated surface waves: Description and simple calculations. J. Atmos. Ocean. Technol. 2012, 29, 1329–1346. [Google Scholar] [CrossRef]
- Zieger, S.; Babanin, A.V.; Rogers, W.E.; Young, I.R. Observation based source terms in the third-generation wave model WAVEWATCH. Ocean. Mod. 2015, 96, 2–25. [Google Scholar] [CrossRef]
- Liu, Q.; Rogers, W.E.; Babanin, A.V.; Young, I.R.; Romero, L.; Zieger, S.; Qiao, F.; Guan, C. Observation-based source terms in the third-generation wave model WAVEWATCH III: Updates and verification. J. Phys. Ocean. 2018, 4, 10. [Google Scholar] [CrossRef]
- Myslenkov, S.; Kruglova, E.; Medvedeva, A.; Silvestrova, K.; Arkhipkin, V.; Akpinar, A.; Dobrolyubov, S. Number of Storms in Several Russian Seas: Trends and Connection to Large-Scale Atmospheric Indices. Russ. J. Earth Sci. 2023, 23, ES000828. [Google Scholar] [CrossRef]
- Saha, S.; Moorthi, S.; Pan, H.L.; Wu, X.; Wang, J.; Nadiga, S.; Goldberg, M. The NCEP climate forecast system reanalysis. Bull. Am. Meteorol. Soc. 2010, 91, 1015–1057. [Google Scholar] [CrossRef]
- Saha, S.; Moorthi, S.; Wu, X.; Wang, J.; Nadiga, S.; Tripp, P.; Becker, E. The NCEP Climate Forecast System Version 2. J. Clim. 2014, 27, 2185–2208. [Google Scholar] [CrossRef]
- NCAR Research Data Archive. Available online: https://rda.ucar.edu (accessed on 10 May 2023).
- Marine Geology and Geophysics Data. Available online: https://www.ngdc.noaa.gov/mgg/global/ (accessed on 10 May 2023).
- Myslenkov, S.; Platonov, V.; Kislov, A.; Silvestrova, K.; Medvedev, I. Thirty-Nine-Year Wave Hindcast, Storm Activity, and Probability Analysis of Storm Waves in the Kara Sea, Russia. Water 2021, 13, 648. [Google Scholar] [CrossRef]
- Myslenkov, S.A.; Platonov, V.S.; Dobrolyubov, S.A.; Silvestrova, K.P. Increase in Storm Activity in the Kara Sea from 1979 to 2019: Numerical Simulation Data. Dokl. Earth Sci. 2021, 498, 502–508. [Google Scholar] [CrossRef]
- Platonov, V.S.; Myslenkov, S.A.; Arkhipkin, V.S.; Kislov, A.V. High-resolution modeling of hydrometeorological fields over the Kara Sea coastal regions with irregular coastline. Vest. Mosk. Univ. Ser. Geogr. 2022, 1, 87–106. (In Russian) [Google Scholar]
- Myslenkov, S.; Shestakova, A.; Chechin, D. The impact of sea waves on turbulent heat fluxes in the Barents Sea according to numerical modeling. Atmos. Chem. Phys. 2021, 21, 5575–5595. [Google Scholar] [CrossRef]
- Andersland, O.B.; Ladanyi, B. Frozen Ground Engineering, 2nd ed.; John Wiley & Sons: Hoboken, NJ, USA, 2004. [Google Scholar]
- Baranskaya, A.; Novikova, A.; Shabanova, N.; Romanenko, F.; Ogorodov, S. Late quaternary and modern evolution of permafrost coasts at Beliy island, Kara Sea. J. Coast. Res. 2020, 95, 356–361. [Google Scholar] [CrossRef]
- Belova, N.; Ermolov, A.; Novikova, A.; Ogorodov, S.; Stanilovskaya, Y. Dynamics of Low-Lying Sandy Coast of the Gydan Peninsula, Kara Sea, Russia, Based on Multi-Temporal Remote Sensing Data. Remote Sens. 2023, 15, 48. [Google Scholar] [CrossRef]
- Hequette, A.; Ruz, M.H. Spit and barrier island migration in the southeastern Canadian Beaufort Sea. J. Coast. Res. 1991, 7, 677–698. Available online: https://www.jstor.org/stable/4297885 (accessed on 10 May 2023).
- Tweedie, C.E.; Aguirre, A.; Cody, R.; Vargas, S.; Brown, J. Spatial and temporal dynamics of erosion along the Elson Lagoon Coastline near Barrow, Alaska (2002–2011). In Proceedings of the Tenth International Conference on Permafrost, Salekhard, Russia, 25–29 June 2012; pp. 25–29. [Google Scholar]
- Baranskaya, A.; Novikova, A.; Shabanova, N.; Belova, N.; Maznev, S.; Ogorodov, S.; Jones, B.M. The role of thermal denudation in erosion of ice-rich permafrost coasts in an enclosed bay. Front. Earth Sci. 2021, 8, 566227. [Google Scholar] [CrossRef]
- Atkinson, D.E. Observed storminess patterns and trends in the circum-Arctic coastal regime. Geo-Mar. Lett. 2005, 25, 98–109. [Google Scholar] [CrossRef]
- Mars, J.C.; Houseknecht, D.W. Quantitative remote sensing study indicates doubling of coastal erosion rate in past 50 yr along a segment of the Arctic coast of Alaska. Geology 2007, 35, 583–586. [Google Scholar] [CrossRef]
- Mackay, J.R. Notes on the shoreline recession along the coast of the Yukon Territory. Arctic 1963, 16, 195–197. [Google Scholar] [CrossRef]
- Hopkins, D.M.; Hartz, R.W. Coastal Morphology, Coastal Erosion, and Barrier Islands of the Beaufort Sea, Alaska; Report No. 78-1063; U.S. Geological Survey: Reston, VA, USA, 1978. [CrossRef]
- Lantuit, H.; Overduin, P.P.; Wetterich, S. Recent Progress Regarding Permafrost Coasts. Permafr. Periglac. Process. 2013, 24, 120–130. [Google Scholar] [CrossRef]
- Konopczak, A.M.; Manso, G.K.; Couture, N.J. Variability of Coastal Change along the Western Yukon Coast, Geological Survey of Canada Open File Report; Geological Survey of Canada: Ottawa, ON, Canada, 2014; 81p.
- Islam, M.A.; Lubbad, R.; Afzal, M.S. A Probabilistic Model of Coastal Bluff-Top Erosion in High Latitudes Due to Thermoabrasion: A Case Study from Baydaratskaya Bay in the Kara Sea. J. Mar. Sci. Eng. 2020, 8, 169. [Google Scholar] [CrossRef]
- Romanenko, F.A.; Baranskaya, A.V.; Ermolov, A.A.; Kokin, O.V. Low coasts of the Western Arctic Seas: Genesis, age and modern dynamics. Vopr. Geogr. 2015, 140, 275–3060. (In Russian) [Google Scholar]
- Ogorodov, S.; Baranskaya, A.; Shabanova, N.; Belova, N.; Bogatova, D.; Novikova, A.; Selyuzhenok, V. Erosion of the russian arctic coasts in changing environment. In Proceedings of the 39th IAHR World Congress, Granada, Spain, 19–24 June 2022. [Google Scholar]
- Biskaborn, B.K.; Smith, S.L.; Noetzli, J. Permafrost is warming at a global scale. Nat. Commun. 2019, 10, 264. [Google Scholar] [CrossRef]
- Overland, J.; Dunlea, E.; Box, J.E.; Corell, R.; Forsius, M.; Kattsov, V.; Olsen, M.S.; Pawlak, J.; Reiersen, L.-O.; Wang, M. The urgency of Arctic change. Polar Sci. 2019, 21, 6–13. [Google Scholar] [CrossRef]
- Bernatchez, P.; Fraser, C.; Lefaivre, D.; Dugas, S. Integrating anthropogenic factors, geomorphological indicators and local knowledge in the analysis of coastal flooding and erosion hazards. Ocean. Coast. Manag. 2011, 54, 621–632. [Google Scholar] [CrossRef]
- Hapke, C.; Kratzmann, M.; Himmelstoss, E. Geomorphic and human influence on large-scale coastal change. Geomorphology 2013, 199, 160–170. [Google Scholar] [CrossRef]
- Bartsch, A.; Pointner, G.; Nitze, I.; Efimova, A.; Jakober, D.; Ley, S.; Högström, E.; Grosse, G.; Schweitzer, P. Expanding infrastructure and growing anthropogenic impacts along Arctic coasts. Environ. Res. Lett. 2021, 16, 115013. [Google Scholar] [CrossRef]
- Jaskólski, M. Challenges and perspectives for human activity in Arctic coastal environments—A review of selected interactions and problems. Misc. Geogr. 2011, 25, 127–143. [Google Scholar] [CrossRef]
- Ogorodov, S.A. Human impacts on coastal stability in the Pechora Sea. Geo-Marine Lett. 2005, 25, 190–195. [Google Scholar] [CrossRef]
- Provoost, S.; Jones, M.L.M.; Edmondson, S.E. Changes in landscape and vegetation of coastal dunes in northwest Europe: A review. J. Coast. Conserv. 2011, 15, 207–226. [Google Scholar] [CrossRef]
- Burningham, H.; French, J. Understanding coastal change using shoreline trend analysis supported by cluster-based segmentation. Geomorphology 2017, 282, 131–149. [Google Scholar] [CrossRef]
- Launch of Kharasaveyskoye Gas and Condensate Field. 20 March 2019. Available online: http://en.kremlin.ru/events/president/news/60113 (accessed on 20 March 2023).


| Sensor | Acquisition Date | Spatial Resolution (m) | Referencing Uncertainty (m) |
|---|---|---|---|
| KH-4A Corona | 08.08.1964 | 5.0 | 3.6 |
| Aerial | 31.07.1972 | 1.0 | 2.5 |
| Aerial | 21.07.1977 | 1.5 | 2.9 |
| KH9-17 Hexagon | 26.07.1982 | 1.2 | 2.7 |
| Aerial | 05.08.1988 | 0.5 | 2.4 |
| ALOS PRIZM | 16.07.2006 | 2.0 | 2.5 |
| GeoEye-1 | 18.07.2014 | 0.4 | - |
| WorldView-2 | 15.06.2016 | 0.5 | 1.7 |
| PlanetScope | 20.08.2020 | 0.5 | 1.4 |
| Jilin-1 | 20.08.2022 | 0.75 | 1.2 |
| Time Period | 1964–1972 | 1972–1977 | 1977–1982 | 1982–1988 | 1988–2006 | 2006–2014 | 2014–2016 | 2016–2020 | 2020–2022 | All Period (1964–2022) |
|---|---|---|---|---|---|---|---|---|---|---|
| Mean rate | −1.08 | −1.02 | −1.29 | −1.49 | −0.85 | −1.12 | −1.07 | −0.60 | −0.84 | −1.03 |
| Standard deviation | 0.83 | 1.16 | 1.40 | 1.79 | 0.70 | 0.83 | 0.86 | 0.61 | 0.77 | 0.66 |
| Peak rate | −4.27 | −5.68 | −6.62 | −7.86 | −2.52 | −4.34 | −4.01 | −3.04 | −4.08 | −2.75 |
| Time Period | 1964–1977 | 1977–1982 | 1982–1988 | 1988–2006 | 2006–2014 | 2014–2022 | All Period (1964–2022) |
|---|---|---|---|---|---|---|---|
| Mean rate | 1.70 | −1.66 | 0.25 | −3.24 | 3.76 | −1.43 | −0.42 |
| Standard deviation | 1.33 | 2.27 | 4.79 | 2.14 | 4.59 | 1.83 | 0.99 |
| Min rate | −5.03 | −5.86 | −8.99 | −7.51 | −0.84 | −6.43 | −2.03 |
| Max rate | 5.77 | 6.34 | 25.11 | 0.80 | 34.12 | 2.99 | 5.12 |
Disclaimer/Publisher’s Note: The statements, opinions and data contained in all publications are solely those of the individual author(s) and contributor(s) and not of MDPI and/or the editor(s). MDPI and/or the editor(s) disclaim responsibility for any injury to people or property resulting from any ideas, methods, instructions or products referred to in the content. |
© 2023 by the authors. Licensee MDPI, Basel, Switzerland. This article is an open access article distributed under the terms and conditions of the Creative Commons Attribution (CC BY) license (https://creativecommons.org/licenses/by/4.0/).
Share and Cite
Kazhukalo, G.; Novikova, A.; Shabanova, N.; Drugov, M.; Myslenkov, S.; Shabanov, P.; Belova, N.; Ogorodov, S. Coastal Dynamics at Kharasavey Key Site, Kara Sea, Based on Remote Sensing Data. Remote Sens. 2023, 15, 4199. https://doi.org/10.3390/rs15174199
Kazhukalo G, Novikova A, Shabanova N, Drugov M, Myslenkov S, Shabanov P, Belova N, Ogorodov S. Coastal Dynamics at Kharasavey Key Site, Kara Sea, Based on Remote Sensing Data. Remote Sensing. 2023; 15(17):4199. https://doi.org/10.3390/rs15174199
Chicago/Turabian StyleKazhukalo, Georgii, Anna Novikova, Natalya Shabanova, Mikhail Drugov, Stanislav Myslenkov, Pavel Shabanov, Nataliya Belova, and Stanislav Ogorodov. 2023. "Coastal Dynamics at Kharasavey Key Site, Kara Sea, Based on Remote Sensing Data" Remote Sensing 15, no. 17: 4199. https://doi.org/10.3390/rs15174199