
High-Resolution and Wide-Swath 3D Imaging for Urban Areas Based on Distributed Spaceborne SAR


1
National Key Laboratory of Microwave Imaging Technology, Aerospace Information Research Institute, Chinese Academy of Sciences, Beijing 100190, China
2
School of Electronic, Electrical and Communication Engineering, University of Chinese Academy of Sciences, Beijing 100094, China
*
Author to whom correspondence should be addressed.
Remote Sens. 2023, 15(16), 3938; https://doi.org/10.3390/rs15163938
Submission received: 1 June 2023
/
Revised: 18 July 2023
/
Accepted: 25 July 2023
/
Published: 9 August 2023
(This article belongs to the Special Issue Advances in SAR: Sensors, Methodologies, and Applications II)
Abstract
:Tomographic synthetic aperture radar (TomoSAR) obtains elevation resolution by adding multiple baselines successively in the direction perpendicular to the line of sight, thereby realizing three-dimensional (3D) reconstruction of complex scenes and significantly promoting the development of the 3D application field. However, a large data redundancy and long mapping time in traditional 3D imaging lead to a large data transmission burden, low efficiency, and high costs. To solve the above problems, this paper proposes a distributed SAR high-resolution and wide-swath (HRWS) 3D imaging technology scheme. The proposed scheme overcomes the size limitation of traditional single-satellite antennas through the multi-channel arrangement of multiple satellites in the elevation direction to achieve HRWS imaging; meanwhile, the distributed SAR system is integrated with tomographic processing technology to realize 3D imaging of difficult areas by using the elevation directional resolution of TomoSAR systems. HRWS 3D SAR increases the baseline length and channel number by transmission in turn, which leads to excessive pulse repetition frequency and causes echoes of different pulse signals to overlap in the same receiving cycle, resulting in range ambiguity and thus seriously affecting the quality of the 3D reconstruction. To solve this problem, this paper proposes a range ambiguity resolution algorithm based on multi-beam forming and verifies it on the measured data from airborne array SAR. Compared with the traditional TomoSAR, the distributed HRWS 3D SAR scheme proposed in this paper can obtain a greater mapping bandwidth with the same resolution in a single flight, thereby enhancing the time correlation, reducing data redundancy, and greatly improving mapping efficiency.
1. Introduction
Limited by the side view imaging mechanism, there are numerous geometric distortions in complex ground object scenes, such as shrinkage, occlusion, and layover, which seriously affect the interpretation of synthetic aperture radar (SAR) images. To solve this problem, SAR tomography (TomoSAR) was created. TomoSAR obtains the 3D resolution of targets using multiple SAR images from different perspectives, which has application-significant value in military reconnaissance, topographic mapping, oil exploration, forest cover, urban reconstruction, and other military and civilian fields [1,2,3,4,5].
Many studies have been carried out since TomoSAR was proposed in 1995. Knaell et al. [6] developed a Ku-band tomographic SAR system with eight baselines, which successfully distinguished two overlapped metal spheres at different elevation positions. This was the first time the feasibility of TomoSAR 3D imaging was verified and it greatly promoted the research of multi-baseline SAR 3D reconstruction. In 2000, Reigber et al. [7] employed L-band airborne SAR data for the first time to conduct multi-baseline 3D reconstruction research on the E-SAR system platform. In 2005, Fornaro et al. [8] used the mapping data of the Naples area obtained by the European Remote Sensing Satellite heavy orbit flight to realize 3D imaging of spaceborne tomographic SAR for the first time. In 2010, a team led by Zhu Xiaoxiang from DLR [9] used TerraSAR-X data to obtain 3D imaging results of complex urban scenes for the first time. Later, the team carried out much spaceborne TomoSAR research using satellite data [10,11,12], which has made a significant contribution to the development of TomoSAR 3D imaging. In 2013, the ESA Program Board decided to implement Biomass as the 7th Earth Explorer Mission within the frame of the ESA Earth Observation Envelope Programme [13], which is the first SAR spaceborne mission specifically designed to conduct tomography from space, with a repeat-pass configuration. With the rapid development of deep learning, more research is combining it with 3D imaging to achieve efficient imaging [14,15]. The authors of [14] constructed the CTV-driven optimization model to pursue precise estimations in weakly sparse scenarios. The authors of [15] proposed a network called kR-Net to achieve high-resolution imaging of intricate targets, which was previously impossible. However, the above multi-baseline data are obtained with a repeat-pass configuration, resulting in strong temporal decorrelation, which makes the tomographic focusing of targets more difficult.
Although the TomoSAR technology has gradually developed and improved with the assistance of abundant data resources, there are several problems with traditional 3D imaging. First, traditional 3D imaging takes a long time in a wide mapping area, causing low efficiency and high costs. Meanwhile, the traditional 3D imaging system has a short baseline length and few channels, which results in serious data redundancy. Therefore, it is necessary to develop an HRWS platform to achieve wide application prospects of SAR tomography technology.
Distributed SAR can realize 3D imaging of targets in a single flight. The distributed SAR satellite system [16] is composed of multiple satellites flying in a formation that can break through the size limitation of traditional large satellites and provide various baseline combinations and globally stable baselines. It conducts cooperative work through communication, formation control, and joint signal processing to complete the earth observation task, improve the performance of the system in HRWS imaging and 3D imaging, reduce the system cost, and shorten the development cycle, so it has important strategically important significance and research value.
Significant international research work in distributed spaceborne SAR systems includes the TechSAT-21 mission [17,18,19] RadarSat-2/3 [20,21], Cartwheel plan [22], Cosmo skymed plan [23], TerraSAR-X and TanDEM dual satellite formation plan [24,25], and SAR-Lupe five satellite formation networking plan. TerraSAR-X and TanDEM form a dual satellite, which is the only distributed spaceborne SAR system operating in orbit and has completed a high-precision global 3D topographic survey. However, the system can only realize interferometry in a single flight. The multi-channel distributed SAR system scheme proposed in this paper can realize 3D imaging in a single pass. This paper combines distributed SAR HRWS imaging with tomographic 3D reconstruction technology through the distribution of tangent lines of multiple satellites. On the one hand, it achieves HRWS imaging by overcoming the size limitation of traditional single-satellite antennas through the distribution of multiple satellites in a multi-channel. On the other hand, it uses the high directional resolution of the distributed SAR system to reconstruct 3D terrain such as overlapping areas. Compared with traditional 3D imaging systems, distributed HRWS SAR has a long baseline and high resolution, and can achieve wide-swath imaging with a single pass, enhancing the temporal correlation while reducing information redundancy, and greatly improving mapping efficiency.
However, the contradiction between a high azimuth resolution and a wide mapping swath cannot be reconciled effectively, especially in spaceborne SAR, which causes range ambiguity in the imaging process of large mapping scenes, seriously affecting the imaging quality and image registration.
The HRWS spaceborne SAR system usually uses the SCORE (scan-on-receive) method to process echo signals in the elevation direction of the receiver to achieve range ambiguity resolution [26,27]. The processing method divides the receiving antenna into several pitch sub-apertures, with each pitch sub-aperture receiving its echo independently for low-noise amplification, down-conversion, and digitization. Then, time-varying weighting synthesis is carried out by a digital beamforming (DBF) processor to form an equivalent high-gain digital beam scan to receive echoes in the entire wide mapping band scene. The SCORE method determines the relationship between the target return time and the DOA (direction of arrival) based on the globe smooth sphere model, and it obtains the DBF weighting vector corresponding to the sampling time at each distance, thereby enabling the receiving beam center to track the point-to-return signal at all times. However, in areas with large topographic relief, the DBF receiving beam formed by the SCORE method will deviate in direction due to a large difference between the earth’s smooth sphere model and the real terrain. This results in a decline in echo gain and a deterioration in the signal-to-noise ratio, thus affecting the imaging quality of the SAR system. To solve this problem, in 2009, Varona [28] presented a processing method called adaptive digital beamforming (ADBF). The spatial spectrum estimation algorithm was adopted to estimate the DOA of the echo signal, and then the DOA estimator DBF weighting vector was exploited to adjust the receiving beam direction.
However, the above technologies are mainly used in single-station multi-channel SAR and are mostly applied to HRWS 2D imaging, without consideration of the overlapping targets. Meanwhile, the existing range ambiguity resolution technology cannot be directly applied to the research of distributed SAR. Therefore, it is urgent to investigate the range ambiguity resolution technology of distributed SAR 3D imaging.
In this paper, the technical scheme of distributed SAR HRWS 3D imaging through the multi-channel arrangement of multiple satellite SAR ranges is innovatively put forward. It is combined with tomography processing technology to realize the 3D imaging of difficult areas while overcoming the size limitation of the traditional single-satellite antenna. The main contributions of this paper are summarized as follows:
- (1)
- A scheme of a distributed SAR HRWS 3D imaging system with a multi-channel arrangement is innovatively proposed, which addresses the issues of long imaging time, low efficiency, and data redundancy in traditional 3D imaging.
- (2)
- A range ambiguity resolution method based on multi-beam forming is proposed. This method effectively achieves range ambiguity resolution for overlapping targets with non-unique wave direction.
- (3)
- The feasibility of the proposed distributed SAR HRWS system and the effectiveness of the range ambiguity resolution method are verified by using the airborne array tomographic SAR data, and the HRWS 3D imaging results are obtained.
The rest of this paper is outlined as follows. The detailed methodology is introduced in Section 2, and the experimental results and evaluation are provided in Section 3. Section 4 discusses the results and limitations of the method, as well as some potential applications, and finally, Section 5 concludes this paper.
2. Materials and Methods
2.1. Overall Workflow
As shown in Figure 1, compared with traditional 3D imaging, the distributed SAR multi-channel arrangement scheme proposed in the paper can complete HRWS imaging and 3D imaging at the same time.
The overall flow chart of 3D imaging is shown in Figure 2. In the 3D imaging process of distributed SAR, 2D imaging of multi-channel SAR echo data is realized first; then, image registration, amplitude correction, and phase correction are carried out to achieve strong coherence between multi-channel SAR images; and finally, height focusing is realized, and the 3D distribution of the scene scattering coefficient is obtained through coordinate conversion. However, there is range ambiguity in the imaging process. Aiming to solve the problem that the range ambiguity affects image registration, a general idea of coarse registration-range ambiguity resolution-precise registration is proposed. Firstly, the weight of special points and regions with a high signal-to-interference ratio is strengthened to realize the overall coarse image registration. Then, the external digital elevation model (DEM) is introduced to obtain the prior knowledge of the target position, which is combined with the DBF algorithm to obtain multi-channel range ambiguity resolution. Finally, precise registration is performed.
2.2. Distributed SAR 3D Imaging Geometry and Theory
This paper proposes a 3D imaging technology scheme of a distributed HRWS SAR with a multi-channel arrangement. The tomography uses multi-baseline satellite SAR to measure the same area at different angles and form a synthetic aperture in the elevation direction to obtain high-dimensional geometric resolution and achieve a real 3D imaging effect. The imaging geometry of distributed SAR tomography is illustrated in Figure 3. There is an SLC data set with N pieces of mutual registration, which is spatially arranged with a baseline , relative to the reference image. Afterwards, phase correction processing is required on the dataset. SAR phase correction is a technique used to compensate for phase errors in SAR imaging systems. Phase errors can arise from various sources such as antenna imperfections, atmospheric disturbances, or platform motion. These errors can result in image distortions, blurring, or misalignment of the SAR imagery. The phase correction process involves estimating and compensating for the phase errors in the received radar signal. This is typically conducted by referencing a known phase reference or utilizing a calibration signal. By applying the phase correction algorithm, the phase errors can be effectively mitigated, leading to improved image quality and accuracy. The range-Doppler algorithm is used in this paper. This algorithm estimates the phase errors by analyzing the range and Doppler frequency information of the received radar signal. Based on these estimates, the algorithm applies a corrective phase shift to each range cell of the SAR image, thereby compensating for the phase errors [29].
After phase correction of the data set is performed, the received signal in each azimuth-range unit can be represented as backscattering intensity γ superposition of all signals in cross-range direction [30]:
where denotes the range of elevation of the scene; represents the spatial frequency; , , and denote the length of vertical baseline, wavelength, and range, respectively; and represents the distribution of the backscattering coefficient in elevation. The above formula indicates that the received signal of the antenna is a Fourier sample which has the backscattering intensity along the azimuth with frequency . Therefore, the 3D imaging problem is transformed into the inverse-Fourier transform of non-uniform sampling.
In urban applications, the general scattering process has main scattering and a layover effect, so it can be considered that the intensity of backscattering γ is composed of a limited number of δ-Dirac functions with different scattering phase centers. The typical composition is the ground, building surface, and top, as illustrated by the red wavy line/arrow in Figure 3.
If L-order gridding discrete sampling () is performed on the elevation direction , the linear equations composed of M equations can be obtained.
where denotes the observation vector, represents the elements of the observation matrix, is a discrete sampling of the elevation backscattering distribution, and represents the noise vector. The above formula is a system of underdetermined equations since .
To simplify the problem, the noise vector is generally assumed to be stationary zero-mean Gaussian white noise, and the distribution model of the observation vector can be obtained [31].
where represents the covariance matrix of noise which assumes that the noise of each observation is independent of each other and independent of the strong backscattering wave source.
The Fisher information matrix of the above Gaussian distribution is [30]:
where represents the parameters involved in the model, including the amplitude the corresponding scatters, the phase , and the elevation . Finding the inverse of the Fisher information matrix is to obtain the Cramer–Rao lower bound , which indicates the estimation accuracy that the algorithm can achieve.
2.3. Range Ambiguity Resolution Algorithm
Each SAR image is obtained independently in the actual distributed SAR system. Due to geometric differences such as different antenna heights and different viewing angles, the data obtained by each SAR in the same scene on the ground are not completely coincident. There are not only translations in range and azimuth directions but also deformations such as relative compression or stretching. The mismatch of images seriously hinders the performance of the interferometric phase and affects the process of tomography. Therefore, image registration [32] needs to be carried out before tomography to ensure the coherence of multiple SAR images. A general idea of coarse registration-range ambiguity resolution-precise registration is proposed in this paper, as shown in Figure 4.
2.3.1. Range Ambiguity Theory
In the HRWS 3D imaging process of distributed SAR, the radar echo from two successive pulses will overlap at the receiver due to the high PRF, resulting in range ambiguity. Meanwhile, the range ambiguity comes from the side lobe of the antenna pitch beam. When the side lobe is strong enough, if the difference between the two-way delay of the echo in the sidelobe irradiation area and the two-way delay of the echo in the observation band is equal to an integral multiple of the pulse repetition period, the echo signals will be mixed, as illustrated in Figure 5, where C is the speed of light, is the pulse length, and is the target range.
To avoid range ambiguity, scene echoes two pulses of antenna transmission need to be fully received by the system, and the PRF must be low enough so that all near-to-far echo signals within the range of the SAR antenna beam are in the receiving window. In this case, the PRF should satisfy the following condition:
where denotes the incidence angle at the far end of the scene, denotes the mapping bandwidth, and denotes light speed.
2.3.2. Range Ambiguity Calculation
The ratio of the echo intensity of the ambiguity signal to the echo intensity of the main signal is an important index for measuring the range ambiguity of the system, which mainly comes from the ambiguity signal with a difference between the sum of the distance from the same target to the main satellite and the sub-satellites is equal to the integer multiple of the PRF. The geometric diagram of range ambiguity is shown in Figure 6.
In Figure 6, the solid line represents the useful signal, and the dotted line represents the ambiguous signal.
where and denote the distances from the ambiguity point to the main star point and the auxiliary star point, respectively; and represent the distance from the target point to the main star point and the auxiliary star point, respectively; and enotes PRF.
According to its definition, the range ambiguity is expressed as [33]:
where and represent the bottom view of the main satellite and the sub-satellite, respectively; denotes the beam incidence angle; and represent the antenna range gain of the main satellite and the sub-satellite, respectively; is the backscattering coefficient of ground scattering points; and denotes antenna area.
Then, the coordinates of ambiguity points are found. Firstly, a coordinate system is established by taking the midpoint of the connecting line between the main satellite and the sub-satellite as the coordinate origin and the connecting line between the main satellite and the sub-satellite as the x-axis. Pointing from the main satellite to the sub-satellite, the y-axis in the plane of the main satellite, the sub-satellite, and the earth center, pointing to the earth center, and the z-axis is determined by the right-hand spiral law.
Formula (8) shows the equation of the earth in the coordinate system, where represents the earth’s center and denotes the earth’s radius. Formula (9) shows the ellipsoid equation with the main satellite and sub-satellite as the focus. , where is half the distance between the main satellite and sub-satellite. Formula (10) shows the plane equation, where the main satellite, the earth center, the beam center point, and the ambiguity point are coplanar, where are the coordinates of the main satellite, the earth center, and the beam center point, respectively. The coordinates of the ambiguity point can be obtained by combining the above equation. Then, and can be obtained to acquire the range ambiguity.
After calculating the ambiguity, the weight of the area with low ambiguity is increased, and image registration is performed on this area.
2.3.3. Obtaining Range Ambiguity Resolution Based on Multi-Beam Forming
The investigation of range ambiguity resolution can be conducted after the coarse image registration. A multi-channel range ambiguity resolution technology based on multi-beam forming is proposed in this paper, as shown in Figure 7. First, the prior knowledge of the target location is obtained by introducing an external DEM. The accuracy of external DEM can reach 3–10 m, which can provide prior knowledge such as accurate target location for DBF.
The target echo signal received from the nth SAR in pitch can be expressed as:
where represents the constant related to the gain of the antenna pattern and the backscattering coefficient of the target; represents the round trip delay of the target; represents the pulse width of the transmitting signals; represents the carrier frequency of the radar signal; represents the frequency modulation; represents the bottom view of the antenna normal; denotes the normalized rectangular window with a range of [−0.5, 0.5]; and represents the distance between the nth SAR and the middle SAR.
To reduce the pulse-broadening loss of the target echo, each SAR echo signal is matched and filtered.
The matched filtering results of all SAR received echoes are:
where represents the guidance vector of the target echo and denotes the noise vector. The matched filtering results of these echoes received by the SAR are weighted and accumulated in the digital beamforming processor to generate an equivalent high-gain DBF beam pointing at the target, thereby achieving a high-gain received target echo signal. To ensure that the DBF receiving beam center points to the target echo direction, the pitch DBF weighting vector of each range gate unit should be calculated according to the target angle of arrival as [34]:
The elevation value of the target is needed to calculate the angle of view under the target corresponding to the distance gate unit. Therefore, it is necessary to calculate the target elevation corresponding to the range gate unit according to the digital elevation map of the real terrain based on the spaceborne SAR imaging geometry model.
Note that there will be overlapping targets in the 3D imaging of urban areas studied in this paper, and their DOA is not unique. Therefore, the method proposed in this paper first performs multi-direction arrival filtering and multi-beam synthesis.
3. Experiments and Results
3.1. Study Area and Data
Rizhao, Shandong Province, China, is selected as the study area, which is a large-scale urban area containing typical urban forms, as shown in Figure 8. The longitude and latitude range of the experimental area is 119.518°~119.569°E and 35.383°~35.431°N, respectively.
To verify the effectiveness of the proposed method, some experimental results using the first domestic airborne array TomoSAR system of the Institute of Aerospace Information Research Chinese Academy of Sciences (AIRCAS) are presented. Detailed information on the system parameters is listed in Table 1.
3.2. The Results of Range Ambiguity Resolution and HRWS 3D Imaging
The SAR image with range ambiguity is shown in Figure 9. It can be seen that the far and near scenes overlap obviously. Meanwhile, the road and the buildings overlap, seriously affecting the subsequent 3D reconstruction process. In SAR imaging, the “far range” and “near range” refer to the two ends of the range direction in the SAR image. The far range corresponds to the region in the SAR image that is farthest away from the radar sensor or the imaging platform. It represents the maximum distance at which the radar signal has traveled and interacted with the target. The far range is typically depicted at the top or the right side of the SAR image. On the other hand, the near range represents the region in the SAR image that is closest to the radar sensor or the imaging platform. It corresponds to the minimum distance at which the radar signal has interacted with the target. The near range is usually shown at the bottom or the left side of the SAR image. The near and far ranges in SAR imaging are determined by the radar system’s range resolution, which is the ability to distinguish between two targets located at different distances. The range resolution is determined by the pulse length of the radar signal, and it affects the level of detail and clarity in the SAR image.
As described in Section 2.3.1, the range ambiguity is mainly caused by the high PRF of the radar-transmitted pulse. In the process of spaceborne SAR, the echo signal of its transmitted pulse is generally received by the receiving radar after N-pulse repetition cycles are delayed. Considering the impact of the curvature of the earth, the time dispersion of useful echo signals in the observation zone may exceed the interval between pulses. This will cause the echo signals of the previously transmitted pulse or several transmitted pulses to overlap with the echo signals of the current transmitted pulse in time and result in interference with the echo signals of the current transmitted pulse, thus causing ambiguity. Reflected in the SAR image, the far and near target scenes are mixed, and the azimuth defocus will occur due to the different modulation frequencies of different range units. The method proposed in this paper is used to separate the far and near target scenes so that the received echo points to the real position and range ambiguity resolution is achieved. Four typical areas of ABCD are shown in Figure 9, and the corresponding results are illustrated in Figure 10, Figure 11, Figure 12 and Figure 13 in turn, where (a) shows the image with range ambiguity, and the far and near scenes overlap; (b) and (c) show the near and far scene after range ambiguity, respectively; (d) and (e) show the HRWS 3D imaging results of (b) and (c), respectively.
It can be seen from Figure 10a, Figure 11a, Figure 12a and Figure 13a that there is significant azimuth defocusing, so azimuth refocusing is necessary. Then, a detailed analysis is performed on area B. Taking channel 1 and channel 2 as examples for analysis, the interferometric phase before range ambiguity resolution is shown in Figure 14a. The range ambiguity of the ambiguous image is calculated, and the weight of the areas with low ambiguity is increased. The flat ground with low ambiguity can be adopted as the registration point. After coarse image registration, according to the proposed method, the DOA of the target scene corresponding to each range moment is estimated by the echo of each range unit. Then, the weighted vector of the radar corresponding to each range moment is calculated to make the center of the receiving beam point exactly to the target location, the correct beam direction is obtained, and multi-channel range ambiguity resolution is realized. Next, precise image registration is performed on the ambiguity resolution image. As shown in Figure 14b, the interferometric phase is uniform even after range ambiguity. After the interferometric phase, the phase quality map needs to be calculated to evaluate the quality of the interferometric phase, and the coherence coefficient map is the most commonly used, whose calculation formula is shown below:
The Coherence coefficient before and after the range ambiguity resolution is shown in Table 2, where “1–2” represents the correlation coefficients of the interferometric phases of channel 1 and channel 2.
It can be seen from Table 2 that before the range ambiguity resolution, the average coherence coefficient between the adjacent channels is 0.5845, and the interferometric phase quality is poor. After the range ambiguity resolution, the average coherence coefficient between the adjacent channels becomes 0.9864, which greatly improves the interferometric phase.
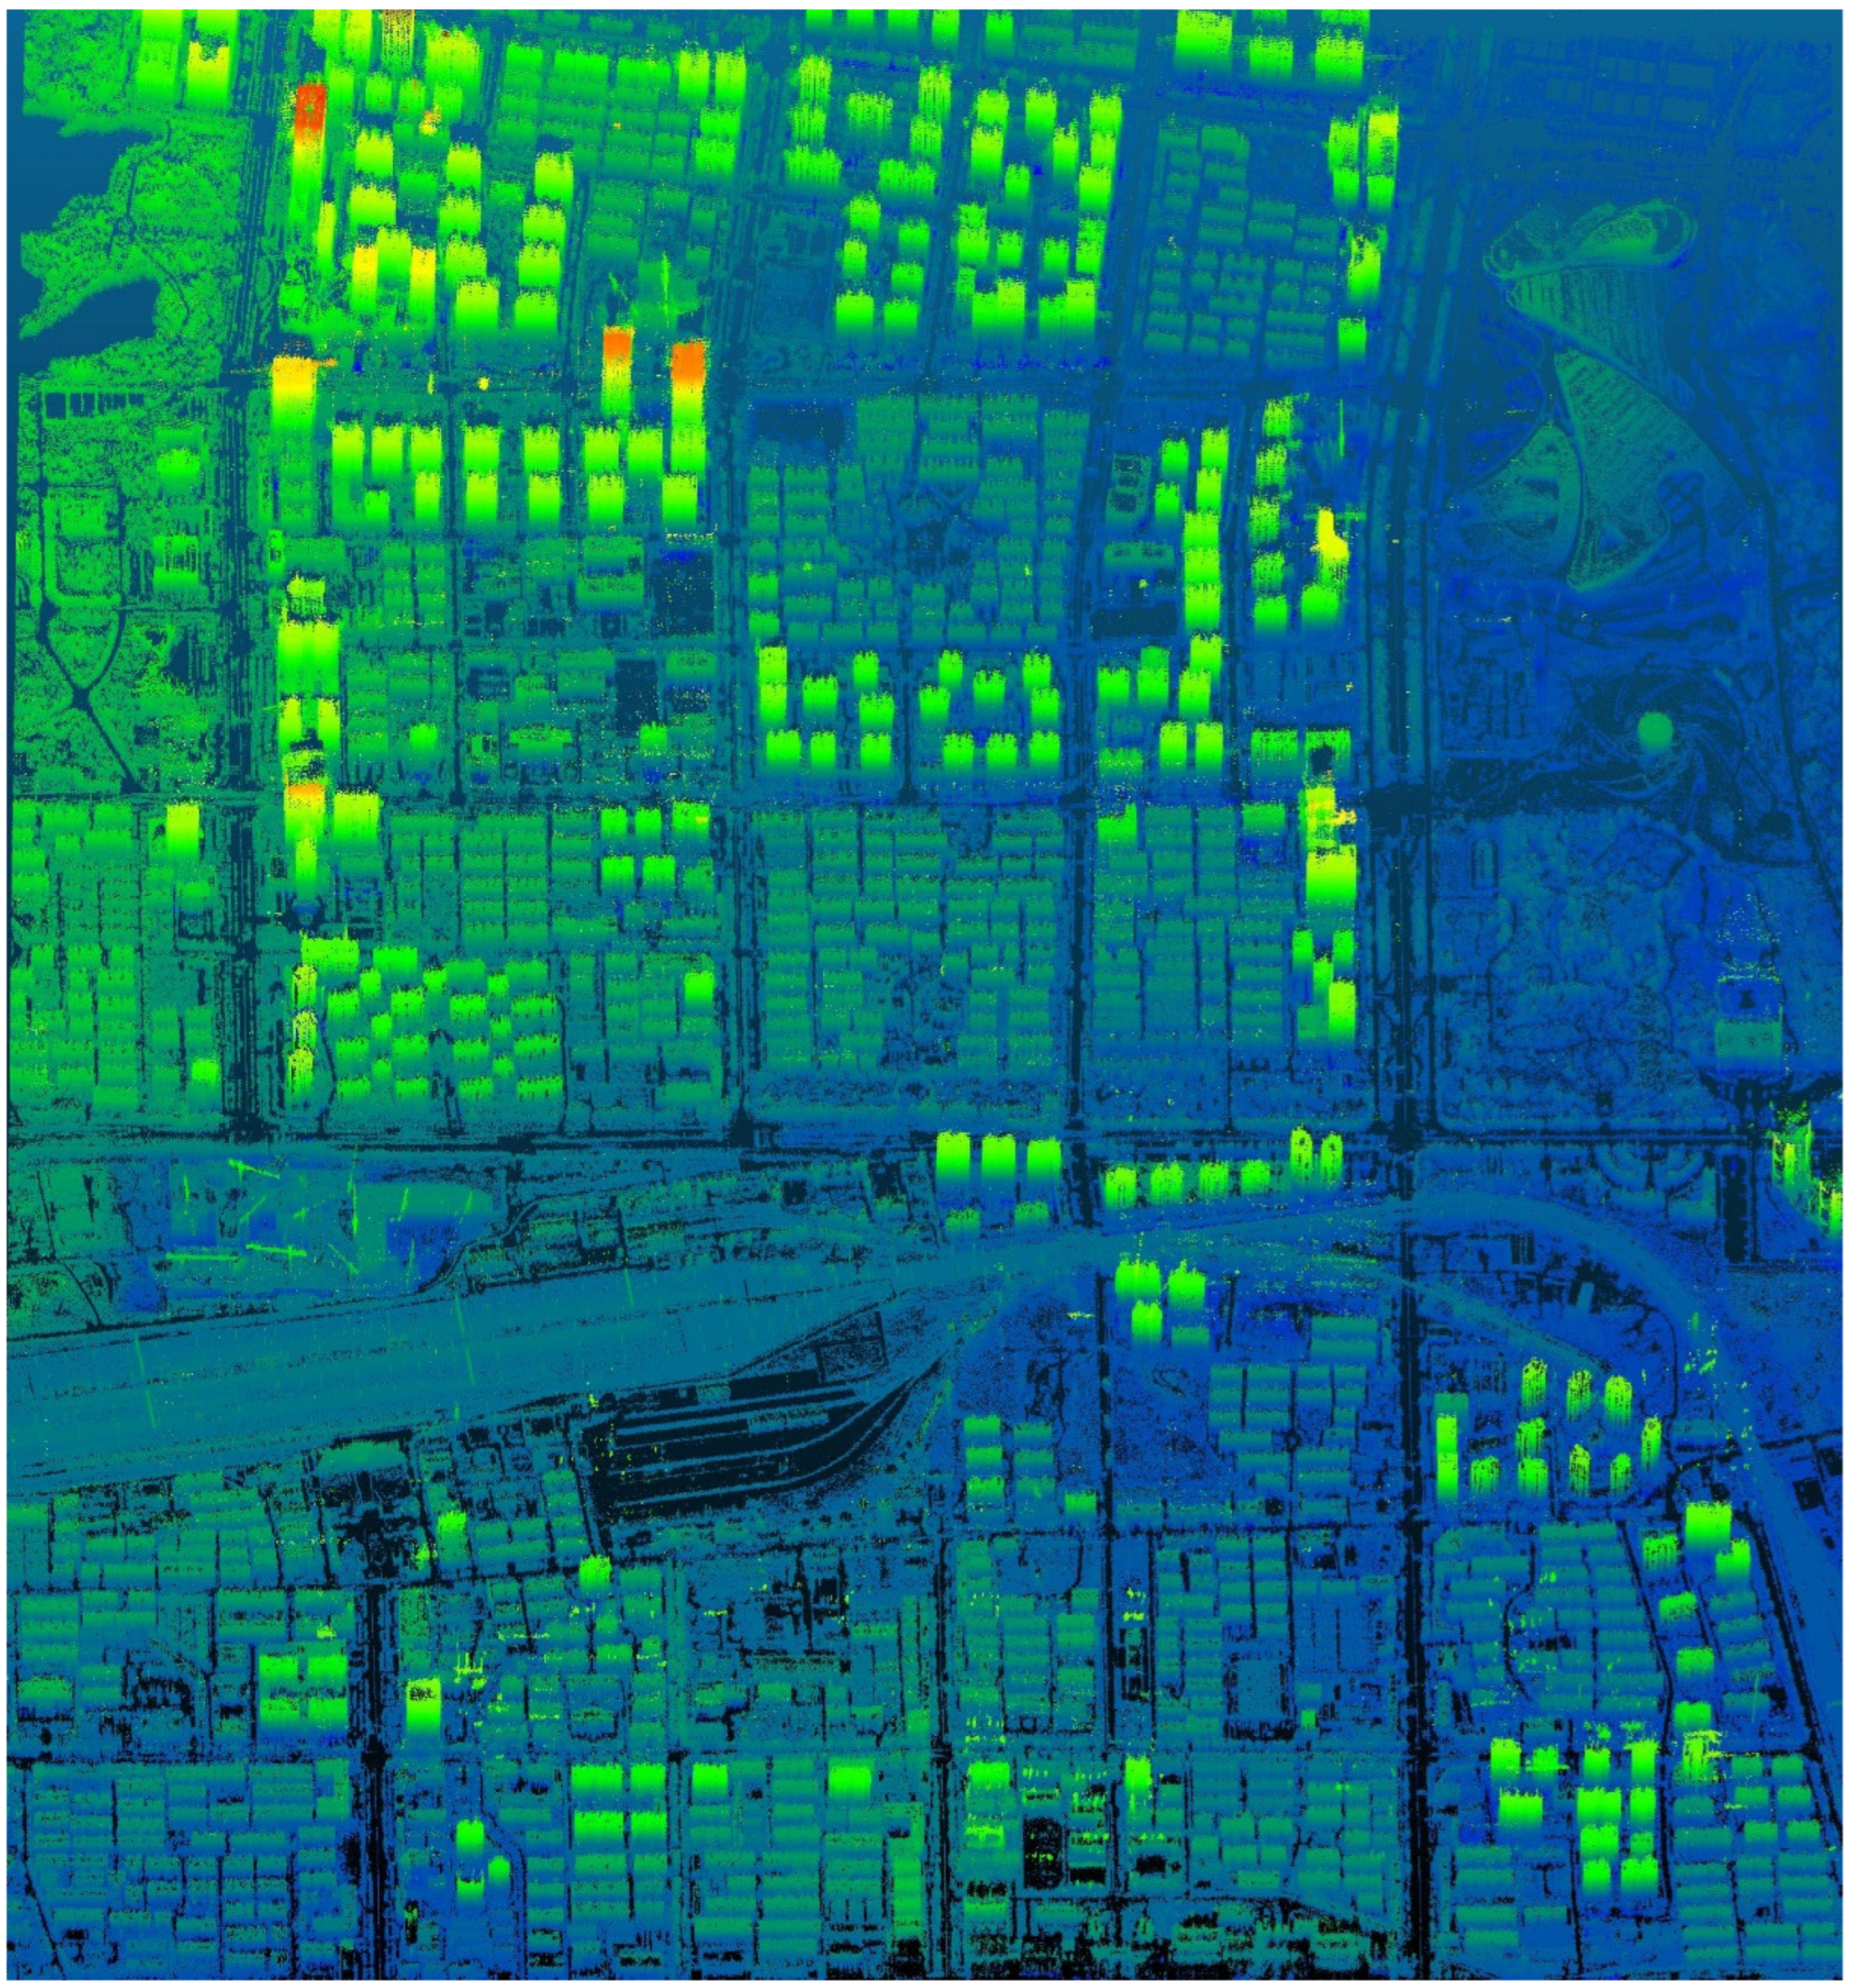
After the range ambiguity resolution, image registration, channel imbalance calibration, sparse recovery, and high-dimensional focusing, the 3D imaging point cloud of the whole area is illustrated in Figure 15, where color represents height. It can be observed that the method proposed in this paper can realize HRWS 3D imaging of a large area.
4. Discussion
The experimental results in Section 3 indicate that the proposed scheme can achieve HRWS 3D imaging. In the experiment, the simulation mode of hardware in the loop is used to verify that the multi-channel distributed SAR mode proposed in this paper can achieve 3D imaging by using airborne array measured data. For the range ambiguity problem in this mode, our proposed range ambiguity resolution method based on multi-beam forming can effectively eliminate the range ambiguity. In the study area, a large area of buildings is selected, and the buildings in this area are overlapping targets. First, the range ambiguity is simulated with hardware in the loop by using the measured data obtained from the airborne array data. It can be seen from Figure 10 that the targets in different range units are mixed. Meanwhile, due to the different modulation frequencies of different range units, the ambiguity signal is defocused in the azimuth direction. Then, the range ambiguity is calculated. In this area, the flat ground is the area with low ambiguity, so it is selected as the registration point for image coarse registration. For the overlapping targets, their DOA is not unique. The proposed method first filters the multiple DOA and then selects typical buildings for range ambiguity resolution. As shown in Figure 10, Figure 11, Figure 12 and Figure 13, the ambiguity signal is effectively eliminated, and the coherence coefficient is improved from 0.5845 to 0.9864, which significantly improves the quality of imaging. Subsequently, range ambiguity resolution and 3D imaging are performed on the whole area. The experimental results are shown in Figure 15, where the color represents the height. It can be concluded that our proposed method can realize high-division and wide-width 3D imaging of a large area. It should be noted that azimuth refocusing is required after range ambiguity resolution.
To sum up, the proposed method can realize both HRWS imaging and 3D imaging, which is of great significance to SAR imaging.
5. Conclusions
With the development of SAR applications and the increasing complexity of observation tasks, the demand for 3D information on targets in production and military activities is increasing. Meanwhile, the SAR imaging technology of HRWS has attracted more and more attention from SAR researchers, and it has become a research hotspot in the field of remote sensing. High-resolution imagery is the guaranteed when correct information is obtained, and large surveying and mapping zones are important for shortening the revisiting period and obtaining information quickly. Therefore, accurate acquisition of 3D HRWS information including height on the earth’s surface is of great value in military reconnaissance, land resources monitoring, map mapping, environmental monitoring, disaster monitoring, and other satellite applications. However, there are many problems with traditional 3D SAR imaging systems, such as long imaging time, large amounts of channel data, and data redundancy, which seriously reduce the efficiency and image quality of 3D reconstructions.
Aiming to solve the above problems, a distributed SAR HRWS 3D imaging scheme is put forward innovatively in this paper. The proposed distributed SAR multi-channel system combines distributed SAR HRWS imaging with tomographic 3D reconstruction technology by arranging multiple satellite SAR in the tangent direction, which can achieve both HRWS imaging and 3D imaging simultaneously. Compared with traditional 3D imaging systems, distributed HRWS SAR has a longer baseline, a higher resolution, and a larger mapping bandwidth by a single flight, thereby enhancing time correlation, reducing redundancy of information, and greatly improving surveying and mapping efficiency.
However, due to the long baseline and large detection scene of distributed HRWS SAR, there is range ambiguity in the 3D imaging process. To solve this problem, this paper introduces the geometric model of 3D imaging and the theoretical basis of range ambiguity. Based on this, a range ambiguity resolution method is presented based on multi-beamforming.
The proposed HRWS 3D imaging methodology is verified on the data set obtained through experiments conducted with airborne array SAR in Rizhao, Shandong province. The coherence coefficient is increased from 0.5845 to 0.9864, i.e., the image quality is greatly improved. The proposed method can eliminate range ambiguity successfully, which is significant for realizing HRWS 3D imaging of distributed SAR.
Author Contributions
Conceptualization, Y.Y. and F.Z.; methodology, Y.Y.; validation, Y.Y., F.Z. and Y.T.; formal analysis, L.C.; resources, R.W. and Y.W.; data curation, F.Z.; writing—original draft preparation, Y.Y.; visualization, L.C. and Y.T.; project administration, Y.W.; funding acquisition, F.Z. All authors have read and agreed to the published version of the manuscript.
Funding
This research was funded by the National Key R&D Program of China, 2021YFA0715404.
Acknowledgments
The authors thank all colleagues who participated in this work. The authors would like to express their gratitude to the anonymous reviewers and the editor for their constructive comments on the paper.
Conflicts of Interest
The authors declare no conflict of interest.
Abbreviations
The following abbreviations are used in this manuscript:
| TomoSAR | tomographic synthetic aperture radar |
| 3D | three-dimensional |
| HRWS | high-resolution and wide-swath |
| PRF | pulse repetition frequency |
| SAR | synthetic aperture radar |
| SCORE | scan-on-receive |
| DBF | digital beamforming |
| DOA | direction of arrival |
| ADBF | adaptive digital beamforming |
| DEM | digital elevation model |
| AIRCAS | Aerospace Information Research Institute, Chinese Academy of Sciences |
References
- Liu, S.; Wei, S.; Wei, J.; Zeng, X.; Zhang, X. TomoSAR Sparse 3-D Imaging Via DEM-Aided Surface Projection. In Proceedings of the 2021 IEEE International Geoscience and Remote Sensing Symposium IGARSS, Brussels, Belgium, 11–16 July 2021; pp. 5211–5214. [Google Scholar] [CrossRef]
- Yu, H.; Zhang, Z. The Performance of Relative Height Metrics for Estimation of Forest Above-Ground Biomass Using L- and X-Bands TomoSAR Data. IEEE J. Sel. Top. Appl. Earth Obs. Remote. Sens. 2021, 14, 1857–1871. [Google Scholar] [CrossRef]
- Shi, Y.; Bamler, R.; Wang, Y.; Zhu, X.X. SAR Tomography at the Limit: Building Height Reconstruction Using Only 3–5 TanDEM-X Bistatic Interferograms. IEEE Trans. Geosci. Remote Sens. 2020, 58, 8026–8037. [Google Scholar] [CrossRef]
- Lu, H.; Zhang, H.; Deng, Y.; Wang, J.; Yu, W. Building 3-D Reconstruction With a Small Data Stack Using SAR Tomography. IEEE J. Sel. Top. Appl. Earth Obs. Remote Sens. 2020, 13, 2461–2474. [Google Scholar] [CrossRef]
- Shahzad, M.; Zhu, X.X. Automatic Detection and Reconstruction of 2-D/3-D Building Shapes From Spaceborne TomoSAR Point Clouds. IEEE Trans. Geosci. Remote. Sens. 2015, 54, 1292–1310. [Google Scholar] [CrossRef] [Green Version]
- Knaell, K. Radar tomography for the generation of three-dimensional images. IEE Proc.—Radar, Sonar Navig. 1995, 142, 54. [Google Scholar] [CrossRef] [Green Version]
- Reigber, A.; Moreira, A. First demonstration of airborne SAR tomography using multibaseline L-band data. IEEE Trans. Geosci. Remote. Sens. 2000, 38, 2142–2152. [Google Scholar] [CrossRef]
- Fornaro, G.; Serafino, F. Imaging of Single and Double Scatterers in Urban Areas via SAR Tomography. IEEE Trans. Geosci. Remote. Sens. 2006, 44, 3497–3505. [Google Scholar] [CrossRef]
- Zhu, X.X.; Bamler, R. Demonstration of Super-Resolution for Tomographic SAR Imaging in Urban Environment. IEEE Trans. Geosci. Remote Sens. 2012, 50, 3150–3157. [Google Scholar] [CrossRef] [Green Version]
- Zhu, X.X.; Bamler, R. Super-Resolution Power and Robustness of Compressive Sensing for Spectral Estimation With Application to Spaceborne Tomographic SAR. IEEE Trans. Geosci. Remote Sens. 2012, 50, 247–258. [Google Scholar] [CrossRef]
- Shahzad, M.; Zhu, X.X. Reconstruction of building façades using spaceborne multiview TomoSAR point clouds. In Proceedings of the 2013 IEEE International Geoscience and Remote Sensing Symposium—IGARSS, Melbourne, VIC, Australia, 21–26 July 2013; pp. 624–627. [Google Scholar] [CrossRef]
- Ge, N.; Gonzalez, F.R.; Wang, Y.; Shi, Y.; Zhu, X.X. Spaceborne Staring Spotlight SAR Tomography—A First Demonstration With TerraSAR-X. IEEE J. Sel. Top. Appl. Earth Obs. Remote. Sens. 2018, 11, 3743–3756. [Google Scholar] [CrossRef] [Green Version]
- Arcioni, M.; Bensi, P.; Fehringer, M.; Fois, F.; Heliere, F.; Lin, C.-C.; Scipal, K. The Biomass mission, status of the satellite system. In Proceedings of the 2014 IEEE Geoscience and Remote Sensing Symposium, Quebec City, QC, Canada, 13–18 July 2014. [Google Scholar] [CrossRef]
- Wang, M.; Wei, S.; Zhou, Z.; Shi, J.; Zhang, X.; Guo, Y. CTV-Net: Complex-Valued TV-Driven Network With Nested Topology for 3-D SAR Imaging. IEEE Trans. Neural Netw. Learn. Syst. 2022, 1–15. [Google Scholar] [CrossRef] [PubMed]
- Smith, J.W.; Torlak, M. Deep Learning-Based Multiband Signal Fusion for 3-D SAR Super-Resolution. IEEE Trans. Aerosp. Electron. Syst. 2023, 1–17. [Google Scholar] [CrossRef]
- Goodman, N.; Lin, S.C.; Rajakrishna, D.; Stiles, J. Processing of multiple-receiver spaceborne arrays for wide-area SAR. IEEE Trans. Geosci. Remote. Sens. 2002, 40, 841–852. [Google Scholar] [CrossRef]
- Das, A.; Cobb, R. TechSat 21–Space Missions Using Collaborating Constellations of Satellites. In Proceedings of the 12th Annual AIAA/USU Conference on Small Satellites, Logan, UT, USA, 31 August–3 September 1998. [Google Scholar]
- Martin, M.; Klupar, P.; Kilberg, S.; Winter, J. Techsat 21 and Revolutionizing Space Missions using Microsatellites. In Proceedings of the 15th American Institute of Aeronautics and Astronautics Conference on Small Satellites, Logan, UT, USA, 13–16 August 2001. [Google Scholar]
- Cyrus, D.J. Multiobjective, Multidisciplinary Design Optimization Methodology for the Conceptual Design of Distributed Satellite Systems. Ph.D. Thesis, Department of Aeronautics and Astronautics, Massachusettes Institute of Technology, Cambridge, MA, USA, 2002. [Google Scholar]
- Lee, P.F.; James, K. The RADARSAT-2/3 Topographic Mission. In Proceedings of the IGARSS 2001, Sydney, Australia, 9–13 July 2001. [Google Scholar]
- Evans, N.; Lee, P.; Girard, R. The RADARSAT-2&3 Topographic Mission. In Proceedings of the EUSAR 2002, Cologne, Germany, 4–6 June 2002; pp. 37–40. [Google Scholar]
- Massonnet, D. Capabilities and limitations of the interferometric cartwheel. IEEE Trans. Geosci. Remote. Sens. 2001, 39, 506–520. [Google Scholar] [CrossRef]
- Reale, D.; Nitti, D.O.; Peduto, D.; Nutricato, R.; Bovenga, F.; Fornaro, G. Postseismic Deformation Monitoring With the COSMO/SKYMED Constellation. IEEE Geosci. Remote. Sens. Lett. 2011, 8, 696–700. [Google Scholar] [CrossRef]
- Moreira, A.; Krieger, G.; Hajnsek, I.; Werner, M.; Hounam, D.; Riegger, S.; Settelmeyer, E. Single-Pass SAR Interferometry with a TanDEM TerraSAR-X Configuration. In Proceedings of the EUSAR 2004, Ulm, Germany, 25–27 May 2004; pp. 53–54. [Google Scholar]
- Fiedler, H.; Krieger, G. The TanDEM-X Mission Design and Data Acquisition Plan. In Proceedings of the EUSAR 2006, Dresden, Germany, 16–18 May 2006. [Google Scholar]
- Suess, M.; Wiesbeck, W. Side-Looking Synthetic Aperture Radar System. European Patent EP1241487A1, 18 September 2002. [Google Scholar]
- Suess, M.; Grafmueller, B.; Zahn, R. A novel high resolution, wide swath SAR system. In Proceedings of the IGARSS 2001. Scanning the Present and Resolving the Future. Proceedings. IEEE 2001 International Geoscience and Remote Sensing Symposium (Cat. No.01CH37217), Sydney, NSW, Australia, 9–13 July 2001; pp. 1013–1015. [Google Scholar] [CrossRef]
- Varona, E.M. Adaptive Digital Beam-Forming for High-Resolution Wide-Swath Synthetic Aperture Radar; University Politècnica of Catalonia: Barcelona, Spain, 2009; pp. 31–42. [Google Scholar]
- Wilson, K.S.; Ryan, P.A.; Minardi, M.J. Phase-history data collection for synthetic scene modeling applications. Proc. SPIE 2001, 4382, 438201. [Google Scholar] [CrossRef]
- Fornaro, G.; Serafino, F.; Soldovieri, F. Three-dimensional focusing with multipass SAR data. IEEE Trans. Geosci. Remote. Sens. 2003, 41, 507–517. [Google Scholar] [CrossRef]
- Kay, S.M.; Luo, P.; Zhang, W.; Liu, Z. Fundamentals of Statistical Signal Processing Volume I: Estimation Theory; Publishing House of Electronics Industry: Beijing, China, 2011; pp. 451–453. [Google Scholar]
- Zitová, B.; Flusser, J. Image registration methods: A survey. Image Vis. Comput. 2003, 21, 977–1000. [Google Scholar] [CrossRef] [Green Version]
- Yu, Z.; Zhou, Y.; Chen, J.; Li, C. Approach of range ambiguity suppression for spaceborne SAR based on LCMV algorithm. J. Beijing Univ. Aeronaut. Astronaut. 2006, 32, 1035–1038. [Google Scholar] [CrossRef] [Green Version]
- Chen, E.X. Study on Ortho-Rectification Methodology of Space-Borne Synthetic Aperture Radar Imagery; Chinese Academy of Forestry: Beijing, China, 2004; pp. 123–150. [Google Scholar]
Figure 1.
The distributed HRWS SAR 3D imaging system.
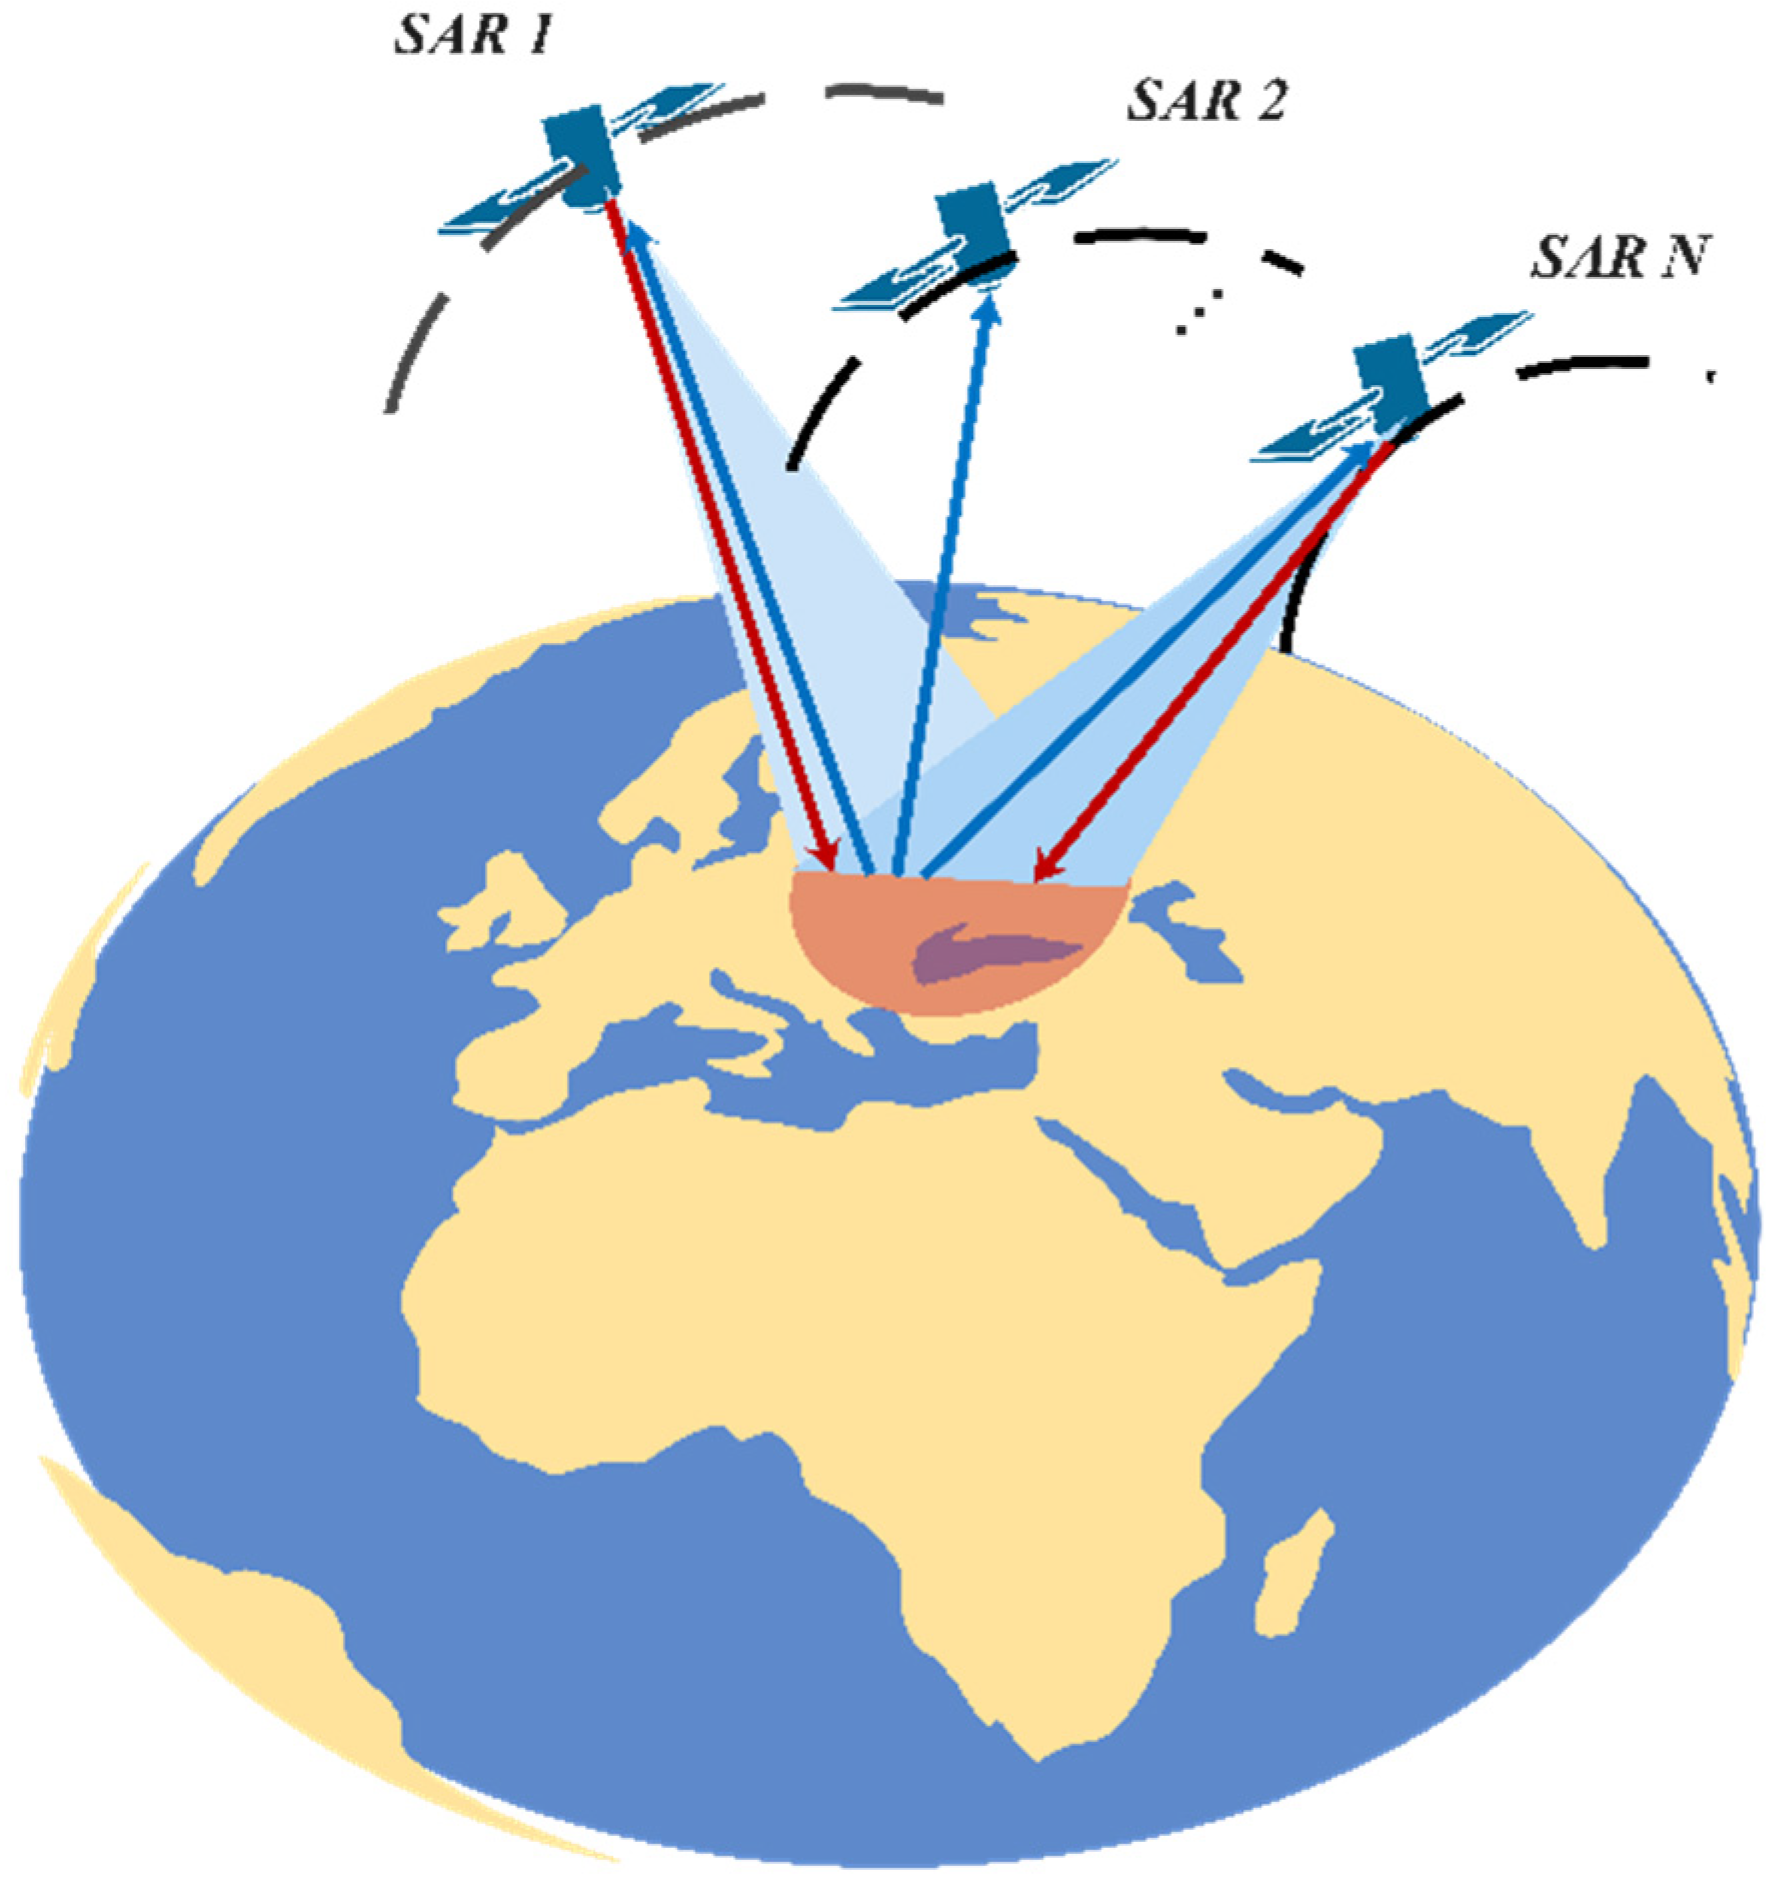
Figure 2.
The overall flow of the distributed HRWS SAR 3D imaging system.
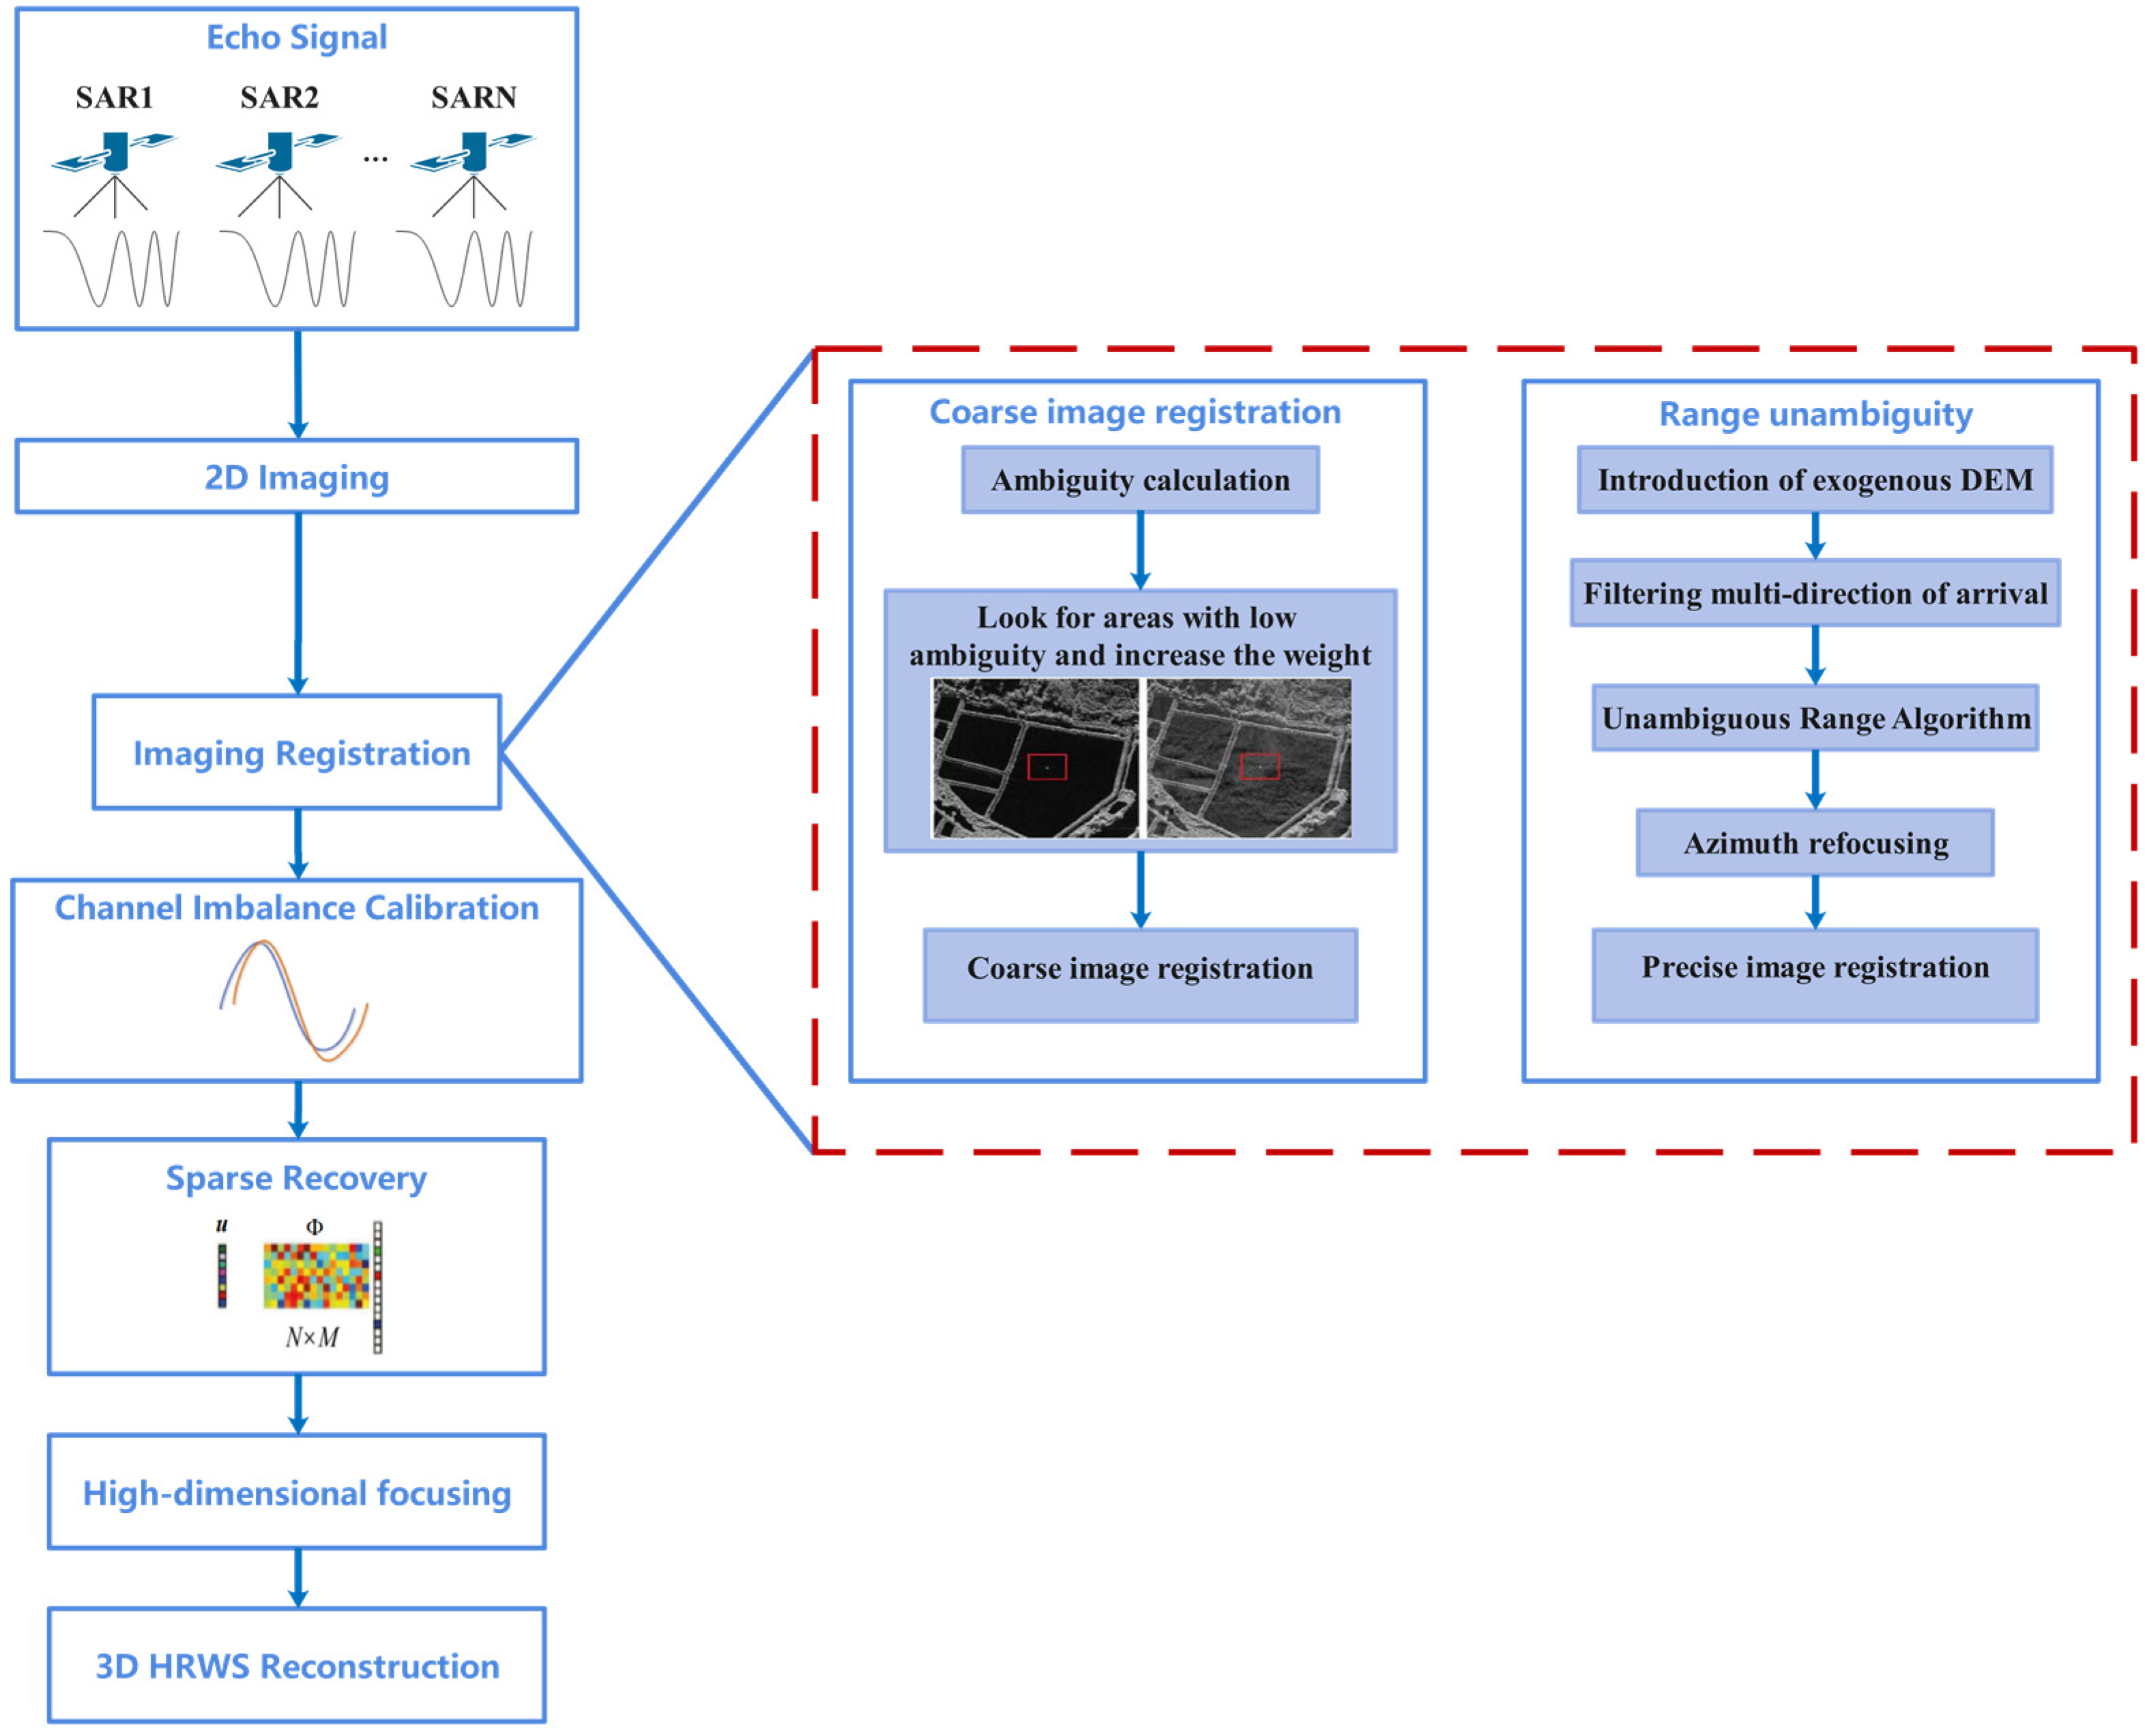
Figure 3.
The geometry of the distributed SAR 3D imaging.

Figure 4.
The overall flowchart of the image registration and range ambiguity resolution algorithm.
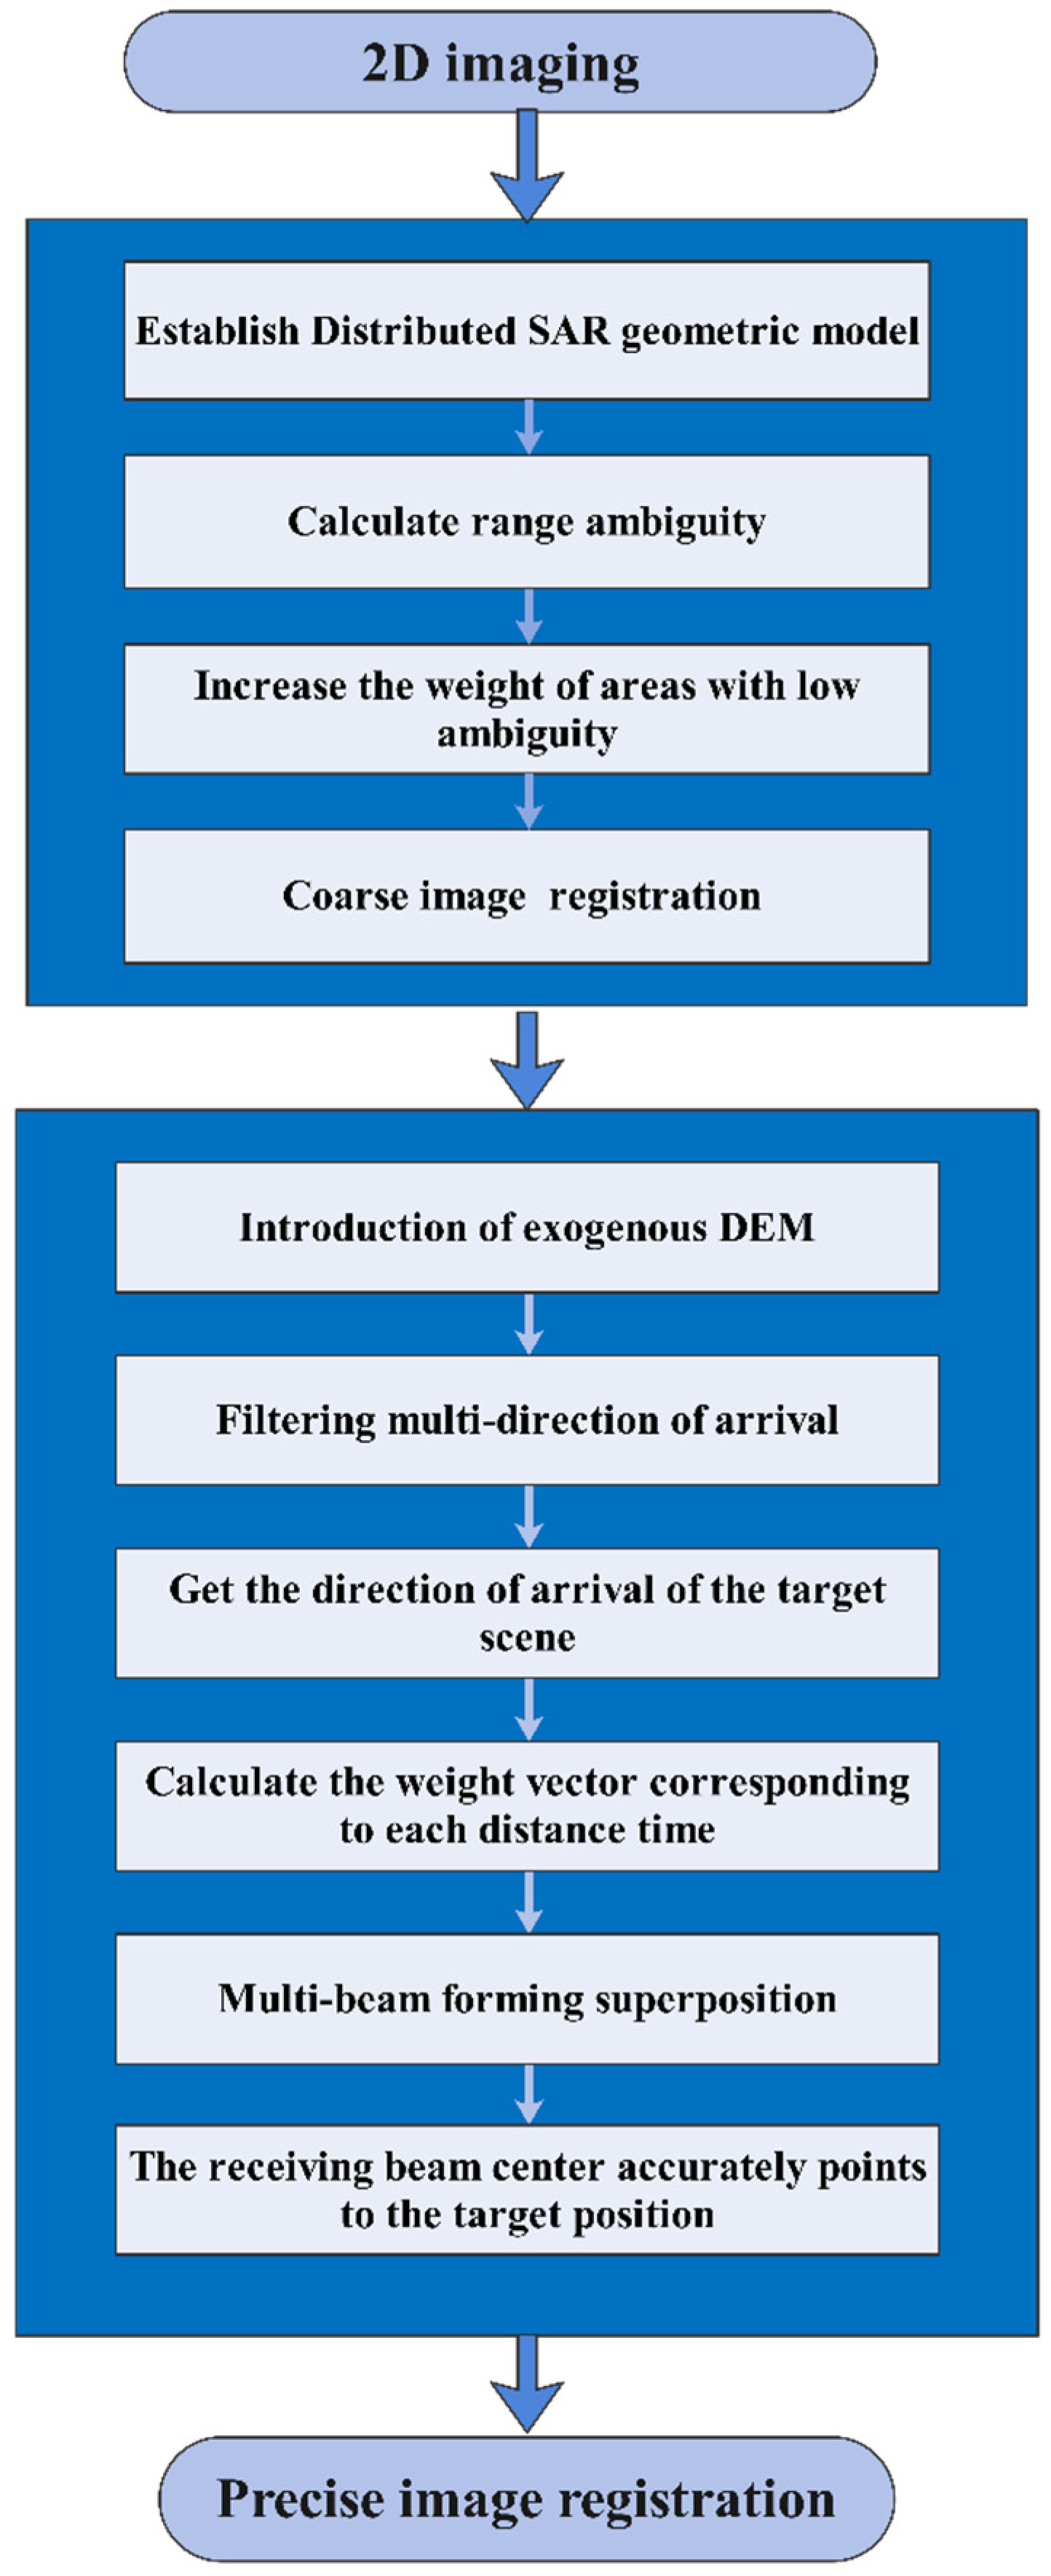
Figure 5.
The range ambiguity of the SAR system.

Figure 6.
The geometric diagram of range ambiguity.

Figure 7.
The algorithm for obtaining range ambiguity resolution based on multi-beam forming.

Figure 8.
The optical image of the study area in the UTM coordinate system.

Figure 9.
The SAR image of the study area with range ambiguity.
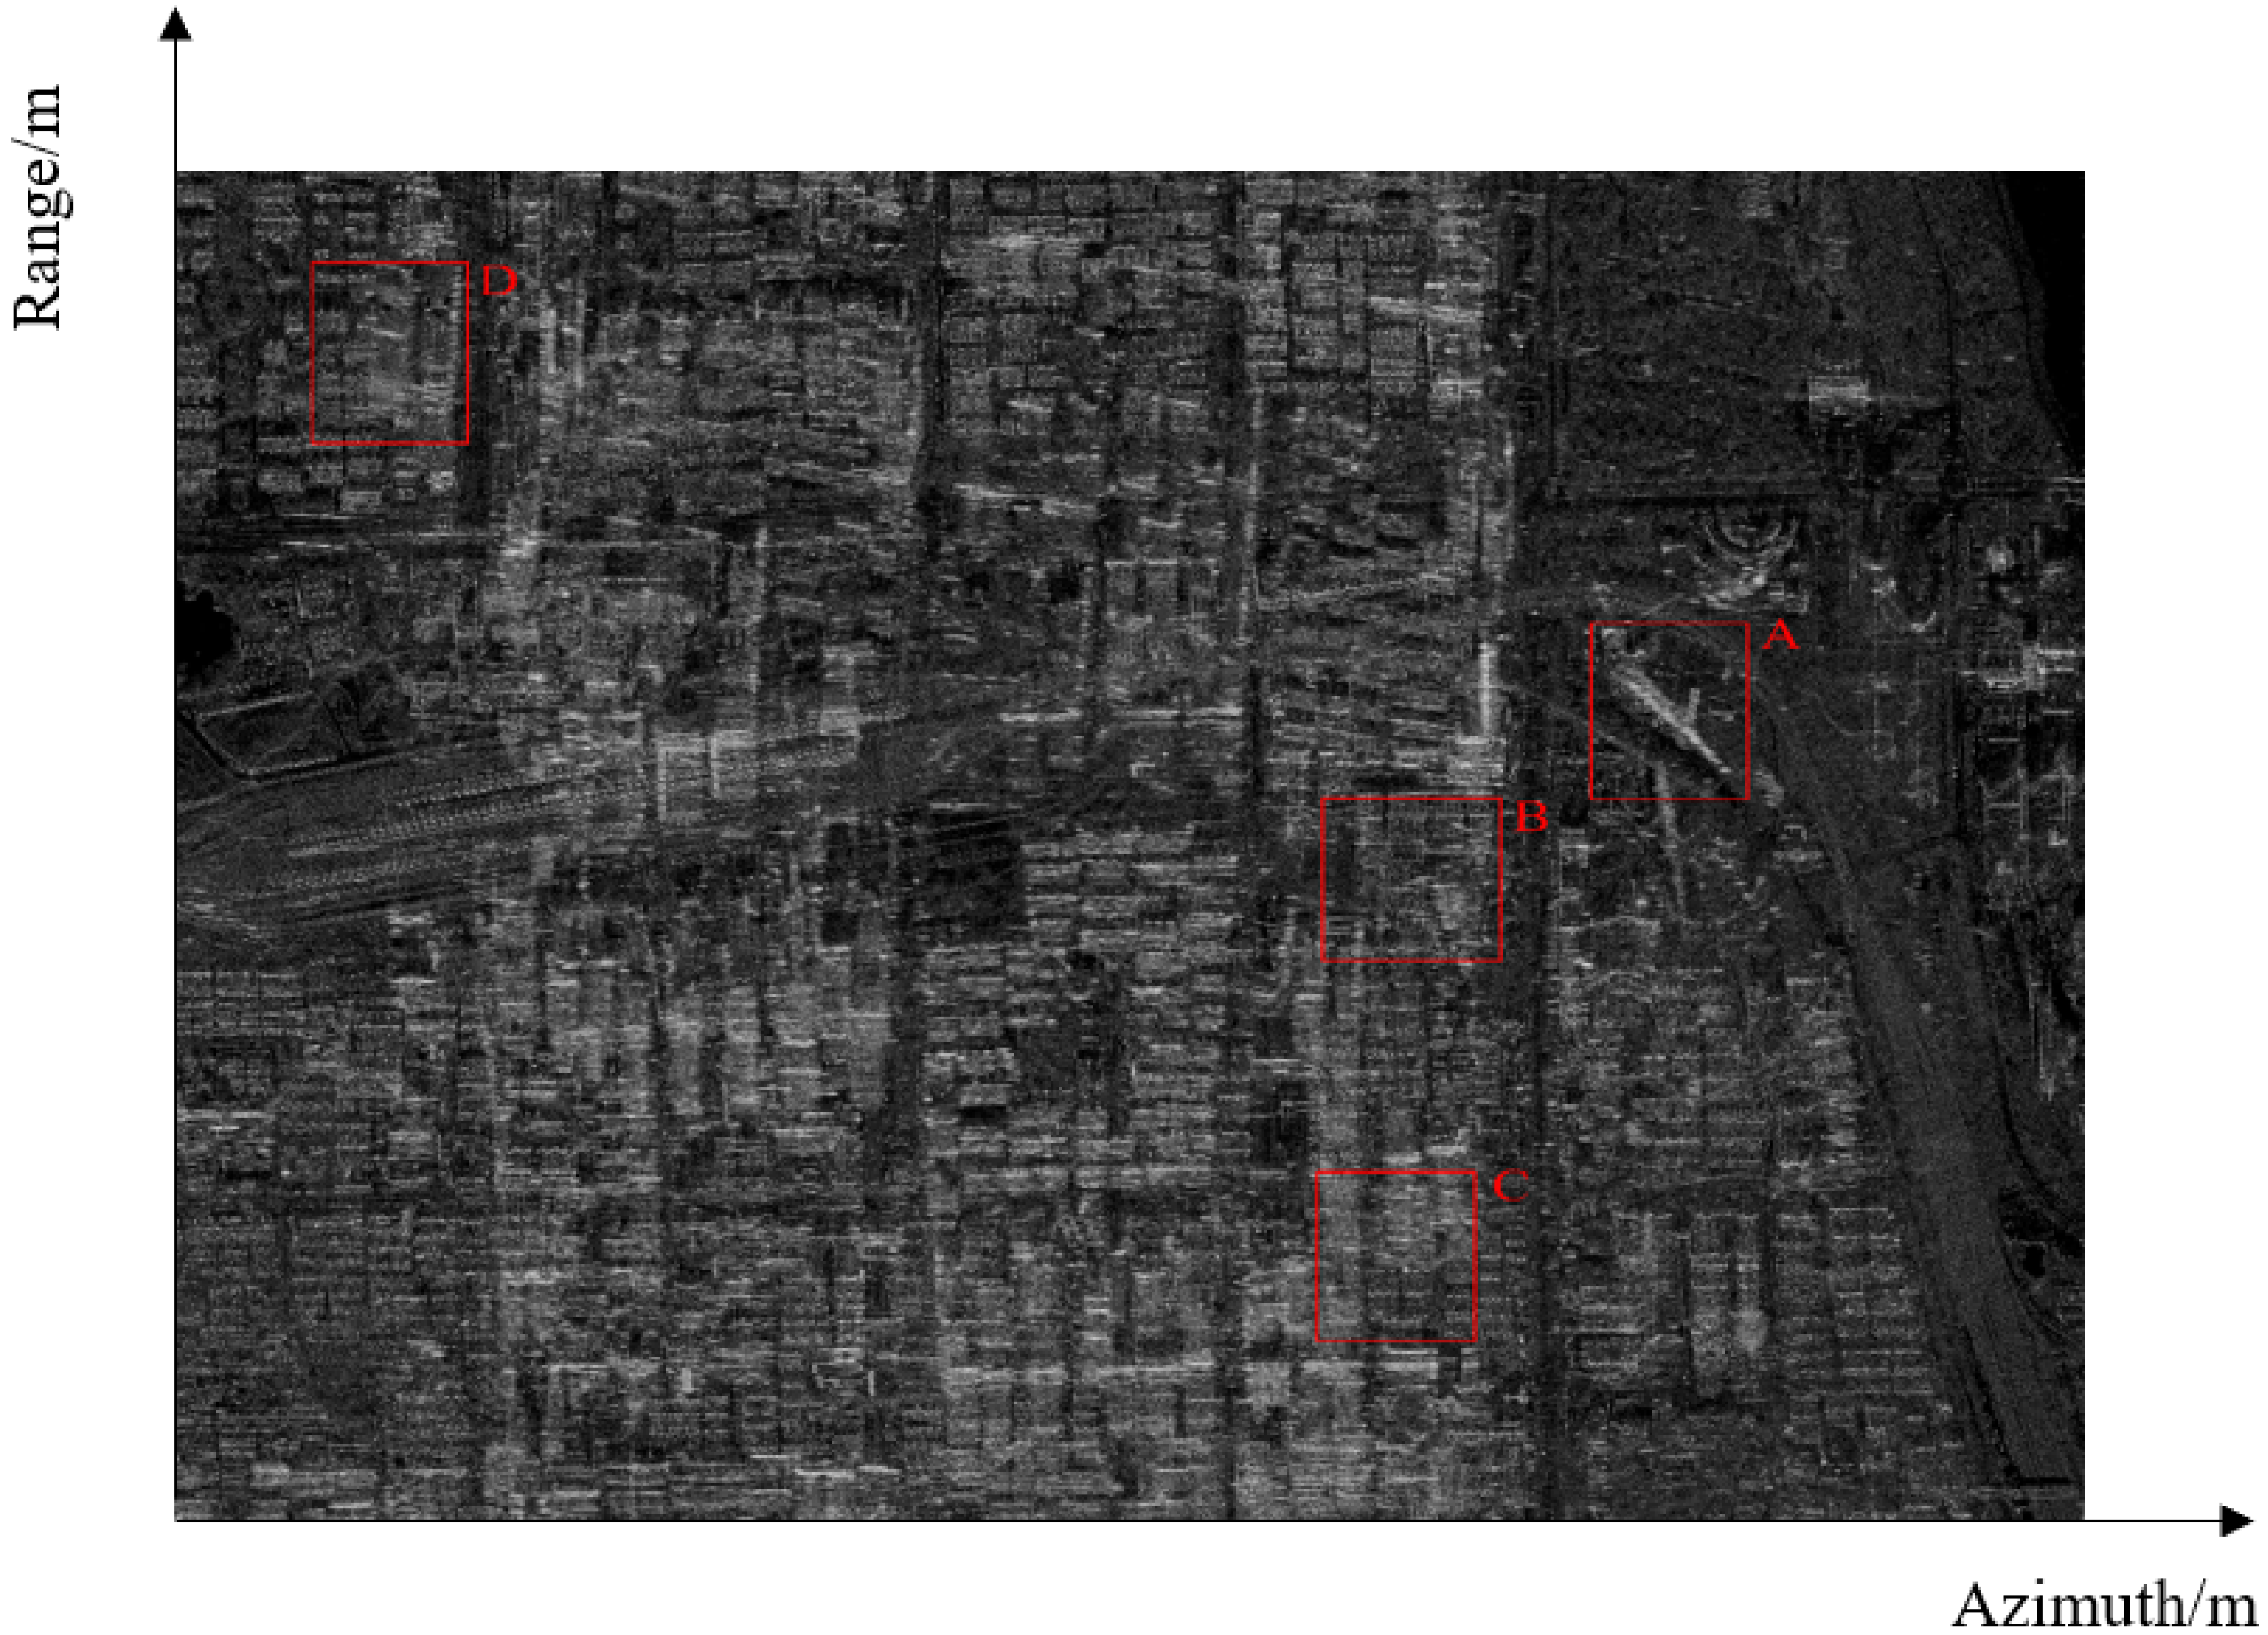
Figure 10.
The results of range ambiguity resolution and 3D imaging of area A: (a) the SAR image with range ambiguity; (b) the near scene after range ambiguity resolution; (c) the far scene after range ambiguity resolution; (d) the 3D imaging result of (b); and (e) the 3D imaging result of (c).
Figure 10.
The results of range ambiguity resolution and 3D imaging of area A: (a) the SAR image with range ambiguity; (b) the near scene after range ambiguity resolution; (c) the far scene after range ambiguity resolution; (d) the 3D imaging result of (b); and (e) the 3D imaging result of (c).

Figure 11.
The results of range ambiguity resolution and 3D imaging of area B: (a) the SAR image with range ambiguity; (b) the near scene after range ambiguity resolution; (c) the far scene after range ambiguity resolution; (d) the 3D imaging result of (b); and (e) the 3D imaging result of (c).
Figure 11.
The results of range ambiguity resolution and 3D imaging of area B: (a) the SAR image with range ambiguity; (b) the near scene after range ambiguity resolution; (c) the far scene after range ambiguity resolution; (d) the 3D imaging result of (b); and (e) the 3D imaging result of (c).
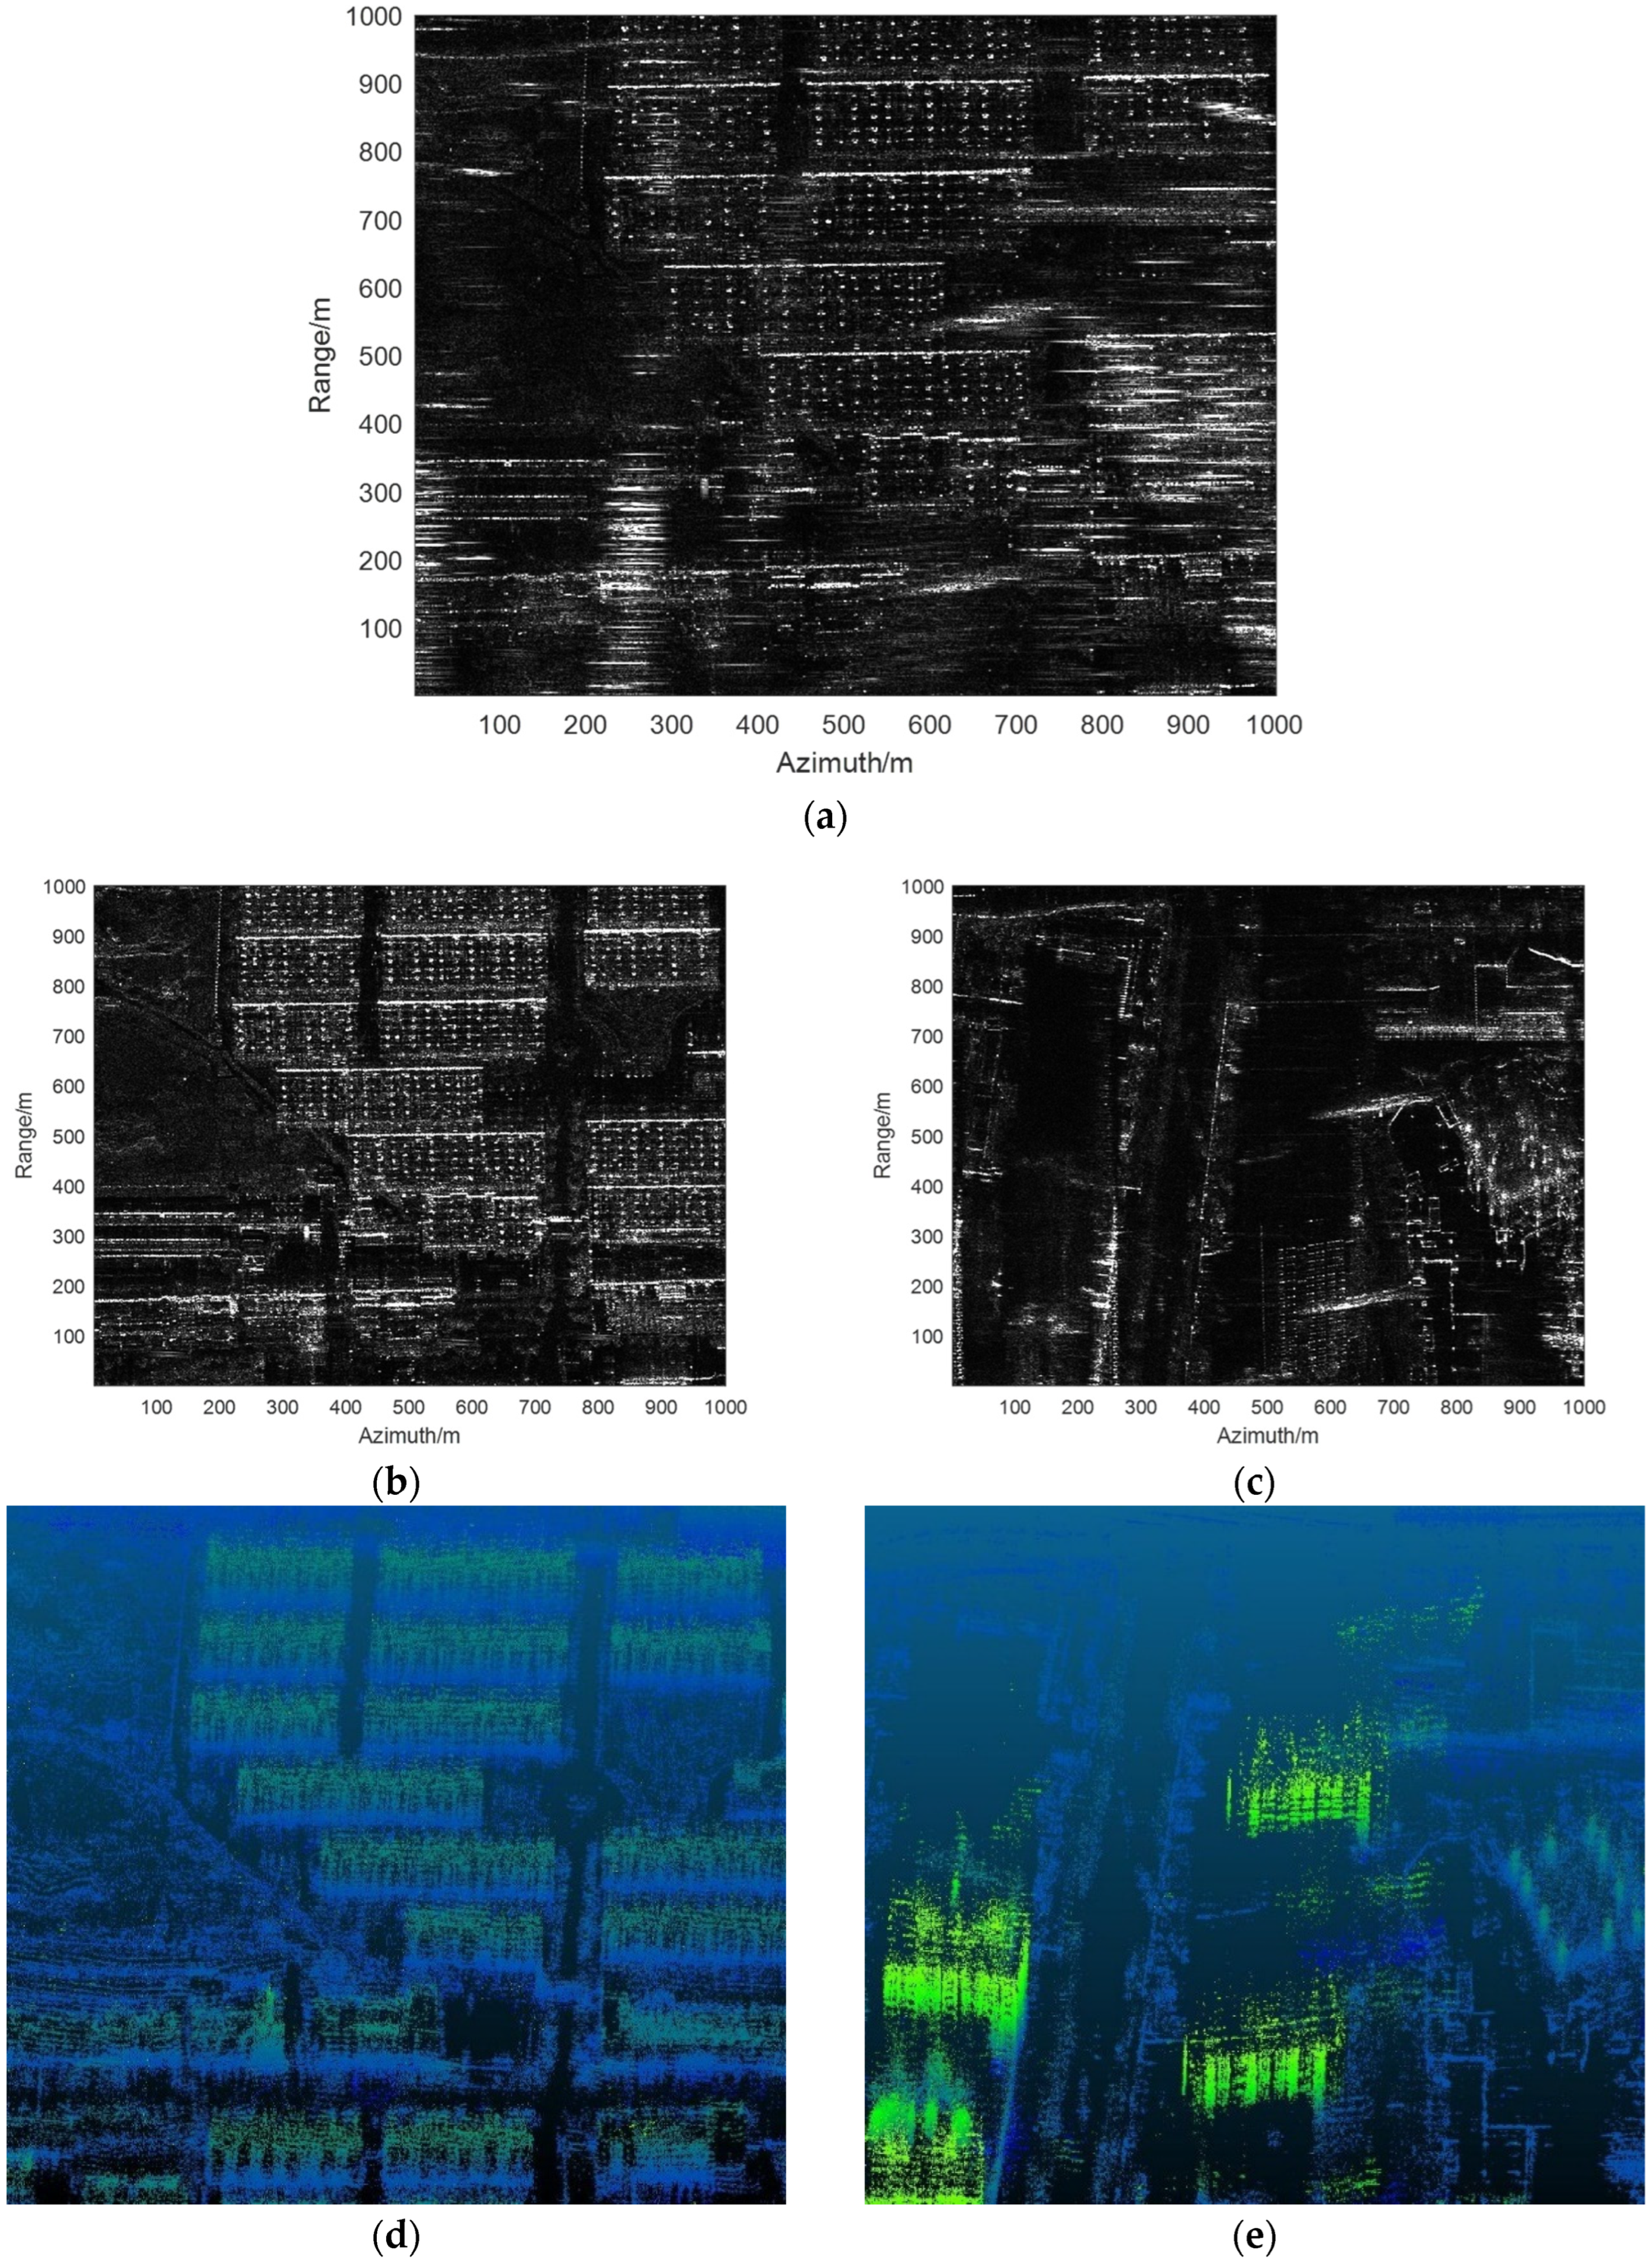
Figure 12.
The results of range ambiguity resolution and 3D imaging of area C: (a) the SAR image with range ambiguity; (b) the near scene after range ambiguity resolution; (c) the far scene after range ambiguity resolution; (d) the 3D imaging result of (b); and (e) the 3D imaging result of (c).
Figure 12.
The results of range ambiguity resolution and 3D imaging of area C: (a) the SAR image with range ambiguity; (b) the near scene after range ambiguity resolution; (c) the far scene after range ambiguity resolution; (d) the 3D imaging result of (b); and (e) the 3D imaging result of (c).
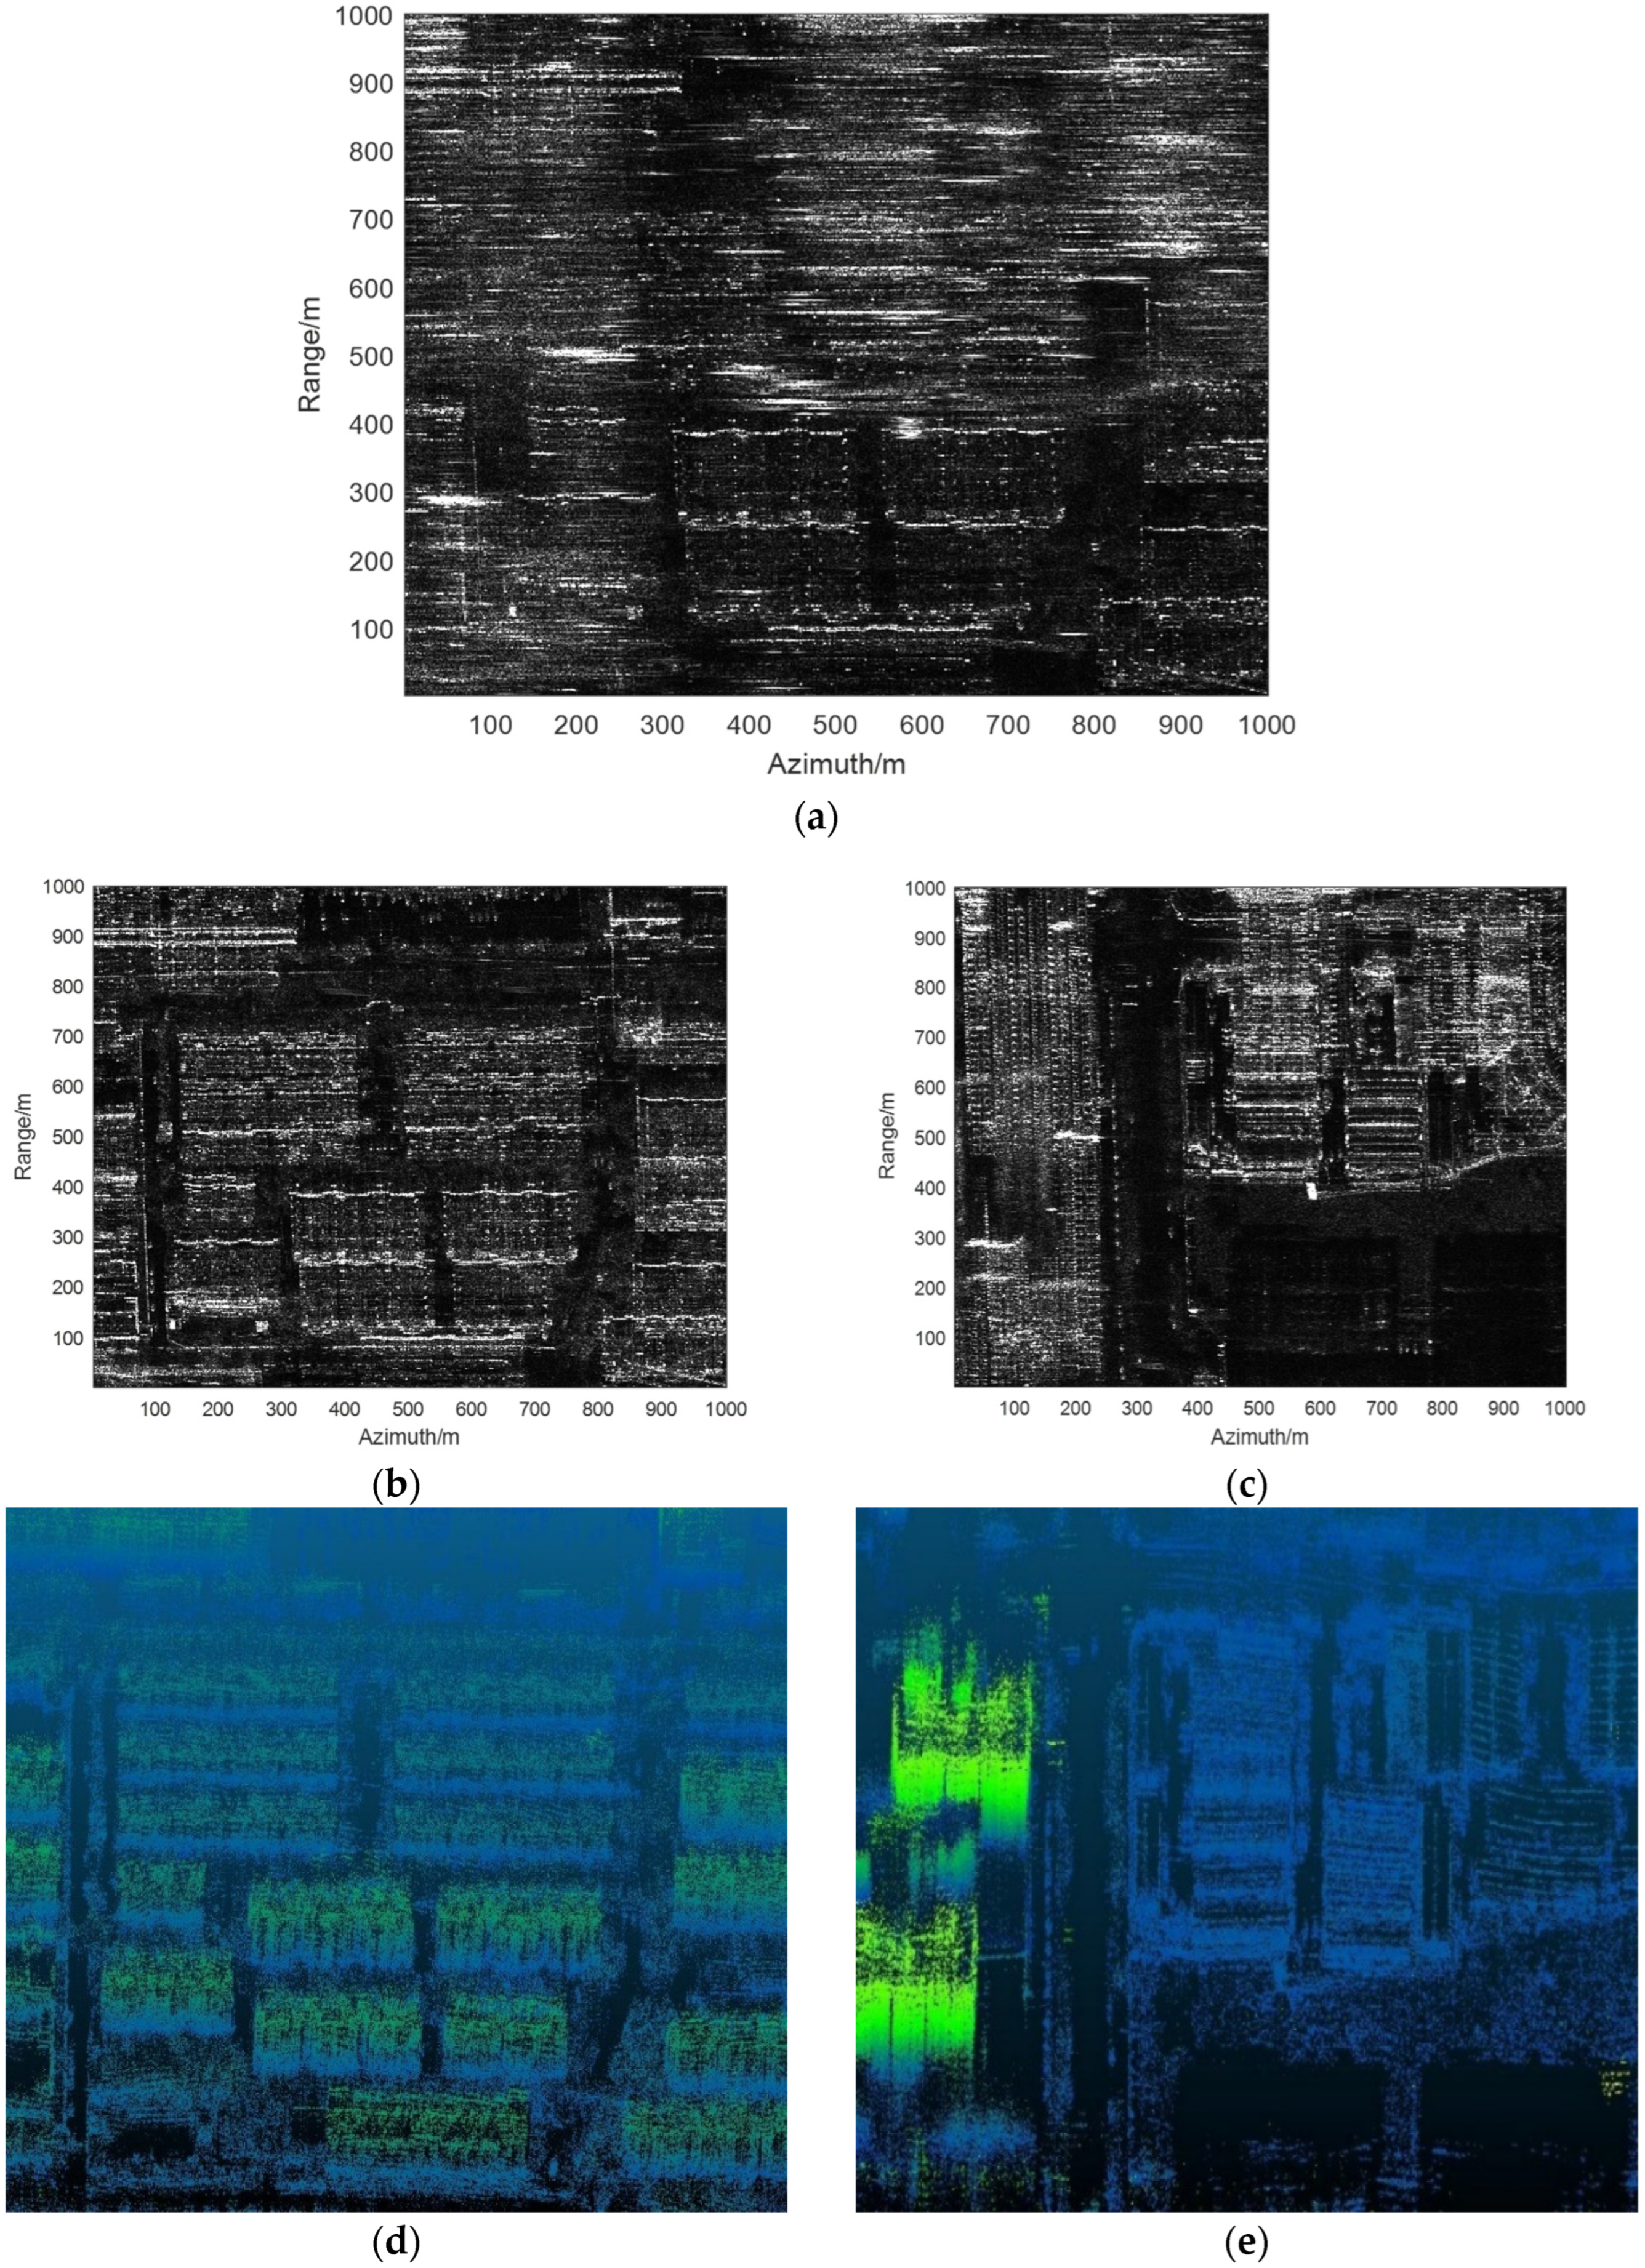
Figure 13.
The results of range ambiguity resolution and 3D imaging of area D: (a) the SAR image with range ambiguity; (b) the near scene after range ambiguity resolution; (c) the far scene after range ambiguity resolution; (d) the 3D imaging result of (b); and (e) the 3D imaging result of (c).
Figure 13.
The results of range ambiguity resolution and 3D imaging of area D: (a) the SAR image with range ambiguity; (b) the near scene after range ambiguity resolution; (c) the far scene after range ambiguity resolution; (d) the 3D imaging result of (b); and (e) the 3D imaging result of (c).

Figure 14.
The interferometric phase before and after the range ambiguity resolution of the SAR image: (a) before range ambiguity resolution and (b) after range ambiguity resolution.
Figure 14.
The interferometric phase before and after the range ambiguity resolution of the SAR image: (a) before range ambiguity resolution and (b) after range ambiguity resolution.
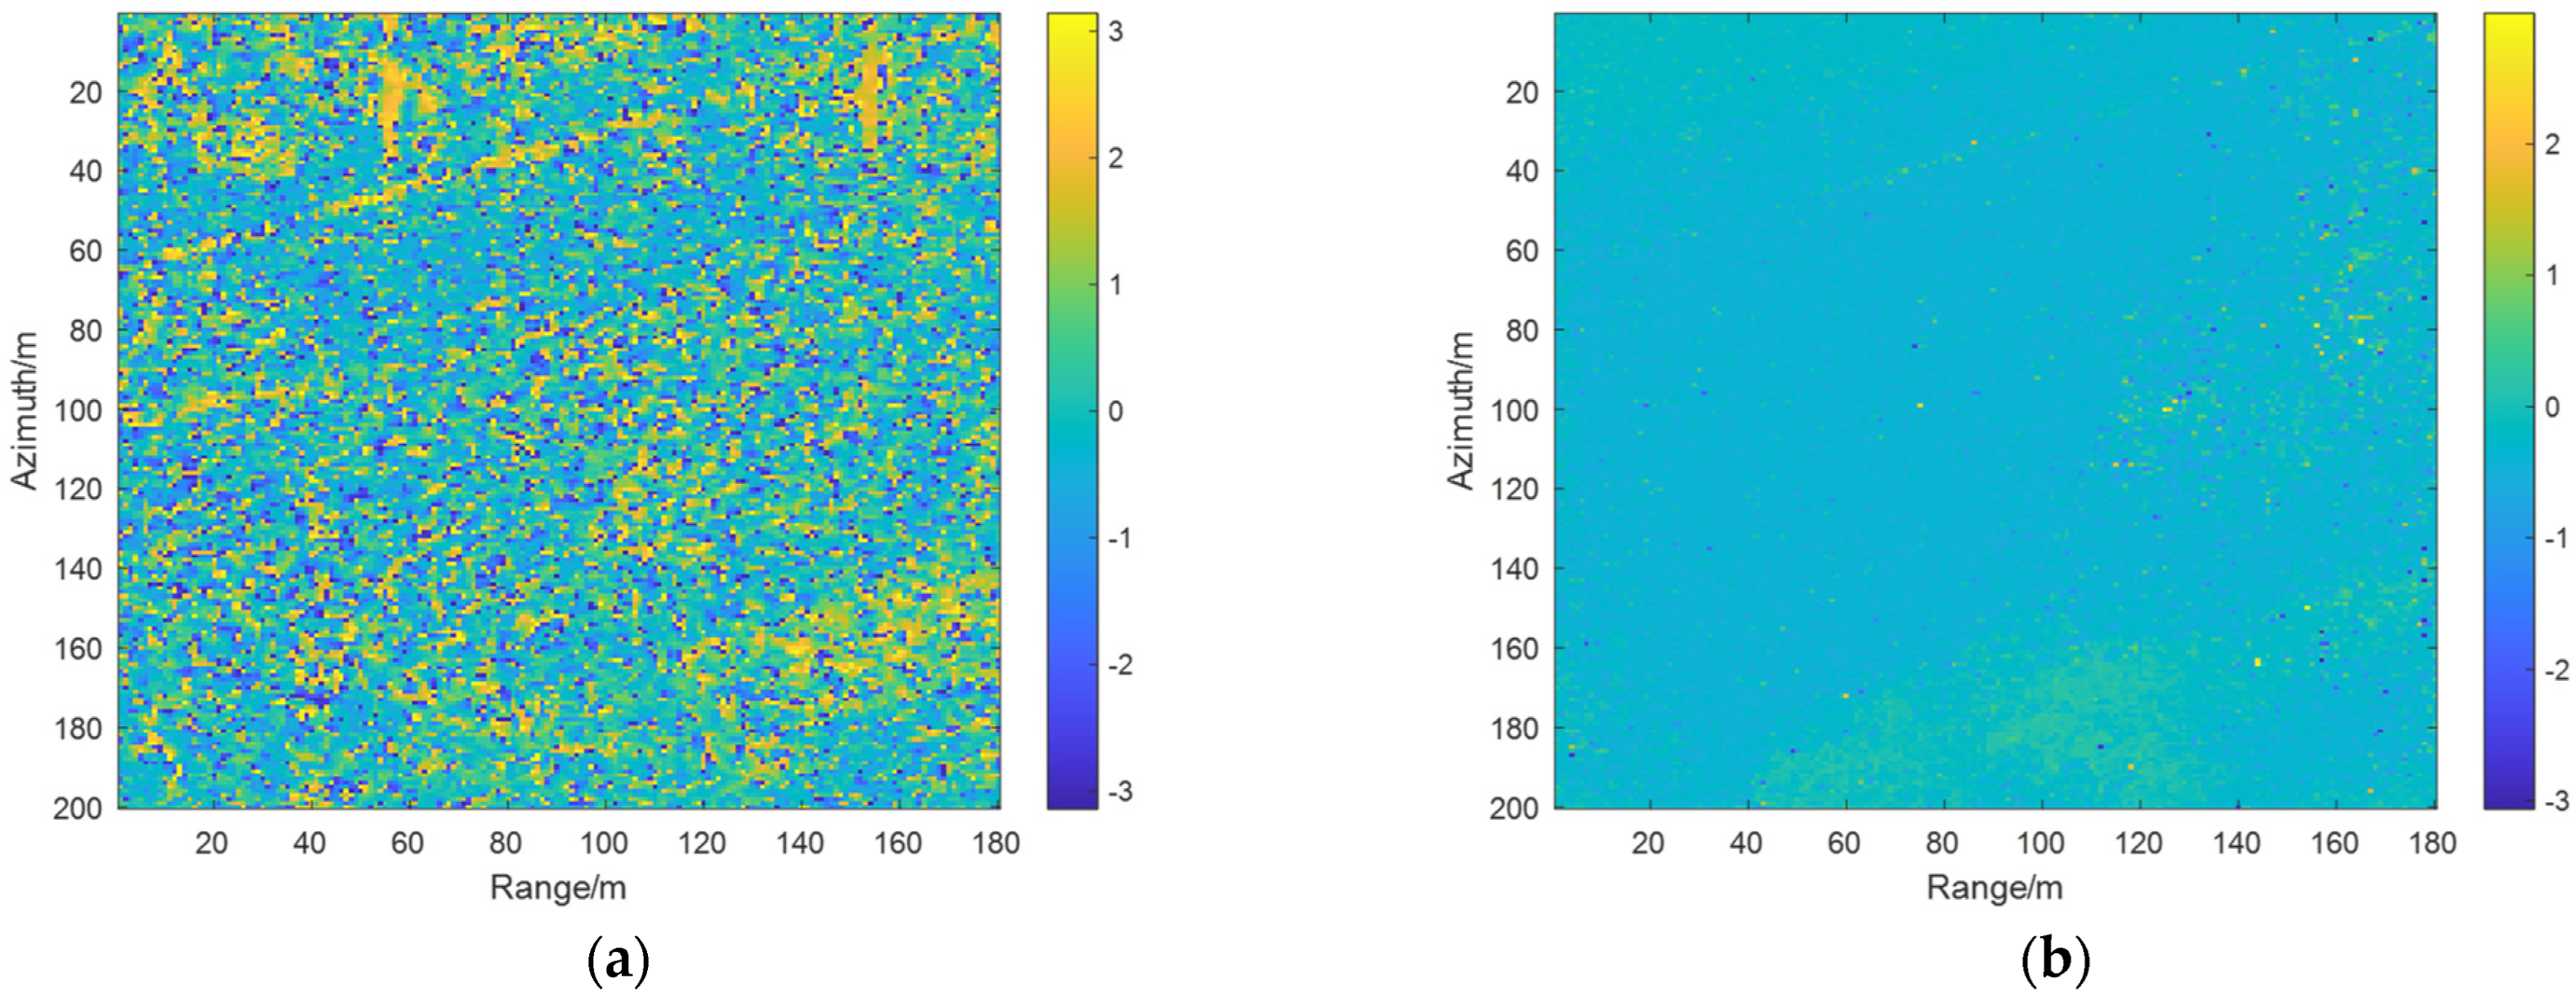
Figure 15.
HRWS 3D imaging result of the study area.

Table 1.
The main parameters of the system.
| Parameter | Symbol | Value |
|---|---|---|
| Center frequency | 10 GHz | |
| Bandwidth | 500 MHz | |
| Channel number | 14 | |
| Baseline interval | 0.2 m | |
| The horizontal inclination of the baseline | 0 deg | |
| Flight height | 3.5 km | |
| Central incidence angle | 35 deg |
Table 2.
The Coherence coefficient before and after range ambiguity resolution.
| Channel | Before Range Ambiguity Resolution | After Range Ambiguity Resolution |
|---|---|---|
| 1–2 | 0.5357 | 0.9861 |
| 2–3 | 0.4751 | 0.9860 |
| 3–4 | 0.5692 | 0.9861 |
| 4–5 | 0.5596 | 0.9861 |
| 5–6 | 0.6005 | 0.9860 |
| 6–7 | 0.6290 | 0.9860 |
| 7–8 | 0.5897 | 0.9864 |
| 8–9 | 0.5695 | 0.9867 |
| 9–10 | 0.5887 | 0.9867 |
Disclaimer/Publisher’s Note: The statements, opinions and data contained in all publications are solely those of the individual author(s) and contributor(s) and not of MDPI and/or the editor(s). MDPI and/or the editor(s) disclaim responsibility for any injury to people or property resulting from any ideas, methods, instructions or products referred to in the content. |
© 2023 by the authors. Licensee MDPI, Basel, Switzerland. This article is an open access article distributed under the terms and conditions of the Creative Commons Attribution (CC BY) license (https://creativecommons.org/licenses/by/4.0/).
Share and Cite
MDPI and ACS Style
Yang, Y.; Zhang, F.; Tian, Y.; Chen, L.; Wang, R.; Wu, Y. High-Resolution and Wide-Swath 3D Imaging for Urban Areas Based on Distributed Spaceborne SAR. Remote Sens. 2023, 15, 3938. https://doi.org/10.3390/rs15163938
AMA Style
Yang Y, Zhang F, Tian Y, Chen L, Wang R, Wu Y. High-Resolution and Wide-Swath 3D Imaging for Urban Areas Based on Distributed Spaceborne SAR. Remote Sensing. 2023; 15(16):3938. https://doi.org/10.3390/rs15163938
Chicago/Turabian StyleYang, Yaqian, Fubo Zhang, Ye Tian, Longyong Chen, Robert Wang, and Yirong Wu. 2023. "High-Resolution and Wide-Swath 3D Imaging for Urban Areas Based on Distributed Spaceborne SAR" Remote Sensing 15, no. 16: 3938. https://doi.org/10.3390/rs15163938
Note that from the first issue of 2016, this journal uses article numbers instead of page numbers. See further details here.