Article

Towards the Accurate Automatic Detection of Mesoscale Convective Systems in Remote Sensing Data: From Data Mining to Deep Learning Models and Their Applications

by
Mikhail Krinitskiy
1,2,3,*,
Alexander Sprygin
4,5,
Svyatoslav Elizarov
1,
Alexandra Narizhnaya
4,
Andrei Shikhov
4,6 and
Alexander Chernokulsky
4,7
1
Shirshov Institute of Oceanology, Russian Academy of Sciences, Moscow 117997, Russia
2
Moscow Institute of Physics and Technology, 9 Institutskiy per., Dolgoprudny 141701, Russia
3
Moscow Center for Fundamental and Applied Mathematics, Leninskie Gory, 1, Moscow 119991, Russia
4
A.M. Obukhov Institute of Atmospheric Physics, Russian Academy of Sciences, Moscow 119017, Russia
5
Scientific and Production Association “Typhoon”, Obninsk 249038, Russia
6
Faculty of Geography, Perm State University, Perm 614068, Russia
7
Institute of Geography, Russian Academy of Sciences, Moscow 119017, Russia
*
Author to whom correspondence should be addressed.
Remote Sens. 2023, 15(14), 3493; https://doi.org/10.3390/rs15143493
Submission received: 23 April 2023 / Revised: 26 June 2023 / Accepted: 30 June 2023 / Published: 11 July 2023
(This article belongs to the Special Issue Remote Sensing of Extreme Weather Events: Monitoring and Modeling)

Abstract

:
Mesoscale convective systems (MCSs) and associated hazardous meteorological phenomena cause considerable economic damage and even loss of lives in the mid-latitudes. The mechanisms behind the formation and intensification of MCSs are still not well understood due to limited observational data and inaccurate climate models. Improving the prediction and understanding of MCSs is a high-priority area in hydrometeorology. One may study MCSs either employing high-resolution atmospheric modeling or through the analysis of remote sensing images which are known to reflect some of the characteristics of MCSs, including high temperature gradients of cloud-top, specific spatial shapes of temperature patterns, etc. However, research on MCSs using remote sensing data is limited by inadequate (in size) databases of satellite-identified MCSs and poorly equipped automated tools for MCS identification and tracking. In this study, we present (a) the GeoAnnotateAssisted tool for fast and convenient visual identification of MCSs in satellite imagery, which is capable of providing AI-generated suggestions of MCS labels; (b) the Dataset of Mesoscale Convective Systems over the European Territory of Russia (DaMesCoS-ETR), which we created using this tool, and (c) the Deep Convolutional Neural Network for the Identification of Mesoscale Convective Systems (MesCoSNet), constructed following the RetinaNet architecture, which is capable of identifying MCSs in Meteosat MSG/SEVIRI data. We demonstrate that our neural network, optimized in terms of its hyperparameters, provides high MCS identification quality ( mAP = 0.75 , true positive rate TPR = 0.61 ) and a well-specified detection uncertainty (false alarm ratio FAR = 0.36 ). Additionally, we demonstrate potential applications of the GeoAnnotateAssisted labelling tool, the DaMesCoS-ETR dataset, and the MesCoSNet neural network in addressing MCS research challenges. Specifically, we present the climatology of axisymmetric MCSs over the European territory of Russia from 2014 to 2020 during summer seasons (May to September), obtained using MesCoSNet with Meteosat MSG/SEVIRI data. The automated identification of MCSs by the MesCoSNet artificial neural network opens up new avenues for previously unattainable MCS research topics.

1. Introduction

Over the past thirty years, northern Eurasia, including the territory of Russia, has experienced the warmest temperatures in recorded meteorological history. Air temperatures in Russia are increasing 2.5 times faster than the global average [1]. The observed climate warming has led to an intensification of convective processes in the atmosphere, as well as to an increase in the frequency and intensity of hazardous convective weather events [2,3,4]. In Russia, these events cause significant economic damage and loss of life. The most notable among them are extreme precipitation, including a flash flood in Krymsk in 2012 [5], strong tornadoes in both the European and Asian parts of the country [6,7,8], and destructive linear storms in 2010, 2017, and 2021 [9,10,11]. Hazardous convective events, i.e., heavy convective rainfall, tornadoes, squalls, and large hail, typically occur during the warm season and are generated by mesoscale convective systems (hereafter MCSs). Despite their importance, the characteristics and variability of MCSs over northern Eurasia remain understudied.
An MCS is an organized cluster of cumulonimbus clouds that forms a precipitation region larger than 100 km (in at least one direction) due to deep moist convection [12]. While the majority of MCSs are found in the tropics, a smaller number can be observed in the mid-latitudes during the warm season [13]. The most widely used classification of MCSs, proposed by Maddox [14], is based on their geometry and horizontal dimensions. Specifically, linear and axisymmetric MCSs are identified. The former are further subdivided into squall lines (meso-alpha scale) and cumulonimbus ridges (meso-beta scale) based on the Orlanski classification [15]. Axisymmetric MCSs include mesoscale convective complexes (MCCs) (meso-alpha scale systems) and cumulonimbus cloud clusters and supercells (meso-beta scale).
Observational and climatological studies of MCSs are based on the use of remote sensing data. In particular, long-term data series are provided by polar orbiting satellites such as NOAA or Terra/Aqua, and geostationary satellites like GOES, Meteosat, or Himawari. MCSs can be identified and tracked using infrared satellite images as they produce contiguous regions of extremely cold cloud-top temperatures [16]. In addition, geostationary satellite imagery has broad spatial and temporal coverage, and the methods for analyzing its data can be applied to any region of the globe. One of the first satellite-based studies of the climatological characteristics of MCSs (focusing on mesoscale convective complexes) was performed by Laing and Fritsch [13] for 1986–1997. Morel and Senesi [17,18] compiled a satellite-derived database of MCSs over Europe for 1993–1997. In subsequent years, many climatological studies of MCSs have been carried out both globally [19] and for macro-regions like the contiguous United States [19], China [20,21], and west Africa [22]. In addition to tracking MCSs, infrared satellite images are used to evaluate several characteristics of MCSs. In particular, signatures on the cloud-tops, such as overshooting tops (OTs) [23], cold rings [24], cold U/V features [25], and above-anvil cirrus plume [26], indicate strong updrafts and the areas with high potential for severe weather. Long-term databases of these signatures have been established for Europe [27,28], North America [29], and the globe [30].
Along with satellite images, weather radar data are widely used in climatological studies of MCSs [31]. These data have high spatial and temporal resolution and enable evaluation of MCS characteristics and evolution. Radar-based climatologies of MCSs have been compiled for the U.S. [32] and eastern Europe [33]. In addition to the MCSs itself and their morphological features, weather radar data have been successfully used to estimate the climatological characteristics of hailstorms [34,35]. The main limitation of radar data is their sparse spatial coverage in some regions. This is especially true in northern Eurasia, where the new Doppler weather radar system became operational in the 2010s and now only partially covers western Russia [36], while data from previous radars (MRL-5) are not integrated, fragmentary and often not digitized.
MCS statistics for northern Eurasia are currently fragmented and insufficient. Only a few research studies may be mentioned, including Abdullaev et al. [37], who studied 214 MCSs in the Moscow region in 1990–1995; Sprygin [38], who identified 30 long-lived MCSs over Belarus, Ukraine, and the central part of European Russia for 2009–2019; and Chernokulsky et al. [39], who estimated the characteristics of 128 convective storms and their cloud-tops associated with severe wind and tornado events over the western regions of northern Eurasia for 2006–2021. The main drawback of the aforementioned studies is that MCS selection was secondary and determined by the initial selection of hazardous events (i.e., squall or tornado), which may have biased MCS sampling towards more powerful MCSs. Currently, long-term homogeneous and unbiased statistics of MCSs are lacking not only for the entire northern Eurasia region, but also for its European part.
The identification of MCSs on satellite images can be carried out by experts or through the use of automated tools. The increasing amount of experimental data, especially those related to the spatial and temporal distribution of various meteorological parameters, has led to a growing reliance on automated data-processing and analysis techniques. At the same time, the time required to visually identify and study MCSs in satellite imagery remains significant. Alternatively, to better understand the dynamics of MCSs, experts can use advanced machine learning algorithms that can identify patterns and trends in the vast amounts of data available.
For two-dimensional data analysis, which is visually representable, frequently, computer vision techniques may be employed alongside the numerical simulation methods mentioned above. These include image-processing techniques adapted for visual pattern recognition, keypoint detection and clustering, and connected components identification. In addition to image-processing methods that analyze color and brightness [40], various approaches can be utilized, including image analysis with machine learning algorithms [41].
Machine learning (ML) and deep learning (DL) methods were shown to be useful tools in problems of pattern recognition, visual object detection and other computer vision tasks [42,43,44,45,46]. In recent studies, successful application of ML methods was shown when identifying extreme weather events in reanalyses data [47,48,49]. Most research groups focus on the identification of synoptic-scale atmospheric phenomena, such as tropical cyclones [50,51] and atmospheric rivers [52], because of clear representation of these events in most observational data and simulated atmospheric dynamics data. There are some studies on mesoscale geophysical phenomena identification using DL techniques: in Huang et al. 2017 [53], the authors identified submesoscale oceanic vortices in SAR satellite data; in Krinitskiy et al. 2018 [54], the authors demonstrated the capabilities of convolutional neural networks for classifying polar lows in infrared and microwave satellite mosaics. Further, in Krinitskiy et al. 2020 [55], the authors applied convolutional neural networks to the problem of polar lows identification in satellite mosaics in the Southern ocean.
To the best of our knowledge, there are only a few studies on the identification and tracking of mesoscale convective systems over the land in satellite imagery using deep learning techniques [29]. There are several reasons for this lack of accurate research:
  • the signal-to-noise ratio is not very high for satellite imagery. This feature is not an issue for major events of synoptic scale. However, it becomes one in the case of mesoscale phenomena;
  • one of the most impactful issues of supervised ML methods in the Earth Sciences is the lack of labeled datasets. There are a number of labeled benchmarks for classic computer vision tasks, like Microsoft COCO [56], Cityscapes [57], Imagenet [58] and others [59,60,61]. In climate sciences, the amount of remote sensing and modeling data are unprecedented today, but most of the datasets are unlabeled concerning semantically meaningful meteorological events and phenomena. There are rare exceptions, such as the Dataset of All-Sky Imagery over the Ocean (DASIO [41]) or the Southern Ocean Mesocyclones Dataset (SOMC [62]);
  • in the rare cases of labeled datasets, the amount of labels is insufficient for training a reliable machine learning or deep learning model with good generalization;
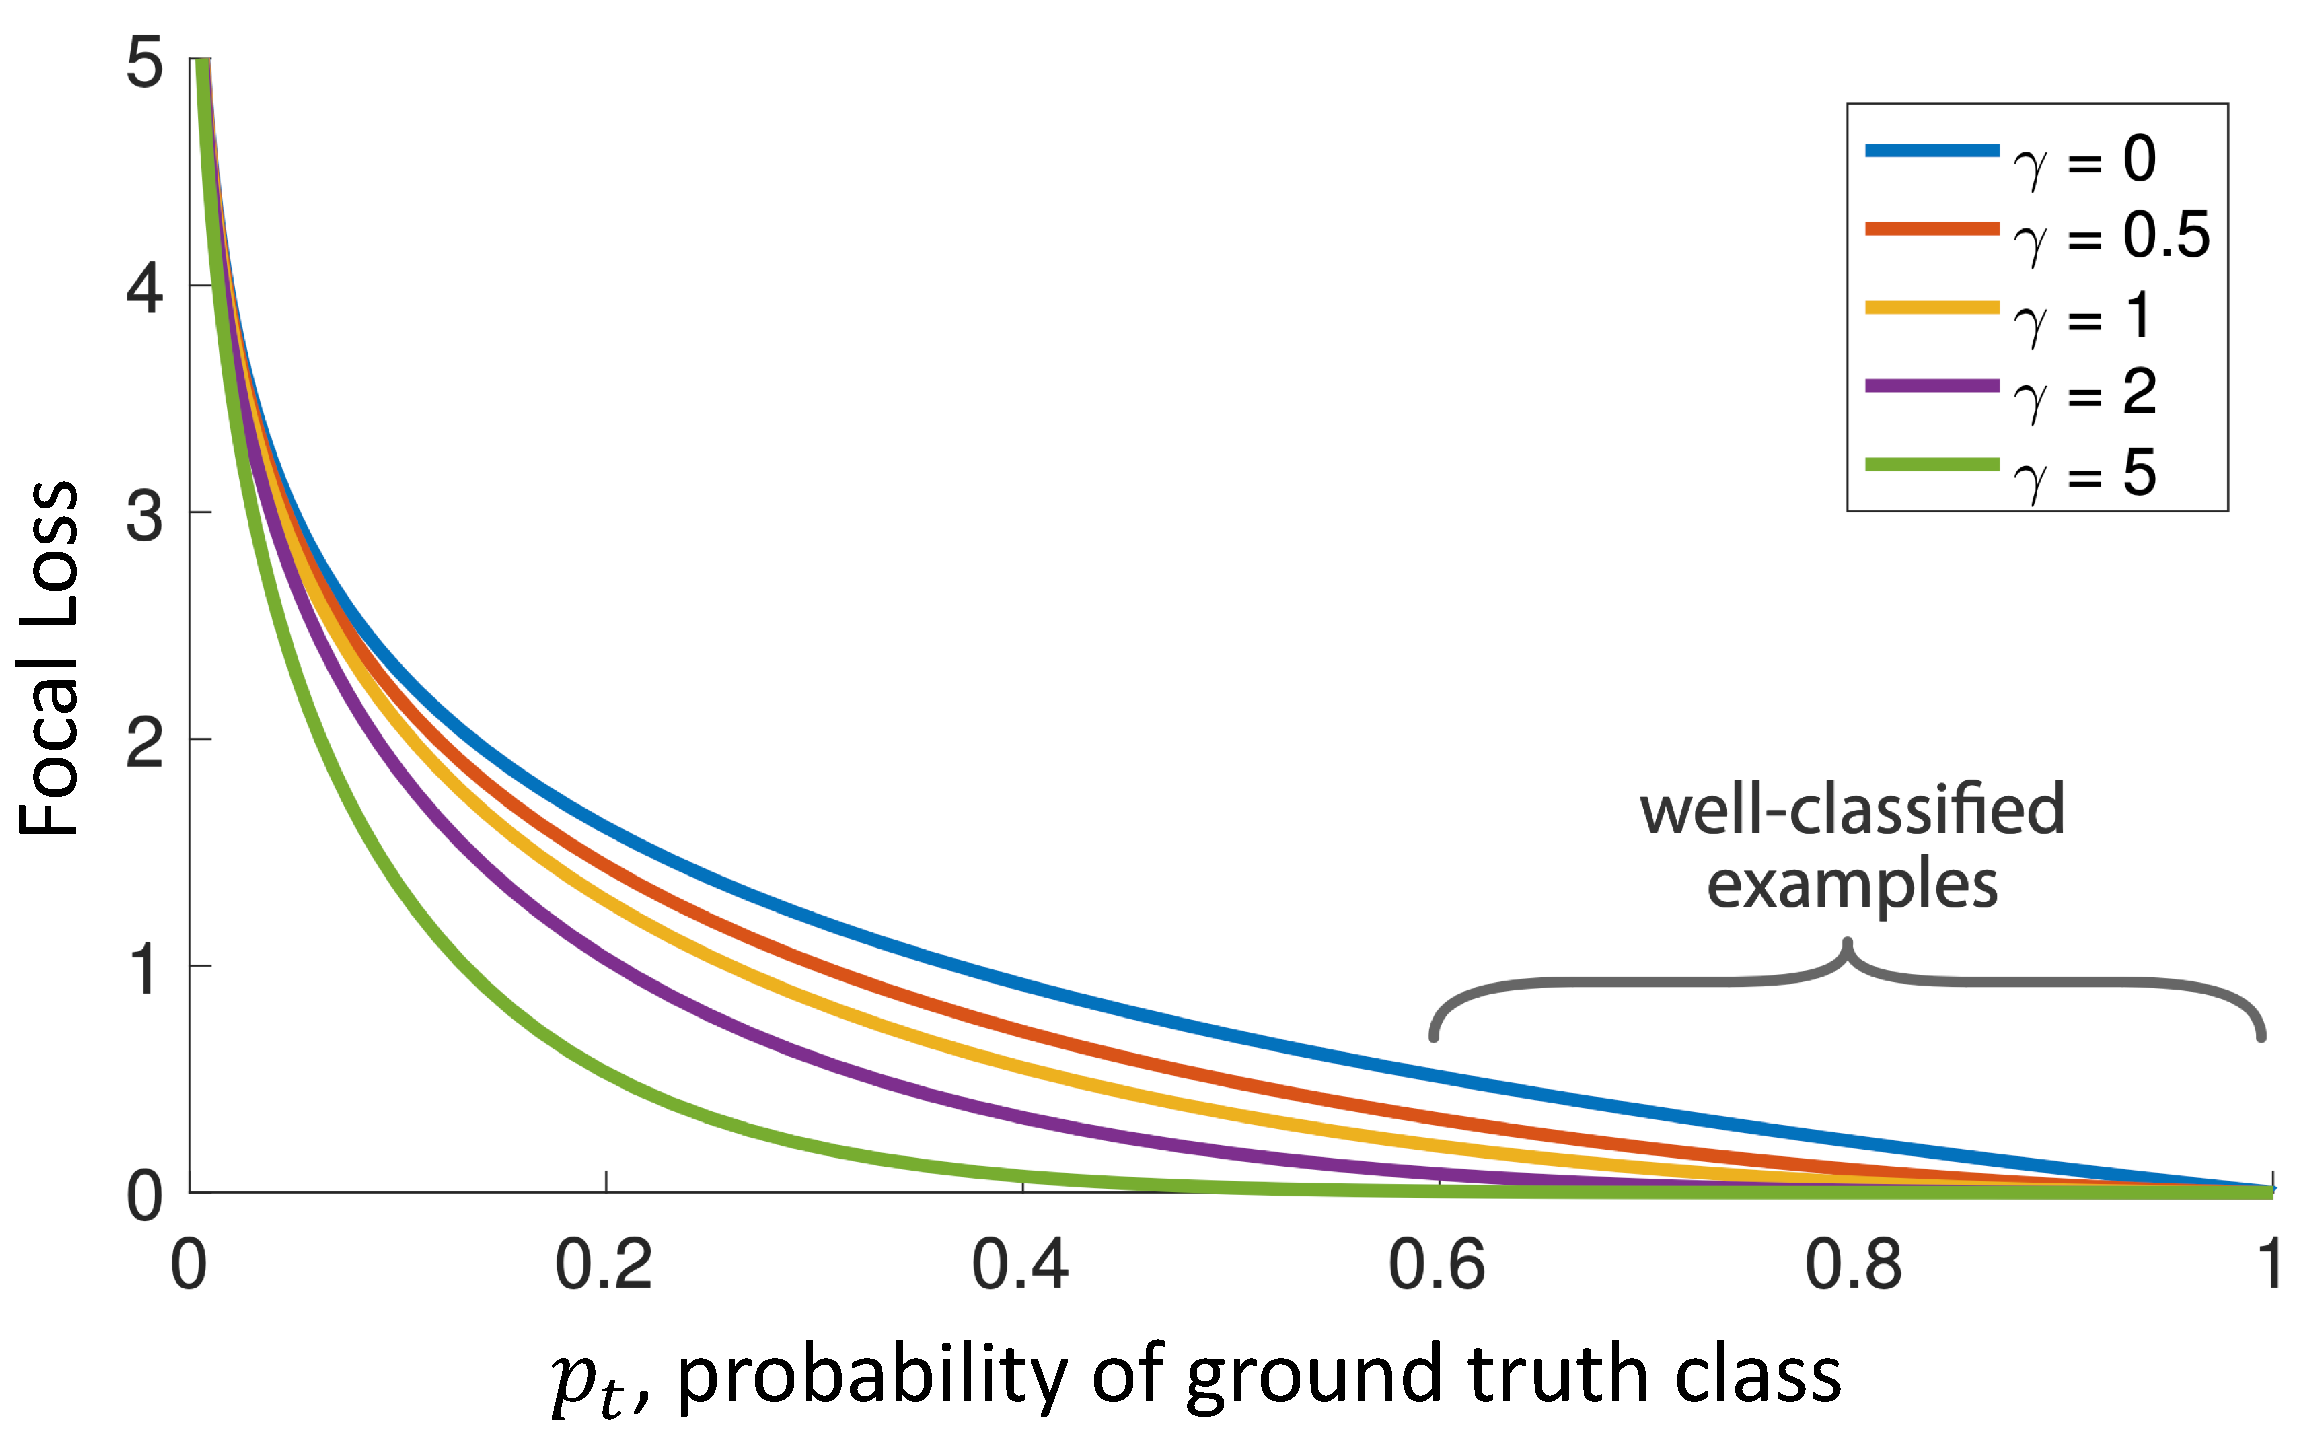
  • in the case of a labeled dataset, one needs to deal with the issue of uneven fractions of “positively” and “negatively” marked points (pixels) in a satellite image, meaning the area of the phenomena labeled in the image is much less compared to the phenomena-free area. This problem is referred to as “class imbalance” in machine learning. As a consequence, a deep learning model may suffer from loss of generalization from too many false alarms or too many missed events. In the case of unsuitable neural network configuration and improper training process, one may find the model in a state where it “prefers” to identify no events at all with low loss value instead of trying to find phenomena of interest, resulting in almost the same but insignificantly lower loss.
Most of the abovementioned issues do not affect the quality of the detection of synoptic-scale extreme atmospheric phenomena in reanalyses [47]. However, each one of these issues needs to be addressed in the case of MCS detection in remote sensing imagery.
The primary objective of our study is to determine the frequency of MCS occurrence over a specific geospatial region using remote sensing imagery and deep learning techniques. At the onset of our research, we acknowledged the challenges associated with obtaining a sufficiently large labeled dataset of MCSs in remote sensing imagery due to the costs of expert labeling. Unlike routine visual object detection (VOD), MCSs are not easily recognizable by non-expert human observers, rendering crowd-sourcing an impractical solution for collecting extensive labeled datasets.
Given the limitations in expert resources, we accepted certain trade-offs in the properties of the solution derived from our study. Consequently, we accepted a potential reduction in confidence regarding the detected MCS labels when employing a deep learning model trained on our labeled data. Despite this, our findings may still provide valuable insights into the activity of MCSs within the region of interest.
Our study’s goal can be rephrased as determining the probability of MCS occurrence within a given time frame. While we may not be able to detect MCSs with high precision in every remote sensing image, our approach can still yield accurate estimates of MCS frequency. This information can then be utilized for further research on correlations between MCSs and meteorological indices or for assessing their economic impact.
Thus, in this study, we address the challenge of estimating the frequency of mesoscale convective system occurrence over a specific region of interest, namely the European territory of Russia (ETR). To achieve this objective, we tackle a proxy problem, which involves detecting all MCSs present in each available remote sensing imagery snapshot. Subsequently, we derive the frequency of MCS occurrence based on the frequency of the satellite imagery. This approach allows one to estimate the prevalence of MCSs within the target region.
The problem of phenomenon detection in satellite imagery may be reformulated as a VOD problem, with the only exception that satellite imagery is not a visual image. This issue does not prevent one from applying state-of-the-art VOD methods though. Among them are the following approaches: VOD using a locate-and-adjust approach, and VOD using a semantic segmentation approach. In our study, we focused on the locate-and-adjust approach since our preliminary studies demonstrated that extreme mesoscale cyclones (also known as polar lows) and other extreme mesoscale phenomena are hard to segment with state-of-the-art deep convolutional neural networks taking a small labeled dataset into account [55]. Thus, we solve the problem of MCS detection using the locate-and-adjust approach, which implies two generic steps for detection: (i) detecting the rectangular bounding boxes of the phenomena, and (ii) assessing some score (probability) for them to represent a phenomenon of interest.
In our study, we develop the method based on deep neural networks, which we exploited in order to handle the issues of class imbalance and a low amount of labeled data. We started with the RetinaNet [63] architecture of neural networks, which was designed particularly to handle the class imbalance issue in VOD problems.
The rest of the paper is organized as follows: in Section 2, we describe the source data of our study, as well as the procedure for collecting the Dataset of Mesoscale Convective Systems over the ETR (DaMesCoS-ETR). In Section 3, we present the method based on deep convolutional neural networks (DCNN), namely, the Neural Network for the Identification of Mesoscale Convective Systems (MesCoSNet), which we developed following a ReinaNet [63] design for the detection of MCSs in remote sensing imagery; we also describe the method for estimating the frequency of MCSs over the ETR based on the results of MCS detection with MesCoSNet. In Section 4, we present the results of our study regarding the proxy-problem of MCS detection along with the problem of MCS frequency estimation over the ETR. In Section 5, we discuss the properties of the solutions we present. In Section 6, we summarize the results and provide an overview of the forthcoming studies based on the results we present.

2. Data

2.1. Remote Sensing Data

In this study, we used remote sensing data of several Meteosat satellites. Meteosat mission imagery has proven to be useful in meteorological studies since 1977 [64]. First, there were Meteosat 1–7, that were first-generation (MFG) satellites equipped with Meteosat Visible and Infrared Imager (MVIRI). MVIRI provided snapshots in three bands: visible imagery (0.5–0.9   μ m) with central wavelength of 0.7  μ m, water vapor mean temperature (5.7–7.1  μ m) with central wavelength of 6.4  μ m, and the 3-rd infrared band (10.5–12.5  μ m) with central wavelength of 11.5  μ m. First-generation Meteosat satellites were stopped on 31 March 2017. After the MFG, second generation satellites were gradually deployed: Meteosat Second Generation (MSG) Nos. 8, 9, 10, and 11. Currently, MSG are employed for meteorological observations according to the Eumetsat web portal [65]. All the MSG satellites are geostationary and operate on the 36,000 km high. We provide here a brief summary of MSG satellites to justify our decision on the data source for our study focused on the European territory of Russia.
Meteosat-8 (MSG-1) was deployed in 2002. On 1 February 2018, it was placed in the 41 . 5 E position to serve Indian Ocean Data Coverage, replacing Meteosat-7. According to the Eumetsat web portal, it was retired on 1 July 2022. Meteosat-9 (MSG-2) was deployed in 2005. It is placed in the 3 . 5 E position. The period of its imagery is 15 min. It is intended to function until 2025. Its view angle covers the whole Earth disk. On 1 June 2022, it was moved to 45 . 5 E to serve IODC (Indian Ocean Data Coverage). Meteosat-10 (MSG-3) was deployed in 2012, and is placed in the 9 . 5 E position. It has a full-Earth-disk view angle as well, and its imagery period is also 15 min. It also scans Europe, Africa and associated seas with a 5 min period. This satellite will operate until 2030. Meteosat-11 (MSG-4) was deployed in June 2015. It is placed in the 0 E position. It has a full-Earth-disk view angle, and its imagery period is 15 min. According to the Eumetsat web portal, its availability lifetime is expected to end in 2033. A summary of these satellites is presented in Table 1.
There are SEVIRI instruments at each of the MSG satellites. SEVIRI stands for “Spinning Enhanced Visible Infra-Red Imager”, and it images reflected infrared radiation in 12 spectral bands. The SEVIRI instrument is capable of scanning every 5 min (MSG-3) or every 15 min (MSG-1,2,4). There is also visual imagery of high resolution (HRV) with 1 km resolution in sub-satellite point and 3 km elsewhere.
Following the practices described in recent studies for detecting MCSs using remote sensing imagery [24,66], we employed a limited subset of SEVIRI bands and their combination:
  • band-5 ( c h 5 )—radio-brightness temperature imagery for 6.25 μ m mean wavelength, which characterizes water vapor content in the atmosphere column;
  • band-9 ( c h 9 )—radio-brightness temperature imagery for 10.8 μ m mean wavelength, which characterizes the cloud-top temperature;
  • BTD, which is the difference between ch5 and ch9: B T D = c h 5 c h 9 .
We also applied normalization for c h 5 ,   c h 9 and non-linear re-scaling for B T D in order to highlight the patterns in imagery that are characteristic for various MCS according to studies on the physics of mesoscale convective systems. These normalization and rescaling transformations are equivalent to those we applied while preprocessing satellite imagery data when training and testing our neural network MesCoSNet (see Section 3.2.2). As we mention in Section 3.2.2, these transformations are meant to bring the distribution of the features c h 5 ,   c h 9 ,   B T D of source remote sensing data close to the distribution of the R,G,B features of images in the ImageNet [58] dataset, which includes images of real-world visual scenes observed by a person on an everyday basis.

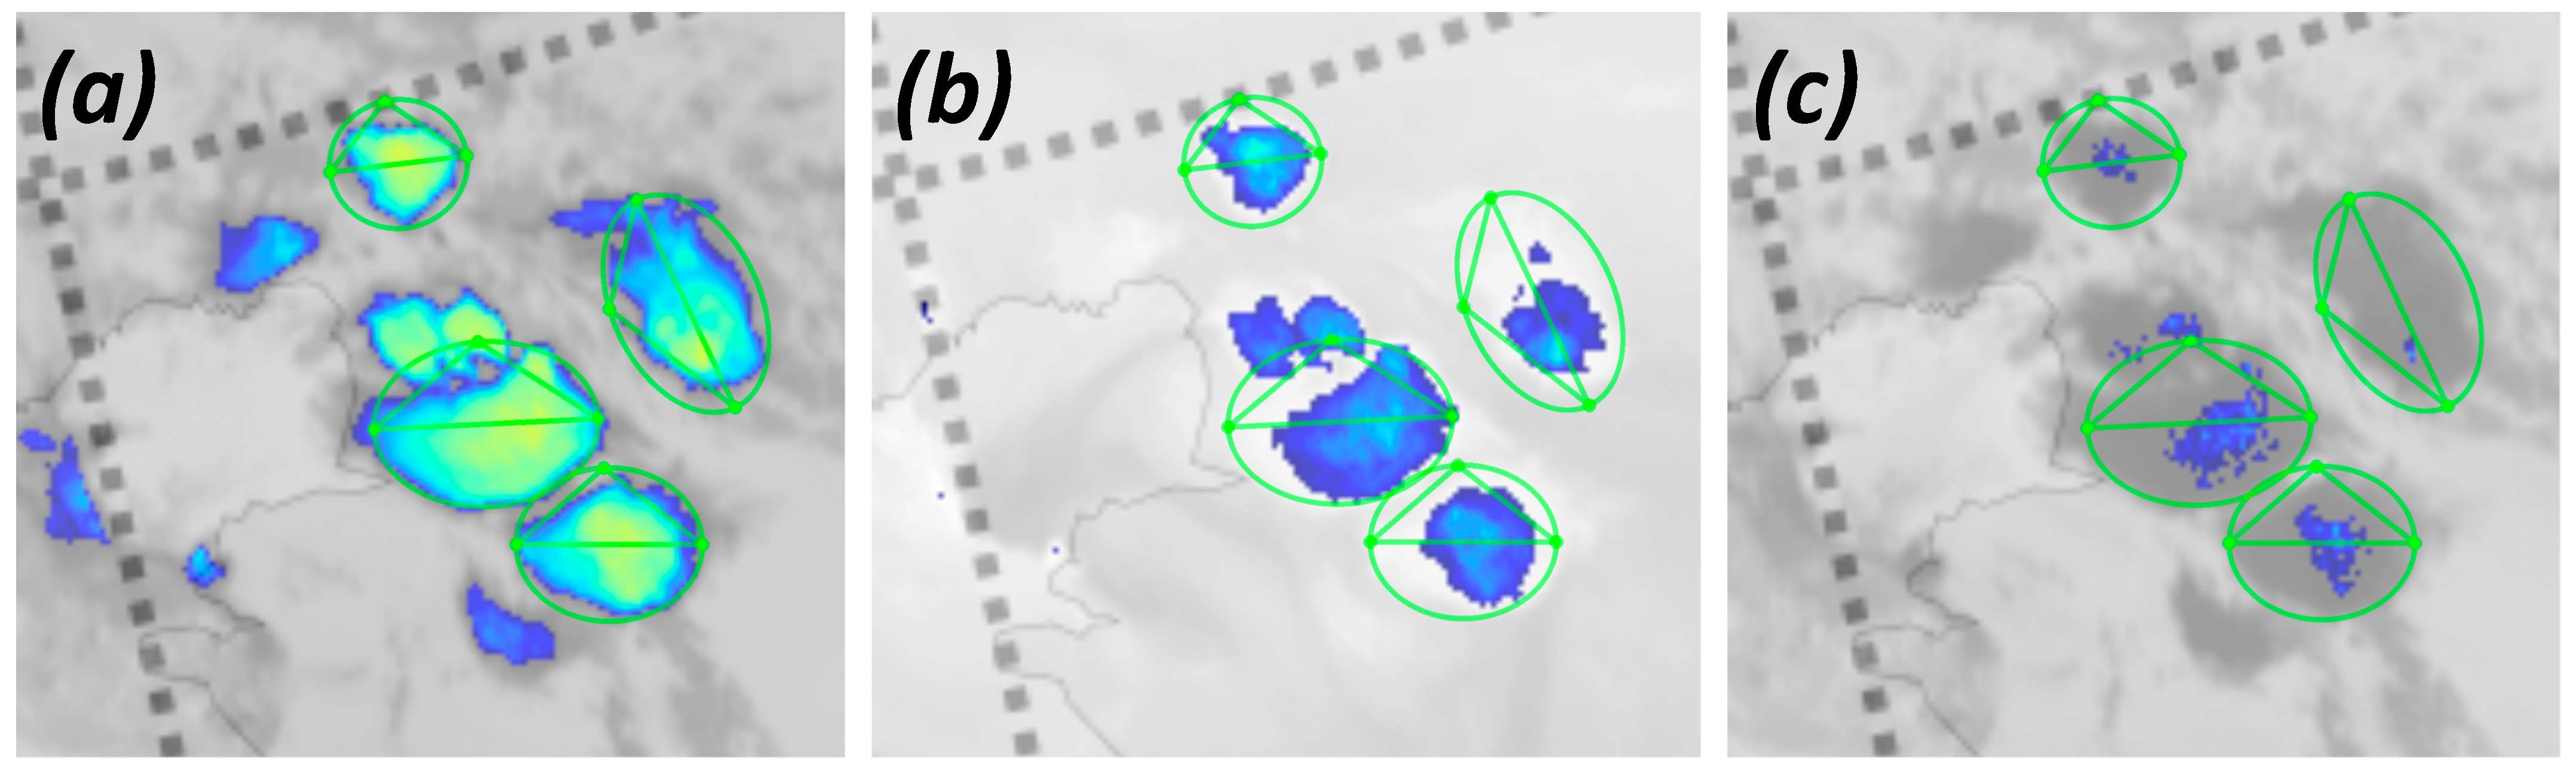
2.2. Visual Identification and Tracking of Mesoscale Convective Systems in Remote Sensing Data

When collecting the DaMesCoS-ETR, we exploited the GeoAnnotateAssisted tool presented in Section 2.3. It transforms the source remote sensing imagery fields c h 5 ,   c h 9 ,   B T D , as described further in Section 3.2.2, and presents it in the form of a conventional colorful image with auxiliary georeferencing information (not shown to an observer). It provides a toolkit for creating ellipse-shaped labels of MCS or other events, and for uniting them into tracks.
When labeling MCSs, an expert follows the established methodology of MCS identification. Classic definitions of MCSs and mesoscale convective complexes (MCC) of various types were proposed by Maddox in 1980 [14]: MCC has an area with cloud-top temperature T c t 32 C exceeding 100,000 km 2 ; the inside area with cloud-top temperature T c t 52 C should exceed 50,000 km 2 . These characteristics should persist for more than 6 hours. The ratio between the minor and major diameters of an MCC candidate should be greater than 0.7 .
However, some authors have proposed more relaxed MCC criteria. For example, in Morel and Senesi 2002 [17,18], the authors proposed using the gradient of the cloud-top temperature for MCC identification. Feidas and Cartalis (2001) [67] used the threshold values in some spectral bands. In recent years, the identification of MCS in satellite data has been based on the use of some typical features (also known as signatures or spatial patterns). There are three major signatures:
  • Overshooting tops (OTs), which is the strong updraft rising above the anvil of an MCS. OTs can be identified in visible and infrared spectral bands. The formation of OTs is related to strong updrafts, which often points to the presence of a mesocyclone in the MCS. OTs are typical signatures of supercell clouds. They indicate the zones with high probability of hazardous weather events. A statistically significant relationship of OTs with severe weather was recently shown [68,69,70];
  • The ring-shaped and U/V-shaped signatures (cold-U/V, cold ring), which are related to shielding of cold inside the area of the MCS cloud-top by the plume of relatively warm cloud particles. These particles are moved with high-speed updrafts from lower stratus clouds. Ring-shaped and U/V-shaped signatures are typically attributed to supercell clouds and can be used to detect them [24,68];
  • The plumes of cirrus clouds above the anvil, the formation of which is related to the ejection of cloud particles by intense updrafts over the central part of an MCS [71,72].
When searching for an MCS, our experts examine the records of severe weather events reported in broadcast news, printed and electronic news feeds, and weather reports. We examined the reports associated with strong winds, extreme rainfall, and other extreme weather events. An expert then examines Meteosat imagery relevant to the report in terms of date and time. The major focus of the expert in this process was on the region of the report; however, we also examined adjacent territories.
With the transformations of the Meteosat source data described in Section 3.2.2, the data from the SEVIRI instrument of Meteosat are presented in a way that a human expert can perceive comfortably. The fields of transformed features are presented to the expert one-by-one, and the expert may switch channel using the buttons in the GeoAnnotateAssisted app. We also adjusted the colormaps for each of the channels (namely, c h 5 n ,   c h 9 n and b ˜ , see Section 3.2.2). With these colormaps, the GeoAnnotateAssisted app. produces an image that visually represents one the channels. The areas of each image that typically correspond to MCS presence are colorful, with the brighter the color, the higher the radiobrightness temperature (for c h 5 and c h 9 channels). The rest of the images are “shaded” (presented in grayscale). The threshold values that are employed to shade the unnecessary areas are in accordance with the threshold-based MCS identification technique proposed by Maddox [14]: T t h , c h 5 = 50 C, T t h , c h 9 = 33 C. In the case of b ˜ , the colorful area corresponds to values exceeding a particular threshold value B T D 0 C; the brightness of the color corresponds to the height of the B T D . As we discuss further in Section 3.2.2, the scale of b ˜ , representing the B T D for visual examination and for our neural network is non-linear. The non-linearly rescaled b ˜ highlights colorful MCS-relevant areas more expressively in comparison to commonly used linear rescaling. In Figure 1, we demostrate the resulting representations of channels as they are shown in the GeoAnnotateAssisted app. In this figure, we also show examples of MCS labeled by our experts (shown by the green ellipses).

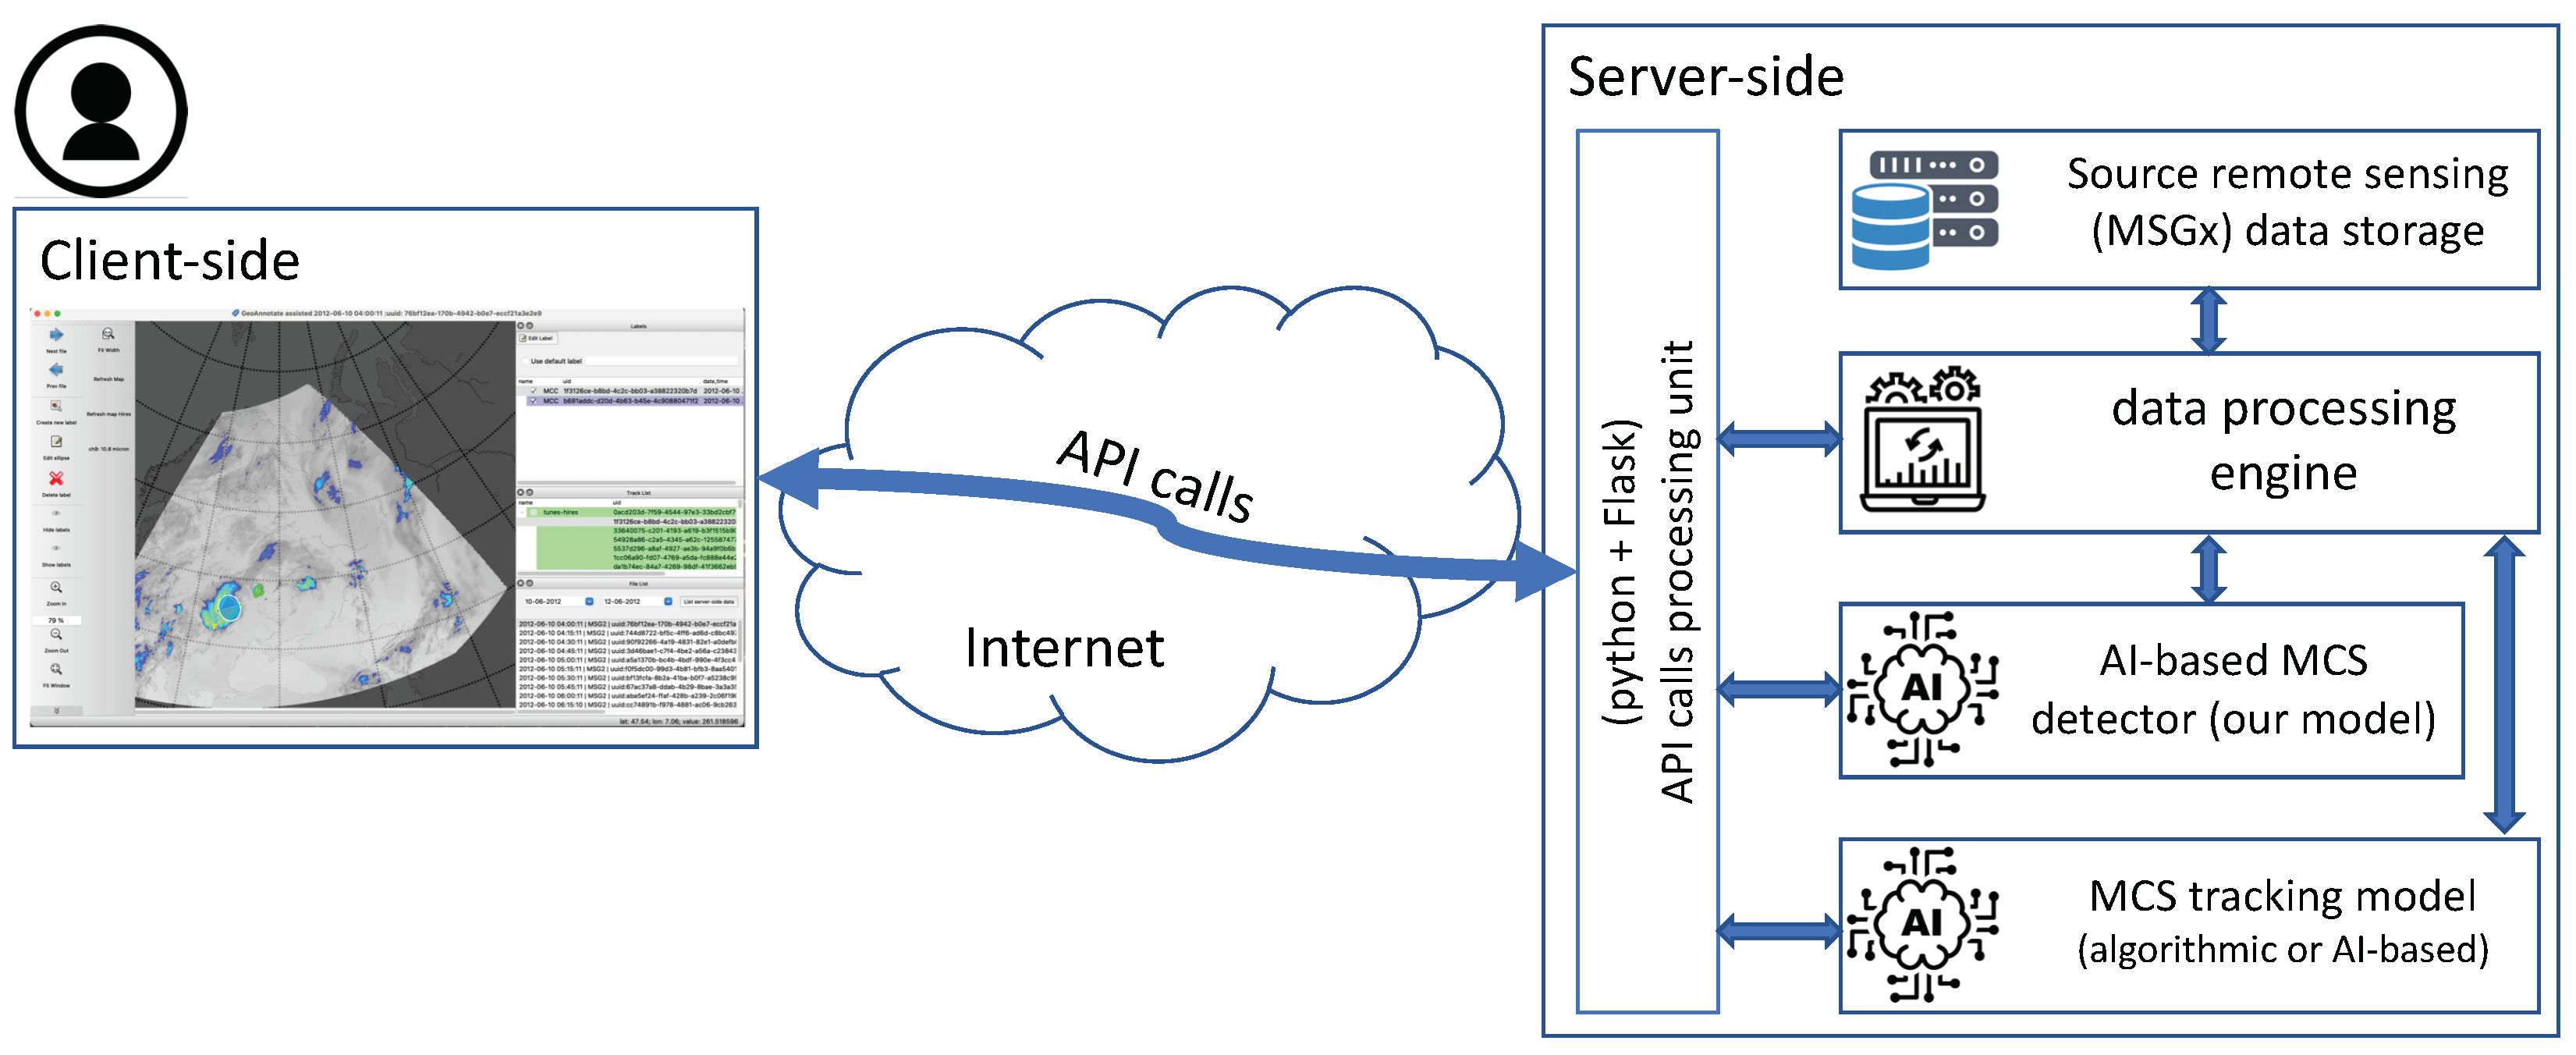
2.3. GeoAnnotateAssisted-Client-Server Annotation Tool for Remote Sensing Data

In this section, we describe the software package we developed for the labeling of MCSs in Meteosat data snapshots. We name it GeoAnnotateAssisted.
If there is a need to label spatial patterns in a two-dimensional field for training an artificial neural network (ANN), there are several problems to solve. First, the data should be represented in a human-readable way, in a form that would help an expert to recognize the events clearly. Second, an expert needs a clear and simple way of labeling an event in this representation. Then, the labels an expert creates should be translated into representation-agnostic event attributes, which are typically (but not necessarily) its geospatial coordinates, physical size, etc. These attributes should then be transformable into labels that are suitable for the application of an ANN model. Finally, when tracking lasting natural phenomena, one needs to connect the labels of an individual event in several consecutive data snapshots.
In order to be able to solve these problems, the software that is used for labeling should meet several requirements:
  • it should be easy enough to install on the annotator’s computer;
  • it should be lightweight in terms of the annotator’s computer computational load while preprocessing remote sensing data;
  • it should be capable of creating a human-readable representation of remote sensing data;
  • it should be fast enough in creating this representation;
  • the representation should be physics-related, e.g., demonstrating the anomalies of radio-brightness temperature in a certain band, which can be used to determine certain classes of identified phenomena;
  • the representation should be adjustable to some extent for an expert to have an opportunity of validating an event candidate taking several representations into account;
  • the labeling capabilities of the software should meet the requirements imposed by the specific requirements of the task, e.g., a capability for fancy shapes labeling should be implemented, and the labeling procedure should be fast enough (meaning one should not annotate an ellipse-shaped event using a free-form polygon since it is very time-consuming);
  • the labeling tool should provide a way to conveniently link the labels of individual events across multiple consecutive data snapshots.
There are a number of ready-to-use labeling software packages available. Some of them are free-to-use, others are provided for a fee. They also differ in their installation procedures: some of them are browser-based, others are implemented in a programming language and require installation. Some of the tools are capable of suggesting the labels generated with either classic computer vision techniques or pretrained deep learning tools. However, these pretrained neural networks are not expected to work well in the case of weather phenomena since they were trained on the datasets of visual objects.
The most notable labeling software are the following:
  • V7 [73] (https://www.v7labs.com/, accessed on 20 April 2023)—data labeling and management platform, which is paid or free of charge for educational open data; it is browser-based for an annotator; thus, the data is processed on the server-side. Automatic labels suggestion is implemented;
  • SuperAnnotate [74] (https://www.superannotate.com/, accessed on 20 April 2023)—a proprietary annotation tool; paid or free-of-charge for early-stage startups;
  • LabelMe [75] (https://github.com/wkentaro/labelme, accessed on 20 April 2023)—a classic graphical image annotation tool written in Python [76] with Qt for the visual interface. It was inspired by the LabelMe web-based annotation tool by MIT (http://labelme.csail.mit.edu/Release3.0/, accessed on 20 April 2023).
  • CVAT [77] (https://cvat.org/, accessed on 2 April 2023)—an image annotation tool which is implemented in Python [76] and web-serving languages. The tool may be deployed on a self-hosted server in a number of ways which makes it versatile. The tool is also deployed on the Web at https://cvat.org/ (accessed on 2 April 2023) for public use. There is also a successor to this tool presented at cvat.ai (https://cvat.ai/, accessed on 20 April 2023), which is capable of algorithmic assistance (automated interactive algorithms, like intelligent scissors, histogram equalization, etc.).
  • Labelimg [78] (https://github.com/tzutalin/labelImg, accessed on 20 April 2023)—an annotation tool implemented in Python with Qt, similar to LabelMe. It is designed to be deployed on a local annotator’s computer and requires a Python interpreter of a certain version.
  • ImgLab [79] (https://imglab.in/, accessed on 20 April 2023)—client-server annotation tool, the client side of which is platform-independent and runs directly in a browser. Thus, it has no specific prerequisites for an annotator’s computer. Its server-side is deployed on a server with some software-specific requirements, however.
  • ClimateContours [52]—to the best of our knowledge, is the only annotation tool adapted to the labeling of climate events, e.g., atmospheric rivers. It is essentially a variant of LabelMe by MIT (http://labelme.csail.mit.edu/Release3.0/, accessed on 20 April 2023); thus, in Table 2, we do not list it explicitly. At the moment, the web-deployed instance of ClimateContours (http://labelmegold.services.nersc.gov/climatecontours_gold/tool.html, accessed on 21 March 2021) is unavailable.
All of the annotation tools are characterized by their own advantages and flaws. Almost all the tools were developed for annotating images, and most of the efforts of their developers were focused on making the labeling faster and easier. However, none of them were designed to annotate geophysical phenomena specifically; thus, none of them meets all the requirements we listed above, due to the specifics of the task of labeling geophysical events in remote sensing data or other geospatially distributed fields. In Table 2, we provide a brief review of the annotation tools we listed above, highlighting the requirements of our MCS annotation task. In this table, we also present our annotation tool GeoAnnotateAssisted, which we describe further in Section 2.3.
While most of the publicly available annotation tools, including the ones enlisted in Table 2, are suitable for labeling ordinary images, they are not suited for labeling MCS in geospatial data, like remote sensing imagery, due to the absence of some of the must-have features we listed above. Therefore, we developed our own labeling tool, namely, “GeoAnnotateAssisted”. Satellite imagery preprocessing is a computationally expensive task. Once we developed the previous version of the tool, namely, “GeoAnnotate”, we faced the issue of data preprocessing taking several minutes in the case of a computer station not being powerful enough. Thus, we split the app into client and server parts. These two apps are implemented using the Python programming language [76] with Qt [81] as the backend for the graphical user interface of the client-side app. The server-side is implemented using the Flask [82] library for web applications.
In Figure 2, we present the high-level architecture of our client-server annotation tool GeoAnnotateAssisted. It is capable of processing remote sensing data at the server-side and creating its visual representations. The representations are generated for various channels, including band-6, band-9 and BTD. The data representation task is adjustable; thus, an expert may create their own colormaps and data preprocessing pipelines for labeling new phenomena. In our study, for each channel, we created a unique colomap that highlights visually the features characterizing MCSs. The server-side app is equipped with optional capabilities as follows:
  • the capability of suggesting the candidate-labels in new data snapshots. For this to happen, we employ the neural network we present in this study (see Section 3.1), operating on the server-side. The suggested labels are passed to the client-side app using JSON-based API so that an expert may examine them and either decline or accept and adjust their locations and forms. Here, JSON stands for JavaScript Object Notation [83], which is a unified text-based representation of objects to be passed between various programs, and API stands for application programming interface, which is a way to organize the communication between applications.
  • the capability of suggesting the linking between the labels in consecutive data snapshots, using either a human-designed algorithm or an artificial neural network (e.g., the one we present in [80]).
One may launch the server-side app with both of these features switched on or off.
The client-side app of GeoAnnotateAssisted is free of the computations required for data projection since the projection and the interpolation are performed at the server-side. Thus, the client-side computational load is low. In GeoAnnotateAssisted, we also implemented the label shapes that are not common for most of the visual annotation tasks—it is capable of labeling the phenomena of elliptic and rounded shapes.
GeoAnnotateAssisted provides features for both labeling (identifying) atmospheric events in remote sensing imagery and tracking them. The data describing individual labels and tracks is recorded in the SQLite database the moment the label is created or corrected or track attribution is set. The database is placed on the data storage of the expert performing labeling. The schema of the database is presented in Figure 3. This schema is the same that DaMesCoS-ETR is distributed with since DaMesCoS-ETR is essentially the database of labels and tracking data collected by our experts. We plan to extend the dataset with labels and tracking data in the eastern territories of Russia.

2.4. Collecting the Dataset of Mesoscale Convective Systems over the European Territory of Russia (DaMesCoS-ETR) Using the GeoAnnotateAssisted Labeling Tool

The core approach of our study is supervised machine learning, which is characterized by the need for labeled training data. Labeling is a process of creating the set of tuples of data instances with corresponding target labels. In the problem of MCS identification, data instances are remote sensing imagery, and labels are the tuples of values characterizing the position, size and form of MCSs in remote sensing data. MCSs are characterized by symmetric shapes which may be approximated by ellipses. Thus, in our study and in our Dataset of Mesoscale Convective Systems (DaMesCoS), we label the MCS instances as ellipses.
For collecting our Dataset of Mesoscale Convective Systems European over the Territory of Russia (DaMesCoS-ETR), our experts were employed in MCS labeling and tracking. We exploited the bands presented in Section 2.1 with linear (for c h 5 ,   c h 9 ) and non-linear (for B T D ) re-scaling, resulting in features c h 5 n , c h 9 n and b ˜ (see visualization in Figure 1 and the transformation description in Section 3.2.2). The diagnostics of the contours of anomalous blobs in these images allows one to detect an MCS, assess its stage within its lifecycle as a convective storm, and also estimate its potential power [24,66].
There is also a classification of MCSs with the classes characterized by the spatial shape (also known as signatures) of the cloud-top’s radio-brightness temperature anomalies representing the convective storms. A signature is a certain spatial distribution of the low anomalies of radio-brightness temperature visible in the 10.8 μ m channel in MSG imagery. In the case of convective storms, there are two known signatures: cold-U/V and cold-ring, according to the established classification [24,84]. These two signatures are purportedly related to the features of convective flows in the regions close to a convective cloud anvil. These two signatures are frequently detected for mature storms related to dangerous events [24,84,85,86,87]. Thus, we used these signatures as indicators of potentially severe storms when identifying MCSs in our study.
To reduce the time consumption of MCS labeling, we used records of local meteorological stations, experts, and also messages in various local news channels, both electronic and paper ones. These records contain messages about severe storms accompanied by strong winds, fallen woods and, in some case, damaged infrastructure. Using these records, we located the dates, times and geographical positions of possible MCS occurrences which we then checked in the satellite imagery. We also inspected spatially adjacent regions and closely related time frames since an MCS occurrence indicates favourable atmospheric instability and convection intensity conditions.
With an MCS located, we placed an elliptic shape label enclosing it. Then we would trace the event back in time through the previous satellite imagery snapshots until its generation, and also through the subsequent snapshots until dissipation. Sometimes an MCS would split into two or more other MCSs. In this case, for each of the newly occurring phenomena, we would start a new track; we would continue the track for the one MCS in this group that looked like inheriting the trajectory of the initial one. Alternatively, two MCSs may merge. In this case, we would terminate one of the tracks and continue the second. To continue the track, we would choose the MCS that was more developed before the merge.
Following the procedure described above, we collected 205 tracks consisting of 3785 MCS labels in total. In Table 3, we present a summary of the DaMesCoS-ETR. We also present the basic MCS lifecycle distributions based on DaMesCoS-ETR in Figure 4. For the sake of clarity, we do not display the moments of the distributions in the figure since they are displayed in logarithmic scale. Instead, we present them in Table 3.
The DaMesCoS-ETR dataset is available on the GitHub repository (https://github.com/MKrinitskiy/DaMesCoS, accessed on 20 April 2023).

3. Methods

In this study, we exploited a deep convolutional neural network we designed based on RetinaNet [63]. RetinaNet is a deep convolutional neural network proposed in 2018 to perform the task of visual object detection (VOD). In artificial neural networks performing the VOD task, there are two approaches: one-stage detection [63,94,95,96,97,98,99] and two-stage detection [100,101,102]. In two-stage detectors, the first stage of proposing regions dramatically narrows down the number of candidate object locations. At the second stage, which is the classification and location adjustment step, complicated heuristics are applied in order to preserve a manageable ratio between foreground and background examples. In contrast, one-stage detectors process a vast amount of object proposals sampled regularly across an image. Within this approach, one needs to tackle the problems of background–foreground imbalance, and also tuning the network hyperparameters in order to make it meet the foreground–background ratio. It was demonstrated that one-stage detectors may deliver accuracy similar to that demonstrated by two-stage detectors [103]. At the same time, RetinaNet [63] provides the opportunity for the optimization of foreground-focusing capability, which is crucial in the case of strong foreground–background imbalance. This kind of imbalance is not very strong in the case of real-life photographic imagery similar to the ones presented in the MS COCO dataset [56], the KITTI multi-modal sensory dataset [104], the PASCAL VOC dataset [59], etc. It is often significant, however, in datasets originating from geophysics [41] and Earth sciences. MCSs may be considered statistical outliers, rare events [105]. They are mesoscale; thus, they are also characterized by a small footprint compared to synoptic-scale events, like cyclones. Thus, one may consider MCS labels in remote sensing imagery having a strong foreground–background imbalance favouring the background (the area where no MCSs are observed) over the foreground (the area occupied by MCSs).

3.1. RetinaNet Neural Network for the Identification of Mesoscale Convective Systems

The problem of foreground–background imbalance is specifically addressed in RetinaNet [63] through dynamic scaling of commonly exploited cross-entropy (CE hereafter), where the scaling factor decays to zero as confidence p t in the correct class increases. In the original paper [63], this re-scaled loss is named focal loss (FL hereafter). In particular, one may write down the FL in the following way:
p t = 1 if y k = 1 , 1 p k if y k = 0 ,
L F L p t = α t 1 p t γ log p t ,
where p t —probability of the correct class for a rectangular bounding box (i.e., one of the object proposals); p k —probability of class k ( k { 1 K } ) for this bounding box; K is the number of classes; y k is the true label (either one or zero) for class k on this bounding box; α t is the balancing coefficient proposed in the original paper [63]; and γ is the focusing parameter. In the original paper, the default values are proposed to be set to the following: α t = 0.25 , γ = 2 . Here, one may note, the closer γ is to zero, the closer FL is to conventional CE. The intuition behind the FL is the following: during training regarding the classification sub-task, FL “encourages” the network to pay more attention to hard examples that are classified with less certainty p t . The contribution to the loss function of easily classified examples with p t close to 1 is downweighted through this dynamic scaling expressed in the α t 1 p t γ coefficient. In Figure 5 (from the original paper Lin et al. 2018 [63]), we demonstrate this feature of FL: compared to conventional CE ( γ = 0 ), FL underweights well-classified objects compared to hard examples (the ones with low values of p t ).
The capability of FL to focus a network on under-represented objects is controlled by γ and α t hyperparameters. Thus, one may optimize these hyperparameters based on a scalar quality measure (mean average precision or mAP in the original paper), which is hard to fulfill through heuristics that are characteristic for two-staged detectors. This capability of targeted hyperparameter tuning of RetinaNet equipped with FL determined our choice in relation to the problem of MCS detection.
The main problem of this study is to infer MCS positions and sizes, i.e., bounding boxes of MCS (bboxes hereafter) for each time moment, meaning in each source data snapshot (see examples in Figure 13 shown by yellow rectangles). Thus, in terms of the VOD task, we consider one-class object detection, where the class is MCS. Thus, p t in our study is an output of the network modeling a Bernoulli-distributed variable that is commonly interpreted as an estimate of the probability of an object, enclosed with a detected bbox, to have class “1”, i.e., to be an MCS.
The fundamental approach of RetinaNet is the following: (a) an independent generator regularly places object proposals, varying in size and aspect ratio, that are rectangular bboxes densely covering an image; (b) the network itself processes an image with respect to this vast amount of generated bboxes, performing two tasks:
  • a classification task for each bbox proposal, meaning estimating the probability p ^ of the bbox to enclose an MCS, and
  • a regression task, meaning adjusting the position and the size of the bbox.
The network is constructed of four parts, (a) a feature extractor subnet (see Figure 6a); (b) a feature pyramid subnet (see Figure 6b); (c) a subnet performing the classification task for bbox proposals (see Figure 6c) and (d) a subnet performing the regression task for bbox proposals (see Figure 6d).
It is a common practice in detectors based on convolutional neural networks to exploit the transfer learning technique (TL) [106] using a backbone sub-network trained in advance on a large dataset like ImageNet [58]. In deep learning methods, TL addresses the lack of labeled data. In our study, ResNet-152 [45] was employed as a backbone network (see backbone subnet in Figure 6a).

3.2. Data Preprocessing

3.2.1. Transfer Learning

Transfer learning (TL) [107,108,109,110] is the basic approach in deep learning to solve the problem of insufficient training data. In Earth sciences and in geophysics, in particular, there is a common issue of a vast amount of unlabeled data describing natural processes with a small annotated subset. Thus, TL may be helpful in problems similar to MCS detection, and in other Earth science problems. When using TL, one tries to transfer the knowledge about the distribution of data in a hidden representation space from the source domain to the target domain. The process of knowledge transfer may be expressed in terms of the definition from Tan et al. [109]: given a learning task T t based on dataset D t , one can get help from dataset D s for the learning task T s ; transfer learning aims to improve the performance of the predictive function f T · for learning task T t by discovering and transferring latent knowledge from D s and T s , where D s D t and/or T s T t ; in addition, typically, the size of D s is much larger compared to the size of D t : N s > > N t .
In our study, the source domain D s is the ImageNet dataset [58], and the source task T s is the ImageNet 1000-class classification problem; the target domain D t is Metesat remote sensing imagery, and the target task T t is the MCS identification problem.
In order to clarify the transfer learning approach, we show a symbolic scheme in Figure 7 (from Pan and Yang 2010 [110]), where the difference between conventional machine learning and machine learning involving transfer learning is presented. Within the traditional ML approach (Figure 7, left), hidden representations and predictive skills are learned by neural networks (namely, “learning systems”) independently from the datasets specific to their own tasks. Datasets are presented in Figure 7 as rounded shapes with markers of different types symbolizing data points of different origin. In contrast, within the approach of transfer learning (Figure 7, right), a learning system extracts generalizable knowledge (hidden representations mostly) from source datasets learning to perform source tasks; then, some of the extracted knowledge may be helpful when the system is learning to perform a target task. Within the TL approach, one relaxes the hypothesis of independent and identically distributed data of the domains D s and D t . With this requirement relaxed, one does not need to train the network in the target domain D t from scratch, which may significantly reduce the demand for training data and computational resources for training. Following the classification given in Tan et al. 2018 [109] and the methodology presented in RetinaNet paper [63], the network-based TL technique is exploited in RetinaNet with ResNet employed as a reusable part of the architecture. In particular, ResNet-152 [45] is employed in our study as the backbone (see Figure 6a).

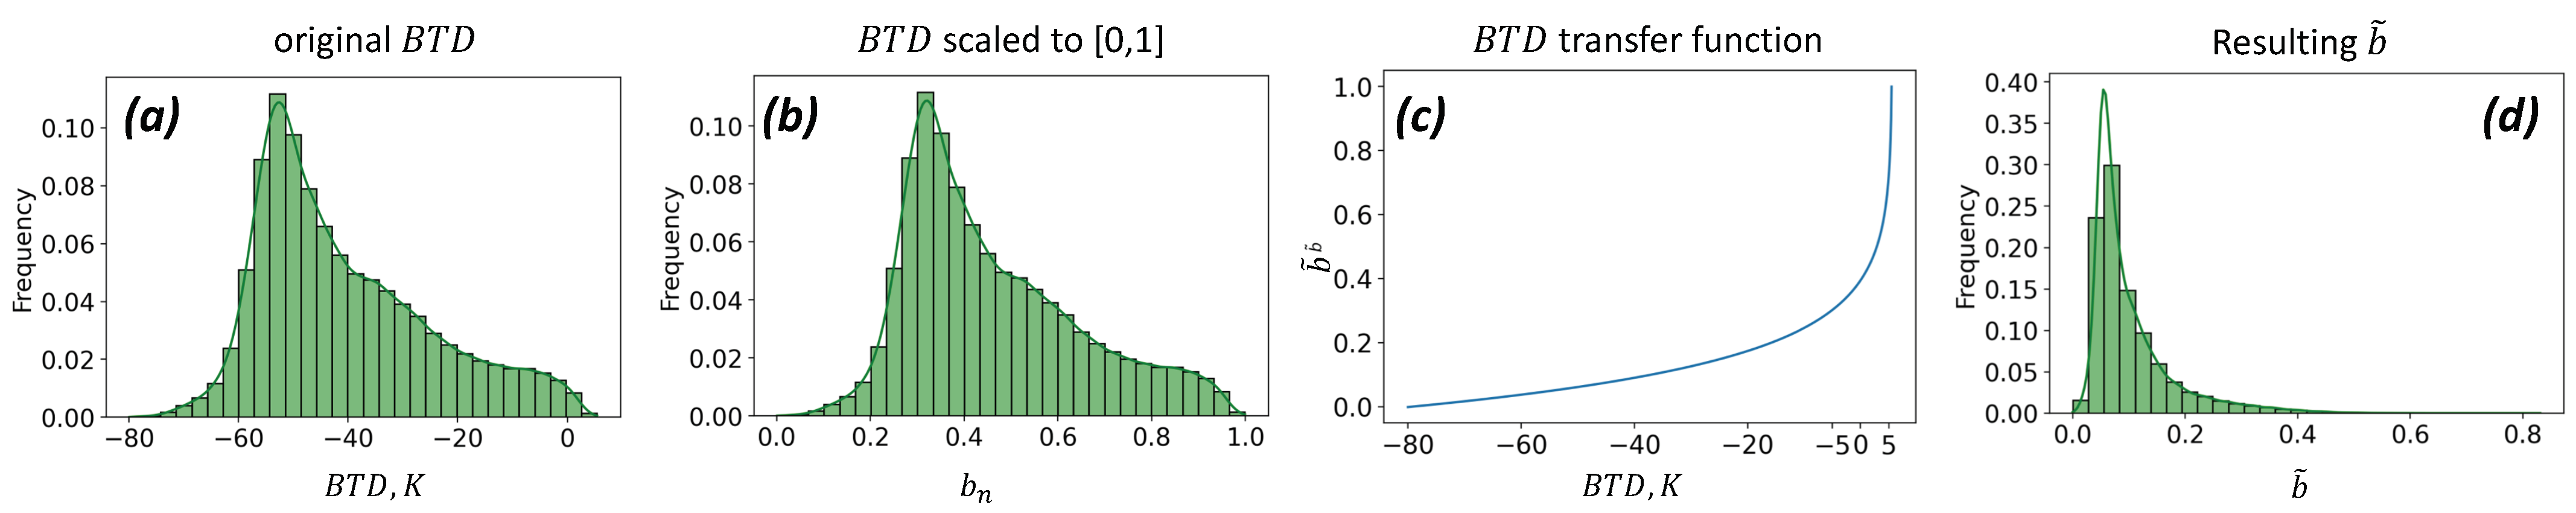
3.2.2. Domain Adaptation through Linear and Non-Linear Scaling

It was demonstrated in recent studies that the degree of similarity between the source and target domains D s ,   D t plays a crucial role in target task performance [111] when one exploits the transfer learning technique. Thus, when one needs to exploit the pretrained ResNet-152 network as a feature extractor (also known as a “backbone” in some studies [63]), there is the need for harmonizing the dataset of the target domain with the dataset the backbone was pretrained on (ImageNet in the case of our study).
The snapshots of Meteosat remote sensing imagery may be projected to a plane; thus, it may be presented on a regular grid, which indicates some similarity with conventional digital images of ImageNet. At the same time, one may assume a strong covariate shift between projected satellite imagery and ImageNet images due to fundamentally different origins of the data. When one needs to harmonize the target domain dataset with the source domain dataset, one may employ domain adaptation (DA) techniques [112,113]. Within the DA approach, one seeks for the transformation of target domain data that brings their distribution close to the source domain, meaning not only the distributions of the features themselves, but also the distributions of representations in a hidden representation space. There are a number of DA techniques in computer vision tasks involving CNNs [112,113]. One of the fastest is feature-based adaptation [112]. In feature-based DA, the goal is to map the target data distribution to the source data distribution using either a human-designed or a trainable transformation. In our study, we exploited expert-designed transformation of remote sensing data constructed in a way that, to some extent, delivers imagery similar to the optical images of ImageNet. In order to design this transformation, we first normalize the source data according to Equation (3):
X n o r m = 1 + X m i n X X m a x X m i n ,
where X is the substitute for c h 5 and c h 9 ; X m i n and X m a x are shown in Table 4. As a result, we acquire scaled (also known as normalized) features corresponding to the original ones: c h 5 n , c h 9 n . One may note that the values of the scaled features are inverted with respect to the original ones. This was performed due to the need of a labeling expert to focus on the negative temperatures of the cloud-top—the stronger, the lower its temperature. Thus, in order to highlight the colder pixels, we inverted the scales of c h 5 and c h 9 while normalizing them.
We scaled the brightness temperature difference B T D in a different way. We normalized it in a manner similar to c h 5 and c h 9 except for inverting the scale:
b n = X X m i n X m a x X m i n ,
where X is the substitute for B T D ; X m i n and X m a x are shown in Table 4.
With the normalization procedure described above, 99% of the values of the normalized source data were in the range 0 , 1 . All the values outside this range were masked and, thus, did not contribute to the loss function of our detection model.
When performing exploratory data analysis for MCS labeling, we found that an expert needs to focus on the range of B T D between 0 and 5 . We also found that the B T D distribution is mainly concentrated in the region of negative values from 60 to 10 (see Figure 8a). In order to (a) harmonize the distribution of transformed B T D with a typical color channel of digital imagery characteristic for ImageNet, and yet (b) preserve the semantics of the most needed range of B T D data, we re-scaled the b n data non-linearly in the following way:
b ˜ = 1 log max ϵ 2 , 1 b n + ϵ 1 log ϵ 1 log ϵ 1 ,
where b n are B T D data normalized as expressed in Equation (4), b ˜ are B T D data re-scaled non-linearly, and ϵ 1 , ϵ 2 are small constants employed for computational stability; typically, we set ϵ 1 = 10 3 , ϵ 2 = 10 6 . In Figure 8, we present the original B T D distribution, its normalized distribution acquired as a result of transformation in Equation (3), the transfer function presented in Equation (5), and the empirical distribution of b ˜ , which is the non-linearly re-scaled B T D . The effect of the non-linear re-scaling we applied is the following: instead of highlighting the pixels characterized by the most frequently observed B T D , we suppress their brightness in the channel of b ˜ , and yet we extend the variability of the b ˜ values for the pixels that an observer needs to focus on the most. In this way, the labeling expert would be able to distinguish more color tones with higher contrast in the regions relevant to MCS formation and life cycle.
As a result of normalization and non-linear re-scaling (only for B T D ), we constructed the features that one may consider being close to the red, green and blue channels of ImageNet digital imagery, given the digital images being routinely preprocessed through features scaling with the coefficient 1 / 255 . In Figure 9, we demonstrate the empirical distributions of the three resulting data features we use in our study: c h 9 n , b ˜ and c h 5 n . One may consider them analogs of the color channels R,G,B in conventional digital optical imagery.

3.3. Training and Evaluation Procedure

3.3.1. Quality Measures

In our study, MCS identification is presented as being similar to a visual object detection (VOD) problem. That is, given a vector field (considering c h 9 n , b ˜ and c h 5 n as vector components in each pixel) distributed on a regular spatial grid, one needs to identify and classify the spatial patterns in this field that represent the objects of interest (MCS in our study). The patterns are characterized by their locations and sizes; thus, typically, the goal of the VOD task is to create rectangular labels that enclose the individual objects of interest.
A typical quality measure for the identification of one object is Intersection over Union ( I o U ) [114], which is equivalent to the pixel-wise Jaccard score (see Equation (6)).
I o U M d , M t = M d M t M d M t ,
where M t is the set of pixels that are labeled as MCS (ground truth labels); M d is the set of pixels that are detected by an algorithm as MCS (detected labels); and M is the cardinality of a set M, which is the area (the number of pixels) in the case of VOD in digital imagery or in remote sensing imagery. IoU is commonly used in VOD tasks for the determination of whether a detected label is a true positive (TP hereafter) or false positive (FP hereafter). For this to happen, one needs to (a) employ a threshold value t p to classify a label candidate as a detected label (see Equation (7)), and (b) employ a threshold value t i o u so a detected label may be classified as TP or FP (see Equation (8)).
L i = 1 if P i t p , 0 if P i < t p ,
where L i is the classification decision of whether a label candidate is a label of MCS based on the probability estimate p t inferred by the classification subnet of our neural network (see Figure 6c).
C i = T P if I o U t i o u , F P if I o U < t i o u ,
where C i is the TP/FP class for an i-th detected label. When there are multiple ground truth labels intersecting with the detected one, the I o U score is calculated following one of the alternatives:
  • computation by taking all ground truth labels into account, without considering the label-wise attribution of pixels to specific ground truth labels. This means that the I o U score is based on the overall overlap between the predicted and ground truth labels, rather than on the individual label assignments of each pixel;
  • computation of I o U separately for each particular ground truth label that has a non-zero intersection with the detected label. The I o U scores for each label are then averaged to obtain the final I o U score. This approach takes into account the contribution of each ground truth label.
In our study, we followed the second approach. I o U is the measure with minimum (worst) value I o U m i n = 0 and maximum (best) value I o U m a x = 1 .
In VOD tasks, there are no true negatives or false negatives since there are no negative labels for any class. Therefore, the performance of the detection algorithm can only be evaluated using precision and recall metrics expressed in the form presented in Equations (9) and (10)). Precision measures the accuracy of positive detections, and recall measures the proportion of actual positive instances that are correctly identified by our model.
P L d , L t = T P L d ,
R L d , L t = T P L t ,
where L d is the set of detected labels; L t is the set of ground truth labels; T P is assessed following the thresholding procedure described in Equation (8). P and R are the measures with minimum (worst) values P m i n = 0 , R m i n = 0 and maximum (best) values P m a x = 1 , R m a x = 1 .
There is a common quality measure for VOD tasks, which is the mean average precision [103,114]. The term “mean” here denotes averaging over classes; thus, it is irrelevant in our study due to one class only being considered. Thus, we exploited average precision (AP) as one more quality measure for our model. Average precision is the metric assessed based on the precision-vs-recall (PR) curve, which is acquired due to varying t p . AP is the area under the PR curve approximated using either n-points interpolation or employing all-points piecewise-continuous approximation (e.g., see Padilla et al. 2020 [114]). AP is the measure with minimum (worst) value AP m i n = 0 and maximum (best) value AP m a x = 1 .
During the hyperparameter optimization procedure, we optimized AP with respect to the parameters and procedure properties of the stochastic optimization algorithm (see Section 3.3.3), and t i o u value.

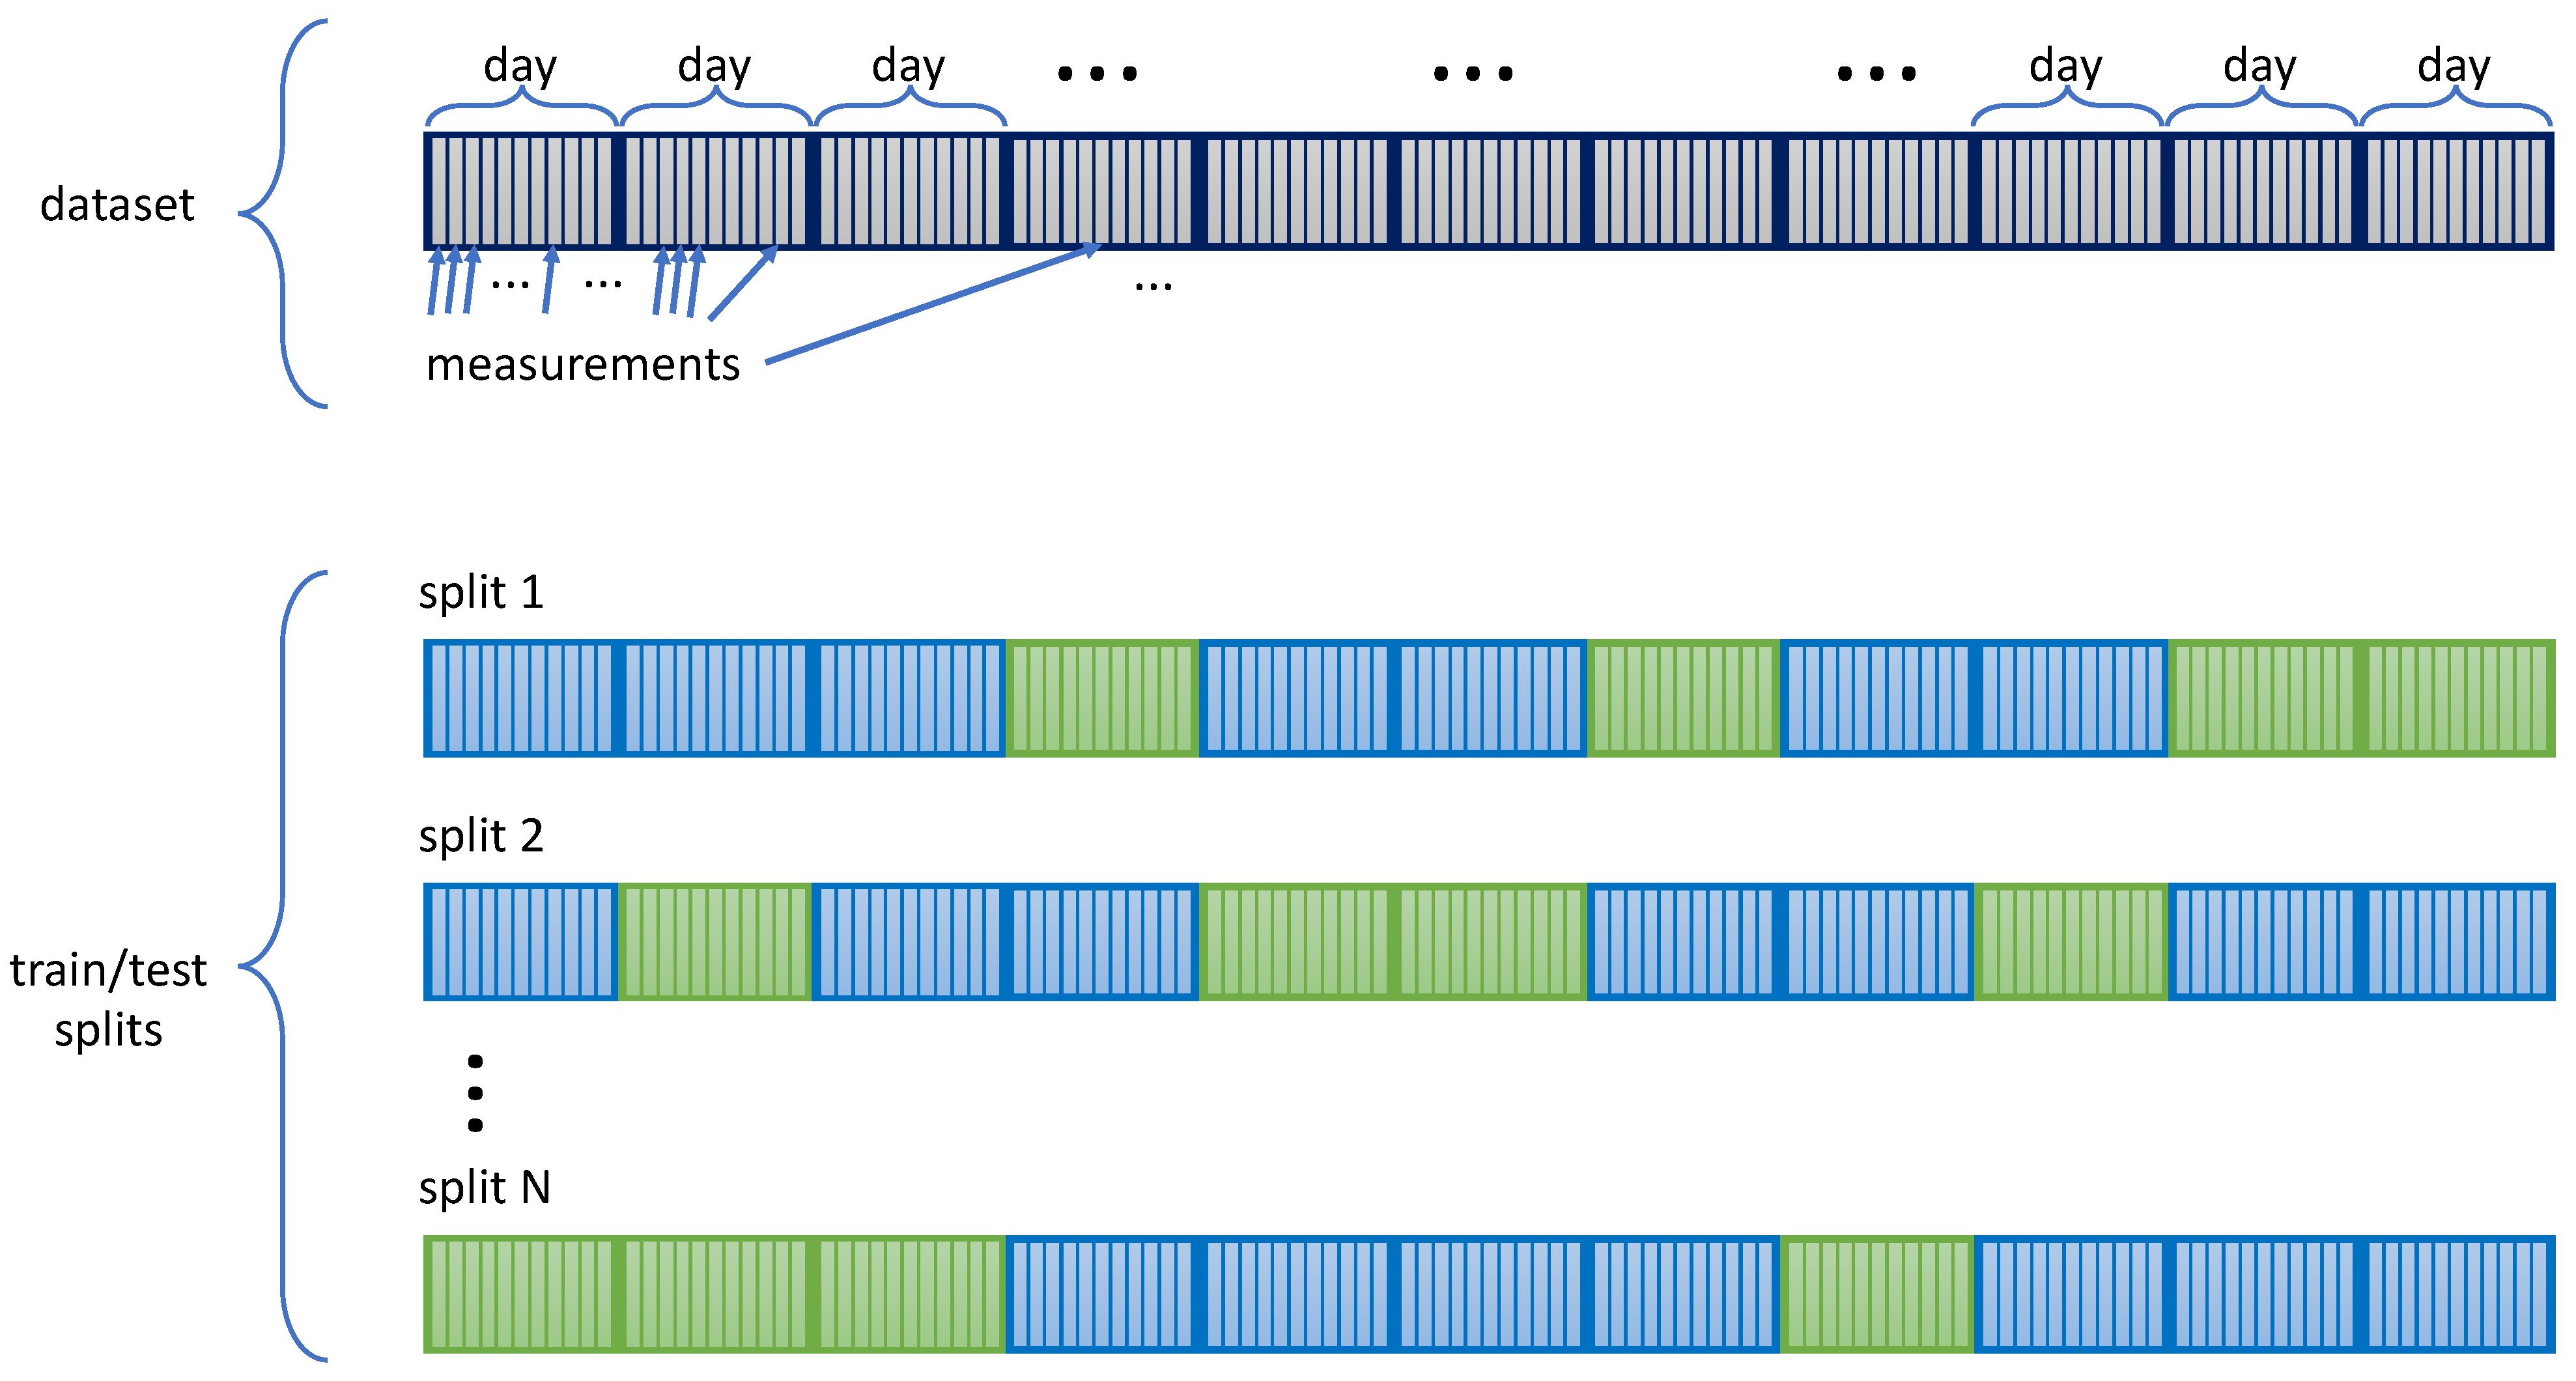
3.3.2. Reliable Quality Assessment

When analyzing physical processes generating an observational time series dataset, successive observations in the dataset may exhibit strong autocorrelation due to the smooth evolution of natural states. These natural states refer to the underlying physical phenomena that drive the observed features available in the form of remote sensing imagery in our study.
In machine learning, it is a common approach to evaluate a model through estimating quality metrics by testing a subset of data, this subset being acquired using random sampling from the original set of labeled examples. It is the correct approach where the examples are strictly independent yet identically distributed. In this case, quality assessment estimates with a testing subset are reliable.
At the same time, since successive images may be strongly correlated, they may be considered as the same observations with noise-like perturbations, i.e., one can not assume that they are independent. On the contrary, they should be considered strongly dependent. Thus, it is important to avoid systematically adding successive examples from a time-series dataset obtained through observing a natural process to training and testing sets. It was shown that one needs to apply particular methods of sampling for validating the models trained on time-series data [115,116,117,118]. In our study, we address the issue of strongly correlated successive examples using day-wise random sampling. We present the scheme for this day-wise sampling strategy in Figure 10. With this approach, there is still the possibility for consecutive examples to replenish different subsets; it is two orders of magnitude lower compared to pure random sampling given a 15 min period of remote sensing imagery acquisition.
Using the presented sampling strategy, we obtained seven different train-test splits. We trained our network on the training subset and evaluated the quality measures on the testing subset for each split. Then, we estimated the mean for each quality metric and assessed their uncertainty S m , where m denotes a metric. We assessed S m , assuming normal distributions for each metric. Thus, we calculated S m as a confidence interval with a 95% confidence level based on the sample estimate of the standard deviation computed using the sample of seven train-test splits.
Due to the high computational demand of the training procedure of artificial neural networks, we limited the validation of our model with one quality assessment train-validation split during hyperparameter optimization. That is, when optimizing the hyperparameters, we trained and validated the model once per hyperparameter set.

3.3.3. Training Procedure

Artificial neural networks are known to be sensitive to the details of the training procedure [119]. A training algorithm and the hyperparameter choice may either lower dramatically or improve significantly the resulting quality of the trained model. Currently, the most stable and commonly used training algorithm is Adam [120,121]. Adam is a first-order gradient-based optimization algorithm employing a momentum approach for estimating the lower-order moments of the loss function gradients. We exploit the Adam optimization procedure in our study.
The most important factors of optimization algorithms are the batch size and learning rate [119,122]. Due to the large size of remote sensing imagery, we could not vary the batch size significantly. In order to lower the noise in the gradient estimates, we set the largest batch size (batch_size = 8) that was technically available due to limitations of our computer hardware. Following common best practice, we optimized the learning rate schedule in order to acquire not only high quality AP, but also strong generalization skill. One may assess generalization through the gap between the quality estimated on the training and testing subsets. A small gap corresponds to good generalization, whereas a large gap means poor generalization.
Following best practice proposed in recent studies, we employed a special learning rate schedule which was presented in Loshchilov and Hutter, 2016 [123]. The authors proposed the use of a cyclical schedule of learning rate characterized by a cosine-shaped decrease over training epochs and several annealing simulations. There have been a number of modifications to this schedule presented in recent studies. We employ the configuration characterized by the following features:
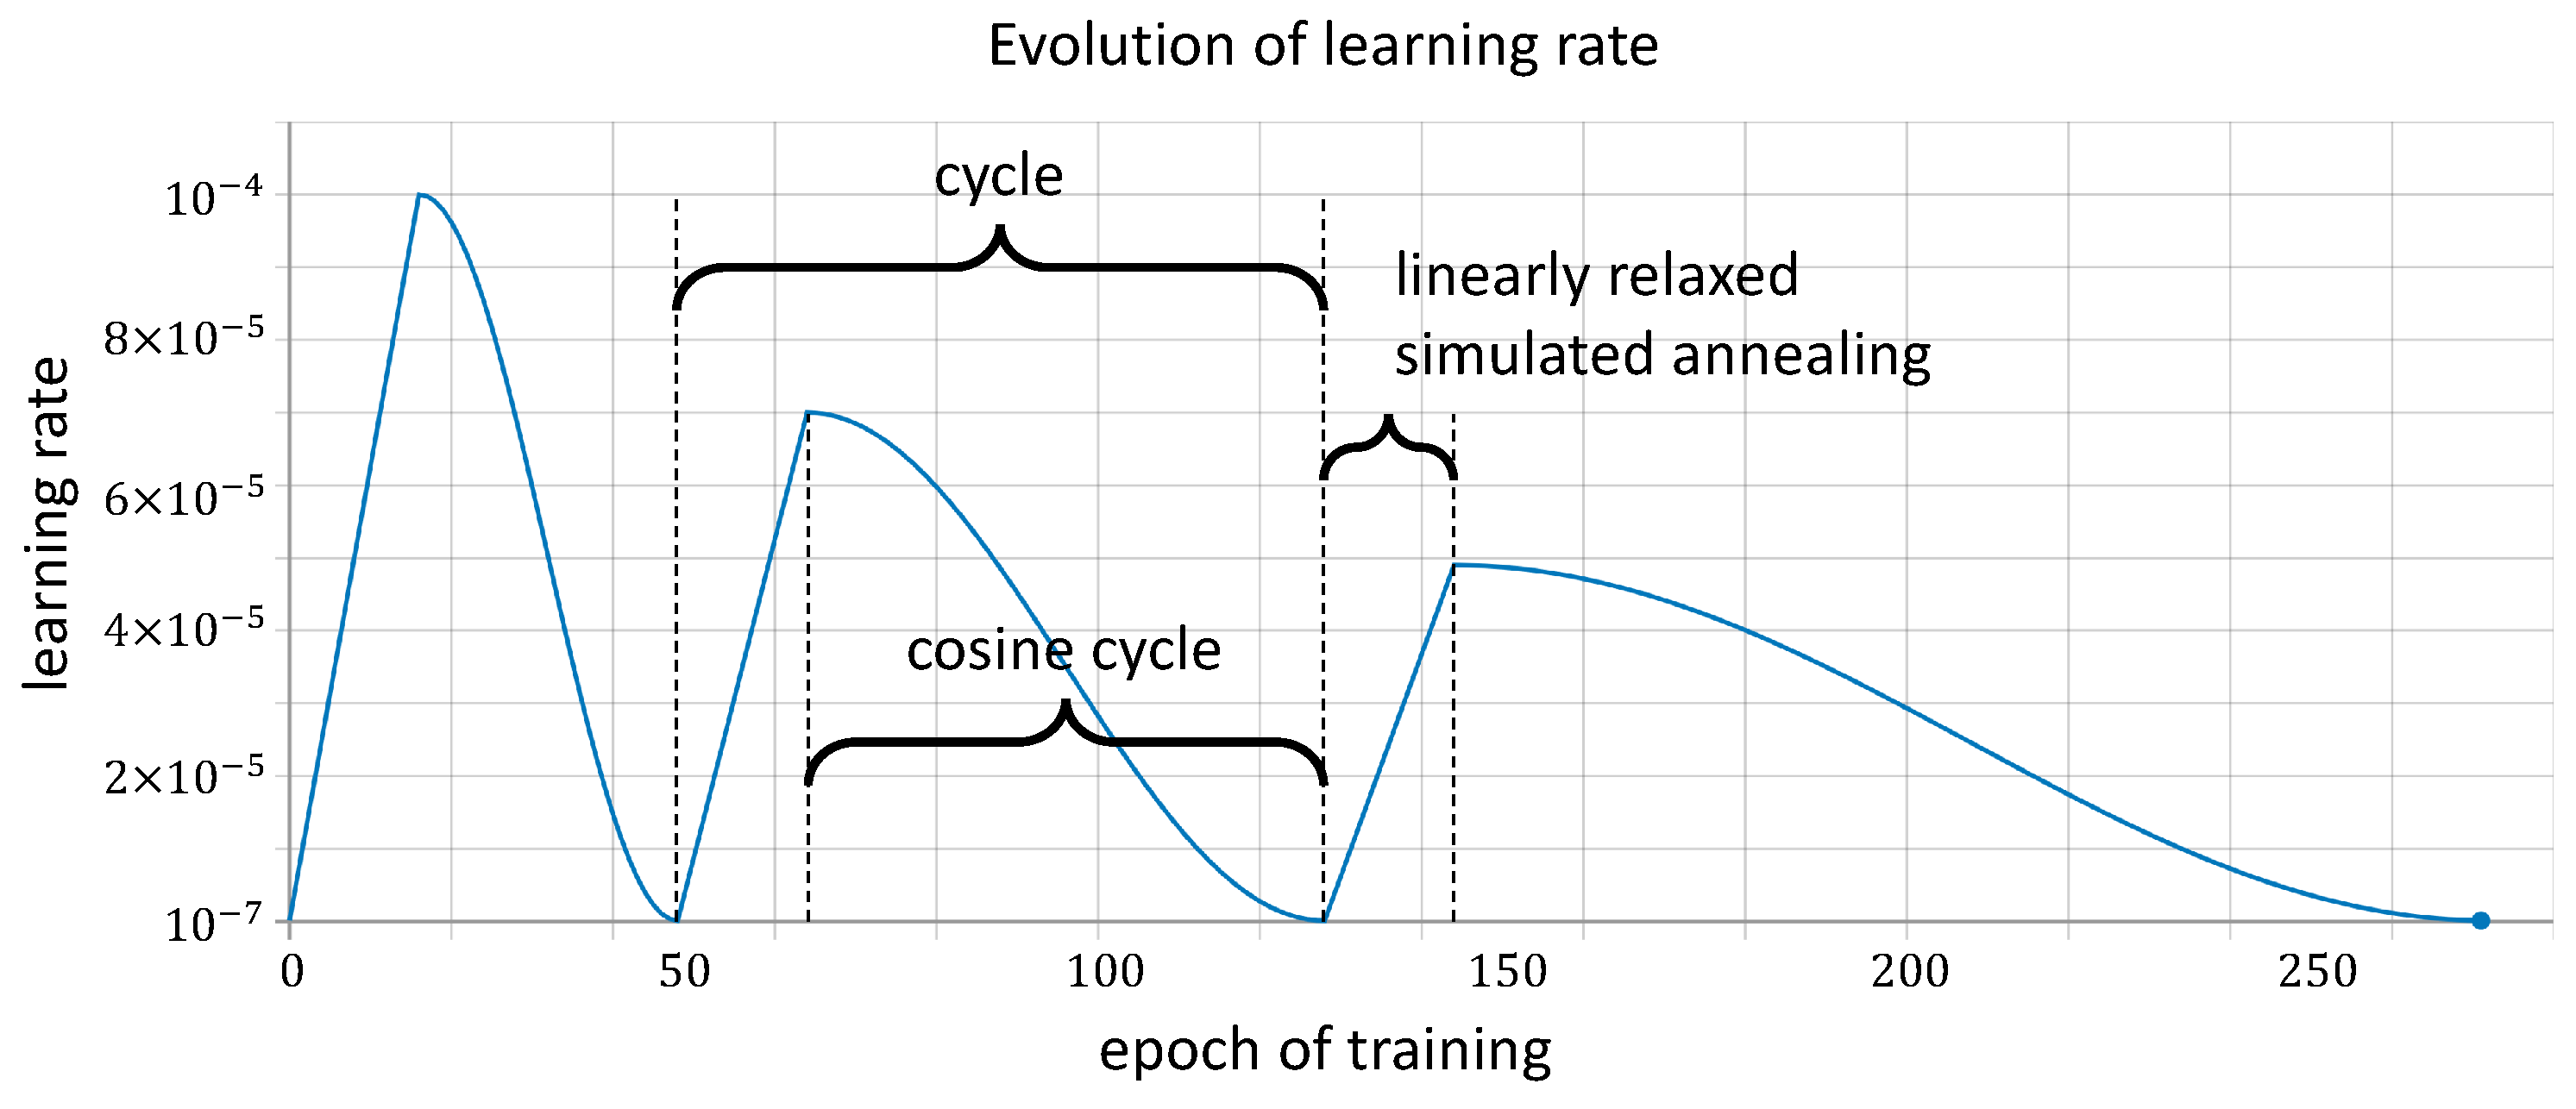
  • we apply an increase in the period of simulated annealing with each cosine cycle using the multiplicative form (see Equation (11));
    T i = T 0 k T ( i 1 ) ,
    where T 0 is the first period of simulated annealing, and T 0 = 32 in our study; k T is the multiplicative coefficient, and k T = 2 in our study; i is the cycle number starting from i = 1 .
  • we apply a linear increase in the learning rate prior to each cycle of cosine-shaped learning rate decay to mitigate the sudden changes in gradient moments that can occur within the Adam algorithm;
  • we also apply exponential decay of simulated annealing magnitude with each cosine cycle using the multiplicative form (see Equation (12));
    A s a , i = A s a , 0 k s a ( i 1 ) ,
    where A s a is the scale of simulated annealing compared to the initial learning rate; A s a , 0 is its first value, and A s a , 0 = 1 ; k s a is the multiplicative coefficient, and k s a = 0.7 in our study; i is the cycle number starting from i = 1 .
The resulting learning rate schedule optimized through hyperparameter optimization is presented in Figure 11.
As we mentioned in Section 3.2.1, we employed the convolutional subnet of ResNet-152 [45] pre-trained on the ImageNet [58] dataset as a convolutional feature extractor in our network constructed following the RetinaNet [63] scheme (see Figure 6). Since the classifier and the regressor subnets are randomly initialized in the beginning of training, their initial weights are certainly suboptimal, which means poor performance of the model and high values for the regression and classification losses. Thus, during the initial epochs of training, the gradients of composite loss function are high. In the case of convolutional backbone weights being trained at this stage, one may significantly change the feature representations learned by the convolutional layers, which can negatively impact the performance of the model. In order to preserve the feature extraction skill of the ResNet backbone, we employed a warm-up step [124,125,126,127] for 48 epochs. The warm-up step in transfer learning is a technique used to harmonize the newly added layers (i.e., classifier and regressor subnets) with the pretrained ResNet convolutional backbone. At this step, the weights of the convolutional layers are frozen (i.e., the optimization algorithm does not update them), and only the weights of the newly added layers are updated during training. The warm-up step helps to ensure that the new classifier and regressor layers are harmonized with the pretrained convolutional backbone, resulting in a more effective transfer learning process.
Due to the small amount of data, the generalization ability of overparameterized neural networks may be suboptimal. A summary of DaMesCoS-ETR presented in Table 3 demonstrates that the amount of labeled data is insufficient for deep convolutional neural networks of a complexity similar to RetinaNet. To alleviate this issue, one may employ data augmentation. In our study, we applied the following augmentations to the training examples during training: random flip in both directions; blurring with Gaussian kernel of random width sampled from the range [ 0 , 5 ] pixels; random rotation with angle sampled uniformly from the range [ 180 , 180 ] ; random shift (translation) with the translation magnitude sampled from the range [ 0.1 , 0.1 ] (measured in fractions of the image); and random shear in both directions with angles sampled independently from the range [ 15 , 15 ] . We also applied random coarse dropout, which is the technique of dropping a small amount of randomly scattered small rectangular regions from the augmented image. We also attempted to apply computationally demanding elastic deformations to the images. However, this approach significantly slowed down the training and did not lead to a substantial improvement in MesCoSNet quality.

4. Results

Following the procedure described in Section 2.2, we conducted visual identification and tracking of MCS using our GeoAnnotateAssisted tool (see Section 2.3), resulting in the Dataset of Mesoscale Convective Systems over the European Territory of Russia (DaMesCoS-ETR, see summary in Section 2.4). We then constructed our deep convolutional neural network MesCoSNet following the method presented in Section 3. Following the sampling procedure described in Section 3.3.2, we generated several (typically seven) splits of the source DaMesCoS-ETR dataset into training and testing subsets. Employing the optimization procedure described in Section 3.3.3, we trained and evaluated our MesCoSNet with each split. We present the resulting measures of quality and their uncertainties in Table 5.
One of the hyperparameters we optimized is the t p (see Section 3.3.1). It is optimized during evaluation, and it does not impact training of the neural network. By default, t p = 0.5 . However, this value may not deliver the best quality. In Figure 12, we present the plot of the I o U metric depending on t p and the plot of the AP metric depending on t p . The maximum of the mean I o U is achieved at t p 0.825 . The landscape of the AP metric is flat with respect to t p near this value; thus, one may use it without substantial degradation of AP.
In Figure 13, we present some examples of the application of MesCoSNet. As one can see, qualitatively, our MesCoSNet performs the MCS detection task in good accordance with the ground truth. For example, in Figure 13a, one may see an almost perfect match of the detected MCS with the ground truth. In Figure 13b, the location and form of the identified label is close to the ground truth. However, there are missed MCS instances.
As a demonstration of potential applications of MesCoSNet trained on DaMesCoS-ETR, we present here a map of the frequency (probability estimate) of MCS occurrence over the European territory of Russia. We applied our MesCoSNet to the full set of Meteosat SEVIRI data in summer (May to September) from 2014 to 2017. We identified all MCS using the hyperparameter value t p = 0.85 . We then calculated the frequency of MCS occurrence in each pixel of the map that is covered by Meteosat imagery. In Figure 14, we present the resulting frequency map. It is worth noting that we did not filter overlapping occurrences of MCSs that may be attributed to one track. Thus, the frequency of MCSs in this result is most probably overestimated. Additional research is needed to accurately assess the corrected frequency of MCS occurrences while considering the tracking attribution of identified labels.

5. Discussion

In this paper, we presented the results of our holistic research regarding the identification of mesoscale convective systems in satellite imagery over the European territory of Russia. We started by developing our own tool GeoAnnotateAssisted for labeling and tracking MCS in Meteosat remote sensing imagery. Then, we collected the DaMesCoS-ETR dataset of labeled and tracked MCS instances. We then constructed the MesCoSNet, a deep convolutional neural network based on the RetinaNet architecture. We then trained it on Meteosat SEVIRI images, along with labels from DaMesCoS-ETR. Finally, we demonstrated some potential applications of our approach for identifying MCS in satellite imagery.
The quality we reached in our study, does not exceed the typical quality measures of contemporary detection models in the case of visual object detection problems. Today, the mAP quality measure is typically close to mAP = 0.869 (reported for the SNIPER neural network [128] on the MS COCO dataset [56]) or mAP = 0.867 (reported for the ATSS neural network [129] on the MS COCO dataset [56]). Possible cases for this behavior may be:
  • a small amount of labeled data. In our study, we applied a number of approaches that may alleviate the negative impact of a small dataset: we applied data augmentation, and applied a transfer learning technique, along with domain adaptation of satellite imagery. However, there are more techniques that may deliver an increase in identification quality. One may pretrain the convolutional subnet on Meteosat SEVIRI data within a convolutional autoencoder approach; thus, the backbone would learn more informative features compared to the ones it learned from ImageNet;
  • a low signal-to-noise ratio in satellite imagery, which is obvious in the images in Figure 1 and Figure 13. Some of the data preprocessing techniques we applied during MesCoSNet training are meant to reduce the impact of noise in satellite bands, e.g., Gaussian blur. Here, one may improve the source data further by adding relevant features characterized by a high signal-to-noise ratio, e.g., CAPE (convective available potential energy) or CIN (convective inhibition).
In Section 2.4, we presented the way we used to search for MCS events while labeling the Meteosat imagery. In particular, our experts studied records of local meteorological stations, expert views, and also messages in various local news channels. The goal of these studies was to find the signs of severe weather events that may indicate the passage of an MCS. A bias may be introduced by this manner of searching for severe storms. In particular, with this searching and identification procedure, the collected sample of labels and tracks may be biased spatially towards populated territories. Also, a bias towards extremely strong MCS may be introduced into the DaMesCoS-ETR through the searching procedure due to the natural disposition of a person to focus on hazardous events that may cause economic damage and even loss of human life.
Recently, a number of studies were reported at conferences demonstrating the capabilities of deep learning methods for addressing the problem of identification of mesoscale atmospheric phenomena. Some of them indicate results characterized by high quality measures. In particular, one research group reported an approach exploiting a convolutional neural network constructed following the U-net [130] architecture; another group reported the use of a feedforward artificial neural network (also known as a fully connected neural network or multilayer perceptron). Both reports are characterized by a similar approach for evaluating the models, which is the use of pixel-wise quality measures. In this discussion, we argue that pixel-wise quality measures that do not account for strong class imbalance are not reliable in addressing the MCS identification problem. Indeed, MCS are extremely rare events (e.g., see Figure 14); thus, the pixel-wise class imbalance may be characterized by an approximately 1:200 pixel class ratio. If one insists on using pixel-wise quality assessment, it is strongly advised to employ quality measures that account for a strong class imbalance. One potential choice may be the F β -score, with β tuned accurately in accordance with researcher needs. In our study, we exploited object-wise quality metrics; thus, we did not suffer from inadequate metric formulation.
One may also observe that, in our study, we applied MesCoSNet closely following the architecture of RetinaNet. Within this approach, the labels are rectangular. In contrast, MCS labels are elliptic in DaMesCoS-ETR, which is in accordance with the methodology of visual MCS identification proposed in Maddox, 1980 [14]. Thus, one may test the approach of approximating the coordinates of three keypoints, defining the elliptic form of an MCS, instead of two tuples (i.e., location and size). Alternatively, a regression subnet may be trained to approximate the location, the azimuth angle of the main axis, and the eccentricity of the ellipse. In this case, the number approximated remains four.

6. Conclusions

Mesoscale convective systems (MCS) are rare, yet extremely powerful and dangerous atmospheric events. Reliable research of MCS properties based on observations is limited due to the small amount of labeled data. In our study, we proposed a three-element toolkit to address this issue. First, we proposed the client-server application GeoAnnotateAssisted, which covers all the needs of an expert who would like to perform identification and tracking of MCS in remote sensing imagery. Second, we presented the Dataset of Mesoscale Convective Systems over the European Territory of Russia (DaMesCoS-ETR). We collected DaMesCoS-ETR data employing experts in mesoscale atmospheric dynamics. When labeling and tracking the MCSs, we exploited our GeoAnnotateAssisted app. Third, we presented a deep convolutional Neural Network for the Identification of Mesoscale Convective Systems (MesCoSNet) that was constructed following the architecture of RetinaNet, which was proposed to tackle the problem of visual object detection with a strong background–foreground imbalance, i.e., with rare objects, which is the case for MCS. We trained our neural network several times on different subsets of DaMesCoS-ETR in order to estimate the quality metrics reliably. The detection quality of MesCoSNet ( AP = 0.75 ) does not surpass the typical level today (e.g., 0.87 reported for some networks assessed on the MS COCO dataset). At the same time, AP = 0.75 is good enough, yet there are various means of potential improvement. Using our three-fold toolkit, one may support the investigation of MCSs and associated extreme weather events by their automated identification and tracking.

Author Contributions

Conceptualization, A.C. and M.K.; methodology, M.K. and S.E.; software, M.K.; validation, M.K. and A.C.; investigation, M.K. and A.C.; resources, M.K. and A.C.; data curation, A.S. (Alexander Sprygin), A.N. and A.S. (Andrew Shikhov); writing—original draft preparation, M.K.; writing—review and editing, M.K., A.S. (Alexander Sprygin), A.S. (Andrew Shikhov) and A.C.; visualization, M.K.; supervision, A.C.; project administration, A.C.; funding acquisition, A.C. and M.K. All authors have read and agreed to the published version of the manuscript.

Funding

The methodological development, training and evaluation of neural networks, and dataset collection were supported by the Russian Science Foundation (project no. 18-77-10076); the development of the software package GeoAnnotateAssisted was conducted with the financial support of the Ministry of Education and Science of the Russian Federation as part of the program of the Moscow Center for Fundamental and Applied Mathematics under the agreement № 075-15-2022-284.

Data Availability Statement

Publicly available dataset DaMesCoS-ETR is created and analysed in this study. This data is publicly available on a GitHub repository. The repository can be accessed at https://github.com/MKrinitskiy/DaMesCoS (accessed on 20 April 2023).

Conflicts of Interest

The authors declare no conflict of interest.

Abbreviations

The following abbreviations are used in this manuscript:
MCSsMesoscale convective systems
MCCsMesoscale convective complexes
SCSupercell
CSMeso-beta convective storms
OTOvershooting top (MCC spatial pattern)
ANNArtificial neural network
DCNNDeep convolutional neural networks
DaMesCoS-ETRDataset of Mesoscale Convective Systems over the European Territory of Russia
MesCoSNetNeural Network for Identification of Mesoscale Convective Systems
MSGMeteosat Second Generation
SEVIRISpinning Enhanced Visible Infra-Red Imager (the instrument at Meteosat )
APAverage precision
mAPMean average precision
PR curvePrecision-vs-recall curve
IoUIntersection over Union
TPRTrue positive rate
FARFalse alarms ratio
CAPEConvective available potential energy
CINConvective inhibition
FLFocal loss
VODVisual object detection
NOAANational Oceanic and Atmospheric Administration
GOESGeostationary Operational Environmental Satellite
DLDeep learning
MLMachine learning
SARSynthetic-aperture radar
DASIODataset of All-Sky Imagery over the Ocean [41]
SOMCSouthern Ocean Mesocyclones Dataset [62]
ETREuropean territory of Russia
BTDBrightness temperature difference
RSDRemote sensing data
APIApplication programming interface
CECross-entropy
bboxBounding box
TLTransfer learning (an approach in deep learning)
DADomain adaptation (an approach in deep learning)
IoUIntersection over Union

References

  1. Kattsov, V.M.; Akentieva, E.M.; Anisimov, O.A.; Bardin, M.Y.; Zhuravlev, S.A.; Kiselev, A.A.; Klyueva, M.V.; Konstantinov, P.I.; Korotkov, V.N.; Kostyanoy, A.G.; et al. Third Assessment Report on Climate Change and Its Consequences on The Territory of the Russian Federation; General Summary; Roshydromet Science-Intensive Technologies: St. Petersburg, Russia, 2022. [Google Scholar]
  2. Diffenbaugh, N.S.; Scherer, M.; Trapp, R.J. Robust increases in severe thunderstorm environments in response to greenhouse forcing. Proc. Natl. Acad. Sci. USA 2013, 110, 16361–16366. [Google Scholar] [CrossRef] [PubMed]
  3. Rädler, A.T.; Groenemeijer, P.H.; Faust, E.; Sausen, R.; Púčik, T. Frequency of severe thunderstorms across Europe expected to increase in the 21st century due to rising instability. npj Clim. Atmos. Sci. 2019, 2, 30. [Google Scholar] [CrossRef] [Green Version]
  4. Chernokulsky, A.; Eliseev, A.; Kozlov, F.; Korshunova, N.; Kurgansky, M.; Mokhov, I.; Semenov, V.; Shvets’, N.; Shikhov, A.; Yarinich, Y.I. Atmospheric severe convective events in Russia: Changes observed from different data. Russ. Meteorol. Hydrol. 2022, 47, 343–354. [Google Scholar] [CrossRef]
  5. Meredith, E.P.; Semenov, V.A.; Maraun, D.; Park, W.; Chernokulsky, A.V. Crucial role of Black Sea warming in amplifying the 2012 Krymsk precipitation extreme. Nat. Geosci. 2015, 8, 615–619. [Google Scholar] [CrossRef]
  6. Chernokulsky, A.; Kurgansky, M.; Mokhov, I.; Shikhov, A.; Azhigov, I.; Selezneva, E.; Zakharchenko, D.; Antonescu, B.; Kühne, T. Tornadoes in northern Eurasia: From the middle age to the information era. Mon. Weather Rev. 2020, 148, 3081–3110. [Google Scholar] [CrossRef] [Green Version]
  7. Chernokulsky, A.; Shikhov, A.; Bykov, A.; Azhigov, I. Satellite-based study and numerical forecasting of two tornado outbreaks in the Ural Region in June 2017. Atmosphere 2020, 11, 1146. [Google Scholar] [CrossRef]
  8. Chernokulsky, A.; Kurgansky, M.; Mokhov, I.; Shikhov, A.; Azhigov, I.; Selezneva, E.; Zakharchenko, D.; Antonescu, B.; Kuhne, T. Tornadoes in the Russian regions. Russ. Meteorol. Hydrol. 2021, 46, 69–82. [Google Scholar] [CrossRef]
  9. Lister, T.; Masters, J. Moscow Storm Kills 16, Injures Nearly 170 | CNN. Available online: https://edition.cnn.com/2017/05/30/europe/moscow-storm/index.html (accessed on 22 April 2023).
  10. Chernokulsky, A.; Shikhov, A.; Bykov, A.; Kalinin, N.; Kurgansky, M.; Sherstyukov, B.; Yarinich, Y. Diagnosis and modelling of two destructive derecho events in European Russia in the summer of 2010. Atmos. Res. 2022, 267, 105928. [Google Scholar] [CrossRef]
  11. Chernokulsky, A.V.; Shikhov, A.N.; Azhigov, I.O.; Eroshkina, N.A.; Korenev, D.P.; Bykov, A.V.; Kalinin, N.A.; Kurgansky, M.V.; Pavlyukov, Y.B.; Sprygin, A.A.; et al. Squalls and Tornadoes over the European Territory of Russia on May 15, 2021: Diagnosis and Modeling. Russ. Meteorol. Hydrol. 2022, 47, 867–881. [Google Scholar] [CrossRef]
  12. Houze, R.; Schmid, W.; Fovell, R.; Schiesser, H. Hailstorms in Switzerland: Left movers, right movers, and false hooks. Mon. Weather Rev. 1993, 121, 3345–3370. [Google Scholar] [CrossRef]
  13. Laing, A.G.; Michael Fritsch, J. The global population of mesoscale convective complexes. Q. J. R. Meteorol. Soc. 1997, 123, 389–405. [Google Scholar] [CrossRef]
  14. Maddox, R.A. Mesoscale Convective Complexes. Bull. Am. Meteorol. Soc. 1980, 61, 1374–1387. [Google Scholar] [CrossRef]
  15. Orlanski, I. A rational subdivision of scales for atmospheric processes. Bull. Am. Meteorol. Soc. 1975, 56, 527–530. [Google Scholar]
  16. Cheeks, S.M.; Fueglistaler, S.; Garner, S.T. A Satellite-Based Climatology of Central and Southeastern U.S. Mesoscale Convective Systems. Mon. Weather Rev. 2020, 148, 2607–2621. [Google Scholar] [CrossRef]
  17. Morel, C.; Senesi, S. A climatology of mesoscale convective systems over Europe using satellite infrared imagery. I: Methodology. Q. J. R. Meteorol. Soc. 2002, 128, 1953–1971. [Google Scholar] [CrossRef]
  18. Morel, C.; Senesi, S. A climatology of mesoscale convective systems over Europe using satellite infrared imagery. II: Characteristics of European mesoscale convective systems. Q. J. R. Meteorol. Soc. 2002, 128, 1973–1995. [Google Scholar] [CrossRef]
  19. Feng, Z.; Leung, L.R.; Liu, N.; Wang, J.; Houze, R.A.; Li, J.; Hardin, J.C.; Chen, D.; Guo, J. A Global High-Resolution Mesoscale Convective System Database Using Satellite-Derived Cloud Tops, Surface Precipitation, and Tracking. J. Geophys. Res. Atmos. 2021, 126, e2020JD034202. [Google Scholar] [CrossRef]
  20. Chen, D.; Guo, J.; Yao, D.; Lin, Y.; Zhao, C.; Min, M.; Xu, H.; Liu, L.; Huang, X.; Chen, T.; et al. Mesoscale Convective Systems in the Asian Monsoon Region From Advanced Himawari Imager: Algorithms and Preliminary Results. J. Geophys. Res. Atmos. 2019, 124, 2210–2234. [Google Scholar] [CrossRef] [Green Version]
  21. Yang, X.; Fei, J.; Huang, X.; Cheng, X.; Carvalho, L.M.V.; He, H. Characteristics of Mesoscale Convective Systems over China and Its Vicinity Using Geostationary Satellite FY2. J. Clim. 2015, 28, 4890–4907. [Google Scholar] [CrossRef]
  22. Klein, C.; Belušić, D.; Taylor, C.M. Wavelet Scale Analysis of Mesoscale Convective Systems for Detecting Deep Convection From Infrared Imagery. J. Geophys. Res. Atmos. 2018, 123, 3035–3050. [Google Scholar] [CrossRef] [Green Version]
  23. Bedka, K.; Brunner, J.; Dworak, R.; Feltz, W.; Otkin, J.; Greenwald, T. Objective Satellite-Based Detection of Overshooting Tops Using Infrared Window Channel Brightness Temperature Gradients. J. Appl. Meteorol. Climatol. 2010, 49, 181–202. [Google Scholar] [CrossRef]
  24. Setvák, M.; Lindsey, D.T.; Novák, P.; Wang, P.K.; Radová, M.; Kerkmann, J.; Grasso, L.; Su, S.H.; Rabin, R.M.; Šťástka, J.; et al. Satellite-observed cold-ring-shaped features atop deep convective clouds. Atmos. Res. 2010, 97, 80–96. [Google Scholar] [CrossRef]
  25. Brunner, J.C.; Ackerman, S.A.; Bachmeier, A.S.; Rabin, R.M. A Quantitative Analysis of the Enhanced-V Feature in Relation to Severe Weather. Weather Forecast. 2007, 22, 853–872. [Google Scholar] [CrossRef]
  26. Bedka, K.; Murillo, E.M.; Homeyer, C.R.; Scarino, B.; Mersiovsky, H. The Above-Anvil Cirrus Plume: An Important Severe Weather Indicator in Visible and Infrared Satellite Imagery. Weather Forecast. 2018, 33, 1159–1181. [Google Scholar] [CrossRef]
  27. Proud, S.R. Analysis of overshooting top detections by Meteosat Second Generation: A 5-year dataset. Q. J. R. Meteorol. Soc. 2015, 141, 909–915. [Google Scholar] [CrossRef]
  28. Punge, H.J.; Bedka, K.M.; Kunz, M.; Reinbold, A. Hail frequency estimation across Europe based on a combination of overshooting top detections and the ERA-INTERIM reanalysis. Atmos. Res. 2017, 198, 34–43. [Google Scholar] [CrossRef]
  29. Cintineo, J.L.; Pavolonis, M.J.; Sieglaff, J.M.; Wimmers, A.; Brunner, J.; Bellon, W. A Deep-Learning Model for Automated Detection of Intense Midlatitude Convection Using Geostationary Satellite Images. Weather Forecast. 2020, 35, 2567–2588. [Google Scholar] [CrossRef]
  30. Hong, Y.; Nesbitt, S.W.; Trapp, R.J.; Di Girolamo, L. Near-global distributions of overshooting tops derived from Terra and Aqua MODIS observations. Atmos. Meas. Tech. 2023, 16, 1391–1406. [Google Scholar] [CrossRef]
  31. Czernecki, B.; Taszarek, M.; Marosz, M.; Półrolniczak, M.; Kolendowicz, L.; Wyszogrodzki, A.; Szturc, J. Application of machine learning to large hail prediction—The importance of radar reflectivity, lightning occurrence and convective parameters derived from ERA5. Atmos. Res. 2019, 227, 249–262. [Google Scholar] [CrossRef]
  32. Haberlie, A.M.; Ashley, W.S. A Radar-Based Climatology of Mesoscale Convective Systems in the United States. J. Clim. 2019, 32, 1591–1606. [Google Scholar] [CrossRef] [Green Version]
  33. Surowiecki, A.; Taszarek, M. A 10-Year Radar-Based Climatology of Mesoscale Convective System Archetypes and Derechos in Poland. Mon. Weather Rev. 2020, 148, 3471–3488. [Google Scholar] [CrossRef]
  34. Nisi, L.; Martius, O.; Hering, A.; Kunz, M.; Germann, U. Spatial and temporal distribution of hailstorms in the Alpine region: A long-term, high resolution, radar-based analysis. Q. J. R. Meteorol. Soc. 2016, 142, 1590–1604. [Google Scholar] [CrossRef]
  35. Cintineo, J.L.; Smith, T.M.; Lakshmanan, V.; Brooks, H.E.; Ortega, K.L. An Objective High-Resolution Hail Climatology of the Contiguous United States. Weather Forecast. 2012, 27, 1235–1248. [Google Scholar] [CrossRef] [Green Version]
  36. Dyaduchenko, V.; Pavlyukov, Y.; Vylegzhanin, I. Doppler weather radars in Russia. Sci. Russ. 2014, 199, 23–27. [Google Scholar]
  37. Abdullaev, S.M.; Zhelnin, A.A.; Lenskaya, O.Y. The structure of mesoscale convective systems in central Russia. Russ. Meteorol. Hydrol. 2012, 37, 12–20. [Google Scholar] [CrossRef]
  38. Sprygin, A. Parameters of long-lived severe convective structures in the European territory of Russia and adjacent territories and the possibility of unifying their forecast. Hydrometeorol. Res. Forecast. 2020, 375, 21–47. [Google Scholar] [CrossRef]
  39. Chernokulsky, A.; Shikhov, A.; Yarinich, Y.; Sprygin, A. An Empirical Relationship among Characteristics of Severe Convective Storms, Their Cloud-Top Properties and Environmental Parameters in Northern Eurasia. Atmosphere 2023, 14, 174. [Google Scholar] [CrossRef]
  40. Krinitskiy, M.A.; Sinitsyn, A.V. Adaptive algorithm for cloud cover estimation from all-sky images over the sea. Oceanology 2016, 56, 315–319. [Google Scholar] [CrossRef]
  41. Krinitskiy, M.; Aleksandrova, M.; Verezemskaya, P.; Gulev, S.; Sinitsyn, A.; Kovaleva, N.; Gavrikov, A. On the Generalization Ability of Data-Driven Models in the Problem of Total Cloud Cover Retrieval. Remote Sens. 2021, 13, 326. [Google Scholar] [CrossRef]
  42. Simonyan, K.; Zisserman, A. Very Deep Convolutional Networks for Large-Scale Image Recognition. arXiv 2014, arXiv:1409.1556. [Google Scholar]
  43. Badrinarayanan, V.; Kendall, A.; Cipolla, R. SegNet: A Deep Convolutional Encoder-Decoder Architecture for Image Segmentation. arXiv 2017, arXiv:1511.00561. [Google Scholar] [CrossRef] [PubMed]
  44. Lin, T.Y.; Dollár, P.; Girshick, R.; He, K.; Hariharan, B.; Belongie, S. Feature Pyramid Networks for Object Detection. arXiv 2016, arXiv:1612.03144. [Google Scholar]
  45. He, K.; Zhang, X.; Ren, S.; Sun, J. Deep Residual Learning for Image Recognition. In Proceedings of the 2016 IEEE Conference on Computer Vision and Pattern Recognition (CVPR), Las Vegas, NV, USA, 27–30 June 2016; pp. 770–778. [Google Scholar]
  46. Krizhevsky, A.; Sutskever, I.; Hinton, G.E. ImageNet Classification with Deep Convolutional Neural Networks. In Advances in Neural Information Processing Systems 25; Pereira, F., Burges, C.J.C., Bottou, L., Weinberger, K.Q., Eds.; Curran Associates, Inc.: Red Hook, NY, USA, 2012; pp. 1097–1105. [Google Scholar]
  47. Liu, Y.; Racah, E.; Prabhat; Correa, J.; Khosrowshahi, A.; Lavers, D.; Kunkel, K.; Wehner, M.; Collins, W. Application of Deep Convolutional Neural Networks for Detecting Extreme Weather in Climate Datasets. arXiv 2016, arXiv:1605.01156. [Google Scholar]
  48. Rupe, A.; Kashinath, K.; Kumar, N.; Lee, V.; Prabhat; Crutchfield, J.P. Towards Unsupervised Segmentation of Extreme Weather Events. arXiv 2019, arXiv:1909.07520. [Google Scholar]
  49. Muszynski, G.; Kashinath, K.; Kurlin, V.; Wehner, M.; Prabhat. Topological data analysis and machine learning for recognizing atmospheric river patterns in large climate datasets. Methods Assess. Model. 2019, 12, 613–628. [Google Scholar] [CrossRef] [Green Version]
  50. Matsuoka, D.; Nakano, M.; Sugiyama, D.; Uchida, S. Deep learning approach for detecting tropical cyclones and their precursors in the simulation by a cloud-resolving global nonhydrostatic atmospheric model. Prog. Earth Planet. Sci. 2018, 5, 80. [Google Scholar] [CrossRef] [Green Version]
  51. Pang, S.; Xie, P.; Xu, D.; Meng, F.; Tao, X.; Li, B.; Li, Y.; Song, T. NDFTC: A New Detection Framework of Tropical Cyclones from Meteorological Satellite Images with Deep Transfer Learning. Remote Sens. 2021, 13, 1860. [Google Scholar] [CrossRef]
  52. Prabhat; Kashinath, K.; Mudigonda, M.; Kim, S.; Kapp-Schwoerer, L.; Graubner, A.; Karaismailoglu, E.; von Kleist, L.; Kurth, T.; Greiner, A.; et al. ClimateNet: An expert-labeled open dataset and deep learning architecture for enabling high-precision analyses of extreme weather. Geosci. Model Dev. 2021, 14, 107–124. [Google Scholar] [CrossRef]
  53. Huang, D.; Du, Y.; He, Q.; Song, W.; Liotta, A. DeepEddy: A simple deep architecture for mesoscale oceanic eddy detection in SAR images. In Proceedings of the 2017 IEEE 14th International Conference on Networking, Sensing and Control (ICNSC), Calabria, Italy, 16–18 May 2017; pp. 673–678. [Google Scholar] [CrossRef]
  54. Krinitskiy, M.; Verezemskaya, P.; Grashchenkov, K.; Tilinina, N.; Gulev, S.; Lazzara, M. Deep Convolutional Neural Networks Capabilities for Binary Classification of Polar Mesocyclones in Satellite Mosaics. Atmosphere 2018, 9, 426. [Google Scholar] [CrossRef] [Green Version]
  55. Krinitskiy, M.; Verezemskaya, P.; Elizarov, S.; Gulev, S. Machine learning methods for the detection of polar lows in satellite mosaics: Major issues and their solutions. IOP Conf. Ser. Earth Environ. Sci. 2020, 606, 012025. [Google Scholar] [CrossRef]
  56. Lin, T.Y.; Maire, M.; Belongie, S.; Bourdev, L.; Girshick, R.; Hays, J.; Perona, P.; Ramanan, D.; Zitnick, C.L.; Dollár, P. Microsoft COCO: Common Objects in Context. arXiv 2014, arXiv:1405.0312. [Google Scholar]
  57. Cordts, M.; Omran, M.; Ramos, S.; Rehfeld, T.; Enzweiler, M.; Benenson, R.; Franke, U.; Roth, S.; Schiele, B. The Cityscapes Dataset for Semantic Urban Scene Understanding. arXiv 2016, arXiv:1604.01685. [Google Scholar]
  58. Deng, J.; Dong, W.; Socher, R.; Li, L.J.; Li, K.; Fei-Fei, L. Imagenet: A large-scale hierarchical image database. In Proceedings of the IEEE Conference on Computer Vision and Pattern Recognition, CVPR 2009, Miami, FL, USA, 20–25 June 2009; pp. 248–255. [Google Scholar]
  59. Everingham, M.; Eslami, S.M.A.; Van Gool, L.; Williams, C.K.I.; Winn, J.; Zisserman, A. The Pascal Visual Object Classes Challenge: A Retrospective. Int. J. Comput. Vis. 2015, 111, 98–136. [Google Scholar] [CrossRef]
  60. Krizhevsky, A. Learning Multiple Layers of Features from Tiny Images. Master’s Thesis, University of Toronto, Toronto, ON, Canada, 2009. [Google Scholar]
  61. Lecun, Y.; Bottou, L.; Bengio, Y.; Haffner, P. Gradient-based learning applied to document recognition. Proc. IEEE 1998, 86, 2278–2324. [Google Scholar] [CrossRef]
  62. Verezemskaya, P.; Tilinina, N.; Gulev, S.; Renfrew, I.A.; Lazzara, M. Southern Ocean mesocyclones and polar lows from manually tracked satellite mosaics. Geophys. Res. Lett. 2017, 44, 7985–7993. [Google Scholar] [CrossRef] [Green Version]
  63. Lin, T.Y.; Goyal, P.; Girshick, R.; He, K.; Dollár, P. Focal Loss for Dense Object Detection. arXiv 2017, arXiv:1708.02002. [Google Scholar]
  64. Tessier, R. The Meteosat Programme. ESA Bull. 1989, 7, 45–57. [Google Scholar]
  65. EUMETSAT | Monitoring the Weather and Climate from Space. Available online: https://www.eumetsat.int/ (accessed on 29 June 2023).
  66. Šťástka, J.; Radová, M. Detection and analysis of anomalies in the brightness temperature difference field using MSG rapid scan data. Atmos. Res. 2013, 123, 354–359. [Google Scholar] [CrossRef]
  67. Feidas, H.; Cartalis, C. Monitoring mesoscale convective cloud systems associated with heavy storms using Meteosat imagery. J. Appl. Meteorol. Climatol. 2001, 40, 491–512. [Google Scholar] [CrossRef]
  68. Bedka, K.M. Overshooting cloud top detections using MSG SEVIRI Infrared brightness temperatures and their relationship to severe weather over Europe. Atmos. Res. 2011, 99, 175–189. [Google Scholar] [CrossRef]
  69. Mikuš, P.; Mahović, N.S. Satellite-based overshooting top detection methods and an analysis of correlated weather conditions. Atmos. Res. 2013, 123, 268–280. [Google Scholar] [CrossRef]
  70. Punge, H.; Bedka, K.; Kunz, M.; Werner, A. A new physically based stochastic event catalog for hail in Europe. Nat. Hazards 2014, 73, 1625–1645. [Google Scholar] [CrossRef]
  71. Levizzani, V.; Setvák, M. Multispectral, high-resolution satellite observations of plumes on top of convective storms. J. Atmos. Sci. 1996, 53, 361–369. [Google Scholar] [CrossRef]
  72. Putsay, M.; Simon, A.; Setvák, M.; Szenyán, I.; Kerkmann, J. Simultaneous observation of an above-anvil ice plume and plume-shaped BTD anomaly atop a convective storm. Atmos. Res. 2013, 123, 293–304. [Google Scholar] [CrossRef]
  73. V7—The AI Data Engine for Computer Vision & Generative AI. Available online: https://www.v7labs.com/ (accessed on 29 June 2023).
  74. SuperAnnotate—The Ultimate Training Data Platform for AI. Available online: https://www.superannotate.com/ (accessed on 29 June 2023).
  75. Russell, B.C.; Torralba, A.; Murphy, K.P.; Freeman, W.T. LabelMe: A Database and Web-Based Tool for Image Annotation. Int. J. Comput. Vis. 2008, 77, 157–173. [Google Scholar] [CrossRef]
  76. Van Rossum, G.; Drake, F.L. Python 3 Reference Manual; CreateSpace: Scotts Valley, CA, USA, 2009. [Google Scholar]
  77. Sekachev, B.; Manovich, N.; Zhiltsov, M.; Zhavoronkov, A.; Kalinin, D.; Hoff, B.; TOsmanov; Kruchinin, D.; Zankevich, A.; Sidnev, D.; et al. opencv/cvat: V1.1.0. Available online: https://zenodo.org/record/4009388 (accessed on 29 June 2023). [CrossRef]
  78. LabelImg—Git Code (2015). Available online: https://github.com/heartexlabs/labelImg (accessed on 29 June 2023).
  79. Imglab—A Web Based Tool to Label Images for Objects That Can Be Used to Train Dlib or Other Object Detectors. Available online: https://github.com/NaturalIntelligence/imglab (accessed on 29 June 2023).
  80. Krinitskiy, M.; Grashchenkov, K.; Tilinina, N.; Gulev, S. Tracking of atmospheric phenomena with artificial neural networks: A supervised approach. Procedia Comput. Sci. 2021, 186, 403–410. [Google Scholar] [CrossRef]
  81. Summerfield, M. Rapid GUI Programming with Python and Qt: The Definitive Guide to PyQt Programming (Paperback); Pearson Education: London, UK, 2007. [Google Scholar]
  82. Grinberg, M. Flask Web Development: Developing Web Applications With Python; O’Reilly Media, Inc.: Sebastopol, CA, USA, 2018. [Google Scholar]
  83. Pezoa, F.; Reutter, J.L.; Suarez, F.; Ugarte, M.; Vrgoč, D. Foundations of JSON schema. In Proceedings of the 25th International Conference on International World Wide Web Conferences Steering Committee, Montreal, QC, Canada, 11–15 April 2016; pp. 263–273. [Google Scholar]
  84. Žibert, M.I.; Žibert, J. Monitoring and automatic detection of the cold-ring patterns atop deep convective clouds using Meteosat data. Atmos. Res. 2013, 123, 281–292. [Google Scholar] [CrossRef]
  85. Mikuš Jurković, P. Satellite signatures and lightning characteristics of severe convective storms. Croat. Meteorol. J. 2017, 52, 77–82. [Google Scholar]
  86. Shikhov, A.N.; Chernokulsky, A.V.; Sprygin, A.A.; Azhigov, I.O. Identification of mesoscale convective cloud systems with tornadoes using satellite data. Sovrem. Probl. Distantsionnogo Zondirovaniya Zemli Kosmosa 2019, 16, 223–236. [Google Scholar] [CrossRef]
  87. Putsay, M.; Simon, A.; Szenyán, I.; Kerkmann, J.; Horváth, G. Case study of the 20 May 2008 tornadic storm in Hungary—Remote sensing features and NWP simulation. Atmos. Res. 2011, 100, 657–679. [Google Scholar] [CrossRef]
  88. Laing, A. MESOSCALE METEOROLOGY|Mesoscale Convective Systems. In Encyclopedia of Atmospheric Sciences, 2nd ed.; North, G.R., Pyle, J., Zhang, F., Eds.; Academic Press: Oxford, UK, 2015; pp. 339–354. [Google Scholar] [CrossRef]
  89. Rasmussen, E.N.; Blanchard, D.O. A Baseline Climatology of Sounding-Derived Supercell andTornado Forecast Parameters. Weather Forecast. 1998, 13, 1148–1164. [Google Scholar] [CrossRef]
  90. Rasmussen, E.N.; Straka, J.M. Variations in Supercell Morphology. Part I: Observations of the Role of Upper-Level Storm-Relative Flow. Mon. Weather Rev. 1998, 126, 2406–2421. [Google Scholar] [CrossRef]
  91. Weisman, M.L.; Klemp, J.B. Characteristics of Isolated Convective Storms. In Mesoscale Meteorology and Forecasting; Ray, P.S., Ed.; American Meteorological Society: Boston, MA, USA, 1986; pp. 331–358. [Google Scholar] [CrossRef]
  92. Weisman, M.L.; Klemp, J.B. The Structure and Classification of Numerically Simulated Convective Stormsin Directionally Varying Wind Shears. Mon. Weather Rev. 1984, 112, 2479–2498. [Google Scholar] [CrossRef]
  93. Weisman, M.L.; Klemp, J.B. The Dependence of Numerically Simulated Convective Storms on Vertical Wind Shear and Buoyancy. Mon. Weather Rev. 1982, 110, 504–520. [Google Scholar] [CrossRef]
  94. Sermanet, P.; Eigen, D.; Zhang, X.; Mathieu, M.; Fergus, R.; LeCun, Y. OverFeat: Integrated Recognition, Localization and Detection using Convolutional Networks. arXiv 2014, arXiv:1312.6229. [Google Scholar] [CrossRef]
  95. Redmon, J.; Farhadi, A. YOLOv3: An Incremental Improvement. arXiv 2018, arXiv:1804.02767. [Google Scholar] [CrossRef]
  96. Fu, C.Y.; Liu, W.; Ranga, A.; Tyagi, A.; Berg, A.C. DSSD: Deconvolutional Single Shot Detector. arXiv 2017, arXiv:1701.06659. [Google Scholar] [CrossRef]
  97. Liu, W.; Anguelov, D.; Erhan, D.; Szegedy, C.; Reed, S.; Fu, C.Y.; Berg, A.C. SSD: Single Shot MultiBox Detector. In Proceedings of the Computer Vision–ECCV, Amsterdam, The Netherlands, 11–14 October 2016; Leibe, B., Matas, J., Sebe, N., Welling, M., Eds.; Lecture Notes in Computer Science. Springer International Publishing: Cham, Switzerland, 2016; pp. 21–37. [Google Scholar] [CrossRef] [Green Version]
  98. Bochkovskiy, A.; Wang, C.Y.; Liao, H.Y.M. YOLOv4: Optimal Speed and Accuracy of Object Detection. arXiv 2020, arXiv:2004.10934. [Google Scholar] [CrossRef]
  99. Tian, Z.; Shen, C.; Chen, H.; He, T. FCOS: Fully Convolutional One-Stage Object Detection. arXiv 2019, arXiv:1904.01355. [Google Scholar] [CrossRef]
  100. Girshick, R. Fast R-CNN. arXiv 2015, arXiv:1504.08083. [Google Scholar] [CrossRef]
  101. Ren, S.; He, K.; Girshick, R.; Sun, J. Faster R-CNN: Towards Real-Time Object Detection with Region Proposal Networks. arXiv 2016, arXiv:1506.01497. [Google Scholar] [CrossRef] [PubMed] [Green Version]
  102. Dai, J.; Li, Y.; He, K.; Sun, J. R-FCN: Object Detection via Region-based Fully Convolutional Networks. arXiv 2016, arXiv:1605.06409. [Google Scholar] [CrossRef]
  103. Carranza-García, M.; Torres-Mateo, J.; Lara-Benítez, P.; García-Gutiérrez, J. On the Performance of One-Stage and Two-Stage Object Detectors in Autonomous Vehicles Using Camera Data. Remote Sens. 2021, 13, 89. [Google Scholar] [CrossRef]
  104. Geiger, A.; Lenz, P.; Stiller, C.; Urtasun, R. Vision meets robotics: The kitti dataset. Int. J. Robot. Res. 2013, 32, 1231–1237. [Google Scholar] [CrossRef] [Green Version]
  105. Shikhov, A.; Chernokulsky, A.; Kalinin, N.; Bykov, A.; Pischalnikova, E. Climatology and Formation Environments of Severe Convective Windstorms and Tornadoes in the Perm Region (Russia) in 1984–2020. Atmosphere 2021, 12, 1407. [Google Scholar] [CrossRef]
  106. Kolesnikov, A.; Beyer, L.; Zhai, X.; Puigcerver, J.; Yung, J.; Gelly, S.; Houlsby, N. Large Scale Learning of General Visual Representations for Transfer. arXiv 2019, arXiv:1912.11370. [Google Scholar]
  107. Bozinovski, S.; Fulgosi, A. The influence of pattern similarity and transfer learning upon training of a base perceptron B2. Proc. Symp. Inform. 1976, 3, 121–126. [Google Scholar]
  108. Weiss, K.; Khoshgoftaar, T.M.; Wang, D. A survey of transfer learning. J. Big Data 2016, 3, 9. [Google Scholar] [CrossRef] [Green Version]
  109. Tan, C.; Sun, F.; Kong, T.; Zhang, W.; Yang, C.; Liu, C. A survey on deep transfer learning. In Proceedings of the Artificial Neural Networks and Machine Learning–ICANN 2018: 27th International Conference on Artificial Neural Networks, Rhodes, Greece, 4–7 October 2018; Proceedings, Part III 27. Springer: Cham, Switzerland, 2018; pp. 270–279. [Google Scholar]
  110. Pan, S.J.; Yang, Q. A survey on transfer learning. IEEE Trans. Knowl. Data Eng. 2010, 22, 1345–1359. [Google Scholar] [CrossRef]
  111. Bernico, M.; Li, Y.; Zhang, D. Investigating the Impact of Data Volume and Domain Similarity on Transfer Learning Applications. In Proceedings of the Future Technologies Conference (FTC), Vancouver, BC, Canada, 15–16 November 2018; Arai, K., Bhatia, R., Kapoor, S., Eds.; Advances in Intelligent Systems and Computing. Springer International Publishing: Cham, Switzerland, 2019; Volume 881, pp. 53–62. [Google Scholar] [CrossRef]
  112. Farahani, A.; Voghoei, S.; Rasheed, K.; Arabnia, H.R. A Brief Review of Domain Adaptation. In Advances in Data Science and Information Engineering; Stahlbock, R., Weiss, G.M., Abou-Nasr, M., Yang, C.Y., Arabnia, H.R., Deligiannidis, L., Eds.; Transactions on Computational Science and Computational Intelligence; Springer International Publishing: Cham, Switzerland, 2021; pp. 877–894. [Google Scholar] [CrossRef]
  113. Wang, M.; Deng, W. Deep visual domain adaptation: A survey. Neurocomputing 2018, 312, 135–153. [Google Scholar] [CrossRef] [Green Version]
  114. Padilla, R.; Netto, S.L.; da Silva, E.A.B. A Survey on Performance Metrics for Object-Detection Algorithms. In Proceedings of the 2020 International Conference on Systems, Signals and Image Processing (IWSSIP), Online, 1–3 July 2020; pp. 237–242. [Google Scholar] [CrossRef]
  115. Bergmeir, C.; Hyndman, R.J.; Koo, B. A note on the validity of cross-validation for evaluating autoregressive time series prediction. Comput. Stat. Data Anal. 2018, 120, 70–83. [Google Scholar] [CrossRef]
  116. Bergmeir, C.; Benítez, J.M. On the use of cross-validation for time series predictor evaluation. Inf. Sci. 2012, 191, 192–213. [Google Scholar] [CrossRef]
  117. Racine, J. Consistent cross-validatory model-selection for dependent data: hv-block cross-validation. J. Econom. 2000, 99, 39–61. [Google Scholar] [CrossRef]
  118. Arlot, S.; Celisse, A. A survey of cross-validation procedures for model selection. Stat. Surv. 2010, 4, 40–79. [Google Scholar] [CrossRef]
  119. Kandel, I.; Castelli, M. The effect of batch size on the generalizability of the convolutional neural networks on a histopathology dataset. ICT Express 2020, 6, 312–315. [Google Scholar] [CrossRef]
  120. Kingma, D.P.; Ba, J. Adam: A Method for Stochastic Optimization. arXiv 2014, arXiv:1412.6980. [Google Scholar]
  121. Papers with Code—An Overview of Stochastic Optimization. Available online: https://paperswithcode.com/methods/category/stochastic-optimization (accessed on 14 April 2023).
  122. Sun, S.; Cao, Z.; Zhu, H.; Zhao, J. A Survey of Optimization Methods from a Machine Learning Perspective. arXiv 2019, arXiv:1906.06821. [Google Scholar] [CrossRef] [Green Version]
  123. Loshchilov, I.; Hutter, F. SGDR: Stochastic Gradient Descent with Warm Restarts. arXiv 2016, arXiv:1608.03983. [Google Scholar]
  124. Howard, J.; Ruder, S. Universal Language Model Fine-tuning for Text Classification. arXiv 2018, arXiv:1801.06146. [Google Scholar] [CrossRef]
  125. Long, M.; Cao, Y.; Wang, J.; Jordan, M. Learning Transferable Features with Deep Adaptation Networks. In Proceedings of the 32nd International Conference on Machine Learning, PMLR, Lille, France, 7–9 July 2015; pp. 97–105. [Google Scholar]
  126. Yosinski, J.; Clune, J.; Bengio, Y.; Lipson, H. How transferable are features in deep neural networks? In Advances in Neural Information Processing Systems; Curran Associates, Inc.: Red Hook, NY, USA, 2014; Volume 27. [Google Scholar]
  127. Kornblith, S.; Shlens, J.; Le, Q.V. Do Better ImageNet Models Transfer Better? In Proceedings of the 2019 IEEE/CVF Conference on Computer Vision and Pattern Recognition (CVPR), Long Beach, CA, USA, 15–19 June 2019; pp. 2661–2671. [Google Scholar]
  128. Singh, B.; Najibi, M.; Davis, L.S. SNIPER: Efficient Multi-Scale Training. arXiv 2018, arXiv:1805.09300. [Google Scholar]
  129. Zhang, S.; Chi, C.; Yao, Y.; Lei, Z.; Li, S.Z. Bridging the Gap Between Anchor-based and Anchor-free Detection via Adaptive Training Sample Selection. arXiv 2019, arXiv:1912.02424. [Google Scholar]
  130. Ronneberger, O.; Fischer, P.; Brox, T. U-Net: Convolutional Networks for Biomedical Image Segmentation. In Proceedings of the Medical Image Computing and Computer-Assisted Intervention—MICCAI, Munich, Germany, 5–9 October 2015; Lecture Notes in Computer Science. Springer: Cham, Switzerland, 2015; pp. 234–241. [Google Scholar] [CrossRef] [Green Version]
Figure 1. An example of four mesoscale convective systems labeled by our expert in Meteosat imagery using our GeoAnnotateAssisted labeling and tracking tool. Here, the actual representations of transformed channels c h 9 n ,   c h 5 n and b ˜ are shown (see Section 3.2.2 for details) using the actual color maps employed in GeoAnnotateAssisted. Green ellipses are the labels an expert has placed as a result of the examination of these representations. Here, in panels, the following channels are shown: (a) c h 9 n , (b) c h 5 n and (c) b ˜ . We do not show temperature color bars, since the values of the re-scaled features c h 9 n , c h 5 n and b ˜ are unitless.
Remotesensing 15 03493 g001
Figure 2. High-level architecture of the annotation tool GeoAnnotateAssisted. The pictogram in the top-left corner stands for a user performing the annotation of MCS.
Remotesensing 15 03493 g002
Figure 3. Structure of the database used in GeoAnnotateAssisted to store the labels and tracking information. It matches completely with the structure of DaMesCoS-ETR. We provide a complete description of this schema in the GitHub repository of DaMesCoS (http://github.com/mkrinitskiy/damescos, accessed on 20 April 2023). Here, label “1” close to certain ID fields indicate that the corresponding identifiers are unique within the scope of its table (e.g., the field “id” of table “labels”) Also, label “*” close to “track_id” field of the table “track_labels” indicates that this identifier is not unique within the scope of the table.
Remotesensing 15 03493 g003
Figure 4. Lifecycle characteristics of MCS in DaMesCoS-ETR based on expert labeling: (a) the distribution of path lengths L, km, (b) the distribution of lifetime T l i f e , h, and (c) the distribution of propagation velocity V, km/h. The distributions are presented in logarithmic scale of the variables. The lines are the kernel density estimation of the distributions.
Remotesensing 15 03493 g004
Figure 5. Focal loss L F L graphs vs. probability of ground truth class p t depending on focusing parameter γ (from the original paper [63]). Here, we modified the captions for the sake of figure clarity. Note, that in the case of γ = 0 , focal loss (FL) is equivalent to the cross-entropy (CE).
Remotesensing 15 03493 g005
Figure 6. RetinaNet architecture, from the original paper [63]. Here, we modified the captions of the first subnet to “backbone subnet” according to the common terminology established by 2023.
Remotesensing 15 03493 g006
Figure 7. Difference between knowledge extraction in traditional machine learning (left) and with transfer learning employed (right) (from Pan and Yang 2010 [110]).
Remotesensing 15 03493 g007
Figure 8. Stages of B T D data transformations within domain adaptation: (a) the original B T D distribution; (b) its normalized distribution acquired as a result of transformation in Equation (4); (c) plot of the transfer function presented in Equation (5), and (d) the empirical distribution of non-linearly scaled B T D employed as one of the spatially distributed features in our study.
Remotesensing 15 03493 g008
Figure 9. Distributions of the features of remote sensing data transformed in accordance with Equations (3) and (5).
Remotesensing 15 03493 g009
Figure 10. Sampling strategy applied in our study for splitting the dataset into training and testing subsets. Here, we display individual Meteosat snapshots with corresponding MCS labels as “measurements” (thin vertical rectangles); days of observations are shown by thick rectangles; days of labeled observations contributing to a train subset are shown in light blue; and days of labeled observations contributing to a test subset are shown in light green.
Remotesensing 15 03493 g010
Figure 11. Learning rate schedule employed in our study.
Remotesensing 15 03493 g011
Figure 12. Plots of metrics I o U and AP depending on t p as the supporting diagram for choosing the t p .
Remotesensing 15 03493 g012
Figure 13. Examples of MesCoSNet application in MCS identification problem using Meteosat remote sensing data. Here, source satellite imagery bands are presented using the color maps delivering the same visual experience as color maps exploited in GeoAnnotateAssisted. MCS labels detected by MesCoSNet are shown as pink rectangles; ground truth MCS labels from DaMesCoS-ETR are shown as yellow rectangles. We also display the certainty rate of MesCoSNet (class MCS probability) for the detected labels (see pink text in the top-left corner of pick rectangles.). Here, we present the cases of (a) our neural network MesCoSNet identifying an MCS close to ground truth and (b) our neural network MesCoSNet identifying one of three ground truth MCSs, thus, two MCSs were missed, whereas the identified one is located close to ground truth.
Remotesensing 15 03493 g013
Figure 14. Frequency of MCS occurrence over ETR in summer (May to September) as a result of MesCoSNet application with Meteosat SEVIRI imagery from 2014 till 2017: (left) frequency map; (right) the averaged over pink rectangle diurnal variation of MCS occurrence probability.
Remotesensing 15 03493 g014
Table 1. Meteosat satellites operating used in this study for identifying mesoscale convective systems over European Russia [65].
NameDeployment DateRetiring Date (If Any)Location
Meteosat-8 (MSG-1)28 August 20021 July 2022 41.5 E
Meteosat-9 (MSG-2)22 December 20051 June 2022 3.5 E
Meteosat-9 (MSG-2, IODC service)1 June 2022 45.5 E
Meteosat-10 (MSG-3)5 July 2012 9.5 E
Meteosat-11 (MSG-4)15 July 2015 0 E
Table 2. Available image annotation tools along with GeoAnnotateAssisted (ours, see Section 2.3). Here, RSD stands for remote sensing data. 1 Depends on deployment scheme. 2 Due to unavailable RSD preprocessing feature. 3 Common tools allow free-form polygons only, while in GeoAnnotateAssisted, ellipses and circles are allowed. 4 In addition to the tool for manual tracking, GeoAnnotateAssisted is equipped with the optional capability of suggesting the linking between the labels in consecutive data snapshots using either a human-designed algorithm or an artificial neural network (e.g., the one we present in [80]). With colored text, we highlight the advantages of our GeoAnnotateAssisted labeling tool compared to other tools presented in this table.
Tool Requirements, FeaturesV7Super-AnnotateCVATLabelMeLabelImgImgLabGeo-Annotate-Assisted
easy to installnoyesyes/no 1 nonoyesno
can create RSD representationsnonononononoyes
RSD preprocessing is fastn/a 2 n/a 2 n/a 2 n/a 2 n/a 2 n/a 2 yes
low annotator’s computational loadn/a 2 n/a 2 n/a 2 n/a 2 n/a 2 n/a 2 yes
physics-related events representationsn/a 2 n/a 2 n/a 2 n/a 2 n/a 2 n/a 2 yes
adjustable view (zoom, pan)yesyesyesyesyesyesyes
adjustable content (channels, bands)nonononononoyes
specific label shapesno 3 no 3 no 3 no 3 no 3 no 3 yes
labels stored in geospatial formnonononononoyes
assistance or labels suggestionyes, neuralnoyes, algorithmicnononoyes, neural
tracking featureyes
(for video)
yes
(for video)
nonononoyes,
algorithmic
or neural  4
Table 3. DaMesCoS-ETR summary. Here, 1 MCC stands for mesoscale convective complex [14,88]; 2  SC stands for supercell [89,90]; 3 CS stands for meso-beta convective storms [91,92,93].
FeatureValue
MCS labels in total3785
MCS tracks in total205
Meteosat imagery snapshots containing MCS labels1759
MCS of MCC 1 type [14,88]2053
MCS of SC 2 type [89,90]328
MCS of CS 3 type [91,92,93]1404
MCS of type either cold-U/V or cold-ring [24]826
Years analyzed2012, 2014, 2015, 2016, 2017, 2018, 2019, 2020
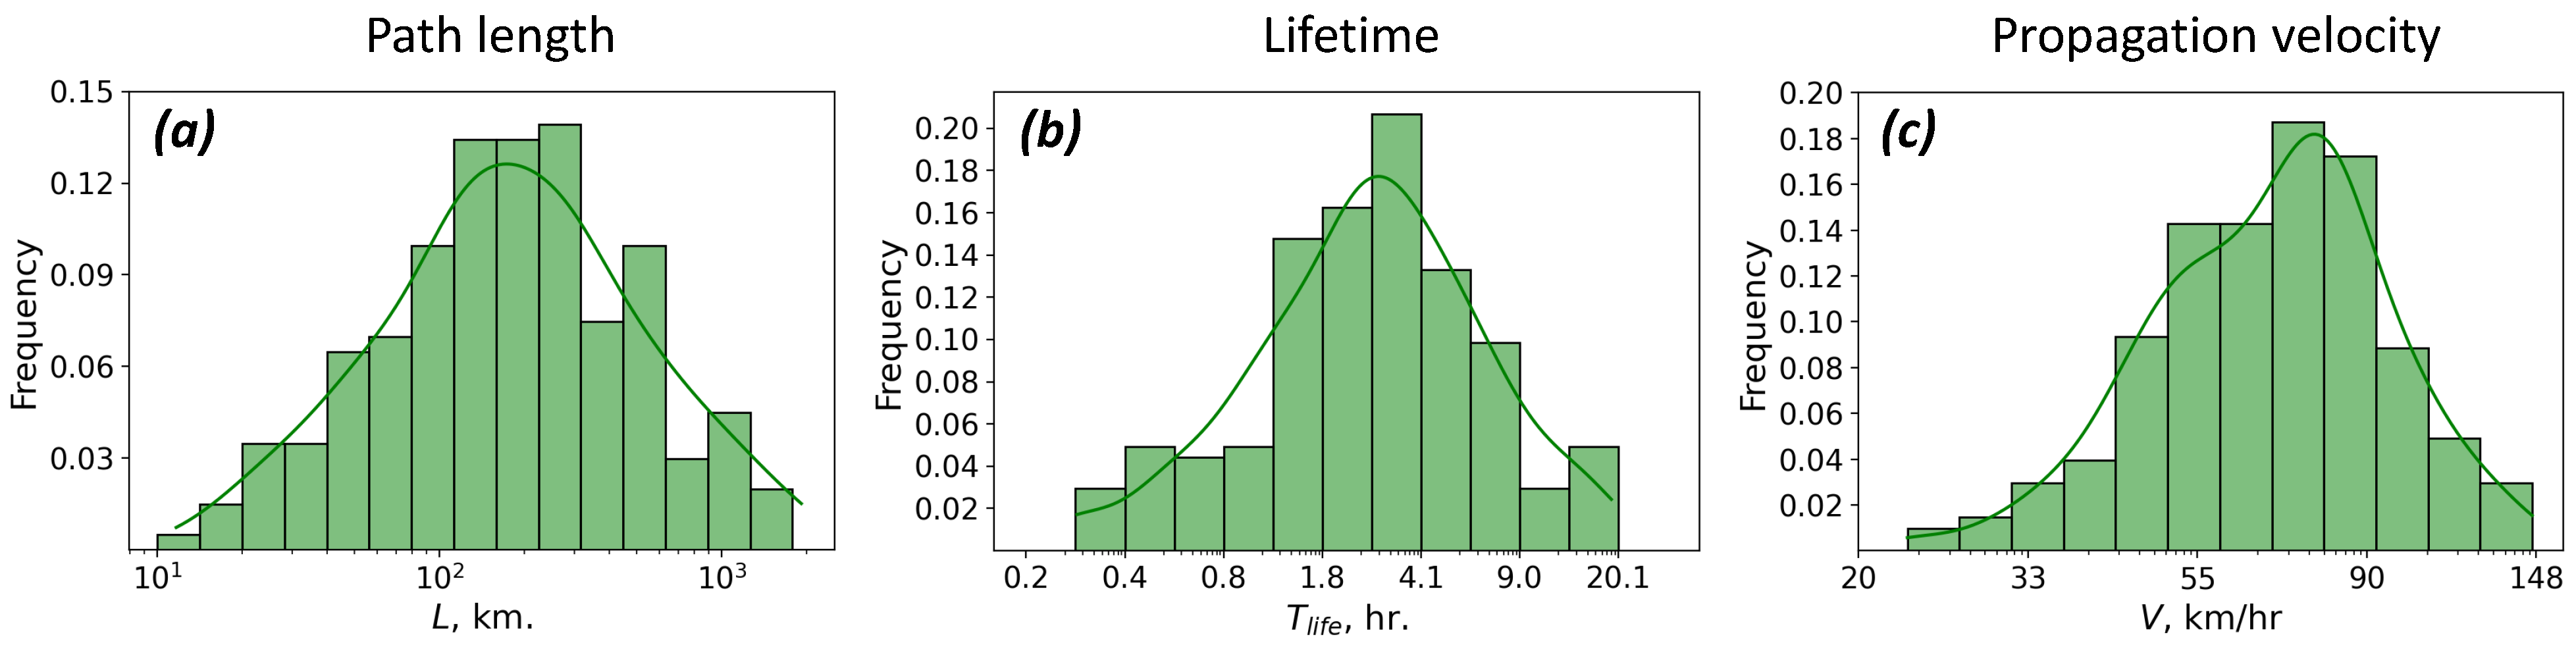
Mean, median lifetime of MCSs3.9 h, 2.75 h
Mean, median path length of MCSs300 km, 175 km.
Mean, median propagation velocity of MCSs71.4 km, 70.8 km.
Table 4. Normalizing coefficients for source data.
Feature x min x max
c h 5 205 K260 K
c h 9 200 K320 K
B T D −80 K5.5 K
Table 5. Quality metrics of MesCoSNet trained on DaMesCoS-ETR in our study.
Quality MeasureRangeInterpretationValue
True positive rate (TPR) [ 0 , 1 ] higher is better 0.61
False alarms ratio (FAR) [ 0 , 1 ] lower is better 0.36
Mean IoU [ 0 , 1 ] higher is better 0.42
Mean average precision (mAP) [ 0 , 1 ] higher is better 0.75
Disclaimer/Publisher’s Note: The statements, opinions and data contained in all publications are solely those of the individual author(s) and contributor(s) and not of MDPI and/or the editor(s). MDPI and/or the editor(s) disclaim responsibility for any injury to people or property resulting from any ideas, methods, instructions or products referred to in the content.

