Article

Triple Collocation of Ground-, Satellite- and Land Surface Model-Based Surface Soil Moisture Products in Oklahoma Part II: New Multi-Sensor Soil Moisture (MSSM) Product

1
Department of Geography and Environmental Sustainability, University of Oklahoma, Norman, OK 73019, USA
2
Department of Earth, Environmental and Resource Sciences, University of Texas, El Paso, TX 79902, USA
3
School of Civil Engineering and Environmental Science, University of Oklahoma, Norman, OK 73019, USA
*
Author to whom correspondence should be addressed.
Remote Sens. 2023, 15(13), 3450; https://doi.org/10.3390/rs15133450
Submission received: 27 December 2022 / Revised: 11 June 2023 / Accepted: 30 June 2023 / Published: 7 July 2023
(This article belongs to the Special Issue Satellite Soil Moisture Validation and Applications)

Abstract

:
This study develops a triple-collocation (TC) based, multi-source shallow-soil moisture product for Oklahoma. The method uses a least squared weights (LSW) optimization to find the set of parameters that result in the lowest root mean squared error (RMSE) with respect to the “unknown truth”. Soil moisture information from multiple sources and resolutions, including the Soil Moisture Active Passive SMAP L3_SM_P_E (9 km, daily), the physically-based, land surface model (LSM) estimates from NLDAS_NOAH0125_H (1/8°, hourly), and the Oklahoma Mesonet ground sensor network (9 km interpolated from point, 30 min) is merged into a 9 km spatial and daily temporal resolution product across the state of Oklahoma from April 2015 to July 2019. This multi-sensor surface soil moisture (MSSM) product is assessed in terms of a state-wide benchmark and previously tested, in situ-based soil moisture product and SMAP L4. Results show that: (1) independent source products have differential values according to the regional conditions they represent, including land cover type, soils, irrigation, or climate regime; (2) beyond serving as validation sets, in situ measurements are of significant value for improving the accuracy of multi-sensor soil moisture datasets through TC; and (3) state-wide RMSE values obtained with MSSM are similar to the typical measurement error found on in situ ground measurements which provides some degree of confidence on the new product. MSSM is an improvement over currently available products in Oklahoma due to its minimized uncertainty, easiness of production, and continuous temporal and geographic coverage. Nevertheless, to exploit its utility, further tests of this methodology are needed in different climates, land cover types, geographic regions, and for other independent products and spatiotemporal resolutions.

1. Introduction

Soil moisture is critical to the climate and hydrological cycle [1,2]. Its spatiotemporal variability is key for understanding and predicting climate trends [2], extreme weather [3,4], runoff and flooding [5,6], droughts [7,8,9], and landslides [10,11]. Nonetheless, soil moisture’s accurate estimation entails a profound understanding of the skills and limitations introduced by the measuring techniques and their spatiotemporal interpolations and extrapolations.
The volume of water content within the soil matrix (vadose zone) above the water table can be divided into three vertical compartments: surface soil moisture (θs, 0–10 cm depth), root-zone soil moisture (θr, 0 cm–1 m or beyond) and deeper soil moisture (θd, beyond the vegetation’s root-zone depth to the water table or bedrock). Soil evaporation and some shallow-rooted plants make use of θs. θs also participates directly in the infiltration excess mechanism and could be a good predictor of hydrological drought, convective cloud formation, and mass movements [8,9,10,11].
θs can be estimated through three primary approaches: (1) in situ measurements and their inter- (and extra-) polations, (2) remote sensing observations, and (3) Land Surface Models (LSM, which could assimilate remote sensing and in situ information). Every technique has its pros and cons in regard to spatial representativity (e.g., in situ Vs. pixel integrated), signal sensitivity to environmental conditions and wavelength (e.g., C-band, L-band, etc.), and model structural-, parameter- and forcing-related uncertainties (e.g., areal precipitation uncertainty estimation) [12,13,14,15,16,17,18,19]. Table 1 synthesizes the major pros and cons of the three methods.
In summary, each source of soil moisture estimates could be better since they inherit a series of uncertainties related to their spatial representativity and retrieval algorithm. Therefore, a natural next step is to merge independent measuring products to obtain more robust and accurate estimates that minimize individual limitations. To date, only a few efforts have tried blending multi-source data to develop an improved θs estimation. Arguably, Kalman filter-based methodologies are one of the most commonly used approaches for merging different products while considering their relative uncertainties [20]. For example, SMAP Level-4 is generated by a data assimilation system that combines L-band brightness temperatures, precipitation observations, and the NASA Catchment land surface model [21]. However, integrating independent data sources using Kalman filter-based methodologies in land data assimilation studies is difficult because the process often relies on prior knowledge of product uncertainties which is arguably subjective [22,23]. Yilmaz et al. [20] introduced an objective methodology, which is less dependent on uncertain, user-defined error assumptions for blending satellite- and model-based soil moisture products through a least squares optimization where uncertainty estimates for each product are obtained using the triple collocation method. Overall, the evident lack of successful efforts is primarily due to (1) the scale mismatch among measurements and (2) the need for long-term simultaneous measurements.
This is the second of a set of two manuscripts that aims to propose an improved, merged retrieval of θs that relies on the strengths of each individual, independent source, as suggested by the triple collocation unknown truth [19]. The overarching goals of this second manuscript are to (1) adopt an objective methodology introduced by Yilmaz et al. [20] in blending multi-source θs across a climate and vegetation gradient (i.e., state of Oklahoma, USA) and (2) evaluate the skill of this new product in terms of a well-established multi-sensor soil moisture product. Expressly, this study will adopt the TC-based LSW method to merge the Satellite SMAP_L3, Land Surface Noah Model, and the interpolated Mesonet, θs estimations across the State of Oklahoma and compare the integrated product (called Multi Sensor Surface Soil Moisture; MSSM) with another established satellite-assimilation and model-based algorithm, the NASA SMAP L4. This manuscript is organized as follows: Section 2 details the data; Section 3, the methods; Section 4 presents the results and Section 5, a discussion. Finally, Section 6 provides some conclusions.

2. Data Sources

2.1. The Oklahoma Mesonet Soil Moisture Measurements

Established in January 1994, the Oklahoma Mesonet is a multipurpose network operating more than 110 automated stations across the state of Oklahoma, USA [24,25]. Mesonet’s data is quality-assured and continuously released (real-time). At each Mesonet station, soil moisture data are collected every 30 min at four different depths (5, 25, 60, and 75 cm below the surface) [26]. Mesonet surface (0–5 cm) soil moisture measurements of 115 sites ranging from 1 April 2015 to 1 July 2019 were used in this study (see Figure 1). To guarantee spatial continuity for product merge, interpolation was conducted using ordinary Kriging, as previously suggested by [27], and then re-gridded to 9 km pixel size. The re-gridded Oklahoma Mesonet soil moisture measurements were used as an independent data source for the production of MSSM.

2.2. NLDAS-2 Noah Soil Moisture Estimations

Noah is a land surface model (LSM) of phase 2 of the North American Land Data Assimilation System (NLDAS-2), generating energy and water fluxes and state variables (e.g., soil moisture) [28] on an hourly basis at 1/8° resolution from 1979 to date. The soil water content product is released for four soil layers: 0–10, 10–40, 40–100, and 100–200 cm. Noah uses a dominant vegetation type per pixel with a varied root depth (e.g., 100 cm for grassland and 200 cm for forest and woodland). Details about the NLDAS-2 Noah LSM can be found in [29]. In this study, the hourly surface soil moisture (0–10 cm) simulations of the NLDAS-2 Noah model between 1 April 2015 and 1 July 2019 [30] were used as an independent data source for the production of MSSM.

2.3. SMAP L3 Soil Moisture Retrievals and SMAP L4 Modeled Product

The Soil Moisture Active Passive (SMAP) mission has provided global L-band brightness temperature observations and surface soil moisture retrievals since 31 March 2015 at about 40 km resolution from a 685 km, near-polar, sun-synchronous orbit [31]. The SMAP mission has generated 24 distributable data products representing four levels of data processing. In this study, the SMAP Enhanced L3 Radiometer Global Daily 9 km EASEGrid Soil Moisture, Version 3 (L3_SM_P_E; [32]) product was used, from 1 April 2015 to 1 July 2019, as a parent data source for MSSM as it satisfies the independency assumption of triple collocation analysis [33].
On the other hand, the modeled SMAP Level-4 soil moisture product, generated by a data assimilation system combining L-band brightness temperature measurements and precipitation observations with the NASA Catchment land surface model [21], is used as a quality comparison standard. While SMAP L4 provides both surface (0–5 cm) and root zone soil moisture (0–100 cm) values every three hours, on a global grid with a 9-km spacing [34], only the surface soil moisture product between the period of 1 April 2015 and 1 July 2019 was used in this study.

2.4. The Automated Soil Moisture Mapping System (RK-SM)

The fully automated soil moisture mapping system developed by Ochsner et al. [15] uses regression kriging (RK) to estimate surface soil moisture based on several data sets: (1) daily soil moisture measurements from the Oklahoma Mesonet, (2) sand content estimates from the Natural Resource Conservation Service Soil Survey Geographic Database, and a (3) antecedent precipitation computed from National Weather Service multi-sensor precipitation estimates. This mapping system provides daily, state-wide, maps of soil moisture at 5, 25, and 60 cm depths with an 800 m pixel resolution spanning from September 2015 to date, with a mean absolute error of ≤0.0576 c m 3 / c m 3 across all three depths. In this study, this RK-SM (Regression Kriging Soil Moisture) product is used as a benchmark (along with SMAP L4) to assess the performance of MSSM.

2.5. Auxiliary Data

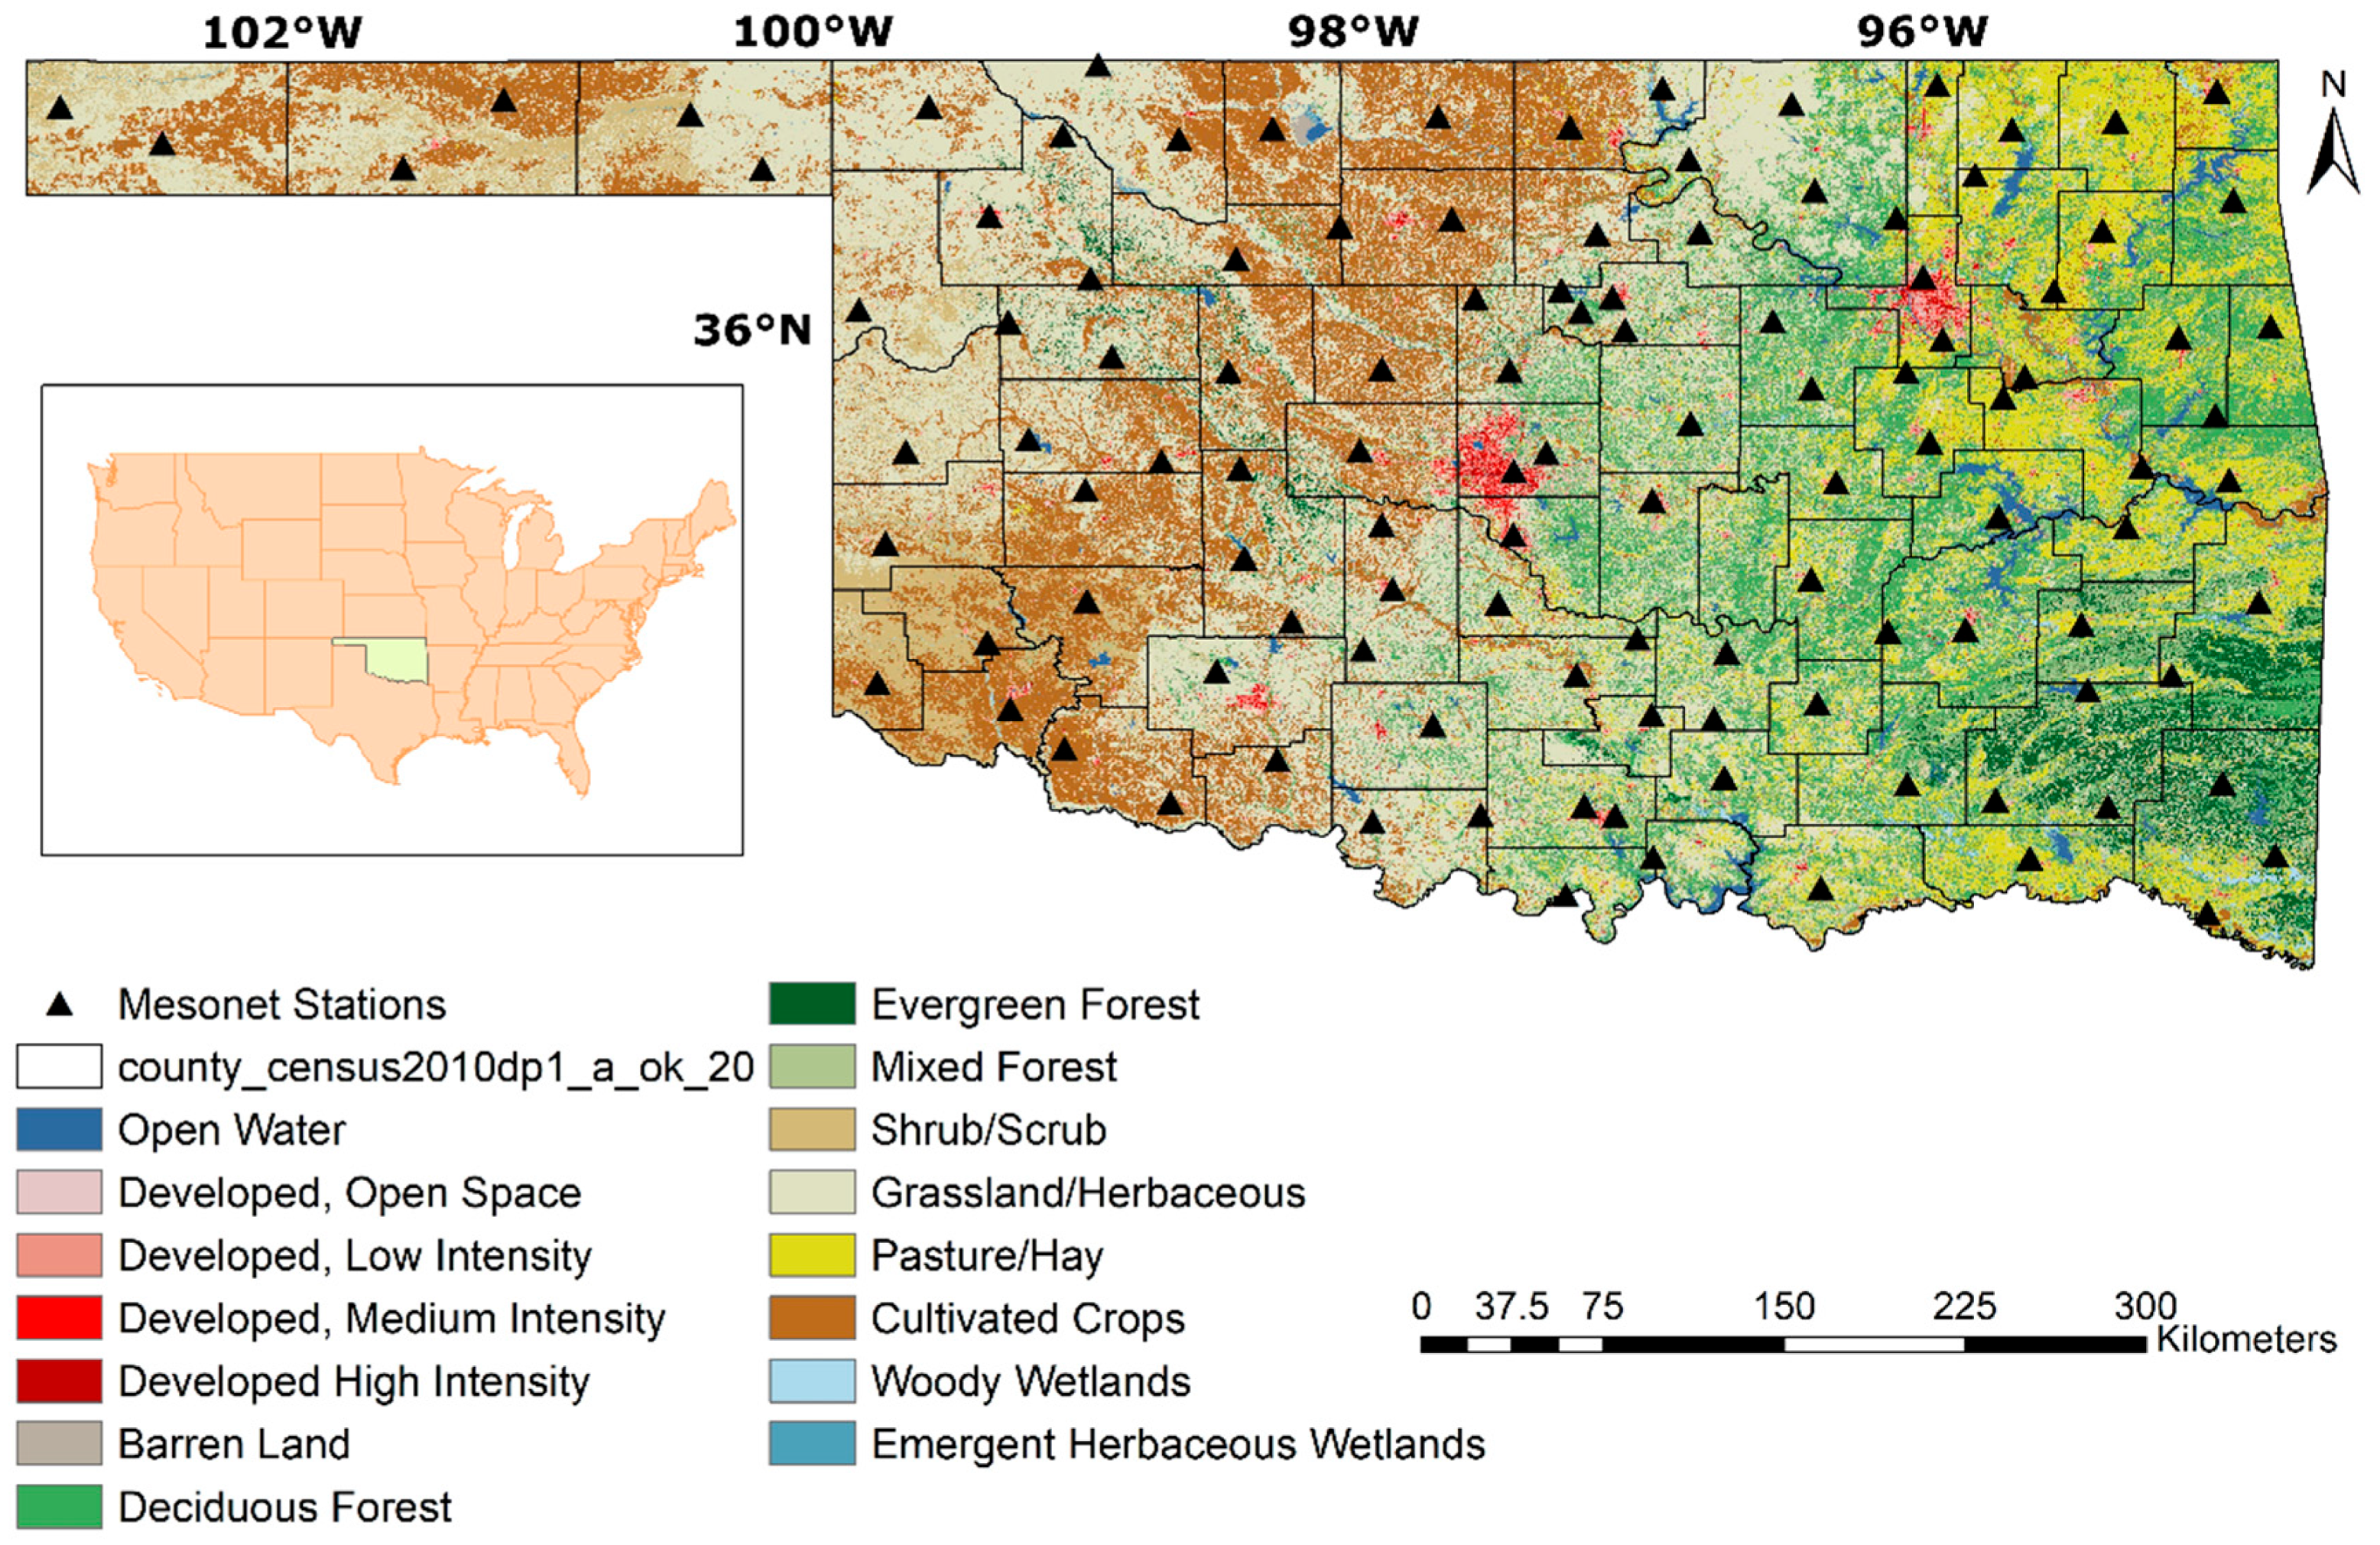
2.5.1. The 2016 National Land Cover Dataset

To provide a land surface type basis for evaluating the performance of MSSM over different land cover types, the national land cover dataset (NLCD) 2016 product was used in this study. The NLCD provides nationwide data on the continental U.S. at a 30 m resolution with a 16-class legend based on a modified Anderson Level II classification system. There are fifteen land cover types within the state of Oklahoma, as shown in Figure 1.

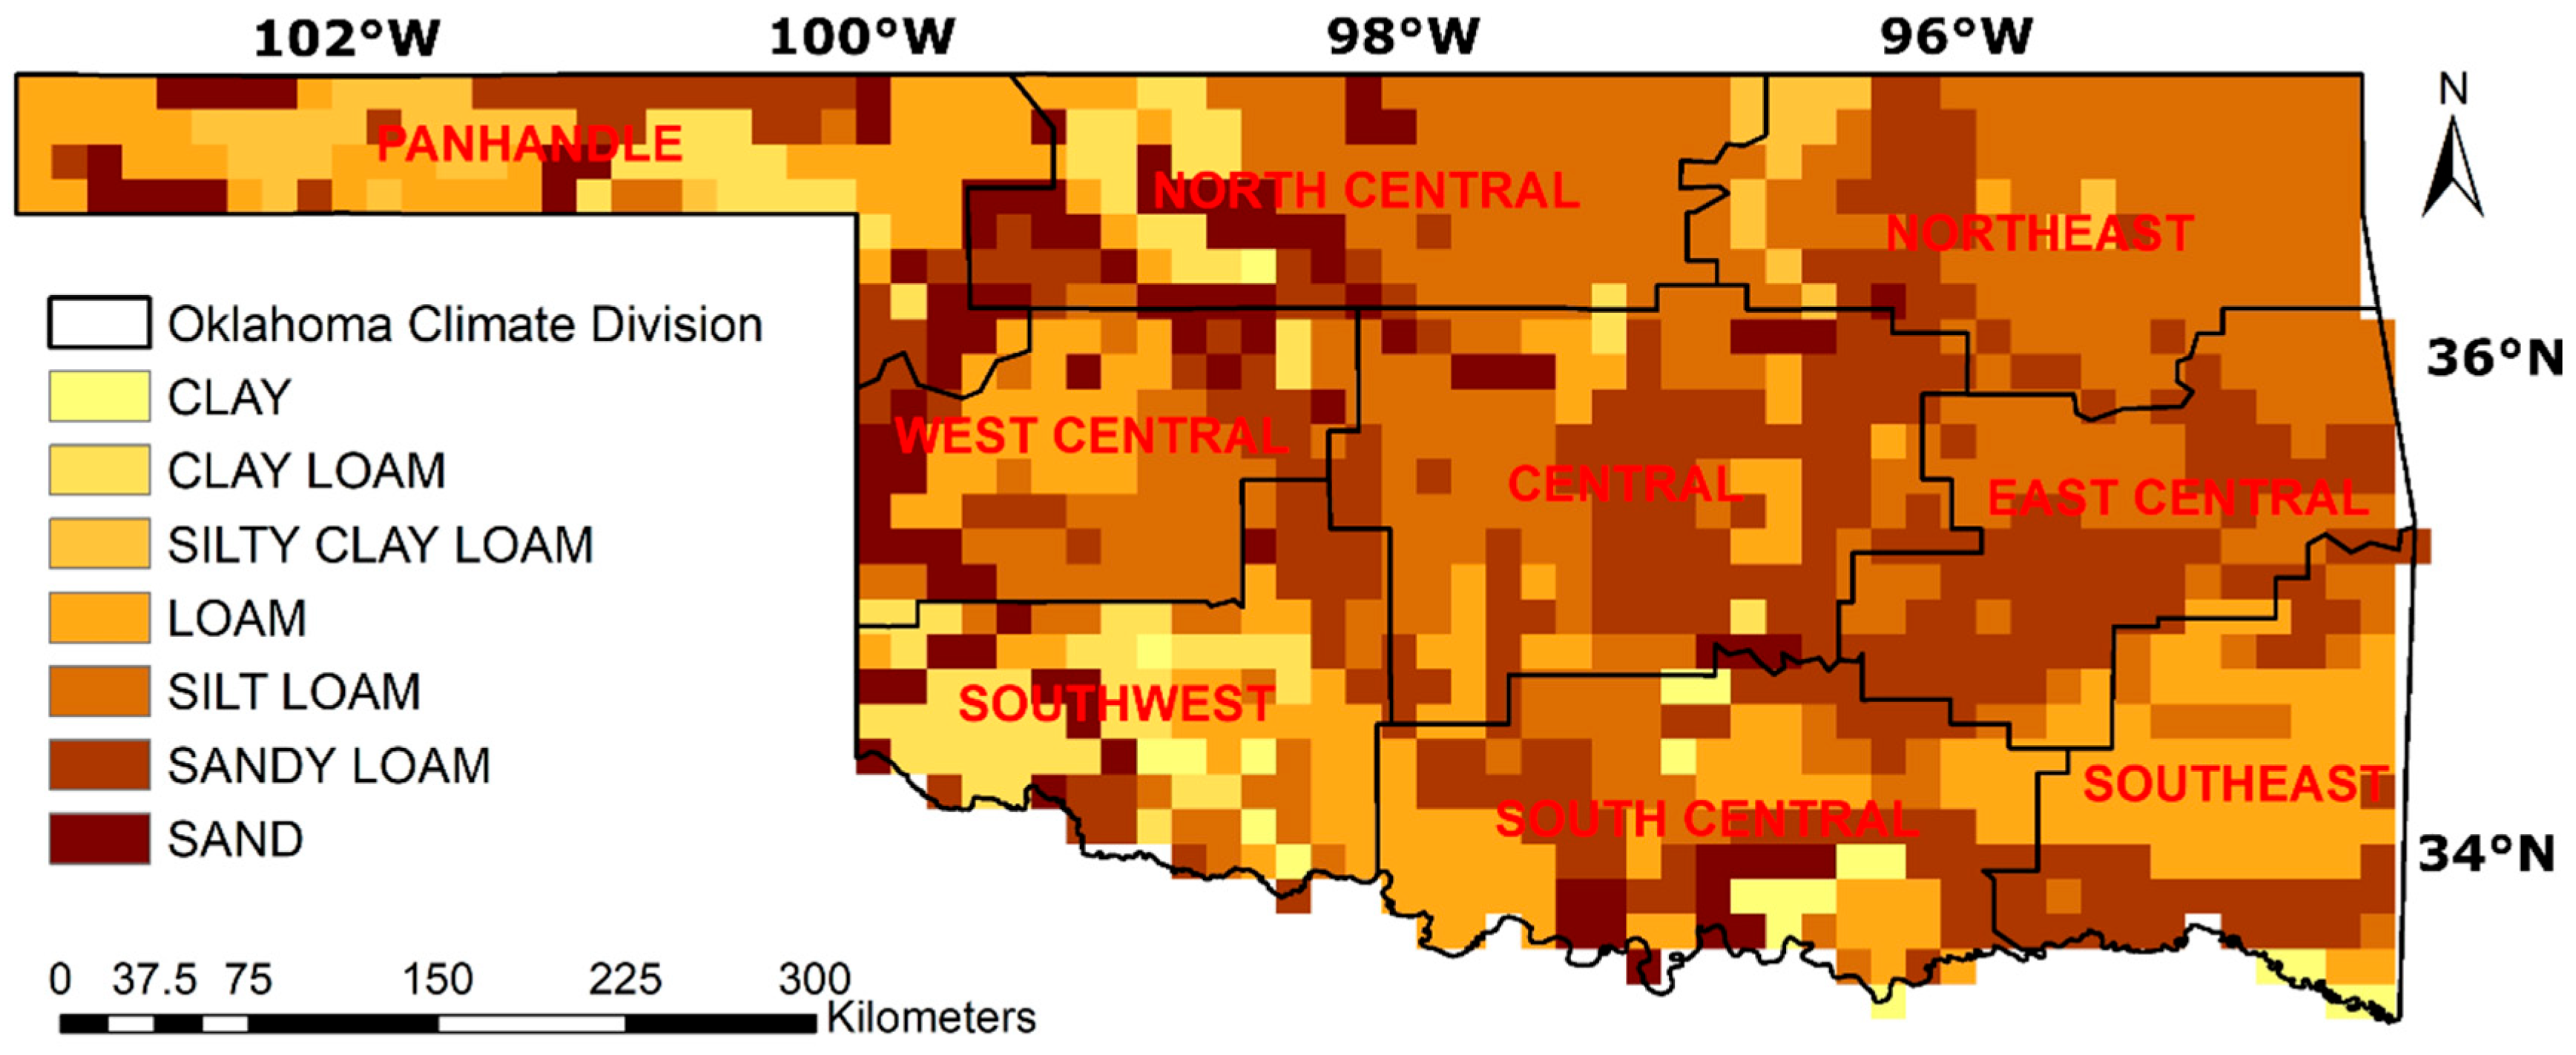
2.5.2. STATSGO Soil Texture

The performance of the MSSM was also compared over different soil textures in Oklahoma (Figure 2). The soil texture data was derived from the 1 km STATSGO database of Miller and White (1998) [35] that carries 16 texture classes by layer over 11 layers to 2 m depth. Oklahoma has seven texture classes: sand, sandy loam, silt loam, loam, silty clay loam, clay loam, and clay (Figure 2).

2.5.3. Oklahoma Climate Divisions

The performance of MSSM was also assessed over nine climate divisions in Oklahoma (Figure 2). Each climate division represents a section of the state that is considered to have distinct precipitation patterns [36,37] (see Figure 3). The division that typically receives the least amount of precipitation (504 mm/year) is the extreme northwest division (the Oklahoma panhandle). In contrast, increased precipitation is observed toward the southeast (1200 mm/year; see Figure 3) [36]. The hottest temperatures in the state usually occur in the south, with cooler conditions towards the north [37].

3. Methodology

The Triple Collocation (TC) technique is used to estimate the error variances of parent products, including the re-gridded Oklahoma Mesonet soil moisture measurements (Mesonet), the soil moisture simulations of NLDAS-2 Noah model (Noah), and the SMAP Level-3 soil moisture product (SMAP L3). Equal weight (EW) and Least square weighting (LSW) are used to optimize the merger of these products. The following subsections provide details on the merging strategy.

3.1. Triple Collocation

TC is a method for estimating the random error variances of three spatially and temporally collocated measurement systems of the same geophysical variable without treating any one system as a perfectly observed “truth” [33]. The method follows these assumptions: (1) linearity between the actual soil moisture signal and the observations, (2) signal and error stationarity, i.e., their mean values and variances are assumed to remain constant over time, (3) error orthogonality, i.e., the errors are independent of the true soil moisture signal, (4) the errors of three independent products should be independent or unrelated which means they must have a zero cross-correlation, and (5) the expectation of error is treated as zero. Even though some studies indicate that some assumptions are not always met, no proposed alternatives showed an enhanced accuracy or reliability of the error estimates [38].
Triplets of measurements θ s x , θ s y and θ s z represent the surface soil moisture values retrieved by the three independent sources (e.g., Mesonet, Noah, and SMAP L3) across the state of Oklahoma at local 6 am and 6 pm time for every day of SMAP L3 overpasses. Such triplets were used in the TC framework. Annual cycle value standardization or trend removal was not conducted across the datasets. The difference between the climatology of the three data sets used in TC will lead to the violation of signal stationarity. However, adaptations proposed by some studies, through removing the climatology of each data set individually, were also susceptible to estimation errors of the new climatologies [14,38,39]. Additionally, the error stationarity of large data sets covering several years limits the representativeness of the estimated average random error variance for subset periods, such as within different seasons. Therefore, Lowe and Schlenz [40] proposed a dynamic approach by applying the TC analysis within 30-day windows. However, the extremely low sampling density in the time window led to very low precision estimates. Therefore, the TC analysis in our study relies on annual error variance estimates based on a large sampling density. Yilmaz and Crow [41] conducted experiments on the TC errors due to the relevance of three products, and the results revealed that the more independent the products are, the less TC-induced error there will be. The three selected soil products for this study, ground-based (Mesonet), model-based (Noah), and satellite-based (SMAP L3), all meet the above criteria [19,42]. For further details on the mathematical framework of the TC method, including the use of correlation coefficient, please refer to [20,43,44,45].

3.2. Equal and Least Square Weighting

Weighting is a commonly used method for blending different data sources. Regarding soil moisture, several authors have proposed using a weight system to increase or reduce value where and when appropriate [20,46,47,48]. Within the TC structure, we adopted Equation (1).
θ M S S M = w x θ s x + w y θ s y + w z θ s z
where θMSSM is the new, merged product, w x , w y , and w z with w x + w y + w z = 1 are the relative weights of three parent datasets θ s x , θ s y and θ s z , respectively. The weights of the parent products are inversely proportional to their error variances [20]. Equal weights (EW), although not ideal, provide a point of comparison for the performance of the triple collocation when all three independent products are equally valued. On the other hand, least square weighting (LSW) is targeted to minimize a cost function and its partial derivatives with respect to w x , w y , and w z . Thus, the optimal estimation of the weights is obtained from the following:
w x = σ y 2 σ z 2 σ x 2 σ y 2 + σ x 2 σ z 2 + σ y 2 σ z 2
w y = σ x 2 σ z 2 σ x 2 σ y 2 + σ x 2 σ z 2 + σ y 2 σ z 2
w z = σ x 2 σ y 2 σ x 2 σ y 2 + σ x 2 σ z 2 + σ y 2 σ z 2
where σ x 2 , σ y 2 , and σ z 2 are the TC-estimated error variances for the parent datasets.

3.3. MSSM Product Assessment

The spatial distribution of period-integrated (1 April 2015 to 1 July 2019) Pearson correlation coefficient (ρ), root mean square error (RMSE), and additive bias between each of the daily blend products (EW-MSSM, LSW-MSSM), and the additional independent daily SMAP_L4, with respect to the benchmark daily RK-SM product, are computed and displayed. Comparisons are also disaggregated by vegetation and soil types and state climate zone. In addition to the multi-year statistical validation scores, a daily time series product inter-comparison of one sample month is also presented to visually assess all products’ performance during rainy and non-rainy days.

4. Results

4.1. LSW Weight Optimization

The LSW scheme is adopted along with the TC-estimated error variances to calculate the weights for the SMAP L3, Noah, and Mesonet independent triplets during the 1 April 2015–1 July 2019 study period. Figure 4 illustrates the regional, multi-annual distribution of such weights for the best fit. Overall, Noah leads the contribution, followed by Mesonet and SMAP L3. Noah presents the highest pixel weights regionally with a state average of 0.56, followed by Mesonet (0.28) and SMAP L3 (0.16). Spatially, the largest weights for Noah are clustered over Eastern Oklahoma, while the smallest appear in the West (Figure 4b). Contrastingly, the highest weights for Mesonet are concentrated in the Panhandle, West Central, and southwest regions (Figure 4a). Lastly, the highest weights for SMAP L3 occur in areas where both Noah and Mesonet result in poorer performance, such as over the Panhandle and West (Figure 4c).

4.2. State-Level Assessment of MSSM

Figure 5 (column 1) provides a quantitative evaluation of LSW-MSSM when using RK-SM as a benchmark for daily soil moisture estimations across Oklahoma. For purposes of comparison, EW-MSSM and SMAP L4’s performance has been added to the Figure (Columns 2 and 3). Statistical scores include the Pearson correlation coefficient (ρ), Root Mean Square Error (RMSE), and additive bias (Bias).
Overall, LSW-MSSM presents the highest spatially averaged ρ values (with RK-SM) with a state average of 0.87, followed by EW-MSSM with a ρ = 0.82 and SMAP L4 with ρ = 0.76. Based on a one-way ANOVA test, all three products have significantly (p < 0.05) different ρ values. The highest values (ρ > 0.9) for LSW-MSSM are concentrated in the West Central, Southwest, and Northeastern Oklahoma regions. In terms of the RMSE, LSW-MSSM presents the lowest mean RMSE value (0.060 cm3/cm3), followed by EW-MSSM (0.063 cm3/cm3) and SMAP L4 (0.084 cm3/cm3). Based on a one-way ANOVA test, all three products have significantly (p < 0.05) different RMSE values. Spatially, the lowest RMSE (<0.05 cm3/cm3) for LSW-MSSM are clustered over eastern Oklahoma, while the highest (>0.07 cm3/cm3) occur in western Oklahoma. Finally, the Bias estimator shows both LSW- and EW-MSSM having positive spatially averaged values (0.05 cm3/cm3 and 0.03 cm3/cm3, respectively), while SMAP L4 with a negative averaged bias value (−0.138 cm3/cm3). Spatially, both LSW-MSSM and EW-MSSM show high positive biases in the Panhandle region.

4.3. MSSM Performance by Land Cover Type

Figure 6 provides box and whisker diagrams of (a) ρ, (b) RMSE, and (c) bias, integrated across the nine dominant land cover types for LSW-MSSM, EW-MSSM, and SMAP L4 daily soil moisture estimations from 1 April 2015 to 1 July 2019 by using RK-SM as a benchmark. Results are analyzed by assessment score.
In terms of ρ, LSW-MSSM shows the highest values over all land cover types, followed by EW-LSM and SMAP L4. Interquartile ranges show similar widths across products and land cover types. In terms of RMSE, LSW-MSSM displays the lowest values over all land cover types except for mixed forest, where both LSW and EW present similar values. SMAP L4 results in the highest RMSEs overall land cover types. Overall, the interquartile ranges of SMAP L4 look two to three times larger than LSW-MSSM or EW-MSSM. Finally, regarding the bias, both LSW and EW show near-zero but positive mean values across all land cover types. SMAP L4 consistently shows negative mean biases in most land cover types except in mixed and evergreen forests. In these two land cover types, SMAP L4 also has large interquartile ranges (−0.10 to 0.40 and −0.25 to 0.40) for the bias.

4.4. MSSM Performance by Soil Texture Type

Figure 7 illustrates box and whisker diagrams of (a) ρ, (b) RMSE, and (c) bias, integrated across the seven dominant soil texture types for LSW-MSSM, EW-MSSM, and SMAP L4 daily soil moisture estimations from 1 April 2015 to 1 July 2019 by using RK-SM as a benchmark. In terms of ρ, LSW-MSSM shows the highest values over all soil types, followed by EW-LSM and SMAP L4. On Sandy soil type, both LSW-MSSM and EW-MSSM show similar mean and interquartile range values for ρ. In terms of RMSE, LSW-MSSM displays the lowest values over all land cover types except for sand and clay soils, where both LSW and EW share similar values (0.06 vs. 0.065, 0.063 vs. 0.0625). SMAP L4 results on the highest RMSEs with the highest inter-quartile ranges over all land cover types. Finally, regarding the bias, both LSW and EW show near-zero but positive mean values, except for the sand soil type, where the values tend to be negative. SMAP L4 shows a large negative mean bias in most soil types except clay. In clay soil type, all three products show positive mean bias.

4.5. MSSM Performance by Climate Zone

Figure 8 provides box and whisker diagrams of (a) ρ, (b) RMSE, and (c) bias, integrated across the nine Oklahoma state climate divisions for LSW-MSSM, EW-MSSM, and SMAP L4 for daily soil moisture measurements between 1 April 2015 and 1 July 2019 by using RK-SM as a benchmark. In terms of ρ, LSW-MSSM attains the highest values overall climate divisions, followed by EW-MSSM and SMAP L4, which provide lower values except for the Panhandle, where EW-MSSM and SMAP L4 reach similar mean ρ values. Regarding RMSE, LSW-MSSM shows the lowest RMSE in Panhandle, West Central, and Southwest zones (driest regions, see Figure 3). Across the other six climate divisions, LSW-MSSM and EW-MSSM achieve similar RMSE values. SMAP L4 consistently shows the highest mean and interquartile range RMSE values over all nine climate divisions. Finally, regarding the bias, both LSW-MSSM and EW-MSSM obtained positive mean biases in all nine climate divisions. SMAP L4 presents negative mean biases in most climate divisions except in the Southeast (the most humid region, see Figure 3), where biases range from −0.35 to 0.56 with a mean value of 0.117.

4.6. Daily Time Series Intercomparison

Figure 9 displays a daily time series intercomparison of the four study products for an example period (August of 2016) intentionally selected to include several storm and inter-storm events. Precipitation (P) is obtained from point rain gauge Mesonet data and surface soil moisture ( θ s ) from the RK-SM benchmark, LSW-MSSM, EW-MSSM, and SMAP L4 at one randomly sampled pixel (9 km × 9 km) located within the Southwest climate division with clay loam soil and cultivated crop vegetation. The daily time series of Figure 8 illustrates that the patterns of the LSW-MSSM and EW-MSSM are similar, but LSW presents values closer to RK-SM, mainly when rainfall inputs occur. In general, RK-SM presents lower volumetric water content values with a monthly mean of θs_RK-SM = 0.17 cm3/cm3 compared to LSW and EW with mean values of θs_LSW-MSSM = 0.24 and θs_EW-MSSM = 0.25 cm3/cm3, respectively. The differences are more marked during the less-rainy period 1 August 2016 to 17 August 2016 when RK-SM oscillates around a mean value of θs_RK-SM = 0.14 cm3/cm3 while LSW and EW fluctuate around θs_LSW-MSSM = 0.205 cm3/cm3 and θs_EW-MSSM = 0.210 cm3/cm3. During the second half of the month, when precipitation becomes more substantial and frequent, LSW-MSSM tends to best capture the magnitude and timing of the soil moisture peak values around (θs = 0.30 cm3/cm3) and subsequent recessions. SMAP_L4, on the other hand, tends to overestimate θs during and after precipitation events and sometimes entirely misses the peak event, thus losing consistency compared to all other products. However, during inter-storm periods, SMAP_L4 values tend to be between LSW-MSSM and EW-MSSM, thus perhaps performing better than LSW and EW in this sample pixel. In general, in addition to the persistent inter-storm positive biases with RK-SM, the relatively accurate storm response in time and magnitude, including moisture raising and falling limbs, shows that LSW-MSSM is the best-performing product compared to RK-SM for this example summer month.

5. Discussion

This study merged daily time series of three independent soil moisture measurements during more than four years (years 2015–2019), including an in situ related product (Ordinary Kriging Interpolated Mesonet) that is usually considered as the ground truth, into a new, multi-sensor surface soil moisture (MSSM) retrieval suited for use in Oklahoma, United States, but potentially expandable to other regions according to an independent LSW optimization (and evaluation) following Equation (1). The selection of the three independent predictors was subject to the recommendations by Hong et al., 2022 [19] that assessed the potential benefits of blending them, thus capitalizing on their individual skills while minimizing their weaknesses. The LSW scheme minimizes the TC-estimated error variances to calculate the weights of the parent products (SMAP_L3, Noah, and the interpolated Mesonet) in an attempt to reduce the expected RMSE with the “unknown truth.” To the best of our knowledge, this is the first attempt to merge three independent products into a new multi-sensor retrieval across the state of Oklahoma beyond the use of each product independently. Recently, some multi-model (i.e., SWAP, Noah-LSM, and CLM) simulations and optimization schemes (GA, SCE-UA, IA) were applied to a watershed within the state (the little Washita watershed in Oklahoma) [49], and a synergistic use of Sentinel imagery was used to retrieve a 1-km resolution product using artificial neural networks across the world [50]. Nonetheless, none of these two recent efforts (1) tested the validity of their results across the entire state of Oklahoma, (2) combined different retrievals using TC in the manner proposed in this study, and (3) included Mesonet point measurements as part of a Multi-Sensor Product.”
Our results show that the highest weights of each product are clustered in different regions of the state. This reflects that, of the three, there is not a single “superior” product across the state and that rather partial contributions of the three parents make up a better representation of the “unknown truth.” In particular, the largest weights for Noah are clustered in eastern Oklahoma, for Mesonet are in the Panhandle, West Central, and Southwest, while for SMAP L3 are in sub-regions of the Panhandle and East where both Noah and Mesonet obtain relatively small weights. This suggests that each product, individually, might not be able to represent the true soil moisture distribution due to the limitations inherent to each measurement type that either favor or deter from correctly reproducing the actual, intra-pixel moisture distribution. For example, the Oklahoma Mesonet site standards require the monitoring sites to be far away from urban landscapes, irrigation, forest, bare soil, fast-growing vegetation, and large bodies of water to minimize those influences [24,25]. Thus, these land cover types are not well represented from the measurements of this network. The results shown in Figure 4 and Figure 5 confirm our hypothesis that merging independent products from multiple sources (satellite, model, and in situ) is meaningful to obtaining an appropriate pixel-level estimate.
In this study, the TC-merged product LSW-MSSM that optimizes the regional distribution of weights (Equation (1)) to obtain the minimum RMSE with the “unknown truth” was also compared with an equal weighting (EW-MSSM) blend and SMAP L4 to assess model-generated products fairly. Since all three (LSW-MSSM, EW-MSSM, and SMAP L4) are model-generated, the point-to-state interpolated RK-SM product [15] was selected as a reference benchmark due to the robustness of the multi-physics regression method that accounts for the main drivers of the soil moisture variable. By including soil textural and precipitation into a regression kriging framework, RK-SM seems to provide previously undetectable mesoscale soil moisture dynamics in Oklahoma and has been recognized as a benchmark product by several studies since 2019 [51,52,53]. Overall, and consistently across land cover types, soil textures, and climates, the LSW-MSSM shows both the highest spatially integrated correlation but the lowest RMSE and near-zero bias values with respect to the RK-SM benchmark at the daily scale during the study period. However, EW-MSSM has similar values in some regions where the weights of the three products are alike, while SMAP L4 resulted in the lowest correlations and highest RMSE, and poorest bias values.
An objective metric to assess soil moisture products is the RMSE. The spatial distribution of values presented by LSW-MSSM with respect to RK-SM (Figure 4) ranges between 0.02 cm3/cm3 and 0.09 cm3/cm3 with an average of RMSELSW-MSSM = 0.060 cm3/cm3. To give context to this value, the inherent mean uncertainty of the 5 cm depth in situ measurements is RMSEin situ = 0.061 cm3/cm3 [15,54]. Thereby, measurement error could contribute a considerable portion of the total error in the MSSM maps. In contrast, RMSE values obtained for SMAP L4 across Oklahoma (Figure 4) range between 0.04 and 0.09 with a mean RMSESMAP L4 = 0.084 cm3/cm3, which is 38% greater than the expected measurement errors from ground stations. Likewise, a newer soil moisture product produced by merging SMAP and Sentinel-1 data had an accuracy of ubRMSE = 0.05 cm3/cm3 after biases were removed [55,56]. It is well known, however, that the removal of the biases (i.e., ubRMSE) between the test and ground truth makes ubRMSE ≤ RMSE as the score only measures the average distance between their residuals with their means and not between the two measurements directly [54]. Even like this, MSSM’s mean RMSELSW = 0.06 cm3/cm3 appears similar to the one reached by this new product. Thus, the soil moisture mapping system described here provides Oklahoma soil moisture data with comparable accuracy to that of current satellite-based soil moisture products.
An example time series of the three model-based soil moisture products (i.e., LSW-MSSM, EW-MSSM, SMAP L4, and RK-SM) reveals the expected similarities between LSW-MSSM and EW-MSSM but also the likelihood with the RK-SM benchmark during and after rainfall events. The observed differences between LSW-MSSM and RK-SM benchmark during inter-storm periods could be explained in terms of the extrapolation issues introduced by RK-SM from point to pixel-scale estimations within 9 km × 9 km heterogeneous land and soil types but also perhaps due to the uncertainties introduced by the assumptions of the TC method. Finally, the behavior of the SMAP L4 product reflects the limitations of correctly generating regional-scale estimations that consistently respond to rainfall inputs and moisture-output periods.
The results above provide a proof of concept that limitations in the correct estimation of surface soil moisture imposed by individual measuring systems can be overcome by appropriately blending those sources (i.e., with an optimal weight structure) into a statistically robust and physically feasible, and usable product. The central hypothesis of the least square weight (LSW) optimization relies on the fact that if one of the sources shows low skill in representing the consistent statistical behavior of the triplets, that source will be given a lower weight on a linear combination of the three, that is taken as representative of the “unknown truth” as provided by the triple collocation.
The TC-based automated soil moisture mapping system described here presents some significant limitations. One is the relatively coarse spatial resolution (9 km) of the retrieval that is constrained by the limited resolution of two of the source predictors (i.e., Noah and SMAP L3), but that could be improved in the future when new land surface modeling at hyper-resolution and AI-downscaled SMAP/SMOS retrievals release finer scale products. A second limitation is that the soil moisture products used in this study were all extracted from 6 am and 6 pm observations to keep consistency with SMAP L3. This constraint could result in the missing sub-daily wetting and drying dynamics of the soil that is otherwise captured by the hourly retrievals of Noah and Mesonet. Future work can adopt methods to ensure the temporal coherence of different datasets; Third, the Mesonet product used in the TC intercomparison is interpolated from point-scaled Oklahoma Mesonet to the spatial resolution of SMAP L3 using an ordinary kriging method. While Ordinary Kriging is a broadly used method for accurate interpolation of hydrometeorological variables like precipitation, future work could use regression kriging in a similar way to [15], including independent predictors such as soil properties, land cover, topography, and precipitation to increase the accuracy of the interpolated Mesonet product; Fourth, although we considered RK-SM as a comparable benchmark, this product does not account for irrigation as a predictor of soil moisture. Irrigation is an important practice in urban and suburban areas and a few counties in western Oklahoma with significant irrigated cropland areas. In these areas, LSW-MSSM could better predict surface soil moisture than RK-SM. The land cover changes (e.g., urbanization) that occurred between April 2015 and July 2019 might affect the results of this study, as shown by [57,58], as those changes translate into multi-scale variability of soil moisture, which might be differentially captured by some of the products (e.g., SMAP L3) but not by others (e.g., Mesonet). Our MSSM product evaluation was based on the 2016 NLCD land cover map without the inclusion of the 2019 version. However, a raster inspection of the observed changes between 2016 and 2019 led to the conclusion that, across the state, urban expansion occurred across less than 2% of the pixels. Other land cover changes (e.g., grassland to agricultural) did not change the dominant 9 km pixel class. As a result, the evaluation of MSSM with the 2016 land cover map is robust and applicable across the evaluation sites for the study period.
Despite these many limitations, this first-generation MSSM becomes a powerful product for use in prediction and decision-making since it combines the strengths of three independent measurements of surface soil water content, including a distance-based interpolation of measured values at Mesonet sites representative of grassland and low-density vegetation, Noah that takes into account multi-physics frameworks including soils, vegetation, precipitation, temperature and evapotranspiration and SMAP L3 that observes brightness temperatures as a proxy for water content across vast regions including those with irrigation.

6. Conclusions

This study adopted an objective methodology to blend multi-source soil moisture products in Oklahoma, identified the importance of incorporating in situ soil moisture into soil moisture blending, and quantified the impact of different weighting schemes on soil moisture blending. Soil moisture information from multiple parent sources, including satellite (SMAP_L3), land surface model (NLDAS-2 Noah), and in situ measurements (the interpolated Mesonet), were used to generate multi-sensor surface soil moisture products at a 9-km spatial and daily temporal resolution. To develop a blended soil moisture product, TC was used to estimate the error variance of the parent products and LSW. An equal weighting approach (EW-MSSM) and SMAP L4 were compared with the TC-LSW approach. The main conclusion is summarized as follows:
Based on the obtained statistical scores (e.g., ρ, RMSE, and bias) when compared with a benchmark product (RK-SM), MSSM, despite imperfect, appears to be an adequate estimator of surface soil moisture (to date) for the state of Oklahoma as it capitalizes on the individual skills of its source predictors, including the effect of non-precipitation driven moisture changes on irrigated fields captured by the brightness temperatures of SMAP L3 but also the impact of soils, vegetation, terrain and precipitation on the spatial distribution of soil moisture reflected on the multi-physics Noah product and the in situ measurements upscaled (by distance proximity) to pixel-size scale given by the measurements of Mesonet. The resulting combined soil moisture estimate of LSW-MSSM can be used as a standalone soil moisture product with available uncertainty estimates. It can be further improved when the resolution of source products is further enhanced.

Author Contributions

Conceptualization, Z.H., H.A.M. and Y.H.; Methodology, Z.H. and Z.L.; Software, Z.H. and Z.L; Formal Analysis, Z.H. and H.A.M.; Writing and Original Preparation, Z.H., H.A.M. and L.V.A.; Writing—Review and Editing, H.A.M. and L.V.A.; Visualization, Z.H. and Z.L. All authors have read and agreed to the published version of the manuscript.

Funding

This project received funding under award NA22SEC4810016 from NOAA Cooperative Science Center, Educational Partnership Program with Minority Serving Institutions (MSI) Program. The statements, findings, conclusions, and recommendations are those of the authors and do not necessarily reflect the views of NOAA.

Data Availability Statement

Data is available upon request.

Acknowledgments

This publication was supported (in part) through the NOAA Educational Partnership Program/Minority-Serving Institutions award NA22SEC4810016 Center for Earth System Sciences and Remote Sensing Technologies II. Contents are solely the responsibility of the author(s) and do not represent the official views of NOAA or the U.S. Department of Commerce.

Conflicts of Interest

The authors declare no conflict of interest.

References

  1. Dingman, S.L. Physical Hydrology, 3rd ed.; Waveland Press: Waveland, MI, USA, 2015; ISBN 978-1-4786-2807-1. [Google Scholar]
  2. Seneviratne, S.I.; Corti, T.; Davin, E.L.; Hirschi, M.; Jaeger, E.B.; Lehner, I.; Orlowsky, B.; Teuling, A.J. Investigating soil moisture—Climate interactions in a changing climate: A review. Earth-Sci. Rev. 2010, 99, 125–161. [Google Scholar] [CrossRef]
  3. Whan, K.; Zscheischler, J.; Orth, R.; Shongwe, M.; Rahimi, M.; Asare, E.O.; Seneviratne, S.I. Impact of soil moisture on extreme maximum temperatures in Europe. Weather. Clim. Extremes 2015, 9, 57–67. [Google Scholar] [CrossRef] [Green Version]
  4. Ho-Hagemann, H.T.M.; Hagemann, S.; Rockel, B. On the role of soil moisture in the generation of heavy rainfall during the Oder flood event in July 1997. Tellus A Dyn. Meteorol. Oceanogr. 2015, 67, 1. [Google Scholar] [CrossRef] [Green Version]
  5. Crow, W.T.; Bindlish, R.; Jackson, T.J. The added value of spaceborne passive microwave soil moisture retrievals for forecasting rainfall-runoff partitioning. Geophys. Res. Lett. 2005, 32, L18401. [Google Scholar] [CrossRef] [Green Version]
  6. Brocca, L.; Melone, F.; Moramarco, T.; Wagner, W.; Naeimi, V.; Bartalis, Z.; Hasenauer, S. Improving runoff prediction through the assimilation of the ASCAT soil moisture product. Hydrol. Earth Syst. Sci. 2010, 14, 1881–1893. [Google Scholar] [CrossRef] [Green Version]
  7. Mohd Kassim, M.R.; Mat, I.; Harun, A.N. Wireless Sensor Network in Precision Agriculture Application. In Proceedings of the 2014 International Conference on Computer, Information and Telecommunication Systems (CITS), Jeju Island, Republic of Korea, 7–9 July 2014; pp. 1–5. [Google Scholar]
  8. Gu, Y.; Hunt, E.; Wardlow, B.; Basara, J.B.; Brown, J.F.; Verdin, J.P. Evaluation of MODIS NDVI and NDWI for vegetation drought monitoring using Oklahoma Mesonet soil moisture data. Geophys. Res. Lett. 2008, 35, L22401. [Google Scholar] [CrossRef] [Green Version]
  9. Zhang, X.; Tang, Q.; Liu, X.; Leng, G.; Li, Z. Soil Moisture Drought Monitoring and Forecasting Using Satellite and Climate Model Data over Southwestern China. J. Hydrometeorol. 2017, 18, 5–23. [Google Scholar] [CrossRef]
  10. Brocca, L.; Ponziani, F.; Moramarco, T.; Melone, F.; Berni, N.; Wagner, W. Improving Landslide Forecasting Using ASCAT-Derived Soil Moisture Data: A Case Study of the Torgiovannetto Landslide in Central Italy. Remote Sens. 2012, 4, 1232–1244. [Google Scholar] [CrossRef] [Green Version]
  11. Ray, R.L.; Jacobs, J.M.; Cosh, M.H. Landslide susceptibility mapping using downscaled AMSR-E soil moisture: A case study from Cleveland Corral, California, US. Remote Sens. Environ. 2010, 114, 2624–2636. [Google Scholar] [CrossRef]
  12. Peng, J.; Loew, A.; Merlin, O.; Verhoest, N.E.C. A review of spatial downscaling of satellite remotely sensed soil moisture. Rev. Geophys. 2017, 55, 341–366. [Google Scholar] [CrossRef] [Green Version]
  13. Famiglietti, J.S.; Ryu, D.; Berg, A.A.; Rodell, M.; Jackson, T.J. Field observations of soil moisture variability across scales. Water Resour. Res. 2008, 44, W01423. [Google Scholar] [CrossRef] [Green Version]
  14. Crow, W.T.; Berg, A.A.; Cosh, M.H.; Loew, A.; Mohanty, B.P.; Panciera, R.; de Rosnay, P.; Ryu, D.; Walker, J.P. Upscaling sparse ground-based soil moisture observations for the validation of coarse-resolution satellite soil moisture products. Rev. Geophys. 2012, 50, RG2002. [Google Scholar] [CrossRef] [Green Version]
  15. Ochsner, T.E.; Linde, E.; Haffner, M.; Dong, J. Mesoscale Soil Moisture Patterns Revealed Using a Sparse In Situ Network and Regression Kriging. Water Resour. Res. 2019, 55, 4785–4800. [Google Scholar] [CrossRef]
  16. Qin, J.; Yang, K.; Lu, N.; Chen, Y.; Zhao, L.; Han, M. Spatial upscaling of in-situ soil moisture measurements based on MODIS-derived apparent thermal inertia. Remote Sens. Environ. 2013, 138, 1–9. [Google Scholar] [CrossRef]
  17. Wang, J.; Ge, Y.; Heuvelink, G.B.M.; Zhou, C. Upscaling In Situ Soil Moisture Observations to Pixel Averages with Spatio-Temporal Geostatistics. Remote Sens. 2015, 7, 11372–11388. [Google Scholar] [CrossRef] [Green Version]
  18. Kang, J.; Jin, R.; Li, X.; Zhang, Y. Mapping High Spatiotemporal-Resolution Soil Moisture by Upscaling Sparse Ground-Based Observations Using a Bayesian Linear Regression Method for Comparison with Microwave Remotely Sensed Soil Moisture Products. Remote Sens. 2021, 13, 228. [Google Scholar] [CrossRef]
  19. Hong, Z.; Moreno, H.A.; Li, Z.; Li, S.; Greene, J.S.; Hong, Y.; Alvarez, L.V. Triple Collocation of Ground-, Satellite- and Land Surface Model-Based Surface Soil Moisture Products in Oklahoma—Part I: Individual Product Assessment. Remote Sens. 2022, 14, 5641. [Google Scholar] [CrossRef]
  20. Yilmaz, M.T.; Crow, W.T.; Anderson, M.C.; Hain, C. An objective methodology for merging satellite- and model-based soil moisture products. Water Resour. Res. 2012, 48, W11502. [Google Scholar] [CrossRef]
  21. Reichle, R.H.; De Lannoy, G.J.M.; Liu, Q.; Ardizzone, J.V.; Colliander, A.; Conaty, A.; Crow, W.; Jackson, T.J.; Jones, L.A.; Kimball, J.S.; et al. Assessment of the SMAP Level-4 Surface and Root-Zone Soil Moisture Product Using In Situ Measurements. J. Hydrometeorol. 2017, 18, 2621–2645. [Google Scholar] [CrossRef]
  22. Crow, W.T.; Van Loon, E. Impact of Incorrect Model Error Assumptions on the Sequential Assimilation of Remotely Sensed Surface Soil Moisture. J. Hydrometeorol. 2006, 7, 421–432. [Google Scholar] [CrossRef]
  23. Reichle, R.H.; Crow, W.; Keppenne, C.L. An adaptive ensemble Kalman filter for soil moisture data assimilation. Water Resour. Res. 2008, 44, W03423. [Google Scholar] [CrossRef]
  24. Brock, F.V.; Crawford, K.C.; Elliott, R.L.; Cuperus, G.W.; Stadler, S.J.; Johnson, H.L.; Eilts, M.D. The Oklahoma Mesonet: A Technical Overview. J. Atmos. Ocean. Technol. 1995, 12, 5–19. [Google Scholar] [CrossRef]
  25. McPherson, R.A.; Fiebrich, C.A.; Crawford, K.C.; Kilby, J.R.; Grimsley, D.L.; Martinez, J.E.; Basara, J.B.; Illston, B.G.; Morris, D.A.; Kloesel, K.A.; et al. Statewide Monitoring of the Mesoscale Environment: A Technical Update on the Oklahoma Mesonet. J. Atmos. Ocean. Technol. 2007, 24, 301–321. [Google Scholar] [CrossRef] [Green Version]
  26. Illston, B.G.; Basara, J.B.; Fiebrich, C.A.; Crawford, K.C.; Hunt, E.; Fisher, D.K.; Elliott, R.; Humes, K. Mesoscale Monitoring of Soil Moisture across a Statewide Network. J. Atmos. Ocean. Technol. 2008, 25, 167–182. [Google Scholar] [CrossRef]
  27. Lakhankar, T.; Jones, A.S.; Combs, C.L.; Sengupta, M.; Vonder Haar, T.H.; Khanbilvardi, R. Analysis of Large Scale Spatial Variability of Soil Moisture Using a Geostatistical Method. Sensors 2010, 10, 913–932. [Google Scholar] [CrossRef] [PubMed] [Green Version]
  28. Xia, Y.; Sheffield, J.; Ek, M.B.; Dong, J.; Chaney, N.; Wei, H.; Meng, J.; Wood, E.F. Evaluation of multi-model simulated soil moisture in NLDAS-2. J. Hydrol. 2014, 512, 107–125. [Google Scholar] [CrossRef]
  29. Xia, Y.; Mitchell, K.; Ek, M.; Sheffield, J.; Cosgrove, B.; Wood, E.; Luo, L.; Alonge, C.; Wei, H.; Meng, J. Continental-scale Water and Energy Flux Analysis and Validation for the North American Land Data Assimilation System Project Phase 2 (NLDAS-2): Intercomparison and Application of Model Products. J. Geophys. Res. Atmos. 2012, 117, D03109. [Google Scholar] [CrossRef]
  30. GES DISC Dataset: NLDAS Noah Land Surface Model L4 Monthly Climatology 0.125 × 0.125 Degree V002 (NLDAS_NOAH0125_MC 002). Available online: https://disc.gsfc.nasa.gov/datasets/NLDAS_NOAH0125_MC_002/summary (accessed on 20 April 2020).
  31. Entekhabi, D.; Njoku, E.G.; O’Neill, P.E.; Kellogg, K.H.; Crow, W.T.; Edelstein, W.N.; Entin, J.K.; Goodman, S.D.; Jackson, T.J.; Johnson, J.; et al. The Soil Moisture Active Passive (SMAP) Mission. Proc. IEEE 2010, 98, 704–716. [Google Scholar] [CrossRef]
  32. ONeill, P.E.; Chan, S.; Njoku, E.G.; Jackson, T.; Bindlish, R. SMAP Enhanced L3 Radiometer Global Daily 9 Km EASE-Grid Soil Moisture, Version 3 2019. Available online: https://nsidc.org/sites/default/files/spl3smp_e-v004-userguide.pdf (accessed on 20 April 2020).
  33. Stoffelen, A. Toward the true near-surface wind speed: Error modeling and calibration using triple collocation. J. Geophys. Res. Oceans 1998, 103, 7755–7766. [Google Scholar] [CrossRef]
  34. Reichle, R.; De Lannoy, G.; Koster, R.; Crow, W.; Kimball, J.; Liu, Q. SMAP L4 Global 3-Hourly 9 Km EASE-Grid Surface and Root Zone Soil Moisture Geophysical Data, Version 5 2020. Available online: https://nsidc.org/sites/default/files/multi_spl4smau-v005-userguide_1.pdf. (accessed on 20 April 2020).
  35. Miller, D.A.; White, R.A. A Conterminous United States Multi-Layer Soil Characteristics Data Set for Regional Climate and Hydrology Modeling, Earth Interactions. Web-Based Publ. Res 1998, 2, 711–724. [Google Scholar]
  36. Guttman, N.B.; Quayle, R.G. A Historical Perspective of U.S. Climate Divisions. Bull. Am. Meteorol. Soc. 1996, 77, 293–304. [Google Scholar] [CrossRef]
  37. Illston, B.G.; Basara, J.B.; Crawford, K.C. Seasonal to Interannual Variations of Soil Moisture Measured in Oklahoma. Int. J. Climatol. A J. R. Meteorol. Soc. 2004, 24, 1883–1896. [Google Scholar] [CrossRef]
  38. Gruber, A.; Su, C.-H.; Zwieback, S.; Crow, W.; Dorigo, W.; Wagner, W. Recent Advances in (Soil Moisture) Triple Collocation Analysis. Int. J. Appl. Earth Obs. Geoinf. 2016, 45, 200–211. [Google Scholar] [CrossRef]
  39. Draper, C.; Reichle, R.; de Jeu, R.; Naeimi, V.; Parinussa, R.; Wagner, W. Estimating root mean square errors in remotely sensed soil moisture over continental scale domains. Remote Sens. Environ. 2013, 137, 288–298. [Google Scholar] [CrossRef] [Green Version]
  40. Loew, A.; Schlenz, F. A dynamic approach for evaluating coarse scale satellite soil moisture products. Hydrol. Earth Syst. Sci. 2011, 15, 75–90. [Google Scholar] [CrossRef] [Green Version]
  41. Yilmaz, M.T.; Crow, W.T. Evaluation of Assumptions in Soil Moisture Triple Collocation Analysis. J. Hydrometeorol. 2014, 15, 1293–1302. [Google Scholar] [CrossRef]
  42. Li, C.; Tang, G.; Hong, Y. Cross-evaluation of ground-based, multi-satellite and reanalysis precipitation products: Applicability of the Triple Collocation method across Mainland China. J. Hydrol. 2018, 562, 71–83. [Google Scholar] [CrossRef]
  43. Scipal, K.; Holmes, T.; de Jeu, R.; Naeimi, V.; Wagner, W. A possible solution for the problem of estimating the error structure of global soil moisture data sets. Geophys. Res. Lett. 2008, 35. [Google Scholar] [CrossRef] [Green Version]
  44. Zwieback, S.; Scipal, K.; Dorigo, W.; Wagner, W. Structural and statistical properties of the collocation technique for error characterization. Nonlinear Process. Geophys. 2012, 19, 69–80. [Google Scholar] [CrossRef]
  45. McColl, K.A.; Vogelzang, J.; Konings, A.G.; Entekhabi, D.; Piles, M.; Stoffelen, A. Extended triple collocation: Estimating errors and correlation coefficients with respect to an unknown target. Geophys. Res. Lett. 2014, 41, 6229–6236. [Google Scholar] [CrossRef] [Green Version]
  46. Zeng, Y.; Su, Z.; van der Velde, R.; Wang, L.; Xu, K.; Wang, X.; Wen, J. Blending Satellite Observed, Model Simulated, and in Situ Measured Soil Moisture over Tibetan Plateau. Remote Sens. 2016, 8, 268. [Google Scholar] [CrossRef] [Green Version]
  47. Gruber, A.; Scanlon, T.; van der Schalie, R.; Wagner, W.; Dorigo, W. Evolution of the ESA CCI Soil Moisture climate data records and their underlying merging methodology. Earth Syst. Sci. Data 2019, 11, 717–739. [Google Scholar] [CrossRef] [Green Version]
  48. Zhang, N.; Quiring, S.M.; Ford, T.W. Blending Noah, SMOS and In-Situ Soil Moisture Using Multiple Weighting and Sampling Schemes. J. Hydrometeorol. 2021, 22, 1835–1854. [Google Scholar] [CrossRef]
  49. Shin, Y.; Mohanty, B.P.; Kim, J.; Lee, T. Multi-model based soil moisture simulation approach under contrasting weather conditions. J. Hydrol. 2023, 617, 129112. [Google Scholar] [CrossRef]
  50. Madelon, R.; Rodriguez-Fernandez, N.; Bazzi, H.; Badhdadi, N.; Albergel, C.; Dorigo, W.; Zribi, M. Hydrology and Earth System. Sciences 2023, 27, 6. [Google Scholar]
  51. Chakraborty, D.; Başağaoğlu, H.; Alian, S.; Mirchi, A.; Moriasi, D.; Starks, P.; Verser, J. Multiscale extrapolative learning algorithm for predictive soil moisture modeling & applications. Expert Syst. Appl. 2023, 213, 119056. [Google Scholar] [CrossRef]
  52. Sharma, S.; Carlson, J.D.; Krueger, E.S.; Engle, D.M.; Twidwell, D.; Fuhlendorf, S.D.; Patrignani, A.; Feng, L.; Ochsner, T.E. Soil moisture as an indicator of growing-season herbaceous fuel moisture and curing rate in grasslands. Int. J. Wildland Fire 2021, 30, 57–69. [Google Scholar] [CrossRef]
  53. Ramsauer, T.; Weiß, T.; Löw, A.; Marzahn, P. RADOLAN_API: An Hourly Soil Moisture Data Set Based on Weather Radar, Soil Properties and Reanalysis Temperature Data. Remote Sens. 2021, 13, 1712. [Google Scholar] [CrossRef]
  54. Scott, B.L.; Ochsner, T.E.; Illston, B.G.; Fiebrich, C.A.; Basara, J.B.; Sutherland, A.J. New Soil Property Database Improves Oklahoma Mesonet Soil Moisture Estimates. J. Atmos. Ocean. Technol. 2013, 30, 2585–2595. [Google Scholar] [CrossRef]
  55. Das, N.N.; Entekhabi, D.; Kim, S.; Jagdhuber, T.; Dunbar, S.; Yuehl, S.; O’Neill, P.E.; Colliander, A.; Walker, J.; Jackson, T.J. High Resolution Soil Moisture Product Based on Smap Active-Passive Approach Using Copernicus Sentinel 1 Data. In Proceedings of the IGARSS 2018—2018 IEEE International Geoscience and Remote Sensing Symposium, Valencia, Spain, 22–27 July 2018. [Google Scholar]
  56. Entekhabi, D.; Reichle, R.H.; Koster, R.D.; Crow, W.T. Performance Metrics for Soil Moisture Retrievals and Application Requirements. J. Hydrometeorol. 2010, 11, 832–840. [Google Scholar] [CrossRef]
  57. Jiang, Y.; Fu, P.; Weng, Q. Assessing the Impacts of Urbanization-Associated Land Use/Cover Change on Land Surface Temperature and Surface Moisture: A Case Study in the Midwestern United States. Remote Sens. 2015, 7, 4880–4898. [Google Scholar] [CrossRef] [Green Version]
  58. Shen, X.; Liu, B.; Jiang, M.; Lu, X. Marshland Loss Warms Local Land Surface Temperature in China. Geophys. Res. Lett. 2020, 47, e2020GL087648. [Google Scholar] [CrossRef] [Green Version]
Figure 1. The distribution of in situ soil moisture stations from the Oklahoma Mesonet on a National Land Cover Dataset (NLCD) land cover type (for 2016) map. For product evaluation of the newly created MSSM product, this map is re-gridded to a 9 km pixel resolution by using the majority of land cover types within each pixel.
Remotesensing 15 03450 g001
Figure 2. Oklahoma climate divisions and the 1 km STATSGO database derived soil texture classes. Data has been re-gridded to our 9 km grid for easy implementation and comparison.
Remotesensing 15 03450 g002
Figure 3. Total annual precipitation across the nine Oklahoma climate divisions of Figure 2. Data were obtained from GPM IMERG from 2000 to 2020. Note the evident gradient from west (semi-arid) to east (sub-humid).
Remotesensing 15 03450 g003
Figure 4. Oklahoma state-level distribution of MSSM blend weights (w) by using an LSW approach based on the TC-estimated error variances of each parent product of θs (a) Mesonet, (b) Noah, (c) SMAP L3. The weights were temporally averaged using daily data from 1 April 2015 to 1 July 2019.
Remotesensing 15 03450 g004
Figure 5. Spatial evaluation of the daily blend products for θs from LSW-MSSM (first column), EW-MSSM (second column), and SMAP L4 (third column) using the RK-SM as a benchmark for the period 1 April 2015 to 1 July 2019. (a) ρ (first row), (b) RMSE (second row), and (c) Bias (third row).
Remotesensing 15 03450 g005
Figure 6. Box and whisker diagrams of (a) ρ, (b) RMSE [cm3 cm−3], and (c) bias [cm3 cm−3], integrated across the dominant Oklahoma state land cover types for LSW-MSSM, EW-MSSM, and SMAP L4 daily surface soil moisture (θs) measurements between 1 April 2015 and 1 July 2019 using RK-SM as a benchmark.
Remotesensing 15 03450 g006
Figure 7. Box and whisker diagrams of (a) ρ, (b) RMSE [cm3 cm−3], and (c) bias [cm3 cm−3], integrated across the dominant Oklahoma state soil texture types for LSW-MSSM, EW-MSSM, and SMAP L4 daily soil moisture (θs) measurements between 1 April 2015 and 1 July 2019 using RK-SM as a benchmark.
Remotesensing 15 03450 g007
Figure 8. Box and whisker diagrams of (a) ρ, (b) RMSE [cm3 cm−3], and (c) bias [cm3 cm−3], integrated across the nine Oklahoma state climate divisions for LSW-MSSM, EW-MSSM, and SMAP L4 daily soil moisture (θs) measurements between 1 April 2015 and 1 July 2019 using RK-SM as a benchmark.
Remotesensing 15 03450 g008
Figure 9. Daily precipitation (P, in; right axis) and surface soil moisture (θs cm3/cm3; left axis) time series from RK-SM (yellow line), LSW-MSSM (blue line), EW-MSSM (orange line) and SMAP L4 (green line) for one example pixel (9 km × 9 km) location with coordinates (lat = 34.938°N, lon = −99.063°W) corresponding to clay loam soil (Figure 2), cultivated crops (Figure 1) within the Southwest climate region of Oklahoma (Figure 2).
Remotesensing 15 03450 g009
Table 1. Pros and cons comparison of three primary surface soil moisture measurement approaches.
ApproachProsCons
In situ
  • Near-true, point- to plot-scale retrievals
  • Installed sensors provide continuous time series at sub-hourly steps.
  • Sensors usually span multiple depths (beyond the surface).
  • Relatively simple sensor calibration.
  • Campaign-based measurements are site-adaptive with a flexible sub-pixel spatial distribution.
  • Large gaps in space that might not reflect pixel-scale averages.
  • Limited site accessibility and coverage.
  • Costly operation and maintenance.
Satellite Remote Sensing
  • Multi-spectral (microwave, thermal, visible) sensing.
  • Global coverage (unlimited spatial accessibility).
  • Low cost to the general public.
  • Limited (i.e., low) pixel resolution (usually tens of km).
  • Swath scans leave large geographical gaps.
  • Low revisit frequencies.
  • Raw spectral signals need to be post-processed or corrected.
Aircraft-, UAS- or Ground-based Remote Sensing
  • High spatial, usually sub-meter, resolution.
  • Rapid soil moisture assessment over a landscape scene.
  • Spatial coverage is usually limited to a sub-region, smaller than a country or state.
  • Raw spectral signals need to be post-processed or corrected.
  • Highly complex and expensive missions.
  • Extremely low revisit frequencies.
Land Surface Models
  • Model outputs are usually time-continuous.
  • Multiple depths (beyond the surface).
  • Continental-scale spatial coverage.
  • Limited (i.e., low) pixel resolution (usually 1 to 10 km).
  • Model parameter, structural and forcing-related uncertainties.
Disclaimer/Publisher’s Note: The statements, opinions and data contained in all publications are solely those of the individual author(s) and contributor(s) and not of MDPI and/or the editor(s). MDPI and/or the editor(s) disclaim responsibility for any injury to people or property resulting from any ideas, methods, instructions or products referred to in the content.

