


Unveiling Air Pollution in Crimean Mountain Rivers: Analysis of Sentinel-5 Satellite Images Using Google Earth Engine (GEE)


Abstract
:1. Introduction
2. Materials and Methods
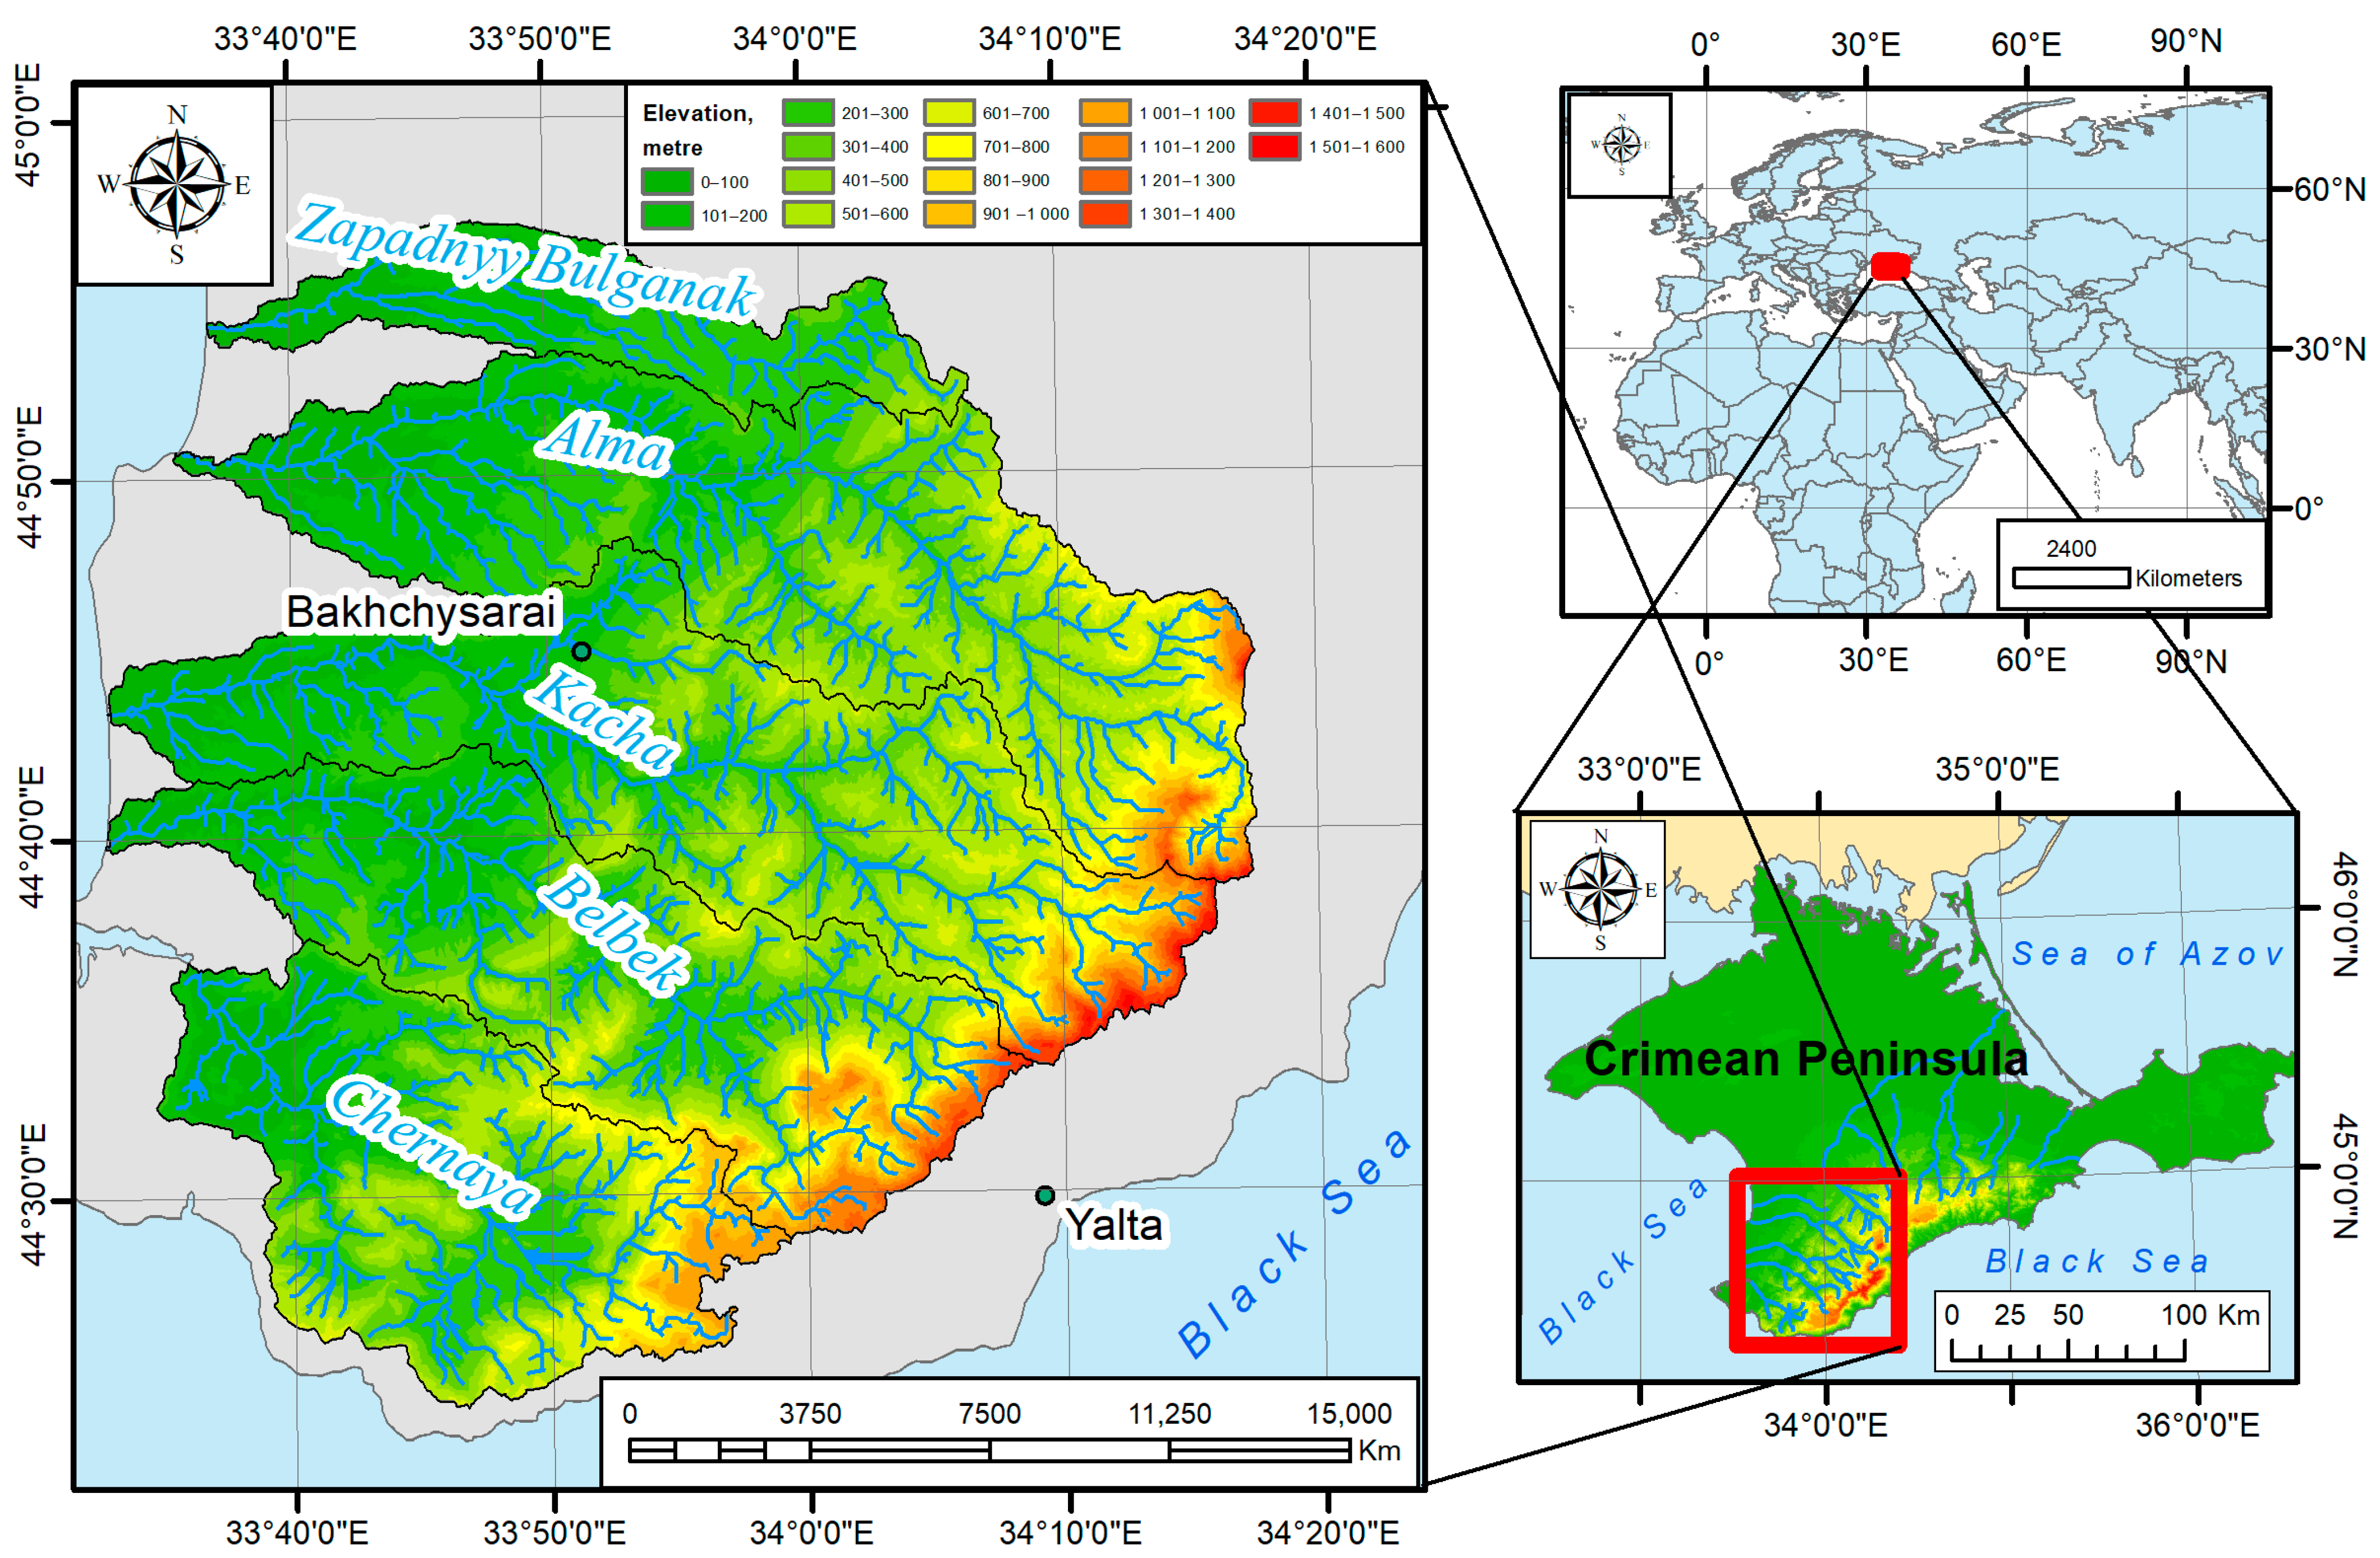
2.1. Study Area
2.2. Methods
3. Results
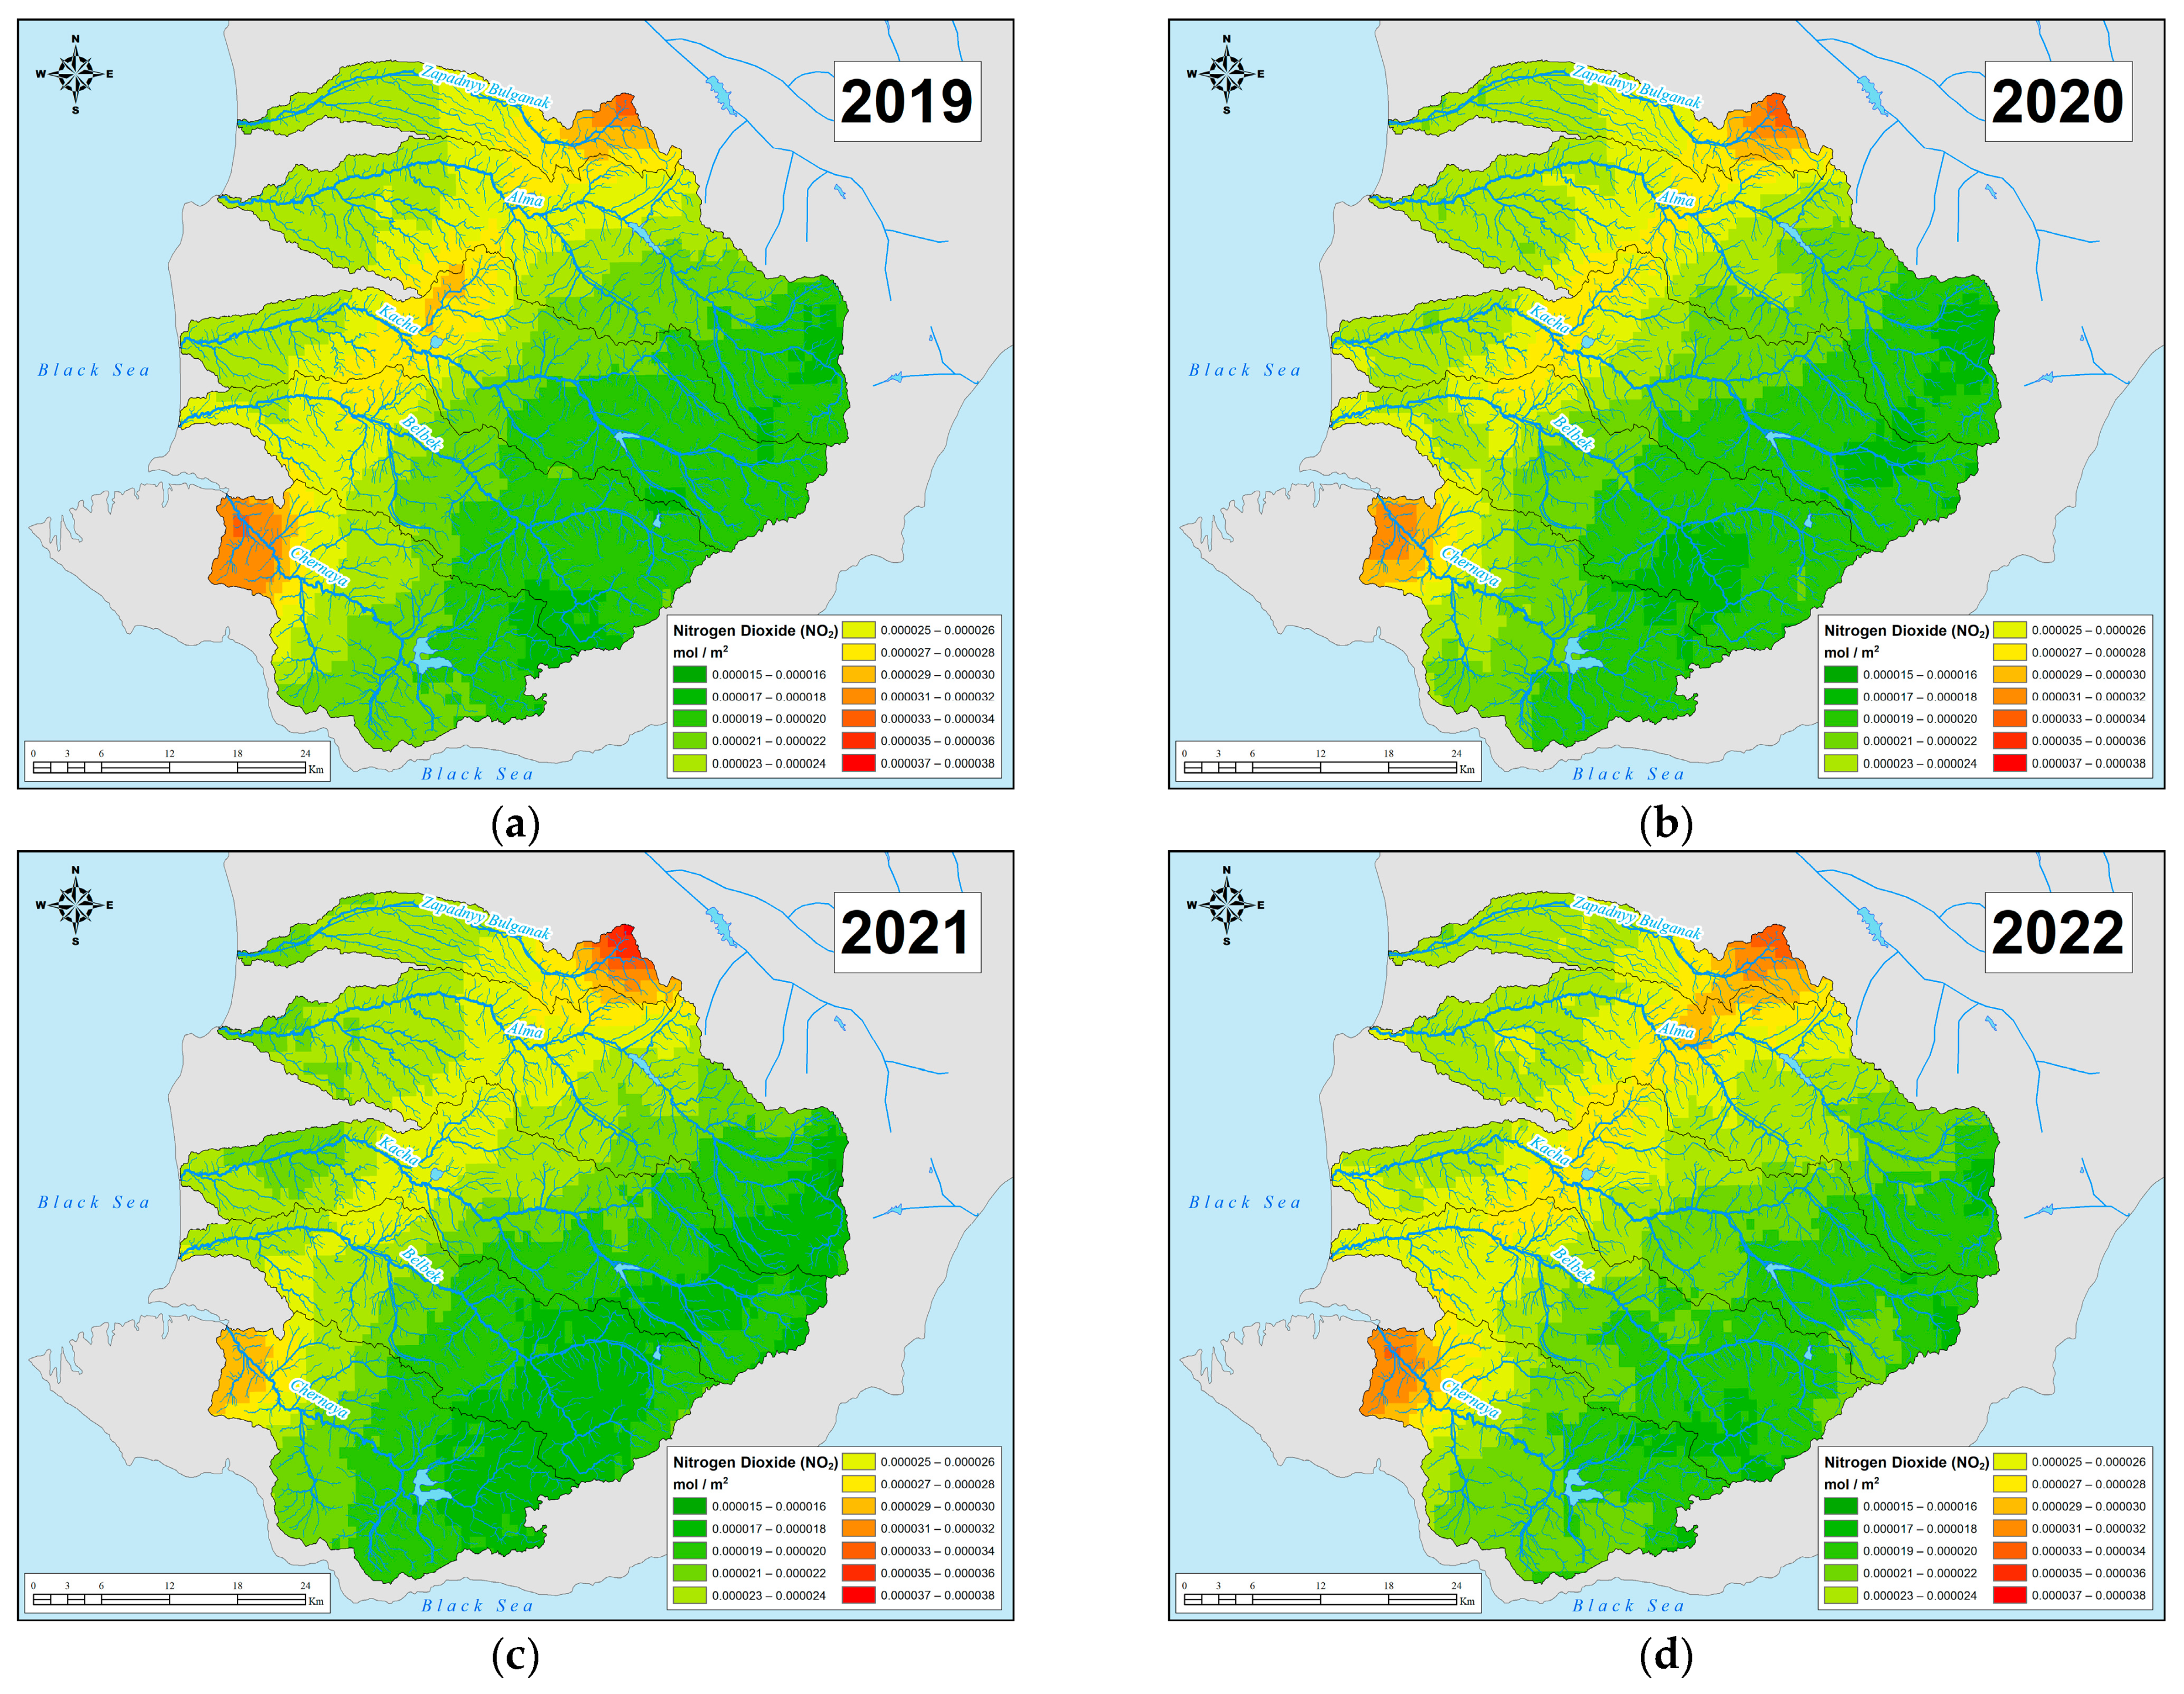
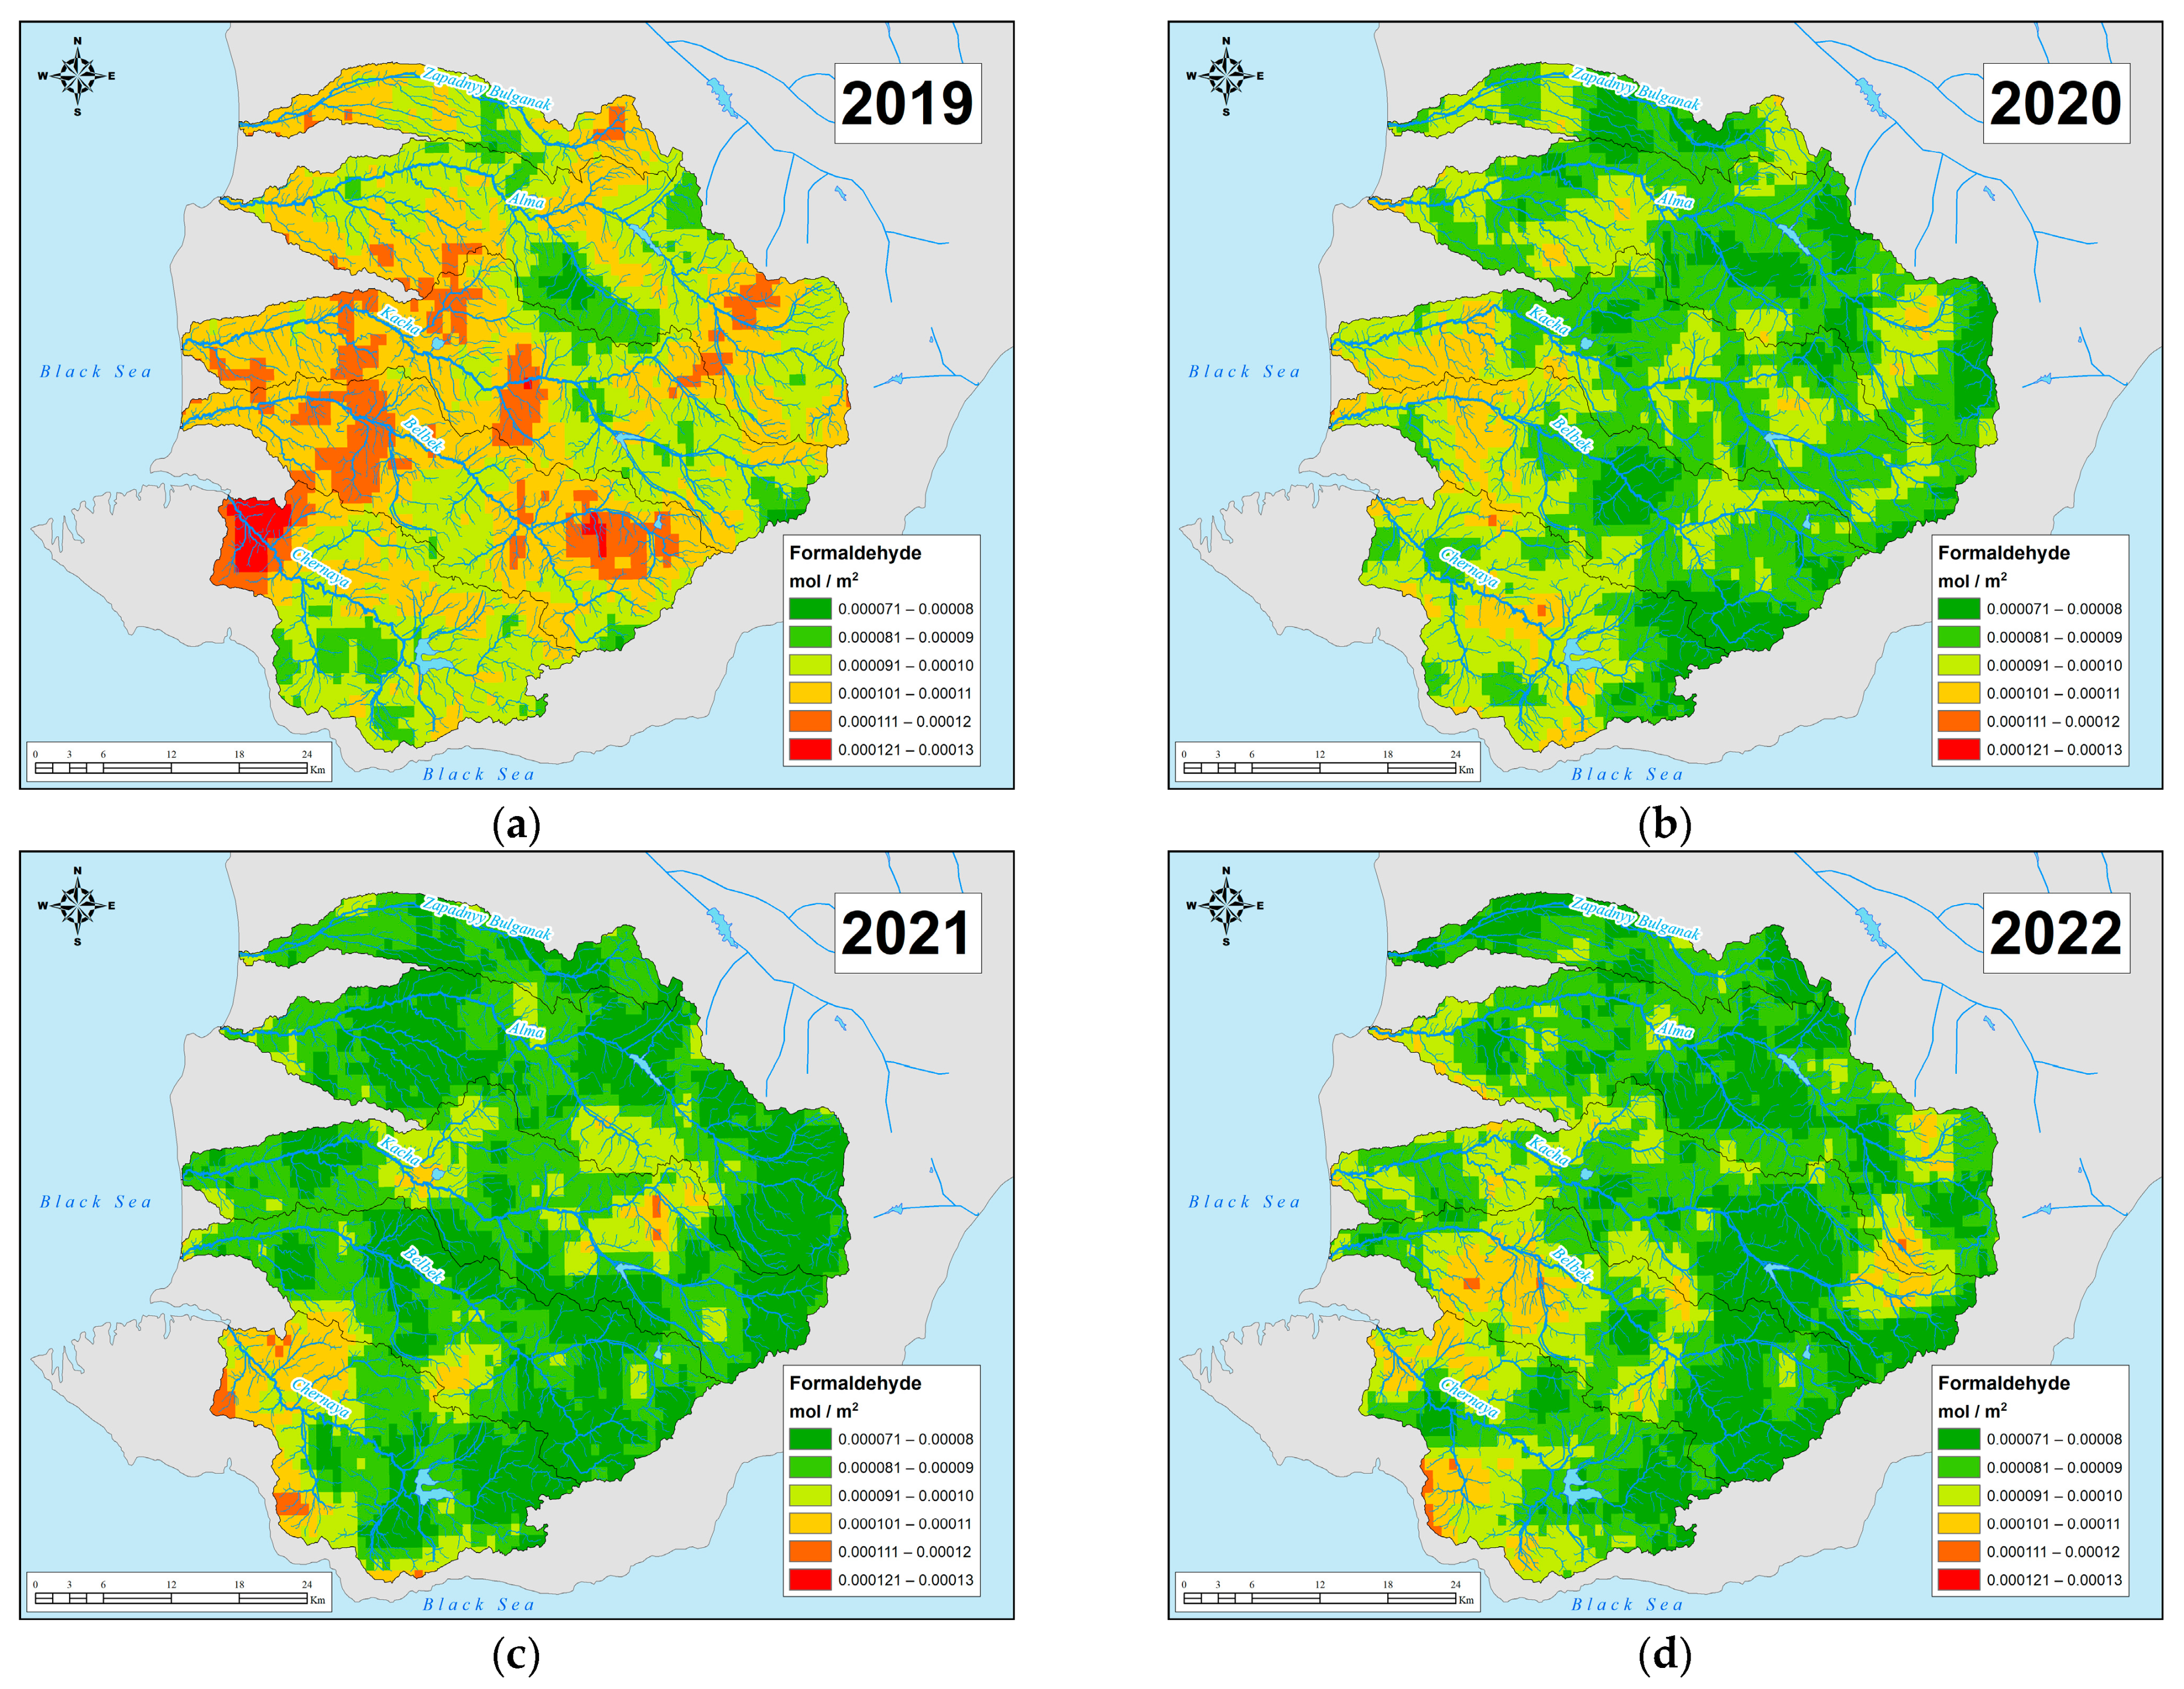
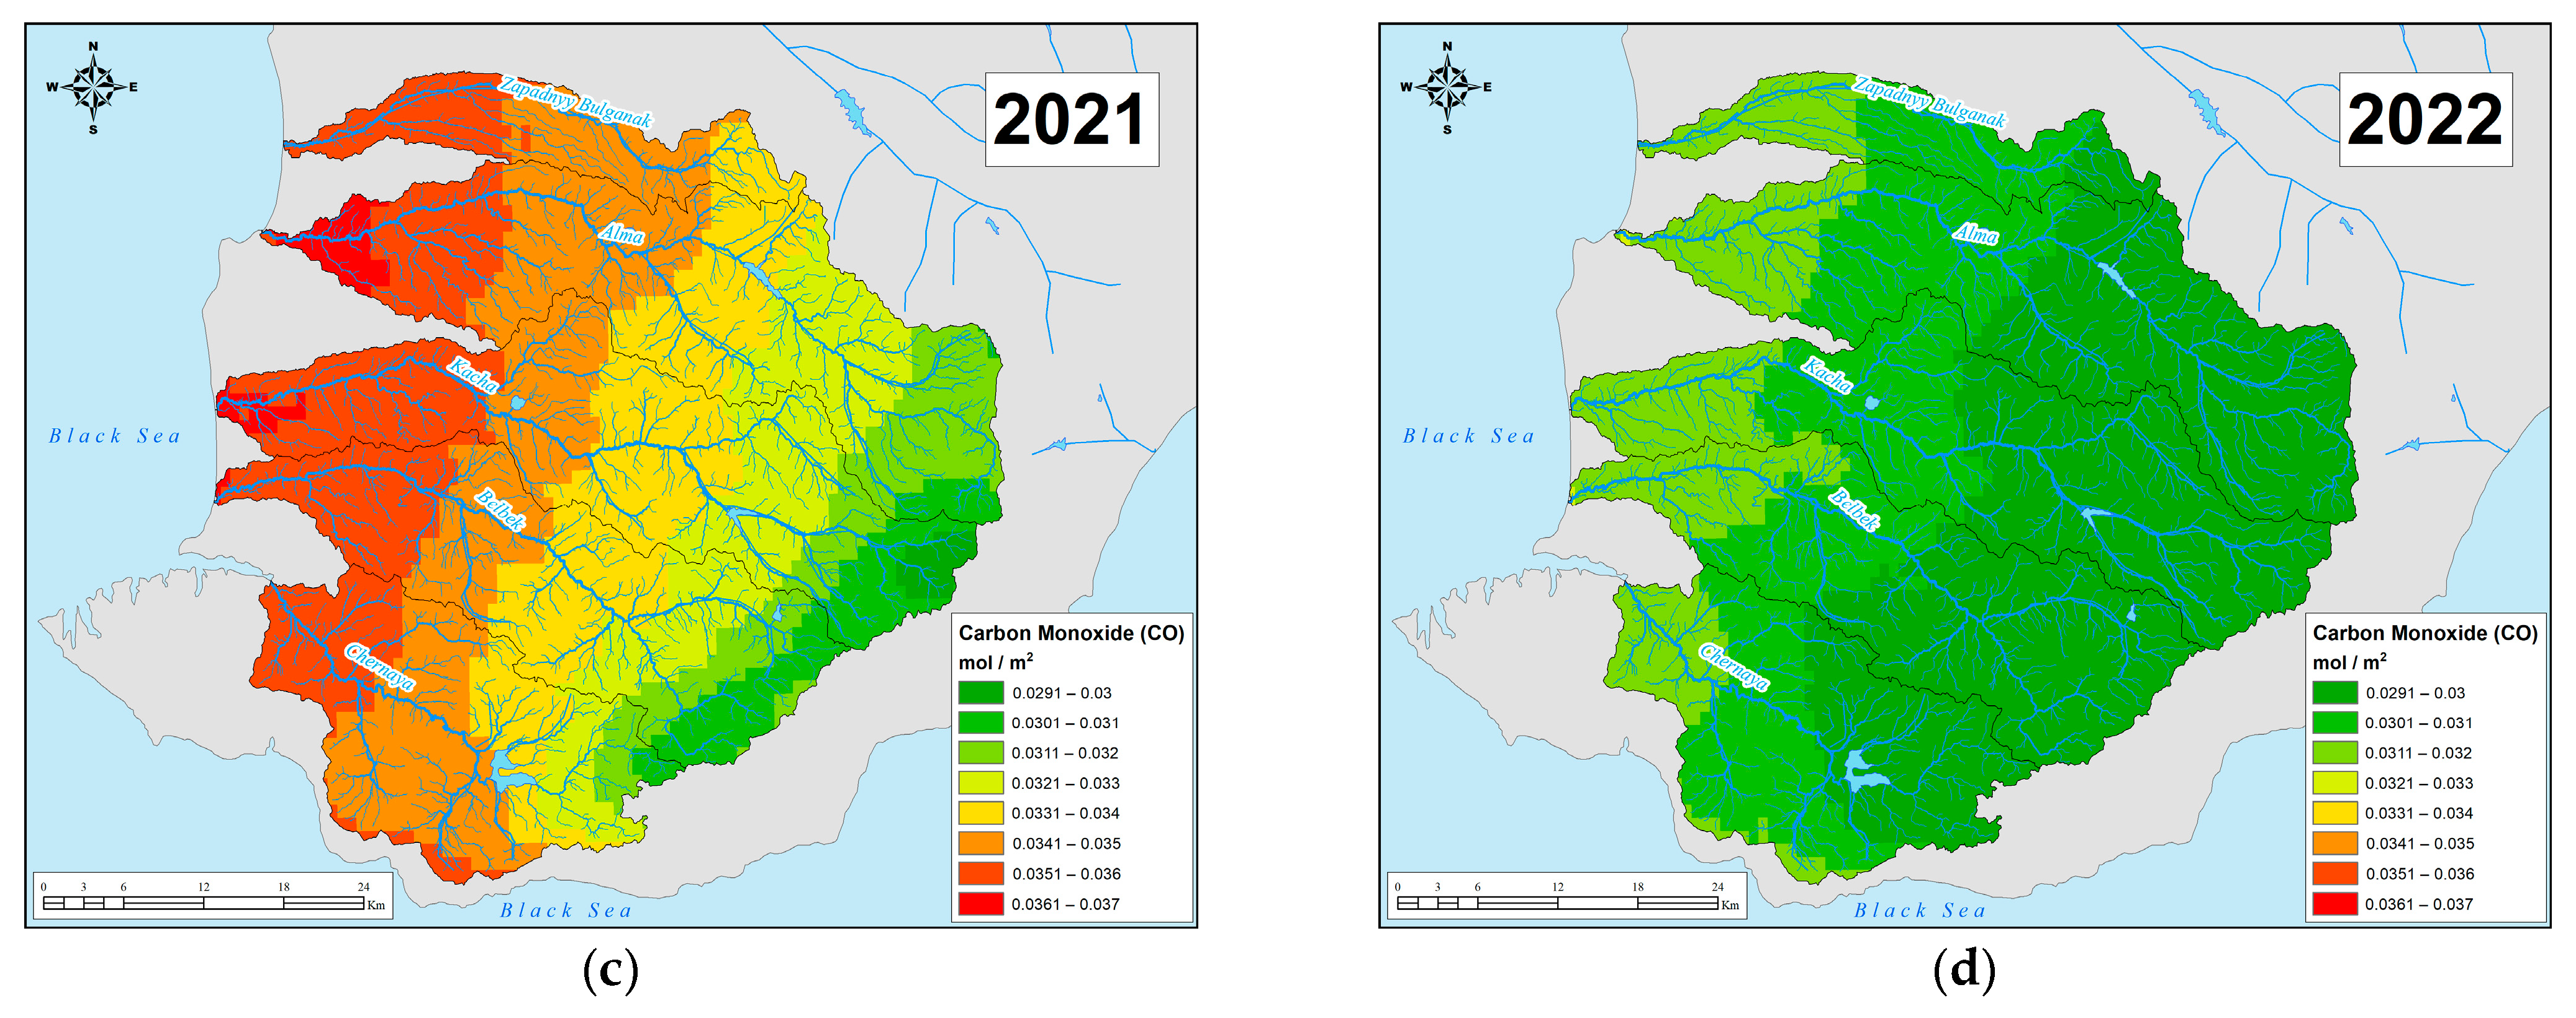
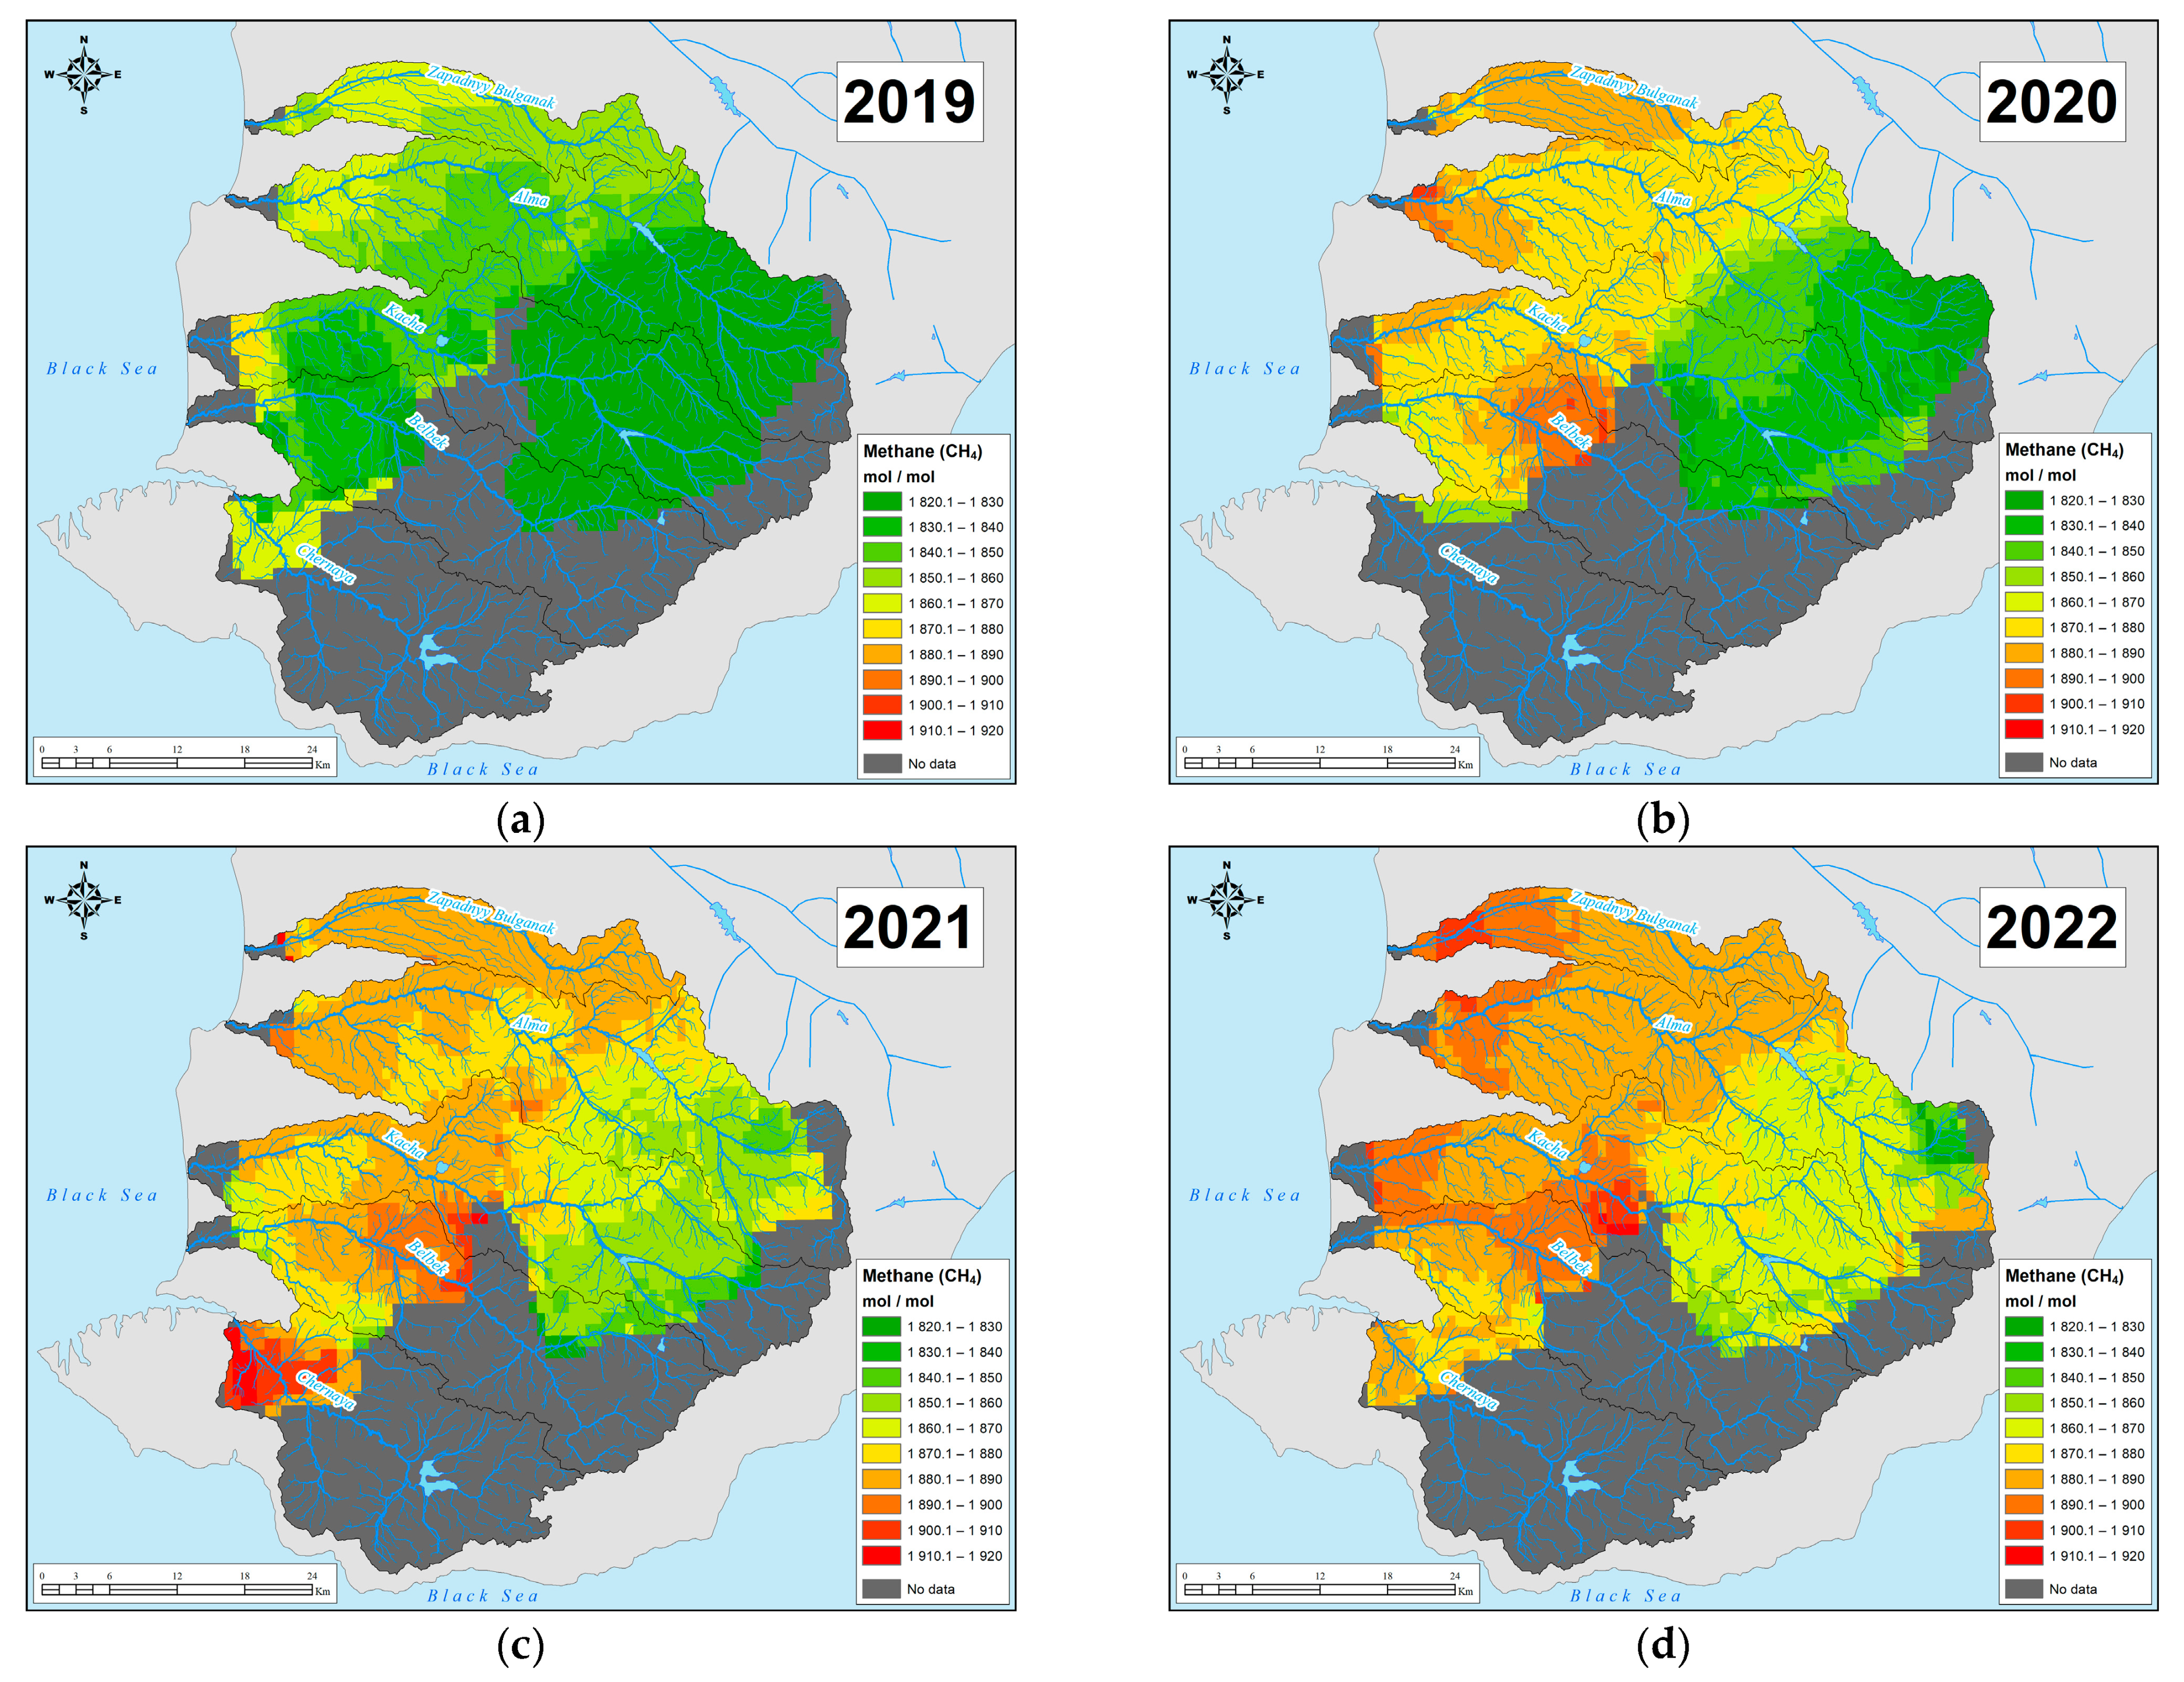
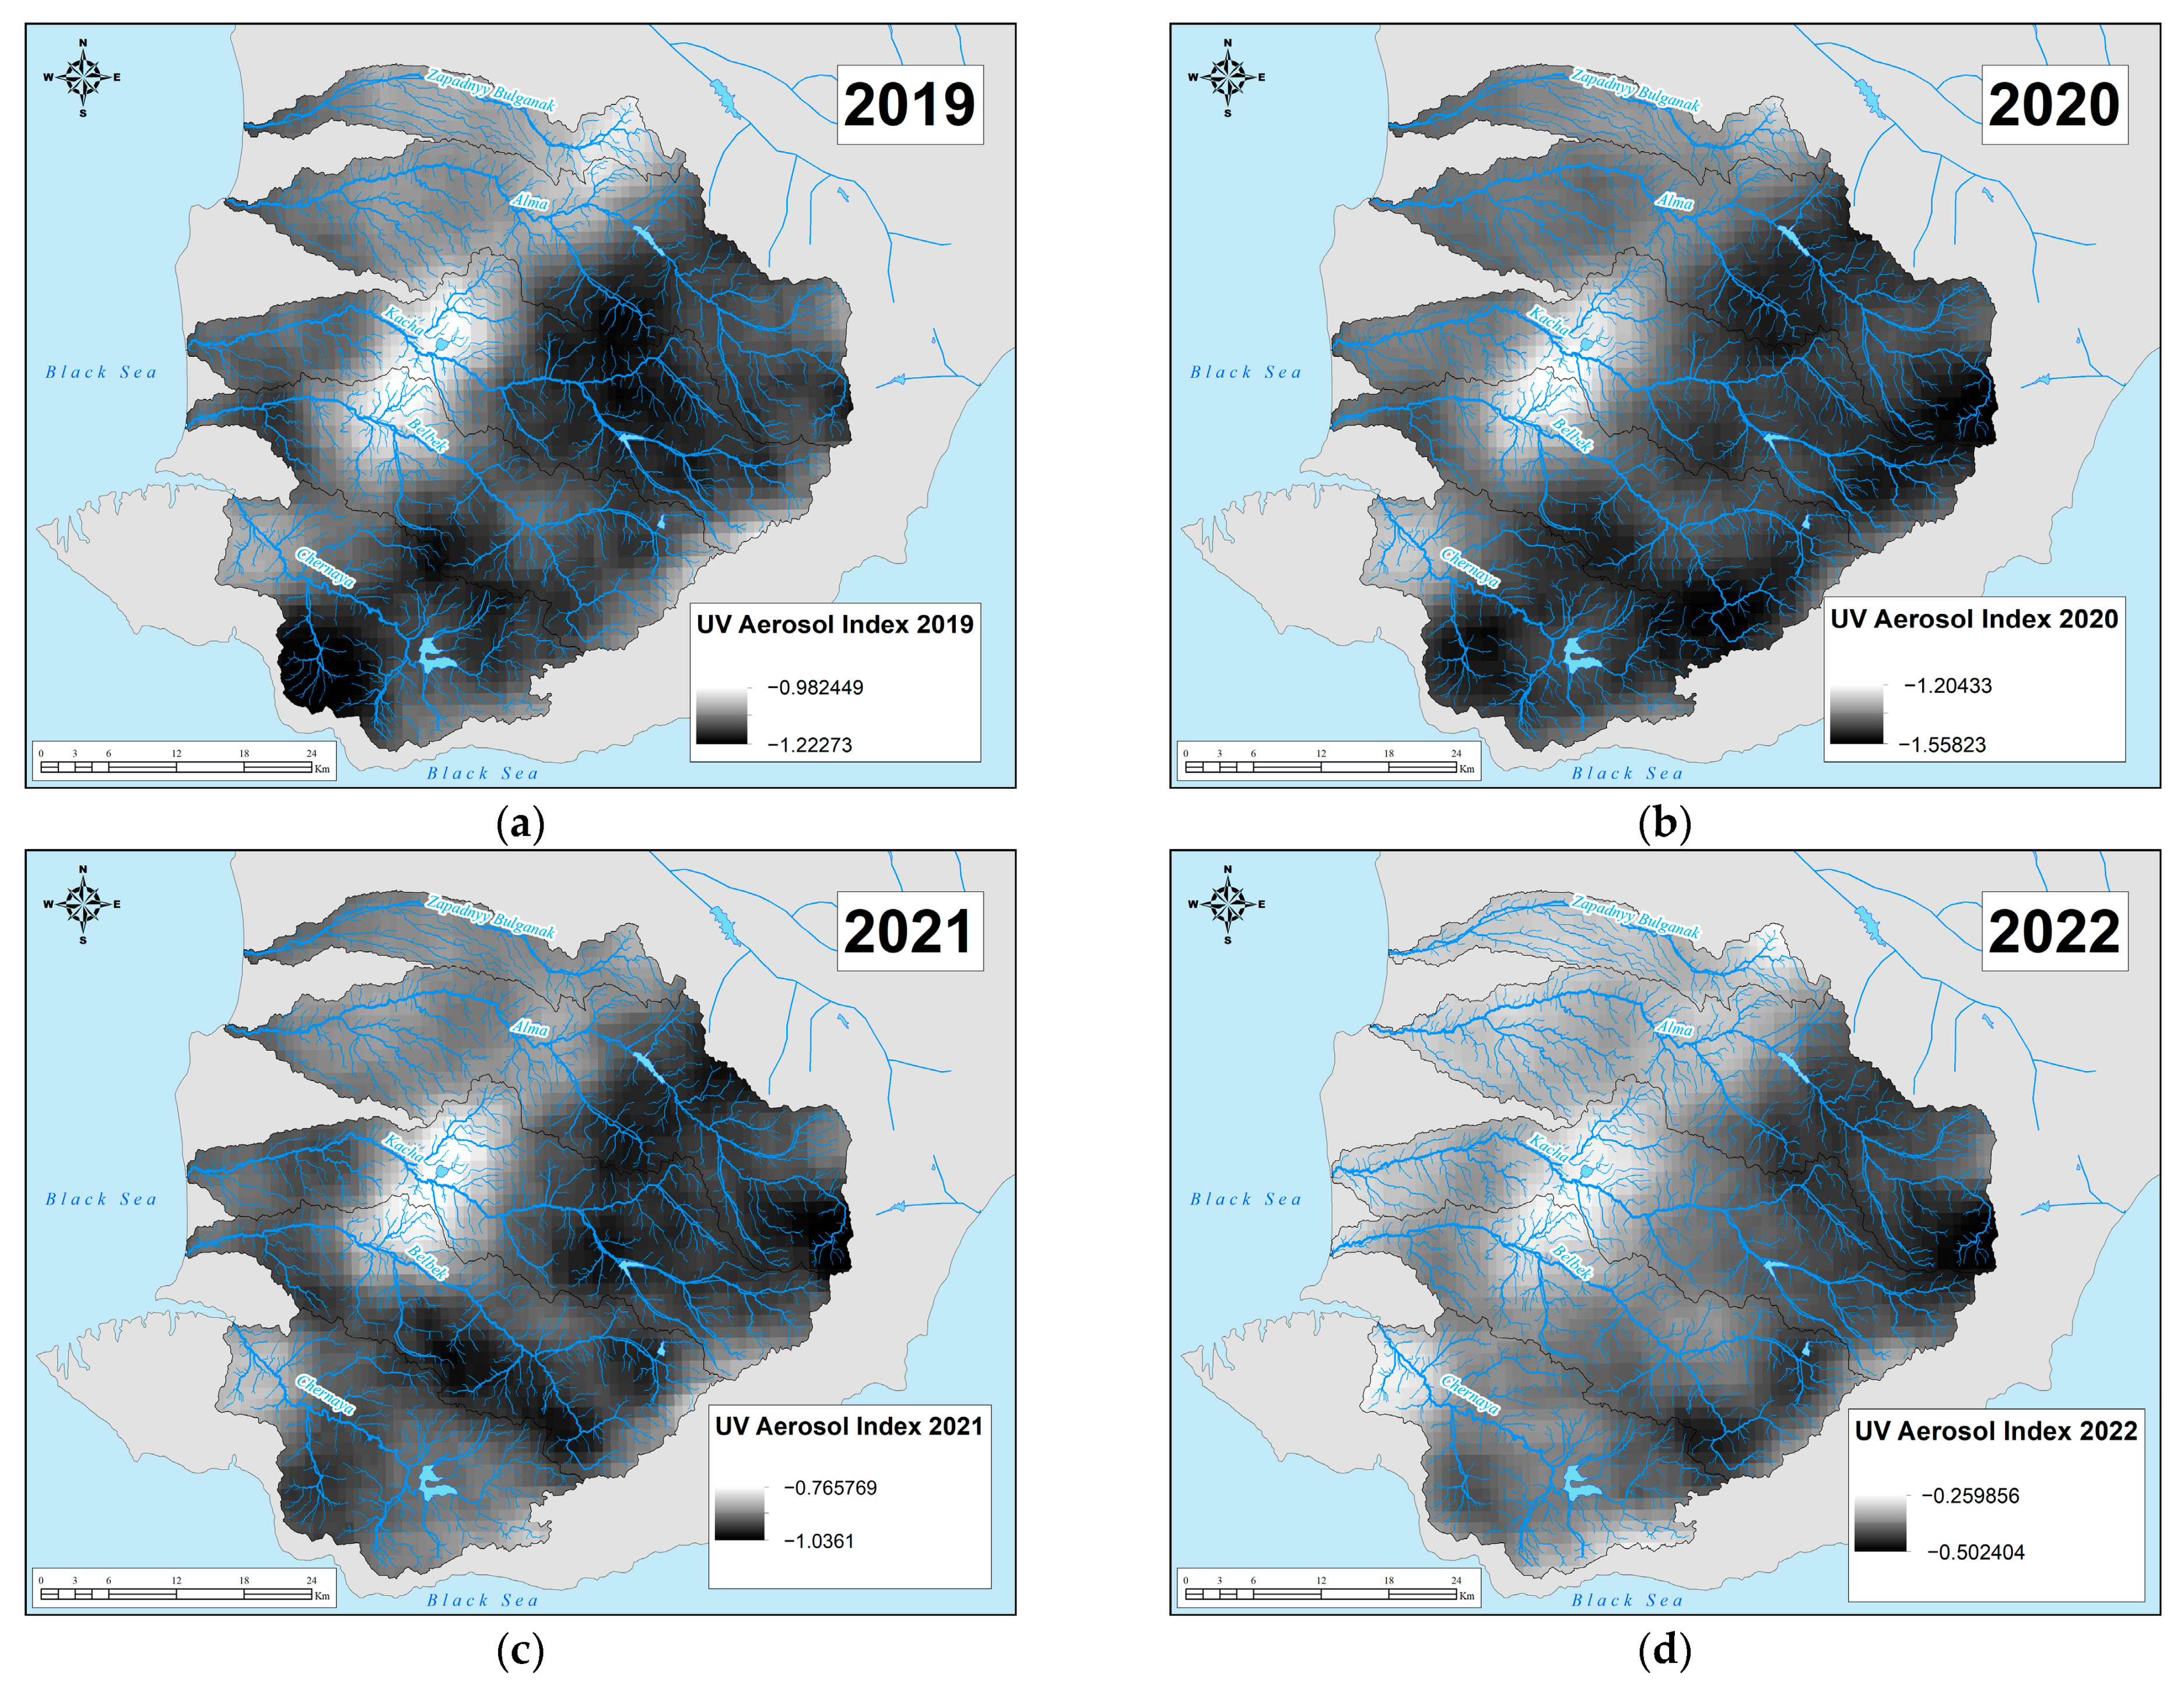
3.1. Average Annual Variability of the Concentration of Chemicals in the Atmosphere
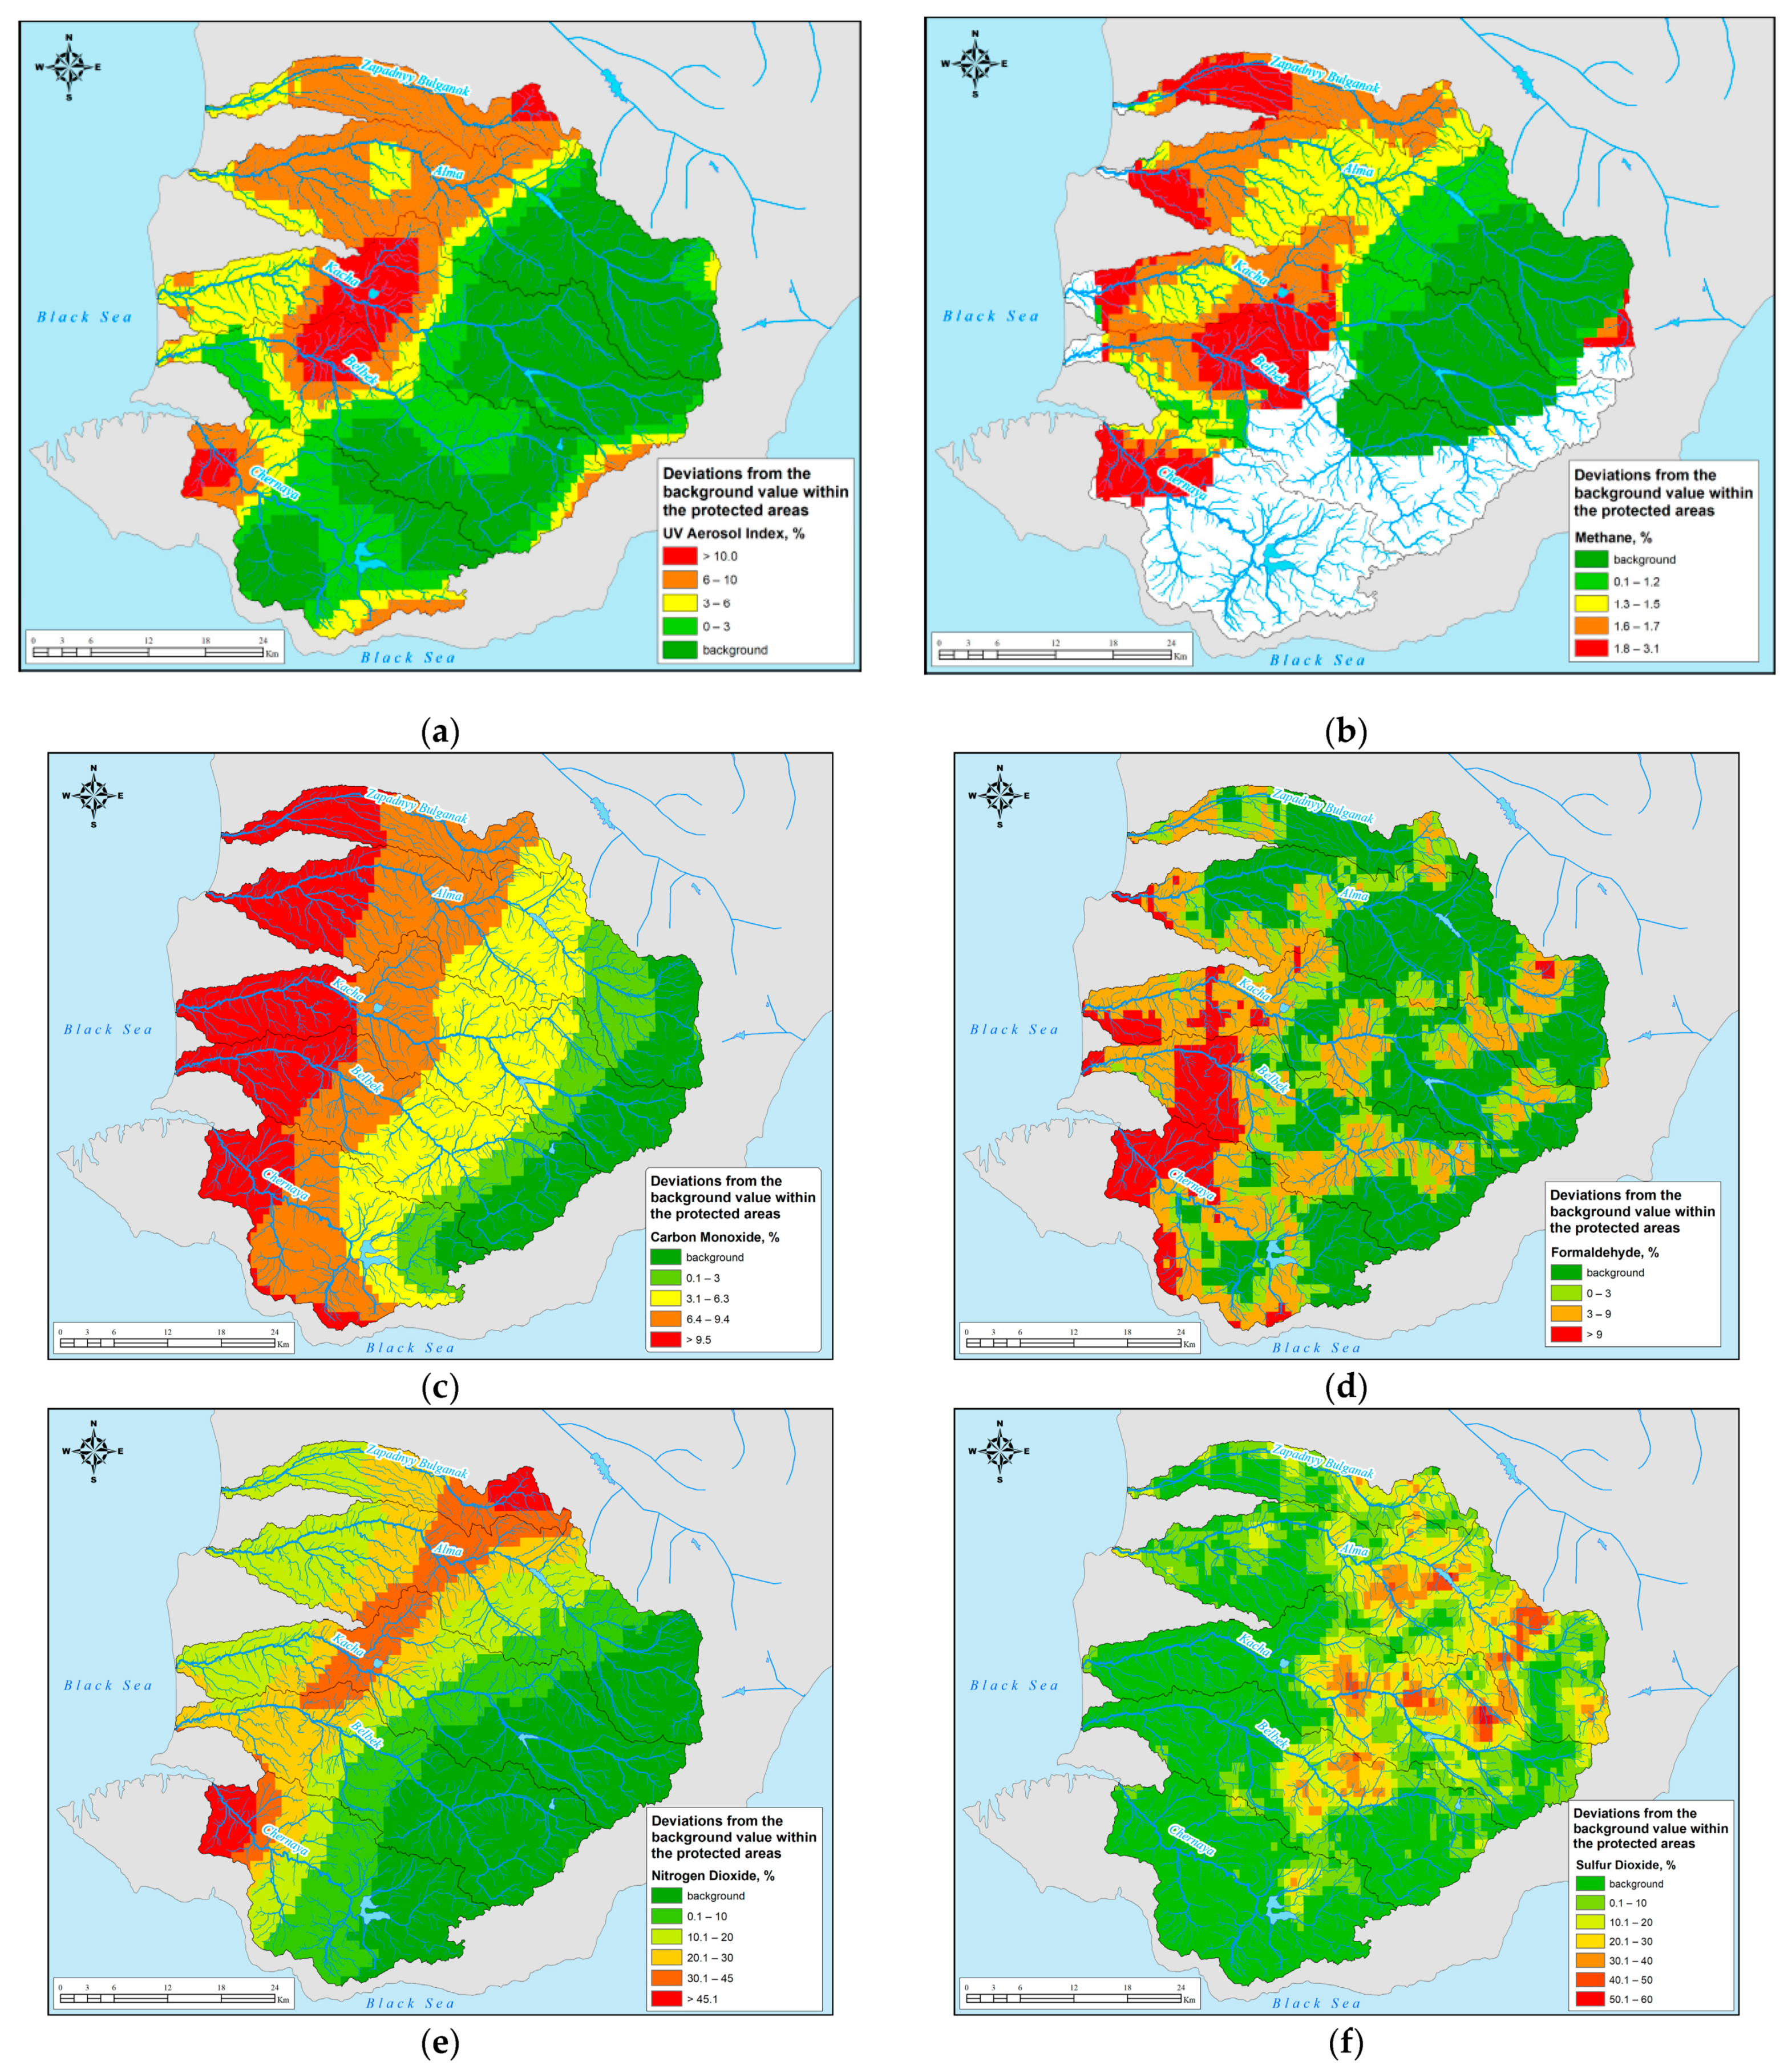
3.2. Comparison of Concentration with Background Values within Protected Areas
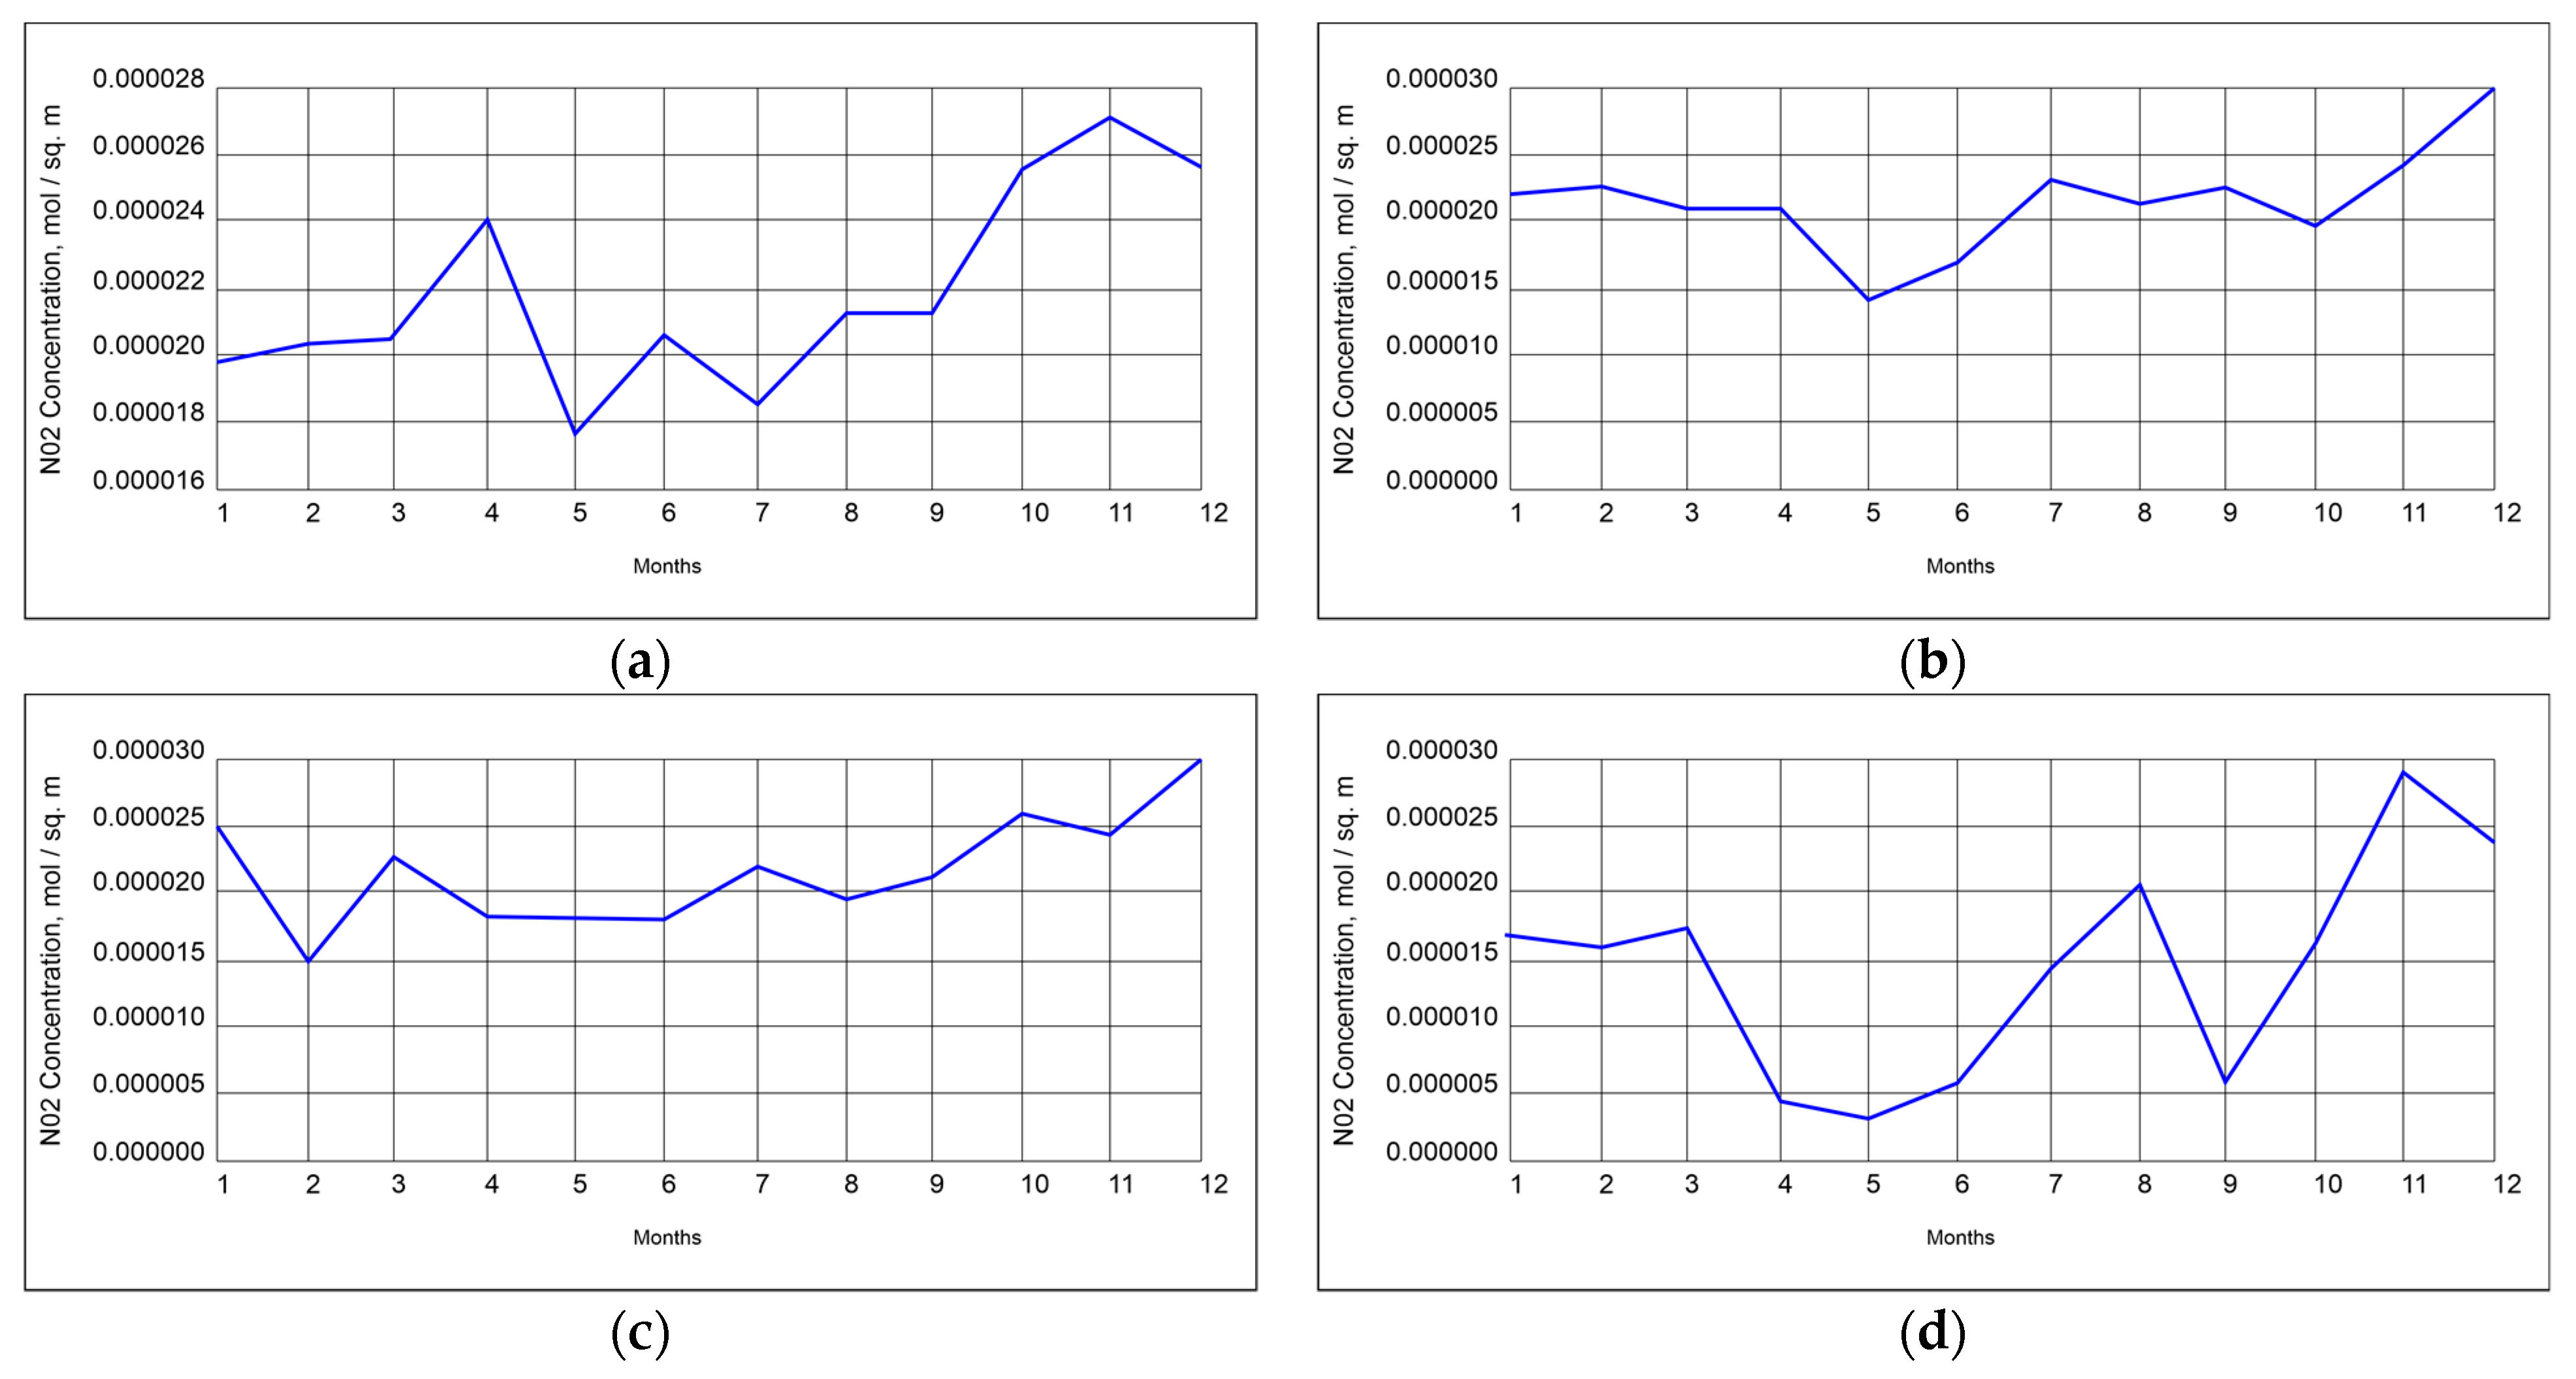
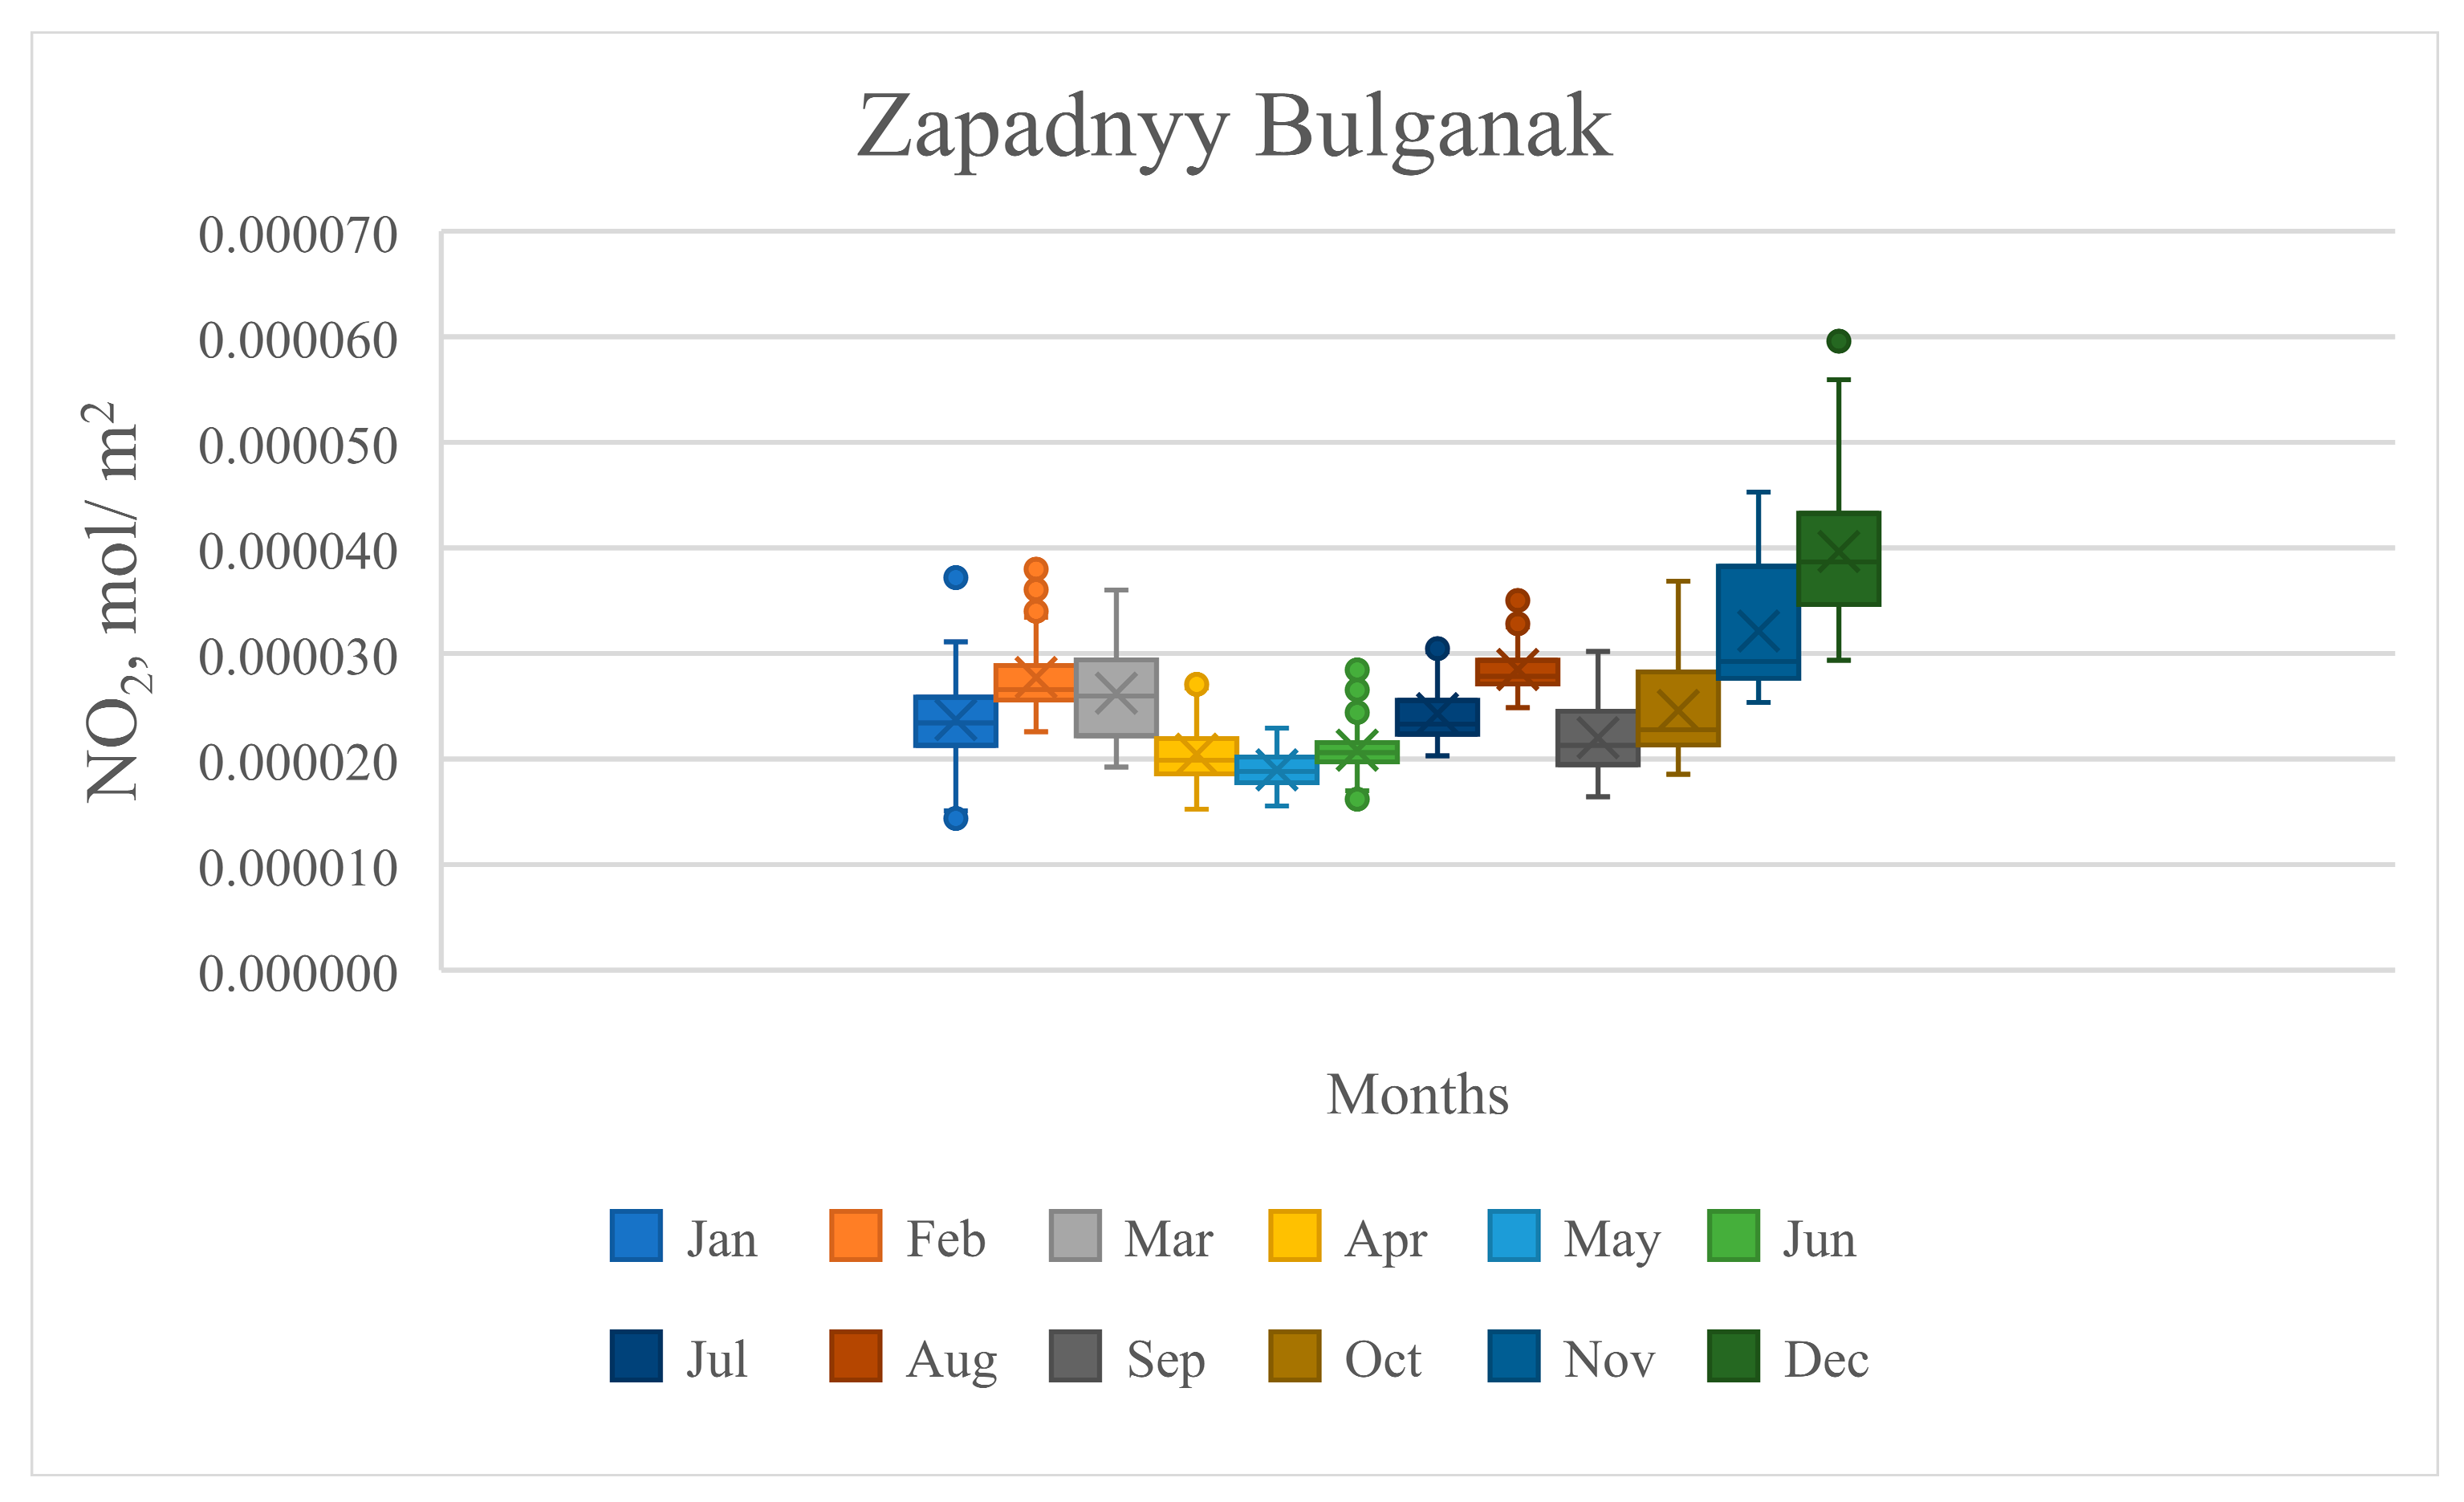
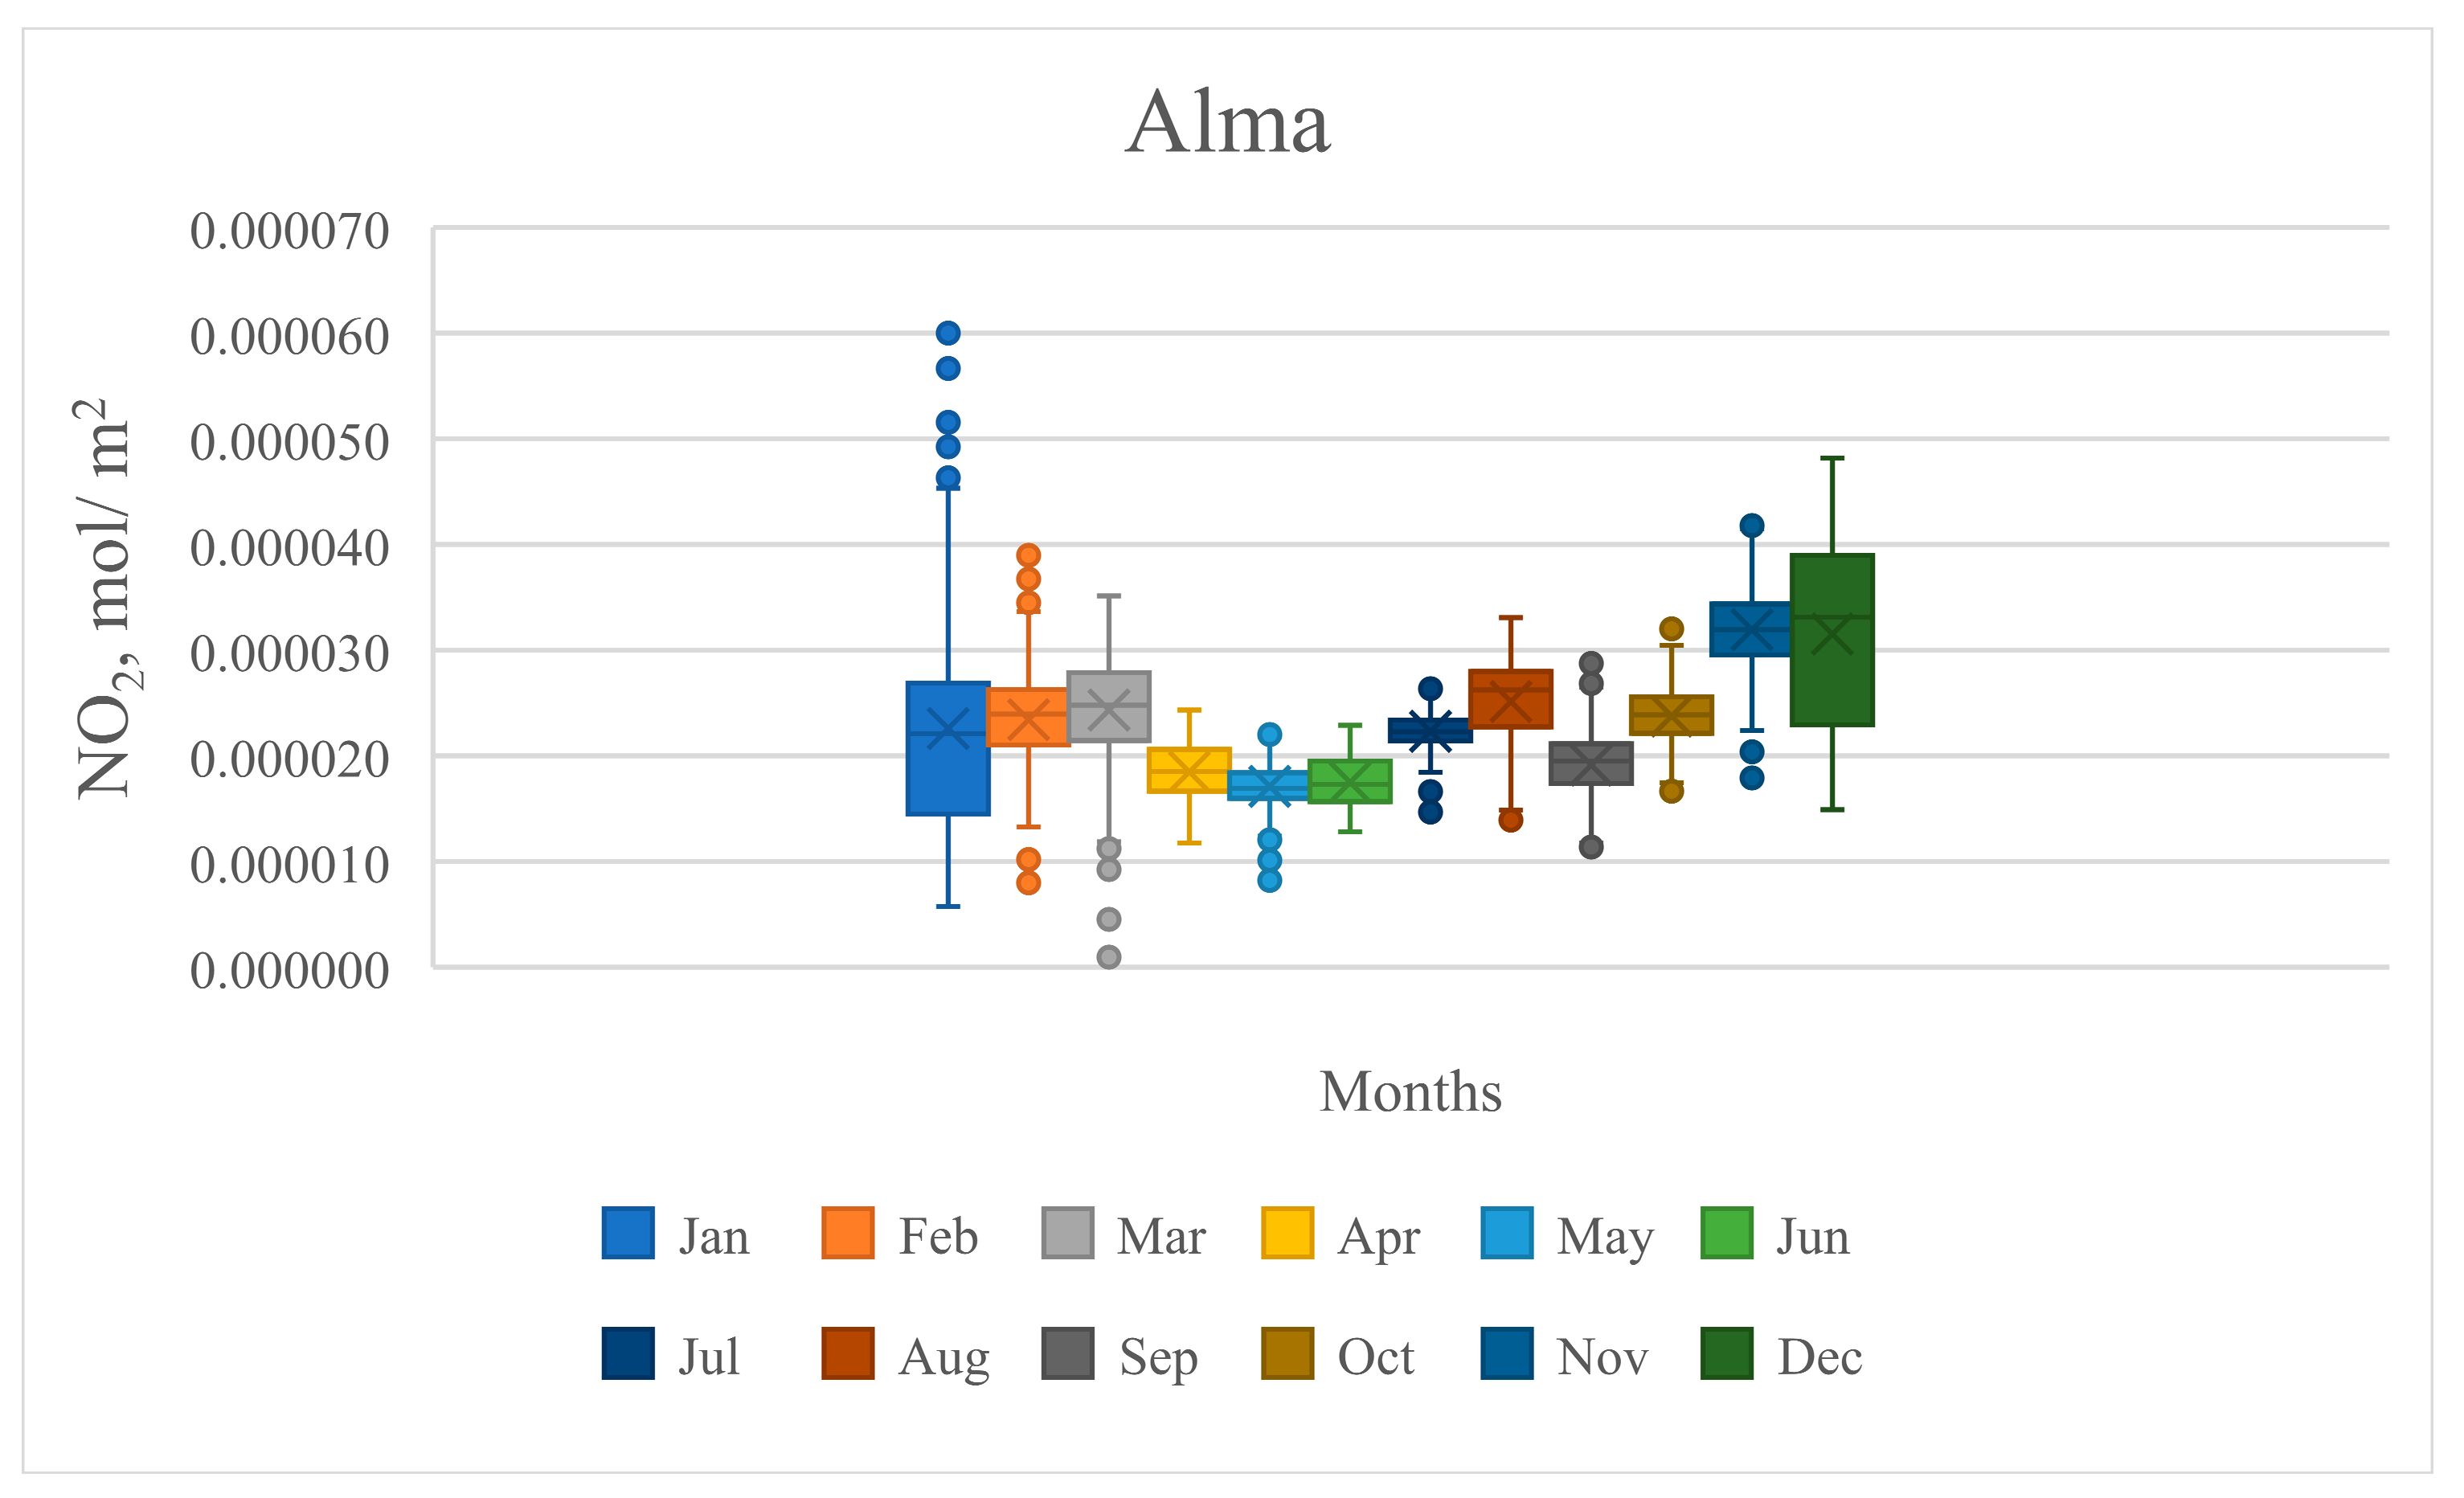
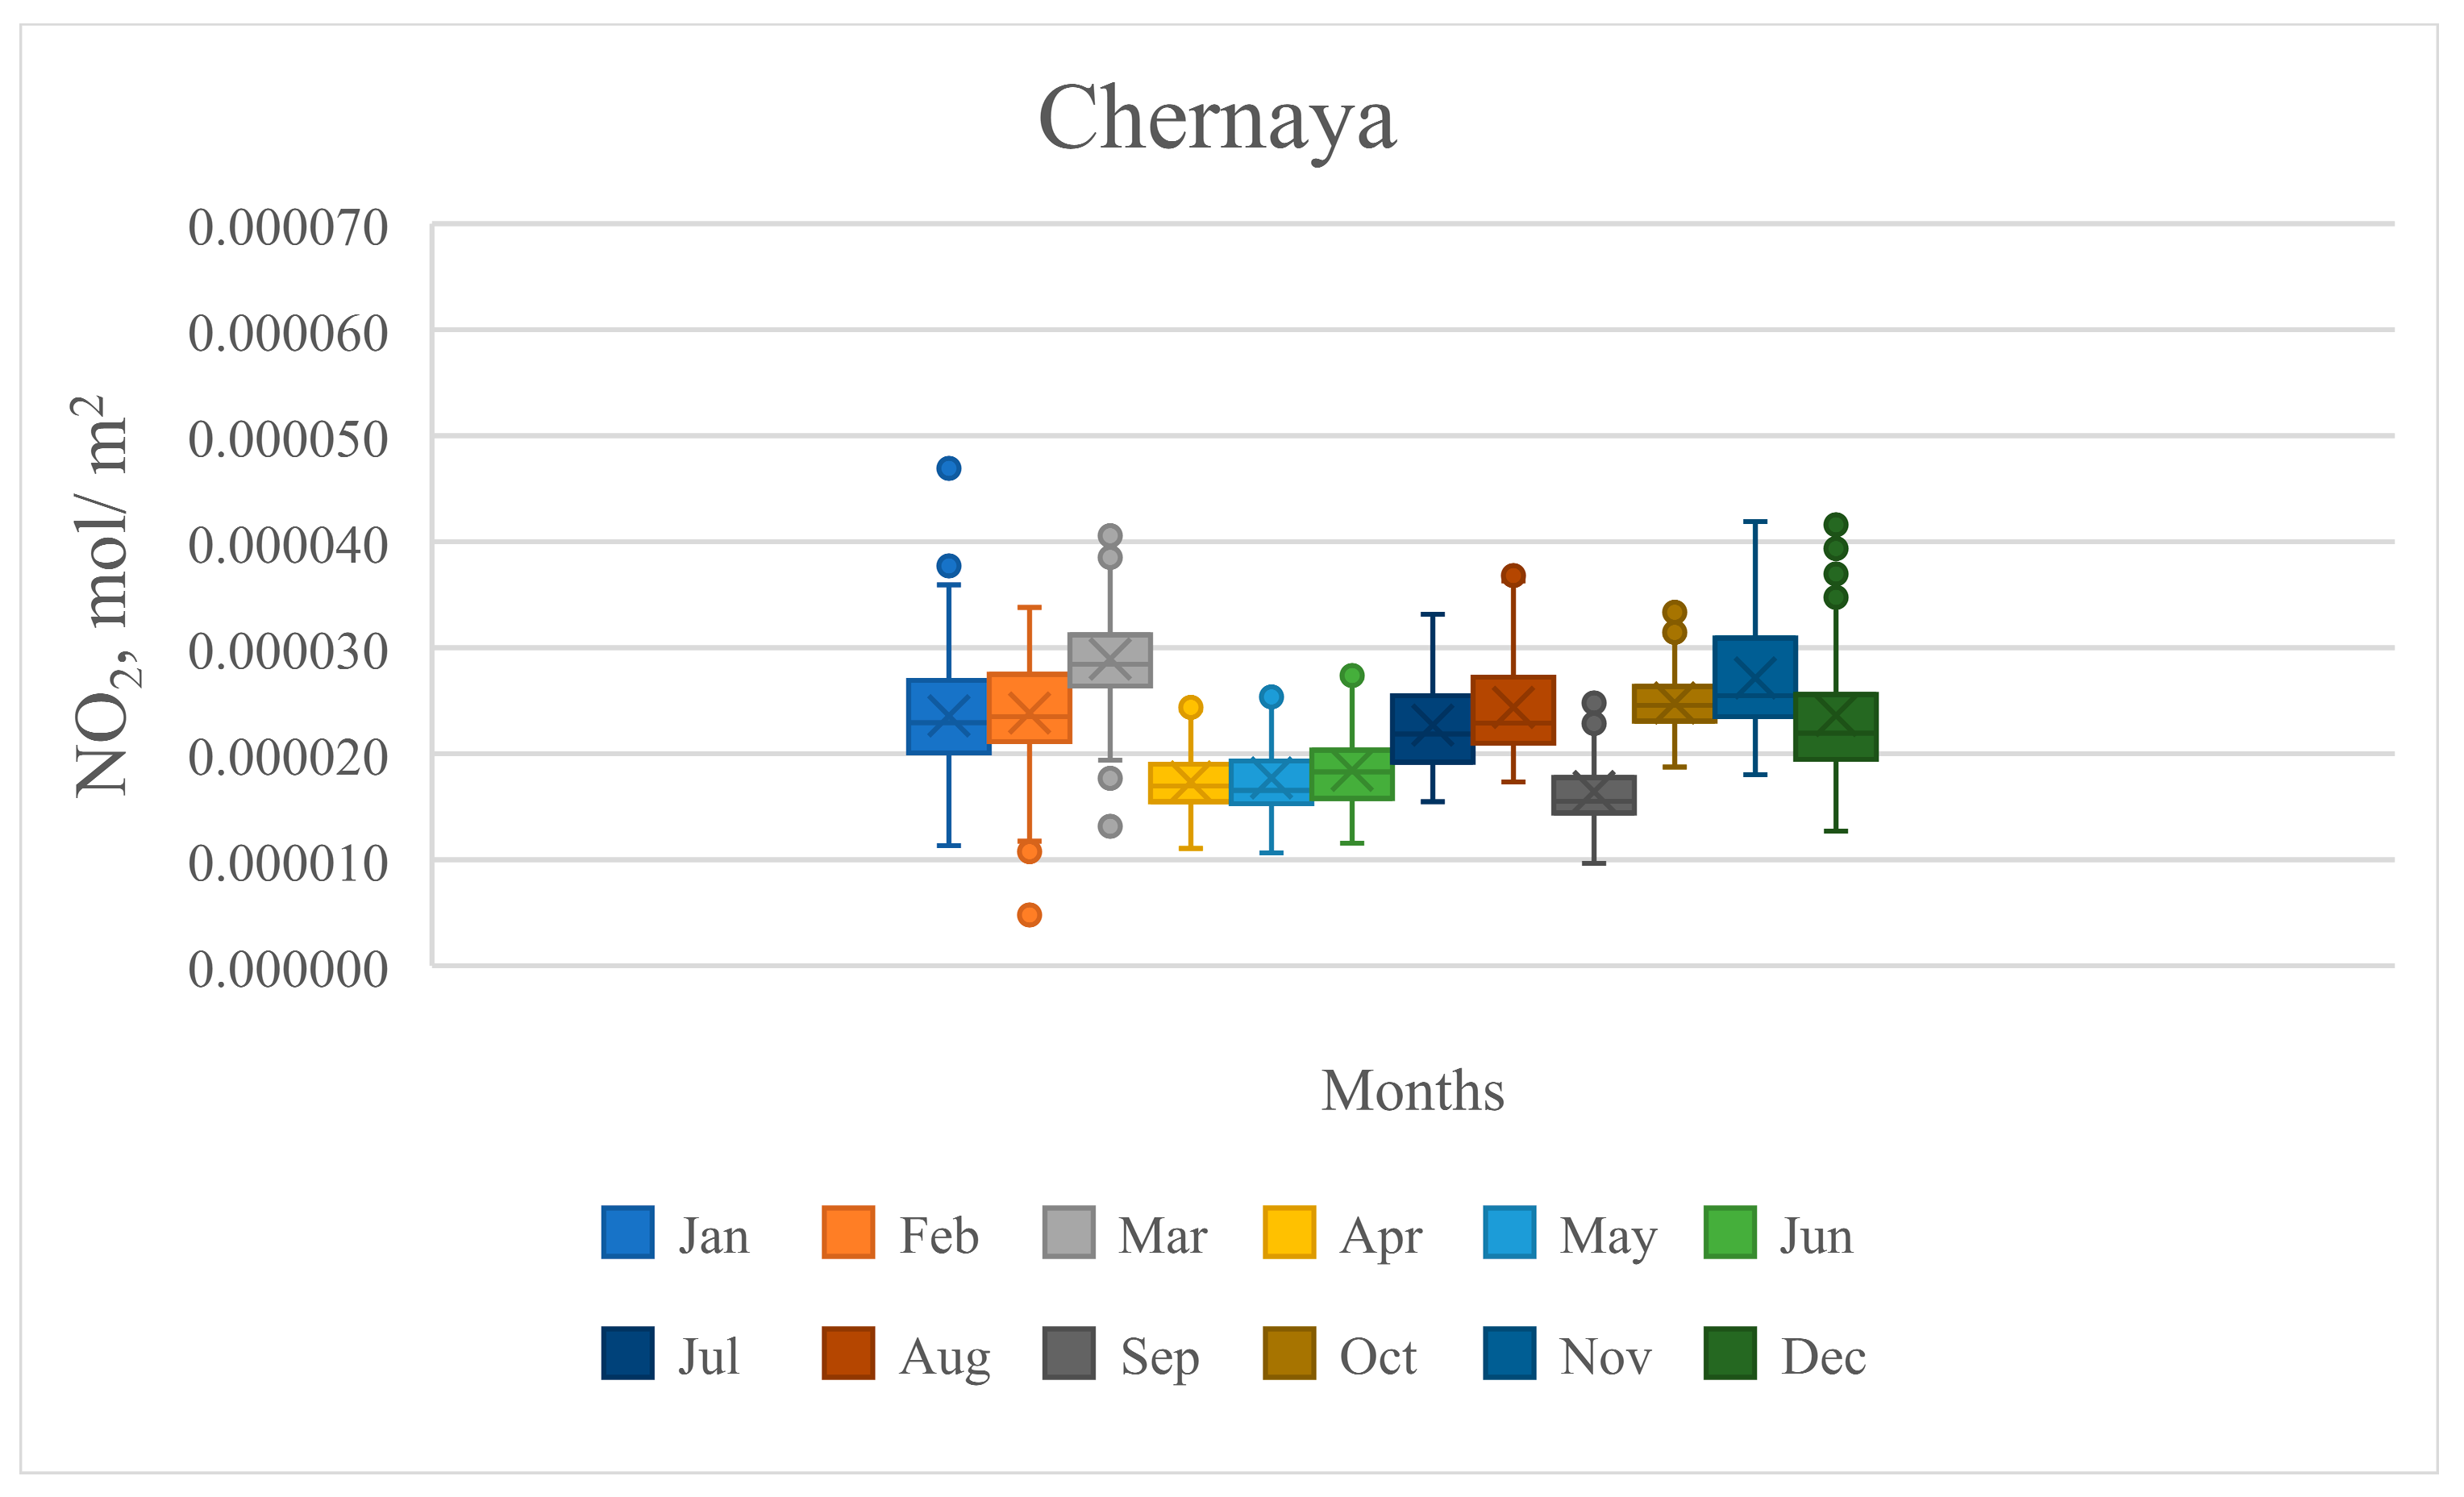
3.3. Average Monthly Variability of Atmospheric NO2 Concentration
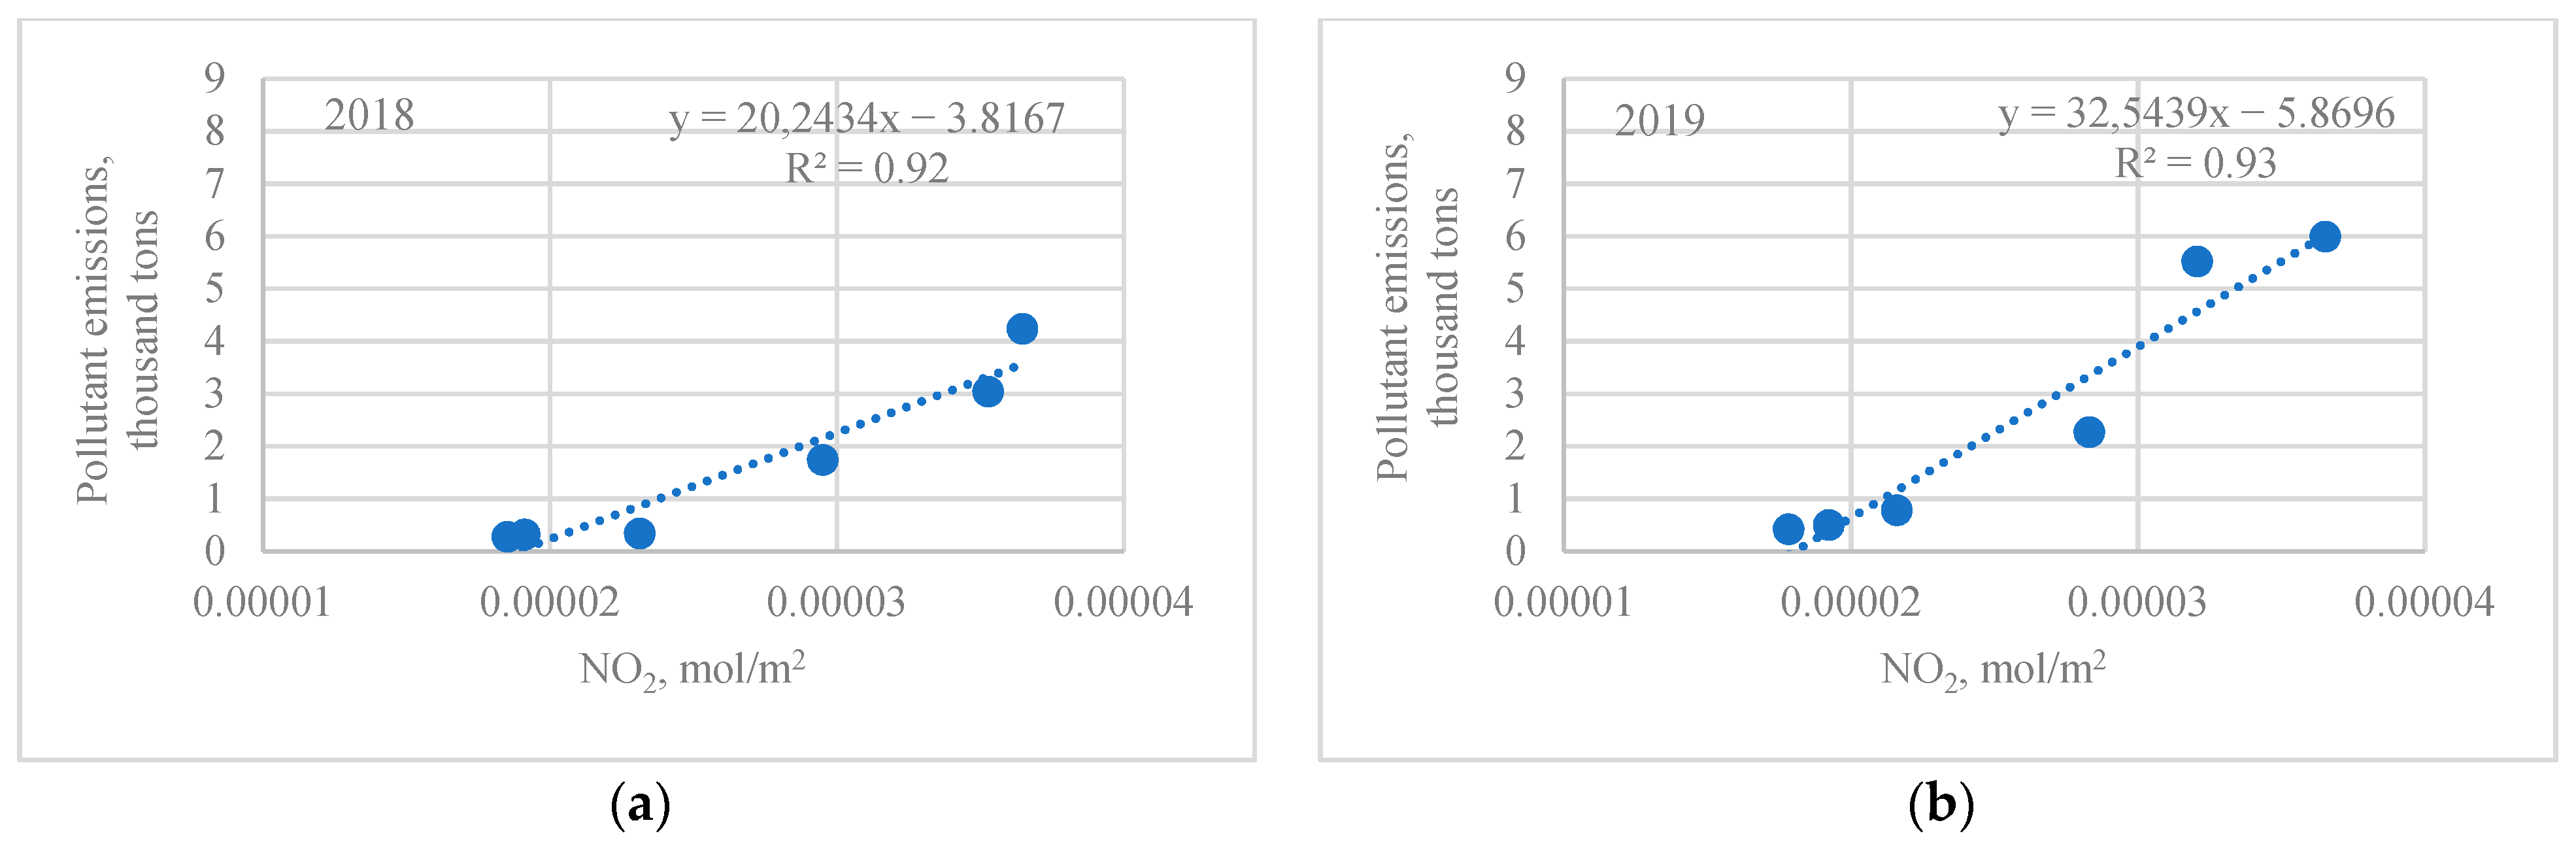
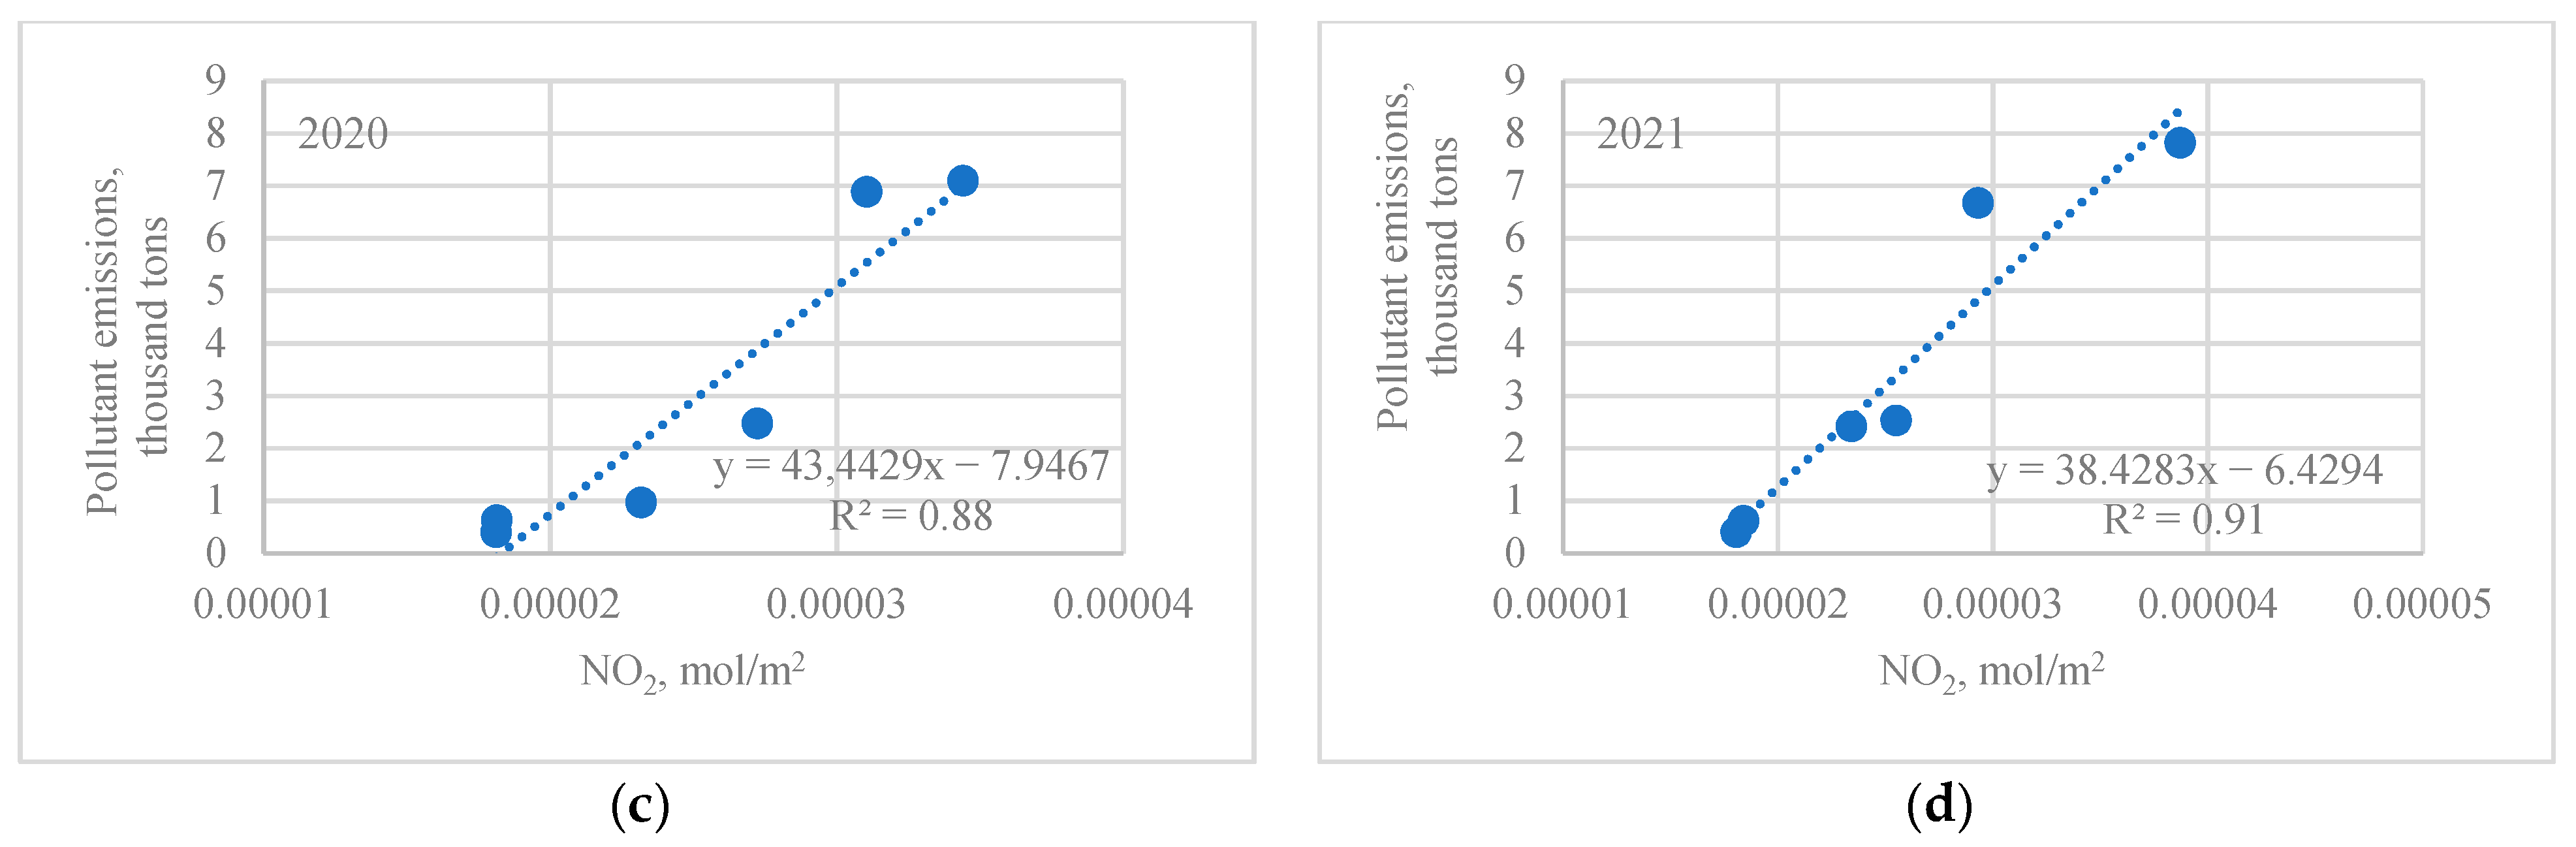
3.4. Comparison of Atmospheric Emissions Values Using Ground-Based Monitoring Results and Earth Remote Sensing Data
4. Discussion
5. Conclusions
Author Contributions
Funding
Data Availability Statement
Conflicts of Interest
References
- Jonson, J.E.; Gauss, M.; Schulz, M.; Jalkanen, J.-P.; Fagerli, H. Effects of global ship emissions on European air pollution levels. Atmos. Chem. Phys. 2020, 20, 11399–11422. [Google Scholar] [CrossRef]
- Rohde, R.A.; Muller, R.A. Air pollution in China: Mapping of concentrations and sources. PLoS ONE 2015, 10, e0135749. [Google Scholar] [CrossRef]
- Glencross, D.A.; Ho, T.R.; Camina, N.; Hawrylowicz, C.M.; Pfeffer, P.E. Air pollution and its effects on the immune system. Free Radic. Biol. Med. 2020, 151, 56–68. [Google Scholar] [CrossRef] [PubMed]
- Tainio, M.; Andersen, Z.J.; Nieuwenhuijsen, M.J.; Hu, L.; de Nazelle, A.; An, R.; Garcia, L.M.; Goenka, S.; Zapata-Diomedi, B.; Bull, F.; et al. Air pollution, physical activity and health: A mapping review of the evidence. Environ. Int. 2021, 147, 105954. [Google Scholar] [CrossRef] [PubMed]
- Taylor, G.E.; Johnson, D.W.; Andersen, C.P. Air pollution and forest ecosystems: A regional to global perspective. Ecol. Appl. 1994, 4, 662–689. [Google Scholar] [CrossRef]
- Vadrevu, K.; Ohara, T.; Justice, C. Land cover, land use changes and air pollution in Asia: A synthesis. Environ. Res. Lett. 2017, 12, 120201. [Google Scholar] [CrossRef] [Green Version]
- Colvile, R.N.; Hutchinson, E.J.; Mindell, J.S.; Warren, R.F. The transport sector as a source of air pollution. Atmos. Environ. 2001, 35, 1537–1565. [Google Scholar] [CrossRef] [Green Version]
- Tur, A.V.; Gromova, E.V. On Optimal Control of Pollution Emissions: An Example of the Largest Industrial Enterprises of Irkutsk Oblast. Autom. Remote Control 2020, 81, 548–565. [Google Scholar] [CrossRef]
- Patra, A.K.; Gautam, S.; Kumar, P. Emissions and human health impact of particulate matter from surface mining operation—A review. Environ. Technol. Innov. 2016, 5, 233–249. [Google Scholar] [CrossRef]
- Ciais, P.; Wang, Y.; Andrew, R.; Bréon, F.-M.; Chevallier, F.; Broquet, G.; Nabuurs, G.-J.; Peters, G.; McGrath, M.; Meng, W.; et al. Biofuel burning and human respiration bias on satellite estimates of fossil fuel CO2 emissions. Environ. Res. Lett. 2020, 15, 074036. [Google Scholar] [CrossRef]
- Kastratović, R. Impact of foreign direct investment on greenhouse gas emissions in agriculture of developing countries. Aust. J. Agric. Resour. Econ. 2019, 63, 620–642. [Google Scholar] [CrossRef]
- Leelőssy, Á.; Molnár, F.; Izsák, F.; Havasi, Á.; Lagzi, I.; Mészáros, R. Dispersion modeling of air pollutants in the atmosphere: A review. Open Geosci. 2014, 6, 257–278. [Google Scholar] [CrossRef]
- Almetwally, A.A.; Bin-Jumah, M.; Allam, A.A. Ambient air pollution and its influence on human health and welfare: An overview. Environ. Sci. Pollut. Res. 2020, 27, 24815–24830. [Google Scholar] [CrossRef]
- Zhang, X.; Chen, L.; Yuan, R. Effect of natural and anthropic factors on the spatiotemporal pattern of haze pollution control of China. J. Clean. Prod. 2020, 251, 119531. [Google Scholar] [CrossRef]
- Fairburn, J.; Schüle, S.A.; Dreger, S.; Karla Hilz, L.; Bolte, G. Social Inequalities in Exposure to Ambient Air Pollution: A Systematic Review in the WHO European Region. Int. J. Environ. Res. Public Health 2019, 16, 3127. [Google Scholar] [CrossRef] [Green Version]
- Ajibade, F.O.; Adelodun, B.; Lasisi, K.H.; Fadare, O.O.; Ajibade, T.F.; Nwogwu, N.A.; Sulaymon, I.D.; Ugya, A.Y.; Wang, H.C.; Wang, A. Environmental pollution and their socioeconomic impacts. In Microbe Mediated Remediation of Environmental Contaminants; Kumar, A., Singh, V.P., Singh, P., Mishra, V.K., Eds.; Woodhead Publishing: Sawston, UK, 2021; pp. 321–354. [Google Scholar] [CrossRef]
- Li, C.; Mao, J.; Lau, A.K.; Yuan, Z.; Wang, M.; Liu, X. Application of MODIS satellite products to the air pollution research in Beijing. Sci. China Ser. D (Earth Sci.) 2005, 48, 209–219. [Google Scholar] [CrossRef]
- Farrag, F.A. The Role of SPOT Satellite Images in Mapping Air Pollution Caused by Cement Factories. Int. Arch. Photogramm. Remote Sens. 2000, 33, 46–53. [Google Scholar]
- Fishman, J.; Iraci, L.T.; Al-Saadi, J.; Chance, K.; Chavez, F.; Chin, M.; Coble, P.; Davis, C.; DiGiacomo, P.M.; Edwards, D.; et al. The United States’ next generation of atmospheric composition and coastal ecosystem measurements: NASA’s Geostationary Coastal and Air Pollution Events (GEO-CAPE) mission. Bull. Am. Meteorol. Soc. 2012, 93, 1547–1566. [Google Scholar] [CrossRef] [Green Version]
- Zhang, Q.; Boersma, K.F.; Zhao, B.; Eskes, H.; Chen, C.; Zheng, H.; Zhang, X. Quantifying daily NOx and CO2 emissions from Wuhan using satellite observations from TROPOMI and OCO-2. Atmos. Chem. Phys. 2023, 23, 551–563. [Google Scholar] [CrossRef]
- Theys, N.; De Smedt, I.; Yu, H.; Danckaert, T.; van Gent, J.; Hörmann, C.; Wagner, T.; Hedelt, P.; Bauer, H.; Romahn, F.; et al. Sulfur dioxide retrievals from TROPOMI onboard Sentinel-5 Precursor: Algorithm theoretical basis. Atmos. Meas. Tech. 2017, 10, 119–153. [Google Scholar] [CrossRef] [Green Version]
- Guanter, L.; Bacour, C.; Schneider, A.; Aben, I.; van Kempen, T.A.; Maignan, F.; Retscher, C.; Köhler, P.; Frankenberg, C.; Joiner, J.; et al. The TROPOSIF global sun-induced fluorescence dataset from the Sentinel-5P TROPOMI mission. Earth Syst. Sci. Data 2021, 13, 5423–5440. [Google Scholar] [CrossRef]
- Vîrghileanu, M.; Săvulescu, I.; Mihai, B.-A.; Nistor, C.; Dobre, R. Nitrogen Dioxide (NO2) Pollution Monitoring with Sentinel-5P Satellite Imagery over Europe during the Coronavirus Pandemic Outbreak. Remote Sens. 2020, 12, 3575. [Google Scholar] [CrossRef]
- Zheng, Z.; Yang, Z.; Wu, Z.; Marinello, F. Spatial Variation of NO2 and Its Impact Factors in China: An Application of Sentinel-5P Products. Remote Sens. 2019, 11, 1939. [Google Scholar] [CrossRef] [Green Version]
- Kaplan, G.; Avdan, Z.Y.; Avdan, U. Spaceborne Nitrogen Dioxide Observations from the Sentinel-5P TROPOMI over Turkey. Proceedings 2019, 18, 4. [Google Scholar] [CrossRef] [Green Version]
- Kaplan, G.; Avdan, Z.Y. Space-borne air pollution observation from sentinel-5p tropomi: Relationship between pollutants, geographical and demographic data. Int. J. Eng. Geosci. 2020, 5, 130–137. [Google Scholar] [CrossRef]
- Schneider, P.; Hamer, P.D.; Kylling, A.; Shetty, S.; Stebel, K. Spatiotemporal Patterns in Data Availability of the Sentinel-5P NO2 Product over Urban Areas in Norway. Remote Sens. 2021, 13, 2095. [Google Scholar] [CrossRef]
- Magro, C.; Nunes, L.; Gonçalves, O.C.; Neng, N.R.; Nogueira, J.M.F.; Rego, F.C.; Vieira, P. Atmospheric Trends of CO and CH4 from Extreme Wildfires in Portugal Using Sentinel-5P TROPOMI Level-2 Data. Fire 2021, 4, 25. [Google Scholar] [CrossRef]
- Theys, N.; Hedelt, P.; De Smedt, I.; Lerot, C.; Yu, H.; Vlietinck, J.; Pedergnana, M.; Arellano, S.; Galle, B.; Fernandez, D.; et al. Global monitoring of volcanic SO2 degassing with unprecedented resolution from TROPOMI onboard Sentinel-5 Precursor. Sci. Rep. 2019, 9, 2643. [Google Scholar] [CrossRef] [PubMed] [Green Version]
- Safarianzengir, V.; Sobhani, B.; Yazdani, M.H.; Kianian, M. Monitoring, analysis and spatial and temporal zoning of air pollution (Carbon monoxide) using Sentinel-5 satellite data for health management in Iran, located in the Middle East. Air Quality. Atmos. Health 2020, 13, 709–719. [Google Scholar] [CrossRef]
- Mazlan, N.A.; Zaki, N.A.M.; Narashid, R.H.; Talib, N.; Manokaran, J.; Arshad, F.C.; Fauzi, S.S.M.; Dom, N.C.; Valipour, M.; Dambul, R.; et al. COVID-19 Restriction Movement Control Order (MCO) Impacted Emissions of Peninsular Malaysia Using Sentinel-2a and Sentinel-5p Satellite. Earth Syst. Environ. 2022, 7, 347–358. [Google Scholar] [CrossRef]
- Alvarado, L.; Richter, A.; Vrekoussis, M.; Hilboll, A.; Kalisz Hedegaard, A.B.; Schneising, O.; Burrows, J.P. Unexpected long-range transport of glyoxal and formaldehyde observed from the Copernicus Sentinel-5 Precursor satellite during the 2018 Canadian wildfires. Atmos. Chem. Phys. 2020, 20, 2057–2072. [Google Scholar] [CrossRef] [Green Version]
- Tabunshchyk, V.A.; Kalinchyk, I.V.; Zhuk, V.O. Emissions from stationary pollution sources in the Republic of Crimea in 2013–2018. J. Phys. Conf. Ser. 2020, 1515, 032040. [Google Scholar] [CrossRef]
- Mabiala, G.; Gnizdylo, V.S. Ecological and Economic Problems of Territorial Development Policy in Crimean Republic. CITISE 2020, 3, 38–52. [Google Scholar] [CrossRef]
- Malishev, T.R.; Yaseneva, E.V. Technogenic pollution of atmospheric air in Crimea. In Proceedings of the III Scientific-Practical Youth Conference “Ecobiological Problems of the Azov-Black Sea Region and Integrated Management of Biological Resources”, Sevastopol, Russian, 28–30 September 2016. [Google Scholar]
- Nekhoroshkov, P.; Peshkova, A.; Zinicovscaia, I.; Vergel, K.; Kravtsova, A. Assessment of the Atmospheric Deposition of Heavy Metals and Other Elements in the Mountain Crimea Using Moss Biomonitoring Technique. Atmosphere 2022, 13, 573. [Google Scholar] [CrossRef]
- Varenik, A.V. The Characteristics of PM2.5 and PM10 and Elemental Carbon Air Pollution in Sevastopol, Crimean Peninsula. Appl. Sci. 2022, 12, 7758. [Google Scholar] [CrossRef]
- Lapchenko, V.A.; Zvyagintsev, A.M. Trace atmospheric gases in the Karadag nature reserve in Crimea. Atmos. Ocean. Opt. 2015, 28, 308–311. [Google Scholar] [CrossRef]
- Zvyagintsev, A.M.; Blum, O.B.; Glazkova, A.A.; Kotel’nikov, S.N.; Kuznetsova, I.N.; Lapchenko, V.A.; Lezina, E.A.; Miller, E.A.; Milyaev, V.A.; Popikov, A.P.; et al. Air pollution over European Russia and Ukraine under the hot summer conditions of 2010. Izv. Atmos. Ocean. Phys. 2011, 47, 699–707. [Google Scholar] [CrossRef]
- Nekrich, A.S. Environmental effects of agricultural activity on the Crimean Peninsula. IOP Conf. Ser. Earth Environ. Sci. 2022, 1045, 012114. [Google Scholar] [CrossRef]
- Bezberdaya, L.; Kosheleva, N.; Chernitsova, O.; Lychagin, M.; Kasimov, N. Pollution Level, Partition and Spatial Distribution of Benzo(a)pyrene in Urban Soils, Road Dust and Their PM10 Fraction of Health-Resorts (Alushta, Yalta) and Industrial (Sebastopol) Cities of Crimea. Water 2022, 14, 561. [Google Scholar] [CrossRef]
- Varenik, A.; Filatova, T.; Kleschenkov, A. Comparative analysis of biogenic elements in atmospherical condensation of Black Sea Crimean coast and Rostov-on-Don in spring-summer period of 2016. Sci. Alm. Black Sea Reg. Ctries. 2017, 11, 56–63. [Google Scholar] [CrossRef]
- Pham, C.N.; Gorbunov, R.; Lapchenko, V.; Gorbunova, T.; Tabunshchik, V. Biogenic Elements of Atmospheric Fallout and Impact of Sub-Mediterranean Forest Communities of Downy Oaks on Changes in the Chemical Composition of Atmospheric Precipitation. Forests 2023, 14, 294. [Google Scholar] [CrossRef]
- Sigora, G.A.; Gutnik, S.A.; Azarenko, E.I.; Nichkova, L.A.; Khomenko, T.Y. Increasing the Efficiency of the Atmospheric Air Monitoring System in the City of Sevastopol. Monit. Syst. Environ. 2021, 1, 118–128. [Google Scholar] [CrossRef]
- Bobra, T.V.; Lychak, A.I. Spatial analysis and modeling of pollutant concentration fields in the atmosphere of Simferopol. Geopolit. Ecogeodynamics Reg. 2022, 4, 104–120. [Google Scholar]
- Bobra, T.V.; Sverbilova, A.A. Monitoring and Analysis of Air Pollution of the Territory of Simpheropol. Sci. Notes V.I. Vernadsky Crime. Fed. Univ. Geogr. Geol. 2020, 6, 156–167. [Google Scholar]
- Vetrova, N.M.; Ivanenko, T.A.; Sadykova, G.E.; Sudjeva, D.V. On the assessment of the environmental ecological state in coastal cities. In IOP Conference Series: Materials Science and Engineering; IOP Publishing: Bristol, UK, 2020; Volume 913, p. 052035. [Google Scholar] [CrossRef]
- Medvedeva, M.S.; Ivanov, S.V. Analysis of the negative impact of air pollution of the Republic of Crimea on the increase in diseases of bronchopulmonary pathology in this region. Mod. Sci. 2020, 5–3, 454–459. [Google Scholar]
- Butyrskaya, I.B.; Erokin, S.E.; Erokina, A.A. The assessment of the sanitary state of atmospheric air of the republic of Crimea. Colloq. J. 2019, 11–12, 17–19. [Google Scholar]
- Ivanov, S.V.; Seytumerova, L.I.; Sofu, L.U.; Yatsiv, A.V. The state of atmospheric air pollution in the Crimea and the consequences of its impact on the health of the population. Sci. Notes Crime. Eng. Pedagog. Univ. Ser. Biol. Sci. 2018, 1–2, 9–15. [Google Scholar]
- Malakhova, L.V.; Egorov, V.N.; Gulin, S.B.; Malakhova, T.V.; Moseichenko, I.N. Long-Term Dynamics of the Concentrations of Organochlorine Compounds and Mercury in the Bottom Sediments of the Chernorechenskoe Reservoir. Water Resour. 2019, 46, 595–601. [Google Scholar] [CrossRef]
- Ovsyany, E.I.; Orekhova, N.A. Hydrochemical Regime of the River Chernaya (Crimea): Environmental Aspects. Phys. Oceanogr. 2018, 25, 77–89. [Google Scholar] [CrossRef] [Green Version]
- Ivankova, T. Ensuring Environmental Safety of Natural and Technical Systems of Small River Basins in the Conditions of the Crimean Peninsula; INFRA-M: Moscow, Russia, 2023; 171p. [Google Scholar] [CrossRef]
- Ryazanova, N.E.; Nikiforov, A.I. Ecological and geographical characteristics of the mouth of the West Bulganak (Crimea) river for the development and implementation of national indicators of the sustainable development goals (SDGS) 6 “Clean water and sanitation”. Reg. Environ. Issues 2018, 5, 88–96. [Google Scholar] [CrossRef]
- Varenik, A.V.; Konovalov, S.K. Contribution of Atmospheric Depositions to Inventory of Nutrients in the Coastal Waters of Crimea. Appl. Sci. 2023, 13, 3178. [Google Scholar] [CrossRef]
- Malakhova, T.V.; Budnikov, A.A.; Ivanova, I.N.; Murashova, A.I. Seasonal and daily patterns of methane content and emission in the estuary of the Chernaya River (Crimea). Vestn. Mosk. Univ. Seriya 5 Geogr. 2022, 6, 27–39. [Google Scholar] [CrossRef]
- Kashirina, E.S.; Medvedkov, A.A.; Novikov, A.A. Assessment of the surface atmospheric air state in the southwestern Crimea according to lichenoinification data. Bull. Tomsk. Polytech. Univ. Geo Assets Eng. 2022, 8, 126–138. [Google Scholar] [CrossRef]
- Tabunshchik, V.; Gorbunov, R.; Gorbunova, T. Anthropogenic Transformation of the River Basins of the Northwestern Slope of the Crimean Mountains (The Crimean Peninsula). Land 2022, 11, 2121. [Google Scholar] [CrossRef]
- Talovskaya, A.V.; Zhornyak, L.V.; Yazikov, E.G. Assessment of the Impact on the Components of the Natural Environment; Tomsk Polytechnic University Publishing House: Tomsk, Russia, 2014; 88p. [Google Scholar]
- Report on the State and Protection of the Environment on the Territory of the Republic of Crimea in 2021. Available online: https://meco.rk.gov.ru/uploads/txteditor/meco/attachments//d4/1d/8c/d98f00b204e9800998ecf8427e/phpPrPviN_1.pdf (accessed on 1 March 2023).
- Report on the State and Protection of the Environment on the Territory of the Republic of Crimea in 2019. Available online: https://meco.rk.gov.ru/uploads/txteditor/meco/attachments//d4/1d/8c/d98f00b204e9800998ecf8427e/phpCCpsTg_1.pdf (accessed on 1 March 2023).
- Statistical Yearbook of the City of Sevastopol. 2021. Available online: https://82.rosstat.gov.ru/storage/mediabank/%D0%A1%D1%82%D0%B0%D1%82%D0%B8%D1%81%D1%82%D0%B8%D1%87%D0%B5%D1%81%D0%BA%D0%B8%D0%B9%20%D0%B5%D0%B6%D0%B5%D0%B3%D0%BE%D0%B4%D0%BD%D0%B8%D0%BA%20%D0%B3%D0%BE%D1%80%D0%BE%D0%B4%D0%B0%20%D0%A1%D0%B5%D0%B2%D0%B0%D1%81%D1%82%D0%BE%D0%BF%D0%BE%D0%BB%D1%8F.%202021.pdf (accessed on 1 March 2023).
- Statistical Yearbook of the City of Sevastopol. 2020. Available online: https://82.rosstat.gov.ru/storage/mediabank/%D0%95%D0%B6%D0%B5%D0%B3%D0%BE%D0%B4%D0%BD%D0%B8%D0%BA%202020%20%D0%91%D0%95%D0%A1%D0%9F%D0%9B%D0%90%D0%A2%D0%9D%D0%AB%D0%99.pdf (accessed on 1 March 2023).
- Chen, K.; Wang, M.; Huang, C.; Kinney, P.L.; Anastas, P.T. Air pollution reduction and mortality benefit during the COVID-19 outbreak in China. Lancet Planet. Health 2020, 4, e210–e212. [Google Scholar] [CrossRef]
- Dutheil, F.; Baker, J.S.; Navel, V. COVID-19 as a factor influencing air pollution? Environ. Pollut. 2020, 263, 114466. [Google Scholar] [CrossRef]
- Ju, M.J.; Oh, J.; Choi, Y.H. Changes in air pollution levels after COVID-19 outbreak in Korea. Sci. Total Environ. 2021, 750, 141521. [Google Scholar] [CrossRef]
- Gautam, S. COVID-19: Air pollution remains low as people stay at home. Air Qual. Atmos. Health 2020, 13, 853–857. [Google Scholar] [CrossRef]
- Travaglio, M.; Yu, Y.; Popovic, R.; Selley, L.; Leal, N.S.; Martins, L.M. Links between air pollution and COVID-19 in England. Environ. Pollut. 2021, 268, 115859. [Google Scholar] [CrossRef]
- Shami, S.; Ranjgar, B.; Bian, J.; Khoshlahjeh Azar, M.; Moghimi, A.; Amani, M.; Naboureh, A. Trends of CO and NO2 Pollutants in Iran during COVID-19 Pandemic Using Timeseries Sentinel-5 Images in Google Earth Engine. Pollutants 2022, 2, 156–171. [Google Scholar] [CrossRef]
- Ghasempour, F.; Sekertekin, A.; Kutoglu, S.H. Google Earth Engine based spatio-temporal analysis of air pollutants before and during the first wave COVID-19 outbreak over Turkey via remote sensing. J. Clean. Prod. 2021, 319, 128599. [Google Scholar] [CrossRef] [PubMed]
- Halder, B.; Ahmadianfar, I.; Heddam, S.; Mussa, Z.H.; Goliatt, L.; Tan, M.L.; Sa’adi, Z.; Al-Khafaji, Z.; Al-Ansari, N.; Jawad, A.H.; et al. Machine learning-based country-level annual air pollutants exploration using Sentinel-5P and Google Earth Engine. Sci. Rep. 2023, 13, 7968. [Google Scholar] [CrossRef] [PubMed]
- Guanter, L.; Aben, I.; Tol, P.; Krijger, J.M.; Hollstein, A.; Köhler, P.; Damm, A.; Joiner, J.; Frankenberg, C.; Landgraf, J. Potential of the TROPOspheric Monitoring nstrument (TROPOMI) onboard the Sentinel-5 Precursor for the monitoring of terrestrial chlorophyll fluorescence. Atmos. Meas. Tech. 2015, 8, 1337–1352. [Google Scholar] [CrossRef] [Green Version]
- Vigouroux, C.; Langerock, B.; Augusto Bauer Aquino, C.; Blumenstock, T.; Cheng, Z.; de Maziere, M.; DeSmedt, I.; Grutter, M.; Hannigan, J.W.; Jones, N.B.; et al. TROPOMI–Sentinel-5 Precursor formaldehyde validation using an extensive network of ground-based Fourier-transform infrared stations. Atmos. Meas. Tech. 2020, 13, 3751–3767. [Google Scholar] [CrossRef]
- Hachmeister, J.; Schneising, O.; Buchwitz, M.; Lorente, A.; Borsdorff, T.; Burrows, J.P.; Notholt, J.; Buschmann, M. On the influence of underlying elevation data on Sentinel-5 Precursor TROPOMI satellite methane retrievals over Greenland. Atmos. Meas. Tech. 2022, 15, 4063–4074. [Google Scholar] [CrossRef]
- Ialongo, I.; Virta, H.; Eskes, H.; Hovila, J.; Douros, J. Comparison of TROPOMI/Sentinel-5 Precursor NO2 observations with ground-based measurements in Helsinki. Atmos. Meas. Tech. 2020, 13, 205–218. [Google Scholar] [CrossRef] [Green Version]
- Verhoelst, T.; Compernolle, S.; Pinardi, G.; Lambert, J.-C.; Eskes, H.J.; Eichmann, K.-U.; Fjæraa, A.M.; Granville, J.; Niemeijer, S.; Cede, A.; et al. Ground-based validation of the Copernicus Sentinel-5p TROPOMI NO2 measurements with the NDACC ZSL-DOAS, MAX-DOAS and Pandonia global networks. Atmos. Meas. Tech. Discuss. 2021, 14, 481–510. [Google Scholar] [CrossRef]
- Muniraj, K.; Panneerselvam, B.; Devaraj, S.; Jesudhas, C.J.; Sudalaimuthu, K. Evaluating the effectiveness of emissions reduction measures and ambient air quality variability through ground-based and Sentinel-5P observations under the auspices of COVID pandemic lockdown in Tamil Nadu, India. Int. J. Environ. Anal. Chem. 2021, 1–12. [Google Scholar] [CrossRef]
- Sha, M.K.; Langerock, B.; Blavier, J.F.L.; Blumenstock, T.; Borsdorff, T.; Buschmann, M.; Dehn, A.; De Mazière, M.; Deutscher, N.M.; Feist, D.G.; et al. Validation of methane and carbon monoxide from Sentinel-5 Precursor using TCCON and NDACC-IRWG stations. Atmos. Meas. Tech. 2021, 14, 6249–6304. [Google Scholar] [CrossRef]


| City | Year | |||
|---|---|---|---|---|
| 2018 | 2019 | 2020 | 2021 | |
| Simferopol | 4.229 | 5.986 | 7.092 | 7.811 |
| Sevastopol | 3.034 | 5.511 | 6.882 | 6.665 |
| Bakhchisaray | 1.732 | 2.258 | 2.468 | 2.52 |
| Yalta | 0.314 | 0.491 | 0.623 | 0.61 |
| Saki | 0.331 | 0.775 | 0.961 | 2.408 |
| Alushta | 0.268 | 0.414 | 0.395 | 0.395 |
| Index. Average Value | Year | River Basins | ||||
|---|---|---|---|---|---|---|
| Zapadnyy Bulganak | Alma | Kacha | Belbek | Chernaya | ||
| Aerosol Index | 2018 | −0.89 | −0.96 | −0.94 | −0.97 | −0.96 |
| 2019 | −1.07 | −1.12 | −1.13 | −1.12 | −1.15 | |
| 2020 | −1.35 | −1.42 | −1.40 | −1.41 | −1.43 | |
| 2021 | −0.88 | −0.91 | −0.91 | −0.92 | −0.91 | |
| 2022 | −0.31 | −0.38 | −0.37 | −0.38 | −0.37 | |
| Methane—CH4 (mol/mol) | 2019 | 1858.7 | 1837.6 | 1831.4 | 1828.7 | 1858.4 |
| 2020 | 1880.8 | 1858.6 | 1857.8 | 1873.6 | 1861.1 | |
| 2021 | 1884.5 | 1872.8 | 1869.8 | 1875.6 | 1893.6 | |
| 2022 | 1889.7 | 1876.4 | 1877.6 | 1881.6 | 1881.0 | |
| Carbon Monoxide—CO (mol/m2) | 2018 | 0.031 | 0.030 | 0.030 | 0.030 | 0.031 |
| 2019 | 0.033 | 0.032 | 0.031 | 0.031 | 0.032 | |
| 2020 | 0.033 | 0.032 | 0.032 | 0.032 | 0.033 | |
| 2021 | 0.035 | 0.034 | 0.033 | 0.033 | 0.034 | |
| 2022 | 0.031 | 0.030 | 0.030 | 0.030 | 0.030 | |
| Formaldehyde—HCHO (mol/m2) | 2018 | 0.000048 | 0.000043 | 0.000041 | 0.000039 | 0.000041 |
| 2019 | 0.000099 | 0.000098 | 0.000101 | 0.000105 | 0.000099 | |
| 2020 | 0.000086 | 0.000086 | 0.000089 | 0.000088 | 0.000092 | |
| 2021 | 0.000082 | 0.000078 | 0.000084 | 0.000081 | 0.000089 | |
| 2022 | 0.000081 | 0.000084 | 0.000083 | 0.000086 | 0.000089 | |
| Nitrogen Dioxide—NO2 (mol/m2) | 2018 | 0.000027 | 0.000023 | 0.000022 | 0.000021 | 0.000023 |
| 2019 | 0.000025 | 0.000022 | 0.000022 | 0.000021 | 0.000023 | |
| 2020 | 0.000025 | 0.000022 | 0.000021 | 0.000021 | 0.000022 | |
| 2021 | 0.000025 | 0.000022 | 0.000021 | 0.000020 | 0.000021 | |
| 2022 | 0.000025 | 0.000023 | 0.000022 | 0.000021 | 0.000022 | |
| Sulfur Dioxide—SO2 (mol/m2) | 2019 | 0.00019 | 0.00017 | 0.00015 | 0.00015 | 0.00012 |
| 2020 | 0.00024 | 0.00025 | 0.00025 | 0.00020 | 0.00016 | |
| 2021 | 0.00012 | 0.00015 | 0.00016 | 0.00017 | 0.00016 | |
| 2022 | 0.00018 | 0.00020 | 0.00018 | 0.00017 | 0.00017 | |
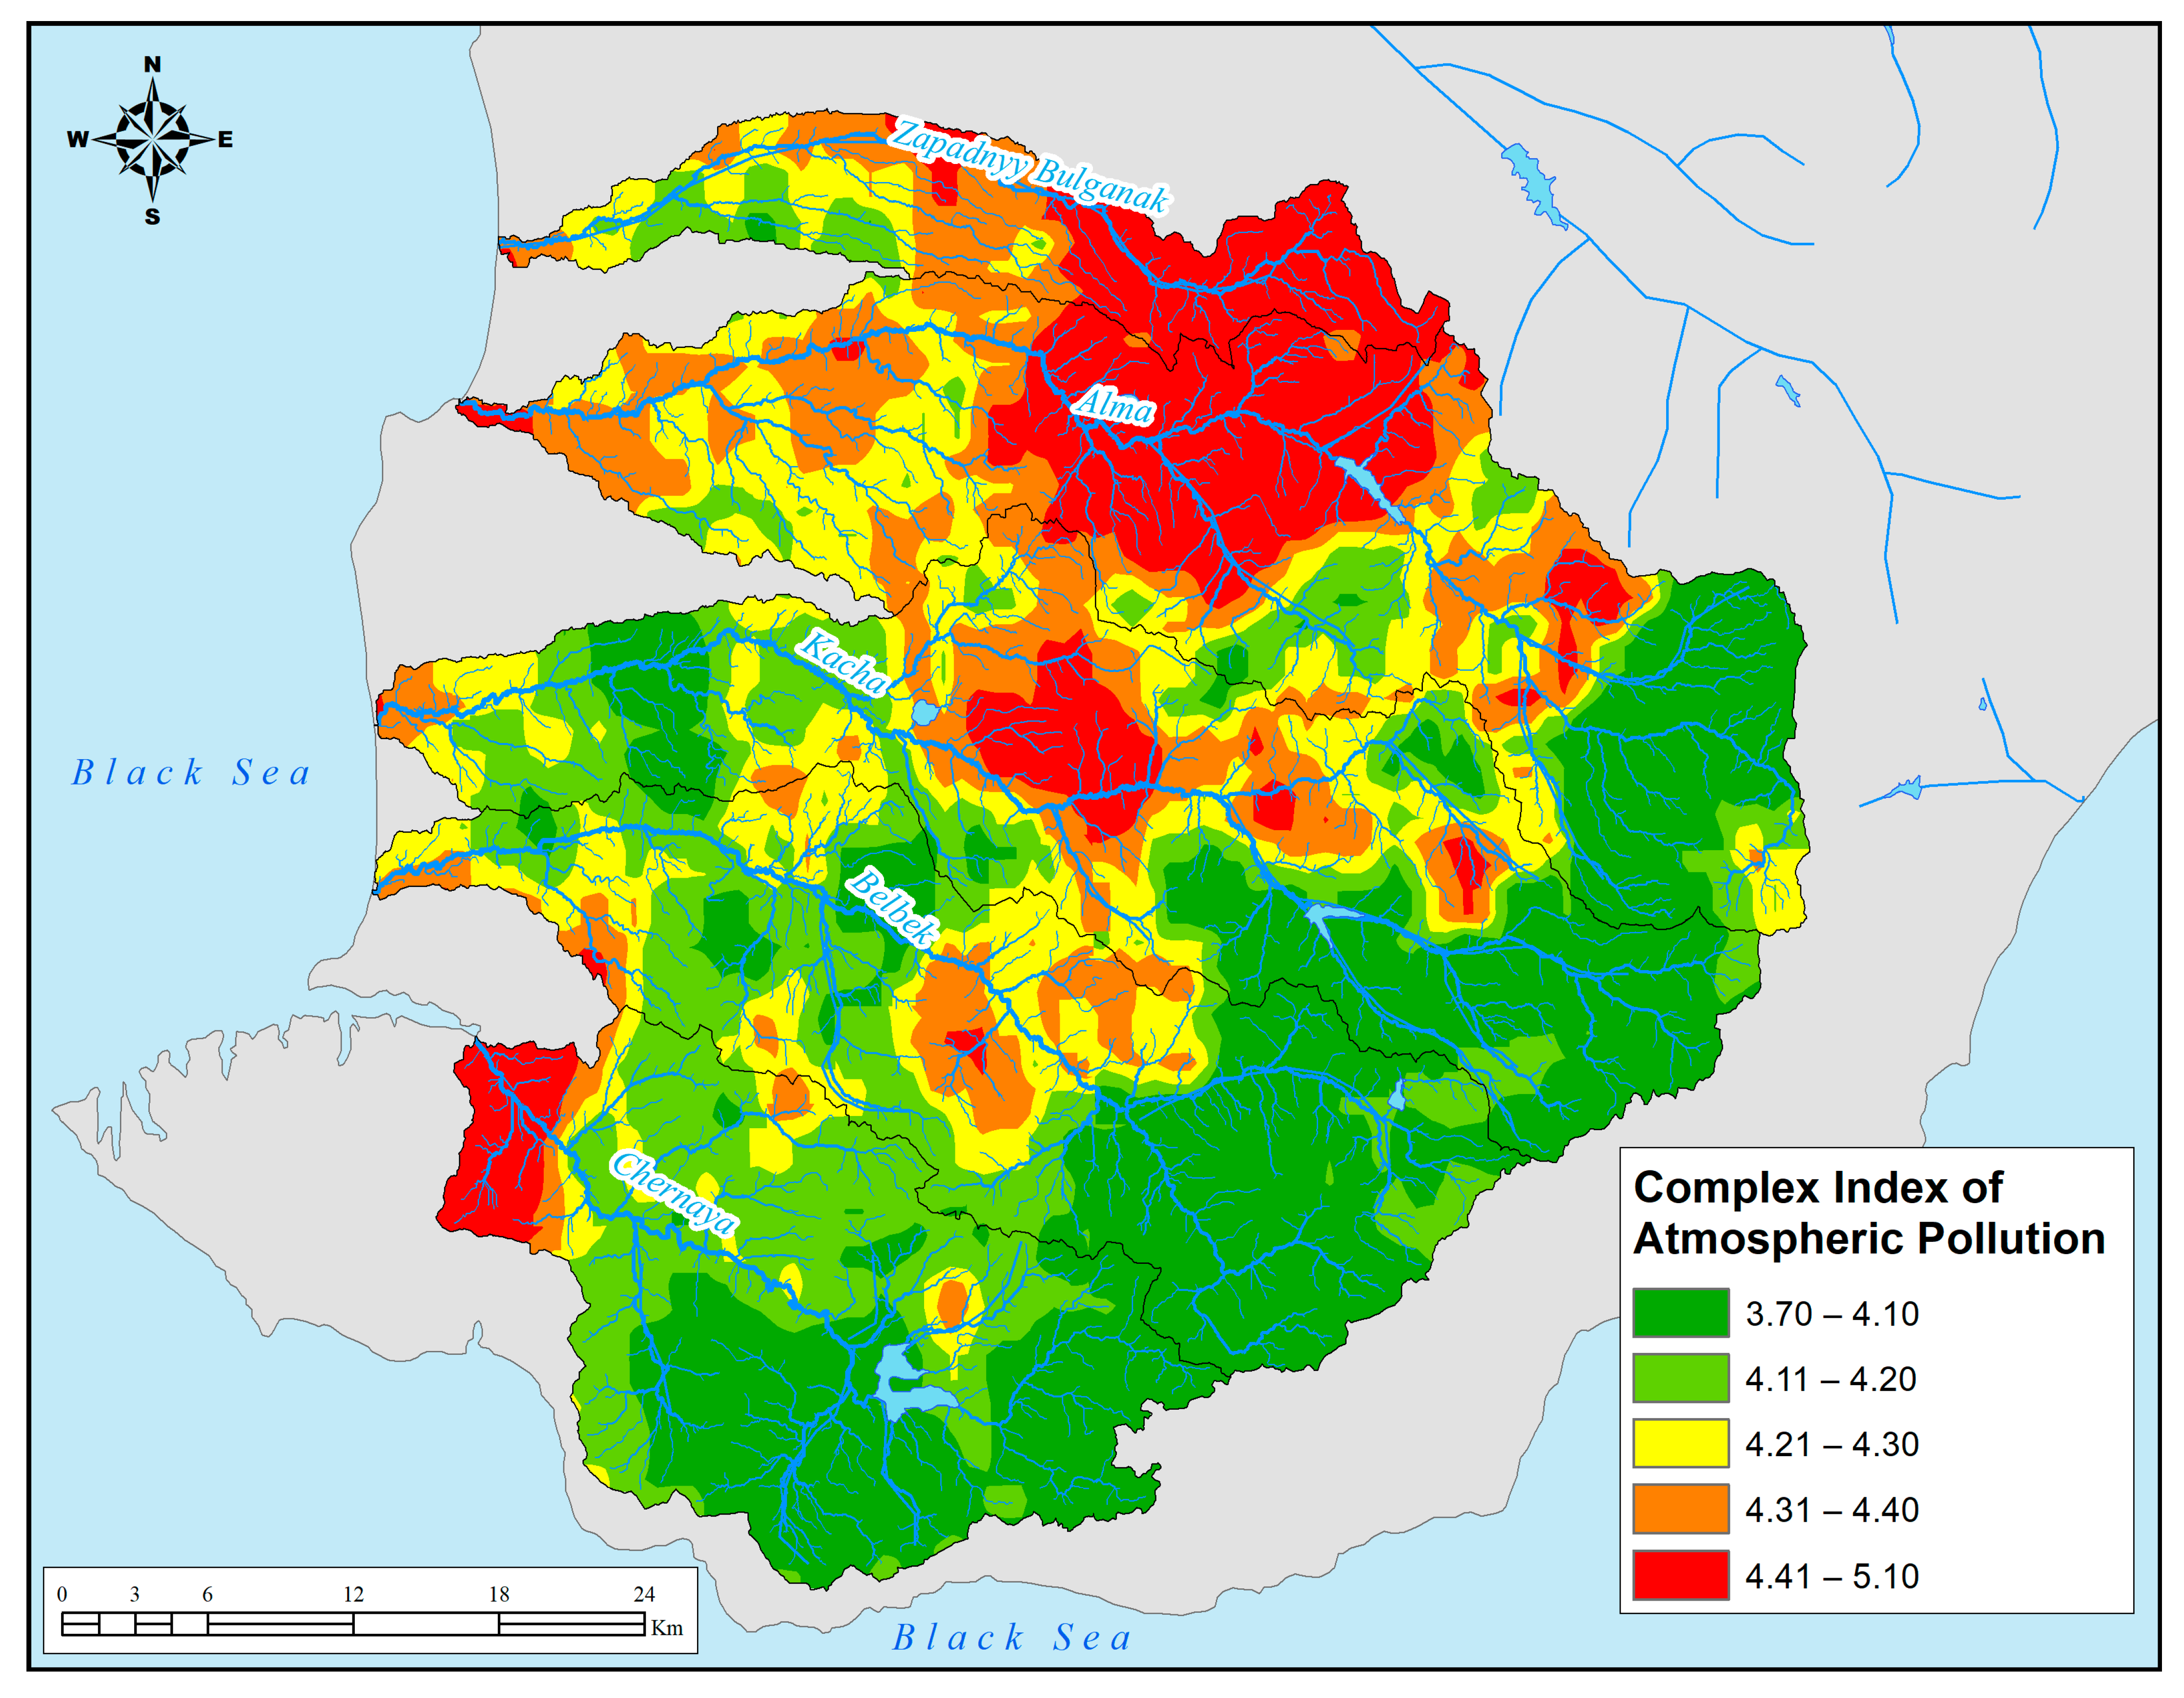
| Year | Study Area as a Whole | River Basin | ||||
|---|---|---|---|---|---|---|
| Zapadnyy Bulganak | Alma | Kacha | Belbek | Chernaya | ||
| 2019 | 5.21 | 5.54 | 5.22 | 5.12 | 5.13 | 5.02 |
| 2020 | 5.40 | 5.64 | 5.50 | 5.49 | 5.22 | 5.12 |
| 2021 | 4.97 | 4.98 | 4.90 | 4.96 | 4.93 | 5.09 |
| 2022 | 5.09 | 5.19 | 5.20 | 5.03 | 4.97 | 5.06 |
Disclaimer/Publisher’s Note: The statements, opinions and data contained in all publications are solely those of the individual author(s) and contributor(s) and not of MDPI and/or the editor(s). MDPI and/or the editor(s) disclaim responsibility for any injury to people or property resulting from any ideas, methods, instructions or products referred to in the content. |
© 2023 by the authors. Licensee MDPI, Basel, Switzerland. This article is an open access article distributed under the terms and conditions of the Creative Commons Attribution (CC BY) license (https://creativecommons.org/licenses/by/4.0/).
Share and Cite
Tabunschik, V.; Gorbunov, R.; Gorbunova, T. Unveiling Air Pollution in Crimean Mountain Rivers: Analysis of Sentinel-5 Satellite Images Using Google Earth Engine (GEE). Remote Sens. 2023, 15, 3364. https://doi.org/10.3390/rs15133364
Tabunschik V, Gorbunov R, Gorbunova T. Unveiling Air Pollution in Crimean Mountain Rivers: Analysis of Sentinel-5 Satellite Images Using Google Earth Engine (GEE). Remote Sensing. 2023; 15(13):3364. https://doi.org/10.3390/rs15133364
Chicago/Turabian StyleTabunschik, Vladimir, Roman Gorbunov, and Tatiana Gorbunova. 2023. "Unveiling Air Pollution in Crimean Mountain Rivers: Analysis of Sentinel-5 Satellite Images Using Google Earth Engine (GEE)" Remote Sensing 15, no. 13: 3364. https://doi.org/10.3390/rs15133364
APA StyleTabunschik, V., Gorbunov, R., & Gorbunova, T. (2023). Unveiling Air Pollution in Crimean Mountain Rivers: Analysis of Sentinel-5 Satellite Images Using Google Earth Engine (GEE). Remote Sensing, 15(13), 3364. https://doi.org/10.3390/rs15133364