
Significant Stratospheric Moistening Following Extreme El Niño Events
by
 ,
,
Quanliang Chen
1, 
Yujing Liao
1,*,
Xin Zhou
1,
Ting Duan
2,
Xiaotian Xue
3,
Ziqi Zhang
1,
Dandan Dong
1 and
Wuhu Feng
4,5 1
Plateau Atmospheric and Environment Key Laboratory of Sichuan Province, School of Atmospheric Science, Chengdu University of Information Technology, Chengdu 610225, China
2
Guanghan College, Civil Aviaition Flight University of China, Guanghan 618307, China
3
Unit 78127 of People’s Liberation Army, Chengdu 610032, China
4
National Centre for Atmospheric Science (NCAS), University of Leeds, Leeds LS2 9JT, UK
5
School of Earth and Environment, University of Leeds, Leeds LS2 9JT, UK
*
Author to whom correspondence should be addressed.
Remote Sens. 2023, 15(13), 3346; https://doi.org/10.3390/rs15133346
Submission received: 22 May 2023
/
Revised: 20 June 2023
/
Accepted: 27 June 2023
/
Published: 30 June 2023
(This article belongs to the Special Issue Effects of Stratosphere-Troposphere-Land-Ocean Interaction on the Atmospheric Environment and Ecosystem II)
Abstract
:The moistening impact of El Niño on the tropical lower stratosphere has been extensively studied, yet a long-standing challenge is its potential nonlinearities regarding the strength of El Niño. Extreme El Niño’s hydration in 2015/2016 was unprecedented in the satellite era, providing a great opportunity to distinguish the differential response of water vapor to extreme and moderate El Niño. Using ERA5 and MERRA-2 reanalysis data from 1979–2019, we compare the composite tropical lower stratospheric water vapor anomalies throughout all extreme and moderate El Niño episodes since the satellite era. We validate the variations in the lower stratospheric water vapor during the two distinct El Niño episodes using a three-dimensional chemistry transport model simulating the same period. The model reproduces the observed pattern in lower stratospheric water vapor. Both demonstrate that robust moistening during extreme El Niño events occurs throughout the tropical lower stratosphere. However, moderate El Niño events seem to have a weak effect on lower stratospheric water vapor. In comparison to moderate El Niño, the strong convective activities induced by extreme El Niño release large amounts of latent heat, causing extensive and intense warming in the tropical upper troposphere and lower stratosphere, thus greatly increasing the water vapor content in the tropical lower stratosphere. Additionally, moderate El Niño events have strong seasonality in their hydration effect in the tropics, whereas the intense moistening effect of extreme El Niño events prevails in all seasons during their episodes.
1. Introduction
Water vapor is one of the key factors driving weather and climate change and has an important position in the Earth’s climate system [1,2,3]. Stratospheric water vapor, as a natural greenhouse gas, on the one hand, absorbs and radiates heat from the Earth’s surface and atmosphere, regulating the Earth’s energy balance [4,5]. On the other hand, stratospheric water vapor participates in chemical reactions in the atmosphere (especially ozone-related reactions) and plays an important role in the formation and destruction of the ozone layer [6,7]. In addition, the mutual transport of tropospheric and stratospheric water vapor can change the temperature distribution in the stratosphere, further affecting the global atmospheric circulation [8,9]. Therefore, researching the trends and impacting factors of stratospheric water vapor change has great reference value for further study of stratospheric-tropospheric exchange and future climate change [10,11].
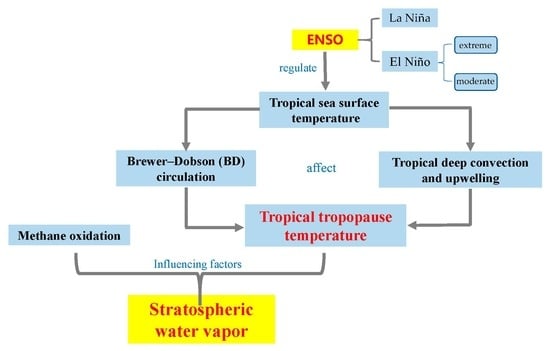
According to previous studies, the quantity of water vapor that enters the stratosphere is governed by four key factors; the first and most important of which is the tropical tropopause temperature [12,13,14]. The entry of tropospheric air into the stratosphere occurs via the tropical tropopause layer, where the extremely low temperatures of the tropopause result in condensation and dehydration, ultimately controlling the content of water vapor reaching the lower stratosphere [12,15,16,17]. Brewer–Dobson (BD) circulation is a vertical meridional circulation driven by atmospheric motion in the stratosphere, which affects the tropopause temperature through dynamical cooling, thus regulating the water vapor concentration in the stratosphere [18,19,20]. This is the second factor that influences the concentration of water vapor in the stratosphere. Additionally, deep tropical convection and upwelling transport water vapor from the troposphere to the stratosphere, whereas convective activities release large amounts of latent heat to heat the tropical tropopause, thereby influencing the water vapor content of the stratosphere [21]. The fourth influencing factor is the oxidative decomposition of methane, which mainly contributes to the water vapor in the upper and middle stratosphere [22].
The El Niño-Southern Oscillation (ENSO) phenomenon is a natural climate pattern formed by changes in sea surface temperature (SST) and pressure over the tropical Pacific Ocean, which represents the interaction between the anomalous variability of SST in the equatorial Pacific Ocean and the global atmospheric circulation [23,24,25]. Previous studies pointed out that ENSO has a significant influence on the interannual and even interdecadal fluctuations of global mean temperature, in which the non-adiabatic exchange of heat between the ocean and the atmosphere contributes significantly [26,27]. The atmospheric water vapor concentration is regulated by global temperature variations, and prior research has also demonstrated that ENSO can impact water vapor content both in the troposphere and stratosphere [28,29,30,31]. For the troposphere, ENSO is a key component of interannual variability in the troposphere, and due to its significant correlation with tropical Pacific SST, convection and zonal advection, ENSO can further modify atmospheric circulation and wind direction in the troposphere, thereby affecting tropospheric temperature, water vapor content and precipitation distribution [32,33,34]. Kim et al. [2] quantified the dynamics and thermodynamic processes of water vapor transport during ENSO events and found that the variation of the low-frequency circulation (dynamical processes) was the main contributor to the seasonally averaged water vapor transport anomalies. A recent study by Johnston et al. [30] pointed out that ENSO is strongly correlated with water vapor entering the upper subtropical troposphere and the lower mid-latitude stratosphere and that moisture anomalies in the tropics during ENSO events are closely related to the variability of deep convection. For the stratosphere, prior research has indicated that ENSO has the ability to regulate the temperature and transportation mechanisms in the tropical tropopause, which subsequently impacts the amount of water vapor in the stratosphere [29,35,36,37]. Specifically, the amplification of deep convection and upwelling in the tropics during the warm phase of ENSO (El Niño) causes the tropopause to warm above the warm pool, permitting more water vapor to penetrate the lower stratosphere [18,31,38,39,40,41]. Scaife et al. [28] proposed as early as 2003 that El Niño causes a 10% increase in the concentration of water vapor entering the stratosphere. In contrast, during La Niña activity (the cold phase of ENSO), the relatively colder temperature in the upper troposphere may have a drying effect on the lower stratosphere in the tropics [42,43]. It is worth noting that a 2011 study by Xie et al. [31] noted that this drying effect of La Niña on the lower stratosphere occurs primarily in a narrow band of 5°S–5°N in the tropics, whereas the entire stratosphere is wet for the wider tropics (25°S–25°N), which also serves as a reminder to pay attention to the zonal mean heterogeneity when analyzing the effect of La Niña activity on stratospheric water vapor. In addition, El Niño induces a Rossby wave response that causes anomalous warming in the tropopause near the Indo-Pacific warm pool and anomalous cooling in the tropopause near the east-central Pacific [27,44]. The content of water vapor increases in the area with warmer temperature and reduces in the area with colder temperature within the tropical tropopause [17,35,45].
However, no two El Niño or La Niña events are identical, and considering the complexity and diversity of ENSO events, scientists have divided them into different categories to investigate their fundamental mechanisms and impacts on lower stratospheric water vapor. ENSO episodes can be categorized as either Eastern-Pacific (EP) or Central-Pacific (CP) events depending on where the warm SST anomalies are located [46]. According to research by Garfinkel et al. [47] utilizing chemistry-climate models, EP El Niño episodes cause much more water vapor to enter the stratosphere than CP El Niño events do, with this difference approaching 0.3 ppmv in some calendar months. However, a subsequent study by Garfinkel et al. [41] again clarified that it might not be crucial to discriminate between EP and CP events and that it is more critical to distinguish between very intense El Niño events and moderate El Niño events. That is, different intensities of ENSO events are more likely to cause differences in the net effect of stratospheric water vapor. Therefore, researchers have further distinguished between strong and moderate ENSO events depending on their magnitude [48,49,50] and found that strong ENSO events contribute to wetting the tropical lower stratosphere, while weak or moderate ENSO events cause dehydration, which shows that the response of stratospheric temperature and water vapor to ENSO is nonlinear during boreal spring [41]. In addition, Rao and Ren [49,50,51] revealed that the moderate El Niño and the strong La Niña caused considerable nonlinearity and asymmetry in the boreal winter, controlling the northern winter stratospheric variability more well than the former and the latter. Furthermore, the effect of ENSO on stratospheric water vapor also has a nonlinear seasonal dependence [17,18,47,52], with El Niño-related increases and La Niña-related decreases occurring primarily in the boreal spring.
A recent study shows that greenhouse warming and internal variability have increased the frequency of extreme and central Pacific El Niño since 1980 [53]. In the last 40 years, there have been three extremely powerful El Niño occurrences, including 1982/1983, 1997/1998 and 2015/2016, which caused a reorganization of atmospheric convection, triggering catastrophic floods and droughts in the Pacific, leading to severe disruptions in global climate [54,55,56,57]. Due to the considerable impact of extreme El Niño on global climate patterns, some scholars have focused their attention on the stratospheric response to extreme El Niño in recent years. Rao and Ren [58] performed a parallel comparison of three extreme El Niño using multiple sea surface temperature datasets and pointed out that the three extreme El Niño had a large impact on the troposphere to stratosphere atmospheric circulation, but extreme El Niño events were less efficient in regulating the extratropical stratospheric circulation than moderate events. Zhou et al. [59] compared the differential effects of extreme and moderate El Niño on the stratosphere in boreal winter, revealing that the response of the Northern Hemisphere stratospheric vortex to extreme El Niño is four times stronger than that to moderate El Niño but they did not note the difference in the response of stratospheric water vapor to extreme and moderate El Niño. Fueglistaler et al. [42] used the model to calculate the interannual variability of water vapor in the tropical lower stratosphere and noted that the 1997/1998 super strong El Niño resulted in a wetness anomaly of 0.5 ppmv in the stratosphere. Using observation and simulation, Avery et al. [60] found that the hydrologic budget of the tropics experienced a remarkable perturbation due to the extreme 2015/16 El Niño, resulting in record-high levels of water vapor concentrations across the tropical Western Pacific over a decade, which coincided with anomalies in warm tropopause temperatures.
In general, previous studies have mainly concentrated on extreme and moderate El Niño impacts on stratospheric temperature and circulation or on changes in stratospheric water vapor concentration triggered by individual extreme El Niño events. However, there is no systematic way to quantify the difference in the net impact of stratospheric water vapor caused by extreme El Niño events versus ordinary events. In addition, as mentioned before, water vapor in the stratosphere response to ENSO exhibits a remarkable seasonal dependence, and previous studies have focused more on the interannual scales variability due to extreme events without discussing whether the effects of extreme El Niño events on stratospheric water vapor also exhibit seasonal evolution. Therefore, this study compares the composites, including stratospheric water vapor, temperature and circulations during extreme and moderate El Niño events, aimed to address their different impacts on water vapor in the tropical lower stratosphere and discuss the causes for these differences.
2. Data and Methods
2.1. Data
This study primarily used monthly mean water vapor, temperature and outgoing longwave radiation (OLR) data for a total of 41 years from 1979–2019. Among them, the water vapor and temperature data are obtained from ERA5 reanalysis data with a horizontal resolution of 0.5° × 0.5°, MERRA-2 reanalysis data with a horizontal resolution of 0.5° × 0.625°, and TOMCAT model data with a horizontal resolution of 1° × 1°. In addition, the OLR data are derived from ERA5 reanalysis data.
2.1.1. ERA5
ERA5 is a fifth-generation global climate reanalysis dataset developed by the European Centre for Medium-Range Weather Forecasts (ECMWF) that provides comprehensive meteorological information from 1979 to the present [61]. It combines various observational data, such as satellite, radiosonde and surface observations, with numerical weather prediction model outputs using data assimilation techniques to generate high spatiotemporal resolution (0.25 degrees latitude/longitude grid, hourly) global meteorological reanalysis data up to 137 levels, covering the atmosphere from high altitude (0.1 hPa) to the surface (ground).
The ERA5 dataset includes a wide range of meteorological variables, including temperature, humidity, wind speed, wind direction, precipitation, cloud cover, pressure and more. These data can be used in various fields, such as climate research, weather forecasting, meteorological disaster warning, agriculture, water resources management, energy planning, environmental monitoring and many other applications. What’s more, the ERA5 dataset is known for its high data quality, global coverage, long-term coverage and comprehensive recording of multiple meteorological variables.
2.1.2. MERRA-2
The MERRA-2 (Modern-Era Retrospective Analysis for Research and Applications, Version 2) dataset is a global reanalysis dataset developed by the National Aeronautics and Space Administration (NASA) that provides comprehensive meteorological information from 1980 to the present [62]. MERRA-2 is based on a state-of-the-art data assimilation system that integrates a wide range of observational data, such as satellite, aircraft and surface observations, with a global atmospheric model to produce a consistent and coherent representation of the Earth’s atmosphere over time. It has a 3 hourly temporal resolution, a vertical resolution of 72 levels from the surface to 10 Pa, and a horizontal resolution of roughly 50 km (0.5° × 0.625°). MERRA-2 incorporates observation types not accessible in its predecessor, MERRA, as well as upgrades to the Goddard Earth Observing System (GEOS) model and analysis scheme, making it a feasible long-term climate analysis beyond MERRA. Additionally, products from MERRA-2 can be accessed online at the Goddard Earth Sciences Data Information Services Centre (GES DISC) of NASA.
2.1.3. TOMCAT
The Tropospheric Ozone Modelling for Climate and Atmospheric Chemistry (TOMCAT) model [7] is a global 3D chemistry-transport model that simulates the distribution and evolution of atmospheric constituents, including ozone, aerosols and other trace gases, in the troposphere [63,64] and lower stratosphere [65,66]. Typical model data include outputs of various atmospheric variables, such as concentrations of ozone, aerosols and other trace gases, and meteorological variables, such as temperature, wind speed and precipitation. These data are typically available at different vertical levels and temporal resolutions, depending on the specific configuration and application of the TOMCAT model. In addition, the model employs a σ–p coordinate system, with surface levels corresponding to the terrain (σ) and higher levels (>100 hPa, up to 0.1 or 0.01 Pa) utilizing pressure levels (p). For multidecadal stratospheric investigations, the typical horizontal resolution ranges from 2.8° × 2.8° to 1° × 1° for brief case studies.
For this study, the chemical transport model (CTM) configuration employed is comparable to the recent control simulations used by Feng et al. [65]. That is, for the TOMCAT model to be specified, we use the ERA5 reanalysis product of temperature, vorticity, divergence and specific humidity to force the model. Thirty-two hybrid sigma-pressure levels are used in the simulations, which are run with a horizontal resolution of 2.8° by 2.8° and cover a distance of around 60 km [67]. The model incorporates time-dependent observed global mean surface mixing ratios for the main greenhouse gases and ozone-depleting substances, which are treated as well mixed throughout the troposphere. The impacts of solar flux fluctuation and heterogeneous chemistry on volcanically increased stratospheric aerosol are also taken into account in the model [68,69]. In addition, TOMCAT incorporates contributions from VSLSs that contribute chlorine and bromine, as described in Hossaini et al. [70]. TOMCAT has been widely used in atmospheric chemistry and climate studies to investigate long-term changes in atmospheric composition and stratospheric trace gases, demonstrating excellent agreement with numerous ground-based and satellite-based data sets [65,71,72,73].
2.2. Methods
In this study, we mainly use composite analysis to discuss the effects of extreme and moderate El Niño, and the Oceanic Niño Index (ONI) is used to distinguish between extreme and moderate El Niño events. The ONI is defined by the National Oceanic and Atmospheric Administration (NOAA) and is calculated as the 3 month running average of SST anomalies in the Niño 3.4 region, which is an area of the tropical Pacific Ocean extending from 120°W to 170°W longitude and from 5°N to 5°S latitude. ONI can be used to characterize ENSO events, with large consecutive positive ONI values indicating El Niño conditions while large consecutive negative ONI values indicating La Niña conditions. Specifically, 5 consecutive months with ONI equal to or greater than +0.5 °C is defined as an El Niño event. In our study, 5 consecutive months with ONI equal to or greater than +2.0 °C is defined as an “extreme” El Niño event, while other El Niño events are identified as “moderate” El Niño events [59,74]. The ONI reports that in the 41 years from 1979 to 2019, there were 3 extreme El Niño events and 9 moderate El Niño events. Table 1 lists the specific years in which the extreme and moderate El Niño events occurred. In addition, monthly anomalies were obtained by subtracting the monthly climatic state average from the monthly raw values for 41 years. Meanwhile, the stratospheric water vapor and temperature also filtered out 24–32 months of the perturbation signal in order to avoid the possible influence of the stratospheric quasi-biennial oscillation (QBO) signal.
3. Results
First, the water vapor data in ERA5 and MERRA-2 are mainly based on conventional observations (such as radiosondes or satellite retrievals), whereas the stratospheric water vapor simulated in TOMCAT is mainly produced by the chemical reactions (e.g., methane oxidation). Differences may exist between observed and simulated values. In order to make a more intuitive comparison of the water vapor data and to quantify the tropical-averaged stratospheric water vapor concentration, Figure 1a shows the monthly time series of stratospheric water vapor anomalies averaged in the tropics (30°N–30°S) at 100 hPa from 1980 to 2020 for the two analysis dataset ERA5 and MERRA-2, along with simulations by TOMCAT. In addition, the seasonal variation of stratospheric water vapor climatology in the tropics from 1980–2020 for the three datasets are presented in Figure 1b–d, respectively. Apparently, the water vapor for climatology and anomalies in the three datasets agree well with each other, with the best agreement between ERA5 and TOMCAT. From the climatology of water vapor, there is a significant seasonal variation in the concentration of stratospheric water vapor, with a minimum of 3.5 ppmv in winter and up to 5.4 ppmv in summer, which is consistent with previous studies [75,76,77]. In terms of water vapor anomalies, the anomalous values of 100 hPa water vapor generally ranged from −0.75 to 0.75 ppmv during 1980–2020, implying an amplitude of 10–20% of stratospheric water vapor variability [78,79]. It is worth noting that a large water vapor anomaly occurred in 1983, which may have been triggered by the volcanic eruptions of El Chichón in Mexico in 1982. Following the volcanic eruption, a massive volume of volcanic aerosols heated the stratosphere, leading to a significant increase in the water vapor content of the stratosphere [80]. Apart from the seasonal cycle, the time series also exhibits strong interannual variability, in line with previous studies [42]. The majority of the interannual variability is due to interannual changes in the tropical sea surface temperature, especially ENSO.
3.1. Water Vapor Response to Extreme and Moderate El Niño
Since the majority of El Niño occurrences mature in winter (December, January and February) and gradually decay the following spring (March, April and May), we will focus on the changes in the lower stratospheric water vapor in El Niño winter and the following spring. Based on ERA5, MERRA-2 and TOMCAT simulations, Figure 2 shows the vertical profiles of tropical-averaged stratospheric water vapor anomalies during extreme and moderate El Niño winters and the following springs. The water vapor anomalies in the lower stratosphere are substantially stronger during extreme El Niño events than during moderate events in all three datasets. The tropical lower stratosphere experiences significant wetting during extreme El Niño episodes, with the stratospheric water vapor increase exceeding 0.4 ppmv in both the El Niño winter and the following spring. In contrast, in the case of moderate El Niño, the lower stratospheric water vapor shows a rather weak, if any, decrease in the winters and a weak increase at 100 hPa (~0.1 ppmv) in the following springs. (Figure 2a,e). Interestingly, the water vapor wetting value of the extreme El Niño in spring is four times that of the moderate El Niño, which corresponds to the four times higher response of the Northern Hemisphere stratospheric vortex to extreme El Niño than moderate event derived by Zhou et al. [59]. The results for MERRA-2 are similar to those of ERA5 and TOMCAT, but the stratospheric water vapor increase in MERRA-2 is close to 0.3 ppmv during extreme events. In addition, we also note that the water vapor increase does not significantly vary from winter to spring during extreme events, while it slightly increases during moderate El Niño events.
It appears that the impacts of El Niño on tropical lower stratospheric water vapor vary depending on its magnitude, with extreme events tending to strongly moisten the lower stratosphere while moderate events have less pronounced effects. In order to better understand the different impacts of extreme and moderate El Niño on tropical lower stratospheric water vapor, we now consider the seasonality of the response of lower stratospheric water vapor to El Niño events. Figure 3 shows the composite water vapor anomalies for extreme and moderate El Niño throughout the El Niño year. During extreme El Niño episodes, it is evident that the tropical lower stratosphere experiences intense wetting, persisting for four seasons in both ERA5 and TOMCAT. The peak occurs at 0.4 ppmv during winter and spring. MERRA-2 shows the wetness persists for three seasons with a maximum of 0.3 ppmv. However, significant seasonal evolution occurs in water vapor response to moderate El Niño events, with three datasets exhibiting weak wetness in the lower stratosphere in spring but little change in the other seasons. Although there are some differences in the anomalous wetting amplitude in different datasets, the results of ERA5, TOMCAT and MERRA-2 all show the strong wetting of the tropical lower stratosphere in extreme El Niño years with small seasonal dependence while weak changes with evident seasonality during moderate El Niño years.
In general, the tropical lower stratosphere experienced significant wetting throughout the season during extreme El Niño events, especially in winter and spring, while the response of water vapor during moderate El Niño events exhibits distinct seasonal evolutions, with invariant in winter and weakly wet in spring. This result also confirms the conclusion in Figure 2 that extreme El Niño gives rise to the lower stratosphere wetter violently, whereas moderate El Niño has little effect on the lower stratosphere.
Figure 4 shows the composite water vapor anomalies at 100 hPa for extreme and moderate El Niño averaged in winter and spring. Similarly, the pattern of water vapor anomalies in the ERA5, MERRA-2 and TOMCAT simulations are in close agreement. Extensive wetting overwhelms the tropics during extreme El Niño, with its strongest changes over the warm Indo-Western Pacific. Even though the Central-Eastern Pacific saw small areas of dryness in winter, the dryness there was far less intense and widespread than the wetness in the tropics. On the contrary, during moderate El Niño winters, dipole-shaped wet and dry regions of comparable intensity are observed in the Indo-Western Pacific and Central-Eastern Pacific, respectively. This is similar to the previously observed annual average distribution of 100 hPa water vapor in response to the El Niño signal [30,31,43], i.e., cooling in the tropical central-eastern Pacific at 100 hPa is accompanied by negative water vapor anomalies, while warming in the western Pacific corresponds to positive water vapor anomalies. However, unlike the distribution of annual mean water vapor anomalies, the wetness of the western Pacific is comparable to the dryness of the central-eastern Pacific during the winter of moderate El Niño; thus, the net impact of water vapor in the lower stratosphere tends to be zero after zonally averaged. Moreover, from winter to spring, the drier areas in the Central-Pacific almost disappeared during both extreme and moderate events, which helped to wet the entire tropical lower stratosphere in the spring.
To further demonstrate the differences in how the lower stratospheric water vapor responds to the two magnitude El Niño events, the zonal distribution of the winter and spring water vapor anomalies are displayed in Figure 5. Likewise, the patterns of TOMCAT are largely the same as ERA5 for both seasons, and the result of MERRA-2 are similar to them. It is clear that extreme El Niño results in substantially larger water vapor changes than moderate El Niño. Consistently, during extreme El Niño, the lower and middle stratosphere’s water vapor content increases significantly in the winter and spring, whereas during moderate El Niño, the water vapor content barely changes in the winter and only marginally wets in the spring, failing to pass the 95% significance test. In addition, the magnitude of stratospheric water vapor wetting in extreme El Niño episodes is consistent in both winter and spring, with the maximum value of water vapor anomalies reaching 0.4 ppmv. Contrarily, during moderate El Niño episodes, the lower stratospheric water vapor shows a distinct seasonal development, with water vapor anomalies converging to zero in winter and becoming more prominent in spring. It is worth noting that the wetting of the lower stratosphere in spring occurs mainly in the southern hemisphere, which is consistent with a previous study by Xie et al. [31] that El Niño activity impact on tropical stratospheric water vapor is stronger in the southern hemisphere, where stronger upwelling is present.
Overall, from Figure 2, Figure 3, Figure 4 and Figure 5, we found the significant wetting of the tropical zonal mean (30°S~30°N) stratosphere following extreme El Niño, and this humidification can even reach the middle stratosphere. Although a dipole-like of negative water vapor anomalies appears in the east-central Pacific on the horizontal distribution map of the tropics (Figure 4), this weaker drying zone is neutralized by a super-humid region of the Western Pacific after zonal averaging. As a result, the net effect of the extreme events on the entire tropical stratosphere appears wet. However, the total amount of stratospheric water vapor hardly changes in the winter when moderate El Niño occurs, which is different from previous studies showing that El Niño events can increase stratospheric water vapor [31,35,37,42,81]. This is probably due to the weak effect of moderate El Niño combined with the drastic wetting effect of extreme El Niño. Meanwhile, from the point of view of seasonal evolution, extreme El Niño significantly affects the stratosphere in all seasons, while moderate El Niño responds differently in the stratosphere in different seasons, which also reminds us to distinguish the El Niño response in different seasons in future studies. Next, we will investigate the reasons for the difference in water vapor response to extreme and moderate El Niño.
3.2. Mechanisms of Water Vapor Response to Extreme and Moderate El Niño
As we mentioned in the introduction, the concentrations of water vapor in the lower stratosphere are primarily influenced by the cold tropical tropopause because the temperature of tropopause determines the saturation water vapor pressure, which means whether the ascending moist air in the troposphere is freeze-dried or enters the lower stratosphere. Therefore, the response of the tropopause temperature to El Niño can explain the variation of the lower stratospheric water vapor. In this study, we approximated the tropical tropopause temperature with a temperature of 100 hPa. Figure 6 shows the 100 hPa temperature response to extreme and moderate El Niño in winter and spring, which explains the changes in water vapor at 100 hPa. Since the temperature in TOMCAT mode is driven by ERA5, here we only display the results for ERA5 and MERRA-2. During extreme El Niño events, the relative cooling of the Central-Eastern Pacific is counterbalanced by widespread warming throughout the entire tropics, especially above the warm pool in the Western Pacific. This overall warming effect, resulting from the asymmetric cooling and warming of the tropics, causes an increase in the amount of water vapor in the lower stratosphere. In contrast, the weak warming of the Western Pacific and the weak cooling of the Central-Eastern Pacific during moderate El Niño events lead to negligible temperature variations in the whole tropical region. Another noteworthy thing is that from winter to spring, the weak cooling in the Central-Eastern Pacific region gradually disappeared during the moderate events, which corresponds to the seasonal evolution of stratospheric water vapor during the moderate El Niño events in Figure 4d,f.
Similarly, we next present the zonal distribution of temperature anomalies in two magnitudes of El Niño events in order to provide further elucidation on the variations of stratospheric water vapor. Figure 7 illustrates the zonal distribution of temperature anomalies in the stratosphere during extreme and moderate El Niño events based on ERA5 and MERRA-2. Remarkable warming occurs in the lower stratosphere, and this warm anomaly extends to the middle stratosphere during extreme El Niño winters. Conversely, in moderate events, the cooling in the lower stratosphere is weaker. This change in temperature corresponds to the changes in water vapor; that is, a large increased content of stratospheric water vapor during extreme events and less content of water vapor in moderate events. Furthermore, during the extreme El Niño spring, the lower stratosphere still shows strong warming despite the middle stratosphere conversion to cooling than in the winter. At the same time, anomalous warming appears in the lower stratosphere during moderate spring; thus, a slight moistening occurs in moderate El Niño spring.
The temperature anomalies are interpreted using the tropical convection excited by the ENSO because thermally-induced deep convection occurring in the troposphere releases latent heat and excites equatorial planetary waves, which play a significant role in affecting the temperature of the upper troposphere and lower stratosphere [21]. Outgoing longwave radiation (OLR) serves as an indicator for convection in the tropics, reflecting not only the intensity of convection but also the dynamic interplay between the atmosphere over the sea and the sea surface temperature [82]. Figure 8 shows the anomalies in the outgoing longwave radiation to demonstrate the difference in convective activity in distinct strengths of El Niño events. During extreme El Niño, intense convective activity is observed centered over the Central-Eastern Pacific, which releases large amounts of latent heat, leading to significant warming in the lower stratosphere. By contrast, although similar patterns are seen during moderate events, the strengths and extent of the convection is significantly reduced. Hence, weaker amplitude convective activity in moderate El Niño events formed a colder lower stratosphere. In terms of seasonal changes, strong tropical convection persists from winter to spring in extreme El Niño activities (Figure 8a,c), while moderate events matured in winter but decayed by the following spring, thus weaker convection activity appeared in moderate El Niño springs (Figure 8d). The contrasting reactions of robust and feeble convective activity during extreme and moderate El Niño are responsible for the striking divergence in tropical tropopause temperatures. This difference in temperature further elucidates the varying effect of extreme and moderate El Niño on water vapor in the lower stratosphere of the tropics.
In general, extreme El Niño excites extensive convections in the tropic troposphere, which are way stronger than those during moderate El Niño events. The overwhelming latent heat released by convective activities during extreme El Niño heats the tropical tropopause, resulting in strong perturbation on the tape recorder signal. In addition, the patterns of temperature and convection in extreme El Niño events are significant both in winter and spring, while moderate El Niño events exhibit a strong seasonality with only evident impact in Spring.
4. Discussion
Extreme El Niño events have received much attention in recent years due to their severe impacts on the global climate and economy [55,56,59]. Although a lot of investigations have been conducted on ENSO’s impact on stratospheric water vapor [17,18,41,49], it is still not conclusive due to the limited El Niño events and corresponding observations since the satellite era versus the large internal variability of the stratospheric water vapor. An understanding of the variety of El Niño in its strengths is essential in order to understand ENSO impacts on the stratospheric water vapor, and Fueglistaler et al. [42] pointed out that the 1997/98 El Niño caused a 0.5 ppmv water vapor anomaly in the tropical tropopause, and Avery et al. [60] showed that the 2015/2016 El Niño produced a decadal record amount of water vapor in the tropical western Pacific. Here, by comparing all the extreme and moderate El Niño events since the satellite era, we show that extreme El Niño events lead to 0.4 ppmv of the stratospheric water vapor increase in the tropical stratosphere when moderate events correspond with an increase of 0.1 ppmv.
However, a comprehensive dynamical analysis is not provided in this study; thus, it is hard to conclude whether the mechanisms are different between the extreme and moderate El Niño impacts on the stratospheric water vapour. The current study is also limited by the small number of extreme El Niño events. Further studies are needed with more observational evidence. A climate chemistry model with a good representation of tropical waves is required to fully understand the tropical dynamics and the water vapor chemistry during extreme and moderate El Niño events.
5. Conclusions
While ENSO’s impacts on stratospheric composition have been extensively discussed, the net effect on zonal mean stratospheric water vapor is still not clear due to its limited sample and also ENSO’s asymmetric pattern adding onto the general changes in Brewer-Dobson circulation [28]. Using the ERA5 and MERRA-2 reanalysis datasets from 1979 to 2019, we compared the differences in the impacts of extreme and moderate El Niño events on tropical stratospheric water vapor, further validated with TOMCAT chemistry model simulations. There are three main findings of this study:
- (1)
- From the perspective of tropical averaging, extreme El Niño events lead to significant moistening in the tropical lower stratosphere, while moderate El Niño events have little effect on water vapor in the lower stratosphere;
- (2)
- This is because strong convective activities excited by extreme El Niño release large amounts of latent heat, which warms the tropical tropopause temperature and thus increases the content of water vapor in the lower stratosphere;
- (3)
- The strong seasonality in the stratospheric water vapor response occurs only during moderate El Niño events when the content of water vapor does not vary in winter and increases slightly in spring. In contrast, the robust wetting effect of extreme El Niño events occurs in all seasons.
Overall, this study reveals the effects of El Niño activity on water vapor in the tropical lower stratosphere, particularly the significant moistening of the stratosphere following extreme El Niño events. Although it has been previously concluded that El Niño wets the lower stratosphere, our division of El Niño activity into extreme and moderate intensity events reveals that it is likely that the previously derived moistening of the lower stratosphere is mainly contributed by extreme events, while moderate El Niño events have little effect on lower stratospheric water vapor. This finding emphasizes the importance of extreme events and highlights the crucial role of El Niño intensity in determining its impact on stratospheric water vapor.
Furthermore, our previous study [43] proposed that the impact of ENSO on stratospheric water vapor is more pronounced in spring as a result of the lag in stratospheric response to ENSO signals. In this study, we found that only moderate El Niño events exhibit a lagged effect, while extreme events elicit a strong response in the stratosphere regardless of the season, which provides new insights for future research on extreme climate events.
Author Contributions
Conceptualization, Q.C. and Y.L.; methodology, X.Z.; formal analysis, Y.L., X.Z. and Q.C.; data curation, W.F., T.D. and X.X.; writing—original draft preparation, Y.L. and Q.C.; writing—review and editing, X.Z.; visualization, Z.Z. and D.D. All authors have read and agreed to the published version of the manuscript.
Funding
This research was funded by the National Natural Science Foundation of China (U20A2097, 41875108, 42275059).
Data Availability Statement
The dataset from MERRA-2 for this study can be found at https://disc.gsfc.nasa.gov/datasets?project=MERRA-2 (accessed on 30 May 2023). The ERA5 dataset is available at: https://cds.climate.copernicus.eu/cdsapp#!/dataset/reanalysis-era5-single-levels?tab=overview (accessed on 30 May 2023). The source of the dataset for the TOMCAT model simulations was: http://homepages.see.leeds.ac.uk/~earfw/MPC688_LONGTERM_MM/ (accessed on 30 May 2023).
Acknowledgments
We thank NOAA and ECMWF for their data provision. We are grateful to Martyn Chipperfield from the University of Leeds for his suggestions and help.
Conflicts of Interest
The authors declare no conflict of interest.
References
- Rieckh, T.; Anthes, R.; Randel, W.; Ho, S.P.; Foelsche, U. Evaluating tropospheric humidity from GPS radio occultation, radiosonde, and AIRS from high-resolution time series. Atmos. Meas. Tech. 2018, 11, 3091–3109. [Google Scholar] [CrossRef] [Green Version]
- Kim, H.M.; Zhou, Y.; Alexander, M.A. Changes in atmospheric rivers and moisture transport over the Northeast Pacific and western North America in response to ENSO diversity. Clim. Dyn. 2019, 52, 7375–7388. [Google Scholar] [CrossRef]
- Xia, Y.; Wang, Y.W.; Huang, Y.; Hu, Y.Y.; Bian, J.C.; Zhao, C.F.; Sun, C. Significant Contribution of Stratospheric Water Vapor to the Poleward Expansion of the Hadley Circulation in Autumn Under Greenhouse Warming. Geophys. Res. Lett. 2021, 48, 10. [Google Scholar] [CrossRef]
- Dessler, A.E.; Schoeberl, M.R.; Wang, T.; Davis, S.M.; Rosenlof, K.H. Stratospheric water vapor feedback. Proc. Natl. Acad. Sci. USA 2013, 110, 18087–18091. [Google Scholar] [CrossRef] [Green Version]
- Randel, W.J.; Wu, F.; Vomel, H.; Nedoluha, G.E.; Forster, P. Decreases in stratospheric water vapor after 2001: Links to changes in the tropical tropopause and the Brewer-Dobson circulation. J. Geophys. Res.-Atmos. 2006, 111, 11. [Google Scholar] [CrossRef] [Green Version]
- Stenke, A.; Grewe, V. Simulation of stratospheric water vapor trends: Impact on stratospheric ozone chemistry. Atmos. Chem. Phys. 2005, 5, 1257–1272. [Google Scholar] [CrossRef] [Green Version]
- Chipperfield, M.P. New version of the TOMCAT/SLIMCAT off-line chemical transport model: Intercomparison of stratospheric tracer experiments. Q. J. R. Meteorol. Soc. 2006, 132, 1179–1203. [Google Scholar] [CrossRef] [Green Version]
- Solomon, S.; Rosenlof, K.H.; Portmann, R.W.; Daniel, J.S.; Davis, S.M.; Sanford, T.J.; Plattner, G.K. Contributions of Stratospheric Water Vapor to Decadal Changes in the Rate of Global Warming. Science 2010, 327, 1219–1223. [Google Scholar] [CrossRef] [Green Version]
- Ovarlez, J.; van Velthoven, P.; Schlager, H. Water vapor measurements from the troposphere to the lowermost stratosphere: Some signatures of troposphere to stratosphere exchanges. J. Geophys. Res.-Atmos. 1999, 104, 16973–16978. [Google Scholar] [CrossRef]
- Randel, W.J.; Park, M. Deep convective influence on the Asian summer monsoon anticyclone and associated tracer variability observed with Atmospheric Infrared Sounder (AIRS). J. Geophys. Res.-Atmos. 2006, 111, 13. [Google Scholar] [CrossRef]
- Dhomse, S.; Weber, M.; Burrows, J. The relationship between tropospheric wave forcing and tropical lower stratospheric water vapor. Atmos. Chem. Phys. 2008, 8, 471–480. [Google Scholar] [CrossRef] [Green Version]
- Brewer, A.W. Evidence for a world circulation provided by the measurements of helium and water vapour distribution in the stratosphere. Q. J. R. Meteorol. Soc. 1949, 75, 351–363. [Google Scholar] [CrossRef]
- Rosenlof, K.H.; Reid, G.C. Trends in the temperature and water vapor content of the tropical lower stratosphere: Sea surface connection. J. Geophys. Res.-Atmos. 2008, 113, 15. [Google Scholar] [CrossRef] [Green Version]
- Grise, K.M.; Thompson, D.W.J. Equatorial Planetary Waves and Their Signature in Atmospheric Variability. J. Atmos. Sci. 2012, 69, 857–874. [Google Scholar] [CrossRef] [Green Version]
- Gettelman, A.; Birner, T.; Eyring, V.; Akiyoshi, H.; Bekki, S.; Bruhl, C.; Dameris, M.; Kinnison, D.E.; Lefevre, F.; Lott, F.; et al. The Tropical Tropopause Layer 1960–2100. Atmos. Chem. Phys. 2009, 9, 1621–1637. [Google Scholar] [CrossRef] [Green Version]
- Grise, K.M.; Thompson, D.W.J. On the Signatures of Equatorial and Extratropical Wave Forcing in Tropical Tropopause Layer Temperatures. J. Atmos. Sci. 2013, 70, 1084–1102. [Google Scholar] [CrossRef]
- Konopka, P.; Ploeger, F.; Tao, M.C.; Riese, M. Zonally resolved impact of ENSO on the stratospheric circulation and water vapor entry values. J. Geophys. Res.-Atmos. 2016, 121, 11486–11501. [Google Scholar] [CrossRef] [Green Version]
- Calvo, N.; Garcia, R.R.; Randel, W.J.; Marsh, D.R. Dynamical Mechanism for the Increase in Tropical Upwelling in the Lowermost Tropical Stratosphere during Warm ENSO Events. J. Atmos. Sci. 2010, 67, 2331–2340. [Google Scholar] [CrossRef] [Green Version]
- Fueglistaler, S.; Liu, Y.S.; Flannaghan, T.J.; Ploeger, F.; Haynes, P.H. Departure from Clausius-Clapeyron scaling of water entering the stratosphere in response to changes in tropical upwelling. J. Geophys. Res.-Atmos. 2014, 119, 1962–1972. [Google Scholar] [CrossRef]
- Xia, Y.; Huang, Y.; Hu, Y.Y.; Yang, J. Impacts of tropical tropopause warming on the stratospheric water vapor. Clim. Dyn. 2019, 53, 3409–3418. [Google Scholar] [CrossRef]
- Highwood, E.J.; Hoskins, B.J. The tropical tropopause. Q. J. R. Meteorol. Soc. 1998, 124, 1579–1604. [Google Scholar] [CrossRef]
- Oman, L.; Waugh, D.W.; Pawson, S.; Stolarski, R.S.; Nielsen, J.E. Understanding the changes of stratospheric water vapor in coupled Chemistry-Climate Model simulations. J. Atmos. Sci. 2008, 65, 3278–3291. [Google Scholar] [CrossRef]
- Bjerknes, J.A. Atmospheric Teleconnections from the Equatorial PACIFIC1. Mon. Weather Rev. 1969, 97, 163–172. [Google Scholar] [CrossRef]
- Horel, J.D.; Wallace, J.M. Planetary-scale atmospheric phenomena associated with the southern oscillation. Mon. Weather Rev. 1981, 109, 813–829. [Google Scholar] [CrossRef]
- Trenberth, K.E.; Branstator, G.W.; Karoly, D.; Kumar, A.; Lau, N.C.; Ropelewski, C. Progress during TOGA in understanding and modeling global teleconnections associated with tropical sea surface temperatures. J. Geophys. Res.-Oceans 1998, 103, 14291–14324. [Google Scholar] [CrossRef]
- Trenberth, K.E.; Caron, J.M.; Stepaniak, D.P.; Worley, S. Evolution of El Nino-Southern Oscillation and global atmospheric surface temperatures. J. Geophys. Res.-Atmos. 2002, 107, 22. [Google Scholar] [CrossRef]
- Yulaeva, E.; Wallace, J.M. Signature of ENSO in global temperature and precipitation fields derived from the microwave sounding unit. J. Clim. 1994, 7, 1719–1736. [Google Scholar] [CrossRef]
- Scaife, A.A.; Butchart, N.; Jackson, D.R.; Swinbank, R. Can changes in ENSO activity help to explain increasing stratospheric water vapor? Geophys. Res. Lett. 2003, 30, 4. [Google Scholar] [CrossRef]
- Scherllin-Pirscher, B.; Deser, C.; Ho, S.P.; Chou, C.; Randel, W.; Kuo, Y.H. The vertical and spatial structure of ENSO in the upper troposphere and lower stratosphere from GPS radio occultation measurements. Geophys. Res. Lett. 2012, 39, 6. [Google Scholar] [CrossRef] [Green Version]
- Johnston, B.R.; Randel, W.J.; Braun, J.J. Interannual Variability of Tropospheric Moisture and Temperature and Relationships to ENSO Using COSMIC-1 GNSS-RO Retrievals. J. Clim. 2022, 35, 3509–3525. [Google Scholar] [CrossRef]
- Xie, F.; Tian, W.; Li, J. The Effect of ENSO Activity on Lower Stratospheric Water Vapor and Circulation. Atmos. Chem. Phys. Discuss. 2012, 11, 4141–4166. [Google Scholar]
- Gu, G.J.; Adler, R.F. Precipitation, temperature, and moisture transport variations associated with two distinct ENSO flavors during 1979–2014. Clim. Dyn. 2019, 52, 7249–7265. [Google Scholar] [CrossRef]
- Guan, B.; Nigam, S. Pacific sea surface temperatures in the twentieth century: An evolution-centric analysis of variability and trend. J. Clim. 2008, 21, 2790–2809. [Google Scholar] [CrossRef] [Green Version]
- Capotondi, A. ENSO diversity in the NCAR CCSM4 climate model. J. Geophys. Res.-Oceans 2013, 118, 4755–4770. [Google Scholar] [CrossRef]
- Gettelman, A.; Randel, W.J.; Massie, S.; Wu, F.; Read, W.G.; Russell, J.M. El Nino as a natural experiment for studying the tropical tropopause region. J. Clim. 2001, 14, 3375–3392. [Google Scholar] [CrossRef]
- Sassi, F.; Kinnison, D.; Boville, B.A.; Garcia, R.R.; Roble, R. Effect of El Nino-Southern Oscillation on the dynamical, thermal, and chemical structure of the middle atmosphere. J. Geophys. Res.-Atmos. 2004, 109, 12. [Google Scholar] [CrossRef] [Green Version]
- Manzini, E.; Giorgetta, M.A.; Esch, M.; Kornblueh, L.; Roeckner, E. The influence of sea surface temperatures on the northern winter stratosphere: Ensemble simulations with the MAECHAM5 model. J. Clim. 2006, 19, 3863–3881. [Google Scholar] [CrossRef] [Green Version]
- Calvo, N.; Garcia, R.R.; Herrera, R.G.; Puyol, D.G.; Gimeno, L.; Martin, E.H.; Rodriguez, P.R. Analysis of the ENSO signal in tropospheric and stratospheric temperatures observed by MSU, 1979–2000. J. Clim. 2004, 17, 3934–3946. [Google Scholar]
- Free, M.; Seidel, D.J. Observed El Nino-Southern Oscillation temperature signal in the stratosphere. J. Geophys. Res.-Atmos. 2009, 114, 11. [Google Scholar] [CrossRef]
- Randel, W.J.; Garcia, R.R.; Calvo, N.; Marsh, D. ENSO influence on zonal mean temperature and ozone in the tropical lower stratosphere. Geophys. Res. Lett. 2009, 36, 5. [Google Scholar] [CrossRef] [Green Version]
- Garfinkel, C.I.; Gordon, A.; Oman, L.D.; Li, F.; Davis, S.; Pawson, S. Nonlinear response of tropical lower-stratospheric temperature and water vapor to ENSO. Atmos. Chem. Phys. 2018, 18, 4597–4615. [Google Scholar] [CrossRef] [Green Version]
- Fueglistaler, S.; Haynes, P.H. Control of interannual and longer-term variability of stratospheric water vapor. J. Geophys. Res.-Atmos. 2005, 110, 14. [Google Scholar] [CrossRef] [Green Version]
- Liao, Y.J.; Chen, Q.L.; Zhou, X. Seasonal evolution of the effects of the El Nino-Southern Oscillation on lower stratospheric water vapor: Delayed effects in late winter and early spring. Earth Planet. Phys. 2019, 3, 489–500. [Google Scholar] [CrossRef]
- Dawson, A.; Matthews, A.J.; Stevens, D.P. Rossby wave dynamics of the North Pacific extra-tropical response to El Nino: Importance of the basic state in coupled GCMs. Clim. Dyn. 2011, 37, 391–405. [Google Scholar] [CrossRef] [Green Version]
- Hatsushika, H.; Yamazaki, K. Stratospheric drain over Indonesia and dehydration within the tropical tropopause layer diagnosed by air parcel trajectories. J. Geophys. Res.-Atmos. 2003, 108, 13. [Google Scholar] [CrossRef]
- Kao, H.Y.; Yu, J.Y. Contrasting Eastern-Pacific and Central-Pacific Types of ENSO. J. Clim. 2009, 22, 615–632. [Google Scholar] [CrossRef]
- Garfinkel, C.I.; Hurwitz, M.M.; Oman, L.D.; Waugh, D.W. Contrasting Effects of Central Pacific and Eastern Pacific El Nino on stratospheric water vapor. Geophys. Res. Lett. 2013, 40, 4115–4120. [Google Scholar] [CrossRef] [Green Version]
- Stephens, D.J.; van Loon, H.; Lamond, M.H.; Telcik, N.P. Differences in atmospheric circulation between the development of weak and strong warm events in the Southern Oscillation. J. Clim. 2007, 20, 2191–2209. [Google Scholar] [CrossRef]
- Rao, J.; Ren, R.C. Asymmetry and nonlinearity of the influence of ENSO on the northern winter stratosphere: 1. Observations. J. Geophys. Res.-Atmos. 2016, 121, 9000–9016. [Google Scholar] [CrossRef] [Green Version]
- Rao, J.; Ren, R.C. Asymmetry and nonlinearity of the influence of ENSO on the northern winter stratosphere: 2. Model study with WACCM. J. Geophys. Res.-Atmos. 2016, 121, 9017–9032. [Google Scholar] [CrossRef]
- Rao, J.; Ren, R.C. A decomposition of ENSO’s impacts on the northern winter stratosphere: Competing effect of SST forcing in the tropical Indian Ocean. Clim. Dyn. 2016, 46, 3689–3707. [Google Scholar] [CrossRef]
- Tao, M.C.; Konopka, P.; Ploeger, F.; Yan, X.L.; Wright, J.S.; Diallo, M.; Fueglistaler, S.; Riese, M. Multitimescale variations in modeled stratospheric water vapor derived from three modern reanalysis products. Atmos. Chem. Phys. 2019, 19, 6509–6534. [Google Scholar] [CrossRef] [Green Version]
- Gan, R.; Liu, Q.; Huang, G.; Hu, K.; Li, X. Greenhouse warming and internal variability increase extreme and central Pacific El Nino frequency since 1980. Nat. Commun. 2023, 14, 394. [Google Scholar] [CrossRef] [PubMed]
- Santoso, A.; McPhaden, M.J.; Cai, W.J. The Defining Characteristics of ENSO Extremes and the Strong 2015/2016 El Nino. Rev. Geophys. 2017, 55, 1079–1129. [Google Scholar] [CrossRef]
- Cai, W.J.; Wang, G.J.; Santoso, A.; Lin, X.P.; Wu, L.X. Definition of Extreme El Nino and Its Impact on Projected Increase in Extreme El Nino Frequency. Geophys. Res. Lett. 2017, 44, 11184–11190. [Google Scholar] [CrossRef]
- Ham, Y.G.; Kug, J.S.; Yang, W.H.; Cai, W.J. Future Changes in Extreme El Nino Events Modulated by North Tropical Atlantic Variability. Geophys. Res. Lett. 2018, 45, 6646–6653. [Google Scholar] [CrossRef]
- Cai, W.J.; Borlace, S.; Lengaigne, M.; van Rensch, P.; Collins, M.; Vecchi, G.; Timmermann, A.; Santoso, A.; McPhaden, M.J.; Wu, L.X.; et al. Increasing frequency of extreme El Nino events due to greenhouse warming. Nat. Clim. Chang. 2014, 4, 111–116. [Google Scholar] [CrossRef] [Green Version]
- Rao, J.; Ren, R.C. Parallel comparison of the 1982/83, 1997/98 and 2015/16 super El Ninos and their effects on the extratropical stratosphere. Adv. Atmos. Sci. 2017, 34, 1121–1133. [Google Scholar] [CrossRef]
- Zhou, X.; Li, J.P.; Xie, F.; Chen, Q.L.; Ding, R.Q.; Zhang, W.X.; Li, Y. Does Extreme El Nino Have a Different Effect on the Stratosphere in Boreal Winter Than Its Moderate Counterpart? J. Geophys. Res.-Atmos. 2018, 123, 3071–3086. [Google Scholar] [CrossRef]
- Avery, M.A.; Davis, S.M.; Rosenlof, K.H.; Ye, H.; Dessler, A.E. Large anomalies in lower stratospheric water vapour and ice during the 2015–2016 El Nino. Nat. Geosci. 2017, 10, 405–409. [Google Scholar] [CrossRef]
- Hersbach, H.; Bell, B.; Berrisford, P.; Hirahara, S.; Horanyi, A.; Munoz-Sabater, J.; Nicolas, J.; Peubey, C.; Radu, R.; Schepers, D.; et al. The ERA5 global reanalysis. Q. J. R. Meteorol. Soc. 2020, 146, 1999–2049. [Google Scholar] [CrossRef]
- Gelaro, R.; McCarty, W.; Suarez, M.J.; Todling, R.; Molod, A.; Takacs, L.; Randles, C.A.; Darmenov, A.; Bosilovich, M.G.; Reichle, R.; et al. The Modern-Era Retrospective Analysis for Research and Applications, Version 2 (MERRA-2). J. Clim. 2017, 30, 5419–5454. [Google Scholar] [CrossRef] [PubMed]
- Monks, S.A.; Arnold, S.R.; Hollaway, M.J.; Pope, R.J.; Wilson, C.; Feng, W.H.; Emmerson, K.M.; Kerridge, B.J.; Latter, B.L.; Miles, G.M.; et al. The TOMCAT global chemical transport model v1.6: Description of chemical mechanism and model evaluation. Geosci. Model Dev. 2017, 10, 3025–3057. [Google Scholar] [CrossRef] [Green Version]
- Feng, W.; Chipperfield, M.P.; Dhomse, S.; Monge-Sanz, B.M.; Yang, X.; Zhang, K.; Ramonet, M. Evaluation of cloud convection and tracer transport in a three-dimensional chemical transport model. Atmos. Chem. Phys. 2011, 11, 5783–5803. [Google Scholar] [CrossRef] [Green Version]
- Feng, W.H.; Dhomse, S.S.; Arosio, C.; Weber, M.; Burrows, J.P.; Santee, M.L.; Chipperfield, M.P. Arctic Ozone Depletion in 2019/20: Roles of Chemistry, Dynamics and the Montreal Protocol. Geophys. Res. Lett. 2021, 48, 10. [Google Scholar] [CrossRef]
- Feng, W.; Chipperfield, M.P.; Davies, S.; Mann, G.W.; Carslaw, K.S.; Dhomse, S.; Harvey, L.; Randall, C.; Santee, M.L. Modelling the effect of denitrification on polar ozone depletion for Arctic winter 2004/2005. Atmos. Chem. Phys. 2011, 11, 6559–6573. [Google Scholar] [CrossRef] [Green Version]
- Dhomse, S.S.; Arosio, C.; Feng, W.H.; Rozanov, A.; Weber, M.; Chipperfield, M.P. ML-TOMCAT: Machine-learning-based satellite-corrected global stratospheric ozone profile data set from a chemical transport model. Earth Syst. Sci. Data 2021, 13, 5711–5729. [Google Scholar] [CrossRef]
- Dhomse, S.S.; Chipperfield, M.P.; Feng, W.; Hossaini, R.; Mann, G.W.; Santee, M.L. Revisiting the hemispheric asymmetry in midlatitude ozone changes following the Mount Pinatubo eruption: A 3-D model study. Geophys. Res. Lett. 2015, 42, 3038–3047. [Google Scholar] [CrossRef]
- Dhomse, S.S.; Chipperfield, M.P.; Damadeo, R.P.; Zawodny, J.M.; Ball, W.T.; Feng, W.; Hossaini, R.; Mann, G.W.; Haigh, J.D. On the ambiguous nature of the 11 year solar cycle signal in upper stratospheric ozone. Geophys. Res. Lett. 2016, 43, 7241–7249. [Google Scholar] [CrossRef]
- Hossaini, R.; Atlas, E.; Dhomse, S.S.; Chipperfield, M.P.; Bernath, P.F.; Fernando, A.M.; Muhle, J.; Leeson, A.A.; Montzka, S.A.; Feng, W.H.; et al. Recent Trends in Stratospheric Chlorine from Very Short-Lived Substances. J. Geophys. Res.-Atmos. 2019, 124, 2318–2335. [Google Scholar] [CrossRef] [Green Version]
- Chipperfield, M.P.; Dhomse, S.S.; Feng, W.; McKenzie, R.L.; Velders, G.J.M.; Pyle, J.A. Quantifying the ozone and ultraviolet benefits already achieved by the Montreal Protocol. Nat. Commun. 2015, 6, 8. [Google Scholar] [CrossRef] [PubMed] [Green Version]
- Harrison, J.J.; Chipperfield, M.P.; Boone, C.D.; Dhomse, S.S.; Bernath, P.F. Fifteen Years of HFC-134a Satellite Observations: Comparisons with SLIMCAT Calculations. J. Geophys. Res.-Atmos. 2021, 126, 11. [Google Scholar] [CrossRef]
- Hossaini, R.; Chipperfield, M.P.; Feng, W.; Breider, T.J.; Atlas, E.; Montzka, S.A.; Miller, B.R.; Moore, F.; Elkins, J. The contribution of natural and anthropogenic very short-lived species to stratospheric bromine. Atmos. Chem. Phys. 2012, 12, 371–380. [Google Scholar] [CrossRef] [Green Version]
- Vaiciulis, V.; Vencloviene, J.; Kaciene, G.; Tamosiunas, A.; Kiznys, D.; Luksiene, D.; Radisauskas, R. Association between El Nino-Southern Oscillation events and stroke: A case-crossover study in Kaunas city, Lithuania, 2000–2015. Int. J. Biometeorol. 2022, 66, 769–779. [Google Scholar] [CrossRef]
- Randel, W.J.; Wu, F.; Oltmans, S.J.; Rosenlof, K.; Nedoluha, G.E. Interannual changes of stratospheric water vapor and correlations with tropical tropopause temperatures. J. Atmos. Sci. 2004, 61, 2133–2148. [Google Scholar] [CrossRef]
- Hurst, D.F.; Oltmans, S.J.; Vomel, H.; Rosenlof, K.H.; Davis, S.M.; Ray, E.A.; Hall, E.G.; Jordan, A.F. Stratospheric water vapor trends over Boulder, Colorado: Analysis of the 30 year Boulder record. J. Geophys. Res.-Atmos. 2011, 116, 12. [Google Scholar] [CrossRef] [Green Version]
- Fueglistaler, S.; Bonazzola, M.; Haynes, P.H.; Peter, T. Stratospheric water vapor predicted from the Lagrangian temperature history of air entering the stratosphere in the tropics. J. Geophys. Res.-Atmos. 2005, 110, 10. [Google Scholar] [CrossRef] [Green Version]
- Pan, L.L.; Randel, W.J.; Massie, S.T.; Kanzawa, H.; Sasano, Y.; Nakajima, H.; Yokota, T.; Sugita, T. Variability of polar stratospheric water vapor observed by ILAS. J. Geophys. Res.-Atmos. 2002, 107, 13. [Google Scholar] [CrossRef] [Green Version]
- Lu, J.P.; Xie, F.; Sun, C.; Luo, J.L.; Cai, Q.F.; Zhang, J.K.; Li, J.; Tian, H.Y. Analysis of factors influencing tropical lower stratospheric water vapor during 1980–2017. npj Clim. Atmos. Sci. 2020, 3, 11. [Google Scholar] [CrossRef]
- Loffler, M.; Brinkop, S.; Jockel, P. Impact of major volcanic eruptions on stratospheric water vapour. Atmos. Chem. Phys. 2016, 16, 6547–6562. [Google Scholar] [CrossRef] [Green Version]
- Garfinkel, C.I.; Harari, O.; Ziskin Ziv, S.; Rao, J.; Morgenstern, O.; Zeng, G.; Tilmes, S.; Kinnison, D.; O’Connor, F.M.; Butchart, N.; et al. Influence of the El Niño–Southern Oscillation on entry stratospheric water vapor in coupled chemistry–ocean CCMI and CMIP6 models. Atmos. Chem. Phys. 2021, 21, 3725–3740. [Google Scholar] [CrossRef]
- Chiodi, A.M.; Harrison, D.E. El Nino Impacts on Seasonal U.S. Atmospheric Circulation, Temperature, and Precipitation Anomalies: The OLR-Event Perspective. J. Clim. 2013, 26, 822–837. [Google Scholar] [CrossRef] [Green Version]
Figure 1.
(a) Monthly time series of the stratospheric water vapor anomalies (Qa; units: ppmv) and seasonal variations of stratospheric water vapor climatology averaged over the tropics (30°N–30°S) from (b) ERA5 (blue line), (c) MERRA-2 (black line) and (d) TOMCAT (red line) datasets.
Figure 1.
(a) Monthly time series of the stratospheric water vapor anomalies (Qa; units: ppmv) and seasonal variations of stratospheric water vapor climatology averaged over the tropics (30°N–30°S) from (b) ERA5 (blue line), (c) MERRA-2 (black line) and (d) TOMCAT (red line) datasets.


Figure 2.
Vertical profiles of tropical−averaged water vapor anomalies (Qa; units: ppmv) during extreme El Niño (dashed lines) and moderate El Niño (dotted lines) events in (a,c,e) winter and (b,d,f) spring based on the (a,b) ERA5 and (c,d) MERRA-2 and (e,f) TOMCAT.
Figure 2.
Vertical profiles of tropical−averaged water vapor anomalies (Qa; units: ppmv) during extreme El Niño (dashed lines) and moderate El Niño (dotted lines) events in (a,c,e) winter and (b,d,f) spring based on the (a,b) ERA5 and (c,d) MERRA-2 and (e,f) TOMCAT.

Figure 3.
Time evolution of water vapor anomalies in (a,c,e) extreme El Niño and (b,d,f) moderate El Niño events based on the (a,b) ERA5, (c,d) MERRA-2 and (e,f) TOMCAT. Anomalies that passed the 95% significance test are stippled.
Figure 3.
Time evolution of water vapor anomalies in (a,c,e) extreme El Niño and (b,d,f) moderate El Niño events based on the (a,b) ERA5, (c,d) MERRA-2 and (e,f) TOMCAT. Anomalies that passed the 95% significance test are stippled.

Figure 4.
The horizontal distribution of tropical water vapor anomalies (Qa; units: ppmv) at 100 hPa during (left column) extreme El Niño and (right column) moderate El Niño events in (a,b,e,f,i,j) winter (DJF) and (c,d,g,h,k,l) spring (MAM) based on the (top two rows) ERA5, (middle two rows) MERRA-2 and (bottom two rows) TOMCAT. Anomalies that passed the 95% significance test are stippled.

Figure 5.
The zonal distribution of water vapor anomalies (Qa; units: ppmv) for (left column) extreme El Niño and (right column) moderate El Niño events in (first and third rows) winter (DJF) and (second and fourth rows) spring (MAM) based on the (top two rows) ERA5, (middle two rows) MERRA-2 and (bottom two rows) TOMCAT. Anomalies that passed the 95% significance test are stippled.


Figure 6.
The horizontal distribution of tropical temperature anomalies (Ta; units: K) at 100 hPa during (a,c) extreme and (b,d) moderate El Niño events in (a,b) winter (DJF) and (c,d) spring (MAM) based on the (a–d) ERA5 and (e–h) MERRA-2. Anomalies that passed the 95% significance test are stippled.

Figure 7.
The zonal distribution of temperature (units: K) anomalies for (a,c) extreme and (b,d) moderate El Niño events in (a,b) winter and (c,d) spring based on the (a–d) ERA5 and (e–h) MERRA-2. Anomalies that passed the 95% significance test are stippled.
Figure 7.
The zonal distribution of temperature (units: K) anomalies for (a,c) extreme and (b,d) moderate El Niño events in (a,b) winter and (c,d) spring based on the (a–d) ERA5 and (e–h) MERRA-2. Anomalies that passed the 95% significance test are stippled.

Figure 8.
The distribution of OLR anomalies response to (a,c) extreme El Niño and (b,d) moderate El Niño events in (a,c) winter and (b,d) spring in the tropics. Anomalies that passed the 95% significance test are stippled.
Figure 8.
The distribution of OLR anomalies response to (a,c) extreme El Niño and (b,d) moderate El Niño events in (a,c) winter and (b,d) spring in the tropics. Anomalies that passed the 95% significance test are stippled.


Table 1.
Extreme and Moderate El Niño events during the time period 1979–2019.
| Composite | Year |
|---|---|
| Extreme El Niño | 1982/1983, 1997/1998, 2015/2016 |
| Moderate El Niño | 1979/1980, 1986/1987, 1987/1988, 1991/1992, 1994/1995, 2002/2003, 2006/2007, 2009/2010, 2018/2019 |
Disclaimer/Publisher’s Note: The statements, opinions and data contained in all publications are solely those of the individual author(s) and contributor(s) and not of MDPI and/or the editor(s). MDPI and/or the editor(s) disclaim responsibility for any injury to people or property resulting from any ideas, methods, instructions or products referred to in the content. |
© 2023 by the authors. Licensee MDPI, Basel, Switzerland. This article is an open access article distributed under the terms and conditions of the Creative Commons Attribution (CC BY) license (https://creativecommons.org/licenses/by/4.0/).
Share and Cite
MDPI and ACS Style
Chen, Q.; Liao, Y.; Zhou, X.; Duan, T.; Xue, X.; Zhang, Z.; Dong, D.; Feng, W. Significant Stratospheric Moistening Following Extreme El Niño Events. Remote Sens. 2023, 15, 3346. https://doi.org/10.3390/rs15133346
AMA Style
Chen Q, Liao Y, Zhou X, Duan T, Xue X, Zhang Z, Dong D, Feng W. Significant Stratospheric Moistening Following Extreme El Niño Events. Remote Sensing. 2023; 15(13):3346. https://doi.org/10.3390/rs15133346
Chicago/Turabian StyleChen, Quanliang, Yujing Liao, Xin Zhou, Ting Duan, Xiaotian Xue, Ziqi Zhang, Dandan Dong, and Wuhu Feng. 2023. "Significant Stratospheric Moistening Following Extreme El Niño Events" Remote Sensing 15, no. 13: 3346. https://doi.org/10.3390/rs15133346
Note that from the first issue of 2016, this journal uses article numbers instead of page numbers. See further details here.