
Exploring the Real-Time WRF Forecast Skill for Four Tropical Storms, Isaias, Henri, Elsa and Irene, as They Impacted the Northeast United States

Department of Civil and Environmental Engineering, University of Connecticut, Storrs, CT 06269, USA
*
Author to whom correspondence should be addressed.
Remote Sens. 2023, 15(13), 3219; https://doi.org/10.3390/rs15133219
Submission received: 1 May 2023
/
Revised: 9 June 2023
/
Accepted: 14 June 2023
/
Published: 21 June 2023
(This article belongs to the Special Issue Prediction of Extreme Weather Events)
Abstract
:Tropical storm Isaias (2020) moved quickly northeast after its landfall in North Carolina and caused extensive damage to the east coast of the United States, with electric power distribution disruptions, infrastructure losses and significant economic and societal impacts. Improving the real-time prediction of tropical storms like Isaias can enable accurate disaster preparedness and strategy. We have explored the configuration, initialization and physics options of the Weather Research and Forecasting (WRF) model to improve the deterministic forecast for Isaias. The model performance has been evaluated based on the forecast of the storm track, intensity, wind and precipitation, with the support from in situ measurements and stage IV remote sensing products. Our results indicate that the Global Forecasting System (GFS) provides overall better initial and boundary conditions compared to the North American Model (NAM) for wind, mean sea level pressure and precipitation. The combination of tropical suite physics options and GFS initialization provided the best forecast improvement, with error reduction of 36% and an increase of the correlation by 11%. The choices for model spin-up time and forecast cycle did not affect the forecast of the storm significantly. In order to check the consistency of the result found from the investigation related to TS Isaias, Irene (2011), Henri (2021) and Elsa (2021), three other tropical storms, were also investigated. Similar to Isaias, these storms are simulated with NAM and GFS initialization and different physics options. The overall results for Henri and Elsa indicate that the models with GFS initialization and tropical suite physics reduced error by 44% and 57%, respectively, which resonates with the findings from the TS Isaias investigation. For Irene, the initialization used an older GFS version and showed increases in error, but applying the tropical physics option decreased the error by 20%. Our recommendation is to consider GFS for the initialization of the WRF model and the tropical physics suite in a future tropical storm forecast for the NE US.
1. Introduction
Tropical storms are extreme weather events with a circulating center of low atmospheric pressure and intense winds, and formed by the energy of warm ocean water over which they originate [1,2,3,4,5,6]. In the Northeast United States (NE US), tropical storms are not uncommon, but the frequency is lower than that for storms that have caused damage and landfall close to Florida. Nonetheless, the storms that have made landfall or reached the NE US have severely damaged people’s lives and property as well as the economy and society [7,8,9]. Damage to infrastructure and trees disrupts electrical power distribution, transportation systems, and, thus, public life [10].
We have examined various tropical storms (TS) that made landfall in the Northeast US, and counted nine storms since 2010. Several of these storms lingered in the NE for a few hours, including Hurricane Sandy (2012), which touched down in New Jersey before moving to Pennsylvania, having a major impact on the area. A few, like Florence (2018), had severely lost strength by the time they reached the NE US. Therefore, considering the strength and track location of the storms, we have focused on four storms, which are Isaias (2020), Henri (2021), Elsa (2021) and Irene (2011).
The strongest and most damaging of the four hurricanes discussed here was Irene. It made its first landfall in the United States at Cape Lookout, North Carolina, on 27 August 2011, with a maximum wind of approximately 70 knots and a minimum central pressure of 952 mbar. The storm continued moving north northeastward and made multiple landfalls over New Jersey and New York on 28 August. The strongest winds, 60 and 55 knots, during these landfalls were mostly to the east of the storm core or over the ocean, causing less damage inland than anticipated. However, the storm kept moving towards the NE with powerful winds inland, triggering a week-long power disruption for up to three million people in Connecticut and Long Island. It caused heavy rainfall and catastrophic floods across New York and New England. In the US, the storm caused USD 15.8 billion in total damage and was associated with 40 recorded fatalities, of which 13 were due to wind-driven tree falls and 21 to rainfall-induced floods, in addition to fatalities from storm surges [11].
Isaias, the second-most destructive storm out of the four, made landfall on 4 August 2020, near Ocean Isle Beach, North Carolina, with a sustained wind of 80 knots and a minimum central pressure of 986 mbar [12]. It was a significant event, with economic losses reaching USD 3.5 billion, considering only the NE US, according to the NOAA Centers for Environmental Information (NCEI). The storm even caused multiple fatalities. During the storm, three million residents of the United States were without power, and for many, this continued for several days. In particular, in the state of Connecticut, there were tens of thousands of power outages, whereas in Rhode Island and Massachusetts, the numbers were in the hundreds of thousands. The main reason for the widespread power outages during this storm was the combination of high winds and densely forested areas, resulting in numerous broken trees and downed power lines [12].
Henri, which made landfall on 22 August 2021, at Westerly, Rhode Island, was the first storm to hit New England following Hurricane Bob (1991). It had a sustained wind of 55 knots and a minimum central pressure of 988 mbar [13]. The fast-weakening trend of the storm and weak landfall did not cause extreme damage, but the storm was associated with high winds, precipitation and flooding in the area. The widespread power outages took place during the event in Rhode Island, Massachusetts, Connecticut, southeastern New York, and New Jersey due to downed trees and power lines, and left more than one hundred and forty thousand homes without power [13]. The power outages that happened during Henri in Connecticut were much smaller and shorter-lived compared to the outages during Isaias and Irene, but due to the uncertainty of the storm’s landfall, there were stand-by crews from out-of-state for anticipated repairs.
Compared to other storms, Elsa was rather a compact storm. It made its landfall in northern Florida on 7 July 2021, with a maximum wind of about 55 kt and a minimum central pressure of 1000 mbar. On July 9, it reemerged over the ocean off the coast of New Jersey, and with a wind peak of 50 knots and 999 mbar minimum pressure, it hit land over Long Island and Rhode Island the same day. Along the shore of New Jersey and southern New England, gusty wind damaged several trees and electrical lines. The storm also caused heavy rain and significant flooding in New York City [14].
These storms’ damage restoration times could have been reduced by better disaster preparedness and strategy, which would require a reliable real-time forecast. Forecasting tropical storms using Numerical Weather Prediction (NWP) models is a challenging task, as the models depend on several factors, ranging from initial and boundary atmospheric conditions to model configurations, and the chaotic nature of the atmosphere is challenging to model accurately [15]. Despite some remaining challenges, the forecasting of tropical storms has improved over the years [16]. To overcome the challenges of forecasting tropical storms, different techniques have been studied, such as data assimilation, the use of high-resolution models, improvements in modeling physics, and the use of ensemble modeling [16,17,18]. Besides studying the challenges, researchers have explored the performance of tropical storm forecasts and found that the forecast skill for the same model varies from year-to-year [19], basin to basin [20], and storm to storm [21]. In addition, an evaluation of tropical cyclone Sandy’s forecast has shown that the sea surface temperature (SST) anomaly had affected the storm track slightly, but the intensity of the storm was affected greatly [22]. The National Hurricane Center (NHC) provides official forecasts of tracks and intensity for each storm using many forecast models as guidance [23] and publishes post-storm reports containing comprehensive information about each storm.
Improvement of the TS forecast could support better preparedness and reduced losses. One such disaster preparedness measure is the issuing of electric power outage predictions for the electric utility (such as the predictions issued using the Outage Prediction Model (OPM) by the Eversource Energy Center at the University of Connecticut), which directly depends on the performance of weather forecasts [24,25]. The OPM uses machine learning algorithms and relies on WRF-forecasted weather variables, which are produced in-house to accommodate the necessary high spatial resolution and 5-day forecasting window. Therefore, in this study, we have investigated the real-time forecasting skill for tropical storms, concentrating on the NE US region. We started this investigation with the storm that caused the second most damage, TS Isaias. Even though TS Irene caused the largest devastation, the data are more than a decade older and weather forecasting has advanced significantly since then, especially the initial and boundary conditions. In the second part of this research, we investigated the other three storms in order to test the consistency of our findings from TS Isaias. The overall objectives of this study were to (a) assess the real-time forecasting skill for TS that have impacted the NE US; (b) present the limitations and successes of a deterministic forecast system; and (c) identify model configuration options that improve storm track and intensity predictions.
2. Materials and Methods
2.1. WRF Model Configuration
The Weather Research and Forecasting (WRF) model, version 4.2, was set up with two domains using the two-way nesting option. A 12 km-by-12 km grid spacing was used for the outer domain, which covers the Eastern US, while the inner domain covers the NE US with a 4 km-by-4 km grid spacing (D01, D02 in Figure 1i). The need for high spatial resolution and forecast lead times of up to five days before the storm makes landfall is dictated by the needs of the power outage forecast system. This is the main reason to issue weather forecasts in-house, instead of relying on federal datasets [26].
We focused on the inner domain to evaluate the model’s performance in forecasting TS. The model includes 51 vertical levels, with a pressure top of 5 mbar and a maximum vertical layer thickness of 1050 m. We tested the utilization of 75 instead of 51 vertical levels, following the configuration of HWRF, as used by the National Hurricane Center, and the model results were very similar. In particular, the minimum MSLP was better captured with the 51 vertical levels, and we opted to continue our model simulations with such vertical structure (also taking into account the computational time taken to run the model four times daily). Terrain data were created from the 30-arc-second USGS Global Multi-Resolution Terrain Elevation Data (GMTED2010).
We assessed the model’s sensitivity to (a) initial conditions, (b) physics options, (c) forecast cycle, and (d) spin-up time. For initial conditions, we used the Global Forecasting System (GFS) 0.5-by-0.5-degree forecast and the North American Mesoscale Forecast System (NAM) 12-by-12 km2 forecast.
For physics options, we evaluated the tropical physics suite and a customized physics option (Table 1). The tropical physics suite is an available and approved suite for WRF by the National Center for Atmospheric Research (NCAR) [27]. The physics options in this suite are taken from the NCAR real-time forecasts and evaluations of the tracks and intensities of hurricanes [28]. It has been found that the forecasts of the tracks, intensities and precipitation levels of hurricanes near the tropics using the tropical suite physics option with the Model for Prediction Across Scales (MPAS) can distinguish the hurricane better than the GFS forecast [29]. Despite the differences between MPAS and WRF as to the use of grid structure or horizontal coordinate system, they share many similar dynamics and numeric options, such as non-hydrostatic approximation, similar physics parameterizations, a common time-integration scheme, and similar transport options [30]. Consequently, the results due to the change to tropical suite physics options bear relation. In addition, the choice of the cumulus scheme is important to simulate hurricane intensity by controlling low-level circulation, and the new Tiedtke cumulus scheme with the cumulus momentum transport can considerably affect the performance of tropical storm forecasting [31,32]. The set of schemes in the customized physics option was chosen based on our in-house real-time WRF forecast configuration. The comparison between the two sets of physics options is listed in Table 1. The model with NAM forecast initialization and customized physics is named WRF/NAM/cus, which was the default configuration of our in-house WRF operational forecast at the time of the storm. The model with GFS forecast initialization and customized physics is named WRF/GFS/cus, and the model with GFS forecast initialization and tropical suite physics is named WRF/GFS/trop (Table 2).
The impacts of the forecast cycle and spin-up time have been tested only for TS Isaias. For the impact of the forecast cycle, we tested initializations from GFS and NAM at 00 UTC and 06 UTC on 4 August 2020. For the impact of WRF spin-up time, we tested 6 h and 12 h. This means that we evaluated WRF outputs 6 h and 12 h after the model’s start time. WRF’s start time was 4 August, 00 UTC or 06 UTC. All model evaluations were conducted for the following duration: 4 August, 12 UTC to 6 August, 12 UTC. Table 2 shows a summary of the WRF sensitivity tests that are analyzed and compared in Section 3.
The comparison of (1) NAM/WRF/cus and GFS/WRF/cus revealed the influence of the GFS vs. NAM initialization; (2) GFS/WRF/cus and GFS/WRF/trop revealed the influence of the physics options; (3) GFS/WRF/cus (a) and GFS/WRF/cus (b) revealed the influence of the WRF start time and spin-up; and (4) GFS/WRF/cus (b) and GFS/WRF/cus (c) revealed the influence of the GFS forecast cycle.
For TSs Irene, Henri and Elsa, we conducted sensitivity tests for initial conditions and physics options utilizing NAM/WRF/cus, GFS/WRF/cus and GFS/WRF/trop. The forecast cycle of GFS or NAM and the start-end time of the WRF model in all three configurations are identical for each storm, and are given in Table 3.
The statistical metrics that have been employed for the evaluation include mean bias (bias), correlation coefficient (CC), Kling–Gupta Efficiency (KGE), root–mean–square error (RMSE), centered root–mean–square error (CRMSE), and mean absolute error (MAE), and the equations are shown in the Appendix A (Equations (A1)–(A6)). The bias indicates the systematic model error, while CRMSE indicates the random component of the error. KGE combines the three components of model errors, which are CC and the ratios of mean and standard deviation, and evaluates the performance in a robust way [43]. For all statistical metrics, a 95th-percentile bootstrap confidence interval is created, which is the range between the 2.5th quantile value and the 97.5th quantile value of the metrics estimated using 10,000 bootstrap samples. The distance between the model-forecasted storm location and the actual location at a particular time has been calculated using the great circle distance with the formula shown in Equation (A7).
2.2. Observed Data
We used hourly observed wind speed and wind gusts at a 10 m height from the Integrated Surface Database (ISD) for 127 available stations in the inner domain (Figure 1ii) [44]. The wind gust from the WRF output was derived from the parameterization provided by the Unified Post Processor (UPP). The storm track and intensity were collected from the NHC report of Isaias and from bulletins published during the storm. The information included the latitude, longitude, and wind speed at the center of the storm.
The National Centers for Environmental Prediction (NCEP) stage IV quantitative precipitation estimates were used to evaluate the accumulated precipitation forecasted by WRF. Stage IV QPE is a combination of gauge data and radar reflectivity and is subject to gauge correction and quality control in each River Forecast Center domain, using the muti-sensor precipitation estimator algorithm [45]. Accumulated 6-hour stage IV data were re-gridded from its native 4 km polar stereographic projection to the WRF projection (Lambert conformal conic projection) and grid spacing (4 km) using bilinear interpolation.
3. Results
3.1. Tropical Storm Isaias
3.1.1. Sensitivity of Initial and Boundary Conditions
WRF/NAM with customized physics forecasted minimum mean sea level pressure (MSLP) over the inner domain of near 995 mbar for a longer period than the actual measured MSLP (Figure 2i). The actual storm entered the domain at 17 UTC on 4 August with a central pressure of 994 mbar, which remained the same for approximately 4 h.
The pressure started increasing from 21 UTC, while the forecast of the storm by WRF/NAM/cus reached a central pressure of the same magnitude at the same time but stayed at that magnitude for 13 h. The forecast by WRF/GFS/cus followed the trend of observed minimum MSLP with time. Between 17 UTC to 20 UTC, the observed central pressure of the storm remained at 994 mbar while the forecast by WRF/GFS/cus was between 995 to 994 mbar and followed the magnitude of the observed minimum MSLP afterward. As the only difference between these two models was the initialization data, the model GFS initialization could reproduce the magnitude of the storm’s central pressure accurately compared to the model with the NAM initialization.
The location of the storm (storm track) forecasted by WRF/NAM/cus and WRF/GFS/cus showed deviation towards the east and south of the actual storm path (Figure 2iv). The forecasted location by WRF/NAM/cus may seem closer to the actual path, but both models were, on average, 125 and 120 km away from the observed storm location. WRF/GFS/cus certainly captured the timeline of the minimum MSLP better than WRF/NAM/cus.
The forecasted 10 m wind speed within both model configurations can reproduce the observed wind speed with good accuracy and show high CC and low error metrics (Figure 3i,ii). WRF/GFS/cus shows slightly lower bias and errors (GFS/WRF). The UPP parameterization estimates wind gust potential, which is usually higher than the actual wind gust, as also highlighted for the tropical storm forecasts herein. Again, WRF/GFS/cus is showing improved performance for wind gusts over WRF/NAM/cus, but the ovestimation is still present (Figure 3v,vi).
The bias (systematic error) of 10 m wind speed and wind gust at different surface stations was lower for WRF/GFS/cus, and the difference is more noticeable in the northern part of the domain (Figure 4i,ii). Wind gust error appears more variable, with WRF/GFS/cus exhibiting over and under-prediction (Figure 4iv,v) that cancel out and give a lower overall bias seen in the scatter plot of Figure 3.
The overall error and the random component of the model error (RMSE, CRMSE) have shown that the model performance for wind speed was not influenced by different initializations; therefore, that factor is not shown here. On the other hand, wind gust performance improved with WRF/GFS/cus, as compared to WRF/NAM/cus in most stations in the domain (Figure 5i,ii,iv,v).
Especially for the random component of the wind gust error, the improvement achieved by changing initial conditions is certainly visible (Figure 5i,ii). CRMSE decreased in several stations, which were located in Pennsylvania, Connecticut, New York City, Vermont and New Hampshire.
Accumulated precipitation from 12 UTC 4 August 2020, to 12 UTC 6 August 2020 (48 h) from stage IV showed a wide band of precipitation following the path of the storm, ranging mostly from 50 to 100 mm, in agreement with GHCND data. To both the east and the west of this band, including the state of Connecticut, the amount of precipitation was small, according to both stage IV and GHCND data (Figure 6i).
Both WRF/NAM/cus and WRF/GFS/cus over-predicted total precipitation at the eastern and western sides of the storm and shrank the highest precipitation band, mostly from the west, and also showed underprediction (Figure 6ii,iii,v,vi). Nevertheless, WRF/GFS/cus performed better in capturing the highest accumulated rainfall band in Pennsylvania and New York. All bulk statistical metrics are improved with the change from NAM to GFS for initial and boundary conditions, except for the precipitation bias. The bulk precipitation bias has a slight increase (Table 4, column iii) but the spatial map indicates that WRF/GFS/cus captured the spatial pattern of precipitation better. Along with the calculation of statistical metrics and relative change of the errors, we estimated the 95th confidence interval through bootstrapping each metric in order to define the statistical significance of the change. When the confidence intervals do not overlap, the results are statistically significant. The statistical significance results are shown in Figure 7.
The conclusion from this part of the study is that using the GFS for initialization of the WRF model is a better choice, compared to the NAM, for the forecast of the wind, MSLP, and precipitation of tropical storm Isaias, with an average decrease of errors of 29.69% and an average increase of CC of 8.17% (Table 3). This conclusion is further supported by the confidence-interval ranges that reveal that WRF/GFS/cus is significantly better than the default (WRF/NAM/cus) for all variables and metrics except precipitation bias and wind CC (Figure 7).
3.1.2. Sensitivity of Forecast Cycles and Spin-Up Time
Comparison of WRF/GFS/cus as to 12 h and 6 h spin-up time revealed the influences of the WRF start time and spin-up; comparison of WRF/GFS/cus initialized with two forecast cycles 6 h apart revealed the influence of the GFS forecast cycle. The forecasted time series of minimum MSLP by models with two different spin-up and start times showed a significant difference, as the model started later and had shorter spin-up time; in short, it missed capturing both the timing and magnitude of the observed minimum MSLP (Figure 2iii). The model with the forecast cycle (GFS-06UTC) closer to the time the storm entered the domain improved the forecast, but reached the lowest pressure of 994 mbar two hours earlier than the actual time and stayed at that level for approximately 12 h instead of 4 h (Figure 2iii). However, the location of the storm by this model was captured better than it was by the model with an earlier initialization (GFS-00UTC), and it had an average shift of 50 km from the observed location (Figure 2vi). The forecast of 10 m wind speed and wind gusts was not improved significantly by using GFS-06UTC data as initialization instead of the GFS-00 UTC forecast cycle of the model (Figure 8).
Moreover, the over-prediction of wind gusts in Connecticut increased when we moved from higher to lower spin-up time and from earlier to later forecast cycle initialization. The increased bias of wind gusts was also noticeable in northern Massachusetts and New Hampshire with a 6 h spin-up compared to the 12 h spin-up time (Figure 9i,ii). The wind gust bias increased in the model initialized with a closer forecast cycle when the effect of different GFS forecast cycle initialization in the overall domain were compared. The same pattern was noticed in the other two error metrics (Figure 9iv–ix), except for the areas of New Jersey and Connecticut, where the random component of error decreased according to the model initialized with a GFS 06UTC forecast cycle (Figure 9viii–ix), and therefore, the combined error decreased as well.
Overall, there is no major influence of the WRF’s start time/spin-up and GFS forecast cycle apparent in the temporally and spatially paired observed–forecasted wind speeds and gusts. The influence is noticed more in the track and the minimum MSLP. The minimum MSLP is reproduced very well with WRF/GFS/cus initialized with the 00 UTC forecast cycle and a 12 h spin-up time, but not with other models. This translates into a disadvantageous configuration when WRF starts 6hrs later or a later GFS cycle is used (06UTC instead of 00UTC). The track shows an opposite signal, one in which the later GFS cycle and WRF start times show locations of the storm center closer to the observations. The overall bulk statistics suggest that the model initialized with 00 UTC forecast cycle and 12 h spin-up time has a lower average error than the other two models (Table 4 columns iii, v–vi). Every percent change of a model configuration is estimated with regard to WRF/NAM/cus, as this was the default WRF configuration at the time of the storm.
3.1.3. Sensitivity of Physics Options
For the next set of sensitivity tests, we chose the GFS model’s 4 August 00 UTC forecast cycle data for initial and boundary conditions for a 60 h WRF simulation with 12 h spin-up time, based on the findings presented in the previous sections. The forecasted time series of minimum MSLP, using two different physics options with WRF/GFS, has shown a similar magnitude and followed a similar trend to the observed one (Figure 2ii). The model with tropical physics reached a low MSLP very close to the observed one of 994 mbar (995 mbar). The location of the storm forecasted by WRF/GFS/trop reduced the locational bias in both the southward and eastward directions (Figure 2v) and reduced the shift of the storm track by 30 km on average compared to WRF/GFS/cus.
The comparison of forecasted and observed wind speed shows similar performance for both physics options, though WRF/GFS/trop reduced the over-prediction for the high wind speeds compared to WRF/GFS/cus (Figure 3ii,iii). The performance of the 10 m wind gust forecast is similar to that of the wind speed evaluation for these two models. Although there is a reduction in wind gust over-prediction for high values, an increased over-prediction in mid-range wind gusts is also noticed in WRF/GFS/trop (Figure 3iv,v).
Spatial error metrics for wind speed and wind gust (averaged over time in each station) for models with two different physics options showed over-prediction of wind speed in the northern part of the domain by both models, and some reduction of bias was noticed in the southern part of Connecticut by WRF/GFS/trop (Figure 4iii,iv). Overall, positive wind gust bias appears on the eastern side and negative wind gust bias on the western side of the domain by both models. However, WRF/GFS/trop has reduced the wind gust bias in Connecticut and increased it in the southern portion of the domain near New Jersey and part of Pennsylvania, compared to WRF/GFS/cus (Figure 5iii,iv). The RMSE of wind speed at 10 m showed small values by both models except in three stations, where the error was reduced by approximately 2 m/s by WRF/GFS/trop compared to WRF/GFS/cus (Figure 5). The very low RMSE of wind gusts at 10m was noticed in many stations on the northern side of the domain; however, wind gust RMSE decreased in the Connecticut stations and increased in the New Jersey stations.
The accumulated precipitation forecasted by WRF/GFS/trop showed a more explicit band compared to WRF/GFS/cus (Figure 6iv,vii). WRF/GFS/trop avoided high precipitation on both sides of the precipitation band in the northern side of the domain, but could not overcome the interposed difficulties in order to forecast low precipitation in the eastern side of the domain, including Connecticut and Massachusetts.
Overall, for Isaias, WRF/GFS/trop has a better performance compared to WRF/NAM/cus and WRF/GFS/cus across all variables that are investigated in this study. The average percentage error was decreased by using tropical physics to 36%, as compared to customized physics at 29%, and the average change in CC was increased by 11% for the model with tropical physics, as compared to 8% for the model with customized physics (Table 4, columns iii and viii). The storm track was improved, and precipitation was somewhat improved, as compared to the other configurations. The minimum MSLP and wind speed/gust predictions from WRF/GFS/trop are similar to those from WRF/GFS/cus, which indicates that the different physics options improved the location values, but did not influence the intensity values of the storm greatly. The 95% confidence-interval plots of the error metrics do not show significantly different results from using two different physics sets, except for wind speed bias (Figure 7iii). However, confidence interval ranges reveal WRF/GFS/trop as being significantly better than the default (WRF/NAM/cus) for all variables and metrics except precipitation bias (Figure 7).
Based on the reasons mentioned above, our recommendation is to consider simulations using the WRF model with GFS initialization and the tropical physics suite in future tropical storm forecasts for the NE US.
3.2. Tropical Storms Henri, Elsa and Irene
In order to test the consistency of the results found in the sensitivity tests of tropical storm Isaias, we repeated the process for TSs Irene, Henri and Elsa. However, considering the impacts on Isaias’s performance, the consistency test has been limited to carrying out the sensitivity of initialization and physics options. We decided to test the model performance from three aspects, which are: storm track location and intensity, wind speed, and precipitation.
3.2.1. Storm Track Evaluation
For TS Elsa and TS Henri, it is evident that the WRF/GFS model has captured the minimum MSLP better than the model with WRF/NAM (Figure 10iv,v). TS Henri and TS Elsa reduced the minimum MSLP bias by almost 10 mbar and 4 mbar, respectively, with the WRF/GFS as compared to WRF/NAM, which suggests that storms with GFS initialization are captured more accurately. On the other hand, the minimum MSLP of TS Irene with NAM initializations closely followed the observed minimum MSLP of the storm, whereas the models with GFS initialization had higher errors.
Models with the tropical suite physics option forecasted higher minimum MSLP than did the customized physics for all the storms, which improved the forecast for Irene and Henri by reducing the MAE by 1.5 mbar and 2.5 mbar, respectively. However, it increased MAE by 3.5 mbar for TS Elsa. For TS Elsa and TS Henri, the shift of the WRF/GFS/trop-predicted storm tracks reduced by 38 km and 29 km, respectively, compared to the NAM/WRF/cus. All model configurations for the three TSs followed the location of the storm closely (Figure 10i–iii).
3.2.2. Precipitation Evaluation
During TS Irene, the maximum precipitation of 100 to 300 mm occurred in the middle of the domain from south to north (Figure 11i, from stage IV and GHCND data). WRF/NAM/cus and WRF/GFS/cus showed overprediction of precipitation in the high ranges, whereas WRF/GFS_ trop reduced the overprediction. For Irene, all the performance evaluation metrics except CC were significantly improved by WRF/GFS/trop over the WRF/NAM/cus model, according to the 95% confidence interval and using bootstrapping (Figure 12i–v).
For TS Elsa, the highest levels within the 48 h of accumulated precipitation occurred on the eastern side of the domain, including Connecticut (Figure 11iv). Similar to Irene, in the case of Elsa, WRF/NAM/cus shows overprediction of the accumulated precipitation, which is reduced by WRF/GFS/cus and further reduced by WRF/GFS/trop. Although WRF/GFS/trop underpredicts the high band of precipitation in Connecticut, it captures the precipitation in the northeast region of the domain. However, WRF/GFS/cus has captured the high precipitation near Connecticut and the Long Island area (Figure 11v–viii). For TS Elsa, all the performance evaluation metrics except KGE and CRMSE are significantly improved by WRF/GFS/trop over the WRF/NAM/cus model, according to the 95% confidence interval and using 10,000 bootstrapping samples (Figure 12vi–x).
TS Henri had low to zero precipitation in the western and northern portions of the domain and maximum levels near Long Island and New Jersey (Figure 11ix). Both NAM and GFS initializations show overprediction of low precipitation and were unable to forecast the high band of precipitation in the correct location. WRF/GFS/cus reduced the overprediction on the western side of the domain and captured part of the high band of precipitation. However, WRF/GFS/cus underpredicted precipitation in the southern side of the domain (Figure 11ix–xii). For Henri, all the performance evaluation matrics have been significantly improved by WRF/GFS/cus over the WRF/NAM/cus model, according to the 95% confidence interval (Figure 12xi–xv). To summarize, the forecasts for the three storms improved with the tropical suite physics option, similarly to the results from Isaias.
3.2.3. Wind Evaluation
For both Elsa and Henri, the models with GFS initialization have significantly reduced the overprediction of wind speed at 10 m., as compared to the models with NAM initiation. For instance, bias has dropped by 42% and 34%, respectively. The wind forecast was improved even further with the use of the tropical suite physics option for these two storms (Figure 13v,vi,viii,ix).
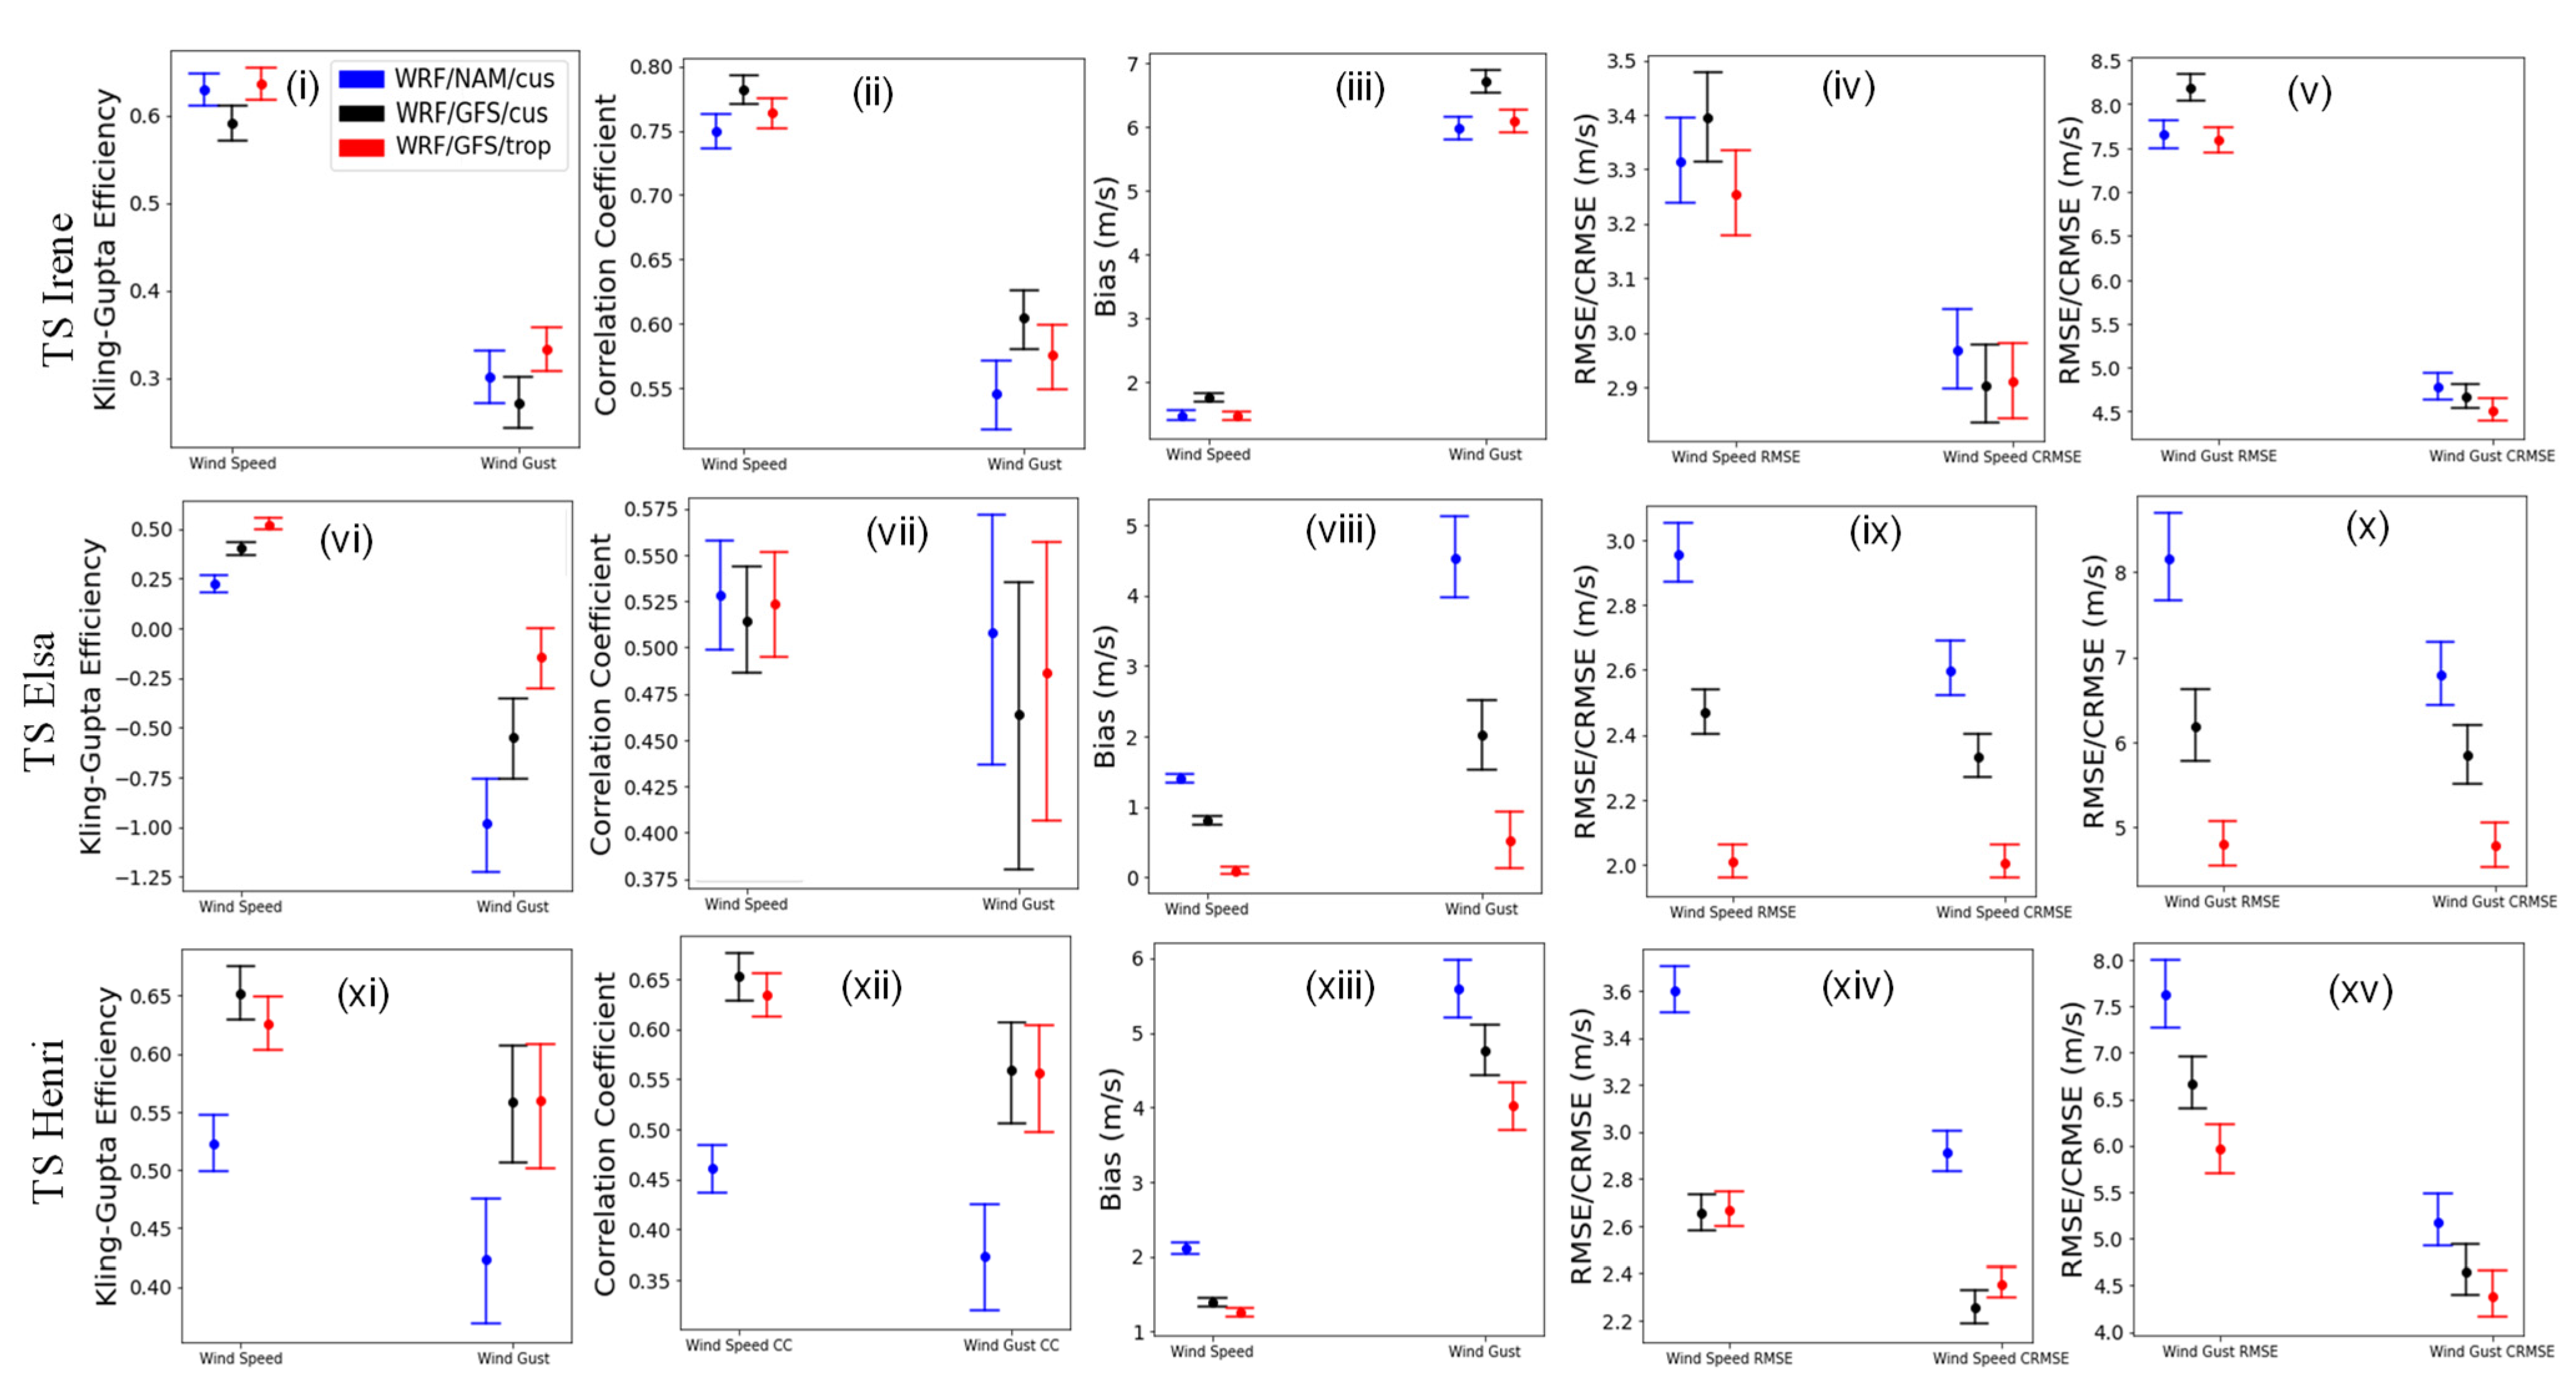
However, for TS Irene, the WRF/NAM/cus has a better wind forecast than does the WRF/GFS/cus (Figure 13i,ii). Although WRF/GFS/trop improved the wind forecast over the WRF/GFS/cus, the model with NAM initialization has a better wind forecast for this particular storm (Figure 13iii), as it happened back in 2011, before major improvements of the GFS model. The KGE, bias and RMSE of wind speed and wind gust at 10 m also suggest that WRF/NAM/cus has significantly better performance than the other two model configurations, whereas CC and CRMSE of wind are indifferent (Figure 12i–v).
For TS Elsa, all the error metrics suggest that WRF/GFS/cus has reduced wind forecast error from WRF/NAM/cus and WRF/GFS/trop has reduced it further. KGE for both wind speed and wind gust follow the same pattern as bias, RMSE and CRMSE, but CC remains the same (Figure 14vi–x). For Henri, all the performance metrics show that models with GFS initialization have a better wind forecast, as compared to NAM. However, WRF/GFS/cus and WRF/GFS/trop have almost the same performance except WRF/GFS/trop reduced bias of wind speed and wind gust and RMSE of wind gust significantly (Figure 14xi–xv).
To summarize, Henri and Elsa have improved performance with the model initialized with GFS and simulated with the tropical suite physics option, similarly to the method used for Isaias. However, Irene’s performance is not so evident and conclusive, as it has used an older GFS model version to initialize WRF.
4. Discussion
We have explored different initialization datasets, physics options and model configurations with the goal of improving the real-time deterministic forecast of tropical storms using the WRF model. We conducted sensitivity tests of initial and boundary conditions, forecast cycles, spin-up time and physics options for Isaias, Irene, Elsa and Henri to explore the consistency of the findings.
Isaias’s storm track and minimum MSLP has been captured better by the WRF model with GFS rather than NAM initialization. There are few plausible explanations for the difference in model behavior made just by changing the initialization data. One could be the presence of an upper-level jet stream that helps the storm to propagate toward its path. According to the 300 hPa observed map from NOAA’s Storm Prediction Center (SPC) [47], the position of the jet stream at the 300 hPa layer appears to stretch from the southern border of Pennsylvania to the northeast at 12 UTC on 4 August. The WRF/GFS/cus model forecasted the position of the jet stream with more accuracy than did the WRF/NAM/cus, as the stretch of the jet stream is forecasted from upstate New York to the north by the later model. The shorter and slightly weaker jet stream could be a reason for the slow propagation of Isaias by the WRF/NAM/cus model. Later that day, the WRF/NAM/cus forecasted a band of severe winds in the same layer with a direction toward the north, which is not apparent at the same location on the SPC map [48] or predicted by WRF/GFS/cus. This band of severe winds may have contributed to the storm track’s deviation towards the north in this model, and at the same time sustained the minimum MSLP for longer than observed. The forecasted warmer storm core may be another factor. The WRF/NAM/cus model predicts that the storm core will be warmer than it is in the WRF/GFS/cus model during the storm’s transition from tropical to extra-tropical. This discrepancy might have been transmitted from NAM and GFS data (maps of 2 m temperature from NAM and GFS show a difference of a few degrees at the location of the storm core). This might be another element influencing the WRF/NAM/cus model’s capacity to maintain a lower minimal MSLP for a longer time.
The model’s initial state affects the storm track and minimum MSLP, which in turn affects the corresponding wind speed and wind gust. Compared to the other model configurations, the over-prediction of WS and WG by WRF/NAM/cus is higher, which may be related to the model’s projection of a more severe storm. The overestimation of wind on the eastern side may be connected to the fact that tropical storms in the northern hemisphere are thought to produce higher winds on the right front quadrant of the storm. However, it should be noted that the WG predicted by WRF is actually the gust wind speed potential calculated by UPP, which is intended to over-predict [49]. For this reason, over prediction of WG is common for all models.
We have used two spin-up times to predict Isaias with the WRF/GFS/cus model, 6 h and 12 h, and the model with the longer spin-up time had less error in terms of the storm’s trajectory and intensity. This result indicates that, for this particular storm, the model needed more than 6 h to develop the physical conditions and produce a near-accurate forecast. Isaias, initialized with a later forecast cycle, reduced the error of the storm track significantly and captured it more accurately than did all the other models. Although the minimum MSLP was also captured with less error by WRF/GFS/cus (c) compared to WRF/GFS/cus (b), it had poorer performance than did the WRF/GFS/cus (a). It is most likely that the reason behind that lies within the differences in spin-up times between models. Overall, the influence of changing the forecast cycle and the spin-up time is not much noticeable for wind forecasts.
The time series of minimum MSLP is one of the indicators of the strength of the storm, and it remained almost identical when the physics option was changed from customized to tropical, but the track improved substantially. The difference between the two physics options comes from the cumulus convection, microphysical processes, and radiation interactions. Among these differences, the use of different cumulus schemes is the most notable one, as it has been seen that small changes in the cumulus scheme significantly affect the tracks and intensities of the storms [50]. Different cumulus schemes represent the depth and motion of the vortex differently, and thus, differently influence the storm track’s direction and intensity [51]. In addition, the shallow convection component of the cumulus scheme has an influence on temperature, moisture and wind, as well as impacts upon the storm track [52]. Although both G3 (used in WRF/GFS/cus) and TD (used in WRF/GFS/trop) cumulus parameterization use shallow convection, these two schemes represent it differently and G3 is highly sensitive to shallow convection. According to a recent study, a model utilizing G3 produces a less realistic picture of storm structures such as larger storms or a larger storm eye and distorts the motion and steering field of tropical storms. As a result of these circumstances, the storm track’s position is affected, causing a minor deviation in the track’s location [53]. In addition to the cumulus scheme, the shortwave radiation and microphysics schemes play crucial roles in capturing the dynamics that influence storm propagation and intensity [54]. The shortwave radiation scheme calculates the atmospheric distribution of incoming solar radiation and supplies the storm with the required energy input. Meanwhile, the storm’s vertical motion and moisture distribution is influenced by the thermodynamic structure, which has an impact on the storm’s intensity and is captured by the microphysics scheme. The effectiveness of wind forecasts is directly impacted by these schemes since they jointly contribute to the thorough simulation of storm behavior in terms of location and severity. As the WRF/GFS/trop has captured the location of the storm more accurately, especially in the southern portion of the domain, it may be responsible for the wind bias reduction seen in the southern part.
The 48 h of accumulated precipitation of Isaias was under-predicted at the higher band of precipitation and over-predicted at the lower end values by all models, and no significant change of bias was noticed. However, there is a reduction of random errors from WRF/NAM/cus to WRF/GFS/cus and it is noticeable that the WRF/GFS/trop model has forecasted the precipitation pattern more closely to stage IV. The change in precipitation pattern and magnitudes of precipitation can be explained by the use of different microphysics schemes (WSMD6 and Thompson) implemented in the two physics options [55], besides the other changes that led to the capture of the storm’s intensity and track differently. We also want to mention that, near the boundary of the model domain, specifically at the north-east and south-west corners, zero or very low values of precipitation have were noticed by WRF/NAM/cus and WRF/GFS/cus (Figure 6ii,iii). According to our tests, these values were inherited from the convective precipitation scheme, and with the changes in cumulus parameterization in WRF/GFS/trop, the problem has been resolved (Figure 6iv). The weak assumption of sub-grid cloud transport made by the G3 cumulus parameterization could be a reason for the boundary problems, and this is the scheme used in our customized physics configurations (all models except WRF/GFS /trop) [56].
The sensitivity test of initialization data and physics options have been explored for TSs Irene, Elsa, and Henri to test the consistency of Isaias’ results. For Elsa and Henri, WRF/GFS/cus has overall better performance than WRF/NAM/cus; one possible reason for this could be that the synoptic scale of these storms has been captured more effectively by the global model (GFS) than the regional model (NAM), similarly to results from Isaias. However, Irene did not exhibit similar behavior when we changed the initialization from NAM to GFS. To investigate the reason, we need to focus on the time difference of almost a decade between Irene and the other three storms studied here. In these years (from 2011 to 2020), the GFS model went through four significant updates [57]. The last of these four changes that took place in 2019 involved changing the dynamical core from spectral to finite-volume cubed-sphere (FV3), replacing Zhao–Carr microphysics with the more sophisticated GFDL microphysics, modifying the convective parameterization scheme to reduce excessive cloud top cooling, replacing GTOPO30 terrain data with the more precise GMTED2010, and other changes [58]. Additionally, a significant number of changes were made to the model’s Global Data Assimilation System (GDAS), including upgrading the near sea surface temperature scheme and adding new observations [58,59]. According to the GFSv15 upgrades presentation [58], this update of the GFS model improved the precipitation forecast [60], provided wind speed closer to observed values, slightly improved the minimum and maximum 2 m temperature, and, most importantly, captured the intensity and track of tropical storms, more closely resembling the best tracks than did earlier versions [61,62]. On the other hand, in these years, the only major updates for NAM happened in 2017, and included changing the convective scheme (Betts–Miller–Janjic) to improve precipitation bias and the microphysics scheme (New Ferrier–Aligo) to improve stratiform precipitation, assimilation of new observation types, more frequent calls of physics schemes, and other changes [63]. As the updates of GFS are more extensive compared to NAM, using the newer version of GFS as initialization could be a reason for the improved forecasts of the particular TSs discussed in this study. However, in Irene’s case, it has been noticed that the older version of GFS is not more beneficial than the older version of NAM. Irrespective of the storms studied here, when we have changed the model physics from the customized option to the tropical option, it has always improved the forecast of the storms.
5. Summary and Conclusions
We have investigated WRF’s real-time forecast skill for tropical storms that have impacted the NE US, presented the limitations and successes of a deterministic forecast system, and identified model configuration options that improve the forecast of the storm track and intensity. The storm intensity is signified by the minimum MSLP and the maximum wind speed, whereas the track is denoted by the location of the minimum MSLP as the storm travels across the region.
For Isaias, all model configurations were able to capture the lowest surface pressure of 994 mbar in the domain at 18 UTC, on 4 August. The default configuration (WRF/NAM/cus) forecasted the same intensity but stayed at that level for 6 h longer than the storm did. Wind speed forecast is acceptable with WRF/NAM/cus, with a bulk bias of ~1 m/s and RMSE ~ 2.5 m/s, but wind gust is largely over-predicted, which is expected due to the parameterization of wind gust potential that is meant to represent maximum gust. In addition, total precipitation is not represented accurately in space and magnitude with our default WRF configuration. Such indications of forecast skill prompted us to explore different initializations, spin-up times and forecast cycles, as well as physics options, to optimize the deterministic model performance for TS Isaias.
The forecast skill (e.g., wind, MSLP, precipitation) of Isaias was mostly improved by the change of initial and boundary conditions from NAM to GFS, possibly because of the synoptic scale of the storm, which is better captured by a global model like GFS. Sensitivity tests of various WRF spin-up times and GFS forecast cycles did not impact the model performance significantly. The model configuration initialized with near-time GFS forecast cycle data (WRF/GFS/cus c) did not perform better in capturing the intensity of the storm but the forecasted storm track provided satisfactory results.
The wind speed of tropical storm Isaias is captured well, with overall bias ranges from 0 to 1 m/s and RMSE around 2 m/s by all WRF configurations. However, the improvement made in the forecasted wind speed by changing the initialization (WRF/GFS/cus) and physics options (WRF/GFS/trop) over the default (WRF/NAM/cus) is statistically significant for all variables and error metrics, with the exception of precipitation bias. Wind gust forecast was improved the most by WRF/GFS/cus, with a decrease of 69% bias and 17.8% RMSE over WRF/NAM/cus. Changing the physics option to tropical did not show any significant improvement in wind gusts over the model with customized physics, although it has decreased the over-prediction of high winds.
All model configurations followed the spatial pattern of the observed accumulated precipitation, except for the over-prediction in the eastern side of the domain, which goes up to 40 mm in some locations. The higher magnitude of precipitation is well forecasted by WRF/GFS/trop and WRF/GFS/cus, compared to WRF/NAM/cus, in the southern side of the domain. Storm track (by distance) and minimum MSLP were also improved by the selection of GFS initialization and tropical suite physics options.
The overall error metrics and statistical significance tests through bootstrapping suggest that the forecast of TS Isaias could be improved by using GFS for initial and boundary conditions and the tropical suite physics options. Such a configuration was able to drive the average error reduction to 36% and increase the correlation by 11%. Even though precipitation bias was not statistically different among the WRF configurations, the random component of the error was, which is an important sign of how the different WRF configurations could also impact accumulated precipitation.
To check the consistency of the result found from Isaias’s sensitivity tests, we have simulated three additional TSs and investigated their results. For TS Henri and TS Elsa, due to the change of initialization from NAM to GFS, the overall wind forecasting error decreased by 20% and 27%, respectively. Moreover, when the model physics changed from customized physics to the tropical suite physics option, the wind forecasting error of TS Henri further decreased by 6% and that for TS Elsa decreased by 39%. The precipitation forecast of TS Henri was improved by changing the model’s initialization from GFS to NAM, reducing overall error by 30%; by changing the physics option and initialization, the error was reduced by 51%. Similar to Henri, Elsa shows a similar trend of decreasing errors, from WRF/NAM to WRF/GFS by 12%, and from WRF/NAM/cus to WRF/GFS/trop by 48%. The average shift of the storm track of Elsa and Henri from WRF/NAM/cus to WRF/GFS/trop was reduced by 38 km and 28 km, respectively, and the minimum MSLP forecast of these storms was improved by reducing MAE by multiple folds.
For TS Irene, the forecasts of wind, and MSLP did not exhibit a statistically significant difference between different model initialization/physics, as it showed for Henri, Elsa, and Isaias. For precipitation, however, WRF/GFS/trop was significantly better than the rest for KGE, bias, RMSE and CRMSE. These results for Irene must be filtered by the fact that the GFS has gone through several version changes since 2011, which has affected the overall results and their consistency with the Isaias, Elsa and Henri forecasts. If we concentrate on the GFS initialization, WRF/GFS/trop improved the forecasts of all variables by reducing the overall error by 14.5%. Error reduction in WRF/GFS/trop was homogenous for all four storms, which is likely the result of using TD as cumulus parameterization (compared to G3 used in WRF/GFS/cus).
The variability in the models’ forecasting skills for these tropical storms also points to the challenges and shortcomings of deterministic weather prediction. When there is a need for a deterministic future forecast of a tropical storm impacting the NE US, our suggestion is to consider the latest GFS model version for initial and boundary conditions, as well as the tropical suite physics option.
Author Contributions
Conceptualization, U.K. and M.A.; methodology, U.K. and M.A.; software, U.K.; validation, U.K; data acquisition, U.K.; model simulations, U.K.; writing—original draft preparation, U.K. and M.A.; visualization, U.K.; supervision, M.A. All authors have read and agreed to the published version of the manuscript.
Funding
The work was funded by Eversource Energy through the research grant “Improving Extreme Weather Forecasting Capabilities in Support of Power Outage Prediction Activities” and awarded to Astitha by the Eversource Energy Center at the University of Connecticut.
Data Availability Statement
Conflicts of Interest
The authors declare no conflict of interest. The funders had no role in the design of the study, in the collection, analyses, or interpretation of data, in the writing of the manuscript, or in the decision to publish the results.
Appendix A
Considering observed values as X, predicted values as Y, mean observed values as X_m, mean predicted values as Y_m, and the total number of values as N, the equations of statistical metrics are shown below. In addition, X_std and Y_std represent the standard deviation of observed and predicted values in these equations.
Bias = N^(−1) ∑(Y − X),
CC = (N^(−1) × ∑[(X − X_m) × (Y − Y_m)])/√(N^(−1) × ∑(X − X_m) ^2 × N^(−1) × ∑(Y − Y_m)^2)
KGE = 1 − √((CC − 1)^2) + (Y_std/X_std − 1)^2 + (Y_m/X_m − 1)^2)
RMSE = √(N^(−1) ∑(X − Y)^2)
CRMSE = √(RMSE^2 − Bias^2)
MAE = N^(−1) ∑absolute(Y − X),
The great circle distance d between two points with coordinates {lat1, lon1} and {lat2, lon2} is given by:
d = 2 × asin × √((sin((lat1 − lat2)/2))^2+ cos(lat1) × cos(lat2) × (sin((lon1 − lon2)/2))^2),
Multiplying d by the earth’s radius (6371 km), we find the distance between observed and predicted storm locations; before applying the formula, the latitude and longitudes are converted into radians by multiplying with pi/180.
References
- Wang, Z. Tropical Cyclones and Hurricanes, Tropical Cyclogenesis. In Encyclopedia of Atmospheric Sciences; Elsevier: Amsterdam, The Netherlands, 2015; pp. 57–64. [Google Scholar] [CrossRef]
- Sillmann, J.; Daloz, A.S.; Schaller, N.; Schwingshackl, C. Extreme Weather and Climate Change. In Climate Change; Elsevier: Amsterdam, The Netherlands, 2021; pp. 359–372. [Google Scholar] [CrossRef]
- Houze, R.A. Clouds and Precipitation in Tropical Cyclones. In International Geophysics; Elsevier: Amsterdam, The Netherlands, 2014; Volume 104, pp. 287–327. [Google Scholar] [CrossRef]
- Bushra, N.; Rohli, R.V. Tracks of Severe Coastal and Marine Tropical Cyclones. In Annotated Atlas of Coastal and Marine Winds; Elsevier: Amsterdam, The Netherlands, 2021; pp. 127–153. [Google Scholar] [CrossRef]
- Navarro, A.; Merino, A. Precipitation in Earth System Models: Advances and Limitations. In Precipitation Science; Elsevier: Amsterdam, The Netherlands, 2022; pp. 637–659. [Google Scholar] [CrossRef]
- Tang, L.; Wang, Y.; Yu, Z.; Wang, L. The Asymmetric Precipitation Evolution in Weak Landfalling Tropical Cyclone Rumbia (2018) Over East China. Front. Earth Sci. 2021, 9, 747271. [Google Scholar] [CrossRef]
- Klug, J.L.; Richardson, D.C.; Ewing, H.A.; Hargreaves, B.R.; Samal, N.R.; Vachon, D.; Pierson, D.C.; Lindsey, A.M.; O’Donnell, D.M.; Effler, S.W.; et al. Ecosystem Effects of a Tropical Cyclone on a Network of Lakes in Northeastern North America. Environ. Sci. Technol. 2012, 46, 11693–11701. [Google Scholar] [CrossRef]
- Chavas, D.; Yonekura, E.; Karamperidou, C.; Cavanaugh, N.; Serafin, K.U.S. Hurricanes and Economic Damage: Extreme Value Perspective. Nat. Hazards Rev. 2013, 14, 237–246. [Google Scholar] [CrossRef] [Green Version]
- Rappaport, E.N. Fatalities in the United States from Atlantic Tropical Cyclones: New Data and Interpretation. Bull. Am. Meteorol. Soc. 2014, 95, 341–346. [Google Scholar] [CrossRef]
- Morang, A. Hurricane Barriers in New England and New Jersey: History and Status after Five Decades. J. Coast. Res. 2016, 32, 181–205. [Google Scholar] [CrossRef] [Green Version]
- Avila, L.A.; Cangialosi, J. Tropical Cyclone Report: Hurricane Irene, 21–28 August 2011; National Hurricane Center Rep.: Miami, FL, USA, 2011. [Google Scholar]
- Latto, A.; Hagen, A.; Berg, R. Tropical Cyclone Report: Hurricane Isaias, 30 July–4 August 2020; National Hurricane Center Rep.: Miami, FL, USA, 2020. [Google Scholar]
- Pasch, R.J.; Berg, R.; Hagen, A.B. Tropical Cyclone Report: Hurricane Henri, 15–23 August 2021; National Hurricane Center Rep.: Miami, FL, USA, 2021. [Google Scholar]
- Cangialosi, J.P.; Delgado, S.; Berg, R. Tropical Cyclone Report: Hurricane Elsa, 30 June–9 July 2021; National Hurricane Center Rep.: Miami, FL, USA, 2021. [Google Scholar]
- Rogers, R.F.; Black, M.L.; Chen, S.S.; Black, R.A. An Evaluation of Microphysics Fields from Mesoscale Model Simulations of Tropical Cyclones. Part I: Comparisons with Observations. J. Atmos. Sci. 2007, 64, 1811–1834. [Google Scholar] [CrossRef] [Green Version]
- Cangialosi, J.P.; Blake, E.; DeMaria, M.; Penny, A.; Latto, A.; Rappaport, E.; Tallapragada, V. Recent Progress in Tropical Cyclone Intensity Forecasting at the National Hurricane Center. Weather. Forecast. 2020, 35, 1913–1922. [Google Scholar] [CrossRef]
- Gall, R.; Franklin, J.; Marks, F.; Rappaport, E.N.; Toepfer, F. The Hurricane Forecast Improvement Project. Bull. Am. Meteorol. Soc. 2007, 94, 329–343. [Google Scholar] [CrossRef]
- Magnusson, L.; Bidlot, J.-R.; Bonavita, M.; Brown, A.R.; Browne, P.A.; Chiara, G.D.; Dahoui, M.; Lang, S.T.K.; McNally, T.; Mogensen, K.S.; et al. ECMWF Activities for Improved Hurricane Forecasts. Bull. Am. Meteorol. Soc. 2019, 100, 445–458. [Google Scholar] [CrossRef]
- Li, W.; Wang, Z.; Peng, M.S. Evaluating Tropical Cyclone Forecasts from the NCEP Global Ensemble Forecasting System (GEFS) Reforecast Version 2. Weather. Forecast. 2016, 31, 895–916. [Google Scholar] [CrossRef]
- Halperin, D.J.; Fuelberg, H.E.; Hart, R.E.; Cossuth, J.H. Verification of Tropical Cyclone Genesis Forecasts from Global Numerical Models: Comparisons between the North Atlantic and Eastern North Pacific Basins. Weather. Forecast. 2016, 31, 947–955. [Google Scholar] [CrossRef]
- Komaromi, W.A.; Majumdar, S.J. Ensemble-Based Error and Predictability Metrics Associated with Tropical Cyclogenesis. Part II: Wave-Relative Framework. Mon. Weather. Rev. 2015, 143, 1665–1686. [Google Scholar] [CrossRef]
- Magnusson, L.; Bidlot, J.-R.; Lang, S.T.K.; Thorpe, A.; Wedi, N.; Yamaguchi, M. Evaluation of Medium-Range Forecasts for Hurricane Sandy. Mon. Weather. Rev. 2014, 142, 1962–1981. [Google Scholar] [CrossRef]
- National Hurricane Center and Central Pacific Hurricane Center. NHC Track and Intensity. 2019. Available online: https://www.nhc.noaa.gov/modelsummary.shtml (accessed on 17 May 2022).
- Watson, P.L.; Cerrai, D.; Koukoula, M.; Wanik, D.W.; Anagnostou, E. Weather-related power outage model with a growing domain: Structure, performance, and generalisability. J. Eng. 2020, 2020, 817–826. [Google Scholar] [CrossRef]
- Cerrai, D.; Koukoula, M.; Watson, P.; Anagnostou, E.N. Outage prediction models for snow and ice storms. Sustain. Energy Grids Netw. 2020, 21, 100294. [Google Scholar] [CrossRef]
- Yang, J.; Astitha, M.; Anagnostou, E.N.; Hartman, B.M. Using a Bayesian Regression Approach on Dual-Model Windstorm Simulations to Improve Wind Speed Prediction. J. Appl. Meteorol. Climatol. 2017, 56, 1155–1174. [Google Scholar] [CrossRef]
- Wang, W.; Bruyère, C.; Duda, M.G.; Dudhia, J.; Gill, D.O.; Kavulich, M.; Werner, K.; Chen, M.; Lin, H.; Michalakes, J.; et al. The Advanced Research WRF Model Version 4 Modeling System User’s Manual; UCAR/NCAR: Boulder, CO, USA, 2019. [Google Scholar]
- Cavallo, S.M.; Torn, R.D.; Snyder, C.; Davis, C.; Wang, W.; Done, J. Evaluation of the Advanced Hurricane WRF Data Assimilation System for the 2009 Atlantic Hurricane Season. Mon. Weather. Rev. 2013, 141, 523–541. [Google Scholar] [CrossRef] [Green Version]
- Davis, C.A.; Ahijevych, D.A.; Wang, W.; Skamarock, W.C. Evaluating Medium-Range Tropical Cyclone Forecasts in Uniform- and Variable-Resolution Global Models. Mon. Weather Rev. 2016, 144, 4141–4160. [Google Scholar] [CrossRef]
- Duda, M.; Fowler, L.; Skamarock, B.; Roesch, C.; Jacobsen, D.; Ringler, T. MPAS-Atmosphere Model User’s Guide. 2014. Available online: https://www2.mmm.ucar.edu/projects/mpas/mpas_atmosphere_users_guide_3.0.pdf (accessed on 25 May 2023).
- Zhang, C.; Wang, Y. Why is the simulated climatology of tropical cyclones so sensitive to the choice of cumulus parameterization scheme in the WRF model? Clim. Dyn. 2018, 51, 3613–3633. [Google Scholar] [CrossRef]
- Bassill, N.P. Accuracy of Early GFS and ECMWF Sandy (2012) Track Forecasts: Evidence for a Dependence on Cumulus Parameterization. Geophys. Res. Lett. 2014, 41, 3274–3281. [Google Scholar] [CrossRef]
- Hong, S.; Lim, J.J. The WRF Single-Moment 6-Class Microphysics Scheme (WSM6). Asia-Pac. J. Atmos. Sci. 2006, 42, 129–151. [Google Scholar]
- Thompson, G.; Field, P.R.; Rasmussen, R.M.; Hall, W.D. Explicit Forecasts of Winter Precipitation Using an Improved Bulk Microphysics Scheme. Part II: Implementation of a New Snow Parameterization. Mon. Weather. Rev. 2008, 136, 5095–5115. [Google Scholar] [CrossRef]
- Zhang, C.; Wang, Y. Projected Future Changes of Tropical Cyclone Activity over the Western North and South Pacific in a 20-km-Mesh Regional Climate Model. J. Clim. 2017, 30, 5923–5941. [Google Scholar] [CrossRef]
- Grell, G.A.; Dévényi, D. A generalized approach to parameterizing convection combining ensemble and data assimilation techniques: Parameterizing convection combining ensemble and data assimilation techniques. Geophys. Res. Lett. 2002, 29, 38–1–38–4. [Google Scholar] [CrossRef] [Green Version]
- Mlawer, E.J.; Taubman, S.J.; Brown, P.D.; Iacono, M.J.; Clough, S.A. Radiative transfer for inhomogeneous atmospheres: RRTM, a validated correlated-k model for the longwave. J. Geophys. Res. 1997, 102, 16663–16682. [Google Scholar] [CrossRef] [Green Version]
- Chou, M.-D.; Suarez, M.J. An Efficient Thermal Infrared Radiation Parameterization for Use in General Circulation Models. NASA Technical Memorandum No. 104606. 1997. Available online: https://archive.org/details/nasa_techdoc_19950009331 (accessed on 30 May 2022).
- Chou, M.D.; Suarez, M.J. A Solar Radiation Parameterization (CLIRAD-SW) for Atmospheric Studies. NASA Tech., Memo NASA/TM-1999-104606. 1999. Available online: https://ntrs.nasa.gov/api/citations/19990060930/downloads/19990060930.pdf (accessed on 30 May 2022).
- Hong, S.-Y.; Noh, Y.; Dudhia, J. A New Vertical Diffusion Package with an Explicit Treatment of Entrainment Processes. Mon. Weather. Rev. 2006, 134, 2318–2341. [Google Scholar] [CrossRef] [Green Version]
- Fairall, C.W.; Bradley, E.F.; Hare, J.E.; Grachev, A.A.; Edson, J.B. Bulk Parameterization of Air–Sea Fluxes: Updates and Verification for the COARE Algorithm. J. Clim. 2003, 16, 571–591. [Google Scholar]
- Tewari, M.; Chen, F.; Wang, W.; Dudhia, J.; LeMone, M.A.; Mitchell, K.; Ek, M.; Gayno, G.; Wegiel, J.; Cuenca, R.H. Implementation and verification of the unified NOAH land surface model in the WRF model. In Proceedings of the 20th Conference on Weather Analysis and Forecasting/16th Conference on Numerical Weather Prediction, Seattle, WA, USA, 14 January 2004. [Google Scholar]
- Knoben, W.J.M.; Freer, J.E.; Woods, R.A. Technical Note: Inherent Benchmark or Not? Comparing Nash-Sutcliffe and Kling-Gupta Efficiency Scores. Catchment Hydrol./Model. Approaches 2019. preprint. [Google Scholar] [CrossRef]
- Smith, A.; Lott, N.; Vose, R. The Integrated Surface Database: Recent Developments and Partnerships. Bull. Am. Meteorol. Soc. 2011, 92, 704–708. [Google Scholar] [CrossRef] [Green Version]
- Nelson, B.R.; Prat, O.P.; Seo, D.-J.; Habib, E. Assessment and Implications of NCEP Stage IV Quantitative Precipitation Estimates for Product Intercomparisons. Weather. Forecast. 2016, 31, 371–394. [Google Scholar] [CrossRef]
- Registry on Open Data AWS. NOAA Global Historical Climatology Network Daily (GHCN-D). Available online: https://registry.opendata.aws/noaa-ghcn (accessed on 7 May 2022).
- NOAA, National Weather Service Storm Prediction Center. Storm Prediction Center Upper Air Maps at 300mbar on 20200804/12UTC. 2023. Available online: https://www.spc.noaa.gov/obswx/maps/300_200804_12.gif (accessed on 25 May 2023).
- NOAA, National Weather Service Storm Prediction Center. Storm Prediction Center Upper Air Maps at 300mbar on 20200805/00UTC. 2023. Available online: https://www.spc.noaa.gov/obswx/maps/300_200805_00.gif (accessed on 25 May 2023).
- Benjamin, S.G.; James, E.P.; Brown, J.M.; Szoke, E.J.; Kenyon, J.S.; Ahmadov, R.; Turner, D.D. Diagnostic Fields Developed for Hourly Updated NOAA Weather Models. 2020. Available online: https://rapidrefresh.noaa.gov/Diag-vars-NOAA-TechMemo.pdf (accessed on 25 May 2023).
- Nasrollahi, N.; AghaKouchak, A.; Li, J.; Gao, X.; Hsu, K.; Sorooshian, S. Assessing the Impacts of Different WRF Precipitation Physics in Hurricane Simulations. Weather Forecast. 2012, 27, 1003–1016. [Google Scholar] [CrossRef] [Green Version]
- Prater, B.E.; Evans, J.L. Sensitivity of Modeled Tropical Cyclone Track and Structure of Hurricane Irene (1999) to the Convective Parameterization Scheme. Meteorol. Atmos. Phys. 2002, 80, 103–115. [Google Scholar] [CrossRef]
- de Szoeke, S.P.; Wang, Y.; Xie, S.-P.; Miyama, T. Effect of Shallow Cumulus Convection on the Eastern Pacific Climate in a Coupled Model. Geophys. Res. Lett. 2006, 33, L17713. [Google Scholar] [CrossRef] [Green Version]
- Shepherd, T.J.; Walsh, K.J. Sensitivity of Hurricane Track to Cumulus Parameterization Schemes in the WRF Model for Three Intense Tropical Cyclones: Impact of Convective Asymmetry. Meteorol. Atmos. Phys. 2017, 129, 345–374. [Google Scholar] [CrossRef]
- Fovell, R.G.; Bu, Y.P.; Corbosiero, K.L.; Tung, W.; Cao, Y.; Kuo, H.-C.; Hsu, L.; Su, H. Influence of Cloud Microphysics and Radiation on Tropical Cyclone Structure and Motion. Meteorol. Monogr. 2016, 56, 11.1–11.27. [Google Scholar] [CrossRef]
- Wu, D.; Zhang, F.; Chen, X.; Ryzhkov, A.; Zhao, K.; Kumjian, M.R.; Chen, X.; Chan, P.-W. Evaluation of Microphysics Schemes in Tropical Cyclones Using Polarimetric Radar Observations: Convective Precipitation in an Outer Rainband. Mon. Weather. Rev. 2021, 149, 1055–1068. [Google Scholar] [CrossRef]
- Huang, W.; Bao, J.-W.; Chen, B. Parameterization of Subgrid Deep Convective Cloud at Gray-Zone Resolutions: Preliminary Results. Trop. Cyclone Res. Rev. 2014, 3, 218–228. [Google Scholar] [CrossRef]
- NCEP. GFS/GDAS Changes Since 1991. Available online: https://www.emc.ncep.noaa.gov/gmb/STATS/html/model_changes.html (accessed on 5 February 2023).
- Yang, F. GDAS/GFS V15.0.0 Upgrades for Q2FY2019. 2018. Available online: https://www.emc.ncep.noaa.gov/gmb/wx24fy/doc/CCB_FV3GFS_24sept2018_v4.pdf (accessed on 5 February 2023).
- Sippel, J.A.; Wu, X.; Ditchek, S.D.; Tallapragada, V.; Kleist, D.T. Impacts of Assimilating Additional Reconnaissance Data on Operational GFS Tropical Cyclone Forecasts. Weather. Forecast. 2022, 37, 1615–1639. [Google Scholar] [CrossRef]
- Chen, J.-H.; Lin, S.-J.; Zhou, L.; Chen, X.; Rees, S.; Bender, M.; Morin, M. Evaluation of Tropical Cyclone Forecasts in the Next Generation Global Prediction System. Mon. Weather. Rev. 2019, 147, 3409–3428. [Google Scholar] [CrossRef]
- Gao, K.; Harris, L.; Zhou, L.; Bender, M.; Morin, M. On the Sensitivity of Hurricane Intensity and Structure to Horizontal Tracer Advection Schemes in FV3. J. Atmos. Sci. 2021, 78, 3007–3021. [Google Scholar] [CrossRef]
- Zhang, C.; Xue, M.; Supinie, T.A.; Kong, F.; Snook, N.; Thomas, K.W.; Brewster, K.; Jung, Y.; Harris, L.M.; Lin, S. How Well Does an FV3-Based Model Predict Precipitation at a Convection-Allowing Resolution? Results From CAPS Forecasts for the 2018 NOAA Hazardous Weather Test Bed With Different Physics Combinations. Geophys. Res. Lett. 2019, 46, 3523–3531. [Google Scholar] [CrossRef] [Green Version]
- Rogers, E.; Carley, J.; Ferrier, B.; Aligo, E.; Gayno, G.; Janjic, Z.; Lin, Y.; Liu, S.; Lou, G.P.; Pyle, M.; et al. NAM Version 4 Science Briefing : Expanded Version. 2017. Available online: https://www.emc.ncep.noaa.gov/users/mesoimpldocs/namv4docs/NAMv4_ScienceIT_brief_10Mar2017.final_expanded.pdf (accessed on 25 May 2023).
Figure 1.
(i) WRF gridded domains; (ii) Surface weather stations used for the wind evaluation (nested grid-D02); and (iii) Surface weather stations used for the precipitation evaluation (nested grid-D02).
Figure 1.
(i) WRF gridded domains; (ii) Surface weather stations used for the wind evaluation (nested grid-D02); and (iii) Surface weather stations used for the precipitation evaluation (nested grid-D02).

Figure 2.
Forecast of tropical storm Isaias, focusing on the time series of minimum MSLP in the center of the storm (top row), the location of the storm (bottom row), and comparisons of model configurations. (i,ii,iv,v) WRF/NAM/cus (magenta), WRF/GFS/cus (blue) and WRF/GFS/trop (red) (initializations/physics; Table 2); (iii,vi) WRF/GFS/cus a (blue), b (red) and c (green) (forecast cycle, WRF start time, spin-up time; Table 2). The observed MSLP location and values are denoted with an asterisk ‘*’.

Figure 3.
Evaluation of wind speed (top row) and wind gust (bottom row) in the inner domain from the output of (i,iv) WRF/NAM/cus, (ii,v) WRF/GFS/cus and (iii,vi) WRF/GFS/trop. The solid line designates a 1:1 relationship; the dashed line designates the linear relationship between the two variables described by the y = f(x) formula.

Figure 4.
Spatial bias plot of wind speed (first row) and wind gust (second row) evaluation in the inner domain from the output of (i,iv) WRF/NAM/cus, (ii,v) WRF/GFS/cus and (iii,vi) WRF/GFS/trop.
Figure 4.
Spatial bias plot of wind speed (first row) and wind gust (second row) evaluation in the inner domain from the output of (i,iv) WRF/NAM/cus, (ii,v) WRF/GFS/cus and (iii,vi) WRF/GFS/trop.
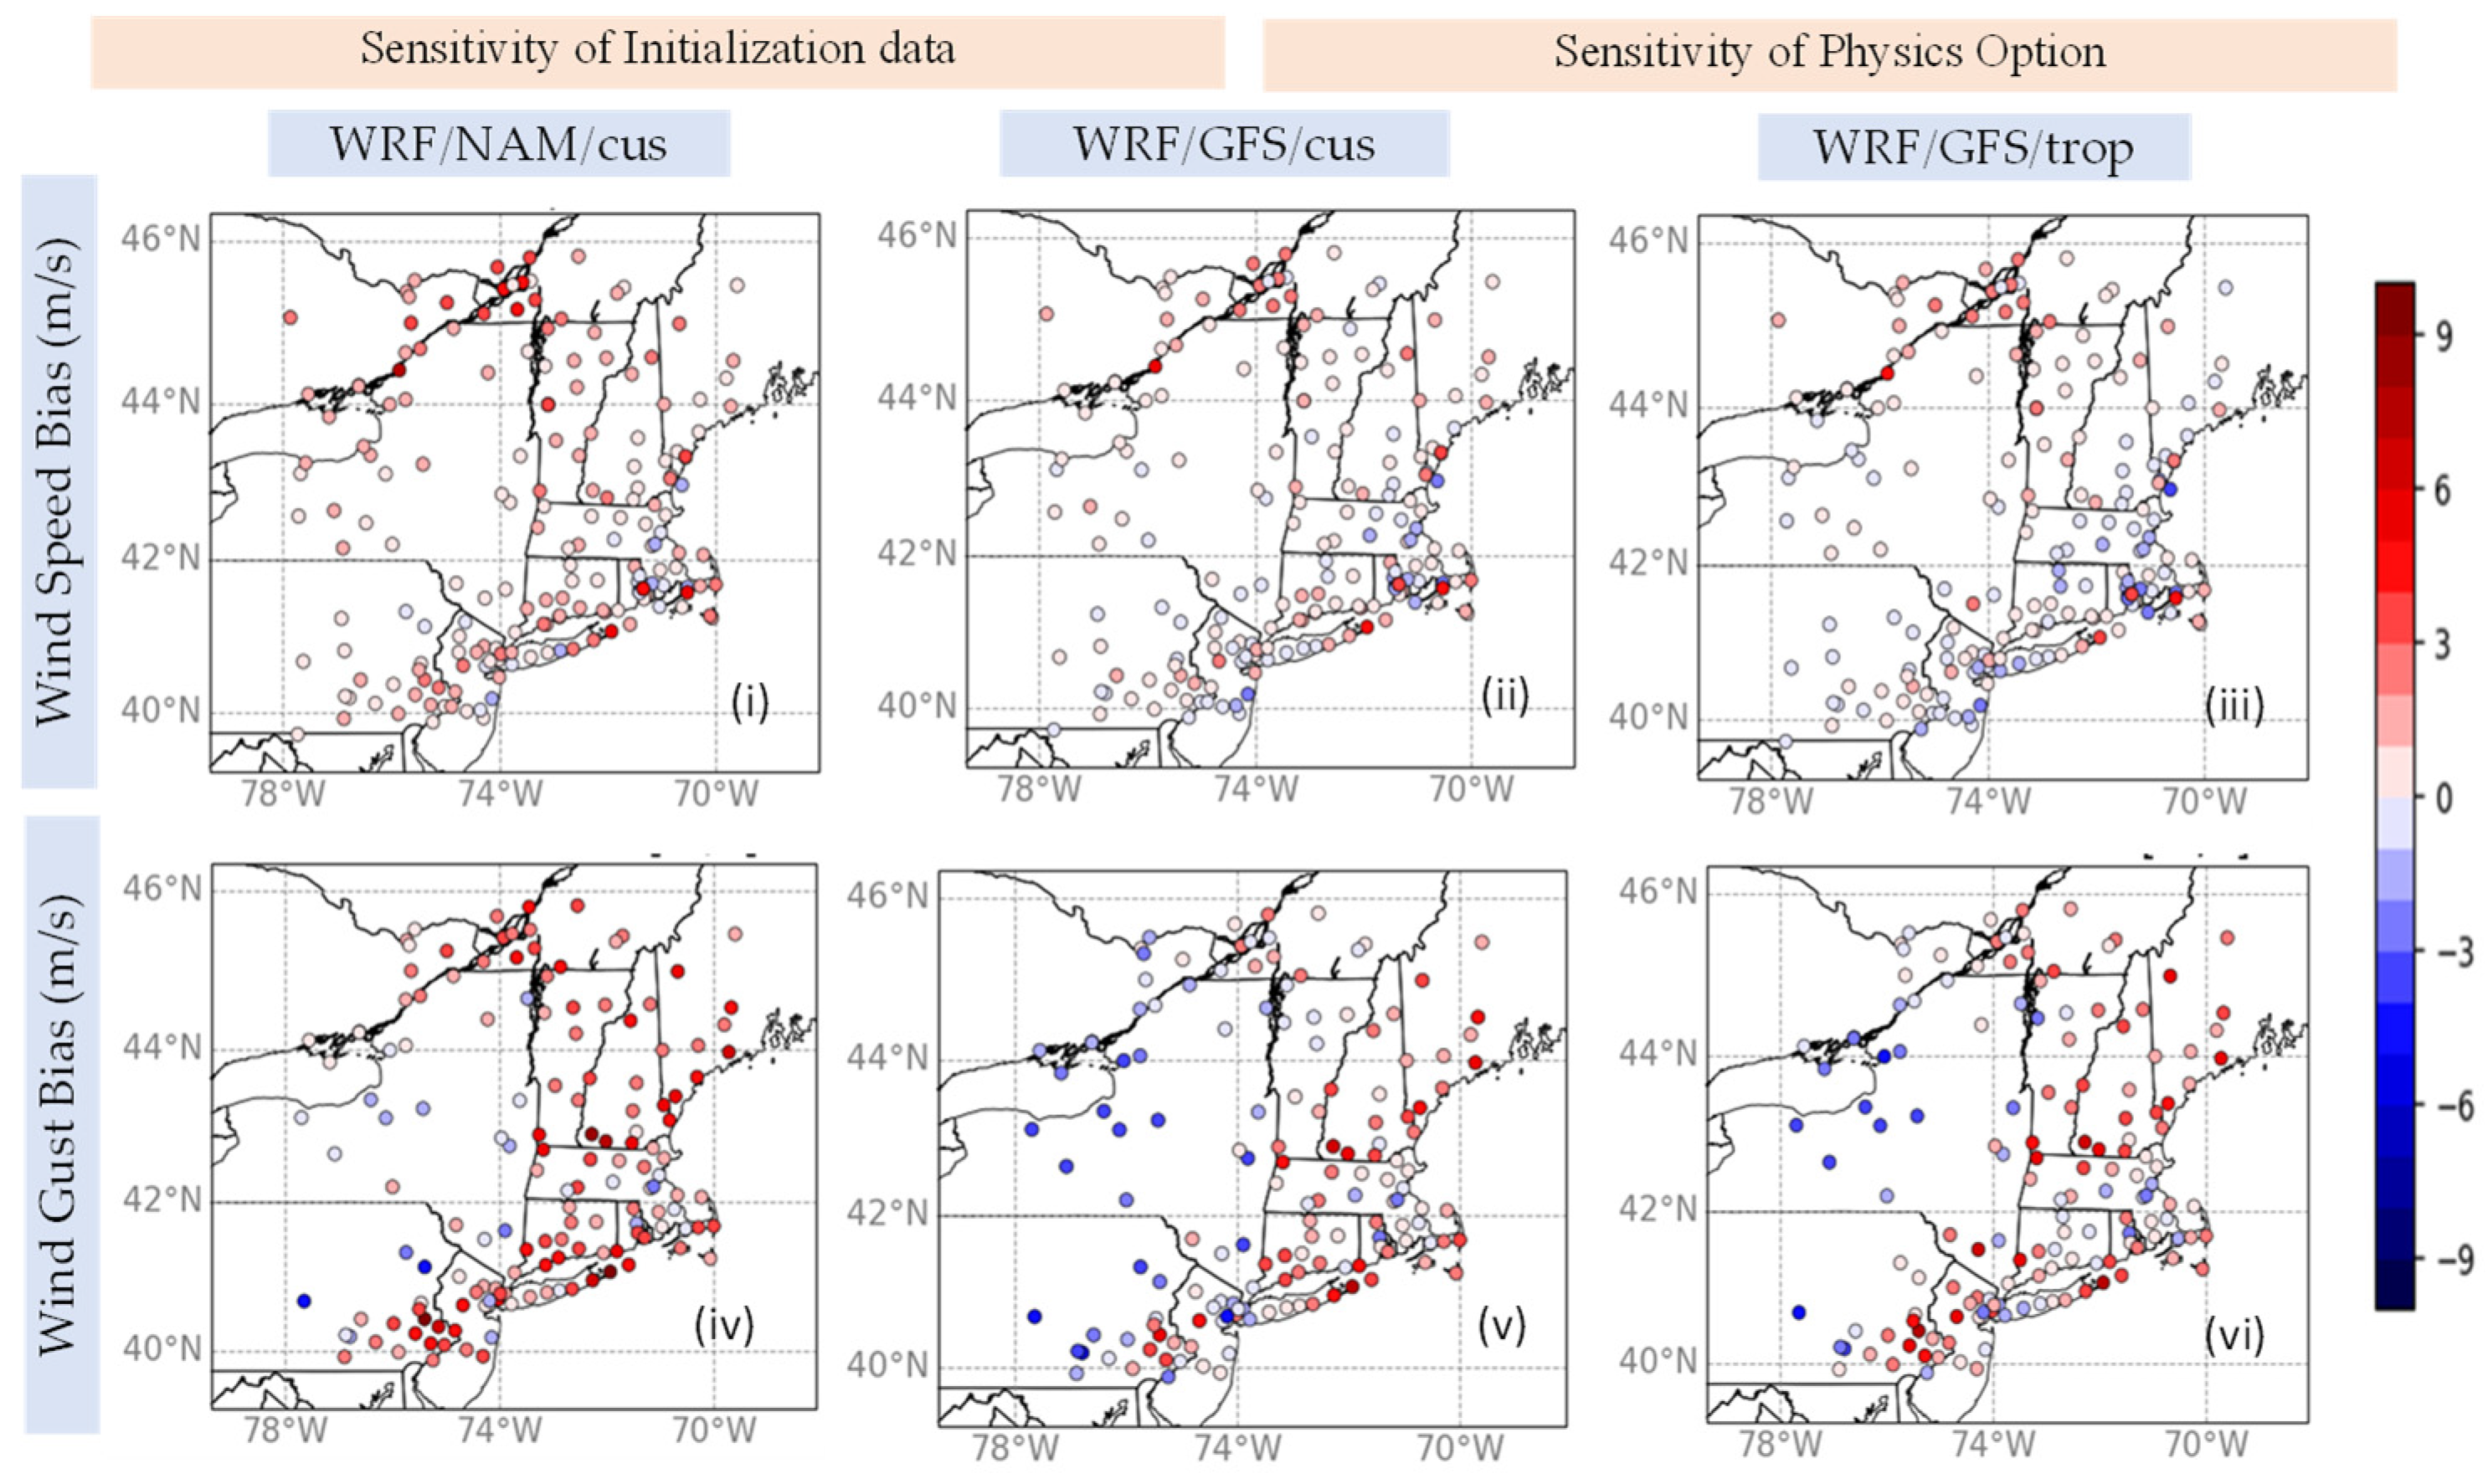
Figure 5.
Maps of RMSE (top row) and CRMSE (bottom row) for wind gust evaluation in the inner domain from the output of (i,iv) WRF/NAM/cus, (ii,v) WRF/GFS/cus and (iii,vi) WRF/GFS/trop.
Figure 5.
Maps of RMSE (top row) and CRMSE (bottom row) for wind gust evaluation in the inner domain from the output of (i,iv) WRF/NAM/cus, (ii,v) WRF/GFS/cus and (iii,vi) WRF/GFS/trop.

Figure 6.
Accumulated precipitation from 1200 UTC 4 August to 1200 UTC 6 August 2020, in the inner domain from (i) stage IV data, and as forecasted by (ii) WRF/NAM/cus, (iii) WRF/GFS/cus and (iv) WRF/GFS/trop. All plots include observed accumulated precipitation from point data from the GHCND dataset. The spatial bias (WRF—stage IV) plots depict 48 h of accumulated precipitation for (v) the WRF/NAM/cus model, (vi) the WRF/GFS/cus model and (vii) WRF/GFS/trop.

Figure 7.
Arrays of 95% confidence intervals for (i) correlation coefficient, (ii,iii) bias, (iv,v,vi) RMSE and CRMSE, and (vii) KGE for wind speed, gust and precipitation from WRF/NAM/cus, WRF/GFS/cus and WRF/GFS/trop.
Figure 7.
Arrays of 95% confidence intervals for (i) correlation coefficient, (ii,iii) bias, (iv,v,vi) RMSE and CRMSE, and (vii) KGE for wind speed, gust and precipitation from WRF/NAM/cus, WRF/GFS/cus and WRF/GFS/trop.

Figure 8.
Evaluation of (i–iii) wind speed and (iv–vi) wind gust in the inner domain from the output of WRF/GFS/cus a through c (forecast cycle, WRF start time, spin-up time; Table 2). The solid line designates a 1:1 relationship; the dashed line designates the linear relationship between the two variables described by the y = f(x) formula.

Figure 9.
(i–iii) Mean Bias; (iv–vi) RMSE; and (vii–ix) CRMSE spatial maps of wind gust at 10 m in the inner domain from the output of WRF/GFS/cus a through c (forecast cycle, WRF start time, spin-up time; Table 2).
Figure 9.
(i–iii) Mean Bias; (iv–vi) RMSE; and (vii–ix) CRMSE spatial maps of wind gust at 10 m in the inner domain from the output of WRF/GFS/cus a through c (forecast cycle, WRF start time, spin-up time; Table 2).
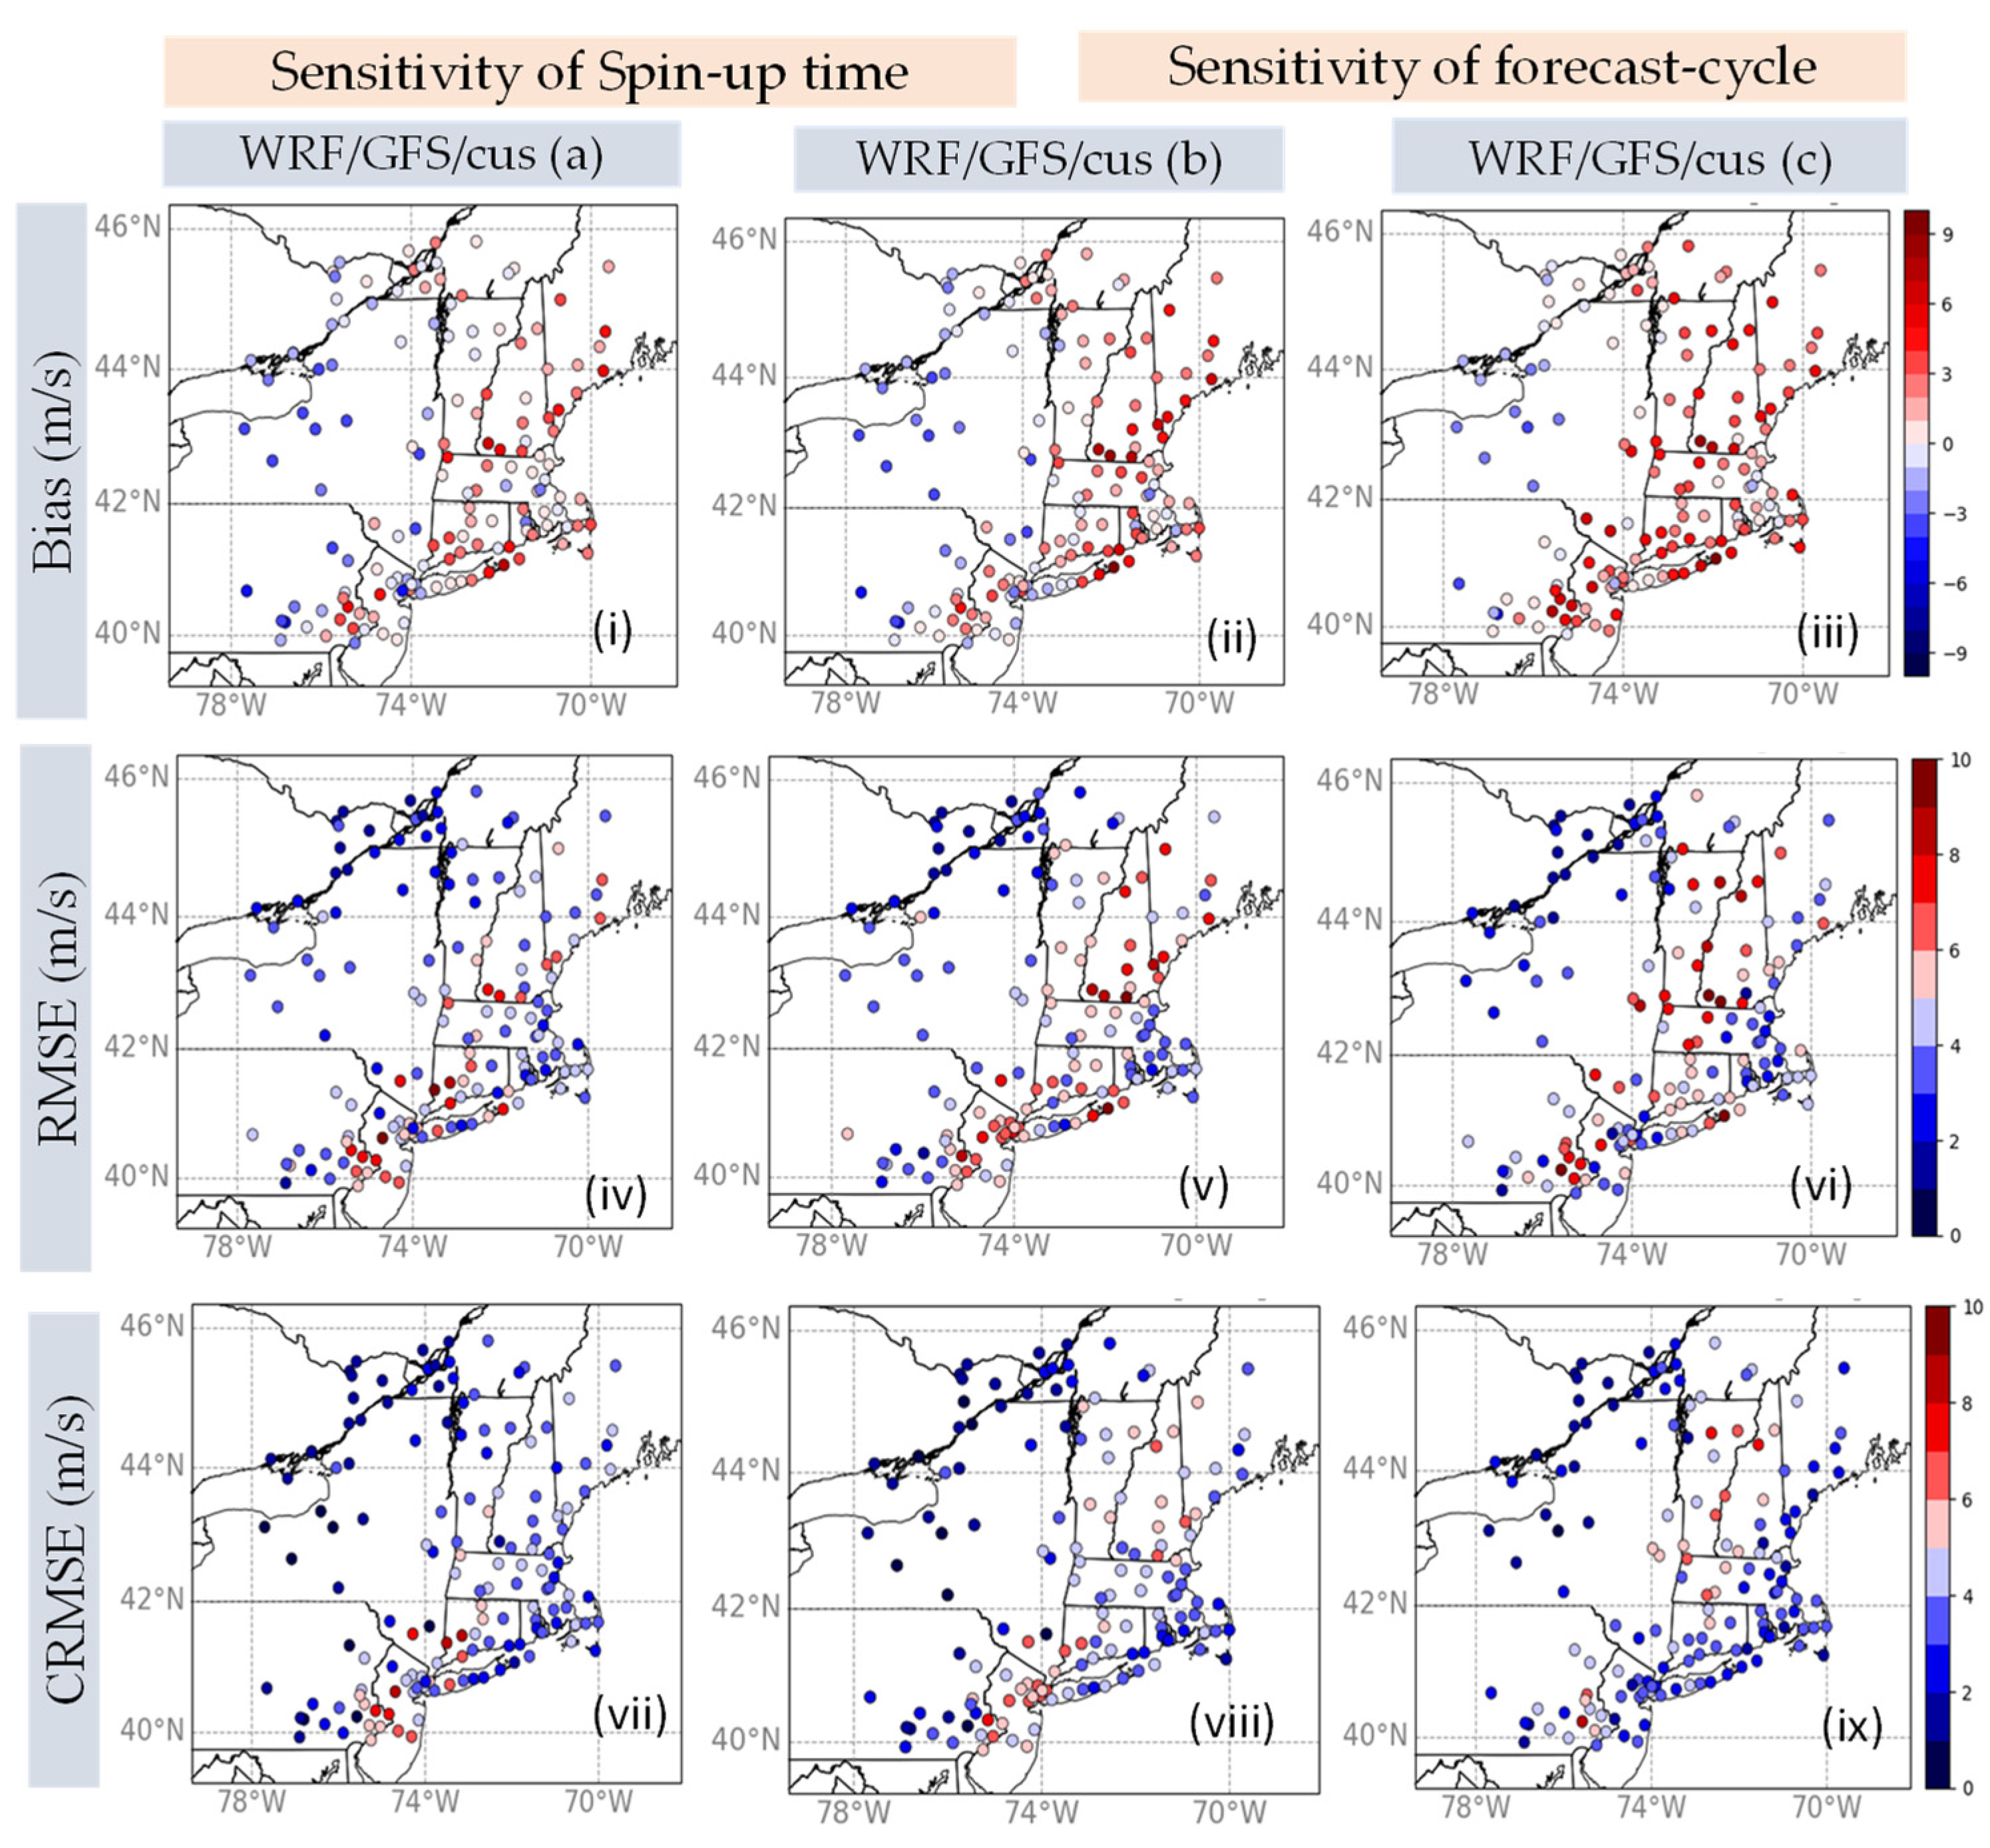
Figure 10.
Forecasts for (i,iv) TS Elsa, (ii,v) TS Henri and (iii,vi) TS Irene, focusing on the time series of minimum MSLP in the center of the storm (bottom row), location of the storm (top row), and comparisons of WRF/NAM/cus (magenta), WRF/GFS/cus (blue) and WRF/GFS/trop (red) models’ configurations. The observed MSLP location and values are denoted by an asterisk ‘*’.
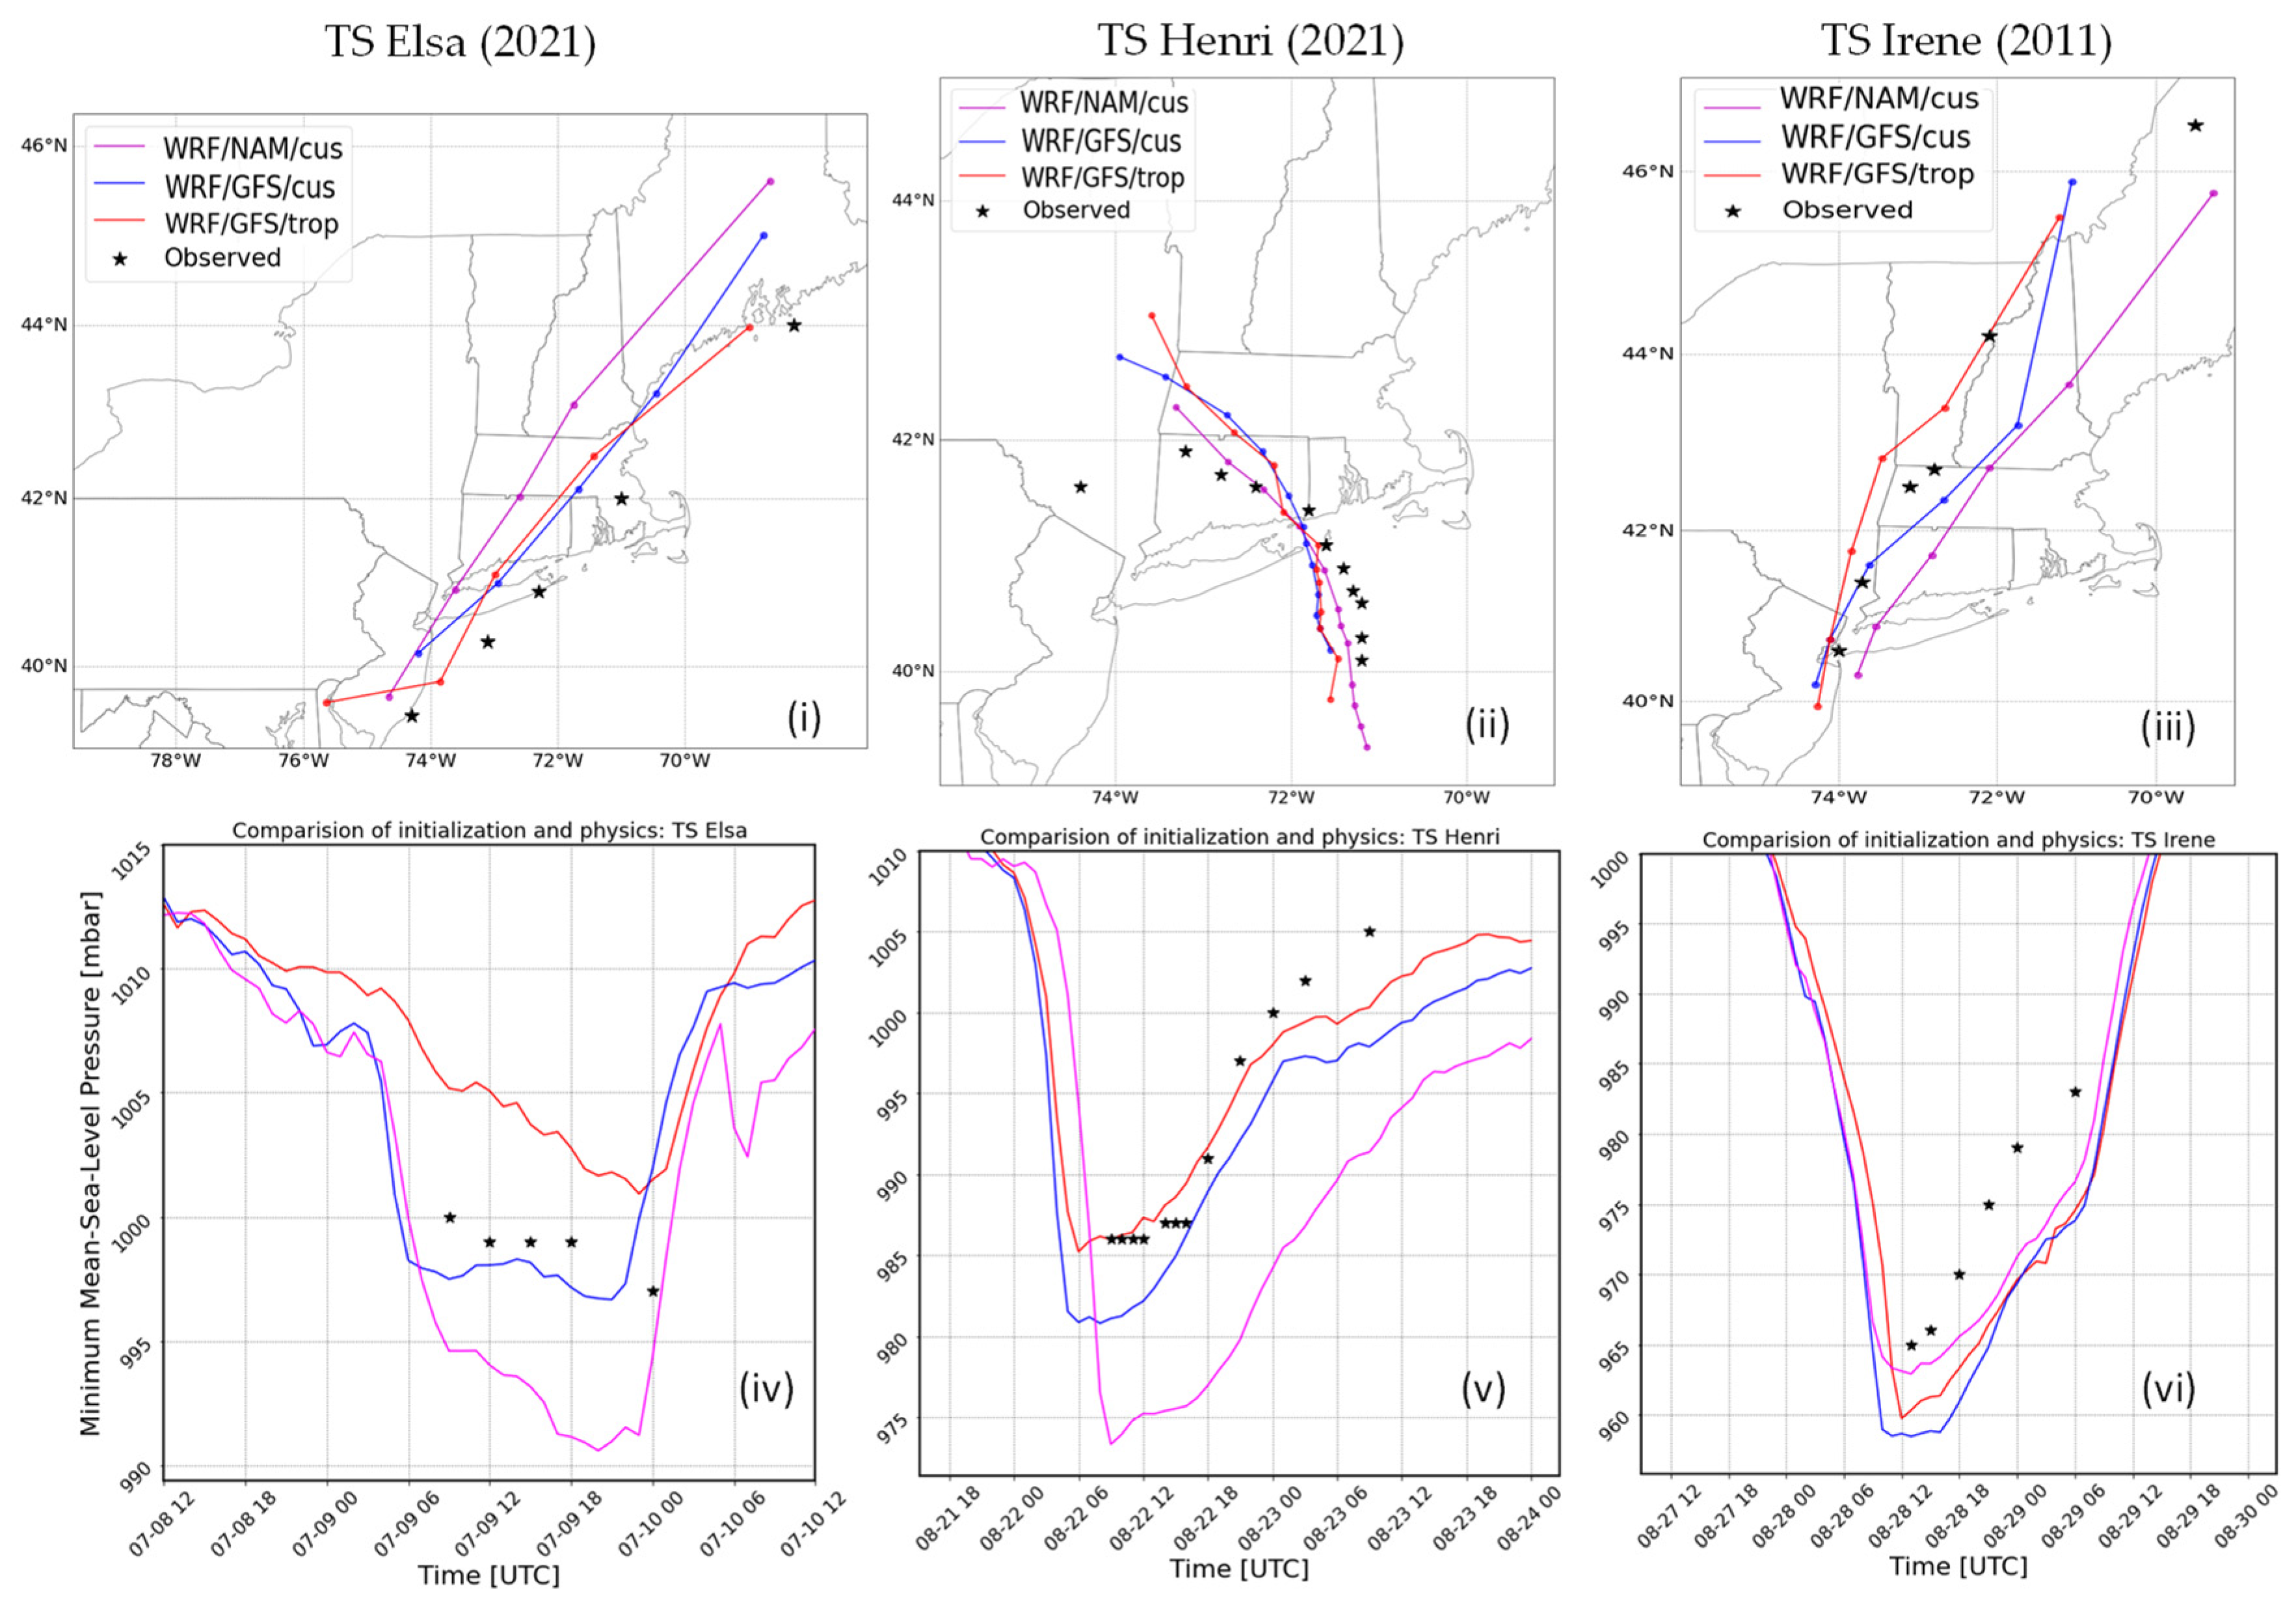
Figure 11.
A total of 48 h of accumulated precipitation (in mm) during TS Irene (1st row), TS Elsa (2nd row) and TS Henri (3rd row), as forecasted by (ii,vi,x) WRF/NAM/cus; (iii,vii,xi) WRF/GFS/cus; (iv,viii,xii) WRF/GFS/trop; (i,v,ix) stage IV precipitation for all three storms.
Figure 11.
A total of 48 h of accumulated precipitation (in mm) during TS Irene (1st row), TS Elsa (2nd row) and TS Henri (3rd row), as forecasted by (ii,vi,x) WRF/NAM/cus; (iii,vii,xi) WRF/GFS/cus; (iv,viii,xii) WRF/GFS/trop; (i,v,ix) stage IV precipitation for all three storms.

Figure 12.
Arrays of 95% confidence intervals for (i,vi,xi) Kling–Gupta Efficiency, (ii,vii,xii) correlation coefficient, (iii,viii,xiii) bias, (iv,ix,xiv) RMSE and (v,x,xv) CRMSE for 48 h of accumulated precipitation (in mm) during TS Irene (1st row), TS Elsa (2nd row) and TS Henri (3rd row), as forecasted by WRF/NAM/cus, WRF/GFS/cus and WRF/GFS/trop.

Figure 13.
Evaluation of hourly wind speed at 10 m from the surface (in m/s) during (i–iii) TS Irene; (iv–vi) TS Elsa; and (vii–ix) TS Henri, as forecasted by WRF/NAM/cus, WRF/GFS/cus and WRF/GFS/trop. The solid line designates a 1:1 relationship; the dashed line designates the linear relationship between the two variables described by the y = f(x) formula.
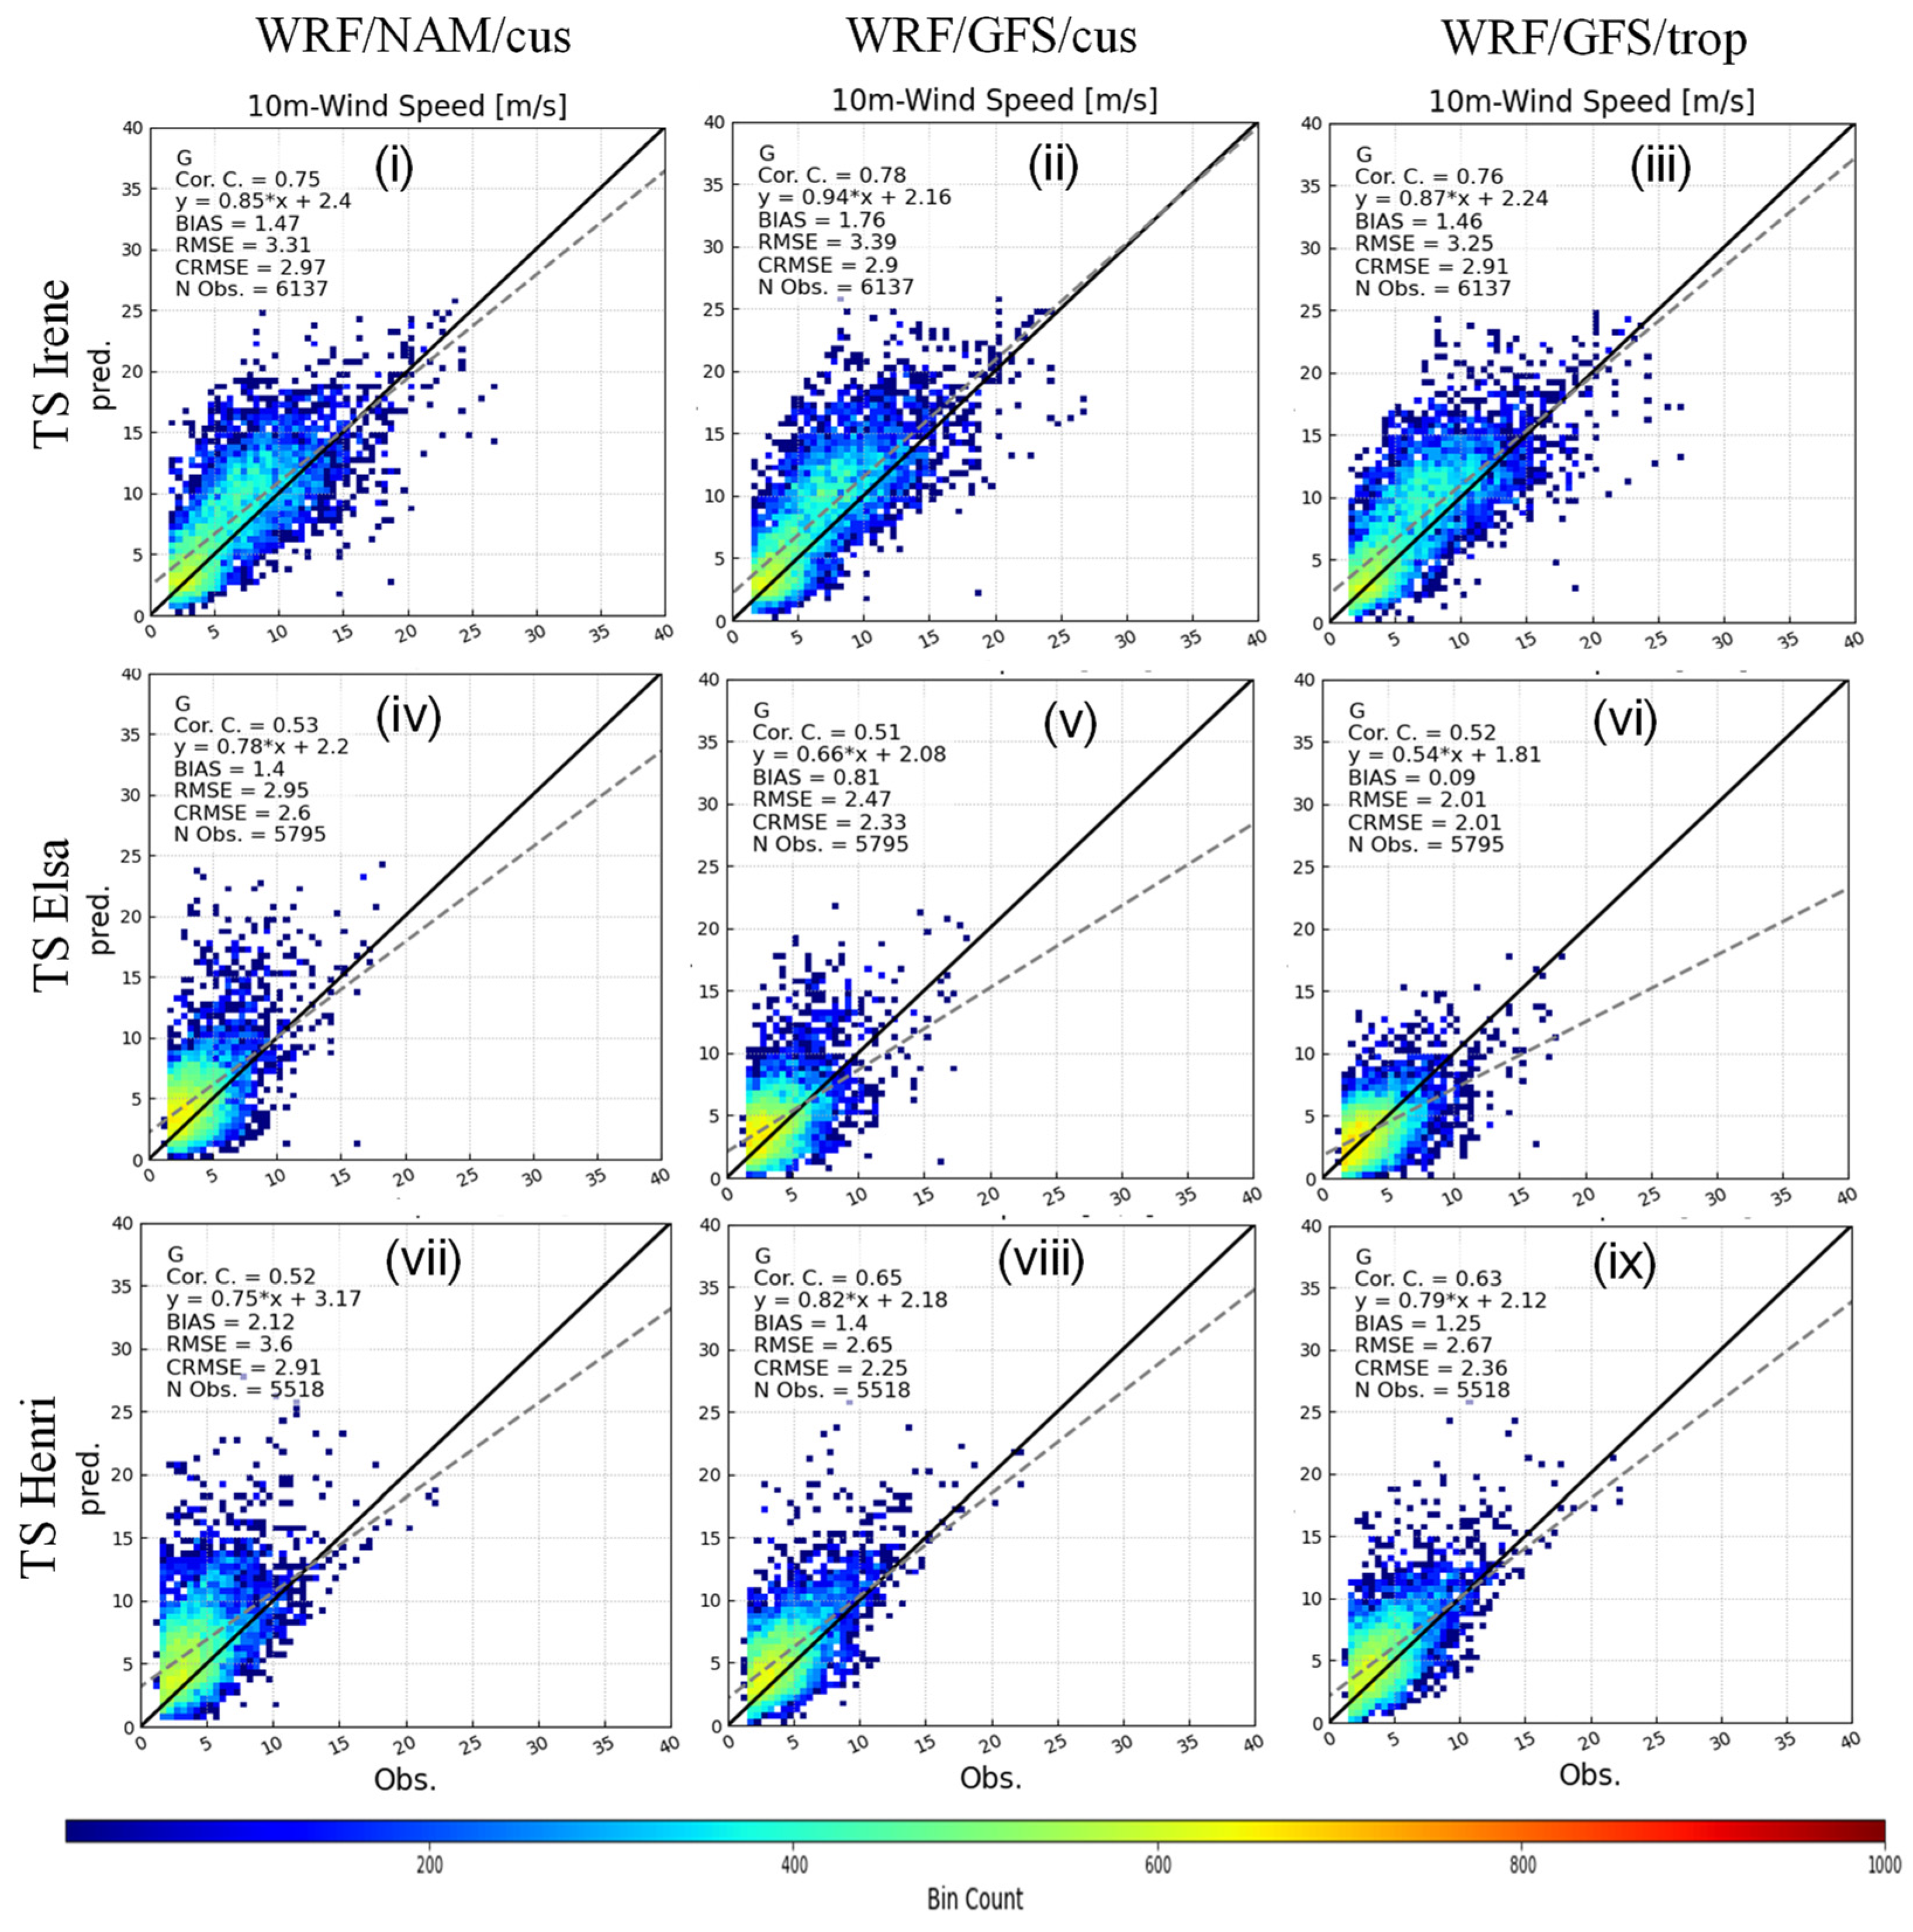
Figure 14.
Arrays of 95% confidence intervals for (i,vi,xi) Kling–Gupta Efficiency, (ii,vii,xii) correlation coefficient, (iii,viii,xiii) bias, (iv,v,ix,x,xiv,xv) RMSE and CRMSE for wind speed, and wind gust, from TS Irene (1st row), TS Elsa (2nd row) and TS Henri (3rd row), as forecasted by WRF/NAM/cus, WRF/GFS/cus and WRF/GFS/trop.

Table 1.
Details of the WRF model configuration.
| Physics Options | Tropical Suite | Customized |
|---|---|---|
| Microphysics | WSM 6-class graupel [33] | Thompson et al. 2008 [34] |
| Cumulus | New Tiedtke scheme (TD) [35] | New Grell scheme (G3) [36] |
| Longwave Radiation | Rapid Radiative Transfer Model [37] | Rapid Radiative Transfer Model |
| Shortwave Radiation | Rapid Radiative Transfer Model [38] | Goddard Shortwave Model [39] |
| Boundary layer | YSU scheme [40] | YSU scheme |
| Land Surface | Unified Noah land-surface [41] | Unified Noah land-surface |
| Surface Layer Scheme | MM5 [42] | MM5 |
Table 2.
WRF setup for sensitivity tests for TS Isaias.
| Test Name | Initialization and Physics | Isaias (4 August 2020) Forecast Cycle and WRF Start Time |
|---|---|---|
| WRF/NAM/cus Default | NAM initialization customized physics | NAM_00 UTC/WRF_00 UTC (12 h spin up) |
| WRF/GFS/cus | GFS initialization customized physics | a. GFS_00 UTC/WRF_00 UTC (12 h spin up) b. GFS_00 UTC/WRF_06 UTC (6 h spin up) c. GFS_06 UTC/WRF_06 UTC (6 h spin up) |
| WRF/GFS/trop | GFS initialization tropical suite | GFS_00 UTC/WRF_00 UTC (12 h spin up) |
Table 3.
Details of the WRF setup for TSs Irene, Henri and Elsa.
| Henri | Elsa | Irene | |
|---|---|---|---|
| Forecast cycle (NAM or GFS) | 21 August 2021 (00 UTC) | 8 July 2021 (00 UTC) | 27 August 2011 (12 UTC) |
| WRF start time | 21 August 2021 (18 UTC) | 8 July 2021 (00 UTC) | 27 August 2011 (12 UTC) |
| WRF end time | 24 August 2021 (00 UTC) | 10 July 2021 (12 UTC) | 30 August 2011 (00 UTC) |
Table 4.
Statistical metrics for WRF model configurations of TS Isaias.
| (i) WRF/NAM/cus default | (ii) WRF/GFS/cus (a) | (iii) 100(ii-i)/i (%) | (iv) WRF/GFS/cus (b) | (v) 100(iv-i)/i (%) | (vi) WRF/GFS/cus (c) | (vii) 100(vi-i)/i (%) | (viii) WRF/GFS/trop | (ix) 100(viii-i)/i (%) | ||
|---|---|---|---|---|---|---|---|---|---|---|
| Storm track (km) | Distance | 125.00 | 100.00 | −20.00 | 138.00 | 10.40 | 50.00 | −60.00 | 70.00 | −44.00 |
| Wind speed (m/s) | CC | 0.70 | 0.72 | 2.86 | 0.74 | 5.71 | 0.75 | 7.14 | 0.74 | 5.71 |
| BIAS | 1.03 | 0.39 | −62.14 | 0.46 | −55.34 | 0.73 | −29.13 | 0.05 | −95.15 | |
| RMSE | 2.49 | 2.17 | −12.85 | 2.17 | −12.85 | 2.21 | −11.24 | 2.10 | −15.66 | |
| CRMSE | 2.27 | 2.14 | −5.73 | 2.12 | −6.61 | 2.08 | −8.37 | 2.10 | −7.49 | |
| Wind gust (m/s) | CC | 0.58 | 0.65 | 12.07 | 0.64 | 10.34 | 0.69 | 18.97 | 0.66 | 13.79 |
| BIAS | 2.17 | 0.67 | −69.12 | 1.22 | −43.78 | 2.15 | −0.92 | 0.97 | −55.30 | |
| RMSE | 5.45 | 4.48 | −17.80 | 4.97 | −8.81 | 4.87 | −10.64 | 4.54 | −16.70 | |
| CRMSE | 5.00 | 4.43 | −11.40 | 4.82 | −3.60 | 4.38 | −12.40 | 4.44 | −11.20 | |
| Precipitation( mm) | CC | 0.73 | 0.80 | 9.59 | 0.83 | 13.70 | 0.70 | −4.11 | 0.83 | 13.70 |
| BIAS | −4.72 | −5.50 | 16.53 | −7.53 | 59.53 | −11.80 | 150.00 | −6.40 | 35.59 | |
| RMSE | 29.25 | 25.91 | −11.42 | 25.34 | −13.37 | 31.47 | 7.59 | 24.83 | −15.11 | |
| CRMSE | 28.86 | 25.31 | −12.30 | 24.19 | −16.18 | 29.17 | 1.07 | 24.00 | −16.84 | |
| Minimum MSLP (mb) | BIAS | −0.9 | 0 | −100 | 1.4 | −255.56 | −0.5 | −44.44 | 0.4 | −144.44 |
| MAE | 1.6 | 0.8 | −50 | 2.6 | 62.50 | 2.2 | 37.50 | 0.9 | −43.75 | |
| AverageΔ(errors); no CC | −29.69 | −23.64 | 1.58 | −35.84 | ||||||
| AverageΔ(CC) | 8.17 | 9.92 | 7.33 | 11.07 | ||||||
| Change due to initial conditions | Change due to start time and initialization | Change due to forecast cycle and initialization | Change due to physics and initialization |
Disclaimer/Publisher’s Note: The statements, opinions and data contained in all publications are solely those of the individual author(s) and contributor(s) and not of MDPI and/or the editor(s). MDPI and/or the editor(s) disclaim responsibility for any injury to people or property resulting from any ideas, methods, instructions or products referred to in the content. |
© 2023 by the authors. Licensee MDPI, Basel, Switzerland. This article is an open access article distributed under the terms and conditions of the Creative Commons Attribution (CC BY) license (https://creativecommons.org/licenses/by/4.0/).
Share and Cite
MDPI and ACS Style
Khaira, U.; Astitha, M. Exploring the Real-Time WRF Forecast Skill for Four Tropical Storms, Isaias, Henri, Elsa and Irene, as They Impacted the Northeast United States. Remote Sens. 2023, 15, 3219. https://doi.org/10.3390/rs15133219
AMA Style
Khaira U, Astitha M. Exploring the Real-Time WRF Forecast Skill for Four Tropical Storms, Isaias, Henri, Elsa and Irene, as They Impacted the Northeast United States. Remote Sensing. 2023; 15(13):3219. https://doi.org/10.3390/rs15133219
Chicago/Turabian StyleKhaira, Ummul, and Marina Astitha. 2023. "Exploring the Real-Time WRF Forecast Skill for Four Tropical Storms, Isaias, Henri, Elsa and Irene, as They Impacted the Northeast United States" Remote Sensing 15, no. 13: 3219. https://doi.org/10.3390/rs15133219
Note that from the first issue of 2016, this journal uses article numbers instead of page numbers. See further details here.